Embed Size (px)
Citation preview
ISSUED BY RPP-WTP PDC Calculation Cover Sheet
Sheet i
RIVER PROTECTION PROJECT-WASTE TREATMENT PLANT JOB NO.: 24590
CALC NO. 24590-BOF-M4C-DEP-00001 I GROUP Process Eng. I FACILITY BOF
SUBJECT DFLAW Effluent Management Facility Air Emissions Estimate
CALCULATION STATUS 0 PRELIMINARY [8J COMMITIED 0 CONFIRMED
0 SUPERSEDED BY: 0 CANCELLED
SOFTWARE USED TO PERFORM CALCULATION
Check applicable boxes in this block to designate what General-Purpose Commercially-Available Software was used to perform calculation
Note: ID older versions used in unrevised portion(s) of calc in "Notes/Comments:" below.
D Excel 2003 D Excel 2007 D Excel 2010 D Excel 2013 l:8l Excel 2016 D Mathcad 11 .2a D Mathcad 14 D Mathcad 15 D Mathematica 5.2
Other Software Used to Perform Calculation l:8l None
VERSION UIF COMPUTER PLATFORM
PROGRAM NAME NO NO REV MICROPROCESSOR OPERA TING SYSTEM JO#
RECORD OF REVISIONS TOTAL LAST NO. OF SHEET APPROVED/
NO. REASON FOR REVISION SHEETS NO. ORIGINATOR CHECKED ACCEPTED DATE
B •Added Annual Possession Quantities 143 G-3 William Hix Seth Schreiber Robert Hanson •Added single-stage HEPA abated '
C/Blzi emissions for ACV exhaust system
'1;}~7:~ ___ /£___ ~ •Updated entrainment factors for particulate emissions from DEP vessels and evaporator
•Editorial fixes
A Initial issue 129 G-3 William Hix Seth Schreiber Robert Hanson 2/29/16
I Notes/Comments:
Affected areas are identified by revision bars in the right margin.
For this revision, it has been confirmed that the inputs and assumptions are current and reflect the current issued state of design.
24590-G04B-F00005 Rev 22 (Revised 3/22/2016) Ref: 24590-WTP-3DP-G04B-00037

CALCULATION SHEET PROJECT: RPP-WTPJOB NO.: 24590
BY: William Hix CALC NO.: 24590-BOF-M4C-DEP-00001 DATE: 6/6/2016 SHEET REV: B
SHEET NO.: 1SUBJECT: DFLAW Effluent Management Facility Air Emissions Estimate
24590-G04B-F00012 Rev 13 (Revised12/23/2015) Ref: 24590-WTP-3DP-G04B-00037, 24590-WTP-GPG-ENG-0127
Contents 1 Objective ............................................................................................................................................... 5
2 Inputs .................................................................................................................................................... 5
3 Background .......................................................................................................................................... 7
4 Applicable Codes and Standards ....................................................................................................... 9
5 Methodology ......................................................................................................................................... 9
5.1 Radionuclide COPC Emissions ........................................................................................................................... 10
5.2 Organic COPC Emissions .................................................................................................................................... 20
5.3 Inorganic COPC Emissions ................................................................................................................................. 32
6 Assumptions ....................................................................................................................................... 41
6.1 Assumptions Requiring Verification ................................................................................................................... 41
6.2 Assumptions Not Requiring Verification ............................................................................................................ 53
7 Calculations ........................................................................................................................................ 64
7.1 Radionuclide COPC Emissions ........................................................................................................................... 64
7.2 Organic COPC Emissions .................................................................................................................................... 73
7.3 Inorganic COPC Emissions ................................................................................................................................. 92
8 Results and Conclusions .................................................................................................................. 104
8.1 Discussion of Margin and Conservatism .......................................................................................................... 104
8.2 Emissions Summary ........................................................................................................................................... 105
9 Tracked References ......................................................................................................................... 119
10 References ......................................................................................................................................... 121
11 Attachments ...................................................................................................................................... 122
Attachment A - WTP COPCs Complete List ....................................................................................... A-1
Attachment B - Radionuclide COPC Specific Activities ...................................................................... B-1
Attachment C – Media File 24590-RMCD-04955 ................................................................................ C-1
Attachment D - Extracted Radionuclide Properties from NuDat 2.6 Database (Ref. 10.6) ............. D-1
Attachment E - Phase Emissions Sensitivity Analysis for 14C and 3H ................................................. E-1
Attachment F – Stream Properties Extracted from PIBOD Runs ...................................................... F-1
Attachment G – DFLAW Bounding Feed Vector Batch Properties .................................................. G-1

CALCULATION SHEET PROJECT: RPP-WTPJOB NO.: 24590
BY: William Hix CALC NO.: 24590-BOF-M4C-DEP-00001 DATE: 6/6/2016 SHEET REV: B
SHEET NO.: 2SUBJECT: DFLAW Effluent Management Facility Air Emissions Estimate
24590-G04B-F00012 Rev 13 (Revised12/23/2015) Ref: 24590-WTP-3DP-G04B-00037, 24590-WTP-GPG-ENG-0127
TABLES Table 2-1 – ICD-30 Acceptance Limits for Radionuclide Concentrations ............................................................. 5
Table 5-1 – TRU Radionuclides ............................................................................................................................... 11
Table 7-1 “DFLAW Radionuclide COPC Emissions Estimate.xlsx” Calculation of Batch Activities .................. 64
Table 7-2 “DFLAW Radionuclide COPC Emissions Estimate.xlsx” Substitution of Adjusted Values as Needed67
Table 7-3 “DFLAW Radionuclide COPC Emissions Estimate.xlsx” Calculation of Batch Mass Fractions and Concentrations ..................................................................................................................................... 68
Table 7-4 “DFLAW Radionuclide COPC Emissions Estimate.xlsx” Calculation of Radionuclide COPC Emissions Due to Entrainment ........................................................................................................... 69
Table 7-5 “DFLAW Radionuclide COPC Emissions Estimate.xlsx” Calculation of Sources of Vapor Phase Radionuclide COPCs ........................................................................................................................... 70
Table 7-6 “DFLAW Radionuclide COPC Emissions Estimate.xlsx” Calculation of 14C Emissions ..................... 70
Table 7-7 “DFLAW Radionuclide COPC Emissions Estimate.xlsx” Calculation of 3H Emissions ...................... 71
Table 7-8 “DFLAW Radionuclide COPC Emissions Estimate.xlsx” Calculation of ACV Exhaust System Radionuclide COPC Emissions .......................................................................................................... 72
Table 7-9 “DFLAW Radionuclide COPC Emissions Estimate.xlsx” Calculation of APQs ................................... 72
Table 7-10 “DFLAW Organic and PIC COPC Emissions Estimate.xlsx” Adjustment of Tank Farms Average Ratios .................................................................................................................................................... 73
Table 7-11 “Bounding_DFLAW-batches-to-wtp_TOTALS.xlsx” Calculation of Adjusted TOC Values ............ 74
Table 7-12 “DFLAW Organic and PIC COPC Emissions Estimate.xlsx” Calculation of Maximum Batch Masses, Mass Fractions, and Concentrations .................................................................................................. 75
Table 7-13 “DFLAW Organic and PIC COPC Emissions Estimate.xlsx” Other Physical Properties ................. 76
Table 7-14 “DFLAW Organic and PIC COPC Emissions Estimate.xlsx” Vapor Phase Feed Organic COPC Emissions .............................................................................................................................................. 77
Table 7-15 “DFLAW Organic and PIC COPC Emissions Estimate.xlsx” Particle Phase Feed Organic COPC Emissions .............................................................................................................................................. 78
Table 7-16 “DFLAW Organic and PIC COPC Emissions Estimate.xlsx” PIC Generation Rates........................ 79
Table 7-17 “DFLAW Organic and PIC COPC Emissions Estimate.xlsx” PIC COPC Emissions ........................ 80
Table 7-18 “DFLAW Organic and PIC COPC Emissions Estimate.xlsx” Summary Tables ................................ 81
Table 7-19 “DFLAW Organic and PIC COPC Emissions Estimate.xlsx” De Minimis Value Comparison ........ 84
Table 7-20 Feed Organic COPCs that Exceed De Minimis Value ........................................................................ 85
Table 7-21 “DFLAW Organic and PIC COPC Emissions Estimate.xlsx” Henry’s Law Analysis Setup ............. 86
Table 7-22 “DFLAW Organic and PIC COPC Emissions Estimate.xlsx” Case 1: Vessel Vent Streams ............. 87
Table 7-23 “DFLAW Organic and PIC COPC Emissions Estimate.xlsx” Case 2: Evaporator Vent Stream ..... 88
Table 7-24 “DFLAW Organic and PIC COPC Emissions Estimate.xlsx” Case 1: Vessel Vent Streams ............. 89
Table 7-25 Post Henry’s Law Comparison to De Minimis Values ........................................................................ 89
Table 7-26 Adjusted Feed Organic COPCs Exceeding De Minimis Values ......................................................... 91

CALCULATION SHEET PROJECT: RPP-WTPJOB NO.: 24590
BY: William Hix CALC NO.: 24590-BOF-M4C-DEP-00001 DATE: 6/6/2016 SHEET REV: B
SHEET NO.: 3SUBJECT: DFLAW Effluent Management Facility Air Emissions Estimate
24590-G04B-F00012 Rev 13 (Revised12/23/2015) Ref: 24590-WTP-3DP-G04B-00037, 24590-WTP-GPG-ENG-0127
Table 7-27 “DFLAW Inorganic COPC Emissions Estimate.xlsx” Calculation of Maximum Batch Masses, Mass Fractions, and Concentrations ............................................................................................................ 93
Table 7-28 “DFLAW Organic and PIC COPC Emissions Estimate.xlsx” Particle Phase Feed Inorganic COPC Emissions .............................................................................................................................................. 94
Table 7-29 “DFLAW Inorganic COPC Emissions Estimate.xlsx” Vapor Phase Feed Inorganic COPC Emissions ............................................................................................................................................................... 96
Table 7-30 “DFLAW Inorganic COPC Emissions Estimate.xlsx” NH3 Emissions due to Caustic Scrubber Effluent ................................................................................................................................................. 96
Table 7-31 “DFLAW Inorganic COPC Emissions Estimate.xlsx” Mercury Concentrations ............................... 99
Table 7-32 “DFLAW Inorganic COPC Emissions Estimate.xlsx” Vessel Temperatures ................................... 100
Table 7-33 “DFLAW Inorganic COPC Emissions Estimate.xlsx” Mercury Concentrations ............................. 100
Table 7-34 “DFLAW Inorganic COPC Emissions Estimate.xlsx” Dimethyl Mercury Formation and Emission101
Table 7-35 “DFLAW Inorganic COPC Emissions Estimate.xlsx” De Minimis Value Comparison .................. 103
Table 7-36 Inorganic COPCs that Exceed De Minimis Value ............................................................................. 104
Table 8-1 – Radionuclide COPC Emissions from DVP System .......................................................................... 107
Table 8-2 - Radionuclide COPC Emissions from ACV Exhaust System ............................................................ 108
Table 8-3 – Radionuclide COPC Annual Possession Quantities ......................................................................... 109
Table 8-4 – Feed Organic COPC Emissions from DVP System .......................................................................... 110
Table 8-5 – PIC COPC Emissions from DVP System .......................................................................................... 113
Table 8-6 – Inorganic COPC Emissions from DVP System ................................................................................ 117
Table 8-7 – Total Particulate Emissions from DVP System ................................................................................ 117
Table 8-8 – Summary of COPC Unabated Emissions Exceeding De Minimis Values ...................................... 118
FIGURES Figure 3-1 - DEP System - Simplified Flow Diagram ............................................................................................... 8
Figure 3-2 - DVP Exhaust System - Simplified Flow Diagram ............................................................................... 9
Figure 7-1 – ICD-30 Acceptance Limits Calculation Spreadsheet ........................................................................ 65
Figure 7-2 – ICD-30 Acceptance Limits Calculation Spreadsheet with Formulas .............................................. 66

CALCULATION SHEET PROJECT: RPP-WTPJOB NO.: 24590
BY: William Hix CALC NO.: 24590-BOF-M4C-DEP-00001 DATE: 6/6/2016 SHEET REV: B
SHEET NO.: 4SUBJECT: DFLAW Effluent Management Facility Air Emissions Estimate
24590-G04B-F00012 Rev 13 (Revised12/23/2015) Ref: 24590-WTP-3DP-G04B-00037, 24590-WTP-GPG-ENG-0127
Acronyms and Abbreviations ACV - Active Confinement Ventilation APQ - Annual possession quantity BOF - Balance of Facilities CAS - Chemical Abstracts Service CNP - Cesium Nitric Acid Recovery Process system COPC - Constituents of Potential Concern CRV - Concentrate Receipt Vessel DEP - DFLAW EMF Process system DF - Decontamination factor DFLAW - Direct Feed Low Activity Waste DVP - DFLAW EMF Process Vessel Ventilation system EMF - Effluent Management Facility ETF - Effluent Treatment Facility HEPA - High Efficiency Particulate Air HLW - High Level Waste Facility ICD - Interface Control Document LAW - Low-Activity Waste Facility LAWPS - LAW Pretreatment System LERF - Liquid Effluent Retention Facility LFP - LAW Melter Feed Process system LVP - LAW Secondary Offgas/Vessel Vent Process system MDR - Mass distribution ratio ORNL - Oak Ridge National Laboratory PFD - Process flow diagram PIC - Product of incomplete combustion PTF - Pretreatment Facility R&T - Research and Technology RAIS - Risk Assessment Information System RLD - Radioactive Liquid Waste Disposal system SBS - Submerged bed scrubber TAP - Toxic air pollutant TOC - Total organic carbon TRU - Transuranic VSL - Vitreous State Laboratory of the Catholic University of America WAC - Washington Administrative Code WESP - Wet electrostatic precipitator WTP - Hanford Tank Waste Treatment and Immobilization Plant
CALCULATION SHEET PROJECT: RPP-WTPJOB NO.: 24590
BY: William Hix CALC NO.: 24590-BOF-M4C-DEP-00001 DATE: 6/6/2016 SHEET REV: B
SHEET NO.: 5SUBJECT: DFLAW Effluent Management Facility Air Emissions Estimate
24590-G04B-F00012 Rev 13 (Revised12/23/2015) Ref: 24590-WTP-3DP-G04B-00037, 24590-WTP-GPG-ENG-0127
1 Objective
The objective of this calculation is to provide an air emissions estimate for the Direct Feed Low Activity Waste (DFLAW) Effluent Management Facility (EMF) at the Hanford Tank Waste Treatment and Immobilization Plant (WTP). This calculation estimates emissions for organic, inorganic, and radionuclide constituents of potential concern (COPCs) from the DFLAW EMF Process Vessel Ventilation system (DVP). Radionuclide COPC emissions from the Active Confinement Ventilation (ACV) exhaust system are also estimated. The annual possession quantities (APQs) for radionuclide COPCs in the DFLAW EMF Process (DEP) system are also estimated. Results are given in g/sec for organic and inorganic COPCs and Ci/yr for radionuclide COPCs.
2 Inputs
2.1 Specific activities of radionuclide COPCs in Ci/g are shown in Attachment B. The specific activities are found in the Oak Ridge National Laboratory (ORNL) Risk Assessment Information System (RAIS) (Ref. 10.1).
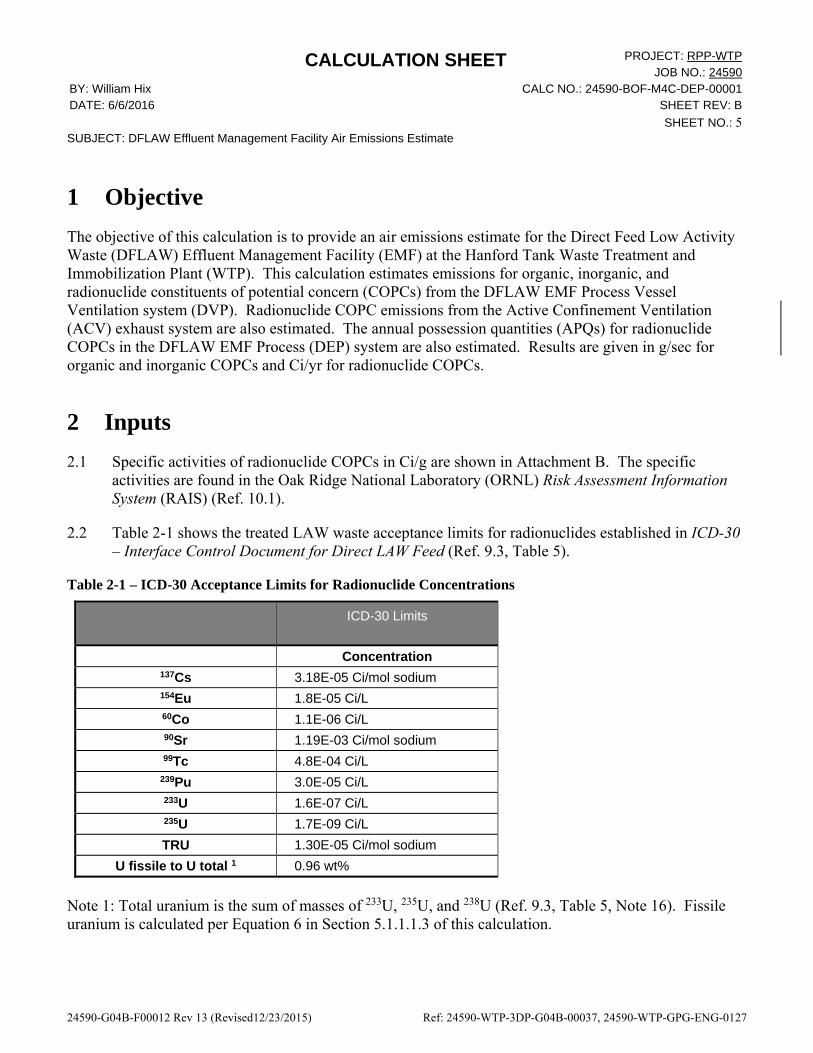
2.2 Table 2-1 shows the treated LAW waste acceptance limits for radionuclides established in ICD-30 – Interface Control Document for Direct LAW Feed (Ref. 9.3, Table 5).
Table 2-1 – ICD-30 Acceptance Limits for Radionuclide Concentrations
ICD-30 Limits
Concentration 137Cs 3.18E-05 Ci/mol sodium 154Eu 1.8E-05 Ci/L 60Co 1.1E-06 Ci/L 90Sr 1.19E-03 Ci/mol sodium 99Tc 4.8E-04 Ci/L
239Pu 3.0E-05 Ci/L 233U 1.6E-07 Ci/L 235U 1.7E-09 Ci/L
TRU 1.30E-05 Ci/mol sodium
U fissile to U total 1 0.96 wt%
Note 1: Total uranium is the sum of masses of 233U, 235U, and 238U (Ref. 9.3, Table 5, Note 16). Fissile uranium is calculated per Equation 6 in Section 5.1.1.1.3 of this calculation.
CALCULATION SHEET PROJECT: RPP-WTPJOB NO.: 24590
BY: William Hix CALC NO.: 24590-BOF-M4C-DEP-00001 DATE: 6/6/2016 SHEET REV: B
SHEET NO.: 6SUBJECT: DFLAW Effluent Management Facility Air Emissions Estimate
24590-G04B-F00012 Rev 13 (Revised12/23/2015) Ref: 24590-WTP-3DP-G04B-00037, 24590-WTP-GPG-ENG-0127
2.3 The median entrainment factor for the free-fall spill of an aqueous solution (density ~1.0 g/cm3) is 4E-5 g entrained material / g air (Ref. 10.2, Page 3-4).
2.4 The volume of the feed transfer line flush from Tank Farms LAW Pretreatment System (LAWPS) facility to the DFLAW EMF Process system (DEP) low point drain vessel (DEP-VSL-00001) is determined by the next planned transfer of feed (Ref. 9.3, Section 2.6.2):
If the next transfer of feed is expected in less than 72 hours, the Tank Operations Conctractor will flush the transfer pipeline with a volume of water that is not more than the transfer pipeline volume (1500 gallons [5.68 m3]) If the next transfer of feed is expected to be more than 72 hours later, then the Tank Operations Contractor will flush the transfer pipeline with a volume of water that is at least 1.5 times the transfer pipeline volume (2200 gallons [8.33 m3])
2.5 The molecular weight of sodium (Na) is 22.9898 g/mol (Ref. 10.3, inside of back cover).
2.6 The molecular weight of carbon (C) is 12.01115 g/mol (Ref. 10.3, inside of back cover).
2.7 The molecular weight of water (H2O) is 18.02 g/mol (Ref. 10.3, inside of back cover).
2.8 The average molecular weight of air is 28.97 g/mol (Ref. 10.3, Page 21-8)
2.9 The molecular weight of ammonia (NH3) is 17.031 g/mol (Ref. 10.3, inside of back cover).
2.10 The molecular weight of mercury (Hg) is 200.59 g/mol (Ref. 10.3, inside of back cover).
2.11 Transuranic (TRU) radionuclides are defined as alpha-emitting radionuclides with an atomic number greater than 92 with half-life greater than 20 years (Ref. 10.4, Page C-119 Note 2).
2.12 The nominal diameter of the WTP portion of the feed transfer line from LAWPS to Low-Activity Waste Facility (LAW) is 3 inch Schedule 40 per ICD-30 (Ref. 9.3, Table 2). This corresponds to an inside diameter of 3.068 inches (Ref. 10.5, Page B-13).
2.13 De minimis values for the emissions of toxic air pollutants (TAPs) are provided in Washington Administrative Code (WAC) Section 173-460-150 (Ref. 10.7).
2.14 The density of the Radioactive Liquid Waste Disposal system stream (RLD21) is 62.6 lb/ft3, or 1002.8 g/L (Ref. 9.22, Table B-25).
2.15 The available batch volume of the Caustic Collection Tank (LVP-TK-00001) is 4,336 gallons (Ref. 9.26, Section 7.5.14 and Section 8).
2.16 The transfer frequency for LVP-TK-00001 is once every 10.7 hours (Ref. 9.26, Section 8).
2.17 The density of the LAW Secondary Offgas/Vessel Vent Process system stream (LVP21) is 65.8 lb/ft3, or 1054.0 g/L (Ref. 9.22, Table B-23).

CALCULATION SHEET PROJECT: RPP-WTPJOB NO.: 24590
BY: William Hix CALC NO.: 24590-BOF-M4C-DEP-00001 DATE: 6/6/2016 SHEET REV: B
SHEET NO.: 7SUBJECT: DFLAW Effluent Management Facility Air Emissions Estimate
24590-G04B-F00012 Rev 13 (Revised12/23/2015) Ref: 24590-WTP-3DP-G04B-00037, 24590-WTP-GPG-ENG-0127
2.18 The Henry’s Law constant for ammonia is 3.45E-6 atm*m3/mol (Ref. 10.11).
2.19 The ICD-30 acceptance limit for mercury is 1.4E-5 mol Hg/mol Na (Ref. 9.3, Table 5).
2.20 The release fraction (entrainment factor) for liquids or particulate solids provided in WAC 246-247-030 is 1E-3 g entrained material / g air (Ref. 10.8, Section 21(a)).
3 Background
The list of COPCs for air permitting at WTP is compiled in 24590-WTP-RPT-ENV-10-001 – Constituents of Potential Concern for the WTP Air and Dangerous Waste Permits (Ref. 9.1). Table 2-1 in Ref. 9.1 shows the entire list of 409 compounds considered WTP COPCs, along with the source document justifying each compound’s addition to the list. The following categorization summarizes the number and type of the COPCs (Ref. 9.1, Page 25).
309 organic COPCs, including: o 138 feed compounds o 171 stack emissions compounds
54 inorganic COPCs, including: o 43 feed compounds (11 with radioactive forms) o 11 stack emissions compounds
46 radionuclide COPCs (all feed constituents) The stack emissions compounds are products of incomplete combustion (PICs) that are generated from the destruction of organics in the melter and not present in the feed stream. The complete list of WTP COPCs evaluated for air emissions is shown in Attachment A. The DFLAW EMF is being added to support DFLAW operations by handling secondary waste streams associated with the melter off-gas (i.e., submerged bed scrubber (SBS) condensate, wet electrostatic precipitator (WESP) drain, and caustic scrubber solution) and line flushes/drains. An evaporator is used to concentrate the SBS condensate/plant wash effluent and recycle the effluent concentrate to the front end of LAW (LCP-VSL-00001/2) to be incorporated into the glass during the vitrification process. The EMF evaporator overheads stream is combined with the LAW Caustic Scrubber effluent stream and then sent to the Liquid Effluent Retention Facility (LERF)/Effluent Treatment Facility (ETF) for final treatment prior to discharge to the environment. The EMF evaporator and other process components are part of a new system, the DEP system, which will be part of the Balance of Facilities (BOF). Process flow diagrams (PFDs) for the DEP system are shown in References 9.5, 9.6, 9.7, and 9.8. The main process vessels in the DEP system are the low point drain vessel (DEP-VSL-00001), evaporator feed vessel (DEP-VSL-00002), evaporator concentrate vessels (DEP-VSL-00003A/B/C), overhead sampling vessels (DEP-VSL-00004A/B), and process condensate lag storage vessels (DEP-VSL-00005A/B), along with the DEP evaporator system, represented by the evaporator separator vessel (DEP-EVAP-00001), primary/inter/after-condensers (DEP-COND-00001/2/3), and reboiler (DEP-RBLR-00001).

CALCULATION SHEET PROJECT: RPP-WTPJOB NO.: 24590
BY: William Hix CALC NO.: 24590-BOF-M4C-DEP-00001 DATE: 6/6/2016 SHEET REV: B
SHEET NO.: 8SUBJECT: DFLAW Effluent Management Facility Air Emissions Estimate
24590-G04B-F00012 Rev 13 (Revised12/23/2015) Ref: 24590-WTP-3DP-G04B-00037, 24590-WTP-GPG-ENG-0127
The DVP system is comprised of two main parts, air supply and exhaust, and its purpose is to maintain hydrogen below dangerous levels in the vessel headspace. The inlet air, or purge air, is supplied by a passive system. For the DEP vessels in the LAW effluent process building, a purge air in-bleed is suitable for meeting the very low required flowrates. The vessel vent is the exhaust or discharge portion of the DVP system that provides the suction pressure on the vessel headspace, drawing in the purged air, and evacuates the hydrogen. The discharge air is sent through a preheater, two-stage high efficiency particulate air (HEPA) filters, and finally through an exhaust fan to discharge the air out of the EMF stack (Ref. 9.7). Figure 3-1 and Figure 3-2 show a simplified flow diagram for the DEP system and DVP exhaust system, respectively Figure 3-1 - DEP System - Simplified Flow Diagram
L
Feed Batch from Tank Farm LAWPS
<LCP01>
<RLD21> LCP‐VSL‐00001/2 LAW Concentrate Receipt Vessel
DEP‐VSL‐00001 Low Point Drain Vessel
DEP‐VSL‐00002Evaporator Feed
Vessel
DEP‐EVAP‐00001DEP Evaporator Separator Vessel
DEP‐VSL‐00004A/BOverhead Sampling Vessels
DEP‐VSL‐00003A/B/CEvaporator Concentrate Vessels
DEP‐VSL‐00005A/B Process Condensate Lag Storage Vessels
LVP‐TK‐00001Caustic Collection Tank
<DEP03>
<DEP02>
<DEP05>
<DEP04>
<LVP21>
<DEP01> <DEP20>
<DEP13>
LAW Process
DEP System
To LERF/ETF
Feed line flush
<DEP11> NaOH Addition
DEP‐FILT‐00003Evaporator Feed Filter

CALCULATION SHEET PROJECT: RPP-WTPJOB NO.: 24590
BY: William Hix CALC NO.: 24590-BOF-M4C-DEP-00001 DATE: 6/6/2016 SHEET REV: B
SHEET NO.: 9SUBJECT: DFLAW Effluent Management Facility Air Emissions Estimate
24590-G04B-F00012 Rev 13 (Revised12/23/2015) Ref: 24590-WTP-3DP-G04B-00037, 24590-WTP-GPG-ENG-0127
Figure 3-2 - DVP Exhaust System - Simplified Flow Diagram
DVP-HEPA-00003A
DEP16
DVP-HTR-00001A
HEPA DVP-EXHR-00001A
HEPA
HEPA
HEPADVP-HTR-00001B
DVP-HEPA-00004B
DEP15
DVP-EXHR-00001B
DEP17
DEP18
Vessel Vent Collection Header
Exhaust to Stack
DVP-HEPA-00004A
DVP-HEPA-00003B
4 Applicable Codes and Standards
4.1 Washington Administrative Code (WAC) 173-460-150 - Table of ASIL, SQER and de minimis emission values.
4.2 Washington Administrative Code (WAC) 246-247-030 – Definitions.
5 Methodology
The methodology for estimating the emissions from the EMF is divided into three main sections: radionuclide COPCs, organic COPCs, and inorganic COPCs. The general approach within each section is to evaluate the COPCs based on their expected emission phase (i.e. vapor or particulate). The main governing assumption for particulate emissions is that the mass fractions of COPCs emitted through entrainment are assumed to remain constant throughout the DEP system at the maximum feed vector batch mass fraction. For PICs, which are not present in the feed vector, the mass fractions of PIC COPCs emitted through entrainment are assumed to remain constant throughout the DEP system at the mass fraction received in the DEP system from Stream RLD21 (Assumption 6.1.1). Additional key assumptions for entrainment are the applicability of the entrainment factors used for the DEP vessels (Assumption 6.2.3) and the DEP evaporator (Assumption 6.2.30). The main governing assumption for vapor emissions is that the entire volatile fraction of a COPC received in the DEP system will be emitted in the vapor phase as it is processed through the DEP system (Assumptions 6.2.4, 6.2.16, and 6.2.23). Any special cases not following this assumption will be specifically mentioned and an alternative estimation method will be described. The calculation spreadsheets and data files associated with 24590-WTP-RPT-ENV-16-001 - Feed Vector Development In Support Of WTP Environmental Risk Assessment Activities (Ref. 9.2) are accessible through 24590-RMCD-04893. The values associated with the DFLAW Bounding Feed Vector and Tank Farm Average ratios, that are used throughout this calculation, were accessed from Excel spreadsheets

CALCULATION SHEET PROJECT: RPP-WTPJOB NO.: 24590
BY: William Hix CALC NO.: 24590-BOF-M4C-DEP-00001 DATE: 6/6/2016 SHEET REV: B
SHEET NO.: 10SUBJECT: DFLAW Effluent Management Facility Air Emissions Estimate
24590-G04B-F00012 Rev 13 (Revised12/23/2015) Ref: 24590-WTP-3DP-G04B-00037, 24590-WTP-GPG-ENG-0127
“Bounding_DFLAW-batches-to-wtp.csv” and “COPC and non-COPC Organic Tank Farm Ratios.xlsx” respectively. 5.1 Radionuclide COPC Emissions
Attachment A, Table A-1 shows the 46 radionuclides tracked as COPCs at WTP. 5.1.1 COPC Maximum Batch Activities
The maximum batch activity for the radionuclide COPCs is determined using the Tank Farms Average ratios (mCi COPC / g Na) and the DFLAW Bounding Feed Vector maximum sodium batch. The Tank Farms Average ratios are provided in Ref. 9.2. These Tank Farms Average ratios are assumed to be applicable to this analysis (Assumption 6.2.1). The DFLAW Bounding Feed Vector is provided in Ref. 9.2 and used in this calculation (Assumption 6.2.2). The values for the amount of sodium (in kmol) in each batch during the DFLAW campaign are extracted from the DFLAW Bounding Feed Vector and then the average, minimum, and maximum values are calculated. The Tank Farms Average ratios are converted to the maximum batch activity of each radionuclide as follows:
∗ , ∗ ∗ 1000 ∗1
1000 Equation 1
Where:
= Maximum feed vector batch activity of COPC i, in Ci = Tank Farms Average ratio of COPC i, in mCi COPC / g Na (Ref. 9.2)
, = Maximum batch amount of Na in DFLAW Bounding Feed Vector, in kmols (Attachment G) = Molecular weight of sodium, in g/mol (Input 2.5)
5.1.1.1 ICD-30 Acceptance Limits
The maximum batch activities of radionuclides that have acceptance limits established in ICD-30, as shown in Input 2.2, are compared to their ICD-30 acceptance limit. If a limit is exceeded, the maximum batch activity is adjusted to equal the ICD-30 acceptance limit, since the Tank Operations Contractor must demonstrate compliance with the criteria in Table 5 of ICD-30 prior to WTP agreeing to receive a Treated LAW feed campaign from LAWPS (Ref. 9.3, Section 2.3). 5.1.1.1.1 Convert ICD-30 Acceptance Limits to Activities
All of the ICD-30 limits shown in Table 2-1 (except U fissile to U total) are converted to Curies. Acceptance limits in units of Ci/L are multiplied by the maximum feed batch volume from the Bounding DFLAW feed vector to calculate the activity of a radionuclide at the ICD-30 limit. The batch volumes of

CALCULATION SHEET PROJECT: RPP-WTPJOB NO.: 24590
BY: William Hix CALC NO.: 24590-BOF-M4C-DEP-00001 DATE: 6/6/2016 SHEET REV: B
SHEET NO.: 11SUBJECT: DFLAW Effluent Management Facility Air Emissions Estimate
24590-G04B-F00012 Rev 13 (Revised12/23/2015) Ref: 24590-WTP-3DP-G04B-00037, 24590-WTP-GPG-ENG-0127
each batch during DFLAW operation are extracted from the feed vector (Ref. 9.2) and then the average, minimum, and maximum values are calculated (Attachment G). For ICD-30 acceptance limits given in Ci/L:
, , ∗ ∗3.7851
Equation 2
Where: , = Activity of COPC i at ICD-30 limit, in Ci
, = Concentration of COPC i at ICD-30 limit, in Ci/L (Input 2.2) = Maximum feed batch volume, in gallons (Ref. 9.2)
Acceptance limits in units of Ci/mol Na are multiplied by the maximum batch amount of sodium,
, , to calculate the activity of a radionuclide at the ICD-30 limit. For ICD-30 acceptance limits given in Ci/mol Na:
, , ∗ , ∗ 1000 Equation 3
Where: , = Activity of COPC i at ICD-30 limit, in Ci
, = Concentration of COPC i at ICD-30 limit, in Ci/mol Na (Input 2.2)
, = Maximum batch amount of Na in DFLAW Bounding Feed Vector, in kmols (Ref. 9.2)
Note that there is an ICD-30 limit for total TRU radionuclides. This limit for total TRU needs to be broken out into individual limits for each of the TRU radionuclides. The TRU radionuclides are listed in Table 5-1. This list represents the radionuclide COPCs that meet the TRU criteria in Input 2.11 using radionuclide properties extracted from Ref. 10.6 as shown in Attachment D. Table 5-1 – TRU Radionuclides
COPC Atomic Number >92 Half-life > 20 years Alpha Emitter? 237Np 93 (Yes) 2.144E6 (Yes) Yes 238Pu 94 (Yes) 87.7 (Yes) Yes 239Pu 94 (Yes) 24110 (Yes) Yes 240Pu 94 (Yes) 6561 (Yes) Yes 241Am 95 (Yes) 432.6 (Yes) Yes 242Pu 94 (Yes) 3.75E5 (Yes Yes 243Am 95 (Yes) 7370 (Yes) Yes 243Cm 96 (Yes) 29.1 (Yes) Yes 244Cm 96 (Yes) 18.1 (NO) Yes
NOTE: 244Cm has a half-life less than 20 years, however it is included as a TRU radionuclide due to it meeting the other criteria.

CALCULATION SHEET PROJECT: RPP-WTPJOB NO.: 24590
BY: William Hix CALC NO.: 24590-BOF-M4C-DEP-00001 DATE: 6/6/2016 SHEET REV: B
SHEET NO.: 12SUBJECT: DFLAW Effluent Management Facility Air Emissions Estimate
24590-G04B-F00012 Rev 13 (Revised12/23/2015) Ref: 24590-WTP-3DP-G04B-00037, 24590-WTP-GPG-ENG-0127
First, the fractional contribution of each TRU radionuclide in the maximum feed vector batch is calculated. Then, the total TRU limit is multiplied by the fractional contribution of each TRU radionuclide to get the individual limits.
Equation 4
Where:
= Fractional contribution of TRU radionuclide i to total TRU in the maximum feed vector batch
= Maximum feed vector batch activity of TRU radionuclide i, in Ci (Equation 1) =
, ∗ , Equation 5
Where:
, = Activity of individual TRU radionuclide i at ICD-30 limit, in Ci
, = Activity of total TRU at ICD-30 limit, in Ci (Equation 3) 5.1.1.1.2 Compare Maximum Feed Vector Batch Activities to ICD-30 Limit Activities
The maximum batch activities of radionuclides that have acceptance limits established in ICD-30, as shown in Input 2.2, are compared to the activities at the ICD-30 limit calculated using Equation 2, Equation 3, or Equation 5. If the maximum batch activity exceeds the ICD-30 limit activity, then the maximum batch activity is adjusted to equal the ICD-30 limit activity. 5.1.1.1.3 U Fissile to U Total Limit
The Uranium fissile to Uranium total limit is shown in Table 2-1 as a weight percent. Total uranium is the sum of 233U, 235U, and 238U (Ref. 9.3, Table 5). Fissile uranium is calculated per the equation provided in Ref. 9.30, Section 4.1.2. The weight percent of Uranium fissile to Uranium total in the maximum feed batch is calculated using the following equation.
, 1.25 ∗ Equation 6

CALCULATION SHEET PROJECT: RPP-WTPJOB NO.: 24590
BY: William Hix CALC NO.: 24590-BOF-M4C-DEP-00001 DATE: 6/6/2016 SHEET REV: B
SHEET NO.: 13SUBJECT: DFLAW Effluent Management Facility Air Emissions Estimate
24590-G04B-F00012 Rev 13 (Revised12/23/2015) Ref: 24590-WTP-3DP-G04B-00037, 24590-WTP-GPG-ENG-0127
, * 100 Equation 7
Where: = Weight percent of Uranium fissile to Uranium total
, = Mass of fissile Uranium, in g = Maximum feed vector batch mass of COPC i, in g (Equation 8)
If exceeds the ICD-30 limit for U fissile to U total, then the masses will be adjusted to equal the ICD-30 limit. 5.1.2 COPC Maximum Batch Mass Fractions and Concentrations
The mass of each COPC in the maximum feed vector batch is calculated using the following equation:
Equation 8
Where: = Maximum feed vector batch mass of COPC i, in g = Maximum feed vector batch activity of COPC i, in Ci (Equation 1)
= Specific Activity of COPC i, in Ci/g (Input 2.1, Attachment B) The average feed vector batch total mass is calculated using the average batch volume and density. Average values are used in Equation 9 through Equation 11 for conservatism (Assumption 6.1.34). The values for total volume (in gallons) and density (in g/cc) in each batch during the DFLAW operation are extracted from the DFLAW Bounding Feed Vector (Ref. 9.2) and then the average, minimum, and maximum values are calculated (Attachment G). The average feed vector batch total mass is calculated as follows:
, , ∗ , ∗ 3.785 ∗ 1000 Equation 9
Where: , = Average total feed vector batch mass, in g
, = Average total feed vector batch volume, in gal (Attachment G)
, = Average total feed vector batch density, in g/cc (Attachment G) A conservative value for the mass fraction of each radionuclide COPC is then calculated by dividing the maximum batch mass of each COPC by the average total batch mass.

CALCULATION SHEET PROJECT: RPP-WTPJOB NO.: 24590
BY: William Hix CALC NO.: 24590-BOF-M4C-DEP-00001 DATE: 6/6/2016 SHEET REV: B
SHEET NO.: 14SUBJECT: DFLAW Effluent Management Facility Air Emissions Estimate
24590-G04B-F00012 Rev 13 (Revised12/23/2015) Ref: 24590-WTP-3DP-G04B-00037, 24590-WTP-GPG-ENG-0127
, Equation 10
Where: = Maximum feed vector batch mass fraction of COPC i
, = Average total feed vector batch mass, in g (Equation 9) A conservative value for the concentration of each radionuclide COPC is calculated by dividing the maximum batch mass of each COPC by the average total batch volume.
,∗3.785
Equation 11
Where: = Maximum feed vector batch concentration of COPC i, in g/L
, = Average total feed vector batch volume, in gal (Attachment G)
5.1.3 Radionuclide COPC Emissions Due to Entrainment of Particles/Aerosols
CCN 129507 (Ref. 9.4) assigns vapor phase partitioning coefficient values, Fv, to all WTP COPCs. Fv is a unitless parameter defined as the fraction of a COPC that is in the vapor phase in an offgas stream. All radionuclide COPCs, except for Carbon-14 (14C), Tritium (3H), and Iodine-129 (129I), are metals and nonvolatile, and are assigned a vapor phase partitioning coefficient, Fv , of 0 and assumed to exist entirely as particles in an offgas stream (Assumption 6.2.9). Particles in an offgas stream are abated by HEPA filtration (Assumption 6.2.10). 129I is also treated as a particle/aerosol for emissions estimation (Assumption 6.2.8). Emissions of radionuclide COPCs with an Fv of 0 are estimated using offgas entrainment factors. For the entrainment of radionuclides from DEP vessels, an entrainment factor of 4E-5 g entrained material / g air is used based on the median entrainment factor for a free-fall spill of an aqueous solution (Input 2.3). As a conservative and simplifying assumption for this calculation, this entrainment factor is applied to all vessels in the DEP system, except for the evaporator (Assumption 6.2.3). For the entrainment of radionuclides from the DEP evaporator, an entrainment factor of 1E-3 g entrained material / g air is used based on the release fraction prescribed in the WAC 246-247-030 (21)(a)(ii) for liquids and particulate solids (Input 2.20). This entrainment factor is applied to the DEP evaporator per Assumption 6.2.30. The total mass flow rate of entrained material in the DVP system is calculated as follows:

CALCULATION SHEET PROJECT: RPP-WTPJOB NO.: 24590
BY: William Hix CALC NO.: 24590-BOF-M4C-DEP-00001 DATE: 6/6/2016 SHEET REV: B
SHEET NO.: 15SUBJECT: DFLAW Effluent Management Facility Air Emissions Estimate
24590-G04B-F00012 Rev 13 (Revised12/23/2015) Ref: 24590-WTP-3DP-G04B-00037, 24590-WTP-GPG-ENG-0127
, , ∗ , ∗ ∗ 453.5924 ∗1
60 Equation 12
Where: , = Total mass flowrate of entrained material, in g/min
, = Total mass flowrate of the DVP system except for the evaporator, in lb/hr (Assumption 6.1.4)
= Entrainment factor for DEP vessels, in g entrained material / g air (Input 2.3)
, = Mass flowrate of the evaporator vent stream, in lb/hr (Assumption 6.1.4) = Entrainment factor for DEP evaporator, in g entrained material / g air (Input 2.20)
The mass fraction of each radionuclide COPC in each DEP vessel is assumed to be equal to the value for
calculated using Equation 10 (Assumption 6.1.1). With the COPC mass fractions assumed to be constant at the maximum value throughout the DEP system, the bounding value for COPC entrainment is calculated as follows:
, , ∗ Equation 13
Where: , = Entrained mass flowrate of COPC i, in g/min
, = Total mass flowrate of entrained material, in g/min (Equation 12) = Maximum feed vector batch mass fraction of COPC i (Equation 10)
The entrained mass flow rate is then converted to unabated activity emitted per year using the specific activity.
, , ∗ ∗ 525,600 Equation 14
Where: , = Unabated activity of COPC i emitted per year, in Ci/year
, = Entrained mass flowrate of COPC i, in g/min (Equation 13) = Specific Activity of COPC i, in Ci/g (Input 2.1, Attachment B)
The DEP vessel ventilation system includes a two-stage HEPA filtration system for removal of particulate prior to release from the EMF stack (Ref. 9.7). The decontamination factors (DFs) of the HEPA filters are given in Assumption 6.2.10. Using the HEPA filter DFs, the abated emissions of radionuclide COPC particles are calculated.
, ,
, ∗ , Equation 15
Where: , = Abated activity of COPC i emitted per year, in Ci/year
, = Decontamination factor of primary HEPA filter (Assumption 6.2.10)
, = Decontamination factor of secondary HEPA filter (Assumption 6.2.10)

CALCULATION SHEET PROJECT: RPP-WTPJOB NO.: 24590
BY: William Hix CALC NO.: 24590-BOF-M4C-DEP-00001 DATE: 6/6/2016 SHEET REV: B
SHEET NO.: 16SUBJECT: DFLAW Effluent Management Facility Air Emissions Estimate
24590-G04B-F00012 Rev 13 (Revised12/23/2015) Ref: 24590-WTP-3DP-G04B-00037, 24590-WTP-GPG-ENG-0127
5.1.4 Vapor Phase Radionuclide COPCs
14C is assumed to exist as 14CO2 and emitted entirely in the vapor phase of an offgas stream (Assumption 6.2.6). 3H is assumed to exist as tritiated water (3H2O) and emitted entirely in the vapor phase of an offgas stream (Assumption 6.2.7). 5.1.4.1 Sources of Vapor Phase Radionuclide COPCs
While the concentrations of particle phase radionuclides were assumed to be at the maximum feed vector batch mass fraction throughout the DEP system (Assumption 6.1.1), a different approach is warranted for the vapor phase radionuclides. 14C and 3H are not likely to reach their maximum feed vector batch mass fractions in the DEP system. Maximum feed vector batch mass fractions are only likely to be reached in the evaporator concentrate and, since volatile radionuclides will mostly partition to the evaporator overhead, 14C and 3H will not be concentrated in the evaporator bottoms like the other non-volatile radionuclides. To establish the input concentrations for 14C or 3H, it is assumed that no 14C or 3H is transferred to the DEP system in the SBS condensate stream or Plant Wash Vessel effluent stream and that the only input stream to the EMF containing 14C or 3H is the LAW feed flush stream to the DEP-VSL-00001 (Assumption 6.1.5). After completion of a batch transfer to LCP-VSL-00001/2, the transfer line will be flushed to the DEP-VSL-00001. The total transfer volume and stream density are monitored prior to reaching LCP-VSL-00001/2 in order to detect when the stream composition changes from LAW feed to flush water. When flush water is first detected prior to LCP-VSL-00001/2, the valve alignment is changed to divert the flush water to DEP-VSL-00001. When the flow of flush water is stopped, the transfer line drains by gravity to DEP-VSL-00001 (Ref. 9.3, Section 2.6.2). Based on the assumed flushing frequency of 18.8 hrs (Assumption 6.1.3), the applicable feed line flush volume to DEP-VSL-00001 is 1500 gallons (Input 2.4). The volume of residual feed material in the flush to DEP-VSL-00001 is estimated by multiplying the total LAW feed line flush volume (Input 2.4) by an assumed flush dilution factor (Assumption 6.1.2).
∗ ∗ 3.785 Equation 16
Where: = Volume of residual feed in a LAW feed line flush, in L
= Total volume of LAW feed line flush, in gal (Input 2.4) = Flush dilution factor (Assumption 6.1.2)
The total mass of 14C and 3H flushed annually to DEP-VSL-00001 is then calculated as follows using the maximum batch concentration, (Equation 11), and the frequency of flushing to DEP-VSL-00001

CALCULATION SHEET PROJECT: RPP-WTPJOB NO.: 24590
BY: William Hix CALC NO.: 24590-BOF-M4C-DEP-00001 DATE: 6/6/2016 SHEET REV: B
SHEET NO.: 17SUBJECT: DFLAW Effluent Management Facility Air Emissions Estimate
24590-G04B-F00012 Rev 13 (Revised12/23/2015) Ref: 24590-WTP-3DP-G04B-00037, 24590-WTP-GPG-ENG-0127
(Assumption 6.1.3). It is also assumed that the flush occurs continuously at the set frequency throughout an entire year (Assumption 6.2.5), so that the total number of flushes annually is the number of hours in a year multiplied by the frequency.
, ∗ ∗ ∗ 8760 Equation 17
Where: , = Mass of COPC i flushed to DEP-VSL-0001 annually, in g/yr
= Volume of residual feed in a LAW feed line flush, in L (Equation 16)
= Maximum feed vector batch concentration of COPC i, in g/L (Equation 11)
= Frequency of LAW feed line flush, in 1/hr (Assumption 6.1.3) 5.1.4.2 Vapor Phase Radionuclide COPC Emissions
5.1.4.2.1 14C Emissions
As a bounding assumption, it is assumed that the entire mass of 14C received in DEP-VSL-00001 annually is emitted to the DEP vessel ventilation system as it is processed through the DEP system (Assumption 6.2.4). The unabated emissions of 14C are then calculated as follows:
, , ∗ Equation 18
Where: , = Unabated activity of COPC i emitted per year, in Ci/year
, = Mass of COPC i flushed to DEP-VSL-0001 annually, in g/yr (Equation 17) = Specific Activity of COPC i, in Ci/g (Input 2.1, Attachment B)
For vapor phase COPCs with an Fv of 1, the DF is 1 through both the primary and secondary HEPA filter (Assumption 6.2.10). Therefore there is no emissions abatement provided by the HEPA filters for 14C. 5.1.4.2.2 3H Emissions
The emissions of 3H are assumed to be controlled by the evaporator/condenser mass distribution ratios (MDRs) for 3H established in Ref. 9.19, Section 8 (Assumption 6.1.35). The MDR specifically represents the ratio of the evaporator/condenser overhead mass flowrate to the evaporator/condenser feed mass flowrate.

CALCULATION SHEET PROJECT: RPP-WTPJOB NO.: 24590
BY: William Hix CALC NO.: 24590-BOF-M4C-DEP-00001 DATE: 6/6/2016 SHEET REV: B
SHEET NO.: 18SUBJECT: DFLAW Effluent Management Facility Air Emissions Estimate
24590-G04B-F00012 Rev 13 (Revised12/23/2015) Ref: 24590-WTP-3DP-G04B-00037, 24590-WTP-GPG-ENG-0127
,
, Equation 19
Where : = Mass distribution ratio of COPC i
, = Mass flow rate for COPC i in the feed to the evaporator/condenser
, = Mass flow rate for COPC i in the evaporator/condenser overheads flow MDRs for the FEP and TLP evaporators/condensers are calculated in Ref. 9.19, Section 8. These MDRs are assumed to apply to the DEP evaporator system (Assumption 6.1.13). For estimating 3H emissions, the value for , will be used for the evaporator feed stream, so , , (Assumption 6.1.36). For the evaporator and two condensers in series, the combined MDR is calculated by multiplying the individual MDRs.
, , ∗ , ∗ , Equation 20
Note: The MDR of the after-condenser is 1 (Ref. 9.19, Section 8). The unabated emissions of 3H are then calculated as follows:
, , ∗ 3 , ∗ Equation 21
Where: , = Unabated activity of COPC i emitted per year, in Ci/year
, = Mass of COPC i flushed to DEP-VSL-0001 annually, in g/yr (Equation 17)
, = Combined mass distribution ratio (Equation 20) = Specific Activity of COPC i, in Ci/g (Input 2.1, Attachment B)
For vapor phase COPCs with an Fv of 1, the DF is 1 through both the primary and secondary HEPA filters (Assumption 6.2.10). Therefore there is no emissions abatement provided by the HEPA filters for 3H. 5.1.5 ACV Exhaust System Radionuclide COPC Emissions
Air supplied to the LAW effluent process building, the LAW effluent drain tank building, and the LAW effluent utility building by the ACV supply system is exhausted by the ACV exhaust system. The ACV exhaust passes through a HEPA filtration system before being released from the EMF stack (Ref. 9.36). The unabated emissions for radionuclide COPCs from the ACV exhaust system are estimated based on a 2 month release of the unabated DEP vessel ventilation emissions into the ACV area of the EMF (Assumption 6.2.11). Abated emissions from the ACV exhaust system are based on the same particle and vapor phase HEPA DFs used for the DEP vessel ventilation system emissions (Assumption 6.2.10). Abated emissions will be calculated for both a single-stage and dual-stage HEPA filtration system in order to compare the effect on the emissions from the ACV exhaust system.
CALCULATION SHEET PROJECT: RPP-WTPJOB NO.: 24590
BY: William Hix CALC NO.: 24590-BOF-M4C-DEP-00001 DATE: 6/6/2016 SHEET REV: B
SHEET NO.: 19SUBJECT: DFLAW Effluent Management Facility Air Emissions Estimate
24590-G04B-F00012 Rev 13 (Revised12/23/2015) Ref: 24590-WTP-3DP-G04B-00037, 24590-WTP-GPG-ENG-0127
, , , ∗212
Equation 22
Where: , , = Unabated activity of COPC i emitted per year from the ACV Exhaust system, in
Ci/year
, = Unabated activity of COPC i emitted per year, in Ci/year (as determined in
previous sections) Note that since the ACV radionuclide emissions are based on a 2 month release from the DVP system into the ACV area, the total emissions of the DVP and ACV combined will double count this 2 month period (i.e. the total annual emissions for DVP and ACV are 117% of their actual value because the 2 month release period is counted for both ventilation systems). 5.1.6 Annual Possession Quantities
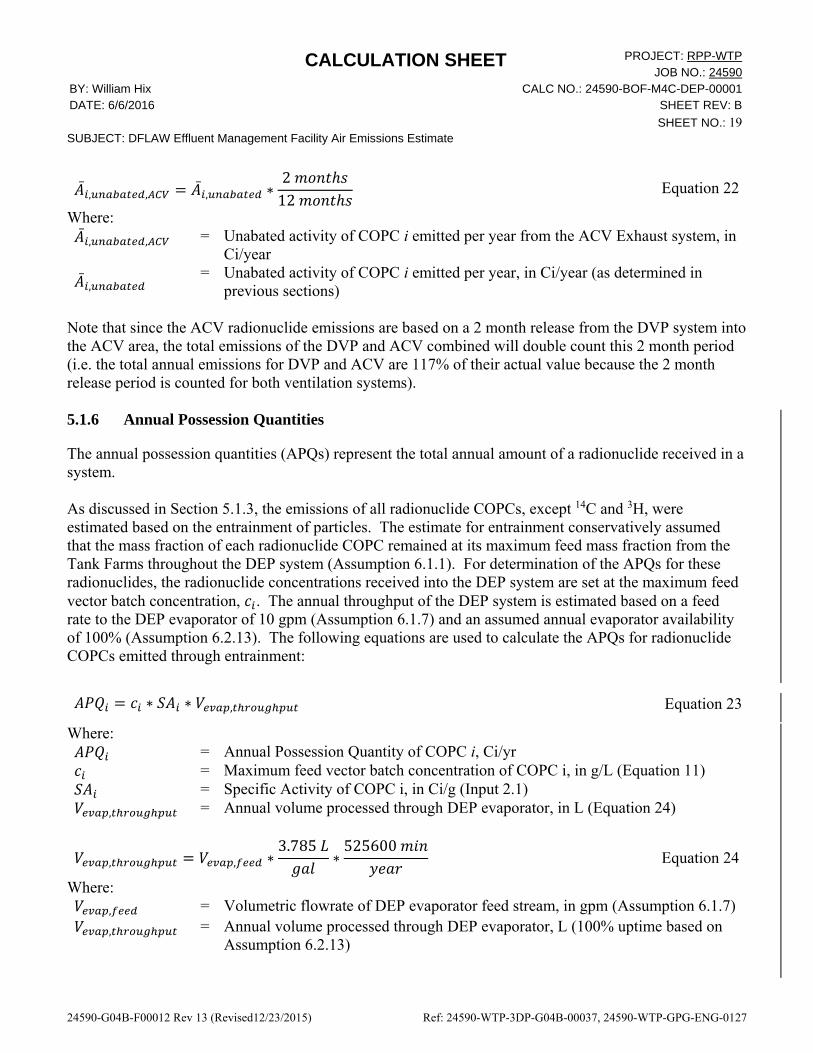
The annual possession quantities (APQs) represent the total annual amount of a radionuclide received in a system. As discussed in Section 5.1.3, the emissions of all radionuclide COPCs, except 14C and 3H, were estimated based on the entrainment of particles. The estimate for entrainment conservatively assumed that the mass fraction of each radionuclide COPC remained at its maximum feed mass fraction from the Tank Farms throughout the DEP system (Assumption 6.1.1). For determination of the APQs for these radionuclides, the radionuclide concentrations received into the DEP system are set at the maximum feed vector batch concentration, . The annual throughput of the DEP system is estimated based on a feed rate to the DEP evaporator of 10 gpm (Assumption 6.1.7) and an assumed annual evaporator availability of 100% (Assumption 6.2.13). The following equations are used to calculate the APQs for radionuclide COPCs emitted through entrainment:
∗ ∗ , Equation 23
Where: = Annual Possession Quantity of COPC i, Ci/yr
= Maximum feed vector batch concentration of COPC i, in g/L (Equation 11) = Specific Activity of COPC i, in Ci/g (Input 2.1)
, = Annual volume processed through DEP evaporator, in L (Equation 24)
, , ∗3.785
∗525600
Equation 24
Where: , = Volumetric flowrate of DEP evaporator feed stream, in gpm (Assumption 6.1.7)
, = Annual volume processed through DEP evaporator, L (100% uptime based on Assumption 6.2.13)

CALCULATION SHEET PROJECT: RPP-WTPJOB NO.: 24590
BY: William Hix CALC NO.: 24590-BOF-M4C-DEP-00001 DATE: 6/6/2016 SHEET REV: B
SHEET NO.: 20SUBJECT: DFLAW Effluent Management Facility Air Emissions Estimate
24590-G04B-F00012 Rev 13 (Revised12/23/2015) Ref: 24590-WTP-3DP-G04B-00037, 24590-WTP-GPG-ENG-0127
For vapor radionuclide COPC emissions, 14C and 3H, the mass flushed to DEP-VSL-00001 annually is calculated in Equation 17 and assumed to represent the entire amount of these COPCs received in the DEP system annually (Assumption 6.1.5). This mass is multiplied by the specific activity to determine the APQs for 14C and 3H.
, ∗ Equation 25
Where: = Annual Possession Quantity of COPC i, Ci/yr
, = Mass of COPC i flushed to DEP-VSL-0001 annually, in g/yr (Equation 17) = Specific Activity of COPC i, in Ci/g (Input 2.1)
5.2 Organic COPC Emissions
Attachment A, Table A-2 shows the 309 organics tracked as COPCs at WTP, identified as feed compounds, PIC compounds, or both. The methodology for estimating feed organic emissions and PIC emissions will be described separately in the following sections. 5.2.1 Feed Organic COPC Emissions
Feed organic COPCs are organic compounds expected to be received in the waste feed from the Tank Farms. COPCs that are present in the feed and as PICs are evaluated as both (see Section 5.2.3). 5.2.1.1 Adjustment of Tank Farms Average Ratios
Ref. 9.2 provides Tank Farms Average ratios for feed organic COPCs, as well as 51 “non-COPC” organics, that were detected in tank farms sampling. The ratios are provided as g COPC / g TOC (total organic carbon) and as g COPC-as-Carbon / g TOC. An evaluation of the g COPC-as-Carbon / g TOC ratios for all organics (COPC and non-COPC) shows the ratios add up to 0.691 (Attachment C, Excel File “DFLAW Organic and PIC COPC Emissions Estimate.xlsx”, Worksheet “Feed Organic COPCs - Calc”, Cell D143), meaning the remaining fraction (0.309) of organic carbon is unaccounted for in the Tank Farms Average ratios. As an approximation to account for the unspeciated organic carbon, the "COPC-as-Carbon" ratios are scaled by a factor of (0.691-1), i.e. the remaining unspeciated organic carbon is assumed to be distributed proportionally to all of the organic compounds with ratios (Assumption 6.2.12).
,
∑ Equation 26
Where:
, = Scaled Tank Farms Average ratio for COPC i to account for unspeciated organic carbon, g COPC-as-Carbon / g TOC
= Tank Farms Average ratio for COPC i, g COPC-as-Carbon / g TOC (Ref. 9.2) ∑ = Sum of all Tank Farms Average ratios (COPC and non-COPC) = 0.69

CALCULATION SHEET PROJECT: RPP-WTPJOB NO.: 24590
BY: William Hix CALC NO.: 24590-BOF-M4C-DEP-00001 DATE: 6/6/2016 SHEET REV: B
SHEET NO.: 21SUBJECT: DFLAW Effluent Management Facility Air Emissions Estimate
24590-G04B-F00012 Rev 13 (Revised12/23/2015) Ref: 24590-WTP-3DP-G04B-00037, 24590-WTP-GPG-ENG-0127
Scaled values for the tank farm ratios, in units of g COPC / g TOC, are then calculated by multiplying , by the ratio of the mass of COPC i to the mass of COPC i as Carbon.
, , ∗ Equation 27
Where:
, = Scaled Tank Farms Average ratio for COPC i to account for unspeciated organic carbon, g COPC / g TOC
= Tank Farms Average ratio for COPC i, g COPC / g TOC (Ref. 9.2)
, = Scaled Tank Farms Average ratio for COPC i to account for unspeciated organic
carbon, g COPC-as-Carbon / g TOC (Equation 26)
= Tank Farms Average ratio for COPC i, g COPC-as-Carbon / g TOC (Ref. 9.2) There is a subset of feed organic COPCs that do not have Tank Farms Average ratios defined in Ref. 9.2, meaning these are COPCs for which no data is available. Therefore, this subset will have emissions of zero using the methodology based on Tank Farms Average ratios. However, this subset will be revisited in Section 5.2.4.2.2, in order to provide a bounding estimate of the emissions for these COPCs that is greater than zero. 5.2.1.2 Determination of Feed Vector TOC Values
The DFLAW Bounding Feed Vector includes separate values for TOC and oxalate (C2O42-). These values
must be combined to have a true TOC value.
∗ ∗ ∗ 1000 Equation 28
Where: = Adjusted mass of TOC delivered to WTP in a feed vector batch, in g
MWc = Molecular weight of carbon g/mol (Input 2.6) = Moles of TOC delivered to WTP in a feed vector batch, in kmol (Ref. 9.2)
= Moles of carbon per mole of oxalate (2 kmol/kmol) = Moles of oxalate delivered to WTP in a feed vector batch, in kmol (Ref. 9.2)
5.2.1.3 COPC Maximum Batch Masses, Mass Fractions, and Concentrations
Using the adjusted mass of TOC in each batch (Equation 28), the average, minimum, and maximum values for adjusted mass of TOC are calculated (Attachment G). The maximum batch mass of each feed organic COPC is then calculated as follows:
CALCULATION SHEET PROJECT: RPP-WTPJOB NO.: 24590
BY: William Hix CALC NO.: 24590-BOF-M4C-DEP-00001 DATE: 6/6/2016 SHEET REV: B
SHEET NO.: 22SUBJECT: DFLAW Effluent Management Facility Air Emissions Estimate
24590-G04B-F00012 Rev 13 (Revised12/23/2015) Ref: 24590-WTP-3DP-G04B-00037, 24590-WTP-GPG-ENG-0127
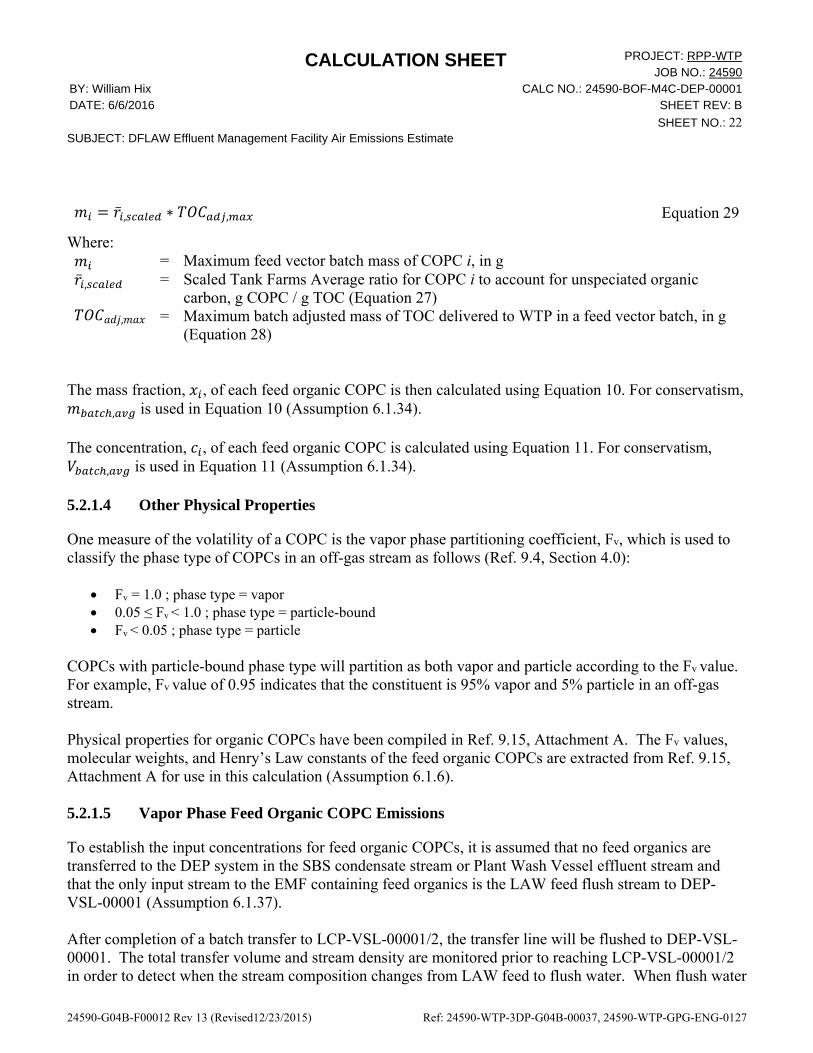
, ∗ , Equation 29
Where: = Maximum feed vector batch mass of COPC i, in g
, = Scaled Tank Farms Average ratio for COPC i to account for unspeciated organic carbon, g COPC / g TOC (Equation 27)
, = Maximum batch adjusted mass of TOC delivered to WTP in a feed vector batch, in g (Equation 28)
The mass fraction, , of each feed organic COPC is then calculated using Equation 10. For conservatism,
, is used in Equation 10 (Assumption 6.1.34). The concentration, , of each feed organic COPC is calculated using Equation 11. For conservatism,
, is used in Equation 11 (Assumption 6.1.34). 5.2.1.4 Other Physical Properties
One measure of the volatility of a COPC is the vapor phase partitioning coefficient, Fv, which is used to classify the phase type of COPCs in an off-gas stream as follows (Ref. 9.4, Section 4.0):
Fv = 1.0 ; phase type = vapor 0.05 ≤ Fv < 1.0 ; phase type = particle-bound Fv < 0.05 ; phase type = particle
COPCs with particle-bound phase type will partition as both vapor and particle according to the Fv value. For example, Fv value of 0.95 indicates that the constituent is 95% vapor and 5% particle in an off-gas stream. Physical properties for organic COPCs have been compiled in Ref. 9.15, Attachment A. The Fv values, molecular weights, and Henry’s Law constants of the feed organic COPCs are extracted from Ref. 9.15, Attachment A for use in this calculation (Assumption 6.1.6). 5.2.1.5 Vapor Phase Feed Organic COPC Emissions
To establish the input concentrations for feed organic COPCs, it is assumed that no feed organics are transferred to the DEP system in the SBS condensate stream or Plant Wash Vessel effluent stream and that the only input stream to the EMF containing feed organics is the LAW feed flush stream to DEP-VSL-00001 (Assumption 6.1.37). After completion of a batch transfer to LCP-VSL-00001/2, the transfer line will be flushed to DEP-VSL-00001. The total transfer volume and stream density are monitored prior to reaching LCP-VSL-00001/2 in order to detect when the stream composition changes from LAW feed to flush water. When flush water

CALCULATION SHEET PROJECT: RPP-WTPJOB NO.: 24590
BY: William Hix CALC NO.: 24590-BOF-M4C-DEP-00001 DATE: 6/6/2016 SHEET REV: B
SHEET NO.: 23SUBJECT: DFLAW Effluent Management Facility Air Emissions Estimate
24590-G04B-F00012 Rev 13 (Revised12/23/2015) Ref: 24590-WTP-3DP-G04B-00037, 24590-WTP-GPG-ENG-0127
is first detected prior to LCP-VSL-00001/2, the valve alignment is changed to divert the flush water to DEP-VSL-00001. When the flow of flush water is stopped, the transfer line drains by gravity to DEP-VSL-00001 (Ref. 9.3, Section 2.6.2). The volume of residual feed in the flush, , was previously calculated using Equation 16. The total mass of each feed organic COPC flushed annually to DEP-VSL-00001, , , is then calculated using Equation 17. As a bounding assumption, it is assumed that the entire vapor fraction of each feed organic COPC received in DEP-VSL-00001 annually is emitted to the DEP vessel ventilation system as it is processed through the DEP system (Assumption 6.2.16). The unabated emissions of feed organic COPCs is then calculated as follows:
, , , ∗ , ∗1
31,536,000 Equation 30
Where: , , = Unabated vapor phase emissions of COPC i, in g/sec
, = Mass of COPC i flushed to DEP-VSL-0001 annually, in g/yr (Equation 17)
, = Vapor phase partitioning coefficient of COPC i (Section 5.2.1.4) For vapor phase COPCs with an Fv of 1, the DF is 1 through both the primary and secondary HEPA filter (Assumption 6.2.10). Therefore there is no emissions abatement provided by the HEPA filters for feed organic COPCs emitted in the vapor phase ( , , , , ). 5.2.1.6 Particle Phase Feed Organic COPC Emissions
Feed organic COPCs with an Fv value less than 1 will have particulate phase emissions. For the estimation of particle emissions, the maximum feed vector batch mass fraction of COPC i, , (calculated in Section 5.2.1.3) is conservatively assumed to represent the mass fraction of feed organic COPC i throughout the DEP system (Assumption 6.1.1). The entrained mass flowrate of feed organic COPCs from the DVP system are calculated using the total mass flowrate of entrained material (Equation 12) and the following equation:
, , ∗ ∗ 1 , Equation 31
Where: , = Entrained mass flowrate of COPC i, in g/min
, = Total mass flowrate of entrained material, in g/min (Equation 12)
, = Vapor phase partitioning coefficient of COPC i (Section 5.2.1.4)

CALCULATION SHEET PROJECT: RPP-WTPJOB NO.: 24590
BY: William Hix CALC NO.: 24590-BOF-M4C-DEP-00001 DATE: 6/6/2016 SHEET REV: B
SHEET NO.: 24SUBJECT: DFLAW Effluent Management Facility Air Emissions Estimate
24590-G04B-F00012 Rev 13 (Revised12/23/2015) Ref: 24590-WTP-3DP-G04B-00037, 24590-WTP-GPG-ENG-0127
The value for , (in g/min) calculated from Equation 31 is converted to g/sec and represents the unabated particulate emissions of feed organic COPC i, , , .
, , , ∗160
Equation 32
Where : , , = Unabated particulate emissions of COPC i, in g/sec
, = Entrained mass flowrate of COPC i, in g/min (Equation 31) The abated emissions are then calculated using a modification to Equation 15, based on mass emitted instead of activity emitted.
, ,, ,
, ∗ , Equation 33
Where: , , = Abated particulate emissions of COPC i, in g/sec
, , = Unabated particulate emissions of COPC i, in g/sec (Equation 32)
, = Decontamination factor of primary HEPA filter (Assumption 6.2.10)
, = Decontamination factor of secondary HEPA filter (Assumption 6.2.10) 5.2.2 PIC COPC Emissions
PICs are COPCs generated in the melter through combustion of organic material in the melter feed. The following methodology is used to estimate the emissions of PICs from the DVP system. 5.2.2.1 PIC Generation Rates
The generation rates of PICs in the melter have been studied through R&T (Research and Technology) testing. Generation rates for PICs detected in testing at the Vitreous State Laboratory of the Catholic University of America (VSL) are reported in Ref. 9.15, Table 3. These generation rates are used to estimate the emissions of PICs from the DVP system (Assumption 6.2.26). First, the list of PICs with generation rates in Ref. 9.15, Table 3 is cross referenced with the list of PIC COPCs in Attachment A, Table A-2, and generation rates are assigned to the COPCs that occur in both lists. Generation rates are given in units of mg generated / mg melter feed TOC. Values calculated in the Process Inputs Basis of Design (PIBOD) (Ref. 9.22) model runs for TOC in the LAW Melter Feed Process system stream (LFP04) were extracted for use in this calculation (Attachment F, Table F-1). The maximum value for melter feed TOC in Attachment F will be used to provide a conservative value for the amount of PIC generation. This LAW melter feed TOC value is assumed to apply to the DFLAW operating scenario (Assumption 6.1.15) As an initial screening, PICs with an Fv value of 1 are assumed to pass through the SBS with a DF of 1 and are emitted entirely through the LAW offgas system (Assumption 6.2.15). This means these vapor phase PICs will not be captured in the SBS, and therefore not transferred to the DEP system through the

CALCULATION SHEET PROJECT: RPP-WTPJOB NO.: 24590
BY: William Hix CALC NO.: 24590-BOF-M4C-DEP-00001 DATE: 6/6/2016 SHEET REV: B
SHEET NO.: 25SUBJECT: DFLAW Effluent Management Facility Air Emissions Estimate
24590-G04B-F00012 Rev 13 (Revised12/23/2015) Ref: 24590-WTP-3DP-G04B-00037, 24590-WTP-GPG-ENG-0127
SBS condensate stream (RLD21). Therefore, these vapor phase PICs will therefore have emissions of zero using the following methodology. However, these vapor phase PICs will be revisited in Section 5.2.4.2.1, in order to provide a bounding estimate of emissions for these COPCs that is greater than zero. Next, the mass flowrates leaving the melter (in g/sec) are calculated for PIC COPCs that have generation rates reported in Ref. 9.15, Table 3.
, , ∗ , ∗1000
∗1
3600 Equation 34
Where : , = Mass flowrate of PIC COPC i generated in the melter, in g/sec
, = Generation rate of PIC COPC i, in mg (or g) PIC generated / mg (or g) melter feed TOC (Ref. 9.15, Table 3)
, = Maximum mass flowrate of TOC in melter feed stream LFP04 from PIBOD model runs, in kg/hr (Assumption 6.1.15)
As a conservative assumption, if a particle or particle-bound PIC COPC does not have a generation rate in Ref. 9.15, Table 3, it is assigned the maximum , value for a particle or particle-bound PIC COPC for calculation of Equation 34 (Assumption 6.2.17). 5.2.2.2 PIC COPC Emissions
Next, the amount of each PIC COPC captured in the SBS as particulate is calculated. For conservatism, the entire fraction of each PIC COPC that exists as particulate, represented by 1 , , is assumed to be captured in the SBS (Assumption 6.2.18).
, , ∗ 1 , Equation 35
Where : , = Mass flowrate of PIC COPC i captured in the SBS, in g/sec
, = Mass flowrate of PIC COPC i generated in the melter, in g/sec (Equation 34)
, = Vapor phase partitioning coefficient of COPC i (Section 5.2.1.4) The SBS condensate is transferred from the SBS to RLD-VSL-00005. The contents of RLD-VSL-00005 are transferred once every 24 hours to DEP-VSL-00002 with a transfer volume of 10,700 gallons (Assumptions 6.2.19 and 6.2.20, respectively). This transfer stream is designated RLD21 in the PFD (Ref. 9.5). The mass flowrate of stream RLD21 is calculated, and then subsequently used to calculate the mass fraction of each PIC COPC in stream RLD21.

CALCULATION SHEET PROJECT: RPP-WTPJOB NO.: 24590
BY: William Hix CALC NO.: 24590-BOF-M4C-DEP-00001 DATE: 6/6/2016 SHEET REV: B
SHEET NO.: 26SUBJECT: DFLAW Effluent Management Facility Air Emissions Estimate
24590-G04B-F00012 Rev 13 (Revised12/23/2015) Ref: 24590-WTP-3DP-G04B-00037, 24590-WTP-GPG-ENG-0127
∗ ∗ ∗3600
∗3.7851
Equation 36
Where : = Mass flowrate of stream RLD21, in g/sec
= Transfer volume of stream RLD21, in gal (Assumption 6.2.20) = Density of stream RLD21 from PIBOD, in g/L (From Input 2.14) =
Frequency of transfer from RLD-VSL-00005 to DEP-VSL-00002, in 1/hr (Assumption 6.2.19)
,, Equation 37
Where : , = Mass fraction of PIC COPC i in Stream RLD21 = Mass flowrate of stream RLD21, in g/sec (Equation 36)
, = Mass flowrate of PIC COPC i captured in the SBS, in g/sec (Equation 35) For the estimation of particle emissions, the mass fraction of PIC COPC i in Stream RLD21, , , is assumed to represent the mass fraction of PIC COPC i throughout the DEP system (Assumption 6.1.1). The particulate emissions of PIC COPCs from the DVP system are calculated using Equation 12 and Equation 13, previously defined in Section 5.1.3. In Equation 13, , is substituted for . Next, values for , , and , , are calculated using Equation 32 and Equation 33, previously defined in Section 5.2.1.6. 5.2.3 Feed/PIC Organic COPC Emissions
In Attachment A, Table A-2, a subset of organic COPCs are identified as being present as both Feed Organics and PICs. Feed/PIC COPCs with an Fv value less than 1 could have particulate emissions based on the methodology described in Sections 5.2.1.6 and 5.2.2.2. The particulate emissions reported in the results for these Feed/PIC COPCs will be the sum of the particulate emissions calculated in Sections 7.2.1.6 and 7.2.2.2. 5.2.4 Organic COPC Summary and Comparison to De Minimis Emissions Limits
The results from Sections 5.2.1, 5.2.2, and 5.2.3 are presented in summary tables (Table 8-4 and Table 8-5 ). The summary table for feed organic COPCs (Sections 5.2.1 and 5.2.3) shows results for vapor phase, particle phase, and total emissions for each feed organic COPC. The PIC COPC summary shows particle phase emissions. Next, the total abated emissions values are compared to de minimis emissions limits for toxic air pollutants (TAPs) established in WAC 173-460-150 (Input 2.13). Each TAP has a de minimis value (lb/averaging period) and an averaging period (1-hour, 24-hours, or 1 year).

CALCULATION SHEET PROJECT: RPP-WTPJOB NO.: 24590
BY: William Hix CALC NO.: 24590-BOF-M4C-DEP-00001 DATE: 6/6/2016 SHEET REV: B
SHEET NO.: 27SUBJECT: DFLAW Effluent Management Facility Air Emissions Estimate
24590-G04B-F00012 Rev 13 (Revised12/23/2015) Ref: 24590-WTP-3DP-G04B-00037, 24590-WTP-GPG-ENG-0127
De minimis emissions are defined in Ref. 10.8 as “trivial levels of emissions that do not pose a threat to human health or the environment. The de minimis emissions threshold values are listed in WAC 173-460-150.” The de minimis values are all converted to units of lb/year.
,
, , 1
, ∗ 365, 24
, ∗ 8760, 1 Equation 38
Where: , = De minimis emissions limit for COPC i , standardized to lb/yr
, = De minimis emissions limit for COPC i , lb/averaging period (Input 2.13) Next, the values for , , (Table 8-4 and Table 8-5 ) converted from g/sec to lb/year, for a standard comparison with the de minimis values.
, , , , ∗ , ,
∗
.
If any values for , , are greater than , , that COPC is evaluated using a
more rigorous approach for estimating the vapor emissions (Section 5.2.4.1). 5.2.4.1 Henry’s Law Analysis
The subset of feed organic COPCs that exceed their de minimis emissions limit, based on the first-pass bounding assumption of complete emission of the vapor fraction of the COPC mass received in the feed line flush (Assumption 6.2.16), are evaluated a second time using a Henry’s Law analysis. First, the concentration of each feed organic COPC (in g/L) is calculated based on the amount received in the feed line flush to DEP-VSL-00001 and the DEP evaporator annual throughput volume. The annual throughput is determined based on Assumptions 6.1.7 and 6.2.13.
,,
, Equation 39
Where: , = Concentration of COPC i based on amount received in feed line flush, g/L
, = Mass of COPC i flushed to DEP-VSL-0001 annually, in g/yr (Equation 17)
, = Annual volume processed through DEP evaporator, in L (Equation 24) Each COPC is assumed to be at the concentration, , , throughout the DEP system (Assumption 6.1.11). The equation for Henry’s Law is (Ref. 10.9, Equation 1):
CALCULATION SHEET PROJECT: RPP-WTPJOB NO.: 24590
BY: William Hix CALC NO.: 24590-BOF-M4C-DEP-00001 DATE: 6/6/2016 SHEET REV: B
SHEET NO.: 28SUBJECT: DFLAW Effluent Management Facility Air Emissions Estimate
24590-G04B-F00012 Rev 13 (Revised12/23/2015) Ref: 24590-WTP-3DP-G04B-00037, 24590-WTP-GPG-ENG-0127
, Equation 40
Where:
= Henry’s Law constant of COPC i, in ∗
= Concentration of COPC i in the aqueous phase, in mol/m3 (Equation 43) = Partial pressure of COPC i in the vapor phase, in Pa (Equation 41)
The equation for partial pressure using Dalton’s Law is (Ref. 10.3, Page 43-2, Equation 43.11):
∗ Equation 41
Where: = Mole fraction COPC i in the vapor phase
P = Total pressure of the vapor space, in Pa
The Henry’s Law constants used in this calculation (Section 5.2.1.4) have units of ∗
, which is the
reciprocal of the units in Equation 40, therefore the equation for Henry’s Law applicable to this calculation is:
, , , using units of ∗
Equation 42
The concentration of COPC i in the aqueous phase, (with units of mol/m3), can be defined based on other variables previously established in this calculation.
, ∗ Equation 43
Where:
, = Concentration of COPC i based on amount received in feed line flush, g/L (Equation 39)
= Molecular weight of COPC i, in g/mol (Ref. 9.15, Attachment A) Next, substitute Equation 41 and Equation 43 into Equation 42 and rearrange to solve for the vapor phase mole fraction, .
,∗
, ∗
, ∗, ∗
Equation 44
Equation 44 is solved for two separate cases:

CALCULATION SHEET PROJECT: RPP-WTPJOB NO.: 24590
BY: William Hix CALC NO.: 24590-BOF-M4C-DEP-00001 DATE: 6/6/2016 SHEET REV: B
SHEET NO.: 29SUBJECT: DFLAW Effluent Management Facility Air Emissions Estimate
24590-G04B-F00012 Rev 13 (Revised12/23/2015) Ref: 24590-WTP-3DP-G04B-00037, 24590-WTP-GPG-ENG-0127
Case 1: Vessel Vent Streams Case 2: Evaporator Vent Stream 5.2.4.1.1 Case 1: Vessel Vent Streams
The vapor emissions from all vessel vent streams, except for the vent from the evaporator system, are estimated using a combined Henry’s Law analysis. The pressure in the vapor space, Pvessel, for all DEP vessels is 0.9622 atm (Assumption 6.1.10). Equation 44 is solved for the vapor phase mole fractions, , in the DEP vessel vapor spaces. Next, the combined mass flow rate of COPC i from all DEP vessel vents is calculated based on the total mass flow rate of the vessel vent system, , .
, ,, ∗ . ∗
∗ ∗ Equation 45
Where: , , = Vapor phase mass flow rate of COPC i in vessel vent stream, g/sec
, = Total mass flowrate of the DVP system, in lb/hr (Assumption 6.1.4) = Average molecular weight of air, g/mol (Input 2.8)
= Mole fraction COPC i in the vapor phase (From Equation 44) = Molecular weight of COPC i (Ref. 9.15, Attachment A)
Note: , is the total flow of the vessel vent exhaust stream and includes the vent stream from the evaporator system. The total flow is used in Equation 45 for conservatism (Assumption 6.1.12). 5.2.4.1.2 Case 2 Evaporator Vent Stream
The vapor emissions from the evaporator system vent are estimated separately from the vessel vent streams due to differing operating pressures and the inclusion of condensers in the evaporator system vent. The evaporator system vents from the after-condenser. The vapor emissions from the evaporator separator vessel are estimated using a Henry’s Law analysis. The pressure, Pevap, in the evaporator vessel is 0.0967 atm (Assumption 6.1.9). Equation 44 is solved for the vapor phase mole fractions, , in the evaporator vessel overheads stream. Next, the mass flow rate of COPC i in the evaporator overheads stream is calculated based on the total volumetric flow rate of the evaporator overheads stream.
, ,, ∗ . ∗ ∗
∗ ∗ Equation 46
Where: , , = Vapor phase mass flow rate of COPC i in evaporator overheads stream, in g/sec
, = Total volumetric flowrate of the evaporator overheads stream, in gpm (Assumption 6.1.8)
= Molecular weight of water, in g/mol (Input 2.7) = Density of water, in g/L (Equation 47)
= Mole fraction COPC i in the vapor phase (Equation 44) = Molecular weight of COPC i (Ref. 9.15, Attachment A)

CALCULATION SHEET PROJECT: RPP-WTPJOB NO.: 24590
BY: William Hix CALC NO.: 24590-BOF-M4C-DEP-00001 DATE: 6/6/2016 SHEET REV: B
SHEET NO.: 30SUBJECT: DFLAW Effluent Management Facility Air Emissions Estimate
24590-G04B-F00012 Rev 13 (Revised12/23/2015) Ref: 24590-WTP-3DP-G04B-00037, 24590-WTP-GPG-ENG-0127
The density of water is calculated using the following correlation from Ref. 9.18, Section 8. The evaporator overheads stream is assumed to have the physical properties of water (Assumption 6.2.14).
3.564 3 ∗ 6.954 2 ∗ 1001 Equation 47
Where: = Density of water, in kg/m3 or g/L
Tevap = Normal operating temperature of the DEP evaporator, °C (Assumption 6.1.9) Next, the separation in the primary, inter-, and after-condensers is approximated using condenser MDRs. MDRs for the FEP and TLP evaporators/condensers are calculated in Ref. 9.19, Section 8. These MDRs are assumed to apply to the DEP evaporator system (Assumption 6.1.13). The primary and inter-condenser MDRs for volatile organic compounds (VOCs) in Ref. 9.19 are assumed to apply to all COPCs being evaluated in Case 2 (Assumption 6.1.14). The feed stream to the primary condenser is the evaporator overheads stream, so , , , . For the two condensers in series, the combined MDR is calculated by multiplying the individual MDRs.
, , ∗ , Equation 48
Note: The MDR of the after-condenser is 1 (Ref. 9.19, Section 8). The mass flowrate of COPC i leaving in the evaporator system vent is then calculated as follows:
, _ , , ∗ , , Equation 49
Where : , _ , = Vapor phase mass flowrate of COPC i in the evaporator vent stream, g/sec
, = VOCs combined mass distribution ratio for primary and inter-condensers (Equation 48)
, , = Vapor phase mass flow rate of COPC i in evaporator overheads stream, in g/sec (Equation 46)
5.2.4.1.3 Henry’s Law Analysis Emissions and Mass Check
The unabated vapor emissions based on the Henry’s Law analyses from Case 1 and Case 2 are combined to give the total unabated vapor emissions.

CALCULATION SHEET PROJECT: RPP-WTPJOB NO.: 24590
BY: William Hix CALC NO.: 24590-BOF-M4C-DEP-00001 DATE: 6/6/2016 SHEET REV: B
SHEET NO.: 31SUBJECT: DFLAW Effluent Management Facility Air Emissions Estimate
24590-G04B-F00012 Rev 13 (Revised12/23/2015) Ref: 24590-WTP-3DP-G04B-00037, 24590-WTP-GPG-ENG-0127
, , , , , _ , Equation 50
Where : , , = Unabated vapor emissions of COPC i, in g/sec
, _ , = Vapor phase mass flowrate of COPC i in the evaporator vent stream, g/sec (Equation 49)
, , = Vapor phase mass flow rate of COPC i in vessel vent stream, g/sec (Equation 45)
In some cases, , , may exceed , , (Equation 30). Since , , is based on the entire mass of the vapor phase of a COPC that is flushed to the DEP system being emitted, values of , , that exceed , , will be capped at the value for , , . 5.2.4.2 Adjustment of COPCs with Zero Emissions
There are two subsets of organic COPCs that have emissions reported as zero based on the methodology described in the preceding sections. The first subset is vapor phase PIC COPCs that are assumed to not be captured in the SBS, and therefore not transferred to the DEP system. The second subset is the feed organic COPCs that do not have Tank Farms Average Ratios defined in Ref. 9.2. 5.2.4.2.1 Adjustment of PIC COPCs with Zero Emissions
The subset of PIC COPCs with vapor phase type (Fv = 1) have emissions estimated as 0 g/sec based on Assumption 6.2.15. Assumption 6.2.15 states that vapor phase COPCs have a DF of 1 in the SBS, meaning the entire amount entering the SBS passes through the SBS without being scrubbed from the off-gas stream. Since these vapor phase PIC COPCs are not captured in the SBS, they are not transferred to the DEP system in the SBS condensate stream (RLD21). In order to assign this subset of PIC COPCs a bounding emissions estimate greater than 0 g/sec, they are assumed to be emitted at the average unabated particulate emissions rate for PIC COPCs (Assumption 6.2.27). The unabated particulate emissions rate for PIC COPCs was calculated using Equation 32. The average of the non-zero unabated particulate emissions rates is calculated, and this average value is assigned to all vapor phase PIC COPCs. 5.2.4.2.2 Adjustment of Feed Organic COPCs with Zero Emissions
The subset of the feed organic COPCs that were not detected in Tank Farms sampling and therefore do not have Tank Farms Average Ratios defined in Ref. 9.2 initally have emissions estimates of 0 g/sec. In order to assign this subset of feed organic COPCs a bounding emissions estimate greater than 0 g/sec, they are assumed to be emitted at the average unabated vapor emissions rate for feed organic COPCs with Tank Farms Average Ratios (Assumption 6.2.28). The unabated vapor emissions rate for feed organic COPCs is reported in the Feed Organic COPC summary table (Table 8-4). In the summary table, feed organic COPCs with Tank Farms Average Ratios are identified as having non-zero values for vapor emissions. The average unabated vapor emissions rate for feed organic COPCs with Tank Farms Average

CALCULATION SHEET PROJECT: RPP-WTPJOB NO.: 24590
BY: William Hix CALC NO.: 24590-BOF-M4C-DEP-00001 DATE: 6/6/2016 SHEET REV: B
SHEET NO.: 32SUBJECT: DFLAW Effluent Management Facility Air Emissions Estimate
24590-G04B-F00012 Rev 13 (Revised12/23/2015) Ref: 24590-WTP-3DP-G04B-00037, 24590-WTP-GPG-ENG-0127
Ratios is calculated, and this average value is assigned as the unabated vapor emissions rate for all feed organic COPCs without Tank Farms Average Ratios. 5.3 Inorganic COPC Emissions
Attachment A, Table A-3 shows the 54 inorganic compounds tracked as COPCs at WTP. Table A-3 designates each inorganic COPC as either a feed compound or a stack compound. Feed compounds are received in the waste feed stream to the plant, while stack compounds are generated during processing within the plant. 5.3.1 Feed Inorganic COPC Emissions
5.3.1.1 COPC Maximum Batch Masses, Mass Fractions, and Concentrations
The maximum batch mass for the feed inorganic COPCs is determined using the Tank Farms Average ratios (g COPC / g Na) and the DFLAW Bounding Feed Vector maximum sodium batch. The Tank Farms Average ratios (g COPC / g Na) are provided in Ref. 9.2. The Tank Farms Average ratios are assumed to be applicable to this analysis (Assumption 6.2.1). The DFLAW Bounding Feed Vector is provided in Ref. 9.2 and used in this calculation (Assumption 6.2.2). The values for the amount of sodium (in kmol) in each batch during the DFLAW campaign are extracted from the DFLAW Bounding Feed Vector and then the average, minimum, and maximum values are calculated. The maximum batch mass of each feed inorganic COPC is calculated as follows:
∗ , ∗ ∗ 1000 Equation 51
Where: = Maximum feed vector batch mass of COPC i, in g
= Tank Farms Average ratio of COPC i, in g COPC / g Na (Ref. 9.2)
, = Maximum batch amount of Na in DFLAW Bounding Feed Vector, in kmols (Attachment G)
= Molecular weight of sodium, in g/mol (Input 2.5) A conservative value for the mass fraction, , of each feed inorganic COPC is then calculated using Equation 10. A conservative value for the concentration, , of each feed inorganic COPC is calculated using Equation 11. 5.3.1.2 Particle Phase Feed Inorganic COPC Emissions
Feed inorganic COPCs (with the exception of ammonia, mercury, and cyanide) are emitted through entrainment as particles (Assumption 6.2.21). For the estimation of particle emissions, the maximum feed vector batch mass fraction of COPC i, , (calculated in Section 5.3.1.1) is conservatively assumed to represent the mass fraction of feed inorganic COPC i throughout the DEP system (Assumption 6.1.1).

CALCULATION SHEET PROJECT: RPP-WTPJOB NO.: 24590
BY: William Hix CALC NO.: 24590-BOF-M4C-DEP-00001 DATE: 6/6/2016 SHEET REV: B
SHEET NO.: 33SUBJECT: DFLAW Effluent Management Facility Air Emissions Estimate
24590-G04B-F00012 Rev 13 (Revised12/23/2015) Ref: 24590-WTP-3DP-G04B-00037, 24590-WTP-GPG-ENG-0127
The particulate emissions of feed inorganic COPCs from the DVP system are calculated using Equation 12 and Equation 13 (previously defined in Section 5.1.3). The value for , (in g/min) calculated from Equation 13 is converted to g/sec using Equation 32 (defined in Section 5.2.1.6) and represents the unabated particulate emissions of feed inorganic COPC i,
, , . The abated emissions are then calculated using Equation 33 (defined in Section 5.2.1.6). 5.3.1.2.1 Mercury
Mercury emissions depend on the speciation of the mercury in the waste streams. The main species present in the Tank Farms are elemental mercury (Hg), mercury oxide (HgO), mercury chloride (HgCl2), and calomel (Hg2Cl2). Hg is a volatile metal, HgCl2 is semivolatile, and HgO and Hg2Cl2 are non-volatile (Ref. 9.29, Section 7.2.3). In addition, monomethyl mercury (CH3Hg+) and dimethyl mercury [(CH3)2Hg ] have the potential to form in WTP waste streams due to the reaction between mercury and organic species, with monomethyl mercury being non-volatile and dimethyl mercury being volatile (Ref. 9.24). The mercury received in the DEP system is assumed to be non-volatile (HgO) and emitted through entrainment (Assumption 6.1.32). For the calculation of mercury emissions from the DEP system due to entrainment, a methodology similar to the one in Sections 5.3.1.1 and 5.3.1.2 for other particle phase feed inorganic COPCs is used. This includes an assumption that the mass fraction of Hg is constant throughout the DEP system at a maximum feed value (Assumption 6.1.33). Using this method, the maximum feed vector mass fraction, , will be compared to the maximum feed mass fraction calculated using the ICD-30 limit for mercury and if the ICD-30 mass fraction is greater, it will be used for greater conservatism. The maximum feed vector batch mass of Hg using the ICD-30 limit is calculated as follows:
, , ∗ , ∗ 1000 ∗ Equation 52
Where: , = Maximum feed vector batch mass of Hg using ICD-30 limit, in g
, = ICD-30 limit for Hg, in mol Hg / mol Na (Input 2.19)
, = Maximum batch amount of Na in DFLAW Bounding Feed Vector, in kmols (Attachment G)
= Molecular weight of Hg, in g/mol (Input 2.10) If , is greater than the mass of Hg calculated from Equation 51, then it is used in the calculation of emissions due to entrainment using Equation 13, Equation 32, and Equation 33. Vapor emissions of dimethyl mercury will be calculated separately (see Section 5.3.1.3.3).

CALCULATION SHEET PROJECT: RPP-WTPJOB NO.: 24590
BY: William Hix CALC NO.: 24590-BOF-M4C-DEP-00001 DATE: 6/6/2016 SHEET REV: B
SHEET NO.: 34SUBJECT: DFLAW Effluent Management Facility Air Emissions Estimate
24590-G04B-F00012 Rev 13 (Revised12/23/2015) Ref: 24590-WTP-3DP-G04B-00037, 24590-WTP-GPG-ENG-0127
5.3.1.3 Vapor Phase Feed Inorganic COPC Emissions
Ammonia, cyanide, carbon disulfide, and dimethyl mercury are emitted in the vapor phase (Assumptions 6.2.21, 6.2.16, and 6.2.23). Note that carbon disulfide is a feed organic COPC per Ref. 9.1 and has been evaluated as an organic COPC in past WTP emissions estimates (Ref. 9.14). The calculation of the emissions estimate for carbon disulfide will be conducted within the vapor phase feed inorganic COPC section because the Tank Farm Average ratio for carbon disulfide is reported as an inorganic COPC in Ref. 9.2, with units of g COPC / g Na. While the calculation for carbon disulfide will be carried out with the inorganic COPCs, the results for carbon disulfide will be reported with the feed organic COPC results. 5.3.1.3.1 Carbon Disulfide and Cyanide
Carbon disulfide (CS2) and cyanide (CN) will be evaluated using the methodology for vapor phase feed organic COPCs described in Section 5.2.1.5. Also, as noted above, the results for carbon disulfide will be reported with feed organic COPCs and not feed inorganic COPCs. 5.3.1.3.2 Ammonia
Ammonia (NH3) will be evaluated using the methodology for vapor phase feed organic COPCs described in Section 5.2.1.5, with an additional step to account for ammonia received in the caustic scrubber effluent stream (LVP21). The vapor phase emissions calculated using Section 5.2.1.5 represent complete emission of all NH3 received in the feed line flush stream to DEP-VSL-00001. Since the caustic scrubber effluent is another DEP inlet stream containing appreciable amounts of NH3, emissions of NH3
from DEP-VSL-00004A/B and DEP-VSL-00005A/B must account for the additional NH3. Emissions of NH3 from DEP-VSL-00004A/B and DEP-VSL-00005A/B will be estimated using a Henry’s Law analysis. The volume transferred annually from LVP-TK-00001 to DEP-VSL-00004A/B in stream LVP21 is calculated using the batch volume of LVP-TK-00001 and the transfer frequency.
, , ∗ ∗ 3.785 ∗ 8760 Equation 53
Where: , = Annual volume transferred in LVP21, in L (Assumption 6.2.22)
, = Batch transfer volume from LVP-TK-00001 to DEP-VSL-00004A/B, in gal (Input 2.15)
= Frequency of LVP-TK-00001 transfer, in 1/hr (Input 2.16) The mass of NH3 transferred annually to DEP-VSL-00004A/B is then calculated using the following equation:

CALCULATION SHEET PROJECT: RPP-WTPJOB NO.: 24590
BY: William Hix CALC NO.: 24590-BOF-M4C-DEP-00001 DATE: 6/6/2016 SHEET REV: B
SHEET NO.: 35SUBJECT: DFLAW Effluent Management Facility Air Emissions Estimate
24590-G04B-F00012 Rev 13 (Revised12/23/2015) Ref: 24590-WTP-3DP-G04B-00037, 24590-WTP-GPG-ENG-0127
, , ∗ ∗ , Equation 54
Where: , = Annual mass of NH3 in LVP21, in g
, = Annual volume transferred in LVP21, in L (Equation 53) = Density of LVP21, in g/L (Input 2.17)
, = Mass fraction of NH3 in LVP21 (Assumption 6.1.16) (Attachment F, Table F-2) The volume of fluid received annually in DEP-VSL-00004A/B is calculated using the volume transferred in LVP21 and the volume of condensate received from DEP-EVAP-00001.
, , , ∗ 3.785 ∗ 11
∗ 525600 Equation 55
Where: , = Annual volume received in DEP-VSL-00004A/B, in L
, = Annual volume transferred in LVP21, in L (Equation 53)
, = Volumetric flowrate of DEP evaporator feed stream, in gpm (Assumption 6.1.7)
= Evaporator volumetric concentration factor (Assumption 6.1.17)
The concentration of NH3 in DEP-VSL-00004A/B and DEP-VSL-00005A/B is then calculated using the results from Equation 54 and Equation 55.
,
, Equation 56
Where: = Concentration of NH3 in DEP-VSL-00004A/B and DEP-VSL-00005A/B, in g/L
(Assumption 6.1.18) , = Annual mass of NH3 in LVP21, in g (Equation 54)
, = Annual volume received in DEP-VSL-00004A/B, in L (Equation 55)
Next, use Equation 44 (defined in Section 5.2.4.1.1) to determine the mole fraction of NH3 in the vapor phase using Henry’s Law.
, ∗ ∗
Equation 44
Where: = Mole fraction of NH3 in the vapor phase
, = Henry’s Law constant for NH3, in atm*m3/mol (Input 2.18) = Concentration of NH3 in DEP-VSL-00004A/B, in g/L (Equation 56)
= Molecular weight of NH3, in g/mol (Input 2.9) = Vessel operating pressure, in atm (Assumption 6.1.10)

CALCULATION SHEET PROJECT: RPP-WTPJOB NO.: 24590
BY: William Hix CALC NO.: 24590-BOF-M4C-DEP-00001 DATE: 6/6/2016 SHEET REV: B
SHEET NO.: 36SUBJECT: DFLAW Effluent Management Facility Air Emissions Estimate
24590-G04B-F00012 Rev 13 (Revised12/23/2015) Ref: 24590-WTP-3DP-G04B-00037, 24590-WTP-GPG-ENG-0127
The mass flowrate of NH3
in the vessel vent streams from DEP-VSL-00004A/B and DEP-VSL-00005A/B is calculated using Equation 45 (defined in Section 5.2.4.1.1).
, ,∗ . ∗
∗ ∗ Equation 45
Where:
, , = Vapor phase mass flow rate of NH3 in vessel vent streams from DEP-VSL-00004A/B and DEP-VSL-00005A/B, in g/sec
= Mass flowrate of the vessel vent streams from DEP-VSL-00004A/B and DEP-
VSL-00005A/B, in lb/hr (Assumption 6.1.19) = Average molecular weight of air, in g/mol (Input 2.8)
= Mole fraction of NH3 in the vapor phase (Equation 44) = Molecular weight of NH3, in g/mol (Input 2.9)
The total unabated emissions of NH3 are then calculated by combining the unabated emissions for NH3
received in the feed line flush calculated using the method from Section 5.2.1.5, Equation 30 and the value for , , calculated using Equation 45.
, , , , , , Equation 57
Where: , , = Total unabated emissions of NH3, in g/sec
, , = Vapor phase mass flow rate of NH3 in vessel vent streams from DEP-VSL-
00004A/B and DEP-VSL-00005A/B, g/sec (Equation 45)
, , = Unabated vapor phase emissions of NH3 in feed line flush, in g/sec (Equation 30)
For vapor phase COPCs with an Fv of 1, the DF is 1 through both the primary and secondary HEPA filter (Assumption 6.2.10). Therefore there is no emissions abatement provided by the HEPA filters for NH3. 5.3.1.3.3 Dimethyl Mercury
Dimethyl Mercury [(CH3)2Hg] has the potential to form in WTP waste streams due to the reaction between mercury and organic species (Ref. 9.15, Section 4.1). 5.3.1.3.3.1 Mercury Concentrations
In order to calculate the amount of dimethyl mercury generated in each DEP process vessel, the maximum mercury concentrations in each vessel are needed.

CALCULATION SHEET PROJECT: RPP-WTPJOB NO.: 24590
BY: William Hix CALC NO.: 24590-BOF-M4C-DEP-00001 DATE: 6/6/2016 SHEET REV: B
SHEET NO.: 37SUBJECT: DFLAW Effluent Management Facility Air Emissions Estimate
24590-G04B-F00012 Rev 13 (Revised12/23/2015) Ref: 24590-WTP-3DP-G04B-00037, 24590-WTP-GPG-ENG-0127
DEP-VSL-00001 The Hg concentration in DEP-VSL-00001 can be calculated using the following equation.
, , ∗
∗ 3.785 Equation 58
Where: , = Concentration of Hg in feed line flush to DEP-VSL-00001, in g/L
, = Maximum feed vector batch concentration of Hg, in g/L (Equation 11)
= Volume of residual feed in a LAW feed line flush, in L (Equation 16) = Total volume of LAW feed line flush, in gal (Input 2.4, Assumption 6.1.3)
Note that if the ICD-30 limit for Hg is used in Section 5.3.1.2.1 for the emission of Hg in the particle phase, then , will be the Hg feed concentration at the ICD-30 limit. DEP-VSL-00002 The Hg concentration in DEP-VSL-00002 is assumed to be the same as in DEP-VSL-00001 (Assumption 6.1.20). DEP-EVAP-00001 & DEP-VSL-00003A/B/C The Hg concentration in DEP-EVAP-00001 and DEP-VSL-00003A/B/C is determined based on the following equation:
, . .
. ., ∗ , ∗ 1 ,
, ∗1 Equation 59
Where: , = Concentration of Hg in evaporator concentrate, in g/L
, = Concentration of Hg in feed line flush to DEP-VSL-00001, in g/L (Equation 58)
, = Volumetric flowrate of DEP evaporator feed stream, in gpm (Assumption 6.1.7) , = Mass distribution ratio of Hg in evaporator (Assumption 6.1.13)
= Evaporator volumetric concentration factor (Assumption 6.1.17) DEP-VSL-00004A/B & DEP-VSL-00005A/B The Hg concentration in DEP-VSL-00004A/B and DEP-VSL-00005A/B is assumed to be at the concentration of Hg in the evaporator condensate (Assumption 6.1.21), which is determined based on the following equation:

CALCULATION SHEET PROJECT: RPP-WTPJOB NO.: 24590
BY: William Hix CALC NO.: 24590-BOF-M4C-DEP-00001 DATE: 6/6/2016 SHEET REV: B
SHEET NO.: 38SUBJECT: DFLAW Effluent Management Facility Air Emissions Estimate
24590-G04B-F00012 Rev 13 (Revised12/23/2015) Ref: 24590-WTP-3DP-G04B-00037, 24590-WTP-GPG-ENG-0127
, . .
. ., ∗ , ∗ ,
, ∗ 11 Equation 60
Where: , = Concentration of Hg in evaporator condensate, in g/L
, = Concentration of Hg in feed line flush to DEP-VSL-00001, in g/L (Equation 58)
, = Volumetric flowrate of DEP evaporator feed stream, in gpm (Assumption 6.1.7) , = Mass distribution ratio of Hg in evaporator (Assumption 6.1.13)
= Evaporator volumetric concentration factor (Assumption 6.1.17) 5.3.1.3.3.2 Vessel Operating Temperatures
Vessel operating temperatures are used in the calculation of dimethyl mercury formation rates. The nominal temperatures established in DEP process calculations will be used as the operating temperatures for this calculation (Assumptions 6.1.22 through 6.1.27). 5.3.1.3.3.3 Vessel Residence Time
Vessel residence times are determined based on the vessel batch cycle times established in the DEP batch sizing calculation (Ref. 9.10) (Assumption 6.1.28). The maximum vessel residence time represents the amount of time between cycle start times for the vessel. For single vessels, the maximum residence time equals the cycle time. For paired vessels (i.e. DEP-VSL-00004A/B and DEP-VSL-00005A/B), the maximum residence time is the cycle time times two, since one of these vessels will be filled during the first cycle time and then drained during the second cycle time while the other vessel is being filled. For triple vessels (i.e. DEP-VSL-00003A/B/C), the maximum residence time is the cycle time times three. One vessel will be filled during the first cycle time, held for sampling during the second cycle time, and then drained during the third cycle time.
∗ Equation 61
Where: = Residence time for vessel j, in hr = Vessel j batch cycle time, in hr (Assumption 6.1.28)
= Quantity of vessel j (e.g. 2) The DEP evaporator is not included in the batch sizing calculation, so its residence time is based on the time to fill and drain the evaporator recirculation loop operating volume (Assumption 6.1.29) at the evaporator feed rate (Assumption 6.1.7).

CALCULATION SHEET PROJECT: RPP-WTPJOB NO.: 24590
BY: William Hix CALC NO.: 24590-BOF-M4C-DEP-00001 DATE: 6/6/2016 SHEET REV: B
SHEET NO.: 39SUBJECT: DFLAW Effluent Management Facility Air Emissions Estimate
24590-G04B-F00012 Rev 13 (Revised12/23/2015) Ref: 24590-WTP-3DP-G04B-00037, 24590-WTP-GPG-ENG-0127
,
,
∗ 2 ∗1
60 Equation 62
Where: = Residence time for evaporator, in hr
, = Volume of DEP evaporator recirculation loop, in gal (Assumption 6.1.29) , = Volumetric flowrate of DEP evaporator feed stream, in gpm (Assumption 6.1.7)
5.3.1.3.3.4 Rate of Dimethyl Mercury Formation
The rate constant for the formation of dimethyl mercury from mercury or its compounds in caustic salt solutions with organics can be estimated based on the following equation (Assumption 6.2.24):
. . Equation 63
Where: = Rate constant for vessel j, in s-1 = Vessel j Nominal Temperature, in K (Section 5.3.1.3.3.2)
The maximum concentration of dimethyl mercury reached in each vessel is then calculated:
, ∗ , ∗ ∗3600
Equation 64
Where: , = Concentration of dimethyl mercury in vessel j, in g/L
= Rate constant for vessel j, in s-1 (Equation 63)
, = Concentration of Hg in vessel j, in g/L (Section 5.3.1.3.3.1) = Vessel j residence time, in hr (Section 5.3.1.3.3.3)
As a bounding assumption, all dimethyl mercury formed in a vessel is assumed to be emitted from that vessel (Assumption 6.2.23). The annual vessel throughput for each DEP vessel is calculated using the vessel batch volumes, quantities, and residence times.
, ∗ ∗ 3.785 ∗8760
Equation 65
Where: = Annual vessel j throughput, in L
, = Vessel j batch volume, in gal (Assumption 6.1.30) = Quantity of vessel j (e.g. 2) = Vessel j residence time, in hr (Section 5.3.1.3.3.3)
CALCULATION SHEET PROJECT: RPP-WTPJOB NO.: 24590
BY: William Hix CALC NO.: 24590-BOF-M4C-DEP-00001 DATE: 6/6/2016 SHEET REV: B
SHEET NO.: 40SUBJECT: DFLAW Effluent Management Facility Air Emissions Estimate
24590-G04B-F00012 Rev 13 (Revised12/23/2015) Ref: 24590-WTP-3DP-G04B-00037, 24590-WTP-GPG-ENG-0127
Note, there is not an established batch volume for DEP-EVAP-00001 in Ref. 9.10. The throughput of DEP-EVAP-00001 is represented by the evaporator concentrate stream that is transferred to DEP-VSL-00003A/B/C, therefore the throughput of DEP-EVAP-00001 is equal to DEP-VSL-00003A/B/C. The unabated vapor phase emissions of dimethyl mercury from each DEP vessel is calculated using the results from Equation 64 and Equation 65, and then summed to give a total unabated vapor emission estimate for dimethyl mercury.
, , , ∗ ∗ 3.1536 7 Equation 66
Where: , , = Unabated vapor phase emissions of dimethyl mercury from vessel j, in g/sec
, = Concentration of dimethyl mercury in vessel j, in g/L (Equation 64) = Annual vessel j throughput, in L (Equation 65)
, , , , Equation 67
Where: , , = Total unabated vapor phase emissions of dimethyl mercury from vessel j, in
g/sec , , = Unabated vapor phase emissions of dimethyl mercury from vessel j, in g/sec
(Equation 66) For vapor phase COPCs with an Fv of 1, the DF is 1 through both the primary and secondary HEPA filter (Assumption 6.2.10). Therefore, there is no emissions abatement provided by the HEPA filters for dimethyl mercury. 5.3.2 Stack Inorganic COPC Emissions
In general, stack inorganics are not expected to be emitted from the DEP system in significant quantities. The justification for this will be discussed in Section 7.3.2. Particulate matter is considered a stack inorganic COPC (Ref. 9.1), therefore the total particulate emissions summed from the results for particulate emissions of radionuclides, feed organics, PICs, and feed inorganics will be reported as the emissions estimate for particulate matter. 5.3.3 Inorganic COPC Summary and Comparison to De Minimis Emissions Limits
The results for unabated and abated inorganic COPC emissions are compiled in a summary table (Table 8-6 ). The unabated inorganic COPC emissions are compared to de minimis emissions limits for TAPs established in WAC 173-460-150 (Input 2.13), using the same method established for organic COPCs in Section 5.2.4.
CALCULATION SHEET PROJECT: RPP-WTPJOB NO.: 24590
BY: William Hix CALC NO.: 24590-BOF-M4C-DEP-00001 DATE: 6/6/2016 SHEET REV: B
SHEET NO.: 41SUBJECT: DFLAW Effluent Management Facility Air Emissions Estimate
24590-G04B-F00012 Rev 13 (Revised12/23/2015) Ref: 24590-WTP-3DP-G04B-00037, 24590-WTP-GPG-ENG-0127
6 Assumptions
6.1 Assumptions Requiring Verification
6.1.1 Mass Fractions of COPCs Released by Entrainment
Assumption For the calculation of COPCs emission through entrainment, the mass fractions of COPCs with FV values less than 1, meaning the COPC will at least partially be emitted through entrainment, are assumed to remain constant throughout the DEP system at the maximum feed vector batch mass fraction, . For PICs, which are not present in the feed vector, the mass fractions of PIC COPCs with FV values less than 1 are assumed to remain constant throughout the DEP system at the mass fraction in Stream RLD21, , . Verification It is conservative and bounding to assume the mass fractions of these COPCs do not decrease from the maximum expected feed value throughout the DEP system. This is a simplifying assumption to help calculate conservative values for the entrainment of COPCs. This assumption for mass fractions will be verified by DFLAW-specific emissions estimate model runs using the APPS model, which will provide mass fractions of the COPCs in each of the DEP streams. 6.1.2 Dilution Factor of Feed Line Flush to DEP-VSL-00001
Assumption
The dilution factor of the feed line flush to DEP-VSL-00001 is assumed to be (i.e. one thirtieth of the
flush to DEP-VSL-00001 is assumed to be residual LAW feed and the remainder is flush water). Verification
The dilution factor of will be verified by confirmed isometric drawings providing the length and
volume for this dead legged section of piping.
The flush volume is 1500 gallons based on Input 2.4 and Assumption 6.1.3, so a dilution factor of
means that there is 50 gallons (6.68 ft3) of residual feed flushed to DEP-VSL-00001 along with the flush water. Based on the 3.068 inch (0.2557 ft) inner diameter of the transfer line (Input 2.12), the length of pipe represented by the 50 gallon residual volume can be calculated using the following equation (Ref. 10.3, Page A-9):
CALCULATION SHEET PROJECT: RPP-WTPJOB NO.: 24590
BY: William Hix CALC NO.: 24590-BOF-M4C-DEP-00001 DATE: 6/6/2016 SHEET REV: B
SHEET NO.: 42SUBJECT: DFLAW Effluent Management Facility Air Emissions Estimate
24590-G04B-F00012 Rev 13 (Revised12/23/2015) Ref: 24590-WTP-3DP-G04B-00037, 24590-WTP-GPG-ENG-0127
∗4
∗ Equation 68
Where: Vpipe = volume of pipe, in ft3 π = 3.14 D = inner diameter of pipe, in ft L = length of pipe, in ft
Solving Equation 68 for L gives a pipe length of 130 feet, meaning that the volume of residual feed flushed to DEP-VSL-00001 represents a 130 ft length of the feed transfer line filled with residual feed being flushed to DEP-VSL-00001. This length of pipe flushed to DEP-VSL-00001 corresponds to the dead leg between the main feed transfer line to LCP-VSL-00001/2 and the entrance to DEP-VSL-00001. This length of pipe based on the assumed dilution factor is conservative for the expected length of the dead leg. In addition, very little residual feed is expected to be flushed from the main feed line to DEP-VSL-00001 based on this statement from ICD-30 (Ref. 9.3, Section 2.6.2):
When the flush water first reaches the CRV [Concentrate Receipt Vessel], the WTP Contractor will align valves to stop delivery to the CRV and send flush water to the low point drain vessel in the WTP effluent management facility (EMF). When the flow of flush water is stopped, the Tank Operations Contractor isolates the transfer pipeline from connected equipment, and the WTP Contractor drains the contents of the pipeline to the low point drain vessel.
Therefore the dilution factor of is considered a conservative value for the approximation of the amount
of residual feed flushed to DEP-VSL-00001. 6.1.3 Frequency of Feed Line Flush to DEP-VSL-00001
Assumption The flush frequency from LAWPS to DEP-VSL-00001 is 18.8 hours per 24590-BOF-MVC-DEP-00009 (Ref. 9.10, Section 7.1.2). Verification This assumption will be verified by the confirmation of calculation 24590-BOF-MVC-DEP-00009 (Ref. 9.10). 6.1.4 Mass Flowrate of the DVP System Exhaust Streams
Assumption The vessel ventilation streams are collected in a common exhaust header (noted as Stream DEP15 in Ref. 9.7) before passing through the preheater, two-stage HEPA filters, and finally through an exhaust fan to discharge the air out of the EMF stack. The total mass flow rate of this exhaust header is 578 lb/hr according to calculation 24590-BOF-M6C-DVP-00001 (Ref. 9.11, Attachment D). Line number DVP-GV-00010/00013 in Ref. 9.11, Attachment D represents the common exhaust header, and the line

CALCULATION SHEET PROJECT: RPP-WTPJOB NO.: 24590
BY: William Hix CALC NO.: 24590-BOF-M4C-DEP-00001 DATE: 6/6/2016 SHEET REV: B
SHEET NO.: 43SUBJECT: DFLAW Effluent Management Facility Air Emissions Estimate
24590-G04B-F00012 Rev 13 (Revised12/23/2015) Ref: 24590-WTP-3DP-G04B-00037, 24590-WTP-GPG-ENG-0127
numbers shown below DVP-GV-00010/00013 represent the DVP lines leading to the exhaust from the EMF stack. These lines in Ref. 9.11, Attachment D all have a mass flow rate of 578 lb/hr. Line number DVP-GV-00005 in Ref. 9.11, Attachment D represents the evaporator vent stream coming off of DEP-COND-00003 with a mass flow rate of 50 lb/hr. For the calculation of NH3 emissions in Section 5.3.1.3.2, only the mass flowrates of the DEP-VSL-00004A/B and DEP-VSL-00005A/B vessel vent streams are needed. In Ref. 9.11, Attachment B, the line number DVP-GV-00004 represents the vessel vent header for these 4 vessels. Line number DVP-GV-00004 has a mass flowrate of 235 lb/hr in Ref. 9.11, Attachment D. Verification This assumption will be verified by the confirmation of calculation 24590-BOF-M6C-DVP-00001 (Ref. 9.11). 6.1.5 14C or 3H Only Transferred to the DEP System in the Feed Line Flush
Assumption It is assumed that 14C and 3H are only transferred to the DEP System in the feed line flush stream received in DEP-VSL-00001. Verification This assumption will be verified by DFLAW-specific emissions estimate model runs using the APPS model. This is a simplifying assumption for the purpose of establishing the amount of 14C and 3H received in, and subsequently emitted by, the DEP system annually (Assumption 6.2.4). The only other waste streams entering the DEP system that may contain significant amounts of radionuclides are the SBS condensate stream (RLD21) and the Plant Wash Vessel effluent (RLD27) (Ref. 9.5). However, this assumption, combined with the conservatism in the other assumptions that support the calculation of the amounts of 14C and 3H flushed to DEP-VSL-00001 (See Assumptions 6.1.2, 6.2.1, and 6.2.5), is expected to bound the amounts of 14C and 3H expected to be received, under steady-state conditions, from all the expected input streams (Feed line flush, RLD21, and RLD27). 6.1.6 Organic COPC Physical Properties
Assumption Physical properties of organic COPCs extracted from Ref. 9.15, Attachment A are used in this calculation. This includes Fv values, Henry’s Law constants, Feed/PIC COPCs, and molecular weights. Verification This assumption will be verified by DFLAW-specific emissions estimate model runs using the APPS model and the physical properties included in the APPS model.

CALCULATION SHEET PROJECT: RPP-WTPJOB NO.: 24590
BY: William Hix CALC NO.: 24590-BOF-M4C-DEP-00001 DATE: 6/6/2016 SHEET REV: B
SHEET NO.: 44SUBJECT: DFLAW Effluent Management Facility Air Emissions Estimate
24590-G04B-F00012 Rev 13 (Revised12/23/2015) Ref: 24590-WTP-3DP-G04B-00037, 24590-WTP-GPG-ENG-0127
6.1.7 DEP Evaporator Feed Volumetric Flowrate
Assumption The volumetric flowrate of the feed stream from the Evaporator Feed Vessel to the Evaporator is assumed to be 10 gpm. This value is based on the design feed rate for the Cesium Nitric Acid Recovery Process system (CNP) evaporator (Ref. 9.16, Section 6.1.1). Detailed design on the DEP evaporator system is ongoing, but the design up to this point has used the CNP evaporator equipment design as a basis (See Ref. 9.17, Section 3). Verification This assumption will be verified by the acceptance of a Code 1 vendor mass and energy balance calculation for the DEP evaporator system. 6.1.8 DEP Evaporator Overheads Stream Volumetric Flowrate
Assumption The nominal volumetric flowrate of the DEP evaporator overheads stream is 9.5 gpm (Ref. 9.17, Section 7.2). This represents 9 gpm of feed evaporated and a 0.5 gpm demister spray stream (recycled from the condensate). Verification This assumption will be verified by the confirmation of calculation 24590-BOF-MEC-DEP-00001 (Ref. 9.17). 6.1.9 DEP Evaporator Nominal Operating Temperature and Pressure
Assumption The nominal operating temperature and pressure of the DEP evaporator are 1.45 psia (0.0987 atm) and 116°F (46.7°C), respectively (Ref. 9.17, Section 8). Verification This assumption will be verified by the confirmation of calculation 24590-BOF-MEC-DEP-00001 (Ref. 9.17). 6.1.10 DEP System Vessel Pressure
Assumption The pressure in the main DEP system vessels is 14.14 psia (0.9622 atm). This is the minimum pressure of the vessel vent inlet for DEP vessels calculated in Ref. 9.11, Section 7.1. Verification This assumption will be verified by the confirmation of calculation 24590-BOF-M6C-DVP-00001 (Ref. 9.11).

CALCULATION SHEET PROJECT: RPP-WTPJOB NO.: 24590
BY: William Hix CALC NO.: 24590-BOF-M4C-DEP-00001 DATE: 6/6/2016 SHEET REV: B
SHEET NO.: 45SUBJECT: DFLAW Effluent Management Facility Air Emissions Estimate
24590-G04B-F00012 Rev 13 (Revised12/23/2015) Ref: 24590-WTP-3DP-G04B-00037, 24590-WTP-GPG-ENG-0127
6.1.11 Concentrations of Feed Organic COPCs Used in Section 5.2.4.1
Assumption For the Henry’s Law analysis in Section 5.2.4.1, the concentrations of the feed organic COPCs evaluated are assumed to remain constant at the concentration in the feed line flush stream, , (Equation 39). Verification This is a simplifying assumption to help calculate vapor phase emissions using Henry’s Law. This assumption for COPC concentrations will be verified by DFLAW-specific emissions estimate model runs using the APPS model, which will provide concentrations of COPCs in each of the DEP streams. 6.1.12 Total Vessel Vent System Flowrate Used in Section 5.2.4.1.1
Assumption The total vessel vent system flowrate used in Section 5.2.4.1.1 to calculate vessel vent emissions based on Henry’s Law from the main DEP vessels, excluding the DEP evaporator, is assumed to be the total vessel vent exhaust flowrate from Assumption 6.1.4. This assumption is conservative because this flowrate includes the vent stream from the DEP evaporator system (which is evaluated separately). Verification This assumption will be verified by DFLAW-specific emissions estimate model runs using the APPS model. 6.1.13 DEP Evaporator/Condenser MDRs
Assumption The DEP evaporator/condenser MDRs are assumed to be the same as the FEP/TLP evaporator/condenser MDRs which are determined in 24590-WTP-M4C-V37T-00011, Rev. 0 - FEP and TLP Evaporator and Condensers Decontamination Factor Calculation (Ref. 9.19, Section 8, Tables 2 and 3). Verification The MDRs established in Ref. 9.19 for the FEP/TLP evaporators/condensers are based on operational data from the 242-A evaporator at the Tank Farms. The applicability of using the 242-A evaporator operational data is justified based on a comparison of the thermodynamic, configurational, and geometric similarities with the FEP/TLP evaporator designs (Ref. 9.19, Section 6.1). This assumption for DEP evaporator/condenser MDRs will be verified when the DEP evaporator design progresses to a point that a comparison can be made with the FEP/TLP evaporators. 6.1.14 Condenser MDRs for Feed Organic COPCs Evaluated in Section 5.2.4.1.2
Assumption The primary and inter-condenser MDRs for VOCs (based on benzene) calculated in Ref. 9.19 (3.27E-3 and 1.06E-1, respectively) are assumed to apply to all Feed Organic COPCs evaluated in Section 5.2.4.1.2.

CALCULATION SHEET PROJECT: RPP-WTPJOB NO.: 24590
BY: William Hix CALC NO.: 24590-BOF-M4C-DEP-00001 DATE: 6/6/2016 SHEET REV: B
SHEET NO.: 46SUBJECT: DFLAW Effluent Management Facility Air Emissions Estimate
24590-G04B-F00012 Rev 13 (Revised12/23/2015) Ref: 24590-WTP-3DP-G04B-00037, 24590-WTP-GPG-ENG-0127
Verification This assumption will be verified by DFLAW-specific emissions estimate model runs using the APPS model. 6.1.15 LAW Melter Feed Maximum TOC during DFLAW Operation
Assumption The maximum TOC value for the LAW melter feed stream (LFP04) during DFLAW operations is assumed to be represented by the maximum TOC value for LFP04 calculated in the current PIBOD (Attachment F, Table F-1). Note: as shown in Attachment F, the maximum PIBOD value for TOC of 15.29 kg/hr will be rounded up to 20 kg/hr for use in this calculation. Verification This assumption will be verified by DFLAW-specific emissions estimate model runs using the APPS model. 6.1.16 Mass Fraction of NH3 in Stream LVP21 during DFLAW Operations
Assumption The maximum mass fraction of NH3 in the caustic scrubber effluent stream (LVP21) during DFLAW operations is assumed to be represented by the maximum value for LVP21 calculated in the current PIBOD (Attachment F, Table F-2). Note: as shown in Attachment F, the maximum PIBOD value for the mass fraction of NH3 (0.0512) will be rounded up to 0.06 for use in this calculation. Verification This assumption will be verified by DFLAW-specific emissions estimate model runs using the APPS model. 6.1.17 DEP Evaporator Volumetric Concentration Factor
Assumption: Overconcentration of the evaporator concentrate will result in the formation of insoluble solids as chemical species reach their saturation point and precipitate from solution. Initial testing at Savannah River National Laboratory demonstrated that a concentration factor of 17X at alkaline pH was possible without significant insoluble solids precipitation (Ref. 10.10, Page vii). In order to mitigate the precipitation of solids in the evaporator, this calculation will use an assumed nominal concentration factor of 10X (meaning the volumetric flowrate of the evaporator feed stream is 10 times greater than the volumetric flowrate of the evaporator concentrate stream).

CALCULATION SHEET PROJECT: RPP-WTPJOB NO.: 24590
BY: William Hix CALC NO.: 24590-BOF-M4C-DEP-00001 DATE: 6/6/2016 SHEET REV: B
SHEET NO.: 47SUBJECT: DFLAW Effluent Management Facility Air Emissions Estimate
24590-G04B-F00012 Rev 13 (Revised12/23/2015) Ref: 24590-WTP-3DP-G04B-00037, 24590-WTP-GPG-ENG-0127
Verification: The concentration factor assumption will be verified as the detailed design of the DEP-EVAP-00001 progresses and bounding limits on the evaporator operation are established. The DFLAW-specific mass balance calculation (to be developed) will establish the basis for determining the steady-state properties of the evaporator concentrate based on operational constraints.
NOTE: This maximum concentration factor based on limiting formation of solids in the evaporator is not provided in this calculation to establish an operational constraint on the evaporator. The solubility of species in the waste is one factor that limits the concentration factor in the evaporator. Other factors include the concentrations of chloride and certain radionuclides. It is outside the scope of this calculation to develop a model for predicting the concentration limit for the DEP evaporator based on these factors. 6.1.18 Concentration of NH3 in DEP-VSL-00004A/B and DEP-VSL-00005A/B
Assumption The concentration of NH3 in DEP-VSL-00004A/B and DEP-VSL-00005A/B is assumed to remain constant at the value calculated using Equation 56 (i.e. the concentration of NH3 in DEP-VSL-00004A/B due to the receipt of stream LVP21 is assumed to remain the same when the contents of DEP-VSL-00004A/B are transferred to DEP-VSL-00005A/B). Verification This assumption will be verified by DFLAW-specific emissions estimate model runs using the APPS model. 6.1.19 Mass Flowrate of DEP-VSL-00004A/B and DEP-VSL-00005A/B Vessel Vent Header
Assumption For the calculation of NH3 emissions in Section 5.3.1.3.2, only the mass flowrates of the DEP-VSL-00004A/B and DEP-VSL-00005A/B vessel vent streams are needed. In Ref. 9.11, Attachment B, the line number DVP-GV-00004 represents the vessel vent header for these 4 vessels. Line number DVP-GV-00004 has a mass flowrate of 235 lb/hr (Ref. 9.11, Attachment D). Verification This assumption will be verified by the confirmation of calculation 24590-BOF-M6C-DVP-00001 (Ref. 9.11). 6.1.20 Concentration of Hg in DEP-VSL-00002 for Dimethyl Mercury Formation
Assumption For the calculation of dimethyl mercury formation in Section 5.3.1.3.3, the concentration of Hg in DEP-VSL-00002 is assumed to be the same as the Hg concentration in DEP-VSL-00001. As mentioned in Assumption 6.1.33, mercury has the potential to accumulate in the recycle from the DEP system to LAW during DFLAW operations, however developing a detailed model of this accumulation is outside the

CALCULATION SHEET PROJECT: RPP-WTPJOB NO.: 24590
BY: William Hix CALC NO.: 24590-BOF-M4C-DEP-00001 DATE: 6/6/2016 SHEET REV: B
SHEET NO.: 48SUBJECT: DFLAW Effluent Management Facility Air Emissions Estimate
24590-G04B-F00012 Rev 13 (Revised12/23/2015) Ref: 24590-WTP-3DP-G04B-00037, 24590-WTP-GPG-ENG-0127
scope of this emissions estimate. Also, the PIBOD shows that there is no Hg in stream RLD21 due to a DF of 1 being applied in the SBS for mercury (Attachment F, Table F-3). Therefore, the amount of Hg captured in the SBS condensate and transferred to the DEP system in stream RLD21 is not modeled in this emissions estimate and the concentration in DEP-VSL-00001 is assumed to represent the concentration in DEP-VSL-00002. Verification This assumption will be verified by DFLAW-specific emissions estimate model runs using the APPS model. 6.1.21 Concentration of Hg in DEP-VSL-00004A/B and DEP-VSL-00005A/B for Dimethyl
Mercury Formation
Assumption For the calculation of dimethyl mercury formation in Section 5.3.1.3.3, the concentration of Hg in DEP-VSL-00004A/B and DEP-VSL-00005A/B is assumed to be the same as the Hg concentration in the evaporator condensate. This is a conservative assumption because the caustic scrubber effluent stream (LVP21) should have a negligible amount of Hg and therefore dilute the Hg concentration in DEP-VSL-00004A/B and DEP-VSL-00005A/B. Verification This assumption will be verified by DFLAW-specific emissions estimate model runs using the APPS model. 6.1.22 DEP-VSL-00001 Nominal Temperature
Assumption The nominal temperature of DEP-VSL-00001 is 67°F (Ref. 9.27, Section 8). Verification This assumption will be verified by the confirmation of calculation 24590-BOF-MVC-DEP-00011 (Ref. 9.27). 6.1.23 DEP-VSL-00002 Nominal Temperature
Assumption The nominal temperature of DEP-VSL-00001 is 124°F (Ref. 9.31, Section 8). Verification This assumption will be verified by the confirmation of calculation 24590-BOF-MVC-DEP-00003.

CALCULATION SHEET PROJECT: RPP-WTPJOB NO.: 24590
BY: William Hix CALC NO.: 24590-BOF-M4C-DEP-00001 DATE: 6/6/2016 SHEET REV: B
SHEET NO.: 49SUBJECT: DFLAW Effluent Management Facility Air Emissions Estimate
24590-G04B-F00012 Rev 13 (Revised12/23/2015) Ref: 24590-WTP-3DP-G04B-00037, 24590-WTP-GPG-ENG-0127
6.1.24 DEP-EVAP-00001 Nominal Temperature
Assumption The nominal temperature of DEP-EVAP-00001 is 116°F (Ref. 9.17, Section 8). Verification This assumption will be verified by the confirmation of calculation 24590-BOF-MEC-DEP-00001. 6.1.25 DEP-VSL-00003A/B/C Nominal Temperature
Assumption The nominal temperature of DEP-VSL-00003A/B/C is 116°F (Ref. 9.32, Section 8). Verification This assumption will be verified by the confirmation of calculation 24590-BOF-MVC-DEP-00010. 6.1.26 DEP-VSL-00004A/B Nominal Temperature
Assumption The nominal temperature of DEP-VSL-00004A/B is 115°F (Ref. 9.33, Section 8). Verification This assumption will be verified by the confirmation of calculation 24590-BOF-MVC-DEP-00007. 6.1.27 DEP-VSL-00005A/B Nominal Temperature
Assumption The nominal temperature of DEP-VSL-00005A/B is 115°F (Ref. 9.34, Section 8). Verification This assumption will be verified by the confirmation of calculation 24590-BOF-MVC-DEP-00008. 6.1.28 DEP Vessel Cycle Times
Assumption The following vessel batch cycle times for DEP vessels are provided based on the vessel storage volumes established in Ref. 9.10, Section 8: Vessel Cycle Time DEP-VSL-00001 48 hours DEP-VSL-00002 48 hours DEP-VSL-00003A/B/C 120 hours (5 days) DEP-VSL-00004A/B 24 hours DEP-VSL-00005A/B 96 hours (4 days)

CALCULATION SHEET PROJECT: RPP-WTPJOB NO.: 24590
BY: William Hix CALC NO.: 24590-BOF-M4C-DEP-00001 DATE: 6/6/2016 SHEET REV: B
SHEET NO.: 50SUBJECT: DFLAW Effluent Management Facility Air Emissions Estimate
24590-G04B-F00012 Rev 13 (Revised12/23/2015) Ref: 24590-WTP-3DP-G04B-00037, 24590-WTP-GPG-ENG-0127
Verification This assumption will be verified by the confirmation of calculation 24590-BOF-MVC-DEP-00009 (Ref. 9.10). 6.1.29 DEP-EVAP-00001 Recirculation Loop Operating Volume
Assumption The DEP evaporator vessel, DEP-EVAP-00001 is assumed to have the same recirculation loop volume as the CNP evaporator. The CNP evaporator has a maximum recirculation loop volume of 2721 gallons (Ref. 9.28, Section 8.1) Verification This assumption will be verified by the acceptance of a Code 1 vendor design drawings for the DEP evaporator system. 6.1.30 DEP Vessel Batch Volumes
Assumption The following vessel batch volumes for DEP vessels are provided in Ref. 9.10, Section 8: Vessel Batch Volume (gal)*
DEP-VSL-00001 6,300 DEP-VSL-00002 28,800 DEP-VSL-00003A/B/C 7,600 DEP-VSL-00004A/B 22,300 DEP-VSL-00005A/B 89,200
*The batch volumes are per vessel Verification This assumption will be verified by the confirmation of calculation 24590-BOF-MVC-DEP-00009 (Ref. 9.10). 6.1.31 Stack Inorganic COPC Emissions
Assumption Stack inorganic COPCs, except for methyl mercury and particulate matter, are gases or acids that are mainly produced during chemical reactions or thermal decomposition. These COPCs are:

CALCULATION SHEET PROJECT: RPP-WTPJOB NO.: 24590
BY: William Hix CALC NO.: 24590-BOF-M4C-DEP-00001 DATE: 6/6/2016 SHEET REV: B
SHEET NO.: 51SUBJECT: DFLAW Effluent Management Facility Air Emissions Estimate
24590-G04B-F00012 Rev 13 (Revised12/23/2015) Ref: 24590-WTP-3DP-G04B-00037, 24590-WTP-GPG-ENG-0127
Nitrogen dioxide Carbon dioxide Carbon monoxide Ozone Sulfur dioxide Hydrogen chloride Hydrogen Fluoride Fluorine gas Chlorine gas
The main source for these COPCs at WTP is the LAW and HLW melters. For example, in the existing WTP emissions estimate (Ref. 9.14, Table 18) the only streams with emissions of NO2, CO, SO2, HCl, and HF are the LAW and HLW offgas streams. Note that CO2, O3, F2, and Cl2 were not included in the existing WTP emissions estimate. It is assumed that there will not be the necessary thermal or kinetic conditions in the DEP system to produce significant amounts of the stack inorganic COPCs. Verification This assumption will be verified by DFLAW-specific emissions estimate model runs using the APPS model 6.1.32 Mercury Speciation in the DEP System
Assumption A detailed analysis of the speciation of mercury throughout the DEP system is outside the scope of this emissions estimate. As an assumption, mercury received in the DEP system is assumed to be a non-volatile form (HgO) and emitted through entrainment. This assumption will be used to estimate emissions of mercury compounds, except for dimethyl mercury which is estimated separately. The potential inlet streams to the DEP system containing mercury are the SBS condensate stream (RLD21) and the feed line flush to DEP-VSL-00001. These two streams are the main process inlet streams to the DEP system. Trace amounts of mercury may be present in other inlet streams to the DEP system, such as the Plant Wash Vessel effluent stream (RLD27) and the LAB sink drain effluent (RLD41), however any potential contribution from these streams is bounded by Assumption 6.1.33. Gaseous mercury in the melter offgas is either absorbed in the SBS as aqueous HgCl2
or passed through as elemental Hg. The fraction captured as HgCl2 in the SBS versus passing through as Hg is dependent on the Hg:Cl molar ratio in the melter feed. The aqueous mercury in the SBS stream is then converted to hydrated mercuric oxide (HgO·H2O(s)) when the stream is neutralized (Ref. 9.15, Section 4). Mercury speciation in the Tank Farms is expected to be mainly HgO, as sampling has shown that mercury in the tank supernate is negligible and most is associated with the sludge and saltcake (Ref. 9.29, Section 7.2.2). Verification This assumption will be verified by DFLAW-specific emissions estimate model runs using the APPS model.

CALCULATION SHEET PROJECT: RPP-WTPJOB NO.: 24590
BY: William Hix CALC NO.: 24590-BOF-M4C-DEP-00001 DATE: 6/6/2016 SHEET REV: B
SHEET NO.: 52SUBJECT: DFLAW Effluent Management Facility Air Emissions Estimate
24590-G04B-F00012 Rev 13 (Revised12/23/2015) Ref: 24590-WTP-3DP-G04B-00037, 24590-WTP-GPG-ENG-0127
6.1.33 Mass Fraction of Mercury for Particle Emissions
Assumption For the calculation of emissions of Hg due to entrainment, the mass fraction of Hg is assumed to remain constant throughout the DEP system at the maximum feed vector batch mass fraction, , or the ICD-30 feed limit mass fraction, , , depending on which is greater. This is a similar assumption to the one used for other COPCs emitted due to entrainment (Assumption 6.1.1). Mercury has the potential to accumulate in the recycle stream from the DEP system back to LAW during DFLAW operations since mercury is not vitrified (DF of 1 in the LAW melter per Ref. 9.14, Table 14), is captured in the SBS (Assumption 6.1.32), and the non-volatile mercury species are concentrated in the DEP evaporator. However, a detailed analysis of the accumulation of mercury in the DEP system is outside the scope of this emissions estimate. Applying the maximum feed mass fraction across the entire DEP system should still be conservative because some tanks will have very low concentrations of mercury (i.e. DEP-VSL-00001, DEP-VSL-00004A/B, and DEP-VSL-00005A/B), while others will see higher concentrations (i.e. DEP-VSL-00002, and DEP-EVAP-00001, and DEP-VSL-00003A/B/C). Verification This assumption will be verified by DFLAW-specific emissions estimate model runs using the APPS model. 6.1.34 Average Feed Vector Batch Volumes, Densities, and Masses in Equation 9 through
Equation 11
Assumption Average feed vector batch volumes, densities, and masses are used in Equation 9 through Equation 11 to calculate conservative values for maximum feed vector batch mass fractions, , and concentations, . Dividing the maximum feed vector batch mass, , by average values instead of maximum values for mass and volume provide conservative results for and , respectively. Verification This assumption will be verified by DFLAW-specific emissions estimate model runs using the APPS model. 6.1.35 3H Emissions
Assumption The emissions of 3H from the DEP system are assumed to be controlled by the evaporator/condenser MDRs established in Ref. 9.19. Since 3H is assumed to be present as tritiated water (Assumption 6.2.7), the emissions of 3H will follow the emissions of water vapor. Some water vapor (and therefore 3H2O) will be released through the the evaporator vent stream. The evaporator/condenser MDRs for 3H will be used to estimate the amount of 3H that is not condensed in the condensers and is emitted to the DVP exhaust system.

CALCULATION SHEET PROJECT: RPP-WTPJOB NO.: 24590
BY: William Hix CALC NO.: 24590-BOF-M4C-DEP-00001 DATE: 6/6/2016 SHEET REV: B
SHEET NO.: 53SUBJECT: DFLAW Effluent Management Facility Air Emissions Estimate
24590-G04B-F00012 Rev 13 (Revised12/23/2015) Ref: 24590-WTP-3DP-G04B-00037, 24590-WTP-GPG-ENG-0127
Verification This assumption will be verified by DFLAW-specific emissions estimate model runs using the APPS model. 6.1.36 3H Emissions Evaporator Feed Mass Flowrate
Assumption The calculation for 3H emissions, using the evaporator/condenser MDRs, will use the value for , , calculated in Equation 17, as the evaporator feed mass flowrate, , . Verification This assumption will be verified by DFLAW-specific emissions estimate model runs using the APPS model. 6.1.37 Vapor Phase Feed Organic COPCs Only Transferred to the DEP System in the Feed Line
Flush
Assumption It is assumed that vapor phase feed organic COPCs are only transferred to the DEP System in the feed line flush stream received in DEP-VSL-00001. Feed organic COPCs received in LAW are processed through the melters. Any portion of the organic COPCs that is not vitrified or destroyed in the melter enters the melter offgas stream. The vapor phase organic COPCs have a DF of 1 in the SBS (Assumption 6.2.15) and will, therefore, not be transferred to the DEP system in the SBS condensate stream (RLD21). Trace amounts of organics may be present in other inlet streams to the DEP system, such as the Plant Wash Vessel effluent stream (RLD27) and the LAB sink drain effluent (RLD41), however, this assumption, combined with the conservatism in the other assumptions that support the calculation of the amount of feed organic COPCs flushed to DEP-VSL-00001 (See Assumptions 6.1.2, 6.2.1, and 6.2.5), is expected to provide an amount of feed organic COPCs that bounds the amount expected to be received under steady-state conditions that account for all the expected input streams (Feed line flush, RLD21, RLD27, and RLD41). Verification This assumption will be verified by DFLAW-specific emissions estimate model runs using the APPS model. 6.2 Assumptions Not Requiring Verification
6.2.1 Applicability of the Tank Farms Average Ratios
Assumption The Tank Farms Average ratios provided in Ref. 9.2 represent the distribution of COPCs as they currently exists in the Tank Farms, based on best available estimates. It is assumed that the waste received at LAW during DFLAW operations has the same distribution represented by these ratios.

CALCULATION SHEET PROJECT: RPP-WTPJOB NO.: 24590
BY: William Hix CALC NO.: 24590-BOF-M4C-DEP-00001 DATE: 6/6/2016 SHEET REV: B
SHEET NO.: 54SUBJECT: DFLAW Effluent Management Facility Air Emissions Estimate
24590-G04B-F00012 Rev 13 (Revised12/23/2015) Ref: 24590-WTP-3DP-G04B-00037, 24590-WTP-GPG-ENG-0127
Justification This assumption is conservative because it does not account for any change in the composition of the waste between when the samples underlying the ratios were collected in the Tank Farms and when the waste is actually received at LAW. This means chemical interactions such as precipitation, dissolution, or volatilization of species within the waste before it is received at WTP are not accounted for. In addition, for radionuclides this means the tank farm ratios do not account for the radioactive decay that will occur between the time of the sampling and the delivery of the waste. It also does not account for any of the pretreatment processing that will occur in the LAWPS facility (such as ultrafiltration or cesium removal). Note that, while this assumption is justified in order to provide a conservative estimate of radionuclide concentrations received for processing and emitted from the DEP process, the feed concentrations are checked against the ICD-30 feed acceptance criteria for individual radionuclide COPCs and adjusted as required per Section 5.1.1.1. 6.2.2 DFLAW Bounding Feed Vector
Assumption DFLAW feed vectors are provided for nominal and bounding conditions in Ref. 9.2. The DFLAW Bounding Feed Vector is used in conjunction with the Tank Farms Average ratios to determine the amount of each COPC received in the feed to LAW during DFLAW operations. Justification The use of the DFLAW Bounding Feed Vector is bounding compared to using the DFLAW Nominal Feed Vector. 6.2.3 Entrainment Factor Applicability for Particulate Emissions from DEP Vessels
Assumption The entrainment factor of 4E-5 g entrained material / g air provided in Input 2.3 is assumed to apply to all DEP vessels for the estimation of particulate emissions. The applicability of the entrainment factor for the DEP evaporator is discussed separately in Assumption 6.2.30. Justification The entrainment factor for free-falling aqueous solution was chosen as a representative entrainment factor because the streams will enter DEP vessels above the fluid surface. The nominal entrainment factor of 4E-5 is used because the fluid transfers will not occur continuously, therefore the free-fall condition will not occur continuously and the nominal value is more representative than the bounding value. The nominal free-fall entrainment factor is also more conservative and representative for DEP vessels compared to other potential entrainment factors in DOE-HDBK-3010-94, such as the bounding entrainment factor of 4E-7 for aerodynamic entrainment and resuspension of fluid that is “indoors, on heterogeneous surface (stainless steel, concrete), low airspeeds up to normal facility ventilation flow; outdoors, pool for low windspeeds.” (Ref. 10.2, Page 3-5) and the bounding entrainment factor of 3E-5 for “heating of aqueous solution in flowing air without surface rupture of bubbles” ( Ref. 10.2, Page 3-1).

CALCULATION SHEET PROJECT: RPP-WTPJOB NO.: 24590
BY: William Hix CALC NO.: 24590-BOF-M4C-DEP-00001 DATE: 6/6/2016 SHEET REV: B
SHEET NO.: 55SUBJECT: DFLAW Effluent Management Facility Air Emissions Estimate
24590-G04B-F00012 Rev 13 (Revised12/23/2015) Ref: 24590-WTP-3DP-G04B-00037, 24590-WTP-GPG-ENG-0127
Additionally, 24590-CM-HC4-W000-00193-01-00001 - Report - Aerosol Production in WTP Process Vessels - A Review of Recent Aerosol Testing recommends an entrainment factor of 4E-5 for sparged vessels (Ref. 9.37 Page 8). The nominal free-fall entrainment factor of 4E-5 from Ref. 10.2 is therefore conservative since DEP vessels are non-sparged. 6.2.4 14C Emissions
Assumption It is assumed that all 14C received in the EMF is emitted as it is processed through the DEP system. Justification This assumption is bounding since actual emissions of 14C cannot exceed this value. The actual emissions are dependent on the vapor-liquid equilibrium of each COPC in each of the DEP vessels and evaporator/condensers and are likely to be less than the total release established with this assumption. 6.2.5 Availability of Transfers from LAWPS to LAW
Assumption Feed transfers from the LAWPS to LAW are assumed to occur continuously without a break between transfers (i.e. a transfer begins immediately after the preceding one is finished). Justification This assumption is conservative and bounding, since it provides the maximum number of annual feed transfers and therefore the maximum number of flushes to the low point drain vessel (DEP-VSL-00001). 6.2.6 Carbon-14 Phase Property
Assumption 14C is assumed to be emitted as a vapor phase COPC. Justification This assumption is consistent with existing WTP emissions estimates, where 14C is assumed to exist as 14CO2 in the waste (Ref. 9.4, Section 4.4) and is treated as a vapor phase (Ref. 9.12, Table 11-1). In order to check that this assumption is conservative, a sensitivity analysis was completed to compare the unabated and abated emissions of 14C using the methodology for particle emissions and vapor emissions (Attachment E). This analysis shows that assuming 14C is emitted as a vapor phase COPC is significantly more conservative than if it was emitted as a particle COPC. 6.2.7 Tritium Phase Property
Assumption 3H is assumed to be emitted as a vapor phase COPC. Justification This assumption is consistent with existing WTP emissions estimates, where 3H is assumed to exist as tritiated water (3H2O) in the waste (Ref. 9.14, Table 12 Note b) and is treated as a vapor phase emission

CALCULATION SHEET PROJECT: RPP-WTPJOB NO.: 24590
BY: William Hix CALC NO.: 24590-BOF-M4C-DEP-00001 DATE: 6/6/2016 SHEET REV: B
SHEET NO.: 56SUBJECT: DFLAW Effluent Management Facility Air Emissions Estimate
24590-G04B-F00012 Rev 13 (Revised12/23/2015) Ref: 24590-WTP-3DP-G04B-00037, 24590-WTP-GPG-ENG-0127
(Ref. 9.12, Table 11-1). In order to check that this assumption is conservative, a sensitivity analysis was completed to compare the unabated emissions of 3H using the methodology for particle emissions and vapor emissions (Attachment E). This analysis shows that assuming 3H is emitted as a vapor phase COPC is equivalent to if it was emitted as a particle COPC for unabated emissions and significantly more conservative for abated emissions. 6.2.8 Iodine-129 Phase Property
Assumption 129I is assumed to be emitted as a particle COPC. Justification 129I is a volatile radionuclide with an Fv of 1 (Ref. 9.4, Section 4.4). Existing emissions estimates have treated 129I as a vapor phase emission in the LAW and High Level Waste Facility (HLW), reflecting its presence as iodine gas in the melter offgas streams (Ref. 9.12, Table 11-1). However, in the Pretreatment Facility (PTF) there is no melter and the process streams are caustic. Under these conditions, essentially all 129I will be in the form of iodide and iodate anions and 129I emissions are expected to be in the form of aerosols (Ref. 9.9, Section 7.3.3). For that reason, 129I has been treated as a particle emission in existing emissions estimates for the PTF (Ref. 9.12, Table 11-1). The DEP system process conditions will more closely resemble the PTF conditions just described (caustic process streams and no melter offgas), therefore 129I will be treated as a particle/aerosol for emissions estimation. 6.2.9 Radionuclide Phase Properties (excluding 14C, 3H, and 129I)
Assumption All radionuclide COPCs, excluding 14C, 3H, and 129I, are assumed to be emitted as particles. Justification This assumption is consistent with existing WTP emissions estimates, where all radionuclide COPCs, except or 14C, 3H, and 129I, are considered metals and nonvolatile, and are assigned a vapor phase partitioning coefficient, Fv , of 0 (Ref. 9.4, Section 4.4) and treated as a particle for emissions (Ref. 9.12, Table 11-1). 6.2.10 HEPA Filter Decontamination Factors
Assumption The following DFs are assumed for HEPA filters:
1st Stage HEPA Filter DF 2nd Stage HEPA Filter DF
Particulate 2,000 100
Vapor-phase 1 1
CALCULATION SHEET PROJECT: RPP-WTPJOB NO.: 24590
BY: William Hix CALC NO.: 24590-BOF-M4C-DEP-00001 DATE: 6/6/2016 SHEET REV: B
SHEET NO.: 57SUBJECT: DFLAW Effluent Management Facility Air Emissions Estimate
24590-G04B-F00012 Rev 13 (Revised12/23/2015) Ref: 24590-WTP-3DP-G04B-00037, 24590-WTP-GPG-ENG-0127
Justification These HEPA DFs are used in existing WTP emissions estimates and permitting documents for the other WTP facilities (e.g. Ref. 9.12, Section 6.1 and Ref. 9.14, Tables 12, 14, and 15) and will be used in this calculation for consistency. 6.2.11 Duration of Release from DVP System to ACV Exhaust System
Assumption The annual radionuclide emissions from the ACV Exhaust System are estimated assuming a 2 month release from the DVP system exhaust stream. Calculation 24590-HAC-50-00005 estimates annual C5V emissions based on a 2 month release from the pretreatment vessel vent system or 16 hour release from the LAW and HLW vitrification process (Ref. 9.13, Assumptions 6.4.1 and 6.4.2). For the ACV Exhaust System, a 2 month release is conservatively assumed, as it is the greater of the two release durations assumed in Ref. 9.13. Justification The 2 month release duration is considered conservative and bounding for any anticipated accidental release or release due to maintenance activities. Note that the EMF will not contain a maintenance shop so other than routine plant operations (i.e., HEPA change outs, valve/pump replacement), maintenance of removed equipment will be performed at an alternate location in the LAW Facility. 6.2.12 Distribution of Unspeciated Organic Carbon in Tank Farms Average Ratios
Assumption The unspeciated organic carbon is assumed to be distributed proportionally to all of the organic compounds with Tank Farms Average ratios in Ref. 9.2, as an approximation to account for the unspeciated organic carbon in tank farm samples. Justification This assumption is justified because the scaled Tank Farms Average ratios calculated to account for the unspeciated organic carbon bound the unscaled Tank Farms Average ratios provided in Ref. 9.2. 6.2.13 DEP Evaporator Annual Uptime
Assumption The annual uptime of the DEP evaporator is assumed to be 100% with a constant feed rate based on Assumption 6.1.7. Justification This assumption is bounding for determination of the annual throughput of the DEP evaporator based on volumetric feed rate from Assumption 6.1.7.

CALCULATION SHEET PROJECT: RPP-WTPJOB NO.: 24590
BY: William Hix CALC NO.: 24590-BOF-M4C-DEP-00001 DATE: 6/6/2016 SHEET REV: B
SHEET NO.: 58SUBJECT: DFLAW Effluent Management Facility Air Emissions Estimate
24590-G04B-F00012 Rev 13 (Revised12/23/2015) Ref: 24590-WTP-3DP-G04B-00037, 24590-WTP-GPG-ENG-0127
6.2.14 Physical Properties of Evaporator Overheads Stream
Assumption The evaporator overheads stream is assumed to have the physical properties of water. Justification This assumption is justified because the overheads stream leaving the Evaporator Separator Vessel will be water with trace elements. This assumption is established in order to calculate the density of the evaporator overheads stream using a correlation between temperature and density for water (Equation 47). The main function of DEP-EVAP-00001 is to concentrate the SBS and WESP condensates transferred from the LAW offgas system (Section 3). In the baseline WTP configuration, these LAW offgas condensates are evaporated in the TLP evaporator system. The function of the TLP evaporator system in the TLP system description is stated as the following (Ref. 9.35, Section 2): “The TLP system reduces the volume of treated LAW waste and LAW offgas condensate streams by evaporating water.” The presence of trace volatile compounds will not significantly affect the density, justifying the assumption that the overheads stream has the physical properties of water. 6.2.15 SBS DF for Vapor Phase Organic COPCs
Assumption The SBS DF for vapor phase organic COPCs is assumed to be 1 (Ref. 9.14, Table 16). Verification This is the SBS DF used for vapor phase organic COPCs in existing WTP emissions estimates for the other WTP facilities (Ref. 9.14, Tables 16) and will be used in this calculation for consistency. 6.2.16 Vapor Phase Feed Organic COPC Emissions
Assumption It is assumed that the entire vapor fraction of each feed organic COPC received in DEP-VSL-00001 annually is emitted to the DEP vessel ventilation system as it is processed through the DEP system. Justification This assumption is bounding since actual vapor phase emissions of feed organic COPCs cannot exceed this value. The actual emissions are dependent on the vapor-liquid equilibrium of each COPC in each of the DEP vessels and evaporator/condensers and, in various cases, are likely to be less than the total release established with this assumption. This assumption is not applied to the subset of feed organic COPCs that are evaluated using a Henry’s Law analysis in Section 5.2.4.1.
CALCULATION SHEET PROJECT: RPP-WTPJOB NO.: 24590
BY: William Hix CALC NO.: 24590-BOF-M4C-DEP-00001 DATE: 6/6/2016 SHEET REV: B
SHEET NO.: 59SUBJECT: DFLAW Effluent Management Facility Air Emissions Estimate
24590-G04B-F00012 Rev 13 (Revised12/23/2015) Ref: 24590-WTP-3DP-G04B-00037, 24590-WTP-GPG-ENG-0127
6.2.17 PIC Generation Rate for Particle or Particle-Bound PIC COPCs without Generation Rates from Testing
Assumption Particle or particle-bound PIC COPCs that do not have generation rates reported in Ref. 9.15, Table 3 are assigned a generation rate equal to the maximum generation rate for a particle or particle-bound PIC COPC that does have a generation rate reported in Ref. 9.15, Table 3. Justification This assumption is established in order to provide a conservative generation rate for PIC COPCs without reported generation rates. 6.2.18 Fraction of PIC COPC Particulate Captured in the SBS
Assumption The entire fraction of each PIC COPC that exists as particulate, represented by 1 , , is assumed to be captured in the SBS. Justification Organic COPCs with an FV value less than 1 are partially present in off-gas streams as particulate. These organic COPCs have SBS DFs assigned (for example, Dibutylphosphate in Ref. 9.14, Table 16 has a particle phase SBS DF of 20). This means that some fraction of particulate is not captured in the SBS and continues in the off-gas stream. For estimation of particulate emissions of PIC COPCs from the DEP system, it is conservative and bounding to assume the entire particle fraction of a PIC COPC is captured in the SBS and subsequently transferred to the DEP system. 6.2.19 Transfer Frequency of RLD-VSL-00005
Assumption The transfer frequency for RLD-VSL-00005 is once every 24 hours (Ref. 9.20, Section 6.1.1). Justification This transfer frequency is included in an assumption not requiring verification in Ref. 9.20, which is a confirmed calculation.

CALCULATION SHEET PROJECT: RPP-WTPJOB NO.: 24590
BY: William Hix CALC NO.: 24590-BOF-M4C-DEP-00001 DATE: 6/6/2016 SHEET REV: B
SHEET NO.: 60SUBJECT: DFLAW Effluent Management Facility Air Emissions Estimate
24590-G04B-F00012 Rev 13 (Revised12/23/2015) Ref: 24590-WTP-3DP-G04B-00037, 24590-WTP-GPG-ENG-0127
6.2.20 Batch Volume of RLD-VSL-00005
Assumption The batch volume of RLD-VSL-00005 is 10,700 gal without contingency (Ref. 9.20, Section 7.1). Note that the volume without contingency shown in Ref. 9.20 is 10,900 gallons. The 10,700 gallon volume used here reflects the reduction in volume contribution from RLD-VSL-00004 from 4,700 gallons to 4,500 gallons determined in calculation 24590-LAW-MVC-RLD-00009 as modified by ECCN 24590-LAW-MVE-RLD-00001 (Ref. 9.21, Section 7.1.2). Ref. 9.20 has not been updated to reflect this change to an input value. Justification For the purpose of this calculation, the batch volume of RLD-VSL-00005 is used without contingency for the following reasons:
Reference 9.20 reports a batch volume of 16,000 gal which includes 40% contingency for conservatism. Excessive conservatism in batch volumes upstream of the DEP vessels creates over-design of the DEP evaporator and associated support systems. Over-design can result in unnecessary costs to the facility and process issues due to improper sizing of pipes and pumps.
The batch volume value of RLD-VSL-00004, used for input in RLD-VSL-00005, is for the high humidity case, not the normal operations case. From Reference 9.21, the high humidity case creates more condensation thus having an increased batch volume of 4,500 gal vs. 3,100 gal for the normal operations case.
6.2.21 Phase Property of Feed Inorganic COPCs
Assumption The offgas phase type of feed inorganic COPCs are determined using the Fv values calculated in CCN 129507 (Ref. 9.4, Table 2). Most feed inorganic COPCs have an Fv value of 0 and are emitted as particles, with the following exceptions:
Bromide has an Fv value of 0.017. Ref. 9.4, Section 4 states that COPCs with an Fv value < 0.05 are considered particles. Therefore bromide will be evaluated using the same method as the other feed inorganic COPCs with Fv values of 0.
Ammonia and cyanide have Fv values of 1 and are emitted as vapor. The phase type for mercury depends on its speciation and will be handled as a special case.
Justification This assumption is consistent with existing WTP emissions estimates (Ref. 9.14, Table 3).

CALCULATION SHEET PROJECT: RPP-WTPJOB NO.: 24590
BY: William Hix CALC NO.: 24590-BOF-M4C-DEP-00001 DATE: 6/6/2016 SHEET REV: B
SHEET NO.: 61SUBJECT: DFLAW Effluent Management Facility Air Emissions Estimate
24590-G04B-F00012 Rev 13 (Revised12/23/2015) Ref: 24590-WTP-3DP-G04B-00037, 24590-WTP-GPG-ENG-0127
6.2.22 Transfers from LVP-TK-00001 to DEP-VSL-00004A/B are Continuous
Assumption Transfers from LVP-TK-00001 to DEP-VSL-00004A/B are assumed to occur continuously, with no break or downtime between transfers (i.e. as soon as a transfer ends, the next transfer begins). Justification This assumption is bounding since it provides the maximum number of transfers annually, and therefore the maximum volume transferred annually, from LVP-TK-00001 to DEP-VSL-00004A/B. 6.2.23 Dimethyl Mercury Emissions
Assumption It is assumed that all dimethyl mercury formed in a DEP vessel is emitted from that vessel in the vapor phase. Justification This assumption is bounding since actual emissions of dimethyl mercury cannot exceed this value. The actual emissions are dependent on the vapor-liquid equilibrium of dimethyl mercury in each of the DEP vessels and evaporator/condensers and are likely to be less than the total release established with this assumption. 6.2.24 Dimethyl Mercury Formation Rate Constant
Assumption The rate constant for the formation of dimethyl mercury from mercury or its compounds in caustic salt solutions in the presence of organics is assumed to be represented by the rate equation reported in CCN 160522 (Ref. 9.24, Figure 1).
. .
Where:
= Rate constant in a first order rate equation, in s-1 = Temperature, in K
Justification This rate equation represents the best available information on the formation of dimethyl mercury in WTP waste streams. This rate equation forms the basis for the current WTP estimate of dimethyl mercury concentrations (Ref. 9.25, Section 5.5).

CALCULATION SHEET PROJECT: RPP-WTPJOB NO.: 24590
BY: William Hix CALC NO.: 24590-BOF-M4C-DEP-00001 DATE: 6/6/2016 SHEET REV: B
SHEET NO.: 62SUBJECT: DFLAW Effluent Management Facility Air Emissions Estimate
24590-G04B-F00012 Rev 13 (Revised12/23/2015) Ref: 24590-WTP-3DP-G04B-00037, 24590-WTP-GPG-ENG-0127
6.2.25 Monomethyl Mercury Emissions
Assumption Monomethyl mercury emissions are included with the total mercury emissions calculated according the methodology in Section 5.3.1.2.1. Justification Monomethyl mercury is nonvolatile and should be considered to exist mainly in the liquid phase within WTP waste streams (Ref. 9.24, Page 10). Therefore, monomethyl mercury emissions are include with the total emissions of mercury and not estimated separately like dimethyl mercury. 6.2.26 PIC Generation Rates
Assumption The PIC generation rates detected in testing at the VSL are reported in Ref. 9.15, Table 3 will be used as the basis for estimating emissions of PICs from the DVP system. Justification These PIC generation rates are the best available testing results from testing and will not be verified. 6.2.27 Non-zero Emission Rates for Vapor Phase PIC COPCs
Assumption The subset of PIC COPCs with vapor phase type (Fv = 1) are assumed to be emitted at the average unabated particulate emissions rate for PIC COPCs. The abated emissions of this subset is then determined based on the HEPA filter particulate DFs. Justification This subset of PIC COPCs have emissions estimated as 0 g/sec based on Assumption 6.2.15. Assumption 6.2.15 states that vapor phase COPCs have a DF of 1 in the SBS, meaning the entire amount entering the SBS passes through the SBS without being scrubbed from the off-gas stream. Since these vapor phase PIC COPCs are not captured in the SBS, they are not transferred to the DEP system in the SBS condensate stream (RLD21). In order to assign this subset of PIC COPCs a bounding emissions estimate greater than 0 g/sec, they are assumed to be emitted at the average unabated particulate emissions rate for PIC COPCs. 6.2.28 Non-zero Emission Rates for Feed Organic COPCs without Tank Farms Average Ratios
Assumption The subset of feed organic COPCs that do not have available data from Tank Farms sampling and therefore do not have Tank Farms Average Ratios defined in Ref. 9.2 are assumed to be emitted at the average unabated vapor emissions rate for feed organic COPCs with Tank Farms Average Ratios.
CALCULATION SHEET PROJECT: RPP-WTPJOB NO.: 24590
BY: William Hix CALC NO.: 24590-BOF-M4C-DEP-00001 DATE: 6/6/2016 SHEET REV: B
SHEET NO.: 63SUBJECT: DFLAW Effluent Management Facility Air Emissions Estimate
24590-G04B-F00012 Rev 13 (Revised12/23/2015) Ref: 24590-WTP-3DP-G04B-00037, 24590-WTP-GPG-ENG-0127
Justification This subset of the feed organic COPCs initally have emissions estimates of 0 g/sec, using the methodology based on Tank Farms Average Ratios. In order to assign this subset of feed organic COPCs a bounding emissions estimate greater than 0 g/sec, they are assumed to be emitted at the average unabated vapor emissions rate for feed organic COPCs with Tank Farms Average Ratios. 6.2.29 Chromium (VI) De Minimis Comparison
Assumption For the purpose of comparing chromium (VI) emissions to the de minimis limit for chromium (VI) in WAC 173-460-150, it is assumed that all chromium emitted is chromium (VI). The emissions estimate evaluates total chromium (without specifying oxidation state) with CAS # 7440-47-3 as a feed inorganic COPC (Attachment A, Table A-3). The TAPs list in WAC 173-460-150 includes chromium (VI) with CAS # 18540-29-9 (Ref. 10.7). Justification The fraction of chromium present as chromium (VI) in the waste depends on the speciation of chromium compounds, however assuming that all chromium emitted is chromium (VI), for the purpose of making a comparison to the de minimis limit, is a bounding and conservative assumption. 6.2.30 Entrainment Factor Applicability for Particulate Emissions from DEP Evaporator
Assumption The entrainment factor of 1E-3 g entrained material / g air provided in Input 2.20 is assumed to apply to the DEP evaporator for the estimation of particulate emissions. Justification The evaporator will be heated and under boiling conditions for water. For this reason the release fraction of 1E-3 from WAC 246-247-030 (21)(a)(ii) (Ref. 10.8) is used to estimate the entrainment of particulate from the evaporator. This value adds additional conservatism compared to the 4E-5 used for the DEP vessels. This value also does not account for any removal of particulate that will occur prior to reaching the vent system due to the presence of a bubble-cap tray, two demister pads, and three condensers in the vent path. Therefore, application of the 1E-3 entrainment factor for particulate emissions is conservative and bounding for the normal operation of the DEP evaporator.

CALCULATION SHEET PROJECT: RPP-WTPJOB NO.: 24590
BY: William Hix CALC NO.: 24590-BOF-M4C-DEP-00001 DATE: 6/6/2016 SHEET REV: B
SHEET NO.: 64SUBJECT: DFLAW Effluent Management Facility Air Emissions Estimate
24590-G04B-F00012 Rev 13 (Revised12/23/2015) Ref: 24590-WTP-3DP-G04B-00037, 24590-WTP-GPG-ENG-0127
7 Calculations
The emissions estimate is calculated in a series of Excel spreadsheets. The Excel spreadsheet files are located in Attachment C (24590-RMCD-04955). 7.1 Radionuclide COPC Emissions
The radionuclide COPC emissions estimate calculation spreadsheet with the file name “DFLAW Radionuclide COPC Emissions Estimate.xlsx” is included in Attachment C. The following section describes how the spreadsheet is used to estimate organic COPC emissions. 7.1.1 COPC Maximum Batch Activities
The maximum batch activity of each radionuclide is calculated using the Excel spreadsheet titled “DFLAW Radionuclide COPC Emissions Estimate.xlsx” shown in Attachment C. The following table describes how these values are calculated within the spreadsheet: Table 7-1 “DFLAW Radionuclide COPC Emissions Estimate.xlsx” Calculation of Batch Activities
Worksheet Title
Cell Location
Property Calculation Method
Notes
Radionuclide COPCs – Calc
B5:B50 COPC i -- Radionuclide COPCs identified in Attachment A
Radionuclide COPCs – Calc
C5:C50 = Tank Farms Average ratio of COPC i, in mCi COPC / g Na
-- Tank farm average ratios from Ref. 9.2
Radionuclide COPCs – Calc
AF5 , = Maximum batch amount of Na in DFLAW Bounding Feed Vector, in kmols
Attachment G Sodium amounts in each DFLAW feed batch from the bounding DFLAW Feed Vector provided in Ref. 9.2
Radionuclide COPCs – Calc
AF6 = Molecular weight of sodium, in g/mol -- Input 2.5
Radionuclide COPCs – Calc
E5:E50 = Maximum feed vector batch activity of COPC i, in Ci
Equation 1 Unadjusted values, see Section 7.1.1.1 for calculation of adjusted values
7.1.1.1 ICD-30 Acceptance Limits
The values for calculated in Cells E5:E50 have not been adjusted to not exceed the ICD-30 acceptance limits shown in Input 2.2. The applicable values for are compared to their ICD-30 limit and adjusted as needed.

CALCULATION SHEET PROJECT: RPP-WTPJOB NO.: 24590
BY: William Hix CALC NO.: 24590-BOF-M4C-DEP-00001 DATE: 6/6/2016 SHEET REV: B
SHEET NO.: 65SUBJECT: DFLAW Effluent Management Facility Air Emissions Estimate
24590-G04B-F00012 Rev 13 (Revised12/23/2015) Ref: 24590-WTP-3DP-G04B-00037, 24590-WTP-GPG-ENG-0127
The following Excel spreadsheet images show how this comparison and adjustment is done per the methodology in Section 5.1.1.1. Figure 7-1 – ICD-30 Acceptance Limits Calculation Spreadsheet
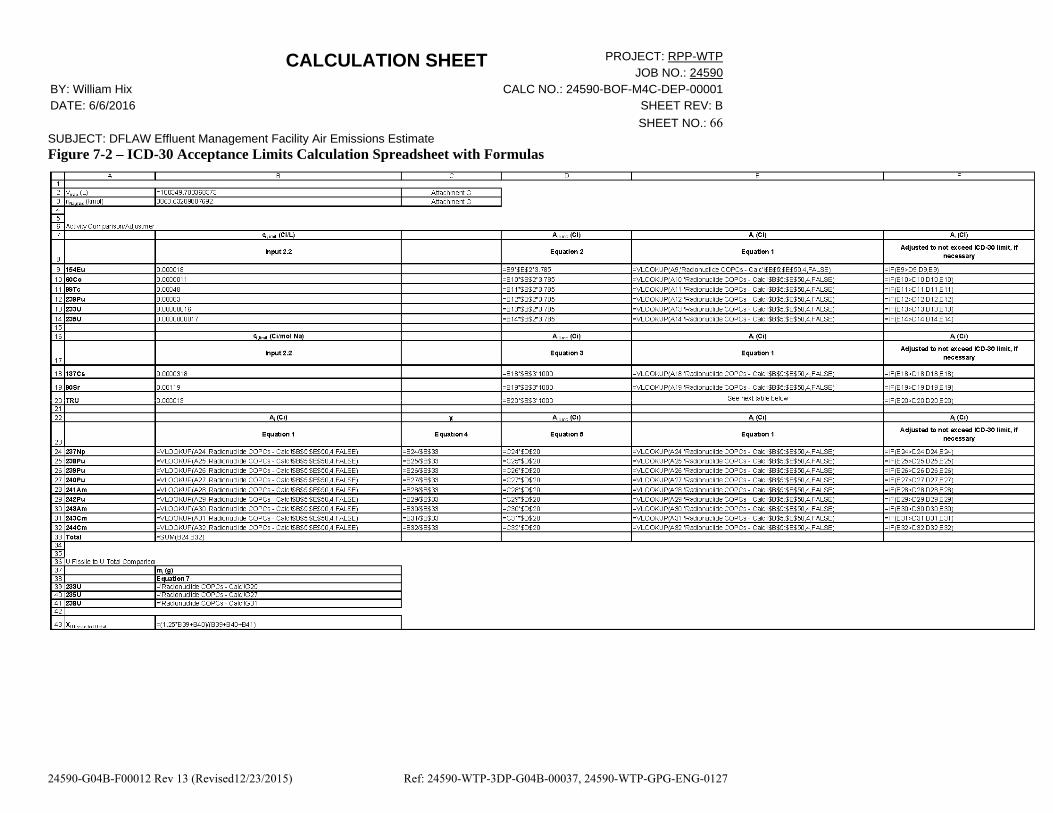
CALCULATION SHEET PROJECT: RPP-WTPJOB NO.: 24590
BY: William Hix CALC NO.: 24590-BOF-M4C-DEP-00001 DATE: 6/6/2016 SHEET REV: B
SHEET NO.: 66SUBJECT: DFLAW Effluent Management Facility Air Emissions Estimate
24590-G04B-F00012 Rev 13 (Revised12/23/2015) Ref: 24590-WTP-3DP-G04B-00037, 24590-WTP-GPG-ENG-0127
Figure 7-2 – ICD-30 Acceptance Limits Calculation Spreadsheet with Formulas

CALCULATION SHEET PROJECT: RPP-WTPJOB NO.: 24590
BY: William Hix CALC NO.: 24590-BOF-M4C-DEP-00001 DATE: 6/6/2016 SHEET REV: B
SHEET NO.: 67SUBJECT: DFLAW Effluent Management Facility Air Emissions Estimate
24590-G04B-F00012 Rev 13 (Revised12/23/2015) Ref: 24590-WTP-3DP-G04B-00037, 24590-WTP-GPG-ENG-0127
If the ICD-30 limit is exceeded, the adjusted values are substituted for the original values in the main “Radionuclide COPCs – Calc” worksheet. Table 7-2 “DFLAW Radionuclide COPC Emissions Estimate.xlsx” Substitution of Adjusted Values as Needed
Worksheet Title
Cell Location
Property Calculation Method
Notes
Radionuclide COPCs – Calc
F5:F50 Adjusted values of , as needed, so that ICD-30 limits are not exceeded. Values that do not require adjustment are equal to the value calculated in Column E
Figure 7-1, Figure 7-2
Note that 137mBa and 90Y are daughter products of 137Cs and 90Sr, respectively. Since 137Cs and 90Sr require adjustment to their ICD-30 limits, as shown in Figure 7-1 and Figure 7-2, 137mBa and 90Y also require adjustment. The daughter products are adjusted so that their adjusted values are the same proportion to their parent as it was for the unadjusted activity. The values/formulas for 137mBa and 90Y in Column F reflect this proportional adjustment. 7.1.2 COPC Maximum Batch Mass Fractions and Concentrations
The maximum batch mass fraction and concentration of each radionuclide is calculated using the Excel spreadsheet titled “DFLAW Radionuclide COPC Emissions Estimate.xlsx” shown in Attachment C. The following table describes how these values are calculated within the spreadsheet:
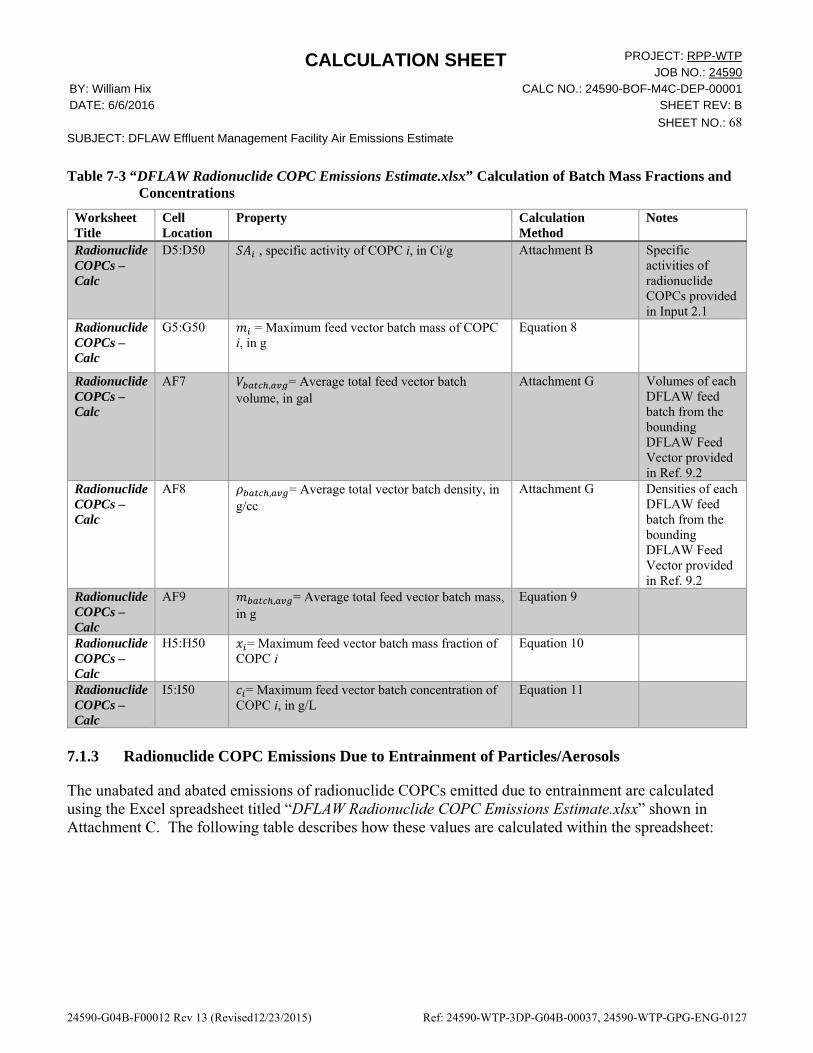
CALCULATION SHEET PROJECT: RPP-WTPJOB NO.: 24590
BY: William Hix CALC NO.: 24590-BOF-M4C-DEP-00001 DATE: 6/6/2016 SHEET REV: B
SHEET NO.: 68SUBJECT: DFLAW Effluent Management Facility Air Emissions Estimate
24590-G04B-F00012 Rev 13 (Revised12/23/2015) Ref: 24590-WTP-3DP-G04B-00037, 24590-WTP-GPG-ENG-0127
Table 7-3 “DFLAW Radionuclide COPC Emissions Estimate.xlsx” Calculation of Batch Mass Fractions and Concentrations
Worksheet Title
Cell Location
Property Calculation Method
Notes
Radionuclide COPCs – Calc
D5:D50 , specific activity of COPC i, in Ci/g Attachment B Specific activities of radionuclide COPCs provided in Input 2.1
Radionuclide COPCs – Calc
G5:G50 = Maximum feed vector batch mass of COPC i, in g
Equation 8
Radionuclide COPCs – Calc
AF7 , = Average total feed vector batch volume, in gal
Attachment G Volumes of each DFLAW feed batch from the bounding DFLAW Feed Vector provided in Ref. 9.2
Radionuclide COPCs – Calc
AF8 , = Average total vector batch density, in g/cc
Attachment G Densities of each DFLAW feed batch from the bounding DFLAW Feed Vector provided in Ref. 9.2
Radionuclide COPCs – Calc
AF9 , = Average total feed vector batch mass, in g
Equation 9
Radionuclide COPCs – Calc
H5:H50 = Maximum feed vector batch mass fraction of COPC i
Equation 10
Radionuclide COPCs – Calc
I5:I50 = Maximum feed vector batch concentration of COPC i, in g/L
Equation 11
7.1.3 Radionuclide COPC Emissions Due to Entrainment of Particles/Aerosols
The unabated and abated emissions of radionuclide COPCs emitted due to entrainment are calculated using the Excel spreadsheet titled “DFLAW Radionuclide COPC Emissions Estimate.xlsx” shown in Attachment C. The following table describes how these values are calculated within the spreadsheet:
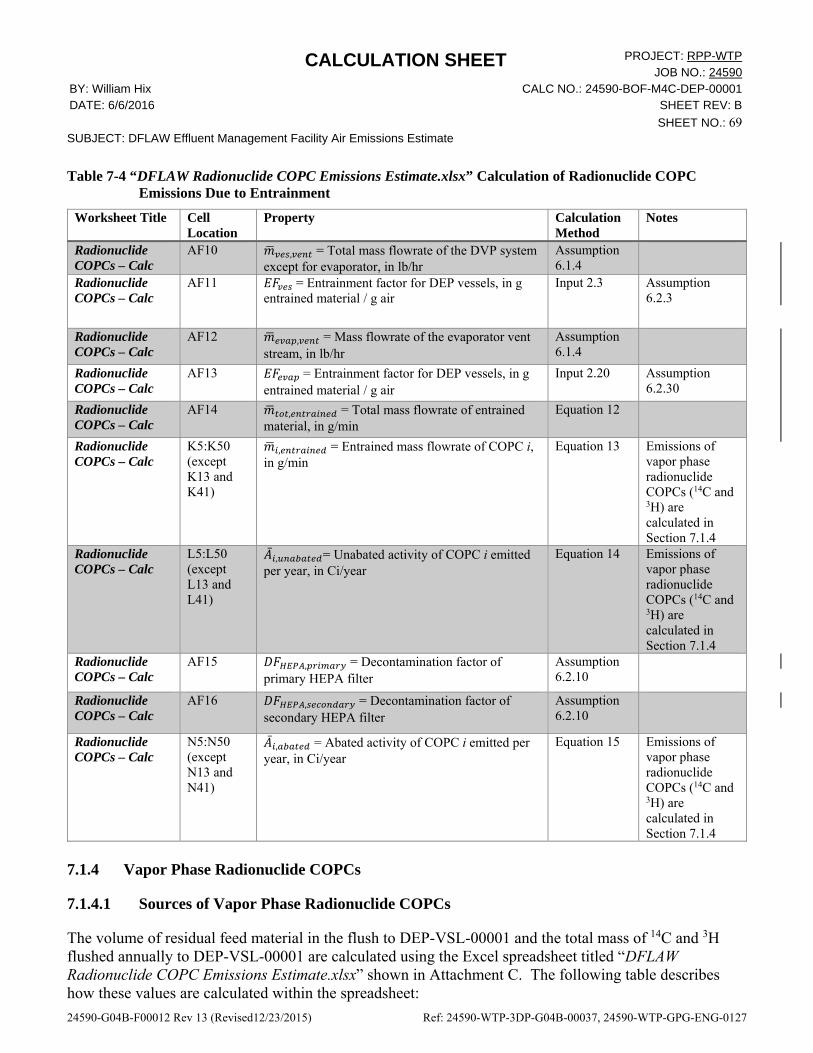
CALCULATION SHEET PROJECT: RPP-WTPJOB NO.: 24590
BY: William Hix CALC NO.: 24590-BOF-M4C-DEP-00001 DATE: 6/6/2016 SHEET REV: B
SHEET NO.: 69SUBJECT: DFLAW Effluent Management Facility Air Emissions Estimate
24590-G04B-F00012 Rev 13 (Revised12/23/2015) Ref: 24590-WTP-3DP-G04B-00037, 24590-WTP-GPG-ENG-0127
Table 7-4 “DFLAW Radionuclide COPC Emissions Estimate.xlsx” Calculation of Radionuclide COPC Emissions Due to Entrainment
Worksheet Title Cell Location
Property Calculation Method
Notes
Radionuclide COPCs – Calc
AF10 , = Total mass flowrate of the DVP system except for evaporator, in lb/hr
Assumption 6.1.4
Radionuclide COPCs – Calc
AF11 = Entrainment factor for DEP vessels, in g entrained material / g air
Input 2.3 Assumption 6.2.3
Radionuclide COPCs – Calc
AF12 , = Mass flowrate of the evaporator vent stream, in lb/hr
Assumption 6.1.4
Radionuclide COPCs – Calc
AF13 = Entrainment factor for DEP vessels, in g entrained material / g air
Input 2.20 Assumption 6.2.30
Radionuclide COPCs – Calc
AF14 , = Total mass flowrate of entrained material, in g/min
Equation 12
Radionuclide COPCs – Calc
K5:K50 (except K13 and K41)
, = Entrained mass flowrate of COPC i, in g/min
Equation 13 Emissions of vapor phase radionuclide COPCs (14C and 3H) are calculated in Section 7.1.4
Radionuclide COPCs – Calc
L5:L50 (except L13 and L41)
, = Unabated activity of COPC i emitted per year, in Ci/year
Equation 14 Emissions of vapor phase radionuclide COPCs (14C and 3H) are calculated in Section 7.1.4
Radionuclide COPCs – Calc
AF15 , = Decontamination factor of primary HEPA filter
Assumption 6.2.10
Radionuclide COPCs – Calc
AF16 , = Decontamination factor of secondary HEPA filter
Assumption 6.2.10
Radionuclide COPCs – Calc
N5:N50 (except N13 and N41)
, = Abated activity of COPC i emitted per year, in Ci/year
Equation 15 Emissions of vapor phase radionuclide COPCs (14C and 3H) are calculated in Section 7.1.4
7.1.4 Vapor Phase Radionuclide COPCs
7.1.4.1 Sources of Vapor Phase Radionuclide COPCs
The volume of residual feed material in the flush to DEP-VSL-00001 and the total mass of 14C and 3H flushed annually to DEP-VSL-00001 are calculated using the Excel spreadsheet titled “DFLAW Radionuclide COPC Emissions Estimate.xlsx” shown in Attachment C. The following table describes how these values are calculated within the spreadsheet:

CALCULATION SHEET PROJECT: RPP-WTPJOB NO.: 24590
BY: William Hix CALC NO.: 24590-BOF-M4C-DEP-00001 DATE: 6/6/2016 SHEET REV: B
SHEET NO.: 70SUBJECT: DFLAW Effluent Management Facility Air Emissions Estimate
24590-G04B-F00012 Rev 13 (Revised12/23/2015) Ref: 24590-WTP-3DP-G04B-00037, 24590-WTP-GPG-ENG-0127
Table 7-5 “DFLAW Radionuclide COPC Emissions Estimate.xlsx” Calculation of Sources of Vapor Phase
Radionuclide COPCs
Worksheet Title
Cell Location
Property Calculation Method
Notes
Radionuclide COPCs – Calc
AF17 = Total volume of LAW feed line flush, in gal Input 2.4, Assumption 6.1.3
Radionuclide COPCs – Calc
AF18 = Flush dilution factor Assumption 6.1.2
Radionuclide COPCs – Calc
AF19 = Volume of residual feed in a LAW feed line flush, in L
Equation 16
Radionuclide COPCs – Calc
AF20 = Frequency of LAW feed line flush, in 1/hr Assumption 6.1.3
Radionuclide COPCs – Calc
Q13 and Q41
, = Mass of COPC i flushed to DEP-VSL-0001 annually, in g/yr
Equation 17
7.1.4.2 Vapor Phase Radionuclide COPC Emissions
7.1.4.2.1 14C Emissions
The unabated and abated emissions of 14C are calculated using the Excel spreadsheet titled “DFLAW Radionuclide COPC Emissions Estimate.xlsx” shown in Attachment C. The following table describes how these values are calculated within the spreadsheet: Table 7-6 “DFLAW Radionuclide COPC Emissions Estimate.xlsx” Calculation of 14C Emissions
Worksheet Title
Cell Location
Property Calculation Method
Notes
Radionuclide COPCs – Calc
R13 , = Unabated activity of COPC i emitted per year, in Ci/year
Equation 18
Radionuclide COPCs – Calc
S13 , = Abated activity of COPC i emitted per year, in Ci/year
Equal to Cell R13
Vapor phase DF through HEPA filter is 1 (Assumption 6.2.10)
7.1.4.2.2 3H Emissions
The unabated and abated emissions of 3H are calculated using the Excel spreadsheet titled “DFLAW Radionuclide COPC Emissions Estimate.xlsx” shown in Attachment C. The following table describes how these values are calculated within the spreadsheet:

CALCULATION SHEET PROJECT: RPP-WTPJOB NO.: 24590
BY: William Hix CALC NO.: 24590-BOF-M4C-DEP-00001 DATE: 6/6/2016 SHEET REV: B
SHEET NO.: 71SUBJECT: DFLAW Effluent Management Facility Air Emissions Estimate
24590-G04B-F00012 Rev 13 (Revised12/23/2015) Ref: 24590-WTP-3DP-G04B-00037, 24590-WTP-GPG-ENG-0127
Table 7-7 “DFLAW Radionuclide COPC Emissions Estimate.xlsx” Calculation of 3H Emissions
Worksheet Title
Cell Location
Property Calculation Method
Notes
Radionuclide COPCs – Calc
AF21 , = Evaporator MDR for 3H Assumption 6.1.35
Radionuclide COPCs – Calc
AF22 , = Primary condenser MDR for 3H
Assumption 6.1.35
Radionuclide COPCs – Calc
AF23 , = Inter condenser MDR for 3H Assumption 6.1.35
Radionuclide COPCs – Calc
AF24 , = Combined MDR for 3H Equation 20
Radionuclide COPCs – Calc
R41 , = Unabated activity of COPC i emitted per year, in Ci/year
Equation 21
Radionuclide COPCs – Calc
S41 , = Abated activity of COPC i emitted per year, in Ci/year
Equal to Cell R41
Vapor phase DF through HEPA filter is 1 (Assumption 6.2.10)
7.1.5 ACV Exhaust System Radionuclide COPC Emissions
The unabated and abated emissions of radionuclide COPCs from the ACV exhaust system are calculated using the Excel spreadsheet titled “DFLAW Radionuclide COPC Emissions Estimate.xlsx” shown in Attachment C. The following table describes how these values are calculated within the spreadsheet:

CALCULATION SHEET PROJECT: RPP-WTPJOB NO.: 24590
BY: William Hix CALC NO.: 24590-BOF-M4C-DEP-00001 DATE: 6/6/2016 SHEET REV: B
SHEET NO.: 72SUBJECT: DFLAW Effluent Management Facility Air Emissions Estimate
24590-G04B-F00012 Rev 13 (Revised12/23/2015) Ref: 24590-WTP-3DP-G04B-00037, 24590-WTP-GPG-ENG-0127
Table 7-8 “DFLAW Radionuclide COPC Emissions Estimate.xlsx” Calculation of ACV Exhaust System Radionuclide COPC Emissions
Worksheet Title
Cell Location
Property Calculation Method
Notes
Radionuclide COPCs – Calc
V5:V50 , , = Unabated activity of COPC i emitted per year from the ACV Exhaust system, in Ci/year
Equation 22
Radionuclide COPCs – Calc
W5:W50 , , = Abated activity of COPC i emitted per year from the ACV Exhaust system (Single-stage HEPA), in Ci/year
Apply DF of 2000 for entrained emissions and DF of 1 for vapor emissions (Assumption 6.2.10)
Radionuclide COPCs – Calc
X5:X50 , , = Abated activity of COPC i emitted per year from the ACV Exhaust system (Dual-stage HEPA), in Ci/year
Apply DF of 200,000 for entrained emissions and DF of 1 for vapor emissions (Assumption 6.2.10)
7.1.6 Annual Possession Quantities
The APQs for radionuclide COPCs in the DEP system are calculated using the Excel spreadsheet titled “DFLAW Radionuclide COPC Emissions Estimate.xlsx” shown in Attachment C. The following table describes how these values are calculated within the spreadsheet: Table 7-9 “DFLAW Radionuclide COPC Emissions Estimate.xlsx” Calculation of APQs
Worksheet Title
Cell Location
Property Calculation Method
Notes
Radionuclide COPCs – Calc
AF25 , = Volumetric flowrate of DEP evaporator feed stream, in gpm
Assumption 6.1.7
Radionuclide COPCs – Calc
AF26 , = Annual volume processed through DEP evaporator, L
Equation 24 100% uptime based on Assumption 6.2.13
Radionuclide COPCs – Calc
Z5:Z50 (except Z13, Z41)
= Annual Possession Quantity of COPC i, in Ci/yr
Equation 23
Radionuclide COPCs – Calc
Z13, Z41 = Annual Possession Quantity of COPC i, in Ci/yr
Equation 25

CALCULATION SHEET PROJECT: RPP-WTPJOB NO.: 24590
BY: William Hix CALC NO.: 24590-BOF-M4C-DEP-00001 DATE: 6/6/2016 SHEET REV: B
SHEET NO.: 73SUBJECT: DFLAW Effluent Management Facility Air Emissions Estimate
24590-G04B-F00012 Rev 13 (Revised12/23/2015) Ref: 24590-WTP-3DP-G04B-00037, 24590-WTP-GPG-ENG-0127
7.2 Organic COPC Emissions
The organic COPC emissions estimate calculation spreadsheet with the file name “DFLAW Organic and PIC COPC Emissions Estimate.xlsx” is included in Attachment C. The following section describes how the spreadsheet is used to estimate organic COPC emissions. 7.2.1 Feed Organic COPC Emissions
7.2.1.1 Adjustment of Tank Farms Average Ratios
The Tank Farms Average ratios are adjusted per the methodology in Section 5.2.1.1 using the Excel spreadsheet titled “DFLAW Organic and PIC COPC Emissions Estimate.xlsx” shown in Attachment C . The following table describes how these values are calculated within the spreadsheet: Table 7-10 “DFLAW Organic and PIC COPC Emissions Estimate.xlsx” Adjustment of Tank Farms Average
Ratios
Worksheet Title Cell Location
Property Calculation Method
Notes
Feed Organic COPCs – Calc
C5:C141 = Tank farm ratio for COPC i, g COPC / g TOC
Ref. 9.2
Feed Organic COPCs – Calc Non-COPCs Organics
D5:D141 D5:D58
= Tank Farms Average ratio for COPC i, in g COPC-as-Carbon / g TOC (include non-COPC ratios)
Ref. 9.2
Feed Organic COPCs – Calc
D143 ∑ = Sum of all Tank Farms Average ratios (COPC and non-COPC) = 0.691
Feed Organic COPCs – Calc Non-COPCs Organics
E5:E141 E5:E58
, = Scaled Tank Farms Average ratio for COPC i to account for unspeciated organic carbon, g COPC-as-Carbon / g TOC
Equation 26 Assumption 6.2.12
Feed Organic COPCs – Calc
F5:F141 , = Scaled tank farm ratio for COPC i to account for unspeciated organic carbon, g COPC / g TOC
Equation 27
7.2.1.2 Determination of Feed Vector TOC Values
The adjusted batch TOC values in the DFLAW Bounding Feed Vector are calculated using the Excel spreadsheet titled “Bounding_DFLAW-batches-to-wtp_TOTALS.xlsx” shown in Attachment C. The DFLAW Bounding Feed Vector batch information is also shown in Attachment G. The following table describes how these values are calculated within the spreadsheet:

CALCULATION SHEET PROJECT: RPP-WTPJOB NO.: 24590
BY: William Hix CALC NO.: 24590-BOF-M4C-DEP-00001 DATE: 6/6/2016 SHEET REV: B
SHEET NO.: 74SUBJECT: DFLAW Effluent Management Facility Air Emissions Estimate
24590-G04B-F00012 Rev 13 (Revised12/23/2015) Ref: 24590-WTP-3DP-G04B-00037, 24590-WTP-GPG-ENG-0127
Table 7-11 “Bounding_DFLAW-batches-to-wtp_TOTALS.xlsx” Calculation of Adjusted TOC Values
Worksheet Title Cell Location
Property Calculation Method
Notes
TOTALS G4:G180 = moles of TOC delivered to WTP in a feed vector batch, in kmol
Provided in Ref. 9.2
TOTALS H4:H180 = moles of oxalate delivered to WTP in a feed vector batch, in kmol
Provided in Ref. 9.2
TOTALS N3 MWc = Molecular weight of carbon, g/mol Input 2.6
TOTALS N4 = moles of carbon per mole of oxalate 2 moles of Carbon for every 1 mole of oxalate (C2O4
-2) TOTALS I4:I180 = adjusted mass of TOC delivered
to WTP in a feed vector batch, in kg Equation 28 The
maximum value for
is shown in Cell I181
7.2.1.3 COPC Maximum Batch Masses, Mass Fractions, and Concentrations
Maximum batch masses, mass fractions, and concentrations are calculated using the Excel spreadsheet titled “DFLAW Organic and PIC COPC Emissions Estimate.xlsx” shown in Attachment C. The following table describes how these values are calculated within the spreadsheet:

CALCULATION SHEET PROJECT: RPP-WTPJOB NO.: 24590
BY: William Hix CALC NO.: 24590-BOF-M4C-DEP-00001 DATE: 6/6/2016 SHEET REV: B
SHEET NO.: 75SUBJECT: DFLAW Effluent Management Facility Air Emissions Estimate
24590-G04B-F00012 Rev 13 (Revised12/23/2015) Ref: 24590-WTP-3DP-G04B-00037, 24590-WTP-GPG-ENG-0127
Table 7-12 “DFLAW Organic and PIC COPC Emissions Estimate.xlsx” Calculation of Maximum Batch Masses, Mass Fractions, and Concentrations
Worksheet Title Cell Location
Property Calculation Method
Notes
Feed Organic COPCs – Calc
AA5 , = Maximum batch adjusted mass of TOC delivered to WTP in a feed vector batch, in g
Equation 28 Value copied from “Bounding_DFLAW-batches-to-wtp_TOTALS.xlsx” Worksheet “TOTALS” Cell I183
Feed Organic COPCs – Calc
G5:G141 = Maximum feed vector batch mass of COPC i, in g
Equation 29
Feed Organic COPCs – Calc
AA6 , = Average total feed vector batch volume, in gal
Attachment G Volumes of each DFLAW feed batch from the bounding DFLAW Feed Vector provided in Ref. 9.2
Feed Organic COPCs – Calc
AA7 , = Average total vector batch density, in g/cc
Attachment G
Feed Organic COPCs – Calc
AA8 , = Average total feed vector batch mass, in g
Equation 9
Feed Organic COPCs – Calc
H5:H141 = Maximum feed vector batch mass fraction of COPC i
Equation 10
Feed Organic COPCs – Calc
I5:I141 = Maximum feed vector batch concentration of COPC i, in g/L
Equation 11
7.2.1.4 Other Physical Properties
Physical properties for organic COPCs have been compiled in Ref. 9.15, Attachment A. Certain physical properties of the feed organic COPCs were extracted from Ref. 9.15, Attachment A for use in in the Excel spreadsheet titled “DFLAW Organic and PIC COPC Emissions Estimate.xlsx” shown in Attachment C. The worksheet titled “COPC Data” within “DFLAW Organic and PIC COPC Emissions Estimate.xlsx” contains the physical property tables from Ref. 9.15, Attachment A in spreadsheet form. The Vlookup function in Excel is used to search the “COPC Data” worksheet by each COPC’s Chemical Abstracts Service (CAS) number and import the desired physical property into the “Feed Organic COPCs – Calc” worksheet. The following table describes where these values are located within the spreadsheet:
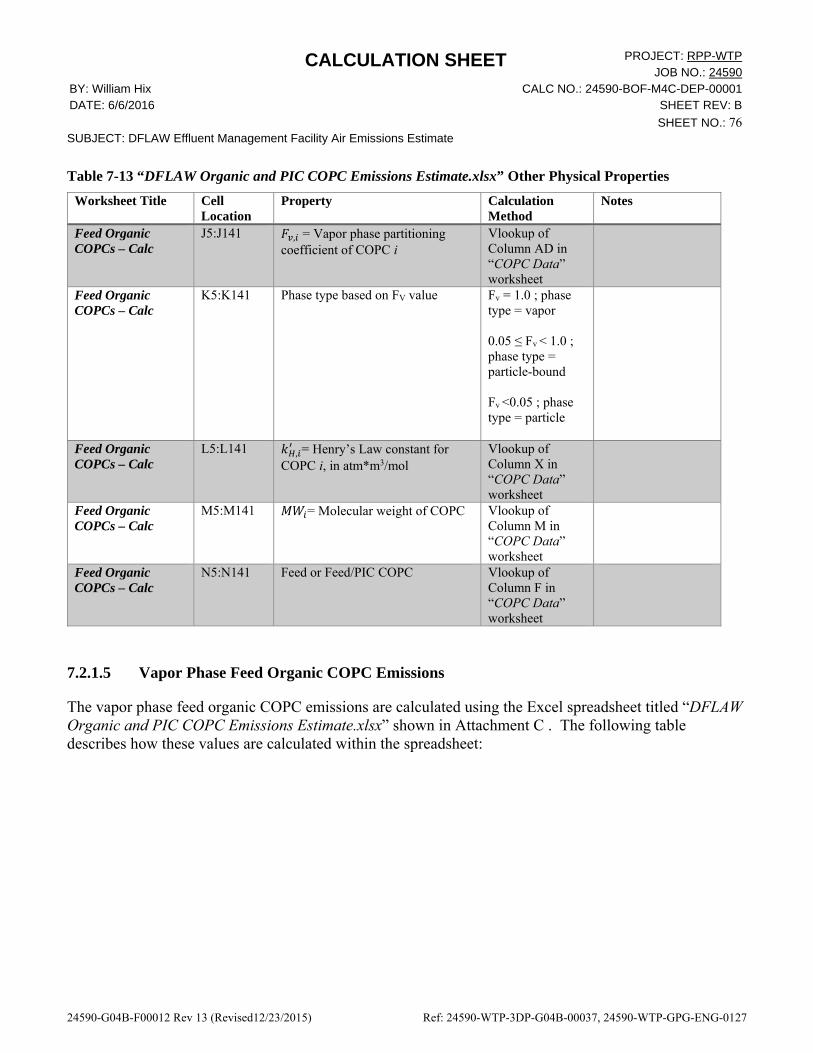
CALCULATION SHEET PROJECT: RPP-WTPJOB NO.: 24590
BY: William Hix CALC NO.: 24590-BOF-M4C-DEP-00001 DATE: 6/6/2016 SHEET REV: B
SHEET NO.: 76SUBJECT: DFLAW Effluent Management Facility Air Emissions Estimate
24590-G04B-F00012 Rev 13 (Revised12/23/2015) Ref: 24590-WTP-3DP-G04B-00037, 24590-WTP-GPG-ENG-0127
Table 7-13 “DFLAW Organic and PIC COPC Emissions Estimate.xlsx” Other Physical Properties
Worksheet Title Cell Location
Property Calculation Method
Notes
Feed Organic COPCs – Calc
J5:J141 , = Vapor phase partitioning coefficient of COPC i
Vlookup of Column AD in “COPC Data” worksheet
Feed Organic COPCs – Calc
K5:K141 Phase type based on FV value Fv = 1.0 ; phase type = vapor 0.05 ≤ Fv < 1.0 ; phase type = particle-bound Fv <0.05 ; phase type = particle
Feed Organic COPCs – Calc
L5:L141 , = Henry’s Law constant for COPC i, in atm*m3/mol
Vlookup of Column X in “COPC Data” worksheet
Feed Organic COPCs – Calc
M5:M141 = Molecular weight of COPC Vlookup of Column M in “COPC Data” worksheet
Feed Organic COPCs – Calc
N5:N141 Feed or Feed/PIC COPC Vlookup of Column F in “COPC Data” worksheet
7.2.1.5 Vapor Phase Feed Organic COPC Emissions
The vapor phase feed organic COPC emissions are calculated using the Excel spreadsheet titled “DFLAW Organic and PIC COPC Emissions Estimate.xlsx” shown in Attachment C . The following table describes how these values are calculated within the spreadsheet:

CALCULATION SHEET PROJECT: RPP-WTPJOB NO.: 24590
BY: William Hix CALC NO.: 24590-BOF-M4C-DEP-00001 DATE: 6/6/2016 SHEET REV: B
SHEET NO.: 77SUBJECT: DFLAW Effluent Management Facility Air Emissions Estimate
24590-G04B-F00012 Rev 13 (Revised12/23/2015) Ref: 24590-WTP-3DP-G04B-00037, 24590-WTP-GPG-ENG-0127
Table 7-14 “DFLAW Organic and PIC COPC Emissions Estimate.xlsx” Vapor Phase Feed Organic COPC Emissions
Worksheet Title Cell Location
Property Calculation Method
Notes
Feed Organic COPCs – Calc
AA9 = Total volume of LAW feed line flush, in gal
Input 2.4, Assumption 6.1.3
Feed Organic COPCs – Calc
AA10 = Flush dilution factor
Assumption 6.1.2
Feed Organic COPCs – Calc
AA11 = Volume of residual feed in a LAW feed line flush, in L
Equation 16
Feed Organic COPCs – Calc
AA12 = Frequency of LAW feed line flush, in hr
Assumption 6.1.3
Feed Organic COPCs – Calc
P5:P141 , = Mass of COPC i flushed to DEP-VSL-0001 annually, in g/yr
Equation 17
Feed Organic COPCs – Calc
Q5:Q141 , , = Unabated vapor phase emissions of COPC i, in g/sec
Equation 30
Feed Organic COPCs – Calc
R5:R141 , , = Abated vapor phase emissions of COPC i, in g/sec
Same as , ,
Assumption 6.2.10
7.2.1.6 Particle Phase Feed Organic COPC Emissions
The particle phase feed organic COPC emissions are calculated using the Excel spreadsheet titled “DFLAW Organic and PIC COPC Emissions Estimate.xlsx” shown in Attachment C . The following table describes how these values are calculated within the spreadsheet:

CALCULATION SHEET PROJECT: RPP-WTPJOB NO.: 24590
BY: William Hix CALC NO.: 24590-BOF-M4C-DEP-00001 DATE: 6/6/2016 SHEET REV: B
SHEET NO.: 78SUBJECT: DFLAW Effluent Management Facility Air Emissions Estimate
24590-G04B-F00012 Rev 13 (Revised12/23/2015) Ref: 24590-WTP-3DP-G04B-00037, 24590-WTP-GPG-ENG-0127
Table 7-15 “DFLAW Organic and PIC COPC Emissions Estimate.xlsx” Particle Phase Feed Organic COPC Emissions
Worksheet Title Cell Location
Property Calculation Method
Notes
Feed Organic COPCs – Calc
AA13 , = Total mass flowrate of the DVP system except for evaporator, in lb/hr
Assumption 6.1.4
Feed Organic COPCs – Calc
AA14 = Entrainment factor for DEP vessels, in g entrained material / g air
Input 2.3 Assumption 6.2.3
Feed Organic COPCs – Calc
AA15 , = Mass flowrate of the evaporator vent stream, in lb/hr
Assumption 6.1.4
Feed Organic COPCs – Calc
AA16 = Entrainment factor for DEP vessels, in g entrained material / g air
Input 2.20 Assumption 6.2.30
Feed Organic COPCs – Calc
AA17 , = Total mass flowrate of entrained material, in g/min
Equation 12
Feed Organic COPCs – Calc
T5:T141 , = Entrained mass flowrate of COPC i, in g/min
Equation 31
Feed Organic COPCs – Calc
U5:U141 , , = Unabated particulate emissions of COPC i, in g/sec
Equation 32
Feed Organic COPCs – Calc
AA18 , = Decontamination factor of primary HEPA filter
Assumption 6.2.10
Feed Organic COPCs – Calc
AA19 , = Decontamination factor of secondary HEPA filter
Assumption 6.2.10
Feed Organic COPCs – Calc
V5:V141 , , = Abated particulate emissions of COPC i, in g/sec
Equation 33
7.2.2 PIC COPC Emissions
7.2.2.1 PIC Generation Rates
The PIC generation rates are calculated using the Excel spreadsheet titled “DFLAW Organic and PIC COPC Emissions Estimate.xlsx” shown in Attachment C . The following table describes how these values are calculated within the spreadsheet:

CALCULATION SHEET PROJECT: RPP-WTPJOB NO.: 24590
BY: William Hix CALC NO.: 24590-BOF-M4C-DEP-00001 DATE: 6/6/2016 SHEET REV: B
SHEET NO.: 79SUBJECT: DFLAW Effluent Management Facility Air Emissions Estimate
24590-G04B-F00012 Rev 13 (Revised12/23/2015) Ref: 24590-WTP-3DP-G04B-00037, 24590-WTP-GPG-ENG-0127
Table 7-16 “DFLAW Organic and PIC COPC Emissions Estimate.xlsx” PIC Generation Rates
Worksheet Title Cell Location
Property Calculation Method
Notes
PIC COPCs – Calc D5:D213 , = Vapor phase partitioning coefficient of COPC i
Vlookup of Column AD in “COPC Data” worksheet
PIC COPCs – Calc E5:E213 Phase type based on FV value Fv = 1.0 ; phase type = vapor 0.05 ≤ Fv < 1.0 ; phase type = particle-bound Fv < 0.05 ; phase type = particle
PIC COPCs – Calc F5:F213 , = Generation rate of PIC COPC i, in mg (or g) PIC generated / mg (or g) melter feed TOC
Vlookup of Column C in “VSL PIC Data” worksheet
Assumptions 6.2.17, 6.2.26
PIC COPCs – Calc Q5 , = Maximum mass flowrate of TOC in melter feed stream LFP04 from PIBOD model runs, in kg/hr
Maximum LFP04 TOC value rounded up to 20 kg/hr See Attachment F values extracted from PIBOD runs
Assumption 6.1.15
PIC COPCs – Calc G5:G213 , = Mass flowrate of PIC COPC i generated in the melter, in g/sec
Equation 34
7.2.2.2 PIC COPC Emissions
The PIC COPC emissions are calculated using the Excel spreadsheet titled “DFLAW Organic and PIC COPC Emissions Estimate.xlsx” shown in Attachment C. The following table describes how these values are calculated within the spreadsheet:

CALCULATION SHEET PROJECT: RPP-WTPJOB NO.: 24590
BY: William Hix CALC NO.: 24590-BOF-M4C-DEP-00001 DATE: 6/6/2016 SHEET REV: B
SHEET NO.: 80SUBJECT: DFLAW Effluent Management Facility Air Emissions Estimate
24590-G04B-F00012 Rev 13 (Revised12/23/2015) Ref: 24590-WTP-3DP-G04B-00037, 24590-WTP-GPG-ENG-0127
Table 7-17 “DFLAW Organic and PIC COPC Emissions Estimate.xlsx” PIC COPC Emissions
Worksheet Title Cell Location
Property Calculation Method
Notes
PIC COPCs – Calc H5:H213 , = Mass flowrate of PIC COPC i captured in the SBS, in g/sec
Equation 35
PIC COPCs – Calc Q6 = Transfer volume of stream RLD21, in gallons
Assumption 6.2.20
PIC COPCs – Calc Q7 = Density of stream RLD21 from PIBOD, in g/L
Input 2.14
PIC COPCs – Calc Q8 = Frequency of transfer from RLD-VSL-00005 to DEP-VSL-00002, in 1/hr
Assumption 6.2.19
PIC COPCs – Calc Q9 = Mass flowrate of stream RLD21, in g/sec
Equation 36
PIC COPCs – Calc I5:I213 , = Mass fraction of PIC COPC i in Stream RLD21
Equation 37
PIC COPCs – Calc Q10 , = Total mass flowrate of the DVP system except for evaporator, in lb/hr
Assumption 6.1.4
PIC COPCs – Calc Q11 = Entrainment factor for DEP vessels, in g entrained material / g air
Input 2.3 Assumption 6.2.3
PIC COPCs – Calc Q12 , = Mass flowrate of the evaporator vent stream, in lb/hr
Assumption 6.1.4
PIC COPCs – Calc Q13 = Entrainment factor for DEP vessels, in g entrained material / g air
Input 2.20 Assumption 6.2.30
PIC COPCs – Calc Q14 , = Total mass flowrate of entrained material, in g/min
Equation 12
PIC COPCs – Calc J5:J213 , = Entrained mass flowrate of COPC i, in g/min
Equation 13
PIC COPCs – Calc K5:K213 , , = Unabated particulate emissions of COPC i, in g/sec
Equation 32
PIC COPCs – Calc Q15 , = Decontamination factor of primary HEPA filter
-- Assumption 6.2.10
PIC COPCs – Calc Q16 , = Decontamination factor of secondary HEPA filter
-- Assumption 6.2.10
PIC COPCs – Calc L5:L213 , , = Abated particulate emissions of COPC i, in g/sec
Equation 33

CALCULATION SHEET PROJECT: RPP-WTPJOB NO.: 24590
BY: William Hix CALC NO.: 24590-BOF-M4C-DEP-00001 DATE: 6/6/2016 SHEET REV: B
SHEET NO.: 81SUBJECT: DFLAW Effluent Management Facility Air Emissions Estimate
24590-G04B-F00012 Rev 13 (Revised12/23/2015) Ref: 24590-WTP-3DP-G04B-00037, 24590-WTP-GPG-ENG-0127
7.2.3 Feed/PIC Organic COPC Emissions
Particulate emissions for the subset of organic COPCs identified as being present as both Feed Organics and PICs will be the sum of the particulate emissions calculated in Sections 7.2.1.6 and 7.2.2.2. This is reflected in the following section describing how the results are summarized. 7.2.4 Organic COPC Summary and Comparison to De Minimis Emissions Limits
The results from Sections 7.2.1, 7.2.2, and 7.2.3 are presented in summary tables. The summary table for feed organic COPCs is contained in “DFLAW Organic and PIC COPC Emissions Estimate.xlsx” Worksheet “Organic Summary Table” shown in Attachment C. The PIC COPC summary table is contained in Worksheet “PIC Summary Table”. The following table describes how these values are calculated within the spreadsheet:
Table 7-18 “DFLAW Organic and PIC COPC Emissions Estimate.xlsx” Summary Tables
Worksheet Title Cell Location
Property Calculation Method Notes
Organic Summary Table
D7:D143 Feed or Feed/PIC COPC
Vlookup of Column N in “Feed Organic COPCs - Calc” worksheet
Organic Summary Table
E7:E143 , , , in g/sec
Vlookup of Column Q in “Feed Organic COPCs - Calc” worksheet
Results before any Henry’s Law Adjustment
Organic Summary Table
F7:F143 , , , in g/sec
Vlookup of Column Q in “Organic COPCs - Calc” worksheet or value from “Henry’s Law” worksheet (see Section 7.2.4.1.3)
Results after any Henry’s Law Adjustment Values initially shown as 0 g/s in this column (representing feed organic COPCs without Tank Farms Average Ratios) will be adjusted to bounding emissions estimates as described in Section 7.2.4.2.2.

CALCULATION SHEET PROJECT: RPP-WTPJOB NO.: 24590
BY: William Hix CALC NO.: 24590-BOF-M4C-DEP-00001 DATE: 6/6/2016 SHEET REV: B
SHEET NO.: 82SUBJECT: DFLAW Effluent Management Facility Air Emissions Estimate
24590-G04B-F00012 Rev 13 (Revised12/23/2015) Ref: 24590-WTP-3DP-G04B-00037, 24590-WTP-GPG-ENG-0127
Worksheet Title Cell Location
Property Calculation Method Notes
Organic Summary Table
H7:H143 , , , in g/sec
Vlookup of Column U in “Feed Organic COPCs - Calc” worksheet OR IF the COPC is a Feed/PIC THEN the sum of Vlookup of Column U in “Feed Organic COPCs - Calc” worksheet AND Vlookup of Column K in “PIC COPCs - Calc” worksheet
Values initially shown as 0 g/s for Feed/PIC COPCs in this column will be adjusted to bounding emissions estimates as described in Section 7.2.4.2.1.
Organic Summary Table
J7:J143 , , , in g/sec
Sum of unabated vapor and particle emissions
Organic Summary Table
K7:K143 , , , in g/sec
Vlookup of Column R in “Feed Organic COPCs - Calc” worksheet
Results before any Henry’s Law Adjustment
Organic Summary Table
L7:L143 , , , in g/sec
Vlookup of Column R in “Feed Organic COPCs - Calc” worksheet or value from “Henry’s Law” worksheet (see Section 7.2.4.1.3)
Results after any Henry’s Law Adjustment
Organic Summary Table
M7:M143 , , , in g/sec
Equation 30
Organic Summary Table
N7:N143 , , , in g/sec
Sum of abated vapor and particle emissions
PIC Summary Table
D7:D216 PIC or Feed/PIC COPC
Vlookup of Column C in “PIC COPCs - Calc” worksheet
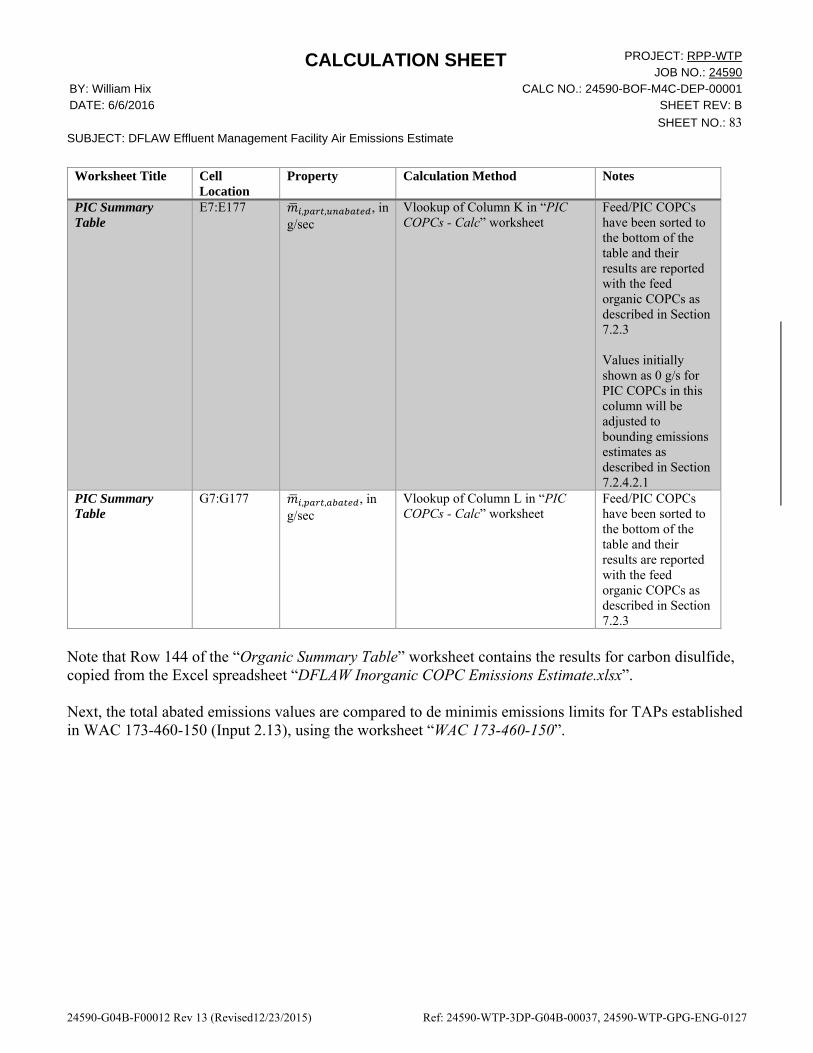
CALCULATION SHEET PROJECT: RPP-WTPJOB NO.: 24590
BY: William Hix CALC NO.: 24590-BOF-M4C-DEP-00001 DATE: 6/6/2016 SHEET REV: B
SHEET NO.: 83SUBJECT: DFLAW Effluent Management Facility Air Emissions Estimate
24590-G04B-F00012 Rev 13 (Revised12/23/2015) Ref: 24590-WTP-3DP-G04B-00037, 24590-WTP-GPG-ENG-0127
Worksheet Title Cell Location
Property Calculation Method Notes
PIC Summary Table
E7:E177 , , , in g/sec
Vlookup of Column K in “PIC COPCs - Calc” worksheet
Feed/PIC COPCs have been sorted to the bottom of the table and their results are reported with the feed organic COPCs as described in Section 7.2.3 Values initially shown as 0 g/s for PIC COPCs in this column will be adjusted to bounding emissions estimates as described in Section 7.2.4.2.1
PIC Summary Table
G7:G177 , , , in g/sec
Vlookup of Column L in “PIC COPCs - Calc” worksheet
Feed/PIC COPCs have been sorted to the bottom of the table and their results are reported with the feed organic COPCs as described in Section 7.2.3
Note that Row 144 of the “Organic Summary Table” worksheet contains the results for carbon disulfide, copied from the Excel spreadsheet “DFLAW Inorganic COPC Emissions Estimate.xlsx”. Next, the total abated emissions values are compared to de minimis emissions limits for TAPs established in WAC 173-460-150 (Input 2.13), using the worksheet “WAC 173-460-150”.
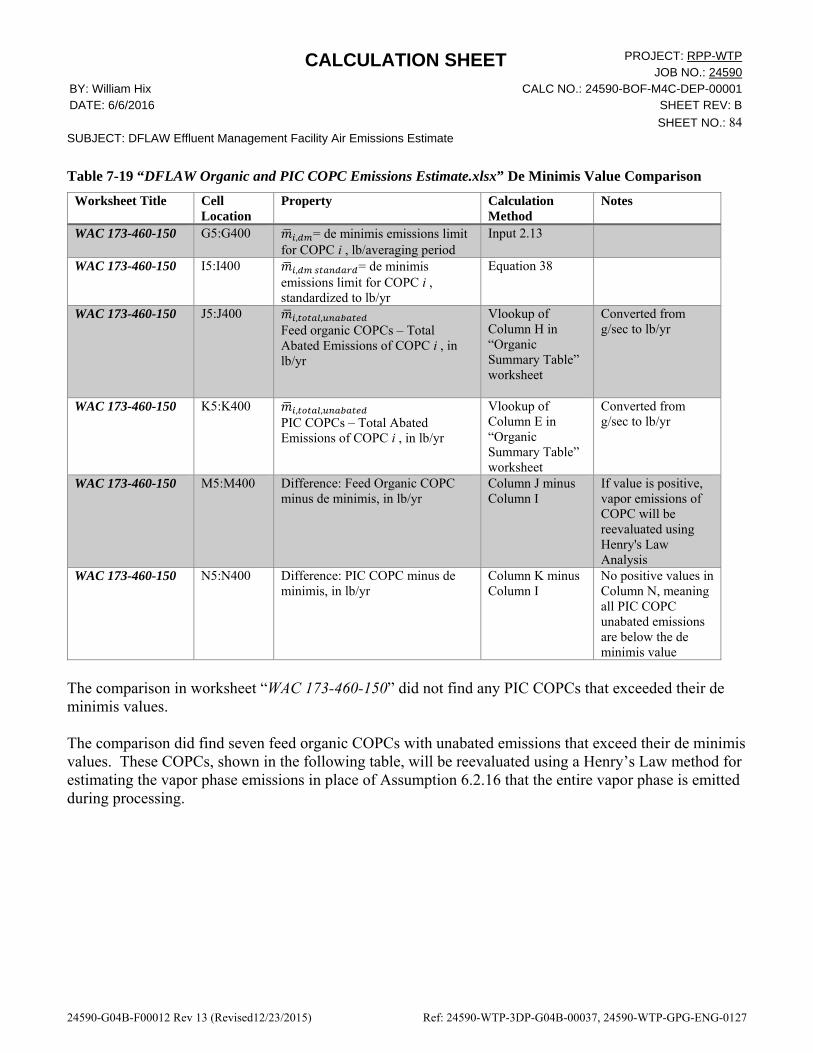
CALCULATION SHEET PROJECT: RPP-WTPJOB NO.: 24590
BY: William Hix CALC NO.: 24590-BOF-M4C-DEP-00001 DATE: 6/6/2016 SHEET REV: B
SHEET NO.: 84SUBJECT: DFLAW Effluent Management Facility Air Emissions Estimate
24590-G04B-F00012 Rev 13 (Revised12/23/2015) Ref: 24590-WTP-3DP-G04B-00037, 24590-WTP-GPG-ENG-0127
Table 7-19 “DFLAW Organic and PIC COPC Emissions Estimate.xlsx” De Minimis Value Comparison
Worksheet Title Cell Location
Property Calculation Method
Notes
WAC 173-460-150 G5:G400 , = de minimis emissions limit for COPC i , lb/averaging period
Input 2.13
WAC 173-460-150 I5:I400 , = de minimis emissions limit for COPC i , standardized to lb/yr
Equation 38
WAC 173-460-150 J5:J400 , , Feed organic COPCs – Total Abated Emissions of COPC i , in lb/yr
Vlookup of Column H in “Organic Summary Table” worksheet
Converted from g/sec to lb/yr
WAC 173-460-150 K5:K400 , , PIC COPCs – Total Abated Emissions of COPC i , in lb/yr
Vlookup of Column E in “Organic Summary Table” worksheet
Converted from g/sec to lb/yr
WAC 173-460-150 M5:M400 Difference: Feed Organic COPC minus de minimis, in lb/yr
Column J minus Column I
If value is positive, vapor emissions of COPC will be reevaluated using Henry's Law Analysis
WAC 173-460-150 N5:N400 Difference: PIC COPC minus de minimis, in lb/yr
Column K minus Column I
No positive values in Column N, meaning all PIC COPC unabated emissions are below the de minimis value
The comparison in worksheet “WAC 173-460-150” did not find any PIC COPCs that exceeded their de minimis values. The comparison did find seven feed organic COPCs with unabated emissions that exceed their de minimis values. These COPCs, shown in the following table, will be reevaluated using a Henry’s Law method for estimating the vapor phase emissions in place of Assumption 6.2.16 that the entire vapor phase is emitted during processing.

CALCULATION SHEET PROJECT: RPP-WTPJOB NO.: 24590
BY: William Hix CALC NO.: 24590-BOF-M4C-DEP-00001 DATE: 6/6/2016 SHEET REV: B
SHEET NO.: 85SUBJECT: DFLAW Effluent Management Facility Air Emissions Estimate
24590-G04B-F00012 Rev 13 (Revised12/23/2015) Ref: 24590-WTP-3DP-G04B-00037, 24590-WTP-GPG-ENG-0127
Table 7-20 Feed Organic COPCs that Exceed De Minimis Value
CAS # COPC
De minimis emissions limit for COPC i , standardized to lb/yr
Feed Organic COPCs - Total Unabated Emissions of COPC i, in lb/yr
Difference: Feed Organic COPC minus de minimis, in lb/yr
88‐06‐2 2,4,6‐Trichlorophenol 4.80E‐01 3.46E+00 2.98E+00
121‐14‐2 2,4‐Dinitrotoluene 1.07E‐01 3.94E+00 3.83E+00
91‐20‐3 Naphthalene 2.82E‐01 3.68E+00 3.40E+00
62‐75‐9 n‐Nitrosodimethylamine 2.08E‐03 1.85E‐02 1.64E‐02
621‐64‐7 n‐Nitrosodi‐n‐propylamine 4.80E‐03 3.49E+00 3.49E+00
59‐89‐2 n‐Nitrosomorpholine 5.05E‐03 7.96E+00 7.95E+00
1336‐36‐3 Polychlorinated Biphenyls, NOS 1.68E‐02 1.80E+00 1.79E+00
7.2.4.1 Henry’s Law Analysis
The subset of feed organic COPCs in Table 7-20 that exceed their de minimis emissions limit are evaluated a second time using a Henry’s Law analysis. This analysis is shown in the Excel spreadsheet titled “DFLAW Organic and PIC COPC Emissions Estimate.xlsx” Worksheet “Henry’s Law” shown in Attachment C.

CALCULATION SHEET PROJECT: RPP-WTPJOB NO.: 24590
BY: William Hix CALC NO.: 24590-BOF-M4C-DEP-00001 DATE: 6/6/2016 SHEET REV: B
SHEET NO.: 86SUBJECT: DFLAW Effluent Management Facility Air Emissions Estimate
24590-G04B-F00012 Rev 13 (Revised12/23/2015) Ref: 24590-WTP-3DP-G04B-00037, 24590-WTP-GPG-ENG-0127
Table 7-21 “DFLAW Organic and PIC COPC Emissions Estimate.xlsx” Henry’s Law Analysis Setup
Worksheet Title Cell Location
Property Calculation Method
Notes
Henry’s Law U5 , = Volumetric flowrate of DEP evaporator feed stream, in gpm
Assumption 6.1.7
Henry’s Law U6 , = Annual volume processed through DEP evaporator, L
Equation 24 100% uptime based on Assumption 6.2.13
Henry’s Law C5:C11 , = Mass of COPC i flushed to DEP-VSL-0001 annually, in g/yr
Vlookup of Column P in “Feed Organic COPCs - Calc” worksheet
Henry’s Law D5:D11 , = Concentration of COPC i based on amount received in feed line flush, g/L
Equation 39
Henry’s Law E5:E11 , = Henry’s Law constant for COPC i, in atm*m3/mol
Vlookup of Column L in “Feed Organic COPCs - Calc” worksheet
Henry’s Law F5:F11 = Molecular weight of COPC i, in g/mol
Vlookup of Column M in “Feed Organic COPCs - Calc” worksheet
7.2.4.1.1 Case 1: Vessel Vent Streams
The vapor emissions from the all vessel vent streams, except for the vent from the evaporator system, are estimated using a combined Henry’s Law analysis.

CALCULATION SHEET PROJECT: RPP-WTPJOB NO.: 24590
BY: William Hix CALC NO.: 24590-BOF-M4C-DEP-00001 DATE: 6/6/2016 SHEET REV: B
SHEET NO.: 87SUBJECT: DFLAW Effluent Management Facility Air Emissions Estimate
24590-G04B-F00012 Rev 13 (Revised12/23/2015) Ref: 24590-WTP-3DP-G04B-00037, 24590-WTP-GPG-ENG-0127
Table 7-22 “DFLAW Organic and PIC COPC Emissions Estimate.xlsx” Case 1: Vessel Vent Streams
Worksheet Title Cell Location
Property Calculation Method
Notes
Henry’s Law U7 = DEP system vessel pressure, in atm
Assumption 6.1.10
Henry’s Law H5:H11 = Mole fraction COPC i in the vapor phase
Equation 44
Henry’s Law U8 , = Total mass flowrate of the DVP system, in lb/hr
Assumption 6.1.4
Henry’s Law U9 = Average molecular weight of air, g/mol
Input 2.8
Henry’s Law I5:I11
, , = Vapor phase mass flow rate of COPC i in vessel vent stream, in g/sec
Equation 45
7.2.4.1.2 Case 2: Evaporator Vent Stream
The vapor emissions from the evaporator system vent are estimated separately from the vessel vent streams due to differing operating pressure and the inclusion of condensers in the evaporator overheads. The evaporator system vents from the after-condenser. The vapor emissions from the evaporator separator vessel are estimated using a Henry’s Law analysis.

CALCULATION SHEET PROJECT: RPP-WTPJOB NO.: 24590
BY: William Hix CALC NO.: 24590-BOF-M4C-DEP-00001 DATE: 6/6/2016 SHEET REV: B
SHEET NO.: 88SUBJECT: DFLAW Effluent Management Facility Air Emissions Estimate
24590-G04B-F00012 Rev 13 (Revised12/23/2015) Ref: 24590-WTP-3DP-G04B-00037, 24590-WTP-GPG-ENG-0127
Table 7-23 “DFLAW Organic and PIC COPC Emissions Estimate.xlsx” Case 2: Evaporator Vent Stream
Worksheet Title Cell Location
Property Calculation Method
Notes
Henry’s Law U10 Pevap = DEP Evaporator nominal operating pressure, in atm
Assumption 6.1.9
Henry’s Law K5:K11 = Mole fraction COPC i in the vapor phase
Equation 44
Henry’s Law U14 , = Total volumetric flowrate of the evaporator overheads stream, in gpm
Assumption 6.1.8
Henry’s Law U12 = Molecular weight of water, in g/mol
Input 2.7
Henry’s Law U13 = Density of water, in g/L Equation 47
Henry’s Law U11 Tevap = Normal operating temperature of the DEP evaporator, °C
Assumption 6.1.9
Henry’s Law L5:L11 , , = Vapor phase mass flow rate of COPC i in evaporator overheads stream, in g/sec
Equation 46
Henry’s Law U15 , = VOCs MDR for primary condenser
Assumption 6.1.14
Henry’s Law U16 , = VOCs MDR for inter-condenser
Assumption 6.1.14
Henry’s Law U17 , = VOCs MDR for primary condenser
Equation 48
Henry’s Law M5:M11 , _ , = Vapor phase mass flowrate of COPC i in the evaporator vent stream, g/sec
Equation 49
7.2.4.1.3 Henry’s Law Analysis Emissions and Mass Check
The unabated emissions based on the Henry’s Law analyses from Case 1 and Case 2 are combined to give the total unabated emissions. In some cases, , , may exceed , , (from Equation 30 in Section 7.2.1.5). Since , , is based on the emission of the entire mass of the vapor phase of a COPC that is flushed to the DEP system, values of , , that exceed
, , will be capped at the value for , , .

CALCULATION SHEET PROJECT: RPP-WTPJOB NO.: 24590
BY: William Hix CALC NO.: 24590-BOF-M4C-DEP-00001 DATE: 6/6/2016 SHEET REV: B
SHEET NO.: 89SUBJECT: DFLAW Effluent Management Facility Air Emissions Estimate
24590-G04B-F00012 Rev 13 (Revised12/23/2015) Ref: 24590-WTP-3DP-G04B-00037, 24590-WTP-GPG-ENG-0127
Table 7-24 “DFLAW Organic and PIC COPC Emissions Estimate.xlsx” Case 1: Vessel Vent Streams
Worksheet Title Cell Location
Property Calculation Method
Notes
Henry’s Law O5:O11 , , = Unabated vapor emissions of COPC i, in g/sec
Equation 50 If , , is greater than
, , (from Worksheet “Feed Organic COPCs – Calc” Column Q) then limit value to , , .
Henry’s Law P5:P11 , , = Abated vapor phase emissions of COPC i, in g/sec
Same as , ,
Assumption 6.2.10
The values for , , and , , for the COPCs evaluated in the “Henry’s Law” worksheet are manually entered in the corresponding cells in Columns F and J of Worksheet “Organic Summary Table”. Then the total unabated emissions of these COPCs are compared again to the WAC 173-460-150 de minimis values. The following table shows the results: Table 7-25 Post Henry’s Law Comparison to De Minimis Values
CAS # COPC
De minimis emissions limit for COPC i , standardized to lb/yr
Feed Organic COPCs - Total Unabated Emissions of COPC i, in lb/yr
Difference: Feed Organic COPC minus de minimis, in lb/yr
88‐06‐2 2,4,6‐Trichlorophenol 4.80E‐01 1.17E‐01 ‐3.63E‐01
121‐14‐2 2,4‐Dinitrotoluene 1.07E‐01 1.58E‐03 ‐1.05E‐01
91‐20‐3 Naphthalene 2.82E‐01 3.68E+00 3.40E+00
62‐75‐9 n‐Nitrosodimethylamine 2.08E‐03 1.46E‐04 ‐1.93E‐03
621‐64‐7 n‐Nitrosodi‐n‐propylamine 4.80E‐03 3.40E‐02 2.92E‐02
59‐89‐2 n‐Nitrosomorpholine 5.05E‐03 8.43E‐04 ‐4.21E‐03
1336‐36‐3 Polychlorinated Biphenyls, NOS 1.68E‐02 1.80E+00 1.79E+00
The comparison shows that Naphthalene (91-20-3), n-Nitrosodi-n-proylamine (621-64-7), and Total PCBs (1336-36-3) are the only organic COPCs that exceed their de minimis values. 7.2.4.2 Adjustment of COPCs with Zero Emissions
7.2.4.2.1 Adjustment of PIC COPCs with Zero Emissions
To calculate the average non-zero unabated particulate emissions rate for PIC COPCs, first Column E in “DFLAW Organic and PIC COPC Emissions Estimate.xlsx” Worksheet “PIC COPCs – Calc” is filtered to hide the PIC COPCs with a vapor phase type. The average unabated particulate emissions (Column K) of the remaining particle/particle-bound PIC COPCs is calculated in Cell K215. The resulting average value is then assigned in Column K to each of the vapor phase type PIC COPCs and subsequently treated

CALCULATION SHEET PROJECT: RPP-WTPJOB NO.: 24590
BY: William Hix CALC NO.: 24590-BOF-M4C-DEP-00001 DATE: 6/6/2016 SHEET REV: B
SHEET NO.: 90SUBJECT: DFLAW Effluent Management Facility Air Emissions Estimate
24590-G04B-F00012 Rev 13 (Revised12/23/2015) Ref: 24590-WTP-3DP-G04B-00037, 24590-WTP-GPG-ENG-0127
as a particulate emission for calculation of abated emissions in Column L (Assumption 6.2.27). These adjusted results are then reported on the PIC COPC summary table (Table 8-5) for PIC COPCs and the feed organic COPC summary table (Table 8-4) for Feed/PIC COPCs. 7.2.4.2.2 Adjustment of Feed Organic COPCs with Zero Emissions
To calculate the average non-zero unabated vapor emissions rate for feed COPCs, first Column F in “DFLAW Organic and PIC COPC Emissions Estimate.xlsx” Worksheet “Organic Summary Table” is filtered to hide the feed COPCs without Tank Farm Average Ratios, indicated by a vapor emissions rate of 0 g/s in Column F. The average unabated vapor emissions rate of the remaining feed organic COPCs in Column F is calculated in Cell F152. The resulting average value is then assigned in Column F to each of the feed organic COPCs without Tank Farm Average Ratios (Assumption 6.2.28). These adjusted results are then used to determine the unabated total emissions and abated vapor/total emissions for these COPCs. 7.2.4.2.3 Exceeded De Minimis Values
Due to the adjustments of PICs and feed organic COPCs with zero emissions, some of the adjusted COPCs have unabated total emissions exceeding the de minimis emissions limits for TAPs established in WAC 173-460-150 (Input 2.13), based on a comparison to the limits using the worksheet “WAC 173-460-150”. The following table shows the adjusted feed organic COPCs with unabated total emissions exceeding the de minimis emissions limits.

CALCULATION SHEET PROJECT: RPP-WTPJOB NO.: 24590
BY: William Hix CALC NO.: 24590-BOF-M4C-DEP-00001 DATE: 6/6/2016 SHEET REV: B
SHEET NO.: 91SUBJECT: DFLAW Effluent Management Facility Air Emissions Estimate
24590-G04B-F00012 Rev 13 (Revised12/23/2015) Ref: 24590-WTP-3DP-G04B-00037, 24590-WTP-GPG-ENG-0127
Table 7-26 Adjusted Feed Organic COPCs Exceeding De Minimis Values
CAS # COPC
De minimis emissions limit for COPC i , standardized to lb/yr
Feed Organic COPCs - Total Unabated Emissions of COPC i, in lb/yr
Difference: Feed Organic COPC minus de minimis, in lb/yr
56‐49‐5 3‐Methylcholanthrene 1.53E‐03 1.17E+00 1.17E+00
3697‐24‐3 5‐Methylchrysene 8.72E‐03 1.17E+00 1.16E+00
602‐87‐9 5‐Nitroacenaphthene 2.59E‐01 1.17E+00 9.14E‐01
60‐35‐5 Acetamide 4.80E‐01 1.17E+00 6.93E‐01
75‐27‐4 Bromodichloromethane 2.59E‐01 1.17E+00 9.14E‐01
72‐55‐9 DDE 9.88E‐02 1.17E+00 1.07E+00
117‐81‐7 Di(2‐ethylhexyl)phthalate 4.00E‐01 1.17E+00 7.73E‐01
226‐36‐8 Dibenz[a,h]acridine 8.72E‐02 1.17E+00 1.09E+00
224‐42‐0 Dibenz[a,j]acridine 8.72E‐02 1.17E+00 1.09E+00
192‐65‐4 Dibenzo[a,e]pyrene 8.72E‐03 1.17E+00 1.16E+00
189‐64‐0 Dibenzo[a,h]pyrene 8.72E‐04 1.17E+00 1.17E+00
189‐55‐9 Dibenzo[a,i]pyrene 8.72E‐04 1.17E+00 1.17E+00
191‐30‐0 Dibenzo[a,l]pyrene 8.72E‐04 1.17E+00 1.17E+00
193‐39‐5 Indeno[1,2,3‐cd]pyrene 8.72E‐02 1.17E+00 1.09E+00
10595‐95‐6 n‐Nitroso‐n‐methylethylamine
1.53E‐03 1.17E+00 1.17E+00
57117‐31‐4 2,3,4,7,8‐Pentachlorodibenzofuran
5.05E‐07 1.70E‐06 1.19E‐06
70648‐26‐9 1,2,3,4,7,8‐Hexachlorodibenzofuran
2.52E‐06 2.84E‐06 3.21E‐07

CALCULATION SHEET PROJECT: RPP-WTPJOB NO.: 24590
BY: William Hix CALC NO.: 24590-BOF-M4C-DEP-00001 DATE: 6/6/2016 SHEET REV: B
SHEET NO.: 92SUBJECT: DFLAW Effluent Management Facility Air Emissions Estimate
24590-G04B-F00012 Rev 13 (Revised12/23/2015) Ref: 24590-WTP-3DP-G04B-00037, 24590-WTP-GPG-ENG-0127
7.3 Inorganic COPC Emissions
The inorganic COPC emissions estimate calculation Excel spreadsheet with the file name “DFLAW Inorganic and PIC COPC Emissions Estimate.xlsx” is included in Attachment C. The following section describes how the spreadsheet is used to estimate organic COPC emissions. 7.3.1 Feed Inorganic COPC Emissions
7.3.1.1 COPC Maximum Batch Masses, Mass Fractions, and Concentrations
The maximum batch mass fraction and concentration of each feed inorganic COPC is calculated using the Excel spreadsheet titled “DFLAW Inorganic COPC Emissions Estimate.xlsx” shown in Attachment C. The following table describes how these values are calculated within the spreadsheet:

CALCULATION SHEET PROJECT: RPP-WTPJOB NO.: 24590
BY: William Hix CALC NO.: 24590-BOF-M4C-DEP-00001 DATE: 6/6/2016 SHEET REV: B
SHEET NO.: 93SUBJECT: DFLAW Effluent Management Facility Air Emissions Estimate
24590-G04B-F00012 Rev 13 (Revised12/23/2015) Ref: 24590-WTP-3DP-G04B-00037, 24590-WTP-GPG-ENG-0127
Table 7-27 “DFLAW Inorganic COPC Emissions Estimate.xlsx” Calculation of Maximum Batch Masses, Mass Fractions, and Concentrations
Worksheet Title Cell Location Property Calculation Method Notes Feed Inorganic COPCs – Calc
C5:C47 = Tank farm ratio for COPC i, g COPC / g Na
Ref. 9.2
Feed Inorganic COPCs – Calc
S5 , = Maximum batch amount of Na in DFLAW Bounding Feed Vector, in kmols
Attachment G Sodium amounts in each DFLAW feed batch from the bounding DFLAW Feed Vector provided in Ref. 9.2
Feed Inorganic COPCs – Calc
S6 = Molecular weight of sodium, in g/mol
Input 2.5
Feed Inorganic COPCs – Calc
D5:D47 = Maximum feed vector batch mass of COPC i, in g
Equation 51 For Hg (Cell D20) see Section 7.3.1.2.1
Feed Inorganic COPCs – Calc
S7 , = Average total feed vector batch volume, in gal
Attachment G Volumes of each DFLAW feed batch from the bounding DFLAW Feed Vector provided in Ref. 9.2
Feed Inorganic COPCs – Calc
S8 , = Average total vector batch density, in g/cc
Attachment G Densities of each DFLAW feed batch from the bounding DFLAW Feed Vector provided in Ref. 9.2
Feed Inorganic COPCs – Calc
S9 , = Average total feed vector batch mass, in g
Equation 9
Feed Inorganic COPCs – Calc
E5:E47 = Maximum feed vector batch mass fraction of COPC i
Equation 10
Feed Inorganic COPCs – Calc
F5:F47 = Maximum feed vector batch concentration of COPC i, in g/L
Equation 11
7.3.1.2 Particle Phase Feed Inorganic COPC Emissions
The particle phase feed inorganic COPC emissions are calculated using the Excel spreadsheet titled “DFLAW Inorganic COPC Emissions Estimate.xlsx” shown in Attachment C . The following table describes how these values are calculated within the spreadsheet:

CALCULATION SHEET PROJECT: RPP-WTPJOB NO.: 24590
BY: William Hix CALC NO.: 24590-BOF-M4C-DEP-00001 DATE: 6/6/2016 SHEET REV: B
SHEET NO.: 94SUBJECT: DFLAW Effluent Management Facility Air Emissions Estimate
24590-G04B-F00012 Rev 13 (Revised12/23/2015) Ref: 24590-WTP-3DP-G04B-00037, 24590-WTP-GPG-ENG-0127
Table 7-28 “DFLAW Organic and PIC COPC Emissions Estimate.xlsx” Particle Phase Feed Inorganic COPC Emissions
Worksheet Title Cell Location
Property Calculation Method
Notes
Feed Inorganic COPCs – Calc
S10 , = Total mass flowrate of the DVP system except for evaporator, in lb/hr
Assumption 6.1.4
Feed Inorganic COPCs – Calc
S11 = Entrainment factor for DEP vessels, in g entrained material / g air
Input 2.3 Assumption 6.2.3
Feed Inorganic COPCs – Calc
S12 , = Mass flowrate of the evaporator vent stream, in lb/hr
Assumption 6.1.4
Feed Inorganic COPCs – Calc
S13 = Entrainment factor for DEP vessels, in g entrained material / g air
Input 2.20 Assumption 6.2.30
Feed Inorganic COPCs – Calc
S14 , = Total mass flowrate of entrained material, in g/min
Equation 12
Feed Inorganic COPCs – Calc
H5:H47 (Except H11, H14, H26)
, = Entrained mass flowrate of COPC i, in g/min
Equation 31 Emissions of CS2, CN, and NH3 are evaluated separately
Feed Inorganic COPCs – Calc
I5:I47 (Except I11, I14, I26)
, , = Unabated particulate emissions of COPC i, in g/sec
Equation 32 Emissions of CS2, CN, and NH3 are evaluated separately
Feed Inorganic COPCs – Calc
S15 , = Decontamination factor of primary HEPA filter
Assumption 6.2.10
Feed Inorganic COPCs – Calc
S16 , = Decontamination factor of secondary HEPA filter
Assumption 6.2.10
Feed Inorganic COPCs – Calc
J5:J47 (Except J11, J14, J26)
, , = Abated particulate emissions of COPC i, in g/sec
Equation 33 Emissions of CS2, CN, and NH3 are evaluated separately
7.3.1.2.1 Mercury
First the mass of Hg using Equation 51 is calculated.
∗ , ∗ ∗ 1000 4.18E‐5
∗ 3063.6 ∗ 22.9898 ∗ 1000
2.94E3g

CALCULATION SHEET PROJECT: RPP-WTPJOB NO.: 24590
BY: William Hix CALC NO.: 24590-BOF-M4C-DEP-00001 DATE: 6/6/2016 SHEET REV: B
SHEET NO.: 95SUBJECT: DFLAW Effluent Management Facility Air Emissions Estimate
24590-G04B-F00012 Rev 13 (Revised12/23/2015) Ref: 24590-WTP-3DP-G04B-00037, 24590-WTP-GPG-ENG-0127
Next the mass of Hg at the ICD-30 limit is calculated using Equation 52.
, , ∗ , ∗ ∗ 1000 1.4E‐5
∗ 3063.6 ∗ 200.59 ∗ 1000
, 8.60E3g
Since , is greater than , it will be used to estimate emissions through entrainment. The value for , is entered into Cell D20 of Excel spreadsheet “DFLAW Inorganic COPC Emissions Estimate.xlsx” Worksheet “Feed Inorganic COPCs – Calc” and the emissions of Hg through entrainment are calculated using the same method as other particle phase inorganic feed COPCs. 7.3.1.3 Vapor Phase Feed Inorganic COPC Emissions
Ammonia, carbon disulfide, and cyanide are emitted in the vapor phase (Assumption 6.2.21 and 6.2.16). As noted in Section 5.3.1.3, carbon disulfide is a feed organic COPC and its emissions will be reported with feed organic COPCs and not feed inorganic COPCs. 7.3.1.3.1 Carbon Disulfide, Ammonia, and Cyanide in the Feed Flush Line
The vapor phase feed inorganic COPC emissions are calculated using the Excel spreadsheet titled “DFLAW Inorganic COPC Emissions Estimate.xlsx” shown in Attachment C . The following table describes how these values are calculated within the spreadsheet:

CALCULATION SHEET PROJECT: RPP-WTPJOB NO.: 24590
BY: William Hix CALC NO.: 24590-BOF-M4C-DEP-00001 DATE: 6/6/2016 SHEET REV: B
SHEET NO.: 96SUBJECT: DFLAW Effluent Management Facility Air Emissions Estimate
24590-G04B-F00012 Rev 13 (Revised12/23/2015) Ref: 24590-WTP-3DP-G04B-00037, 24590-WTP-GPG-ENG-0127
Table 7-29 “DFLAW Inorganic COPC Emissions Estimate.xlsx” Vapor Phase Feed Inorganic COPC Emissions
Worksheet Title Cell Location
Property Calculation Method
Notes
Feed Inorganic COPCs – Calc
S17 = Total volume of LAW feed line flush, in gal
Input 2.4, Assumption 6.1.3
Feed Inorganic COPCs – Calc
S18 = Flush dilution factor
Assumption 6.1.2
Feed Inorganic COPCs – Calc
S19 = Volume of residual feed in a LAW feed line flush, in L
Equation 16
Feed Inorganic COPCs – Calc
S20 = Frequency of LAW feed line flush, in 1/hr
Assumption 6.1.3
Feed Inorganic COPCs – Calc
L11, L14, L26
, = Mass of COPC i flushed to DEP-VSL-0001 annually, in g/yr
Equation 17
Feed Inorganic COPCs – Calc
M11, M14, M26
, , = Unabated vapor phase emissions of COPC i, in g/sec
Equation 30
Feed Inorganic COPCs – Calc
N11, N14, N26
, , = Abated vapor phase emissions of COPC i, in g/sec
Same as , ,
Assumption 6.2.10
7.3.1.3.2 Ammonia Emissions due to Caustic Scrubber Effluent
The vapor phase emissions due to NH3 in the feed line flush are accounted for in Table 7-29 above with the cell locations associated with Row 26. The vapor phase emissions from DEP-VSL-00004A/B and DEP-VSL-00005A/B due to NH3 received from the caustic scrubber effluent are estimated using a Henry’s Law analysis. This analysis is shown in the Excel spreadsheet titled “DFLAW Inorganic COPC Emissions Estimate.xlsx” shown in Attachment C. The following table describes how these values are calculated within the spreadsheet: Table 7-30 “DFLAW Inorganic COPC Emissions Estimate.xlsx” NH3 Emissions due to Caustic Scrubber
Effluent
Worksheet Title Cell Location
Property Calculation Method
Notes
LVP21 NH3 F4 , = Batch transfer volume from LVP-TK-00001 to DEP-VSL-00004A/B, in gal
Input 2.15
LVP21 NH3 F5 = Frequency of LVP-TK-00001 transfer, in 1/hr
Input 2.16
LVP21 NH3 F6 , = Annual volume transferred in LVP21, in L
Equation 53 Assumption 6.2.22

CALCULATION SHEET PROJECT: RPP-WTPJOB NO.: 24590
BY: William Hix CALC NO.: 24590-BOF-M4C-DEP-00001 DATE: 6/6/2016 SHEET REV: B
SHEET NO.: 97SUBJECT: DFLAW Effluent Management Facility Air Emissions Estimate
24590-G04B-F00012 Rev 13 (Revised12/23/2015) Ref: 24590-WTP-3DP-G04B-00037, 24590-WTP-GPG-ENG-0127
Worksheet Title Cell Location
Property Calculation Method
Notes
LVP21 NH3 F7 = Density of LVP21, in g/L Input 2.17
LVP21 NH3 F8 , = Mass fraction of NH3 in LVP21
Attachment F, Table F-2
Assumption 6.1.16
LVP21 NH3 F9 , = Annual mass of NH3 in LVP21, in g
Equation 54
LVP21 NH3 F10 , = Volumetric flowrate of DEP evaporator feed stream, in gpm
Assumption 6.1.7
LVP21 NH3 F11 = Evaporator volumetric concentration factor
Assumption 6.1.17
LVP21 NH3 F12 , = Annual volume received in DEP-VSL-00004A/B, in gal
Equation 55
LVP21 NH3 F13 = Concentration of NH3 in DEP-VSL-00004A/B, in g/L
Equation 56 Assumption 6.1.18
LVP21 NH3 F14 , = Henry’s Law constant for NH3, in atm*m3/mol
Input 2.18
LVP21 NH3 F15 = Molecular weight of NH3, in g/mol
Input 2.9
LVP21 NH3 F16 = Vessel operating pressure, in atm
Assumption 6.1.10
LVP21 NH3 F17 = Mole fraction of NH3 in the vapor phase
Equation 44
LVP21 NH3 F18 = Mass flowrate of the vessel vent streams from DEP-VSL-00004A/B and DEP-VSL-00005A/B, in lb/hr
Assumption 6.1.19
LVP21 NH3 F19 = Average molecular weight of air, in g/mol
Input 2.8
LVP21 NH3 F20 , , = Vapor phase mass flow rate of NH3 in vessel vent streams from DEP-VSL-00004A/B and DEP-VSL-00005A/B, in g/sec
Equation 45
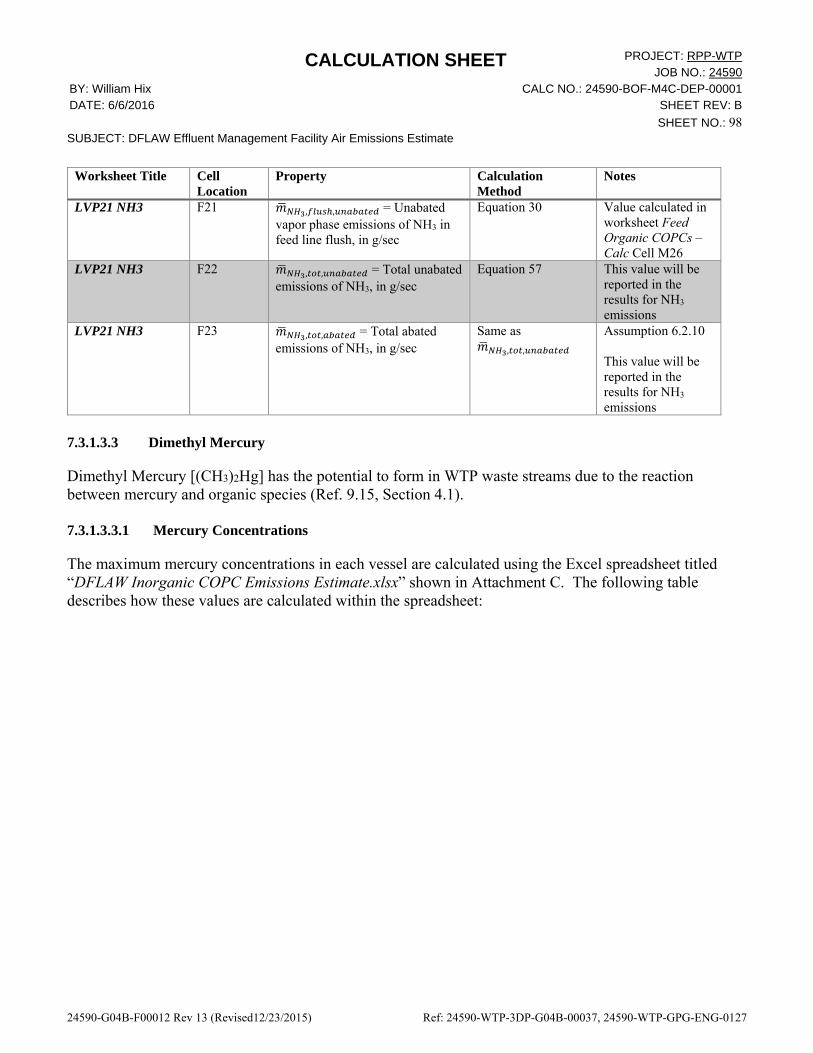
CALCULATION SHEET PROJECT: RPP-WTPJOB NO.: 24590
BY: William Hix CALC NO.: 24590-BOF-M4C-DEP-00001 DATE: 6/6/2016 SHEET REV: B
SHEET NO.: 98SUBJECT: DFLAW Effluent Management Facility Air Emissions Estimate
24590-G04B-F00012 Rev 13 (Revised12/23/2015) Ref: 24590-WTP-3DP-G04B-00037, 24590-WTP-GPG-ENG-0127
Worksheet Title Cell Location
Property Calculation Method
Notes
LVP21 NH3 F21 , , = Unabated vapor phase emissions of NH3 in feed line flush, in g/sec
Equation 30 Value calculated in worksheet Feed Organic COPCs – Calc Cell M26
LVP21 NH3 F22 , , = Total unabated emissions of NH3, in g/sec
Equation 57 This value will be reported in the results for NH3 emissions
LVP21 NH3 F23 , , = Total abated emissions of NH3, in g/sec
Same as , ,
Assumption 6.2.10 This value will be reported in the results for NH3 emissions
7.3.1.3.3 Dimethyl Mercury
Dimethyl Mercury [(CH3)2Hg] has the potential to form in WTP waste streams due to the reaction between mercury and organic species (Ref. 9.15, Section 4.1). 7.3.1.3.3.1 Mercury Concentrations
The maximum mercury concentrations in each vessel are calculated using the Excel spreadsheet titled “DFLAW Inorganic COPC Emissions Estimate.xlsx” shown in Attachment C. The following table describes how these values are calculated within the spreadsheet:

CALCULATION SHEET PROJECT: RPP-WTPJOB NO.: 24590
BY: William Hix CALC NO.: 24590-BOF-M4C-DEP-00001 DATE: 6/6/2016 SHEET REV: B
SHEET NO.: 99SUBJECT: DFLAW Effluent Management Facility Air Emissions Estimate
24590-G04B-F00012 Rev 13 (Revised12/23/2015) Ref: 24590-WTP-3DP-G04B-00037, 24590-WTP-GPG-ENG-0127
Table 7-31 “DFLAW Inorganic COPC Emissions Estimate.xlsx” Mercury Concentrations
Worksheet Title Cell Location
Property Calculation Method
Notes
DMHg S4 , = Maximum feed vector batch concentration of Hg, in g/L
Equation 11
DMHg S5 = Volume of residual feed in a LAW feed line flush, in L
Equation 16
DMHg S6 = Total volume of LAW feed line flush, in gal
Input 2.4, Assumption 6.1.3
DMHg C5, C6 , = Concentration of Hg in feed line flush to DEP-VSL-00001, in g/L
Equation 58 Assumption 6.1.20 Concentration of DEP-VSL-00001 and DEP-VSL-00002
DMHg S7 , = Volumetric flowrate of DEP evaporator feed stream, in gpm
Assumption 6.1.7
DMHg S8 , = Mass distribution ratio of Hg in evaporator
Assumption 6.1.13
DMHg S9 = Evaporator volumetric concentration factor
Assumption 6.1.17
DMHg C7, C8 , = Concentration of Hg in evaporator concentrate, in g/L
Equation 59 Concentration of DEP-EVAP-00001 and DEP-VSL-00003A/B/C
DMHg C9, C10 , = Concentration of Hg in evaporator condensate, in g/L
Equation 60 Assumption 6.1.21 Concentration of DEP-VSL-00004A/B and DEP-VSL-00005A/B
7.3.1.3.3.2 Vessel Operating Temperatures
The DEP vessel nominal operating temperatures are used in the Excel spreadsheet titled “DFLAW Inorganic COPC Emissions Estimate.xlsx” shown in Attachment C. The following table describes how these values are used within the spreadsheet:

CALCULATION SHEET PROJECT: RPP-WTPJOB NO.: 24590
BY: William Hix CALC NO.: 24590-BOF-M4C-DEP-00001 DATE: 6/6/2016 SHEET REV: B
SHEET NO.: 100SUBJECT: DFLAW Effluent Management Facility Air Emissions Estimate
24590-G04B-F00012 Rev 13 (Revised12/23/2015) Ref: 24590-WTP-3DP-G04B-00037, 24590-WTP-GPG-ENG-0127
Table 7-32 “DFLAW Inorganic COPC Emissions Estimate.xlsx” Vessel Temperatures
Worksheet Title Cell Location
Property Calculation Method
Notes
DMHg D5:D10 = Vessel j Nominal Temperature, in °F
Assumptions 6.1.22 through 6.1.27
DMHg E5:E10 = Vessel j Nominal Temperature, in K
Convert °F to K
7.3.1.3.3.3 Vessel Residence Time
The vessel residence times are calculated using the Excel spreadsheet titled “DFLAW Inorganic COPC Emissions Estimate.xlsx” shown in Attachment C. The following table describes how these values are calculated within the spreadsheet: Table 7-33 “DFLAW Inorganic COPC Emissions Estimate.xlsx” Mercury Concentrations
Worksheet Title Cell Location
Property Calculation Method
Notes
DMHg F5:F10, except F7
= Vessel j batch cycle time, in hr
Assumption 6.1.28
DMHg G5:G10 = Quantity of vessel j e.g. 2
DMHg H5:H10, except H7
= Residence time for vessel j, in hr
Equation 61
DMHg S10 , = Volume of DEP evaporator recirculation loop, in gal
Assumption 6.1.29
DMHg S7 , = Volumetric flowrate of DEP evaporator feed stream, in gpm
Assumption 6.1.7
DMHg H7 = Residence time for evaporator, in hr
Equation 62
7.3.1.3.3.4 Rate of Dimethyl Mercury Formation
The formation and emission rates of dimethyl mercury are calculated using the Excel spreadsheet titled “DFLAW Inorganic COPC Emissions Estimate.xlsx” shown in Attachment C. The following table describes how these values are calculated within the spreadsheet:
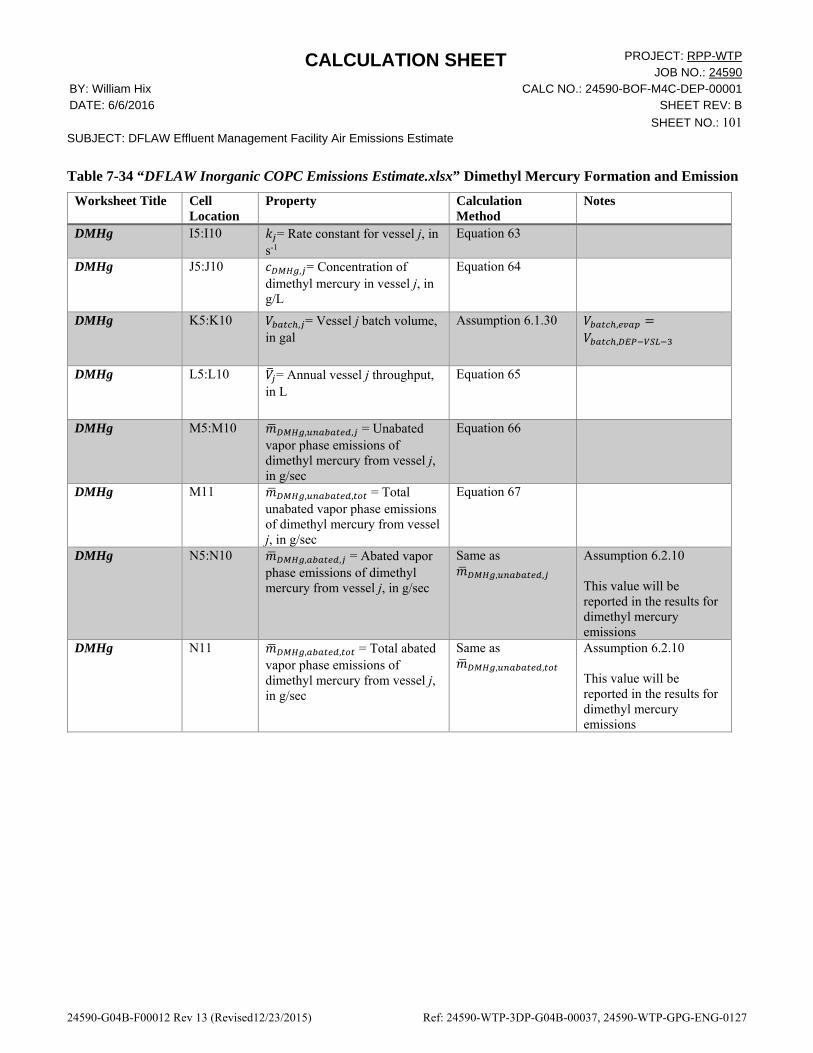
CALCULATION SHEET PROJECT: RPP-WTPJOB NO.: 24590
BY: William Hix CALC NO.: 24590-BOF-M4C-DEP-00001 DATE: 6/6/2016 SHEET REV: B
SHEET NO.: 101SUBJECT: DFLAW Effluent Management Facility Air Emissions Estimate
24590-G04B-F00012 Rev 13 (Revised12/23/2015) Ref: 24590-WTP-3DP-G04B-00037, 24590-WTP-GPG-ENG-0127
Table 7-34 “DFLAW Inorganic COPC Emissions Estimate.xlsx” Dimethyl Mercury Formation and Emission
Worksheet Title Cell Location
Property Calculation Method
Notes
DMHg I5:I10 = Rate constant for vessel j, in s-1
Equation 63
DMHg J5:J10 , = Concentration of dimethyl mercury in vessel j, in g/L
Equation 64
DMHg K5:K10 , = Vessel j batch volume, in gal
Assumption 6.1.30 ,
,
DMHg L5:L10 = Annual vessel j throughput, in L
Equation 65
DMHg M5:M10 , , = Unabated vapor phase emissions of dimethyl mercury from vessel j, in g/sec
Equation 66
DMHg M11 , , = Total unabated vapor phase emissions of dimethyl mercury from vessel j, in g/sec
Equation 67
DMHg N5:N10 , , = Abated vapor phase emissions of dimethyl mercury from vessel j, in g/sec
Same as , ,
Assumption 6.2.10 This value will be reported in the results for dimethyl mercury emissions
DMHg N11 , , = Total abated vapor phase emissions of dimethyl mercury from vessel j, in g/sec
Same as , ,
Assumption 6.2.10 This value will be reported in the results for dimethyl mercury emissions

CALCULATION SHEET PROJECT: RPP-WTPJOB NO.: 24590
BY: William Hix CALC NO.: 24590-BOF-M4C-DEP-00001 DATE: 6/6/2016 SHEET REV: B
SHEET NO.: 102SUBJECT: DFLAW Effluent Management Facility Air Emissions Estimate
24590-G04B-F00012 Rev 13 (Revised12/23/2015) Ref: 24590-WTP-3DP-G04B-00037, 24590-WTP-GPG-ENG-0127
7.3.2 Stack Inorganic COPC Emissions
Stack inorganic COPCs, except for particulate matter and methyl mercury, are gases or acids that are mainly produced during chemical reactions or thermal decomposition. These COPCs are:
Nitrogen dioxide Carbon dioxide Carbon monoxide Ozone Sulfur dioxide Hydrogen chloride Hydrogen Fluoride Fluorine gas Chlorine gas
The main source for these COPCs at WTP is the LAW and HLW melters. For example, in the existing WTP emissions estimate (Ref. 9.14, Table 18) the only streams with emissions of NO2, CO, SO2, HCl, and HF are the LAW and HLW offgas streams. Note that CO2, O3, F2, and Cl2 were not included in the existing WTP emissions estimate. It is assumed that there will not be the necessary thermal or kinetic conditions in the DEP system to produce significant amounts of the stack inorganic COPCs (Assumption 6.1.31). Therefore emissions of these COPCs are zero. Monomethyl mercury is assumed to exist primarily in the liquid phase at WTP and its emissions are therefore grouped with the overall mercury emissions calculated in Section 7.3.1.2.1 (Assumption 6.2.25). Total particulate matter emissions are the sum of the results for particulate emissions of radionuclides, feed organics, PICs, and feed inorganics. The total particulate emissions are reported in the “DFLAW Inorganic COPC Emissions Estimate.xlsx” Worksheet “Inorganic Summary Table” shown in Attachment C. Total unabated particulate emissions of feed inorganic COPCs are the sum of Column I ( , , ) in the “DFLAW Inorganic COPC Emissions Estimate.xlsx” Worksheet “Feed Inorganic COPCs - Calc”. Total abated particulate emissions of inorganic COPCs are the sum of Column J ( , ) in the “DFLAW Inorganic COPC Emissions Estimate.xlsx” Worksheet “Feed Inorganic COPCs - Calc”. Total unabated particulate emissions of radionuclide COPCs on a mass basis are the sum of Column K ( , ) in the “DFLAW Radionuclide COPC Emissions Estimate.xlsx” Worksheet “Radionuclide COPCs - Calc”. Total abated particulate emissions of radionuclide COPCs on a mass basis are the total unabated particulate emissions divided by , and , (similar to Equation 33). Total unabated particulate emissions of feed organic COPCs are the sum of Column G ( , , ) in the “DFLAW Organic and PIC COPC Emissions Estimate.xlsx” Worksheet “Organic Summary Table”. Total abated particulate emissions of inorganic COPCs are the sum of Column K ( , , ) in the “DFLAW Inorganic COPC Emissions Estimate.xlsx” Worksheet “Organic Summary Table”.

CALCULATION SHEET PROJECT: RPP-WTPJOB NO.: 24590
BY: William Hix CALC NO.: 24590-BOF-M4C-DEP-00001 DATE: 6/6/2016 SHEET REV: B
SHEET NO.: 103SUBJECT: DFLAW Effluent Management Facility Air Emissions Estimate
24590-G04B-F00012 Rev 13 (Revised12/23/2015) Ref: 24590-WTP-3DP-G04B-00037, 24590-WTP-GPG-ENG-0127
Total unabated particulate emissions of PIC COPCs are the sum of Column E ( , , ) in the “DFLAW Organic and PIC COPC Emissions Estimate.xlsx” Worksheet “PIC Summary Table”. Total abated particulate emissions of inorganic COPCs are the sum of Column F ( , , ) in the “DFLAW Inorganic COPC Emissions Estimate.xlsx” Worksheet “PIC Summary Table”. 7.3.3 Inorganic COPC Summary and Comparison to De Minimis Emissions Limits
The results from Sections 7.3.1 and 7.3.2 are summarized in “DFLAW Inorganic COPC Emissions Estimate.xlsx” Worksheet “Inorganic Summary Table” shown in Attachment C. The total unabated emissions values are compared to de minimis emissions limits for TAPs established in WAC 173-460-150 (Input 2.13), using the worksheet “WAC 173-460-150”. Table 7-35 “DFLAW Inorganic COPC Emissions Estimate.xlsx” De Minimis Value Comparison
Worksheet Title Cell Location
Property Calculation Method
Notes
WAC 173-460-150 G5:G400 , = de minimis emissions limit for COPC i , lb/averaging period
Input 2.13
WAC 173-460-150 I5:I400 , = de minimis emissions limit for COPC i , standardized to lb/yr
Equation 38
WAC 173-460-150 J5:J400 , , Inorganic COPCs – Total Unabated Emissions of COPC i , in lb/yr
Vlookup of Column D in “Inorganic Summary Table” worksheet
Converted from g/sec to lb/yr
WAC 173-460-150 L5:L400 Difference: Feed Inorganic COPC minus de minimis, in lb/yr
Column J minus Column I
The comparison in worksheet “WAC 173-460-150” showed that ammonia, cadmium, dimethyl mercury, and chromium (VI) exceed their de minimis values. Ammonia was already evaluated using a Henry’s Law method (Section 7.3.1.3.2) so it will not be reevaluated using Henry’s Law like the feed organic COPCs in Section 7.2.4.1. Cadmium will not be reevaluated using Henry’S Law because it is nonvolatile and emitted through entrainment. Dimethyl mercury will also not be reevaluated, because the de minimis value of 3.65E-97 lb/yr is essentially zero and a revaluation will not reduce the emissions to below that limit. Chromium (VI) is listed as a TAP in WAC 173-460-150, however only generic total chromium (without a specified oxidation state) is evaluated as a COPC in the emissions estimate. In order to provide a bounding estimate for chromium (VI) emissions to compare to the de minimis value, it is assumed that all chromium emitted is chromium (VI) (Assumption 6.2.29). Therefore, the total unabated emissions estimate for chromium is assigned to chromium (VI) and is shown in the table below as exceeding the de minimis value.

CALCULATION SHEET PROJECT: RPP-WTPJOB NO.: 24590
BY: William Hix CALC NO.: 24590-BOF-M4C-DEP-00001 DATE: 6/6/2016 SHEET REV: B
SHEET NO.: 104SUBJECT: DFLAW Effluent Management Facility Air Emissions Estimate
24590-G04B-F00012 Rev 13 (Revised12/23/2015) Ref: 24590-WTP-3DP-G04B-00037, 24590-WTP-GPG-ENG-0127
Table 7-36 Inorganic COPCs that Exceed De Minimis Value
CAS # COPC
De minimis emissions limit for COPC i , standardized to lb/yr
Feed Organic COPCs - Total Unabated Emissions of COPC i, in lb/yr
Difference: Feed Organic COPC minus de minimis, in lb/yr
7664‐41‐7 Ammonia 1.70E+02 7.00E+03 6.83E+03
7440‐43‐9 Cadmium & Compounds 2.28E‐03 2.82E‐02 2.59E‐02
18540‐29‐9 Chromium (VI) 6.40E‐05 1.00E+00 1.00E+00
593‐74‐8 Dimethyl mercury 3.65E‐97 3.67E‐02 3.67E‐02
8 Results and Conclusions
8.1 Discussion of Margin and Conservatism
In the absence of DFLAW-specific emissions estimates using the APPS model, this calculation uses a series of simplifying assumptions to provide a conservative estimate of the emissions of radionuclides from the DVP and ACV exhaust systems. These results will be verified by the results from the DFLAW-specific APPS model runs when they become available. The steady-state model will provide a stream-by-stream mass balance to estimate the emissions. Typically there is no margin included in process calculations. This calculation does apply conservatism in several places in order to bound the possible results from the DFLAW-specific APPS model runs. The main conservatisms included in this calculation are the following:
Use of the Tank Farm Average ratios and DFLAW Bounding Feed Vector to estimate COPC inventory received (Assumptions 6.2.1 and 6.2.2)
It is conservative and bounding to assume the mass fractions of COPCs emitted by entrainment do not decrease from the maximum expected feed value throughout the DEP system (Assumption 6.1.1, Assumption 6.1.33).
The nominal entrainment factor for free-falling aqueous solution (4E-5) is a conservative and representative for estimating particulate emissions from the DEP vessels, except for the evaporator (Assumption 6.2.3).
The entrainment factor prescribed in WAC 246-247-030 (21)(a)(ii) for liquids and particulate solids (1E-3) is conservative and bounding for the estimation of particulate emissions from the DEP evaporator (Assumption 6.2.30).
The dilution factor of is considered a conservative value for the approximation of the amount of residual
feed flushed to DEP-VSL-00001 (Assumption 6.1.2). It is assumed that all 14C received in the EMF is emitted as it is processed through the DEP system
(Assumption 6.2.4). It is assumed that the entire vapor fraction of each feed organic COPC received in DEP-VSL-00001
annually is emitted to the DEP vessel ventilation system as it is processed through the DEP system (Assumption 6.2.16).

CALCULATION SHEET PROJECT: RPP-WTPJOB NO.: 24590
BY: William Hix CALC NO.: 24590-BOF-M4C-DEP-00001 DATE: 6/6/2016 SHEET REV: B
SHEET NO.: 105SUBJECT: DFLAW Effluent Management Facility Air Emissions Estimate
24590-G04B-F00012 Rev 13 (Revised12/23/2015) Ref: 24590-WTP-3DP-G04B-00037, 24590-WTP-GPG-ENG-0127
Feed transfers from the LAWPS to LAW are assumed to occur continuously without a break between transfers (i.e. a transfer begins immediately after the preceding one is finished) (Assumption 6.2.5).
The two month duration of release used from Ref. 9.13 to estimate ACV Exhaust system emissions is conservative and bounding (Assumption 6.2.11).
Particle or particle-bound PIC COPCs that do not have generation rates reported in Ref. 9.15, Table 3 are assigned a generation rate equal to the maximum generation rate for a particle or particle-bound PIC COPC that does have a generation rate reported in Ref. 9.15, Table 3 (Assumption 6.2.17)
For ammonia emissions, the transfers from LVP-TK-00001 to DEP-VSL-00004A/B are assumed to occur continuously at the specified frequency and batch volume (Assumption 6.2.22).
Average feed vector batch volumes, densities, and masses are used in Equation 9 through Equation 11 to calculate conservative values for maximum feed vector batch mass fractions, , and concentations, . (Assumption 6.1.34).
In order to assign a bounding emissions estimate greater than 0 g/sec for the subset of PIC COPCs that have a vapor phase type, these COPCs are assumed to be emitted at the average non-zero unabated particulate emissions rate for PIC COPCs (Assumption 6.2.27).
In order to assign a bounding emissions estimate greater than 0 g/sec for the subset of feed organic COPCs without Tank Farms Average Ratios, these COPCs are assumed to be emitted at the average unabated vapor emissions rate for feed organic COPCs with Tank Farms Average Ratios (Assumption 6.2.28).
In order to compare estimated chromium (VI) emissions to the de minimis limit for chromium (VI), it is assumed that all chromium emitted is chromium (VI) (Assumption 6.2.29).
8.2 Emissions Summary
The results for the emissions of radionuclide COPCs are summarized in Table 8-8 summarizes the COPCs with unabated emissions estimates that exceed the WAC de minimis value.

CALCULATION SHEET PROJECT: RPP-WTPJOB NO.: 24590
BY: William Hix CALC NO.: 24590-BOF-M4C-DEP-00001 DATE: 6/6/2016 SHEET REV: B
SHEET NO.: 106SUBJECT: DFLAW Effluent Management Facility Air Emissions Estimate
24590-G04B-F00012 Rev 13 (Revised12/23/2015) Ref: 24590-WTP-3DP-G04B-00037, 24590-WTP-GPG-ENG-0127
Table 8-1 and Table 8-2. APQs for radionuclide COPCs are summarized in Table 8-3. The results for the emissions of feed organic and PIC COPCs are summarized in Table 8-4 and Table 8-5 respectively. The results for the emissions of inorganic COPCs are summarized inTable 8-6 and Table 8-7 . Table 8-8 summarizes the COPCs with unabated emissions estimates that exceed the WAC de minimis value.

CALCULATION SHEET PROJECT: RPP-WTPJOB NO.: 24590
BY: William Hix CALC NO.: 24590-BOF-M4C-DEP-00001 DATE: 6/6/2016 SHEET REV: B
SHEET NO.: 107SUBJECT: DFLAW Effluent Management Facility Air Emissions Estimate
24590-G04B-F00012 Rev 13 (Revised12/23/2015) Ref: 24590-WTP-3DP-G04B-00037, 24590-WTP-GPG-ENG-0127
Table 8-1 – Radionuclide COPC Emissions from DVP System
CAS # COPC
Unabated Stream Abated Stream
DEP15 DEP18
DEP Vessel Vent DEP Vessel Vent
Ci/yr % Contribution Ci/yr % Contribution
13967‐48‐1 106Ru 9.19E‐06 0% 4.60E‐11 0%
378253‐44‐2 113mCd 2.99E‐03 0% 1.50E‐08 0%
14234‐35‐6 125Sb 3.18E‐03 0% 1.59E‐08 0%
15832‐50‐5 126Sn 3.01E‐04 0% 1.50E‐09 0%
15046‐84‐1 129I 2.27E‐05 0% 1.13E‐10 0%
13967‐70‐9 134Cs 5.49E‐04 0% 2.75E‐09 0%
10045‐97‐3 137Cs 5.27E‐02 1% 2.64E‐07 0%
378253‐40‐8 137mBa 4.98E‐02 1% 2.49E‐07 0%
14762‐75‐5 14C (Note 1) 1.82E‐01 3% 1.82E‐01 99%
15715‐94‐3 151Sm 2.75E+00 38% 1.37E‐05 0%
14683‐23‐9 152Eu 6.97E‐04 0% 3.49E‐09 0%
15585‐10‐1 154Eu 3.70E‐03 0% 1.85E‐08 0%
14391‐16‐3 155Eu 1.96E‐02 0% 9.82E‐08 0%
13982‐63‐3 226Ra 7.64E‐09 0% 3.82E‐14 0%
14952‐40‐0 227Ac 2.92E‐06 0% 1.46E‐11 0%
15262‐20‐1 228Ra 5.11E‐06 0% 2.56E‐11 0%
15594‐54‐4 229Th 1.05E‐06 0% 5.26E‐12 0%
14331‐85‐2 231Pa 3.92E‐06 0% 1.96E‐11 0%
7440‐29‐1 232Th 5.11E‐06 0% 2.56E‐11 0%
14158‐29‐3 232U 6.49E‐06 0% 3.24E‐11 0%
13968‐55‐3 233U 3.29E‐05 0% 1.64E‐10 0%
13966‐29‐5 234U 1.82E‐04 0% 9.10E‐10 0%
15117‐96‐1 235U 3.49E‐07 0% 1.75E‐12 0%
13982‐70‐2 236U 5.00E‐06 0% 2.50E‐11 0%
13994‐20‐2 237Np 1.12E‐05 0% 5.62E‐11 0%
13981‐16‐3 238Pu 2.58E‐04 0% 1.29E‐09 0%
7440‐61‐1R 238U 1.66E‐04 0% 8.28E‐10 0%
15117‐48‐3 239Pu 4.84E‐03 0% 2.42E‐08 0%
14119‐33‐6 240Pu 1.06E‐03 0% 5.31E‐09 0%
14596‐10‐2 241Am 1.53E‐02 0% 7.67E‐08 0%
14119‐32‐5 241Pu 6.45E‐02 1% 3.22E‐07 0%
15510‐73‐3 242Cm 9.39E‐05 0% 4.70E‐10 0%
13982‐10‐0 242Pu 8.11E‐08 0% 4.05E‐13 0%
14993‐75‐0 243Am 7.09E‐06 0% 3.55E‐11 0%
15757‐87‐6 243Cm 1.33E‐06 0% 6.63E‐12 0%
13981‐15‐2 244Cm 2.92E‐05 0% 1.46E‐10 0%
10028‐17‐8 3H (Note 1) 2.17E‐03 0% 2.17E‐03 1%
14336‐70‐0 59Ni 1.24E‐03 0% 6.18E‐09 0%
10198‐40‐0 60Co 2.26E‐04 0% 1.13E‐09 0%
13981‐37‐8 63Ni 1.10E‐01 2% 5.52E‐07 0%
15758‐45‐9 79Se 1.10E‐04 0% 5.52E‐10 0%
10098‐97‐2 90Sr 1.97E+00 27% 9.87E‐06 0%
10098‐91‐6 90Y 1.97E+00 27% 9.87E‐06 0%
378782‐82‐2 93mNb 2.44E‐03 0% 1.22E‐08 0%
15751‐77‐6 93Zr 2.87E‐03 0% 1.44E‐08 0%
14133‐76‐7 99Tc 2.03E‐02 0% 1.02E‐07 0%
Total 7.24E+00 100% 1.85E‐01 100%
Note 1: COPC emitted in the vapor phase

CALCULATION SHEET PROJECT: RPP-WTPJOB NO.: 24590
BY: William Hix CALC NO.: 24590-BOF-M4C-DEP-00001 DATE: 6/6/2016 SHEET REV: B
SHEET NO.: 108SUBJECT: DFLAW Effluent Management Facility Air Emissions Estimate
24590-G04B-F00012 Rev 13 (Revised12/23/2015) Ref: 24590-WTP-3DP-G04B-00037, 24590-WTP-GPG-ENG-0127
Table 8-2 - Radionuclide COPC Emissions from ACV Exhaust System
CAS # COPC
Unabated Stream Abated Stream Abated Stream
ACV Exhaust ACV Exhaust (single‐stage HEPA) ACV Exhaust (dual‐stage HEPA)
Ci/yr % Contribution Ci/yr % Contribution Ci/yr % Contribution
13967‐48‐1 106Ru 1.53E‐06 0% 7.66E‐10 0% 7.66E‐12 0%
378253‐44‐2 113mCd 4.98E‐04 0% 2.49E‐07 0% 2.49E‐09 0%
14234‐35‐6 125Sb 5.30E‐04 0% 2.65E‐07 0% 2.65E‐09 0%
15832‐50‐5 126Sn 5.01E‐05 0% 2.51E‐08 0% 2.51E‐10 0%
15046‐84‐1 129I 3.78E‐06 0% 1.89E‐09 0% 1.89E‐11 0%
13967‐70‐9 134Cs 9.15E‐05 0% 4.58E‐08 0% 4.58E‐10 0%
10045‐97‐3 137Cs 8.79E‐03 1% 4.39E‐06 0% 4.39E‐08 0%
378253‐40‐8 137mBa 8.30E‐03 1% 4.15E‐06 0% 4.15E‐08 0%
14762‐75‐5 14C (Note 1) 3.04E‐02 3% 3.04E‐02 97% 3.04E‐02 99%
15715‐94‐3 151Sm 4.58E‐01 38% 2.29E‐04 1% 2.29E‐06 0%
14683‐23‐9 152Eu 1.16E‐04 0% 5.81E‐08 0% 5.81E‐10 0%
15585‐10‐1 154Eu 6.17E‐04 0% 3.08E‐07 0% 3.08E‐09 0%
14391‐16‐3 155Eu 3.27E‐03 0% 1.64E‐06 0% 1.64E‐08 0%
13982‐63‐3 226Ra 1.27E‐09 0% 6.37E‐13 0% 6.37E‐15 0%
14952‐40‐0 227Ac 4.87E‐07 0% 2.44E‐10 0% 2.44E‐12 0%
15262‐20‐1 228Ra 8.52E‐07 0% 4.26E‐10 0% 4.26E‐12 0%
15594‐54‐4 229Th 1.75E‐07 0% 8.77E‐11 0% 8.77E‐13 0%
14331‐85‐2 231Pa 6.53E‐07 0% 3.27E‐10 0% 3.27E‐12 0%
7440‐29‐1 232Th 8.52E‐07 0% 4.26E‐10 0% 4.26E‐12 0%
14158‐29‐3 232U 1.08E‐06 0% 5.41E‐10 0% 5.41E‐12 0%
13968‐55‐3 233U 5.48E‐06 0% 2.74E‐09 0% 2.74E‐11 0%
13966‐29‐5 234U 3.03E‐05 0% 1.52E‐08 0% 1.52E‐10 0%
15117‐96‐1 235U 5.82E‐08 0% 2.91E‐11 0% 2.91E‐13 0%
13982‐70‐2 236U 8.33E‐07 0% 4.17E‐10 0% 4.17E‐12 0%
13994‐20‐2 237Np 1.87E‐06 0% 9.36E‐10 0% 9.36E‐12 0%
13981‐16‐3 238Pu 4.31E‐05 0% 2.15E‐08 0% 2.15E‐10 0%
7440‐61‐1R 238U 2.76E‐05 0% 1.38E‐08 0% 1.38E‐10 0%
15117‐48‐3 239Pu 8.07E‐04 0% 4.04E‐07 0% 4.04E‐09 0%
14119‐33‐6 240Pu 1.77E‐04 0% 8.85E‐08 0% 8.85E‐10 0%
14596‐10‐2 241Am 2.56E‐03 0% 1.28E‐06 0% 1.28E‐08 0%
14119‐32‐5 241Pu 1.07E‐02 1% 5.37E‐06 0% 5.37E‐08 0%
15510‐73‐3 242Cm 1.57E‐05 0% 7.83E‐09 0% 7.83E‐11 0%
13982‐10‐0 242Pu 1.35E‐08 0% 6.75E‐12 0% 6.75E‐14 0%
14993‐75‐0 243Am 1.18E‐06 0% 5.91E‐10 0% 5.91E‐12 0%
15757‐87‐6 243Cm 2.21E‐07 0% 1.11E‐10 0% 1.11E‐12 0%
13981‐15‐2 244Cm 4.87E‐06 0% 2.44E‐09 0% 2.44E‐11 0%
10028‐17‐8 3H (Note 1) 3.62E‐04 0% 3.62E‐04 1% 3.62E‐04 1%
14336‐70‐0 59Ni 2.06E‐04 0% 1.03E‐07 0% 1.03E‐09 0%
10198‐40‐0 60Co 3.77E‐05 0% 1.88E‐08 0% 1.88E‐10 0%
13981‐37‐8 63Ni 1.84E‐02 2% 9.20E‐06 0% 9.20E‐08 0%
15758‐45‐9 79Se 1.84E‐05 0% 9.21E‐09 0% 9.21E‐11 0%
10098‐97‐2 90Sr 3.29E‐01 27% 1.64E‐04 1% 1.64E‐06 0%
10098‐91‐6 90Y 3.29E‐01 27% 1.64E‐04 1% 1.64E‐06 0%
378782‐82‐2 93mNb 4.07E‐04 0% 2.03E‐07 0% 2.03E‐09 0%
15751‐77‐6 93Zr 4.79E‐04 0% 2.39E‐07 0% 2.39E‐09 0%
14133‐76‐7 99Tc 3.39E‐03 0% 1.70E‐06 0% 1.70E‐08 0%
Total 1.21E+00 100% 3.13E‐02 100% 3.08E‐02 100%
Note 1: COPC emitted in the vapor phase

CALCULATION SHEET PROJECT: RPP-WTPJOB NO.: 24590
BY: William Hix CALC NO.: 24590-BOF-M4C-DEP-00001 DATE: 6/6/2016 SHEET REV: B
SHEET NO.: 109SUBJECT: DFLAW Effluent Management Facility Air Emissions Estimate
24590-G04B-F00012 Rev 13 (Revised12/23/2015) Ref: 24590-WTP-3DP-G04B-00037, 24590-WTP-GPG-ENG-0127
Table 8-3 – Radionuclide COPC Annual Possession Quantities
CAS # COPC
Annual Possession Quantities
DEP
Ci/yr
13967‐48‐1 106Ru 8.91E‐01
378253‐44‐2 113mCd 2.90E+02
14234‐35‐6 125Sb 3.08E+02
15832‐50‐5 126Sn 2.92E+01
15046‐84‐1 129I 2.20E+00
13967‐70‐9 134Cs 5.32E+01
10045‐97‐3 137Cs 5.11E+03
378253‐40‐8 137mBa 4.83E+03
14762‐75‐5 14C 1.82E‐01
15715‐94‐3 151Sm 2.67E+05
14683‐23‐9 152Eu 6.76E+01
15585‐10‐1 154Eu 3.59E+02
14391‐16‐3 155Eu 1.90E+03
13982‐63‐3 226Ra 7.41E‐04
14952‐40‐0 227Ac 2.83E‐01
15262‐20‐1 228Ra 4.96E‐01
15594‐54‐4 229Th 1.02E‐01
14331‐85‐2 231Pa 3.80E‐01
7440‐29‐1 232Th 4.96E‐01
14158‐29‐3 232U 6.29E‐01
13968‐55‐3 233U 3.19E+00
13966‐29‐5 234U 1.76E+01
15117‐96‐1 235U 3.39E‐02
13982‐70‐2 236U 4.85E‐01
13994‐20‐2 237Np 1.09E+00
13981‐16‐3 238Pu 2.51E+01
7440‐61‐1R 238U 1.61E+01
15117‐48‐3 239Pu 4.70E+02
14119‐33‐6 240Pu 1.03E+02
14596‐10‐2 241Am 1.49E+03
14119‐32‐5 241Pu 6.25E+03
15510‐73‐3 242Cm 9.11E+00
13982‐10‐0 242Pu 7.86E‐03
14993‐75‐0 243Am 6.88E‐01
15757‐87‐6 243Cm 1.29E‐01
13981‐15‐2 244Cm 2.84E+00
10028‐17‐8 3H 9.33E‐01
14336‐70‐0 59Ni 1.20E+02
10198‐40‐0 60Co 2.19E+01
13981‐37‐8 63Ni 1.07E+04
15758‐45‐9 79Se 1.07E+01
10098‐97‐2 90Sr 1.91E+05
10098‐91‐6 90Y 1.91E+05
378782‐82‐2 93mNb 2.37E+02
15751‐77‐6 93Zr 2.78E+02
14133‐76‐7 99Tc 1.97E+03
Total 6.84E+05

CALCULATION SHEET PROJECT: RPP-WTPJOB NO.: 24590
BY: William Hix CALC NO.: 24590-BOF-M4C-DEP-00001 DATE: 6/6/2016 SHEET REV: B
SHEET NO.: 110SUBJECT: DFLAW Effluent Management Facility Air Emissions Estimate
24590-G04B-F00012 Rev 13 (Revised12/23/2015) Ref: 24590-WTP-3DP-G04B-00037, 24590-WTP-GPG-ENG-0127
Table 8-4 – Feed Organic COPC Emissions from DVP System
CAS # COPC
Unabated Streams Abated Streams
Feed or Feed/PIC
DEP15 DEP18
(Note 1) DEP Vessel Vent DEP Vessel Vent
Vapor Particulate Total Vapor Particulate Total
g/sec g/sec g/sec g/sec g/sec g/sec
630‐20‐6 1,1,1,2‐Tetrachloroethane Feed 1.69E‐05 (Note 4) 0.00E+00 1.69E‐05 1.69E‐05 0.00E+00 1.69E‐05
71‐55‐6 1,1,1‐Trichloroethane Feed 1.98E‐10 0.00E+00 1.98E‐10 1.98E‐10 0.00E+00 1.98E‐10
79‐34‐5 1,1,2,2‐Tetrachloroethane Feed 1.88E‐10 0.00E+00 1.88E‐10 1.88E‐10 0.00E+00 1.88E‐10
127‐18‐4 Tetrachloroethene Feed 1.95E‐10 0.00E+00 1.95E‐10 1.95E‐10 0.00E+00 1.95E‐10
79‐00‐5 1,1,2‐Trichloroethane Feed 1.87E‐10 0.00E+00 1.87E‐10 1.87E‐10 0.00E+00 1.87E‐10
79‐01‐6 Trichloroethene Feed/PIC 2.13E‐10 4.31E‐10 (Note 5) 6.44E‐10 2.13E‐10 2.15E‐15 2.13E‐10
92‐52‐4 Biphenyl Feed 3.73E‐08 0.00E+00 3.73E‐08 3.73E‐08 0.00E+00 3.73E‐08
75‐34‐3 1,1‐Dichloroethane Feed 1.60E‐10 0.00E+00 1.60E‐10 1.60E‐10 0.00E+00 1.60E‐10
75‐35‐4 1,1‐Dichloroethene Feed 2.52E‐10 0.00E+00 2.52E‐10 2.52E‐10 0.00E+00 2.52E‐10
76‐13‐1 1,1,2‐Trichloro‐1,2,2‐trifluoroethane Feed 4.89E‐10 0.00E+00 4.89E‐10 4.89E‐10 0.00E+00 4.89E‐10
120‐82‐1 1,2,4‐Trichlorobenzene Feed 1.18E‐08 0.00E+00 1.18E‐08 1.18E‐08 0.00E+00 1.18E‐08
95‐50‐1 1,2‐Dichlorobenzene Feed 1.54E‐07 0.00E+00 1.54E‐07 1.54E‐07 0.00E+00 1.54E‐07
107‐06‐2 1,2‐Dichloroethane Feed/PIC 1.87E‐10 4.31E‐10 (Note 5) 6.18E‐10 1.87E‐10 2.15E‐15 1.87E‐10
78‐87‐5 1,2‐Dichloropropane Feed 1.60E‐10 0.00E+00 1.60E‐10 1.60E‐10 0.00E+00 1.60E‐10
106‐88‐7 1,2‐Epoxybutane Feed 1.69E‐05 (Note 4) 0.00E+00 1.69E‐05 1.69E‐05 0.00E+00 1.69E‐05
156‐60‐5 1,2‐trans‐Dichloroethene Feed 1.69E‐05 (Note 4) 0.00E+00 1.69E‐05 1.69E‐05 0.00E+00 1.69E‐05
106‐99‐0 1,3‐Butadiene Feed 5.37E‐09 0.00E+00 5.37E‐09 5.37E‐09 0.00E+00 5.37E‐09
541‐73‐1 1,3‐Dichlorobenzene Feed 7.76E‐09 0.00E+00 7.76E‐09 7.76E‐09 0.00E+00 7.76E‐09
106‐46‐7 1,4‐Dichlorobenzene Feed/PIC 1.01E‐07 4.31E‐10 (Note 5) 1.02E‐07 1.01E‐07 2.15E‐15 1.01E‐07
123‐91‐1 1,4‐Dioxane Feed 5.91E‐09 0.00E+00 5.91E‐09 5.91E‐09 0.00E+00 5.91E‐09
75‐01‐4 Vinyl chloride Feed 4.05E‐10 0.00E+00 4.05E‐10 4.05E‐10 0.00E+00 4.05E‐10
58‐90‐2 2,3,4,6‐Tetrachlorophenol Feed 1.69E‐05 (Note 4) 0.00E+00 1.69E‐05 1.69E‐05 0.00E+00 1.69E‐05
95‐95‐4 2,4,5‐Trichlorophenol Feed 4.87E‐05 0.00E+00 4.87E‐05 4.87E‐05 0.00E+00 4.87E‐05
88‐06‐2 2,4,6‐Trichlorophenol Feed 1.68E‐06 (Note 2) 0.00E+00 1.68E‐06 1.68E‐06 0.00E+00 1.68E‐06
120‐83‐2 2,4‐Dichlorophenol Feed 1.69E‐05 (Note 4) 0.00E+00 1.69E‐05 1.69E‐05 0.00E+00 1.69E‐05
121‐14‐2 2,4‐Dinitrotoluene Feed/PIC 2.27E‐08 (Note 2) 1.32E‐10 2.29E‐08 2.27E‐08 6.62E‐16 2.27E‐08
128‐37‐0 2,6‐Bis(1,1‐dimethylethyl)‐4‐methylphenol Feed 2.83E‐07 0.00E+00 2.83E‐07 2.83E‐07 0.00E+00 2.83E‐07
78‐93‐3 2‐Butanone Feed/PIC 6.40E‐08 4.31E‐10 (Note 5) 6.44E‐08 6.40E‐08 2.15E‐15 6.40E‐08
111‐76‐2 2‐Butoxyethanol Feed 1.69E‐05 (Note 4) 0.00E+00 1.69E‐05 1.69E‐05 0.00E+00 1.69E‐05
91‐58‐7 2‐Chloronaphthalene Feed 1.69E‐05 (Note 4) 0.00E+00 1.69E‐05 1.69E‐05 0.00E+00 1.69E‐05
95‐57‐8 2‐Chlorophenol Feed 5.36E‐05 0.00E+00 5.36E‐05 5.36E‐05 0.00E+00 5.36E‐05
110‐80‐5 2‐Ethoxyethanol Feed 1.13E‐04 0.00E+00 1.13E‐04 1.13E‐04 0.00E+00 1.13E‐04
104‐76‐7 2‐Ethyl‐1‐hexanol Feed 1.69E‐05 (Note 4) 0.00E+00 1.69E‐05 1.69E‐05 0.00E+00 1.69E‐05
591‐78‐6 2‐Hexanone Feed 2.55E‐08 0.00E+00 2.55E‐08 2.55E‐08 0.00E+00 2.55E‐08
126‐98‐7 2‐Methyl‐2‐propenenitrile Feed 5.91E‐09 0.00E+00 5.91E‐09 5.91E‐09 0.00E+00 5.91E‐09
78‐83‐1 Isobutanol Feed 2.77E‐04 0.00E+00 2.77E‐04 2.77E‐04 0.00E+00 2.77E‐04
88‐75‐5 2‐Nitrophenol Feed/PIC 5.04E‐05 4.31E‐10 (Note 5) 5.04E‐05 5.04E‐05 2.15E‐15 5.04E‐05
79‐46‐9 2‐Nitropropane Feed 3.95E‐08 0.00E+00 3.95E‐08 3.95E‐08 0.00E+00 3.95E‐08
67‐64‐1 Acetone Feed/PIC 2.80E‐07 4.31E‐10 (Note 5) 2.81E‐07 2.80E‐07 2.15E‐15 2.80E‐07
79‐10‐7 2‐Propenoic acid Feed 1.69E‐05 (Note 4) 0.00E+00 1.69E‐05 1.69E‐05 0.00E+00 1.69E‐05
67‐63‐0 Isopropyl alcohol Feed 1.65E‐08 0.00E+00 1.65E‐08 1.65E‐08 0.00E+00 1.65E‐08
107‐05‐1 3‐Chloropropene Feed 5.91E‐10 0.00E+00 5.91E‐10 5.91E‐10 0.00E+00 5.91E‐10
589‐38‐8 3‐Hexanone Feed 1.69E‐05 (Note 4) 0.00E+00 1.69E‐05 1.69E‐05 0.00E+00 1.69E‐05
56‐49‐5 3‐Methylcholanthrene Feed 1.69E‐05 (Note 4) 0.00E+00 1.69E‐05 1.69E‐05 0.00E+00 1.69E‐05
72‐55‐9 4,4‐DDE Feed 1.69E‐05 (Note 4) 0.00E+00 1.69E‐05 1.69E‐05 0.00E+00 1.69E‐05
101‐55‐3 4‐Bromophenylphenyl ether Feed 1.69E‐05 (Note 4) 0.00E+00 1.69E‐05 1.69E‐05 0.00E+00 1.69E‐05
59‐50‐7 4‐Chloro‐3‐methylphenol Feed 5.19E‐05 0.00E+00 5.19E‐05 5.19E‐05 0.00E+00 5.19E‐05
100‐40‐3 4‐Ethenylcyclohexene Feed 1.69E‐05 (Note 4) 0.00E+00 1.69E‐05 1.69E‐05 0.00E+00 1.69E‐05
108‐10‐1 Hexone Feed 2.09E‐09 0.00E+00 2.09E‐09 2.09E‐09 0.00E+00 2.09E‐09
3697‐24‐3 5‐Methylchrysene Feed 1.69E‐05 (Note 4) 0.00E+00 1.69E‐05 1.69E‐05 0.00E+00 1.69E‐05
602‐87‐9 5‐Nitroacenaphthene Feed 1.69E‐05 (Note 4) 0.00E+00 1.69E‐05 1.69E‐05 0.00E+00 1.69E‐05

CALCULATION SHEET PROJECT: RPP-WTPJOB NO.: 24590
BY: William Hix CALC NO.: 24590-BOF-M4C-DEP-00001 DATE: 6/6/2016 SHEET REV: B
SHEET NO.: 111SUBJECT: DFLAW Effluent Management Facility Air Emissions Estimate
24590-G04B-F00012 Rev 13 (Revised12/23/2015) Ref: 24590-WTP-3DP-G04B-00037, 24590-WTP-GPG-ENG-0127
CAS # COPC
Unabated Streams Abated Streams
Feed or Feed/PIC
DEP15 DEP18
(Note 1) DEP Vessel Vent DEP Vessel Vent
Vapor Particulate Total Vapor Particulate Total
g/sec g/sec g/sec g/sec g/sec g/sec
83‐32‐9 Acenaphthene Feed/PIC 5.66E‐05 4.31E‐10 (Note 5) 5.66E‐05 5.66E‐05 2.15E‐15 5.66E‐05
208‐96‐8 Acenaphthylene Feed/PIC 1.69E‐05 (Note 4) 4.31E‐10 (Note 5) 1.69E‐05 1.69E‐05 2.15E‐15 1.69E‐05
75‐07‐0 Acetaldehyde Feed 1.69E‐05 (Note 4) 0.00E+00 1.69E‐05 1.69E‐05 0.00E+00 1.69E‐05
60‐35‐5 Acetamide Feed 1.69E‐05 (Note 4) 0.00E+00 1.69E‐05 1.69E‐05 0.00E+00 1.69E‐05
141‐78‐6 Ethyl acetate Feed 6.31E‐10 0.00E+00 6.31E‐10 6.31E‐10 0.00E+00 6.31E‐10
108‐05‐4 vinyl acetate Feed 1.69E‐05 (Note 4) 0.00E+00 1.69E‐05 1.69E‐05 0.00E+00 1.69E‐05
75‐05‐8 Acetonitrile Feed/PIC 1.46E‐07 4.31E‐10 (Note 5) 1.46E‐07 1.46E‐07 2.15E‐15 1.46E‐07
98‐86‐2 Acetophenone Feed/PIC 3.73E‐08 4.31E‐10 (Note 5) 3.77E‐08 3.73E‐08 2.15E‐15 3.73E‐08
107‐02‐8 Acrolein Feed 8.68E‐09 0.00E+00 8.68E‐09 8.68E‐09 0.00E+00 8.68E‐09
107‐13‐1 Acrylonitrile Feed/PIC 5.91E‐09 4.31E‐10 (Note 5) 6.34E‐09 5.91E‐09 2.15E‐15 5.91E‐09
134‐32‐7 alpha‐Naphthylamine Feed 1.69E‐05 (Note 4) 0.00E+00 1.69E‐05 1.69E‐05 0.00E+00 1.69E‐05
120‐12‐7 Anthracene Feed/PIC 1.69E‐05 (Note 4) 4.88E‐12 1.69E‐05 1.69E‐05 2.44E‐17 1.69E‐05
71‐43‐2 Benzene Feed/PIC 5.05E‐10 4.31E‐10 (Note 5) 9.36E‐10 5.05E‐10 2.15E‐15 5.05E‐10
50‐32‐8 Benzo(a)pyrene Feed 6.77E‐09 3.86E‐11 6.81E‐09 6.77E‐09 1.93E‐16 6.77E‐09
191‐24‐2 Benzo(ghi)perylene Feed/PIC 1.69E‐05 (Note 4) 2.28E‐09 1.69E‐05 1.69E‐05 1.14E‐14 1.69E‐05
117‐81‐7 Bis(2‐ethylhexyl)phthalate Feed/PIC 1.69E‐05 (Note 4) 9.90E‐10 1.69E‐05 1.69E‐05 4.95E‐15 1.69E‐05
75‐27‐4 Bromodichloromethane Feed 1.69E‐05 (Note 4) 0.00E+00 1.69E‐05 1.69E‐05 0.00E+00 1.69E‐05
74‐83‐9 Bromomethane Feed/PIC 3.99E‐10 4.31E‐10 (Note 5) 8.30E‐10 3.99E‐10 2.15E‐15 3.99E‐10
123‐72‐8 Butanal Feed 1.69E‐05 (Note 4) 0.00E+00 1.69E‐05 1.69E‐05 0.00E+00 1.69E‐05
85‐68‐7 Butylbenzylphthalate Feed/PIC 1.04E‐04 1.33E‐08 1.04E‐04 1.04E‐04 6.66E‐14 1.04E‐04
56‐23‐5 Carbon tetrachloride Feed/PIC 3.05E‐10 4.31E‐10 (Note 5) 7.36E‐10 3.05E‐10 2.15E‐15 3.05E‐10
108‐90‐7 Chlorobenzene Feed/PIC 1.93E‐10 4.31E‐10 (Note 5) 6.23E‐10 1.93E‐10 2.15E‐15 1.93E‐10
75‐45‐6 Chlorodifluoromethane Feed 5.91E‐10 0.00E+00 5.91E‐10 5.91E‐10 0.00E+00 5.91E‐10
75‐00‐3 Chloroethane Feed 3.99E‐10 0.00E+00 3.99E‐10 3.99E‐10 0.00E+00 3.99E‐10
67‐66‐3 Chloroform Feed/PIC 2.00E‐10 4.31E‐10 (Note 5) 6.31E‐10 2.00E‐10 2.15E‐15 2.00E‐10
74‐87‐3 Chloromethane Feed/PIC 7.95E‐10 4.31E‐10 (Note 5) 1.23E‐09 7.95E‐10 2.15E‐15 7.95E‐10
10061‐01‐5 cis‐1,3‐Dichloropropene Feed 5.91E‐10 0.00E+00 5.91E‐10 5.91E‐10 0.00E+00 5.91E‐10
108‐39‐4 m‐Cresol Feed 4.29E‐05 0.00E+00 4.29E‐05 4.29E‐05 0.00E+00 4.29E‐05
95‐48‐7 2‐Methylphenol Feed 5.96E‐05 0.00E+00 5.96E‐05 5.96E‐05 0.00E+00 5.96E‐05
98‐82‐8 Isopropylbenzene Feed 1.69E‐05 (Note 4) 0.00E+00 1.69E‐05 1.69E‐05 0.00E+00 1.69E‐05
110‐82‐7 Cyclohexane Feed 5.91E‐10 0.00E+00 5.91E‐10 5.91E‐10 0.00E+00 5.91E‐10
108‐94‐1 Cyclohexanone Feed 5.77E‐07 0.00E+00 5.77E‐07 5.77E‐07 0.00E+00 5.77E‐07
226‐36‐8 Dibenz[a,h]acridine Feed 1.69E‐05 (Note 4) 0.00E+00 1.69E‐05 1.69E‐05 0.00E+00 1.69E‐05
53‐70‐3 Dibenz[a,h]anthracene Feed/PIC 1.45E‐09 2.37E‐09 3.82E‐09 1.45E‐09 1.18E‐14 1.45E‐09
224‐42‐0 Dibenz[a,j]acridine Feed 1.69E‐05 (Note 4) 0.00E+00 1.69E‐05 1.69E‐05 0.00E+00 1.69E‐05
191‐30‐0 Dibenzo(a,l)pyrene Feed 1.69E‐05 (Note 4) 0.00E+00 1.69E‐05 1.69E‐05 0.00E+00 1.69E‐05
192‐65‐4 Dibenzo[a,e]pyrene Feed 1.69E‐05 (Note 4) 0.00E+00 1.69E‐05 1.69E‐05 0.00E+00 1.69E‐05
189‐64‐0 Dibenzo[a,h]pyrene Feed 1.69E‐05 (Note 4) 0.00E+00 1.69E‐05 1.69E‐05 0.00E+00 1.69E‐05
189‐55‐9 Dibenzo[a,i]pyrene Feed 1.69E‐05 (Note 4) 0.00E+00 1.69E‐05 1.69E‐05 0.00E+00 1.69E‐05
75‐71‐8 Dichlorodifluoromethane Feed 4.95E‐10 0.00E+00 4.95E‐10 4.95E‐10 0.00E+00 4.95E‐10
75‐09‐2 Methylenechloride Feed/PIC 1.18E‐07 4.31E‐10 (Note 5) 1.19E‐07 1.18E‐07 2.15E‐15 1.18E‐07
84‐66‐2 Diethylphthalate Feed/PIC 1.69E‐05 (Note 4) 4.31E‐10 (Note 5) 1.69E‐05 1.69E‐05 2.15E‐15 1.69E‐05
84‐74‐2 Di‐n‐butylphthalate Feed/PIC 3.40E‐04 4.79E‐09 3.40E‐04 3.40E‐04 2.39E‐14 3.40E‐04
117‐84‐0 Di‐n‐octylphthalate Feed 5.49E‐05 2.22E‐08 5.49E‐05 5.49E‐05 1.11E‐13 5.49E‐05
100‐41‐4 Ethylbenzene Feed 3.34E‐10 0.00E+00 3.34E‐10 3.34E‐10 0.00E+00 3.34E‐10
60‐29‐7 Ethyl ether Feed 2.22E‐08 0.00E+00 2.22E‐08 2.22E‐08 0.00E+00 2.22E‐08
106‐93‐4 Ethylene dibromide Feed 1.60E‐10 0.00E+00 1.60E‐10 1.60E‐10 0.00E+00 1.60E‐10
75‐21‐8 Ethylene oxide (Oxirane) Feed 3.44E‐08 0.00E+00 3.44E‐08 3.44E‐08 0.00E+00 3.44E‐08
206‐44‐0 Fluoranthene Feed/PIC 5.57E‐05 1.06E‐09 5.57E‐05 5.57E‐05 5.32E‐15 5.57E‐05
86‐73‐7 Fluorene Feed/PIC 1.69E‐05 (Note 4) 4.31E‐10 (Note 5) 1.69E‐05 1.69E‐05 2.15E‐15 1.69E‐05
75‐02‐5 Fluoroethene (vinyl fluoride) Feed 1.69E‐05 (Note 4) 0.00E+00 1.69E‐05 1.69E‐05 0.00E+00 1.69E‐05
50‐00‐0 Formaldehyde Feed 1.69E‐05 (Note 4) 0.00E+00 1.69E‐05 1.69E‐05 0.00E+00 1.69E‐05
87‐68‐3 Hexachlorobutadiene Feed 1.01E‐07 0.00E+00 1.01E‐07 1.01E‐07 0.00E+00 1.01E‐07
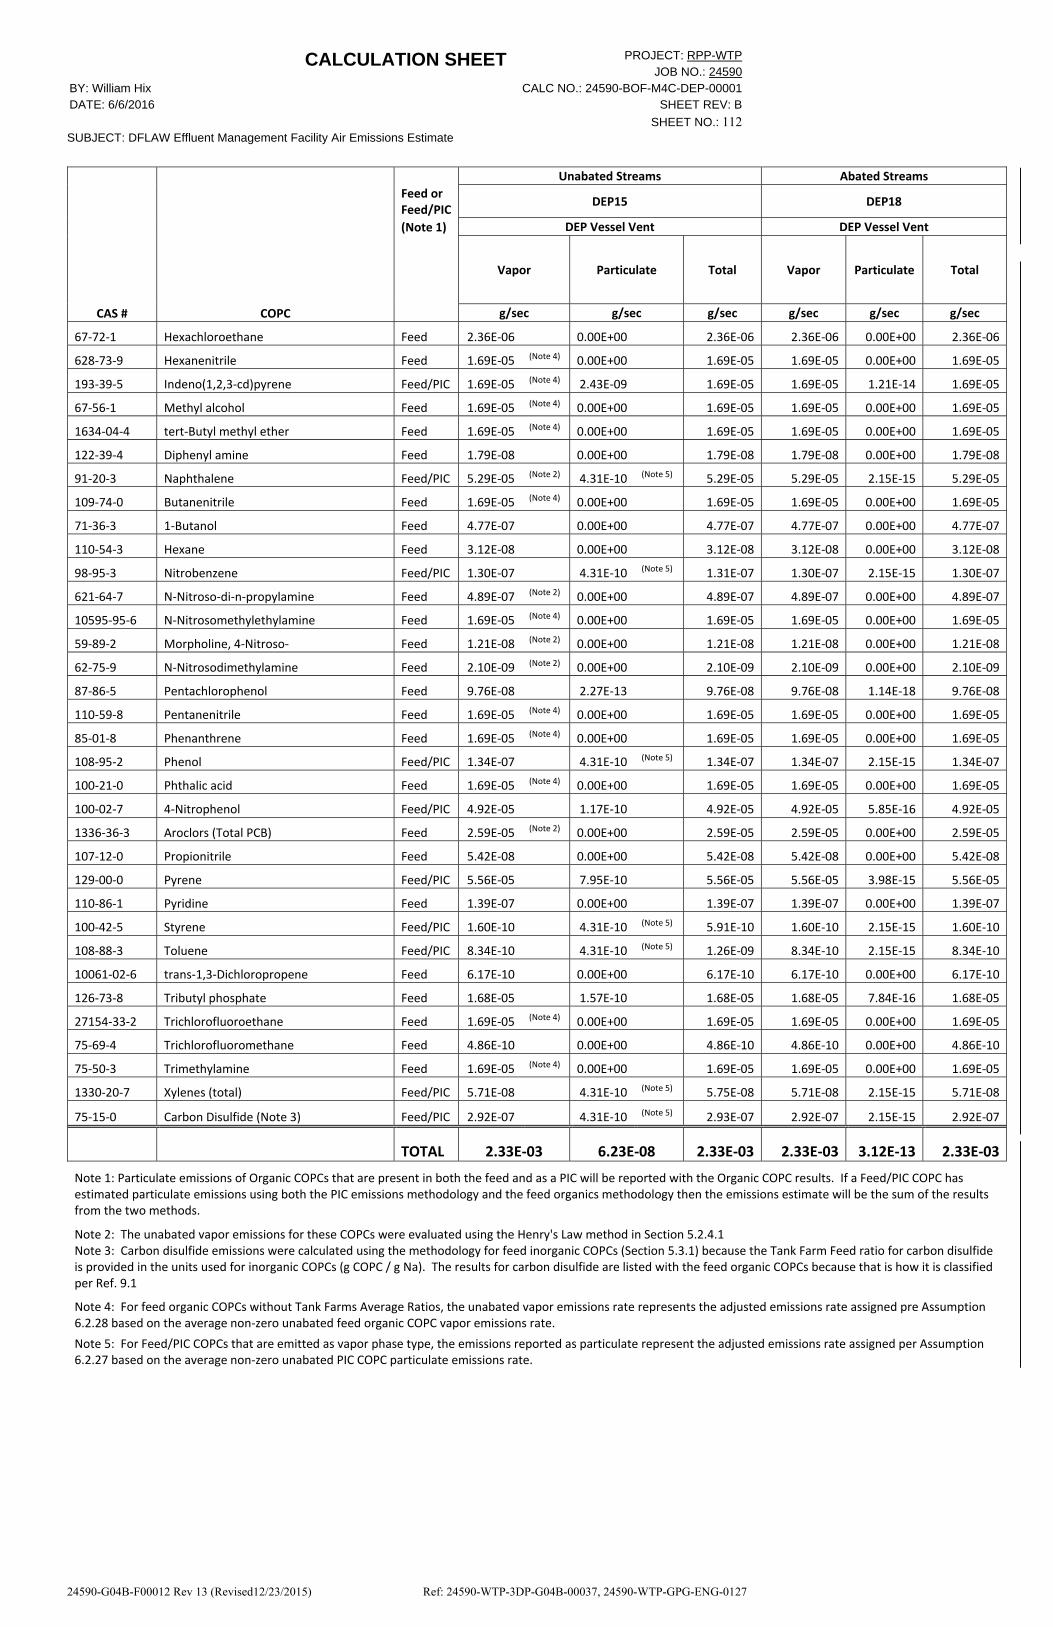
CALCULATION SHEET PROJECT: RPP-WTPJOB NO.: 24590
BY: William Hix CALC NO.: 24590-BOF-M4C-DEP-00001 DATE: 6/6/2016 SHEET REV: B
SHEET NO.: 112SUBJECT: DFLAW Effluent Management Facility Air Emissions Estimate
24590-G04B-F00012 Rev 13 (Revised12/23/2015) Ref: 24590-WTP-3DP-G04B-00037, 24590-WTP-GPG-ENG-0127
CAS # COPC
Unabated Streams Abated Streams
Feed or Feed/PIC
DEP15 DEP18
(Note 1) DEP Vessel Vent DEP Vessel Vent
Vapor Particulate Total Vapor Particulate Total
g/sec g/sec g/sec g/sec g/sec g/sec
67‐72‐1 Hexachloroethane Feed 2.36E‐06 0.00E+00 2.36E‐06 2.36E‐06 0.00E+00 2.36E‐06
628‐73‐9 Hexanenitrile Feed 1.69E‐05 (Note 4) 0.00E+00 1.69E‐05 1.69E‐05 0.00E+00 1.69E‐05
193‐39‐5 Indeno(1,2,3‐cd)pyrene Feed/PIC 1.69E‐05 (Note 4) 2.43E‐09 1.69E‐05 1.69E‐05 1.21E‐14 1.69E‐05
67‐56‐1 Methyl alcohol Feed 1.69E‐05 (Note 4) 0.00E+00 1.69E‐05 1.69E‐05 0.00E+00 1.69E‐05
1634‐04‐4 tert‐Butyl methyl ether Feed 1.69E‐05 (Note 4) 0.00E+00 1.69E‐05 1.69E‐05 0.00E+00 1.69E‐05
122‐39‐4 Diphenyl amine Feed 1.79E‐08 0.00E+00 1.79E‐08 1.79E‐08 0.00E+00 1.79E‐08
91‐20‐3 Naphthalene Feed/PIC 5.29E‐05 (Note 2) 4.31E‐10 (Note 5) 5.29E‐05 5.29E‐05 2.15E‐15 5.29E‐05
109‐74‐0 Butanenitrile Feed 1.69E‐05 (Note 4) 0.00E+00 1.69E‐05 1.69E‐05 0.00E+00 1.69E‐05
71‐36‐3 1‐Butanol Feed 4.77E‐07 0.00E+00 4.77E‐07 4.77E‐07 0.00E+00 4.77E‐07
110‐54‐3 Hexane Feed 3.12E‐08 0.00E+00 3.12E‐08 3.12E‐08 0.00E+00 3.12E‐08
98‐95‐3 Nitrobenzene Feed/PIC 1.30E‐07 4.31E‐10 (Note 5) 1.31E‐07 1.30E‐07 2.15E‐15 1.30E‐07
621‐64‐7 N‐Nitroso‐di‐n‐propylamine Feed 4.89E‐07 (Note 2) 0.00E+00 4.89E‐07 4.89E‐07 0.00E+00 4.89E‐07
10595‐95‐6 N‐Nitrosomethylethylamine Feed 1.69E‐05 (Note 4) 0.00E+00 1.69E‐05 1.69E‐05 0.00E+00 1.69E‐05
59‐89‐2 Morpholine, 4‐Nitroso‐ Feed 1.21E‐08 (Note 2) 0.00E+00 1.21E‐08 1.21E‐08 0.00E+00 1.21E‐08
62‐75‐9 N‐Nitrosodimethylamine Feed 2.10E‐09 (Note 2) 0.00E+00 2.10E‐09 2.10E‐09 0.00E+00 2.10E‐09
87‐86‐5 Pentachlorophenol Feed 9.76E‐08 2.27E‐13 9.76E‐08 9.76E‐08 1.14E‐18 9.76E‐08
110‐59‐8 Pentanenitrile Feed 1.69E‐05 (Note 4) 0.00E+00 1.69E‐05 1.69E‐05 0.00E+00 1.69E‐05
85‐01‐8 Phenanthrene Feed 1.69E‐05 (Note 4) 0.00E+00 1.69E‐05 1.69E‐05 0.00E+00 1.69E‐05
108‐95‐2 Phenol Feed/PIC 1.34E‐07 4.31E‐10 (Note 5) 1.34E‐07 1.34E‐07 2.15E‐15 1.34E‐07
100‐21‐0 Phthalic acid Feed 1.69E‐05 (Note 4) 0.00E+00 1.69E‐05 1.69E‐05 0.00E+00 1.69E‐05
100‐02‐7 4‐Nitrophenol Feed/PIC 4.92E‐05 1.17E‐10 4.92E‐05 4.92E‐05 5.85E‐16 4.92E‐05
1336‐36‐3 Aroclors (Total PCB) Feed 2.59E‐05 (Note 2) 0.00E+00 2.59E‐05 2.59E‐05 0.00E+00 2.59E‐05
107‐12‐0 Propionitrile Feed 5.42E‐08 0.00E+00 5.42E‐08 5.42E‐08 0.00E+00 5.42E‐08
129‐00‐0 Pyrene Feed/PIC 5.56E‐05 7.95E‐10 5.56E‐05 5.56E‐05 3.98E‐15 5.56E‐05
110‐86‐1 Pyridine Feed 1.39E‐07 0.00E+00 1.39E‐07 1.39E‐07 0.00E+00 1.39E‐07
100‐42‐5 Styrene Feed/PIC 1.60E‐10 4.31E‐10 (Note 5) 5.91E‐10 1.60E‐10 2.15E‐15 1.60E‐10
108‐88‐3 Toluene Feed/PIC 8.34E‐10 4.31E‐10 (Note 5) 1.26E‐09 8.34E‐10 2.15E‐15 8.34E‐10
10061‐02‐6 trans‐1,3‐Dichloropropene Feed 6.17E‐10 0.00E+00 6.17E‐10 6.17E‐10 0.00E+00 6.17E‐10
126‐73‐8 Tributyl phosphate Feed 1.68E‐05 1.57E‐10 1.68E‐05 1.68E‐05 7.84E‐16 1.68E‐05
27154‐33‐2 Trichlorofluoroethane Feed 1.69E‐05 (Note 4) 0.00E+00 1.69E‐05 1.69E‐05 0.00E+00 1.69E‐05
75‐69‐4 Trichlorofluoromethane Feed 4.86E‐10 0.00E+00 4.86E‐10 4.86E‐10 0.00E+00 4.86E‐10
75‐50‐3 Trimethylamine Feed 1.69E‐05 (Note 4) 0.00E+00 1.69E‐05 1.69E‐05 0.00E+00 1.69E‐05
1330‐20‐7 Xylenes (total) Feed/PIC 5.71E‐08 4.31E‐10 (Note 5) 5.75E‐08 5.71E‐08 2.15E‐15 5.71E‐08
75‐15‐0 Carbon Disulfide (Note 3) Feed/PIC 2.92E‐07 4.31E‐10 (Note 5) 2.93E‐07 2.92E‐07 2.15E‐15 2.92E‐07
TOTAL 2.33E‐03 6.23E‐08 2.33E‐03 2.33E‐03 3.12E‐13 2.33E‐03
Note 1: Particulate emissions of Organic COPCs that are present in both the feed and as a PIC will be reported with the Organic COPC results. If a Feed/PIC COPC has estimated particulate emissions using both the PIC emissions methodology and the feed organics methodology then the emissions estimate will be the sum of the results from the two methods.
Note 2: The unabated vapor emissions for these COPCs were evaluated using the Henry's Law method in Section 5.2.4.1 Note 3: Carbon disulfide emissions were calculated using the methodology for feed inorganic COPCs (Section 5.3.1) because the Tank Farm Feed ratio for carbon disulfide is provided in the units used for inorganic COPCs (g COPC / g Na). The results for carbon disulfide are listed with the feed organic COPCs because that is how it is classified per Ref. 9.1
Note 4: For feed organic COPCs without Tank Farms Average Ratios, the unabated vapor emissions rate represents the adjusted emissions rate assigned pre Assumption 6.2.28 based on the average non‐zero unabated feed organic COPC vapor emissions rate.
Note 5: For Feed/PIC COPCs that are emitted as vapor phase type, the emissions reported as particulate represent the adjusted emissions rate assigned per Assumption 6.2.27 based on the average non‐zero unabated PIC COPC particulate emissions rate.
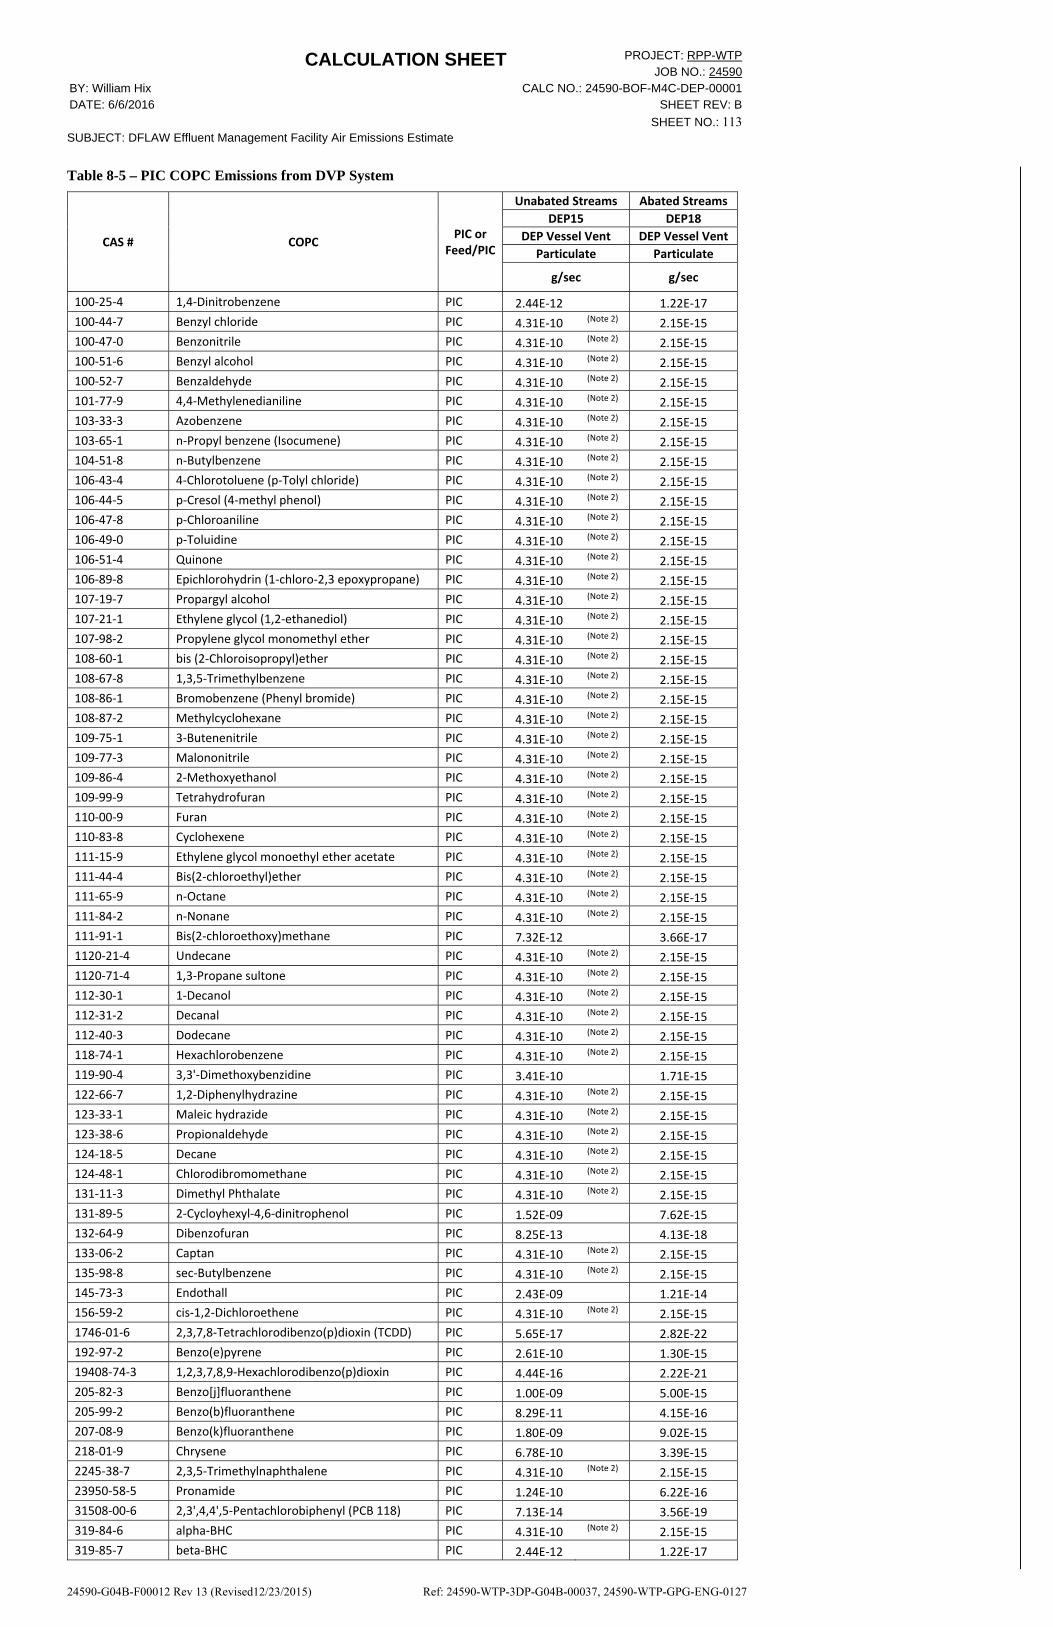
CALCULATION SHEET PROJECT: RPP-WTPJOB NO.: 24590
BY: William Hix CALC NO.: 24590-BOF-M4C-DEP-00001 DATE: 6/6/2016 SHEET REV: B
SHEET NO.: 113SUBJECT: DFLAW Effluent Management Facility Air Emissions Estimate
24590-G04B-F00012 Rev 13 (Revised12/23/2015) Ref: 24590-WTP-3DP-G04B-00037, 24590-WTP-GPG-ENG-0127
Table 8-5 – PIC COPC Emissions from DVP System
CAS # COPC PIC or
Feed/PIC
Unabated Streams Abated Streams
DEP15 DEP18
DEP Vessel Vent DEP Vessel Vent
Particulate Particulate
g/sec g/sec
100‐25‐4 1,4‐Dinitrobenzene PIC 2.44E‐12 1.22E‐17
100‐44‐7 Benzyl chloride PIC 4.31E‐10 (Note 2) 2.15E‐15
100‐47‐0 Benzonitrile PIC 4.31E‐10 (Note 2) 2.15E‐15
100‐51‐6 Benzyl alcohol PIC 4.31E‐10 (Note 2) 2.15E‐15
100‐52‐7 Benzaldehyde PIC 4.31E‐10 (Note 2) 2.15E‐15
101‐77‐9 4,4‐Methylenedianiline PIC 4.31E‐10 (Note 2) 2.15E‐15
103‐33‐3 Azobenzene PIC 4.31E‐10 (Note 2) 2.15E‐15
103‐65‐1 n‐Propyl benzene (Isocumene) PIC 4.31E‐10 (Note 2) 2.15E‐15
104‐51‐8 n‐Butylbenzene PIC 4.31E‐10 (Note 2) 2.15E‐15
106‐43‐4 4‐Chlorotoluene (p‐Tolyl chloride) PIC 4.31E‐10 (Note 2) 2.15E‐15
106‐44‐5 p‐Cresol (4‐methyl phenol) PIC 4.31E‐10 (Note 2) 2.15E‐15
106‐47‐8 p‐Chloroaniline PIC 4.31E‐10 (Note 2) 2.15E‐15
106‐49‐0 p‐Toluidine PIC 4.31E‐10 (Note 2) 2.15E‐15
106‐51‐4 Quinone PIC 4.31E‐10 (Note 2) 2.15E‐15
106‐89‐8 Epichlorohydrin (1‐chloro‐2,3 epoxypropane) PIC 4.31E‐10 (Note 2) 2.15E‐15
107‐19‐7 Propargyl alcohol PIC 4.31E‐10 (Note 2) 2.15E‐15
107‐21‐1 Ethylene glycol (1,2‐ethanediol) PIC 4.31E‐10 (Note 2) 2.15E‐15
107‐98‐2 Propylene glycol monomethyl ether PIC 4.31E‐10 (Note 2) 2.15E‐15
108‐60‐1 bis (2‐Chloroisopropyl)ether PIC 4.31E‐10 (Note 2) 2.15E‐15
108‐67‐8 1,3,5‐Trimethylbenzene PIC 4.31E‐10 (Note 2) 2.15E‐15
108‐86‐1 Bromobenzene (Phenyl bromide) PIC 4.31E‐10 (Note 2) 2.15E‐15
108‐87‐2 Methylcyclohexane PIC 4.31E‐10 (Note 2) 2.15E‐15
109‐75‐1 3‐Butenenitrile PIC 4.31E‐10 (Note 2) 2.15E‐15
109‐77‐3 Malononitrile PIC 4.31E‐10 (Note 2) 2.15E‐15
109‐86‐4 2‐Methoxyethanol PIC 4.31E‐10 (Note 2) 2.15E‐15
109‐99‐9 Tetrahydrofuran PIC 4.31E‐10 (Note 2) 2.15E‐15
110‐00‐9 Furan PIC 4.31E‐10 (Note 2) 2.15E‐15
110‐83‐8 Cyclohexene PIC 4.31E‐10 (Note 2) 2.15E‐15
111‐15‐9 Ethylene glycol monoethyl ether acetate PIC 4.31E‐10 (Note 2) 2.15E‐15
111‐44‐4 Bis(2‐chloroethyl)ether PIC 4.31E‐10 (Note 2) 2.15E‐15
111‐65‐9 n‐Octane PIC 4.31E‐10 (Note 2) 2.15E‐15
111‐84‐2 n‐Nonane PIC 4.31E‐10 (Note 2) 2.15E‐15
111‐91‐1 Bis(2‐chloroethoxy)methane PIC 7.32E‐12 3.66E‐17
1120‐21‐4 Undecane PIC 4.31E‐10 (Note 2) 2.15E‐15
1120‐71‐4 1,3‐Propane sultone PIC 4.31E‐10 (Note 2) 2.15E‐15
112‐30‐1 1‐Decanol PIC 4.31E‐10 (Note 2) 2.15E‐15
112‐31‐2 Decanal PIC 4.31E‐10 (Note 2) 2.15E‐15
112‐40‐3 Dodecane PIC 4.31E‐10 (Note 2) 2.15E‐15
118‐74‐1 Hexachlorobenzene PIC 4.31E‐10 (Note 2) 2.15E‐15
119‐90‐4 3,3'‐Dimethoxybenzidine PIC 3.41E‐10 1.71E‐15
122‐66‐7 1,2‐Diphenylhydrazine PIC 4.31E‐10 (Note 2) 2.15E‐15
123‐33‐1 Maleic hydrazide PIC 4.31E‐10 (Note 2) 2.15E‐15
123‐38‐6 Propionaldehyde PIC 4.31E‐10 (Note 2) 2.15E‐15
124‐18‐5 Decane PIC 4.31E‐10 (Note 2) 2.15E‐15
124‐48‐1 Chlorodibromomethane PIC 4.31E‐10 (Note 2) 2.15E‐15
131‐11‐3 Dimethyl Phthalate PIC 4.31E‐10 (Note 2) 2.15E‐15
131‐89‐5 2‐Cycloyhexyl‐4,6‐dinitrophenol PIC 1.52E‐09 7.62E‐15
132‐64‐9 Dibenzofuran PIC 8.25E‐13 4.13E‐18
133‐06‐2 Captan PIC 4.31E‐10 (Note 2) 2.15E‐15
135‐98‐8 sec‐Butylbenzene PIC 4.31E‐10 (Note 2) 2.15E‐15
145‐73‐3 Endothall PIC 2.43E‐09 1.21E‐14
156‐59‐2 cis‐1,2‐Dichloroethene PIC 4.31E‐10 (Note 2) 2.15E‐15
1746‐01‐6 2,3,7,8‐Tetrachlorodibenzo(p)dioxin (TCDD) PIC 5.65E‐17 2.82E‐22
192‐97‐2 Benzo(e)pyrene PIC 2.61E‐10 1.30E‐15
19408‐74‐3 1,2,3,7,8,9‐Hexachlorodibenzo(p)dioxin PIC 4.44E‐16 2.22E‐21
205‐82‐3 Benzo[j]fluoranthene PIC 1.00E‐09 5.00E‐15
205‐99‐2 Benzo(b)fluoranthene PIC 8.29E‐11 4.15E‐16
207‐08‐9 Benzo(k)fluoranthene PIC 1.80E‐09 9.02E‐15
218‐01‐9 Chrysene PIC 6.78E‐10 3.39E‐15
2245‐38‐7 2,3,5‐Trimethylnaphthalene PIC 4.31E‐10 (Note 2) 2.15E‐15
23950‐58‐5 Pronamide PIC 1.24E‐10 6.22E‐16
31508‐00‐6 2,3',4,4',5‐Pentachlorobiphenyl (PCB 118) PIC 7.13E‐14 3.56E‐19
319‐84‐6 alpha‐BHC PIC 4.31E‐10 (Note 2) 2.15E‐15
319‐85‐7 beta‐BHC PIC 2.44E‐12 1.22E‐17

CALCULATION SHEET PROJECT: RPP-WTPJOB NO.: 24590
BY: William Hix CALC NO.: 24590-BOF-M4C-DEP-00001 DATE: 6/6/2016 SHEET REV: B
SHEET NO.: 114SUBJECT: DFLAW Effluent Management Facility Air Emissions Estimate
24590-G04B-F00012 Rev 13 (Revised12/23/2015) Ref: 24590-WTP-3DP-G04B-00037, 24590-WTP-GPG-ENG-0127
CAS # COPC PIC or
Feed/PIC
Unabated Streams Abated Streams
DEP15 DEP18
DEP Vessel Vent DEP Vessel Vent
Particulate Particulate
g/sec g/sec
32598‐13‐3 3,3',4,4'‐Tetrachlorobiphenyl (PCB 77) PIC 5.98E‐15 2.99E‐20
32598‐14‐4 2,3,3',4,4'‐Pentachlorobiphenyl (PCB 105) PIC 3.04E‐15 1.52E‐20
3268‐87‐9 Octachlorodibenzo(p)dioxin PIC 8.00E‐11 4.00E‐16
32774‐16‐6 3,3',4,4',5,5'‐Hexachlorobiphenyl (PCB 169) PIC 4.06E‐17 2.03E‐22
35822‐46‐9 1,2,3,4,6,7,8‐Heptachlorodibenzo(p)dioxin PIC 7.83E‐12 3.91E‐17
38380‐08‐4 2,3,3',4,4',5‐Hexachlorobiphenyl (PCB 156) PIC 1.94E‐15 9.68E‐21
39001‐02‐0 Octachlorodibenzofuran PIC 3.41E‐11 1.70E‐16
39227‐28‐6 1,2,3,4,7,8‐Hexachlorodibenzo(p)dioxin PIC 1.91E‐16 9.55E‐22
39635‐31‐9 2,3,3',4,4',5,5'‐Heptachlorobiphenyl (PCB 189) PIC 5.96E‐16 2.98E‐21
40321‐76‐4 1,2,3,7,8‐Pentachlorodibenzo(p)dioxin PIC 1.25E‐16 6.23E‐22
4170‐30‐3 Crotonaldehyde (Propylene aldehyde) PIC 4.31E‐10 (Note 2) 2.15E‐15
41851‐50‐7 Chlorocyclopentadiene PIC 4.31E‐10 (Note 2) 2.15E‐15
460‐19‐5 Cyanogen (oxalonitrile) PIC 4.31E‐10 (Note 2) 2.15E‐15
4786‐20‐3 2‐Butenenitrile PIC 4.31E‐10 (Note 2) 2.15E‐15
506‐68‐3 Cyanogen bromide (bromocyanide) PIC 4.31E‐10 (Note 2) 2.15E‐15
506‐77‐4 Cyanogen chloride PIC 4.31E‐10 (Note 2) 2.15E‐15
510‐15‐6 Chlorobenzilate PIC 3.29E‐10 1.65E‐15
51207‐31‐9 2,3,7,8‐Tetrachlorodibenzofuran PIC 2.67E‐11 1.34E‐16
51‐28‐5 2,4‐Dinitrophenol PIC 4.31E‐10 (Note 2) 2.15E‐15
51‐79‐6 Ethyl carbamate (urethane) PIC 4.31E‐10 (Note 2) 2.15E‐15
52663‐72‐6 2,3',4,4',5,5'‐Hexachlorobiphenyl (PCB 167) PIC 1.03E‐15 5.13E‐21
528‐29‐0 1,2‐Dinitrobenzene (o‐Dinitrobenzene) PIC 2.44E‐12 1.22E‐17
532‐27‐4 2‐Chloroacetophenone PIC 4.31E‐10 (Note 2) 2.15E‐15
534‐52‐1 4,6‐Dinitro‐o‐cresol PIC 4.31E‐10 (Note 2) 2.15E‐15
5385‐75‐1 Dibenzo(a,e)fluoranthene PIC 2.39E‐09 1.20E‐14
540‐59‐0 1,2‐Dichloroethene (total) (1,2‐Dichloroethylene)
PIC 4.31E‐10 (Note 2)
2.15E‐15
540‐73‐8 1,2‐Dimethylhydrazine PIC 4.31E‐10 (Note 2) 2.15E‐15
540‐84‐1 2,2,4‐Trimethylpentane PIC 4.31E‐10 (Note 2) 2.15E‐15
542‐75‐6 1,3‐Dichloropropene PIC 4.31E‐10 (Note 2) 2.15E‐15
542‐88‐1 Bis(chloromethyl)ether PIC 4.31E‐10 (Note 2) 2.15E‐15
55673‐89‐7 1,2,3,4,7,8,9‐Heptachlorodibenzofuran PIC 1.53E‐16 7.63E‐22
56‐55‐3 Benzo(a)anthracene PIC 1.29E‐09 6.45E‐15
57117‐31‐4 2,3,4,7,8‐Pentachlorodibenzofuran PIC 2.44E‐11 1.22E‐16
57117‐41‐6 1,2,3,7,8‐Pentachlorodibenzofuran PIC 6.67E‐11 3.33E‐16
57117‐44‐9 1,2,3,6,7,8‐Hexachlorodibenzofuran PIC 1.02E‐11 5.09E‐17
57‐24‐9 Strychnine PIC 2.42E‐09 1.21E‐14
57465‐28‐8 3,3',4,4',5‐Pentachlorobiphenyl (PCB 126) PIC 1.35E‐16 6.73E‐22
57653‐85‐7 1,2,3,6,7,8,‐Hexachlorodibenzo(p)dioxin PIC 4.20E‐16 2.10E‐21
57‐74‐9 Chlordane PIC 1.71E‐11 8.54E‐17
581‐42‐0 2,6‐Dimethylnaphthalene PIC 4.31E‐10 (Note 2) 2.15E‐15
584‐84‐9 2,4‐Toluene diisocyanate PIC 4.31E‐10 (Note 2) 2.15E‐15
58‐89‐9 gamma‐BHC (Lindane) PIC 4.31E‐10 (Note 2) 2.15E‐15
591‐50‐4 Benzene, iodo‐ PIC 4.31E‐10 (Note 2) 2.15E‐15
593‐60‐2 Bromoethene (Vinyl bromide) PIC 4.31E‐10 (Note 2) 2.15E‐15
60‐11‐7 Dimethyl aminoazobenzene PIC 1.12E‐09 5.61E‐15
606‐20‐2 2,6‐Dinitrotoluene PIC 4.31E‐10 (Note 2) 2.15E‐15
60851‐34‐5 2,3,4,6,7,8‐Hexachlorodibenzofuran PIC 1.43E‐16 7.14E‐22
608‐93‐5 Pentachlorobenzene PIC 4.31E‐10 (Note 2) 2.15E‐15
61626‐71‐9 Dichloropentadiene PIC 4.31E‐10 (Note 2) 2.15E‐15
624‐83‐9 Methyl isocyanate PIC 4.31E‐10 (Note 2) 2.15E‐15
62‐50‐0 Ethyl methanesulfonate PIC 4.31E‐10 (Note 2) 2.15E‐15
62‐53‐3 Aniline PIC 4.31E‐10 (Note 2) 2.15E‐15
64‐18‐6 Formic acid (methanoic acid) PIC 4.31E‐10 (Note 2) 2.15E‐15
65510‐44‐3 2',3,4,4',5‐Pentachlorobiphenyl (PCB 123) PIC 9.52E‐17 4.76E‐22
65‐85‐0 Benzoic acid PIC 4.31E‐10 (Note 2) 2.15E‐15
67562‐39‐4 1,2,3,4,6,7,8‐Heptachlorodibenzofuran PIC 2.12E‐16 1.06E‐21
69782‐90‐7 2,3,3',4,4',5'‐Hexachlorobiphenyl (PCB 157) PIC 6.16E‐16 3.08E‐21
70‐30‐4 Hexachlorophene PIC 2.42E‐09 1.21E‐14
70362‐50‐4 3,4,4',5‐Tetrachlorobiphenyl (PCB 81) PIC 7.25E‐17 3.62E‐22
70648‐26‐9 1,2,3,4,7,8‐Hexachlorodibenzofuran PIC 4.09E‐11 2.04E‐16
72‐43‐5 Methoxychlor PIC 3.63E‐10 1.82E‐15
72918‐21‐9 1,2,3,7,8,9‐Hexachlorodibenzofuran PIC 3.48E‐13 1.74E‐18
74472‐37‐0 2,3,4,4',5‐Pentachlorobiphenyl (PCB 114) PIC 1.22E‐16 6.12E‐22
74‐88‐4 Iodomethane PIC 4.31E‐10 (Note 2) 2.15E‐15
74‐95‐3 Methylene bromide PIC 4.31E‐10 (Note 2) 2.15E‐15

CALCULATION SHEET PROJECT: RPP-WTPJOB NO.: 24590
BY: William Hix CALC NO.: 24590-BOF-M4C-DEP-00001 DATE: 6/6/2016 SHEET REV: B
SHEET NO.: 115SUBJECT: DFLAW Effluent Management Facility Air Emissions Estimate
24590-G04B-F00012 Rev 13 (Revised12/23/2015) Ref: 24590-WTP-3DP-G04B-00037, 24590-WTP-GPG-ENG-0127
CAS # COPC PIC or
Feed/PIC
Unabated Streams Abated Streams
DEP15 DEP18
DEP Vessel Vent DEP Vessel Vent
Particulate Particulate
g/sec g/sec
74‐97‐5 Bromochloromethane PIC 4.31E‐10 (Note 2) 2.15E‐15
75‐25‐2 Bromoform PIC 4.31E‐10 (Note 2) 2.15E‐15
75‐29‐6 2‐Chloropropane PIC 4.31E‐10 (Note 2) 2.15E‐15
75‐44‐5 Phosgene (hydrogen phosphide) PIC 4.31E‐10 (Note 2) 2.15E‐15
76‐01‐7 Pentachloroethane PIC 4.31E‐10 (Note 2) 2.15E‐15
764‐41‐0 1,4‐Dichloro‐2‐butene PIC 4.31E‐10 (Note 2) 2.15E‐15
76‐44‐8 Heptachlor PIC 4.31E‐10 (Note 2) 2.15E‐15
765‐34‐4 Glycidylaldehyde PIC 4.31E‐10 (Note 2) 2.15E‐15
77‐47‐4 Hexachlorocyclopentadiene PIC 4.31E‐10 (Note 2) 2.15E‐15
77‐78‐1 Dimethyl sulfate PIC 4.31E‐10 (Note 2) 2.15E‐15
80‐62‐6 Methyl methacrylate PIC 4.31E‐10 (Note 2) 2.15E‐15
822‐06‐0 Hexamethylene‐1,5‐diisocyanate PIC 4.31E‐10 (Note 2) 2.15E‐15
823‐40‐5 Toluene‐2,6‐diamine PIC 4.31E‐10 (Note 2) 2.15E‐15
82‐68‐8 Pentachloronitrobenzene (PCNB) PIC 4.31E‐10 (Note 2) 2.15E‐15
832‐69‐9 1‐Methylphenanthrene PIC 7.07E‐11 3.54E‐16
85‐44‐9 Phthalic anhydride (1,2‐benzenedicarboxylic anhydride)
PIC 4.31E‐10 (Note 2)
2.15E‐15
87‐61‐6 1,2,3‐Trichlorobenzene PIC 4.31E‐10 (Note 2) 2.15E‐15
88‐74‐4 o‐Nitroaniline (2‐nitroaniline) PIC 4.31E‐10 (Note 2) 2.15E‐15
90‐04‐0 o‐Anisidine PIC 4.31E‐10 (Note 2) 2.15E‐15
90‐12‐0 1‐Methylnaphthalene PIC 4.31E‐10 (Note 2) 2.15E‐15
91‐22‐5 Quinoline PIC 4.31E‐10 (Note 2) 2.15E‐15
91‐57‐6 2‐Methylnaphthalene PIC 4.31E‐10 (Note 2) 2.15E‐15
91‐94‐1 3,3'‐Dichlorobenzidine PIC 1.26E‐09 6.29E‐15
924‐16‐3 N‐Nitroso‐di‐n‐Buetylamine PIC 4.31E‐10 (Note 2) 2.15E‐15
94‐59‐7 Safrole (5‐(2‐Propenyl)‐1,3‐benzodioxole) PIC 4.31E‐10 (Note 2) 2.15E‐15
94‐75‐7 2,4‐D PIC 1.24E‐10 6.22E‐16
95‐49‐8 o‐Chlorotoluene PIC 4.31E‐10 (Note 2) 2.15E‐15
95‐53‐4 o‐Toluidine PIC 4.31E‐10 (Note 2) 2.15E‐15
95‐63‐6 1,2,4‐Trimethyl benzene PIC 4.31E‐10 (Note 2) 2.15E‐15
95‐94‐3 1,2,4,5‐Tetrachlorobenzene PIC 4.31E‐10 (Note 2) 2.15E‐15
96‐12‐8 1,2‐Dibromo‐3‐chloropropane PIC 4.31E‐10 (Note 2) 2.15E‐15
96‐18‐4 1,2,3‐Trichloropropane PIC 4.31E‐10 (Note 2) 2.15E‐15
96‐45‐7 Ethylene thiourea PIC 4.31E‐10 (Note 2) 2.15E‐15
97‐63‐2 Ethyl methacrylate PIC 4.31E‐10 (Note 2) 2.15E‐15
98‐01‐1 Furfural PIC 4.31E‐10 (Note 2) 2.15E‐15
98‐06‐6 tert‐Butyl benzene PIC 4.31E‐10 (Note 2) 2.15E‐15
98‐07‐7 Benzotrichloride PIC 4.31E‐10 (Note 2) 2.15E‐15
98‐83‐9 Methyl styrene (mixed isomers) PIC 4.31E‐10 (Note 2) 2.15E‐15
99‐35‐4 1,3,5‐Trinitrobenzene PIC 1.95E‐11 9.76E‐17
99‐65‐0 1,3‐Dinitrobenzene PIC 4.31E‐10 (Note 2) 2.15E‐15
99‐87‐6 p‐Cymene PIC 4.31E‐10 (Note 2) 2.15E‐15
105‐67‐9 2,4‐Dimethylphenol PIC 4.31E‐10 (Note 2) 2.15E‐15
Total 6.99E‐08 3.50E‐13
100‐02‐7 p‐Nitrophenol Feed/PIC
Note 1
100‐42‐5 Styrene Feed/PIC
106‐46‐7 1,4‐Dichlorobenzene Feed/PIC
107‐06‐2 1,2‐Dichloroethane Feed/PIC
107‐13‐1 Acrylonitrile Feed/PIC
108‐88‐3 Toluene Feed/PIC
108‐90‐7 Chlorobenzene Feed/PIC
108‐95‐2 Phenol Feed/PIC
117‐81‐7 bis(2‐Ethylhexyl)phthalate Feed/PIC
120‐12‐7 Anthracene Feed/PIC
121‐14‐2 2,4‐Dinitrotoluene Feed/PIC
129‐00‐0 Pyrene Feed/PIC
1330‐20‐7 Xylenes (total) Feed/PIC
191‐24‐2 Benzo(g,h,i)perylene Feed/PIC
193‐39‐5 Indeno(1,2,3‐cd)pyrene Feed/PIC
206‐44‐0 Fluoranthene Feed/PIC
208‐96‐8 Acenaphthylene Feed/PIC
53‐70‐3 Dibenz[a,h]anthracene Feed/PIC
56‐23‐5 Carbon tetrachloride Feed/PIC
67‐64‐1 2‐Propanone (Acetone) Feed/PIC
67‐66‐3 Chloroform Feed/PIC
71‐43‐2 Benzene Feed/PIC
74‐83‐9 Bromomethane Feed/PIC
74‐87‐3 Chloromethane Feed/PIC
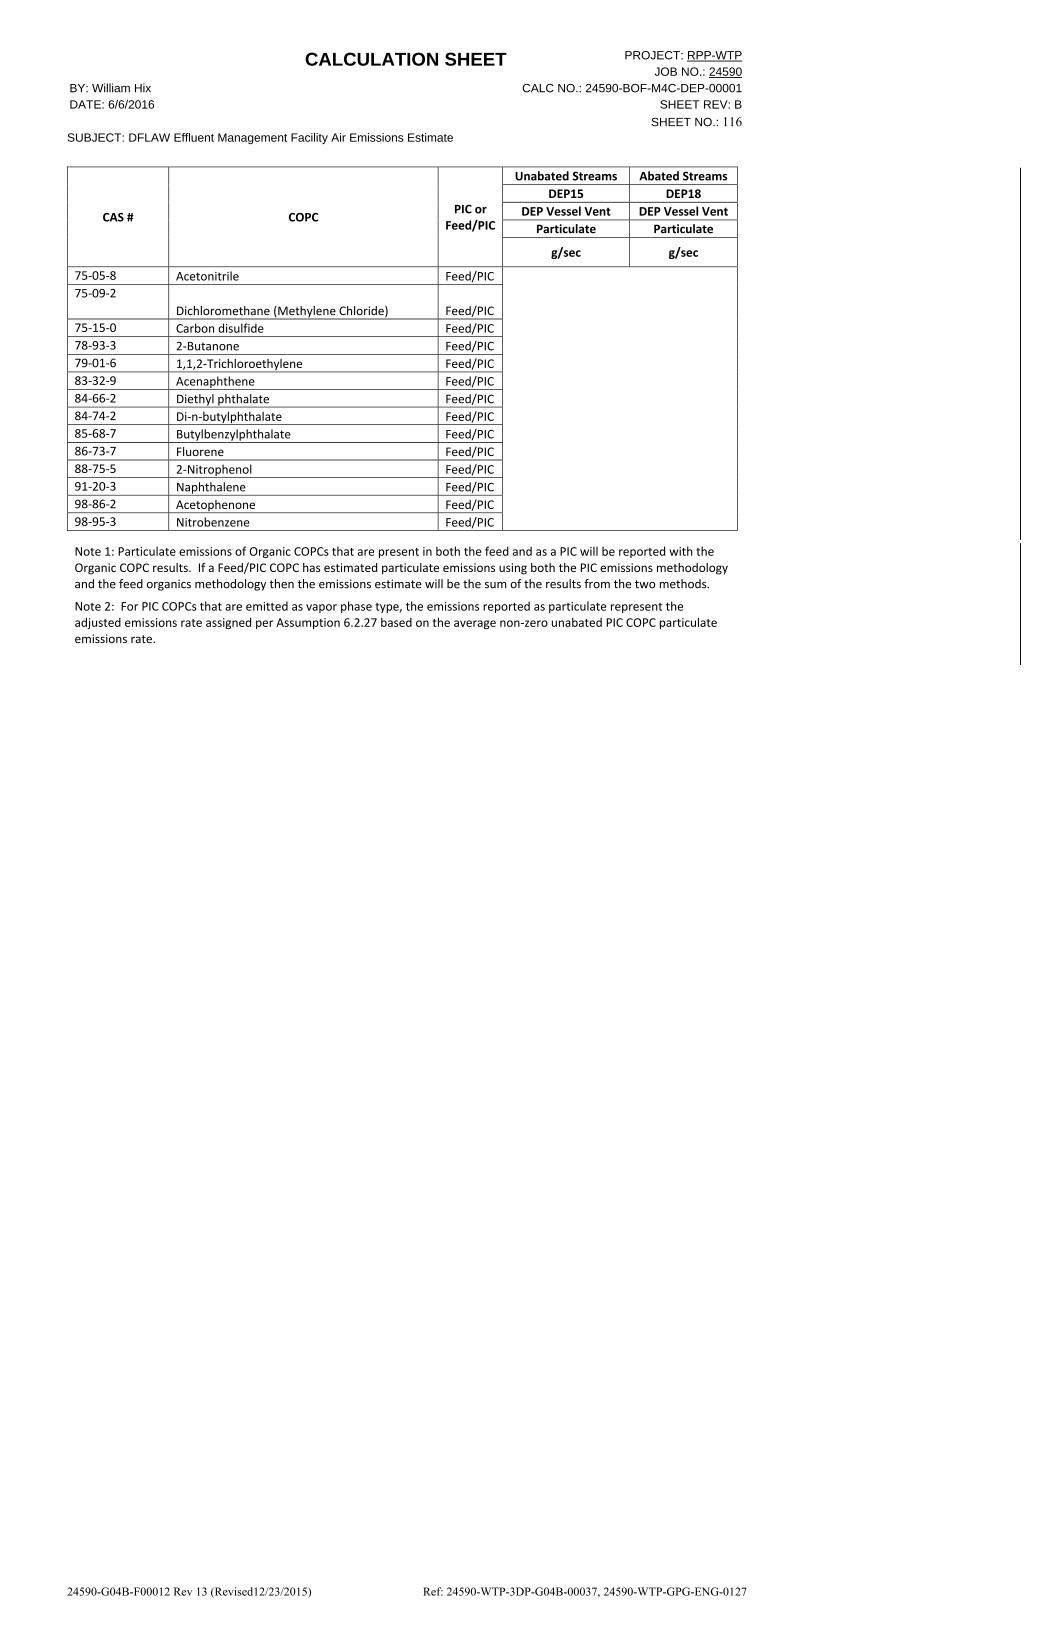
CALCULATION SHEET PROJECT: RPP-WTPJOB NO.: 24590
BY: William Hix CALC NO.: 24590-BOF-M4C-DEP-00001 DATE: 6/6/2016 SHEET REV: B
SHEET NO.: 116SUBJECT: DFLAW Effluent Management Facility Air Emissions Estimate
24590-G04B-F00012 Rev 13 (Revised12/23/2015) Ref: 24590-WTP-3DP-G04B-00037, 24590-WTP-GPG-ENG-0127
CAS # COPC PIC or
Feed/PIC
Unabated Streams Abated Streams
DEP15 DEP18
DEP Vessel Vent DEP Vessel Vent
Particulate Particulate
g/sec g/sec
75‐05‐8 Acetonitrile Feed/PIC
75‐09‐2
Dichloromethane (Methylene Chloride) Feed/PIC
75‐15‐0 Carbon disulfide Feed/PIC
78‐93‐3 2‐Butanone Feed/PIC
79‐01‐6 1,1,2‐Trichloroethylene Feed/PIC
83‐32‐9 Acenaphthene Feed/PIC
84‐66‐2 Diethyl phthalate Feed/PIC
84‐74‐2 Di‐n‐butylphthalate Feed/PIC
85‐68‐7 Butylbenzylphthalate Feed/PIC
86‐73‐7 Fluorene Feed/PIC
88‐75‐5 2‐Nitrophenol Feed/PIC
91‐20‐3 Naphthalene Feed/PIC
98‐86‐2 Acetophenone Feed/PIC
98‐95‐3 Nitrobenzene Feed/PIC
Note 1: Particulate emissions of Organic COPCs that are present in both the feed and as a PIC will be reported with the Organic COPC results. If a Feed/PIC COPC has estimated particulate emissions using both the PIC emissions methodology and the feed organics methodology then the emissions estimate will be the sum of the results from the two methods.
Note 2: For PIC COPCs that are emitted as vapor phase type, the emissions reported as particulate represent the adjusted emissions rate assigned per Assumption 6.2.27 based on the average non‐zero unabated PIC COPC particulate emissions rate.

CALCULATION SHEET PROJECT: RPP-WTPJOB NO.: 24590
BY: William Hix CALC NO.: 24590-BOF-M4C-DEP-00001 DATE: 6/6/2016 SHEET REV: B
SHEET NO.: 117SUBJECT: DFLAW Effluent Management Facility Air Emissions Estimate
24590-G04B-F00012 Rev 13 (Revised12/23/2015) Ref: 24590-WTP-3DP-G04B-00037, 24590-WTP-GPG-ENG-0127
Table 8-6 – Inorganic COPC Emissions from DVP System
CAS # COPC
Unabated Streams Abated Streams
DEP15 DEP18
DEP Vessel Vent DEP Vessel Vent
g/sec g/sec
7440‐22‐4 Ag 1.92E‐07 9.59E‐13
7429‐90‐5 Al 2.12E‐04 1.06E‐09
7440‐38‐2 As 2.64E‐07 1.32E‐12
7440‐39‐3 Ba 4.56E‐07 2.28E‐12
7440‐41‐7 Be 2.39E‐08 1.20E‐13
24959‐67‐9 Br 5.36E‐07 2.68E‐12
7440‐43‐9 Cd 4.06E‐07 2.03E‐12
16887‐00‐6 Cl 2.02E‐05 1.01E‐10
57‐12‐5 CN (c) 1.26E‐04 1.26E‐04
7440‐48‐4 Co 8.02E‐08 4.01E‐13
7440‐47‐3 Cr 1.44E‐05 7.20E‐11
7440‐50‐8 Cu 1.46E‐07 7.28E‐13
16984‐48‐8 F 3.14E‐05 1.57E‐10
7439‐89‐6 Fe 3.09E‐05 1.54E‐10
7439‐97‐6 Hg 1.48E‐07 7.38E‐13
7439‐93‐2 Li 1.00E‐07 5.01E‐13
7439‐95‐4 Mg 1.13E‐06 5.67E‐12
7439‐96‐5 Mn 4.02E‐06 2.01E‐11
7439‐98‐7 Mo 3.35E‐07 1.68E‐12
7440‐23‐5 Na 1.21E‐03 6.04E‐09
7664‐41‐7 NH3 (c) 1.01E‐01 1.01E‐01
7440‐02‐0 Ni 2.41E‐06 1.20E‐11
14797‐65‐0 NO2 2.90E‐04 1.45E‐09
14797‐55‐8 NO3 1.36E‐03 6.81E‐09
7723‐14‐0 P 0.00E+00 0.00E+00
7439‐92‐1 Pb 2.01E‐06 1.01E‐11
14265‐44‐2 PO4 1.26E‐04 6.29E‐10
7440‐16‐6 Rh 3.02E‐07 1.51E‐12
7704‐34‐9 S 0.00E+00 0.00E+00
7440‐36‐0 Sb 2.08E‐07 1.04E‐12
7782‐49‐2 Se 2.94E‐07 1.47E‐12
7440‐31‐5 Sn 2.83E‐07 1.41E‐12
14808‐79‐8 SO4 9.39E‐05 4.69E‐10
7440‐24‐6 Sr 1.03E‐06 5.16E‐12
7440‐25‐7 Ta 9.83E‐08 4.92E‐13
7440‐28‐0 Tl 7.63E‐07 3.81E‐12
7440‐61‐1 UTOTAL 1.57E‐05 7.87E‐11
7440‐62‐2 V 1.33E‐07 6.63E‐13
7440‐33‐7 W 2.06E‐06 1.03E‐11
7440‐65‐5 Y 8.18E‐08 4.09E‐13
7440‐66‐6 Zn 2.87E‐07 1.43E‐12
7440‐67‐7 Zr 9.97E‐06 4.98E‐11
593‐74‐8 Dimethyl Mercury (c) 5.29E‐07 5.29E‐07
10102‐44‐0 Nitrogen dioxide (a) 0.00E+00 0.00E+00
124‐38‐9 Carbon dioxide (a) 0.00E+00 0.00E+00
630‐08‐0 Carbon monoxide (a) 0.00E+00 0.00E+00
10028‐15‐6 Ozone (a) 0.00E+00 0.00E+00
7446‐09‐5 Sulfur dioxide (a) 0.00E+00 0.00E+00
7647‐01‐0 Hydrogen chloride (a) 0.00E+00 0.00E+00
7664‐39‐3 Hydrogen Fluoride (a) 0.00E+00 0.00E+00
7782‐41‐4 Fluorine gas (a) 0.00E+00 0.00E+00
7782‐50‐5 Chlorine (a) 0.00E+00 0.00E+00
22967‐92‐6 Methyl mercury (b) 0.00E+00 0.00E+00
TOTAL 1.04E‐01 1.01E‐01
(a) Emissions of these stack inorganic COPCs are zero (Assumption 6.1.31). (b) Methyl mercury emissions are grouped with total mercury emissions (Assumption 6.2.25) (c) COPCs emitted in vapor phase
Table 8-7 – Total Particulate Emissions from DVP System
Unabated Streams Abated Streams
DEP15 DEP18
DEP Vessel Vent DEP Vessel Vent
g/sec g/sec
Feed Inorganic Particulate 3.43E‐03 1.72E‐08
Radionuclide Particulate 1.72E‐05 8.60E‐11
Feed Organic Particulate 6.23E‐08 3.12E‐13
PIC Particulate 6.99E‐08 3.50E‐13
TOTAL Particulate 3.45E‐03 1.73E‐08
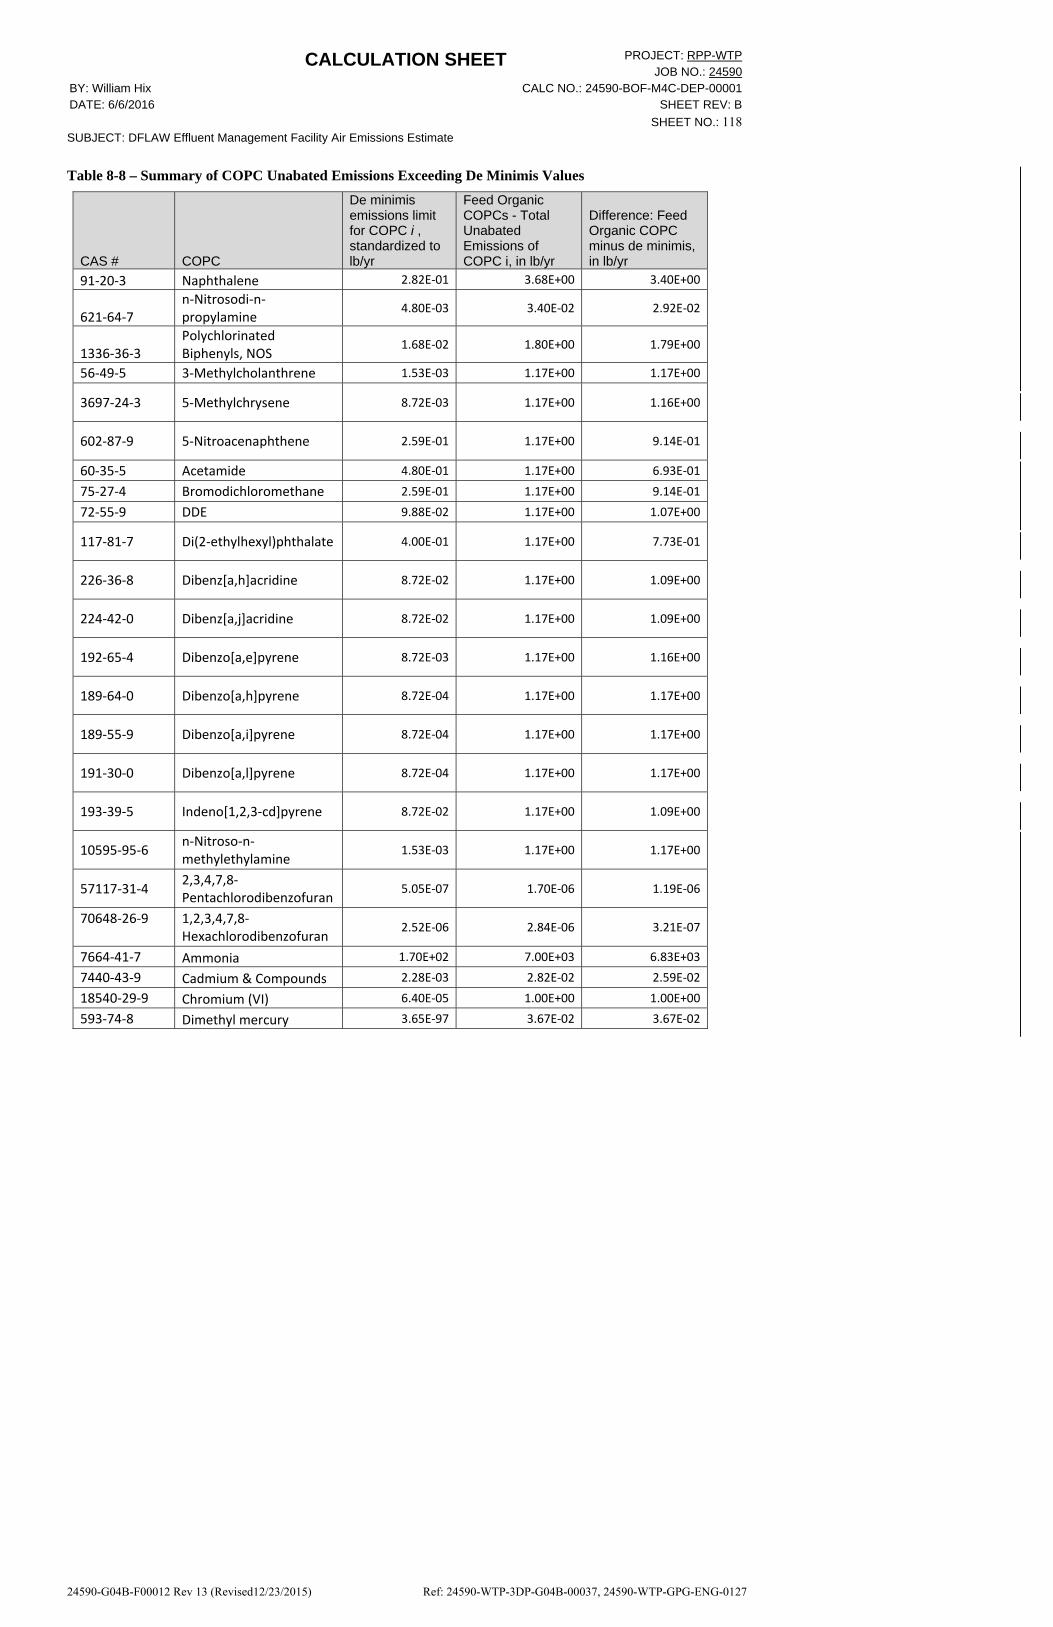
CALCULATION SHEET PROJECT: RPP-WTPJOB NO.: 24590
BY: William Hix CALC NO.: 24590-BOF-M4C-DEP-00001 DATE: 6/6/2016 SHEET REV: B
SHEET NO.: 118SUBJECT: DFLAW Effluent Management Facility Air Emissions Estimate
24590-G04B-F00012 Rev 13 (Revised12/23/2015) Ref: 24590-WTP-3DP-G04B-00037, 24590-WTP-GPG-ENG-0127
Table 8-8 – Summary of COPC Unabated Emissions Exceeding De Minimis Values
CAS # COPC
De minimis emissions limit for COPC i , standardized to lb/yr
Feed Organic COPCs - Total Unabated Emissions of COPC i, in lb/yr
Difference: Feed Organic COPC minus de minimis, in lb/yr
91‐20‐3 Naphthalene 2.82E‐01 3.68E+00 3.40E+00
621‐64‐7 n‐Nitrosodi‐n‐propylamine
4.80E‐03 3.40E‐02 2.92E‐02
1336‐36‐3 Polychlorinated Biphenyls, NOS
1.68E‐02 1.80E+00 1.79E+00
56‐49‐5 3‐Methylcholanthrene 1.53E‐03 1.17E+00 1.17E+00
3697‐24‐3 5‐Methylchrysene 8.72E‐03 1.17E+00 1.16E+00
602‐87‐9 5‐Nitroacenaphthene 2.59E‐01 1.17E+00 9.14E‐01
60‐35‐5 Acetamide 4.80E‐01 1.17E+00 6.93E‐01
75‐27‐4 Bromodichloromethane 2.59E‐01 1.17E+00 9.14E‐01
72‐55‐9 DDE 9.88E‐02 1.17E+00 1.07E+00
117‐81‐7 Di(2‐ethylhexyl)phthalate 4.00E‐01 1.17E+00 7.73E‐01
226‐36‐8 Dibenz[a,h]acridine 8.72E‐02 1.17E+00 1.09E+00
224‐42‐0 Dibenz[a,j]acridine 8.72E‐02 1.17E+00 1.09E+00
192‐65‐4 Dibenzo[a,e]pyrene 8.72E‐03 1.17E+00 1.16E+00
189‐64‐0 Dibenzo[a,h]pyrene 8.72E‐04 1.17E+00 1.17E+00
189‐55‐9 Dibenzo[a,i]pyrene 8.72E‐04 1.17E+00 1.17E+00
191‐30‐0 Dibenzo[a,l]pyrene 8.72E‐04 1.17E+00 1.17E+00
193‐39‐5 Indeno[1,2,3‐cd]pyrene 8.72E‐02 1.17E+00 1.09E+00
10595‐95‐6 n‐Nitroso‐n‐methylethylamine
1.53E‐03 1.17E+00 1.17E+00
57117‐31‐4 2,3,4,7,8‐Pentachlorodibenzofuran
5.05E‐07 1.70E‐06 1.19E‐06
70648‐26‐9
1,2,3,4,7,8‐Hexachlorodibenzofuran
2.52E‐06 2.84E‐06 3.21E‐07
7664‐41‐7 Ammonia 1.70E+02 7.00E+03 6.83E+03
7440‐43‐9 Cadmium & Compounds 2.28E‐03 2.82E‐02 2.59E‐02
18540‐29‐9 Chromium (VI) 6.40E‐05 1.00E+00 1.00E+00
593‐74‐8 Dimethyl mercury 3.65E‐97 3.67E‐02 3.67E‐02
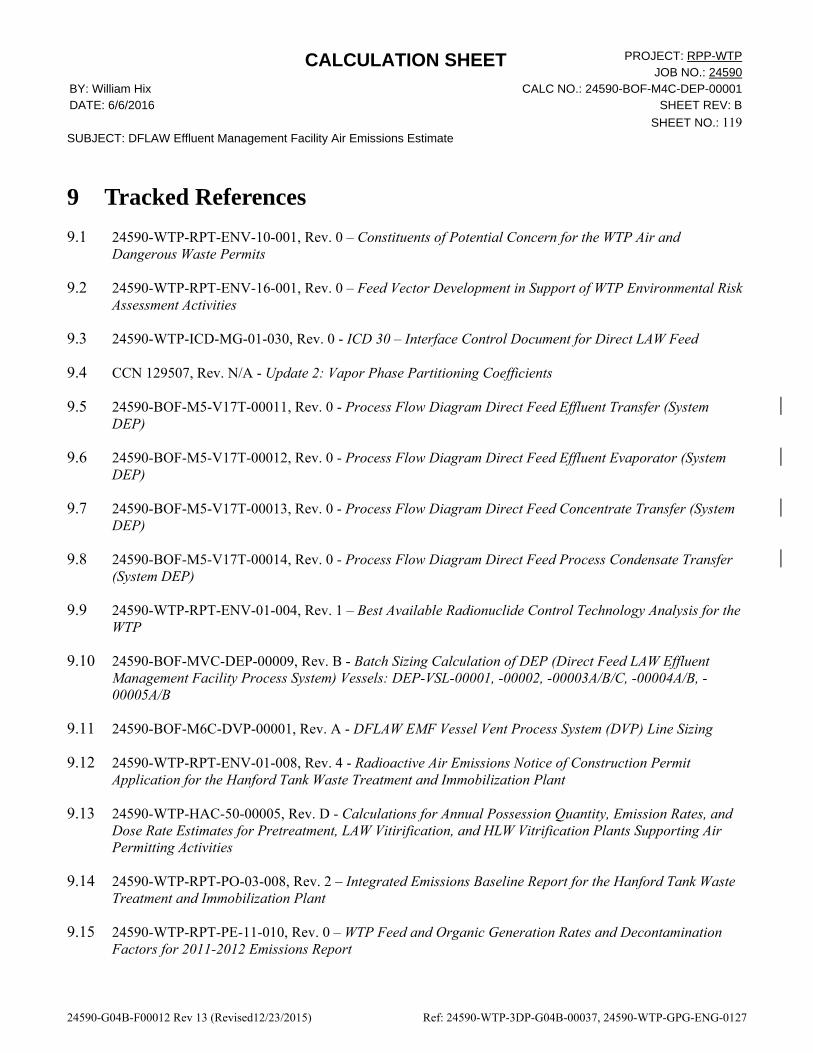
CALCULATION SHEET PROJECT: RPP-WTPJOB NO.: 24590
BY: William Hix CALC NO.: 24590-BOF-M4C-DEP-00001 DATE: 6/6/2016 SHEET REV: B
SHEET NO.: 119SUBJECT: DFLAW Effluent Management Facility Air Emissions Estimate
24590-G04B-F00012 Rev 13 (Revised12/23/2015) Ref: 24590-WTP-3DP-G04B-00037, 24590-WTP-GPG-ENG-0127
9 Tracked References
9.1 24590-WTP-RPT-ENV-10-001, Rev. 0 – Constituents of Potential Concern for the WTP Air and Dangerous Waste Permits
9.2 24590-WTP-RPT-ENV-16-001, Rev. 0 – Feed Vector Development in Support of WTP Environmental Risk Assessment Activities
9.3 24590-WTP-ICD-MG-01-030, Rev. 0 - ICD 30 – Interface Control Document for Direct LAW Feed
9.4 CCN 129507, Rev. N/A - Update 2: Vapor Phase Partitioning Coefficients
9.5 24590-BOF-M5-V17T-00011, Rev. 0 - Process Flow Diagram Direct Feed Effluent Transfer (System DEP)
9.6 24590-BOF-M5-V17T-00012, Rev. 0 - Process Flow Diagram Direct Feed Effluent Evaporator (System DEP)
9.7 24590-BOF-M5-V17T-00013, Rev. 0 - Process Flow Diagram Direct Feed Concentrate Transfer (System DEP)
9.8 24590-BOF-M5-V17T-00014, Rev. 0 - Process Flow Diagram Direct Feed Process Condensate Transfer (System DEP)
9.9 24590-WTP-RPT-ENV-01-004, Rev. 1 – Best Available Radionuclide Control Technology Analysis for the WTP
9.10 24590-BOF-MVC-DEP-00009, Rev. B - Batch Sizing Calculation of DEP (Direct Feed LAW Effluent Management Facility Process System) Vessels: DEP-VSL-00001, -00002, -00003A/B/C, -00004A/B, -00005A/B
9.11 24590-BOF-M6C-DVP-00001, Rev. A - DFLAW EMF Vessel Vent Process System (DVP) Line Sizing
9.12 24590-WTP-RPT-ENV-01-008, Rev. 4 - Radioactive Air Emissions Notice of Construction Permit Application for the Hanford Tank Waste Treatment and Immobilization Plant
9.13 24590-WTP-HAC-50-00005, Rev. D - Calculations for Annual Possession Quantity, Emission Rates, and Dose Rate Estimates for Pretreatment, LAW Vitirification, and HLW Vitrification Plants Supporting Air Permitting Activities
9.14 24590-WTP-RPT-PO-03-008, Rev. 2 – Integrated Emissions Baseline Report for the Hanford Tank Waste Treatment and Immobilization Plant
9.15 24590-WTP-RPT-PE-11-010, Rev. 0 – WTP Feed and Organic Generation Rates and Decontamination Factors for 2011-2012 Emissions Report

CALCULATION SHEET PROJECT: RPP-WTPJOB NO.: 24590
BY: William Hix CALC NO.: 24590-BOF-M4C-DEP-00001 DATE: 6/6/2016 SHEET REV: B
SHEET NO.: 120SUBJECT: DFLAW Effluent Management Facility Air Emissions Estimate
24590-G04B-F00012 Rev 13 (Revised12/23/2015) Ref: 24590-WTP-3DP-G04B-00037, 24590-WTP-GPG-ENG-0127
9.16 24590-PTF-3YD-CNP-00001, Rev. 2 – System Description for the Cesium Nitric Acid Recovery Process – System CNP
9.17 24590-BOF-MEC-DEP-00001, Rev. A - DFLAW EMF Process System (DEP) Evaporator Operating Conditions, Heating/Cooling Duty, and Utility Requirements
9.18 24590-WTP-M3C-50-00001, Rev. 1 – Physical Properties Equations for Liquid Water
9.19 24590-WTP-M4C-V37T-00011, Rev. 0, FEP and TLP Evaporator and Condensers Decontamination Factor Calculation
9.20 24590-LAW-MVC-RLD-00007, Rev. 0 - Process Data Input for LAW SBS Condensate Collection Vessel, RLD-VSL-00005 and Discharge Pumps (RLD-PMP-00003A/B)
9.21 24590-LAW-MVC-RLD-00009, Rev. 0 - Process Data Input for LAW C3/C5 Drains/Sump Collection Vessel (RLD-VSL-00004) and Transfer Pumps (RLD-PMP-00002A/B) as modified by the following ECCNs:
(1) 24590-LAW-MVE-RLD-00001 - Change to Safety Factor Value for the High Humidity Case Listed in Calculation 24590-LAW-MVC-RLD-00009
(2) 24590-LAW-MVE-RLD-00002 - Provide Adequate and Proper Verification on document 24590-LAW-MVC-RLD-00009
9.22 24590-WTP-DB-PET-09-001, Rev. 1 - Process Inputs Basis of Design (PIBOD)
9.23 24590-WTP-M4C-V11T-00012, Rev. 2 – Calculation of Process Stream Properties for the WTP
9.24 CCN 160522, Rev. N/A - SRNL Letter "Input for Dimethylmercury Formation and Partitioning"
9.25 24590-WTP-M4C-V11T-00013, Rev. A – Estimated Concentrations of Dimethylmercury in WTP Process Streams
9.26 24590-LAW-MVC-LVP-00001, Rev. 2, Sizing Calculation for Caustic Collection Tank LVP-TK-00001
9.27 24590-BOF-MVC-DEP-00011, Rev. B - Process Data for the Low Point Drain Vessel, DEP-VSL-00001, and Pumps, DEP-PMP-00001A/B
9.28 24590-PTF-MEC-CNP-00004, Rev. B – Loop Volume Calculation for CNP Evaporator Recirculation Loop
9.29 24590-WTP-RPT-PR-01-011, Rev. 0 – Mercury Pathway and Treatment Assessment for the WTP
9.30 24590-WTP-CSER-ENS-08-0001, Rev. 0b – Preliminary Criticality Safety Evaluation Report for the WTP
9.31 24590-BOF-MVC-DEP-00003, Rev. A - Process Data for the Evaporator Feed Vessel (DEP-VSL-00002), Transfer Pumps (DEP-PMP-00002A/B), and Recirculation Pumps (DEP-PMP-00012A/B/C)
9.32 24590-BOF-MVC-DEP-00010, Rev. A - Process Data for the Evaporator Concentrate Vessels, DEP-VSL-00003A/B/C, and Pumps, DEP-PMP-00003A/B

CALCULATION SHEET PROJECT: RPP-WTPJOB NO.: 24590
BY: William Hix CALC NO.: 24590-BOF-M4C-DEP-00001 DATE: 6/6/2016 SHEET REV: B
SHEET NO.: 121SUBJECT: DFLAW Effluent Management Facility Air Emissions Estimate
24590-G04B-F00012 Rev 13 (Revised12/23/2015) Ref: 24590-WTP-3DP-G04B-00037, 24590-WTP-GPG-ENG-0127
9.33 24590-BOF-MVC-DEP-00007, Rev. A - Process Data for the Overhead Sampling Vessels (DEP-VSL-00004A/B) and Pumps (DEP-PMP-00004A/B/C)
9.34 24590-BOF-MVC-DEP-00008, Rev. A - Process Data for the Process Condensate Lag Storage Vessels (DEP-VSL-00005A/B), Transfer Pumps (DEP-PMP-00005A/B), and Recirculation Pumps (DEP-PMP-00015A/B/C)
9.35 24590-PTF-3YD-TLP-00001, Rev. 2 – System Description for the Treated LAW Evaporation Process (TLP)
9.36 24590-BOF-M8-C3V-00002001, Rev. A – BOF/EMF Utility/Process Bldgs – Plant Room V&ID ACV Exhaust System
9.37 24590-CM-HC4-W000-00193-01-00001, Rev. A, Report - Aerosol Production in WTP Process Vessels - A Review of Recent Aerosol Testing
10 References
10.1 Risk Assessment Information System. Oak Ridge National Laboratory. http://rais.ornl.gov/cgi-bin/tools/TOX_search?select=rad_spef (Accessed 05/27/2016, see Attachment B).
10.2 DOE-HDBK-3010-94 - DOE Handbook Airborne Release Fractions/Rates and Respirable Fractions for Nonreactor Nuclear Facilities Volume I - Analysis of Experimental Data. Department of Energy. December 1994, Reaffirmed 2013.
10.3 Lindeburg, Michael R. 2013. Chemical Engineering Reference Manual for the PE Exam. Seventh Edition. Professional Publications, Inc., Belmont, CA.
10.4 DOE 2000. DOE Contract, DE-AC27-01RV14136, US Department of Energy, Office of River Protection, Richland, WA, USA.
10.5 Flow of Fluids through Valves, Fittings, and Pipe, Crane Co., Technical Paper No. 410. 2011.
10.6 Nudat 2.6. National Nuclear Data Center, Brookhaven National Laboratory. http://www.nndc.bnl.gov/nudat2/ (Accessed 05/27/2016, see Attachment D).
10.7 Washington Administrative Code (WAC) 173-460-150 - Table of ASIL, SQER and de minimis emission values.
10.8 Washington Administrative Code (WAC) 246-247-030 - Definitions.
10.9 Sander, Rolf. 1999. Compilation of Henry’s Law Constants for Inorganic and Organic Species of Potential Importance in Environmental Chemistry. Max-Planck Institute of Chemistry. Mainz, Germany. http://www.henrys-law.org/henry-3.0.pdf (Accessed 05/27/2016)
10.10 Adamson D, Nash C, McCabe D, et al. 2014. SRNL-STI-2013-00713, Rev. 0, Laboratory Evaporation Testing of Hanford Waste Treatment Plant Low Activity Waste Off-Gas Condensate Simulant. Savannah

CALCULATION SHEET PROJECT: RPP-WTPJOB NO.: 24590
BY: William Hix CALC NO.: 24590-BOF-M4C-DEP-00001 DATE: 6/6/2016 SHEET REV: B
SHEET NO.: 122SUBJECT: DFLAW Effluent Management Facility Air Emissions Estimate
24590-G04B-F00012 Rev 13 (Revised12/23/2015) Ref: 24590-WTP-3DP-G04B-00037, 24590-WTP-GPG-ENG-0127
River National Laboratory, Aiken SC. http://sti.srs.gov/fulltext/SRNL-STI-2013-00713.pdf (Last Accessed: 05/27/2016).
10.11 US EPA. Estimation Programs Interface Suite (EPISuite). Accessed through: http://www.chemspider.com/Chemical-Structure.217.html?rid=b473eee8-4999-4b4a-85a9-c50b710ea68d => Properties Tab => EPISuite Tab. (Last Accessed: 05/27/2016).
11 Attachments
Attachment A - WTP COPCs Complete List
Attachment B - Radionuclide COPC Specific Activities
Attachment C – Media File 24590-RMCD-04955
Attachment D - Extracted Radionuclide Properties from NuDat 2.6 Database (Ref. 10.6)
Attachment E - Phase Emissions Sensitivity Analysis for 14C and 3H
Attachment F - Stream Properties Extracted from PIBOD Runs
Attachment G - DFLAW Bounding Feed Vector Batch Properties

BY: William Hix DATE: 6/6/2016 CALCULATION SHEET CALC NO.: 24590-BOF-M4C-DEP-00001 SUBJECT: DFLAW Effluent Management Facility Air Emissions Estimate SHEET REV: B SHEET NO.: A-1
24590-G04B-F00012 Rev 13 (12/23/2015) Ref: 24590-WTP-3DP-G04B-00037, 24590-WTP-GPG-ENG-0127
Attachment A - WTP COPCs Complete List
The following tables list the chemicals and radionuclides considered COPCs for WTP per Ref. 9.1 Table 2-1. Table A-1 – WTP Radionuclide COPCs
CAS # COPC
13967-48-1 106Ru 378253-44-2 113mCd 14234-35-6 125Sb 15832-50-5 126Sn 15046-84-1 129I 13967-70-9 134Cs 10045-97-3 137Cs 378253-40-8 137mBa 14762-75-5 14C 15715-94-3 151Sm 14683-23-9 152Eu 15585-10-1 154Eu 14391-16-3 155Eu 13982-63-3 226Ra 14952-40-0 227Ac 15262-20-1 228Ra 15594-54-4 229Th 14331-85-2 231Pa 7440-29-1 232Th 14158-29-3 232U 13968-55-3 233U 13966-29-5 234U 15117-96-1 235U 13982-70-2 236U 13994-20-2 237Np 13981-16-3 238Pu 7440-61-1R 238U 15117-48-3 239Pu 14119-33-6 240Pu 14596-10-2 241Am 14119-32-5 241Pu 15510-73-3 242Cm 13982-10-0 242Pu 14993-75-0 243Am 15757-87-6 243Cm 13981-15-2 244Cm 10028-17-8 3H 14336-70-0 59Ni 10198-40-0 60Co 13981-37-8 63Ni 15758-45-9 79Se 10098-97-2 90Sr 10098-91-6 90Y 378782-82-2 93mNb 15751-77-6 93Zr 14133-76-7 99Tc

BY: William Hix DATE: 6/6/2016 CALCULATION SHEET CALC NO.: 24590-BOF-M4C-DEP-00001 SUBJECT: DFLAW Effluent Management Facility Air Emissions Estimate SHEET REV: B SHEET NO.: A-2
24590-G04B-F00012 Rev 13 (12/23/2015) Ref: 24590-WTP-3DP-G04B-00037, 24590-WTP-GPG-ENG-0127
Table A-2 – WTP Organic COPCs
CAS # COPC Feed
Organic PIC Feed/PIC (a)
630-20-6 1,1,1,2-Tetrachloroethane X 71-55-6 1,1,1-Trichloroethane X 79-34-5 1,1,2,2-Tetrachloroethane X 127-18-4 Tetrachloroethene X 79-00-5 1,1,2-Trichloroethane X 79-01-6 Trichloroethene X 92-52-4 Biphenyl X 75-34-3 1,1-Dichloroethane X 75-35-4 1,1-Dichloroethene X 76-13-1 1,1,2-Trichloro-1,2,2-trifluoroethane X 120-82-1 1,2,4-Trichlorobenzene X 95-50-1 1,2-Dichlorobenzene X 107-06-2 1,2-Dichloroethane X 78-87-5 1,2-Dichloropropane X 106-88-7 1,2-Epoxybutane X 156-60-5 1,2-trans-Dichloroethene X 106-99-0 1,3-Butadiene X 541-73-1 1,3-Dichlorobenzene X 106-46-7 1,4-Dichlorobenzene X 123-91-1 1,4-Dioxane X 75-01-4 Vinyl chloride X 58-90-2 2,3,4,6-Tetrachlorophenol X 95-95-4 2,4,5-Trichlorophenol X 88-06-2 2,4,6-Trichlorophenol X 120-83-2 2,4-Dichlorophenol X 121-14-2 2,4-Dinitrotoluene X 128-37-0 2,6-Bis(1,1-dimethylethyl)-4-methylphenol X 78-93-3 2-Butanone X 111-76-2 2-Butoxyethanol X 91-58-7 2-Chloronaphthalene X 95-57-8 2-Chlorophenol X 110-80-5 2-Ethoxyethanol X 104-76-7 2-Ethyl-1-hexanol X 591-78-6 2-Hexanone X 126-98-7 2-Methyl-2-propenenitrile X 78-83-1 Isobutanol X 88-75-5 2-Nitrophenol X 79-46-9 2-Nitropropane X 67-64-1 Acetone X 79-10-7 2-Propenoic acid X 67-63-0 Isopropyl alcohol X 107-05-1 3-Chloropropene X 589-38-8 3-Hexanone X 56-49-5 3-Methylcholanthrene X 72-55-9 4,4-DDE X 101-55-3 4-Bromophenylphenyl ether X 59-50-7 4-Chloro-3-methylphenol X 100-40-3 4-Ethenylcyclohexene X 108-10-1 Hexone X 3697-24-3 5-Methylchrysene X 602-87-9 5-Nitroacenaphthene X 83-32-9 Acenaphthene X 208-96-8 Acenaphthylene X

BY: William Hix DATE: 6/6/2016 CALCULATION SHEET CALC NO.: 24590-BOF-M4C-DEP-00001 SUBJECT: DFLAW Effluent Management Facility Air Emissions Estimate SHEET REV: B SHEET NO.: A-3
24590-G04B-F00012 Rev 13 (12/23/2015) Ref: 24590-WTP-3DP-G04B-00037, 24590-WTP-GPG-ENG-0127
CAS # COPC Feed
Organic PIC Feed/PIC (a)
75-07-0 Acetaldehyde X 60-35-5 Acetamide X 141-78-6 Ethyl acetate X 108-05-4 vinyl acetate X 75-05-8 Acetonitrile X 98-86-2 Acetophenone X 107-02-8 Acrolein X 107-13-1 Acrylonitrile X 134-32-7 alpha-Naphthylamine X 120-12-7 Anthracene X 71-43-2 Benzene X 50-32-8 Benzo(a)pyrene X 191-24-2 Benzo(ghi)perylene X 117-81-7 Bis(2-ethylhexyl)phthalate X 75-27-4 Bromodichloromethane X 74-83-9 Bromomethane X 123-72-8 Butanal X 85-68-7 Butylbenzylphthalate X 56-23-5 Carbon tetrachloride X 108-90-7 Chlorobenzene X 75-45-6 Chlorodifluoromethane X 75-00-3 Chloroethane X 67-66-3 Chloroform X 74-87-3 Chloromethane X 10061-01-5 cis-1,3-Dichloropropene X 108-39-4 m-Cresol X 95-48-7 2-Methylphenol X 98-82-8 Isopropylbenzene X 110-82-7 Cyclohexane X 108-94-1 Cyclohexanone X 226-36-8 Dibenz[a,h]acridine X 53-70-3 Dibenz[a,h]anthracene X 224-42-0 Dibenz[a,j]acridine X 191-30-0 Dibenzo(a,l)pyrene X 192-65-4 Dibenzo[a,e]pyrene X 189-64-0 Dibenzo[a,h]pyrene X 189-55-9 Dibenzo[a,i]pyrene X 75-71-8 Dichlorodifluoromethane X 75-09-2 Methylenechloride X 84-66-2 Diethylphthalate X 84-74-2 Di-n-butylphthalate X 117-84-0 Di-n-octylphthalate X 100-41-4 Ethylbenzene X 60-29-7 Ethyl ether X 106-93-4 Ethylene dibromide X 75-21-8 Ethylene oxide (Oxirane) X 206-44-0 Fluoranthene X 86-73-7 Fluorene X 75-02-5 Fluoroethene (vinyl fluoride) X 50-00-0 Formaldehyde X 87-68-3 Hexachlorobutadiene X 67-72-1 Hexachloroethane X 628-73-9 Hexanenitrile X 193-39-5 Indeno(1,2,3-cd)pyrene X

BY: William Hix DATE: 6/6/2016 CALCULATION SHEET CALC NO.: 24590-BOF-M4C-DEP-00001 SUBJECT: DFLAW Effluent Management Facility Air Emissions Estimate SHEET REV: B SHEET NO.: A-4
24590-G04B-F00012 Rev 13 (12/23/2015) Ref: 24590-WTP-3DP-G04B-00037, 24590-WTP-GPG-ENG-0127
CAS # COPC Feed
Organic PIC Feed/PIC (a)
67-56-1 Methyl alcohol X 1634-04-4 tert-Butyl methyl ether X 122-39-4 Diphenyl amine X 91-20-3 Naphthalene X 109-74-0 Butanenitrile X 71-36-3 1-Butanol X 110-54-3 Hexane X 98-95-3 Nitrobenzene X 621-64-7 N-Nitroso-di-n-propylamine X 10595-95-6 N-Nitrosomethylethylamine X 59-89-2 Morpholine, 4-Nitroso- X 62-75-9 N-Nitrosodimethylamine X 87-86-5 Pentachlorophenol X 110-59-8 Pentanenitrile X 85-01-8 Phenanthrene X 108-95-2 Phenol X 100-21-0 Phthalic acid X 100-02-7 4-Nitrophenol X 1336-36-3 Aroclors (Total PCB) X 107-12-0 Propionitrile X 129-00-0 Pyrene X 110-86-1 Pyridine X 100-42-5 Styrene X 108-88-3 Toluene X 10061-02-6 trans-1,3-Dichloropropene X 126-73-8 Tributyl phosphate X 27154-33-2 Trichlorofluoroethane X 75-69-4 Trichlorofluoromethane X 75-50-3 Trimethylamine X 1330-20-7 Xylenes (total) X 75-15-0 Carbon disulfide X 100-25-4 1,4-Dinitrobenzene X 100-44-7 Benzyl chloride X 100-47-0 Benzonitrile X 100-51-6 Benzyl alcohol X 100-52-7 Benzaldehyde X 101-77-9 4,4-Methylenedianiline X 103-33-3 Azobenzene X 103-65-1 n-Propyl benzene (Isocumene) X 104-51-8 n-Butylbenzene X 106-43-4 4-Chlorotoluene (p-Tolyl chloride) X 106-44-5 p-Cresol (4-methyl phenol) X 106-47-8 p-Chloroaniline X 106-49-0 p-Toluidine X 106-51-4 Quinone X 106-89-8 Epichlorohydrin (1-chloro-2,3 epoxypropane) X 107-19-7 Propargyl alcohol X 107-21-1 Ethylene glycol (1,2-ethanediol) X 107-98-2 Propylene glycol monomethyl ether X 108-60-1 bis (2-Chloroisopropyl)ether X 108-67-8 1,3,5-Trimethylbenzene X 108-86-1 Bromobenzene (Phenyl bromide) X 108-87-2 Methylcyclohexane X 109-75-1 3-Butenenitrile X

BY: William Hix DATE: 6/6/2016 CALCULATION SHEET CALC NO.: 24590-BOF-M4C-DEP-00001 SUBJECT: DFLAW Effluent Management Facility Air Emissions Estimate SHEET REV: B SHEET NO.: A-5
24590-G04B-F00012 Rev 13 (12/23/2015) Ref: 24590-WTP-3DP-G04B-00037, 24590-WTP-GPG-ENG-0127
CAS # COPC Feed
Organic PIC Feed/PIC (a)
109-77-3 Malononitrile X 109-86-4 2-Methoxyethanol X 109-99-9 Tetrahydrofuran X 110-00-9 Furan X 110-83-8 Cyclohexene X 111-15-9 Ethylene glycol monoethyl ether acetate X 111-44-4 Bis(2-chloroethyl)ether X 111-65-9 n-Octane X 111-84-2 n-Nonane X 111-91-1 Bis(2-chloroethoxy)methane X 1120-21-4 Undecane X 1120-71-4 1,3-Propane sultone X 112-30-1 1-Decanol X 112-31-2 Decanal X 112-40-3 Dodecane X 118-74-1 Hexachlorobenzene X 119-90-4 3,3'-Dimethoxybenzidine X 122-66-7 1,2-Diphenylhydrazine X 123-33-1 Maleic hydrazide X 123-38-6 Propionaldehyde X 124-18-5 Decane X 124-48-1 Chlorodibromomethane X 131-11-3 Dimethyl Phthalate X 131-89-5 2-Cycloyhexyl-4,6-dinitrophenol X 132-64-9 Dibenzofuran X 133-06-2 Captan X 135-98-8 sec-Butylbenzene X 145-73-3 Endothall X 156-59-2 cis-1,2-Dichloroethene X 1746-01-6 2,3,7,8-Tetrachlorodibenzo(p)dioxin (TCDD) X 192-97-2 Benzo(e)pyrene X 19408-74-3 1,2,3,7,8,9-Hexachlorodibenzo(p)dioxin X 205-82-3 Benzo[j]fluoranthene X 205-99-2 Benzo(b)fluoranthene X 207-08-9 Benzo(k)fluoranthene X 218-01-9 Chrysene X 2245-38-7 2,3,5-Trimethylnaphthalene X 23950-58-5 Pronamide X 31508-00-6 2,3',4,4',5-Pentachlorobiphenyl (PCB 118) X 319-84-6 alpha-BHC X 319-85-7 beta-BHC X 32598-13-3 3,3',4,4'-Tetrachlorobiphenyl (PCB 77) X 32598-14-4 2,3,3',4,4'-Pentachlorobiphenyl (PCB 105) X 3268-87-9 Octachlorodibenzo(p)dioxin X 32774-16-6 3,3',4,4',5,5'-Hexachlorobiphenyl (PCB 169) X 35822-46-9 1,2,3,4,6,7,8-Heptachlorodibenzo(p)dioxin X 38380-08-4 2,3,3',4,4',5-Hexachlorobiphenyl (PCB 156) X 39001-02-0 Octachlorodibenzofuran X 39227-28-6 1,2,3,4,7,8-Hexachlorodibenzo(p)dioxin X 39635-31-9 2,3,3',4,4',5,5'-Heptachlorobiphenyl (PCB 189) X 40321-76-4 1,2,3,7,8-Pentachlorodibenzo(p)dioxin X 4170-30-3 Crotonaldehyde (Propylene aldehyde) X 41851-50-7 Chlorocyclopentadiene X 460-19-5 Cyanogen (oxalonitrile) X
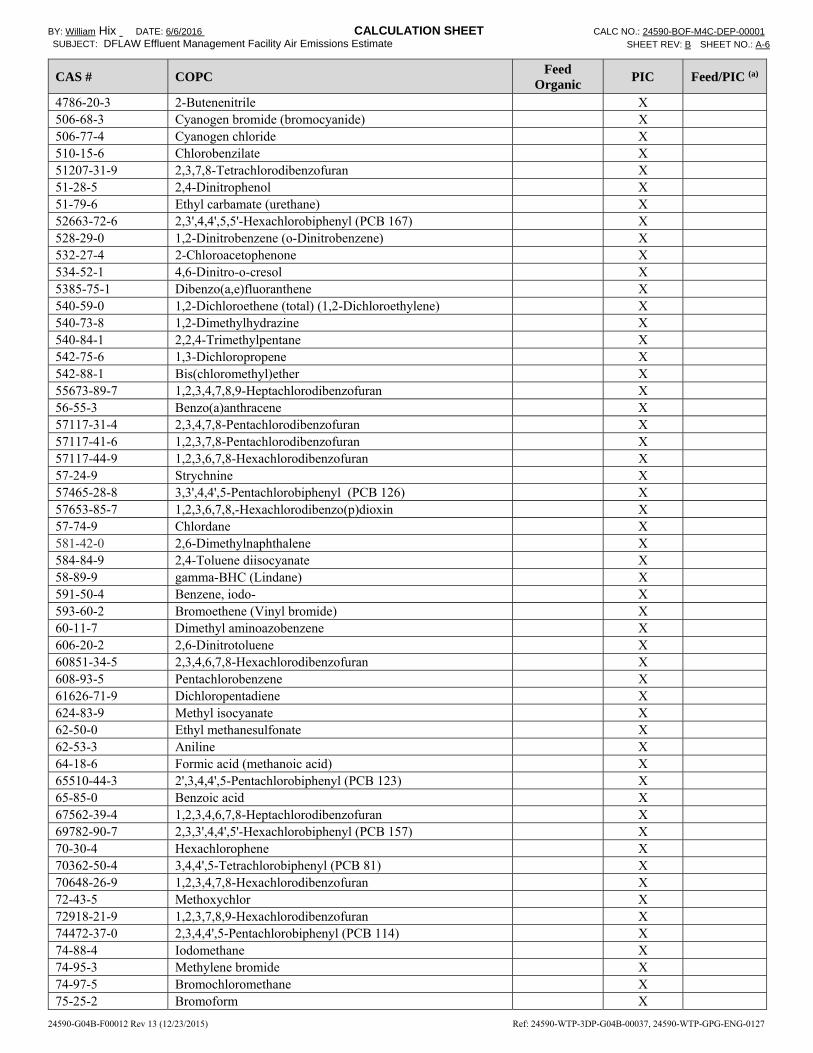
BY: William Hix DATE: 6/6/2016 CALCULATION SHEET CALC NO.: 24590-BOF-M4C-DEP-00001 SUBJECT: DFLAW Effluent Management Facility Air Emissions Estimate SHEET REV: B SHEET NO.: A-6
24590-G04B-F00012 Rev 13 (12/23/2015) Ref: 24590-WTP-3DP-G04B-00037, 24590-WTP-GPG-ENG-0127
CAS # COPC Feed
Organic PIC Feed/PIC (a)
4786-20-3 2-Butenenitrile X 506-68-3 Cyanogen bromide (bromocyanide) X 506-77-4 Cyanogen chloride X 510-15-6 Chlorobenzilate X 51207-31-9 2,3,7,8-Tetrachlorodibenzofuran X 51-28-5 2,4-Dinitrophenol X 51-79-6 Ethyl carbamate (urethane) X 52663-72-6 2,3',4,4',5,5'-Hexachlorobiphenyl (PCB 167) X 528-29-0 1,2-Dinitrobenzene (o-Dinitrobenzene) X 532-27-4 2-Chloroacetophenone X 534-52-1 4,6-Dinitro-o-cresol X 5385-75-1 Dibenzo(a,e)fluoranthene X 540-59-0 1,2-Dichloroethene (total) (1,2-Dichloroethylene) X 540-73-8 1,2-Dimethylhydrazine X 540-84-1 2,2,4-Trimethylpentane X 542-75-6 1,3-Dichloropropene X 542-88-1 Bis(chloromethyl)ether X 55673-89-7 1,2,3,4,7,8,9-Heptachlorodibenzofuran X 56-55-3 Benzo(a)anthracene X 57117-31-4 2,3,4,7,8-Pentachlorodibenzofuran X 57117-41-6 1,2,3,7,8-Pentachlorodibenzofuran X 57117-44-9 1,2,3,6,7,8-Hexachlorodibenzofuran X 57-24-9 Strychnine X 57465-28-8 3,3',4,4',5-Pentachlorobiphenyl (PCB 126) X 57653-85-7 1,2,3,6,7,8,-Hexachlorodibenzo(p)dioxin X 57-74-9 Chlordane X 581-42-0 2,6-Dimethylnaphthalene X 584-84-9 2,4-Toluene diisocyanate X 58-89-9 gamma-BHC (Lindane) X 591-50-4 Benzene, iodo- X 593-60-2 Bromoethene (Vinyl bromide) X 60-11-7 Dimethyl aminoazobenzene X 606-20-2 2,6-Dinitrotoluene X 60851-34-5 2,3,4,6,7,8-Hexachlorodibenzofuran X 608-93-5 Pentachlorobenzene X 61626-71-9 Dichloropentadiene X 624-83-9 Methyl isocyanate X 62-50-0 Ethyl methanesulfonate X 62-53-3 Aniline X 64-18-6 Formic acid (methanoic acid) X 65510-44-3 2',3,4,4',5-Pentachlorobiphenyl (PCB 123) X 65-85-0 Benzoic acid X 67562-39-4 1,2,3,4,6,7,8-Heptachlorodibenzofuran X 69782-90-7 2,3,3',4,4',5'-Hexachlorobiphenyl (PCB 157) X 70-30-4 Hexachlorophene X 70362-50-4 3,4,4',5-Tetrachlorobiphenyl (PCB 81) X 70648-26-9 1,2,3,4,7,8-Hexachlorodibenzofuran X 72-43-5 Methoxychlor X 72918-21-9 1,2,3,7,8,9-Hexachlorodibenzofuran X 74472-37-0 2,3,4,4',5-Pentachlorobiphenyl (PCB 114) X 74-88-4 Iodomethane X 74-95-3 Methylene bromide X 74-97-5 Bromochloromethane X 75-25-2 Bromoform X
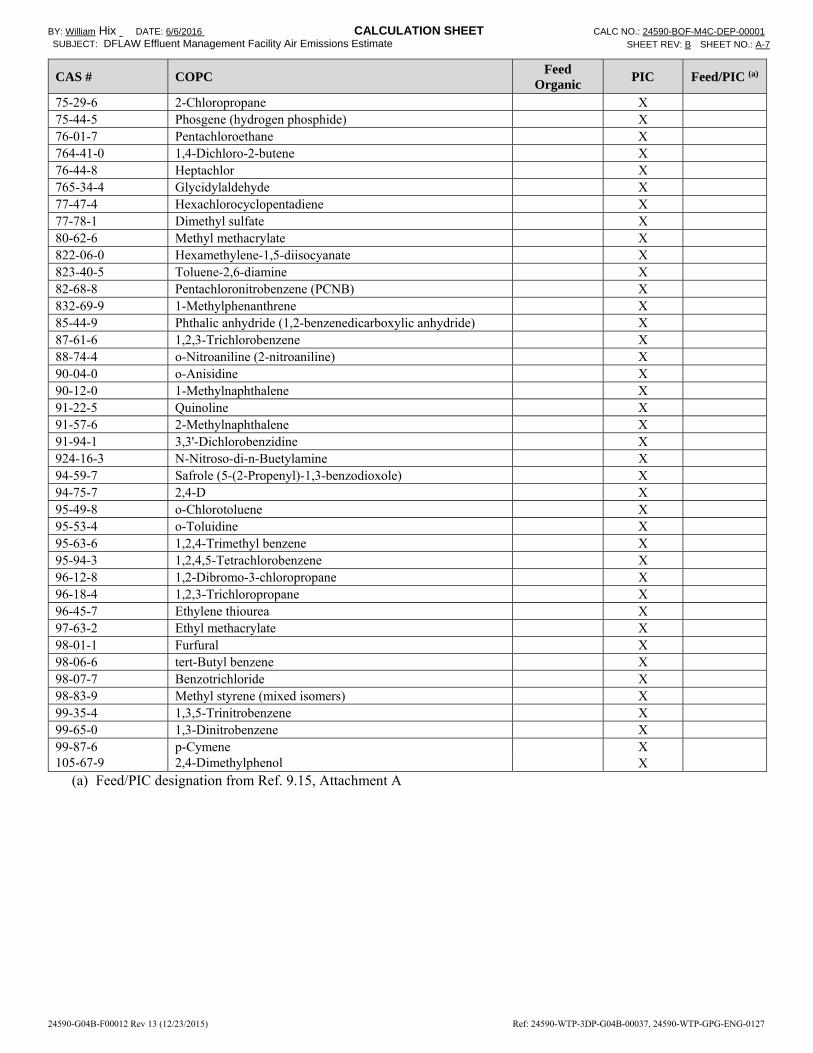
BY: William Hix DATE: 6/6/2016 CALCULATION SHEET CALC NO.: 24590-BOF-M4C-DEP-00001 SUBJECT: DFLAW Effluent Management Facility Air Emissions Estimate SHEET REV: B SHEET NO.: A-7
24590-G04B-F00012 Rev 13 (12/23/2015) Ref: 24590-WTP-3DP-G04B-00037, 24590-WTP-GPG-ENG-0127
CAS # COPC Feed
Organic PIC Feed/PIC (a)
75-29-6 2-Chloropropane X 75-44-5 Phosgene (hydrogen phosphide) X 76-01-7 Pentachloroethane X 764-41-0 1,4-Dichloro-2-butene X 76-44-8 Heptachlor X 765-34-4 Glycidylaldehyde X 77-47-4 Hexachlorocyclopentadiene X 77-78-1 Dimethyl sulfate X 80-62-6 Methyl methacrylate X 822-06-0 Hexamethylene-1,5-diisocyanate X 823-40-5 Toluene-2,6-diamine X 82-68-8 Pentachloronitrobenzene (PCNB) X 832-69-9 1-Methylphenanthrene X 85-44-9 Phthalic anhydride (1,2-benzenedicarboxylic anhydride) X 87-61-6 1,2,3-Trichlorobenzene X 88-74-4 o-Nitroaniline (2-nitroaniline) X 90-04-0 o-Anisidine X 90-12-0 1-Methylnaphthalene X 91-22-5 Quinoline X 91-57-6 2-Methylnaphthalene X 91-94-1 3,3'-Dichlorobenzidine X 924-16-3 N-Nitroso-di-n-Buetylamine X 94-59-7 Safrole (5-(2-Propenyl)-1,3-benzodioxole) X 94-75-7 2,4-D X 95-49-8 o-Chlorotoluene X 95-53-4 o-Toluidine X 95-63-6 1,2,4-Trimethyl benzene X 95-94-3 1,2,4,5-Tetrachlorobenzene X 96-12-8 1,2-Dibromo-3-chloropropane X 96-18-4 1,2,3-Trichloropropane X 96-45-7 Ethylene thiourea X 97-63-2 Ethyl methacrylate X 98-01-1 Furfural X 98-06-6 tert-Butyl benzene X 98-07-7 Benzotrichloride X 98-83-9 Methyl styrene (mixed isomers) X 99-35-4 1,3,5-Trinitrobenzene X 99-65-0 1,3-Dinitrobenzene X 99-87-6 p-Cymene X 105-67-9 2,4-Dimethylphenol X
(a) Feed/PIC designation from Ref. 9.15, Attachment A

BY: William Hix DATE: 6/6/2016 CALCULATION SHEET CALC NO.: 24590-BOF-M4C-DEP-00001 SUBJECT: DFLAW Effluent Management Facility Air Emissions Estimate SHEET REV: B SHEET NO.: A-8
24590-G04B-F00012 Rev 13 (12/23/2015) Ref: 24590-WTP-3DP-G04B-00037, 24590-WTP-GPG-ENG-0127
Table A-3 – WTP Inorganic COPCs CAS # COPC Feed Stack
7440-22-4 Ag X
7429-90-5 Al X
7440-38-2 As X
7440-39-3 Ba X
7440-41-7 Be X
24959-67-9 Br X
7440-43-9 Cd X
16887-00-6 Cl X
57-12-5 CN X
7440-48-4 Co X
7440-47-3 Cr X
7440-50-8 Cu X
16984-48-8 F X
7439-89-6 Fe X
7439-97-6 Hg X
7439-93-2 Li X
7439-95-4 Mg X
7439-96-5 Mn X
7439-98-7 Mo X
7440-23-5 Na X
7664-41-7 NH3 X
7440-02-0 Ni X
14797-65-0 NO2 X
14797-55-8 NO3 X
7723-14-0 P X
7439-92-1 Pb X
14265-44-2 PO4 X
7440-16-6 Rh X
7704-34-9 S X
7440-36-0 Sb X
7782-49-2 Se X
7440-31-5 Sn X
14808-79-8 SO4 X
7440-24-6 Sr X
7440-25-7 Ta X
7440-28-0 Tl X
7440-61-1 UTOTAL X
7440-62-2 V X
7440-33-7 W X
7440-65-5 Y X
7440-66-6 Zn X
7440-67-7 Zr X
593-74-8 Dimethyl Mercury X
10102-44-0 Nitrogen dioxide X
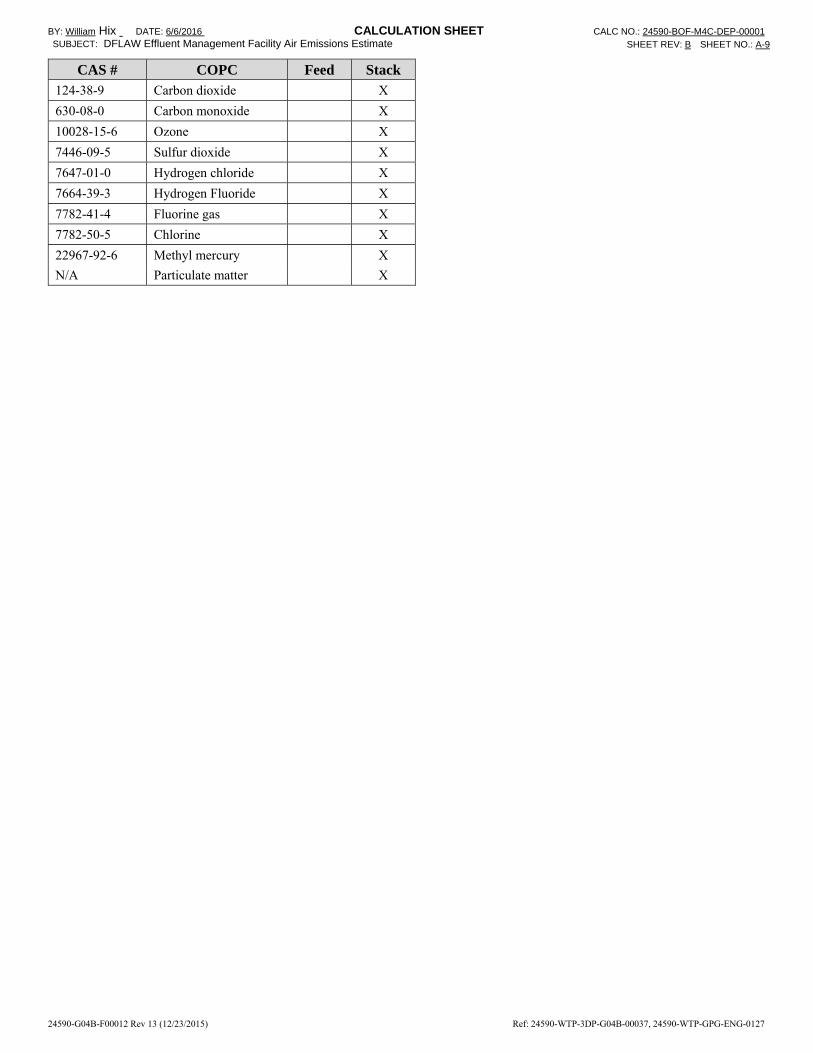
BY: William Hix DATE: 6/6/2016 CALCULATION SHEET CALC NO.: 24590-BOF-M4C-DEP-00001 SUBJECT: DFLAW Effluent Management Facility Air Emissions Estimate SHEET REV: B SHEET NO.: A-9
24590-G04B-F00012 Rev 13 (12/23/2015) Ref: 24590-WTP-3DP-G04B-00037, 24590-WTP-GPG-ENG-0127
CAS # COPC Feed Stack 124-38-9 Carbon dioxide X
630-08-0 Carbon monoxide X
10028-15-6 Ozone X
7446-09-5 Sulfur dioxide X
7647-01-0 Hydrogen chloride X
7664-39-3 Hydrogen Fluoride X
7782-41-4 Fluorine gas X
7782-50-5 Chlorine X
22967-92-6 Methyl mercury X
N/A Particulate matter X

BY: William Hix DATE: 6/6/2016 CALCULATION SHEET CALC NO.: 24590-BOF-M4C-DEP-00001 SUBJECT: DFLAW Effluent Management Facility Air Emissions Estimate SHEET REV: B SHEET NO.: B-1
24590-G04B-F00012 Rev 13 (12/23/2015) Ref: 24590-WTP-3DP-G04B-00037, 24590-WTP-GPG-ENG-0127
Attachment B - Radionuclide COPC Specific Activities
The following table of specific activities for WTP radionuclide COPCs was extracted from the Risk Assessment Information System database (Ref. 10.1)
Radionuclide Specific Activity (Ci/g)
Ac-227 7.24E+01
Am-241 3.43E+00
Am-243 2.00E-01
Ba-137m 5.34E+08
C-14 4.48E+00
Cd-113m 2.23E+02
Cm-242 3.31E+03
Cm-243 5.05E+01
Cm-244 8.09E+01
Co-60 1.11E+03
Cs-134 1.28E+03
Cs-137 8.59E+01
Eu-152 1.73E+02
Eu-154 2.69E+02
Eu-155 4.82E+02
H-3 9.62E+03
I-129 1.75E-04
Nb-93m 2.39E+02
Ni-59 5.91E-02
Ni-63 5.59E+01
Np-237 7.04E-04
Pa-231 4.72E-02
Pu-238 1.71E+01
Pu-239 6.20E-02
Pu-240 2.27E-01
Pu-241 1.03E+02
Pu-242 3.94E-03
Ra-226 9.89E-01
Ra-228 2.73E+02
Ru-106 3.27E+03
Sb-125 1.03E+03
Se-79 1.52E-02
Sm-151 2.62E+01
Sn-126 1.22E-02
Sr-90 1.37E+02
Tc-99 1.70E-02
Th-229 2.13E-01

BY: William Hix DATE: 6/6/2016 CALCULATION SHEET CALC NO.: 24590-BOF-M4C-DEP-00001 SUBJECT: DFLAW Effluent Management Facility Air Emissions Estimate SHEET REV: B SHEET NO.: B-2
24590-G04B-F00012 Rev 13 (12/23/2015) Ref: 24590-WTP-3DP-G04B-00037, 24590-WTP-GPG-ENG-0127
Radionuclide Specific Activity (Ci/g)
Th-232 1.10E-07
U-232 2.24E+01
U-233 9.64E-03
U-234 6.22E-03
U-235 2.16E-06
U-236 6.47E-05
U-238 3.36E-07
Y-90 5.38E+05
Zr-93 2.49E-03

BY: William Hix DATE: 6/6/2016 CALCULATION SHEET CALC NO.: 24590-BOF-M4C-DEP-00001 SUBJECT: DFLAW Effluent Management Facility Air Emissions Estimate SHEET REV: B SHEET NO.: C-1
24590-G04B-F00012 Rev 13 (12/23/2015) Ref: 24590-WTP-3DP-G04B-00037, 24590-WTP-GPG-ENG-0127
Attachment C – Media File 24590-RMCD-04955
Excel spreadsheets used in this calculation are attached to Media File 24590-RMCD-04955.

BY: William Hix DATE: 6/6/2016 CALCULATION SHEET CALC NO.: 24590-BOF-M4C-DEP-00001 SUBJECT: DFLAW Effluent Management Facility Air Emissions Estimate SHEET REV: B SHEET NO.: D-1
24590-G04B-F00012 Rev 13 (12/23/2015) Ref: 24590-WTP-3DP-G04B-00037, 24590-WTP-GPG-ENG-0127
Attachment D- Extracted Radionuclide Properties from NuDat 2.6 Database (Ref. 10.6)
Ground and isomeric state information for 237 93 Np
E(level) (MeV) Jπ ∆(MeV) T1/2 Decay Modes
0.0 5/2+ 44.8746 2.144E+6 y 7 α : 100.00 % SF ≤ 2E-10 %
Ground and isomeric state information for 23894Pu
E(level) (MeV) Jπ ∆(MeV) T1/2 Decay Modes
0.0 0+ 46.1661 87.7 y 1 α : 100.00 % SF : 1.9E-7 %
Ground and isomeric state information for 23994Pu
E(level) (MeV) Jπ ∆(MeV) T1/2 Decay Modes
0.0 1/2+ 48.5912 24110 y 30 α : 100.00 % SF : 3.E-10 %
Ground and isomeric state information for 24094Pu
E(level) (MeV) Jπ ∆(MeV) T1/2 Decay Modes
0.0 0+ 50.1283 6561 y 7 α : 100.00 % SF : 5.7E-6 %
Ground and isomeric state information for 24195Am
E(level) (MeV) Jπ ∆(MeV) T1/2 Decay Modes
0.0 5/2- 52.9373 432.6 y 6 α : 100.00 % SF : 4E-10 %
Ground and isomeric state information for 24294Pu
E(level) (MeV) Jπ ∆(MeV) T1/2 Decay Modes
0.0 0+ 54.7196 3.75E+5 y 2 α : 100.00 % SF : 5.5E-4 %

BY: William Hix DATE: 6/6/2016 CALCULATION SHEET CALC NO.: 24590-BOF-M4C-DEP-00001 SUBJECT: DFLAW Effluent Management Facility Air Emissions Estimate SHEET REV: B SHEET NO.: D-2
24590-G04B-F00012 Rev 13 (12/23/2015) Ref: 24590-WTP-3DP-G04B-00037, 24590-WTP-GPG-ENG-0127
Ground and isomeric state information for 24395Am
E(level) (MeV) Jπ ∆(MeV) T1/2 Decay Modes
0.0 5/2- 57.1774 7370 y 40 α : 100.00 % SF : 3.7E-9 %
Ground and isomeric state information for 24396Cm
E(level) (MeV) Jπ ∆(MeV) T1/2 Decay Modes
0.0 5/2+ 57.1849 29.1 y 1 α : 99.71 % ε : 0.29 %
SF : 5.3E-9 %
Ground and isomeric state information for 24496Cm
E(level) (MeV) Jπ ∆(MeV) T1/2 Decay Modes
0.0 0+ 58.4550 18.1 y 1 α : 100.00 % SF : 1.4E-4 %
1.0402 6+ 59.4952 34 ms 2 IT : 100.00 %

BY: William Hix DATE: 6/6/2016 CALCULATION SHEET CALC NO.: 24590-BOF-M4C-DEP-00001 SUBJECT: DFLAW Effluent Management Facility Air Emissions Estimate SHEET REV: B SHEET NO.: E-1
24590-G04B-F00012 Rev 13 (12/23/2015) Ref: 24590-WTP-3DP-G04B-00037, 24590-WTP-GPG-ENG-0127
Attachment E- Phase Emissions Sensitivity Analysis for 14C and 3H
In order to check that Assumptions 6.2.6 and 6.2.7 conservatively assume that 14C and 3H (respectively) are emitted entirely in the vapor phase, the results using the methodologies for particle emissions and vapor emissions were compared using the worksheet “14C and 3H Sensitivity” in “DFLAW Radionuclide COPC Emissions Estimate.xlsx”. For the sensitivity analysis, all radionuclide COPCs, except 14C and 3H, were removed from the workseet and the calculation was completed for particle emissions and vapor emissions. The results are shown in Figure E-1 below. The results show that assuming unabated vapor emissions greatly exceeds unabated particle emissions for 14C (Cell R5 > Cell L5) and are equal for 3H (Cell R6 = Cell L6). Figure E-1 - Phase Emissions Sensitivity Analysis for 14C and 3H

BY: William Hix DATE: 6/6/2016 CALCULATION SHEET CALC NO.: 24590-BOF-M4C-DEP-00001 SUBJECT: DFLAW Effluent Management Facility Air Emissions Estimate SHEET REV: B SHEET NO.: F-1
24590-G04B-F00012 Rev 13 (12/23/2015) Ref: 24590-WTP-3DP-G04B-00037, 24590-WTP-GPG-ENG-0127
Attachment F – Stream Properties Extracted from PIBOD Runs
The values for the mass flowrate of TOC in the LAW melter feed stream (LFP04) were extracted from the PIBOD model run results documented in calculation 24590-WTP-M4C-V11T-00012 (Ref. 9.23). The model run results for Ref. 9.23 are contained in 24590-RMVD-00357-02, Folder “PIBOD Runs”. Table F-1 – Stream LFP04 TOC PIBOD Model Run # TOC (kg/hr)
1 10.92
2 10.23
3 9.99
4 10.50
5 12.43
6 9.55
7 12.46
8 11.00
9 11.19
10 7.79
11 7.75
12 15.29
13 11.08
14 10.22
15 13.80
16 12.35
17 11.41
18 12.32
19 9.79
20 8.00
21 8.20
22 14.06
23 11.75
Average 10.96
Maximum 15.29
The maximum value of 15.29 kg/hr will be rounded up to 20 kg/hr for use in this calculation as variable
, .

BY: William Hix DATE: 6/6/2016 CALCULATION SHEET CALC NO.: 24590-BOF-M4C-DEP-00001 SUBJECT: DFLAW Effluent Management Facility Air Emissions Estimate SHEET REV: B SHEET NO.: F-2
24590-G04B-F00012 Rev 13 (12/23/2015) Ref: 24590-WTP-3DP-G04B-00037, 24590-WTP-GPG-ENG-0127
The values for the NH4+ and total mass flowrate in LVP21 were extracted from the PIBOD model run results
documented in calculation 24590-WTP-M4C-V11T-00012 (Ref. 9.23). The model run results for Ref. 9.23 are contained in 24590-RMVD-00357-02, Folder “PIBOD Runs”. The model runs report ammonia in the aqueous phase as the ammonium ion (NH4
+), therefore the amount of NH3 transferred in LVP21 is estimated using the results for NH4
+. The mass fraction of NH4+
in LVP21 was calculated by dividing the NH4+
mass flowrate by the total mass flowrate. Table F-2 – Stream LVP21 NH3 Mass Fraction
PIBOD Model Run # NH4
+
(kg/hr) Total (kg/hr)
Mass Fraction
1 0.271 5.292 0.0511
2 0.251 4.903 0.0511
3 0.261 5.120 0.0510
4 0.269 5.254 0.0511
5 0.331 6.473 0.0511
6 0.244 4.776 0.0511
7 0.332 6.489 0.0511
8 0.288 5.636 0.0511
9 0.295 5.770 0.0511
10 0.195 3.816 0.0511
11 0.204 3.993 0.0512
12 0.385 7.516 0.0512
13 0.298 5.838 0.0511
14 0.273 5.333 0.0511
15 0.359 7.014 0.0511
16 0.327 6.403 0.0511
17 0.289 5.662 0.0510
18 0.317 6.204 0.0511
19 0.254 4.974 0.0511
20 0.210 4.128 0.0510
21 0.216 4.245 0.0510
22 0.368 7.207 0.0511
23 0.300 5.875 0.0511
Average 0.284 5.562 0.0511
Maximum 0.385 7.516 0.0512
The maximum value of 0.0512 will be rounded up to 0.06 for use in this calculation as variable , .

BY: William Hix DATE: 6/6/2016 CALCULATION SHEET CALC NO.: 24590-BOF-M4C-DEP-00001 SUBJECT: DFLAW Effluent Management Facility Air Emissions Estimate SHEET REV: B SHEET NO.: F-3
24590-G04B-F00012 Rev 13 (12/23/2015) Ref: 24590-WTP-3DP-G04B-00037, 24590-WTP-GPG-ENG-0127
The values for mercury in the SBS condensate transfer stream (RLD21) were extracted from the PIBOD model run results documented in calculation 24590-WTP-M4C-V11T-00012 (Ref. 9.23). The model run results for Ref. 9.23 are contained in 24590-RMVD-00357-02, Folder “PIBOD Runs”. Table F-3 – Stream RLD21 Hg PIBOD Model Run # Hg (kg/hr)
1 0
2 0
3 0
4 0
5 0
6 0
7 0
8 0
9 0
10 0
11 0
12 0
13 0
14 0
15 0
16 0
17 0
18 0
19 0
20 0
21 0
22 0
23 0

BY: William Hix DATE: 6/6/2016 CALCULATION SHEET CALC NO.: 24590-BOF-M4C-DEP-00001 SUBJECT: DFLAW Effluent Management Facility Air Emissions Estimate SHEET REV: B SHEET NO.: G-1
24590-G04B-F00012 Rev 13 (12/23/2015) Ref: 24590-WTP-3DP-G04B-00037, 24590-WTP-GPG-ENG-0127
Attachment G – DFLAW Bounding Feed Vector Batch Properties
The following table shows the values extracted for each batch in the DFLAW Bounding Feed Vector included as part of Ref. 9.2. These values were calculated in Excel Spreadsheet “Bounding_DFLAW-batches-to-wtp_TOTALS.xlsx” Worksheet “TOTALS”.
Date Batch # Batch Volume
Batch Density Sodium TOC
Oxalate (C2O4‐2)
Adjusted TOC (TOC+Oxalate)
Gallons g/cc kmol kmol kmol kg
Equation 21
1/14/2022 15:36 1 100084 1.32225 3059.52 1.24E+02 4.07E+00 1582.14
1/31/2022 14:44 2 100100 1.32225 3060.01 1.24E+02 4.07E+00 1582.39
2/19/2022 2:20 3 100069 1.32225 3059.05 1.24E+02 4.07E+00 1581.89
3/9/2022 13:16 4 100068 1.32225 3059.03 1.24E+02 4.07E+00 1581.89
3/27/2022 9:04 5 100050 1.32225 3058.49 1.24E+02 4.07E+00 1581.61
4/15/2022 3:08 6 100167 1.32225 3062.06 1.24E+02 4.07E+00 1583.45
5/3/2022 23:52 7 100097 1.32225 3059.92 1.24E+02 4.07E+00 1582.35
5/21/2022 6:36 8 100051 1.32225 3058.50 1.24E+02 4.07E+00 1581.61
6/8/2022 19:52 9 100129 1.32225 3060.89 1.24E+02 4.07E+00 1582.85
6/27/2022 1:44 10 100151 1.32225 3061.57 1.24E+02 4.07E+00 1583.20
7/15/2022 7:52 11 100219 1.32225 3063.63 1.24E+02 4.08E+00 1584.27
9/2/2022 15:04 12 100006 1.36606 3045.48 1.12E+02 4.53E+00 1454.71
9/20/2022 18:44 13 100075 1.39020 3041.96 1.06E+02 4.78E+00 1386.30
10/9/2022 11:28 14 100220 1.39144 3046.05 1.06E+02 4.80E+00 1384.73
10/28/2022 7:20 15 100339 1.39177 3049.59 1.06E+02 4.81E+00 1385.43
11/16/2022 1:08 16 100127 1.39180 3043.13 1.05E+02 4.80E+00 1382.42
12/4/2022 15:52 17 100065 1.39180 3041.26 1.05E+02 4.80E+00 1381.55
12/23/2022 16:32 18 100072 1.39181 3041.47 1.05E+02 4.80E+00 1381.65
1/10/2023 18:36 19 100103 1.39181 3042.40 1.05E+02 4.80E+00 1382.07
1/29/2023 14:16 20 100087 1.39181 3041.93 1.05E+02 4.80E+00 1381.86
2/17/2023 5:04 21 100078 1.39181 3041.63 1.05E+02 4.80E+00 1381.72
3/9/2023 5:12 22 100253 1.39107 3043.71 9.79E+01 4.98E+00 1295.52
3/28/2023 3:44 23 100340 1.38954 3039.58 8.18E+01 5.34E+00 1110.82
4/16/2023 11:12 24 100288 1.38943 3037.52 8.06E+01 5.36E+00 1096.67
5/4/2023 21:48 25 100019 1.38940 3029.28 8.01E+01 5.36E+00 1090.41
5/23/2023 1:20 26 100009 1.38940 3028.97 8.00E+01 5.36E+00 1090.16
6/10/2023 6:00 27 100192 1.38940 3034.50 8.02E+01 5.37E+00 1092.11
6/28/2023 20:40 28 100058 1.38940 3030.45 8.01E+01 5.36E+00 1090.65
7/18/2023 5:04 29 100146 1.38940 3033.09 8.02E+01 5.36E+00 1091.60
8/5/2023 0:12 30 100031 1.38940 3029.63 8.01E+01 5.36E+00 1090.36
8/23/2023 14:12 31 100185 1.38940 3034.28 8.02E+01 5.37E+00 1092.03
9/12/2023 14:44 32 100094 1.39360 3030.48 8.46E+01 5.47E+00 1147.95
10/1/2023 2:28 33 100287 1.40067 3034.58 9.24E+01 5.65E+00 1246.16
10/19/2023 22:40 34 100230 1.40113 3032.74 9.29E+01 5.66E+00 1251.69
11/7/2023 6:04 35 100112 1.40125 3029.13 9.29E+01 5.66E+00 1251.83
12/13/2023 11:12 36 100176 1.40125 3031.07 9.30E+01 5.66E+00 1252.72
1/1/2024 10:24 37 100052 1.40125 3027.31 9.29E+01 5.65E+00 1251.18
1/19/2024 19:08 38 100218 1.40126 3032.35 9.30E+01 5.66E+00 1253.27
2/7/2024 4:56 39 100282 1.40126 3034.27 9.31E+01 5.67E+00 1254.06
2/27/2024 16:00 40 100038 1.40197 3029.28 9.39E+01 5.88E+00 1268.69
3/16/2024 1:40 41 100098 1.40499 3041.70 9.80E+01 6.86E+00 1341.86
4/4/2024 1:08 42 100072 1.40550 3042.92 9.86E+01 7.03E+00 1353.15
4/23/2024 2:00 43 100253 1.40558 3048.74 9.89E+01 7.07E+00 1357.29
5/12/2024 3:48 44 100048 1.40558 3042.53 9.87E+01 7.05E+00 1354.62
5/31/2024 1:56 45 100011 1.40559 3041.39 9.86E+01 7.05E+00 1354.13
6/18/2024 21:36 46 100155 1.40559 3045.78 9.88E+01 7.06E+00 1356.09
7/7/2024 3:12 47 100088 1.40559 3043.76 9.87E+01 7.06E+00 1355.19
7/26/2024 0:32 48 100338 1.40559 3051.36 9.90E+01 7.07E+00 1358.58
8/14/2024 0:28 49 100138 1.40559 3045.27 9.88E+01 7.06E+00 1355.87
9/4/2024 2:04 50 100167 1.39834 3044.47 9.33E+01 6.46E+00 1276.21
9/22/2024 5:56 51 100204 1.37503 3042.25 7.56E+01 4.76E+00 1022.36
10/10/2024 12:56 52 100098 1.37183 3039.10 7.30E+01 4.58E+00 987.18
10/28/2024 19:08 53 100108 1.37134 3039.47 7.26E+01 4.56E+00 981.98
11/16/2024 17:40 54 100071 1.37132 3038.36 7.26E+01 4.56E+00 981.46
12/4/2024 18:16 55 100255 1.37131 3043.94 7.27E+01 4.57E+00 983.18
12/22/2024 22:52 56 100248 1.37131 3043.73 7.27E+01 4.57E+00 983.11
1/10/2025 10:44 57 100075 1.37131 3038.47 7.26E+01 4.56E+00 981.41
1/28/2025 7:56 58 100172 1.37131 3041.44 7.27E+01 4.57E+00 982.36
2/15/2025 17:16 59 100238 1.37131 3043.43 7.27E+01 4.57E+00 983.01
3/7/2025 10:36 60 100075 1.37333 3037.34 6.33E+01 4.54E+00 869.03
3/24/2025 2:08 61 100143 1.37769 3035.41 4.25E+01 4.52E+00 618.85
4/11/2025 16:48 62 100228 1.37807 3037.31 4.06E+01 4.53E+00 596.34
4/30/2025 7:20 63 100173 1.37814 3035.50 4.02E+01 4.53E+00 591.21
5/17/2025 22:12 64 100241 1.37815 3037.55 4.02E+01 4.53E+00 591.44
6/5/2025 4:04 65 100299 1.37815 3039.29 4.02E+01 4.53E+00 591.71
6/23/2025 11:56 66 100004 1.37815 3030.38 4.01E+01 4.52E+00 589.97

BY: William Hix DATE: 6/6/2016 CALCULATION SHEET CALC NO.: 24590-BOF-M4C-DEP-00001 SUBJECT: DFLAW Effluent Management Facility Air Emissions Estimate SHEET REV: B SHEET NO.: G-2
24590-G04B-F00012 Rev 13 (12/23/2015) Ref: 24590-WTP-3DP-G04B-00037, 24590-WTP-GPG-ENG-0127
Date Batch # Batch Volume
Batch Density Sodium TOC
Oxalate (C2O4‐2)
Adjusted TOC (TOC+Oxalate)
Gallons g/cc kmol kmol kmol kg
Equation 21
7/11/2025 11:20 67 100279 1.37815 3038.70 4.02E+01 4.53E+00 591.59
7/29/2025 15:52 68 100299 1.37815 3039.30 4.02E+01 4.53E+00 591.71
8/17/2025 5:52 69 100330 1.37815 3040.25 4.02E+01 4.53E+00 591.89
9/6/2025 12:12 70 100162 1.37713 3013.32 3.76E+01 4.42E+00 557.79
9/24/2025 19:40 71 100158 1.37397 2947.14 3.01E+01 4.15E+00 461.07
10/12/2025 21:04 72 100234 1.37365 2942.92 2.94E+01 4.13E+00 452.16
10/31/2025 5:32 73 100243 1.37359 2941.85 2.92E+01 4.13E+00 450.27
11/17/2025 10:28 74 100106 1.37359 2937.77 2.92E+01 4.12E+00 449.60
12/5/2025 20:56 75 100344 1.37358 2944.73 2.93E+01 4.13E+00 450.64
12/23/2025 7:28 76 100019 1.37358 2935.19 2.92E+01 4.12E+00 449.18
1/10/2026 6:56 77 100117 1.37358 2938.09 2.92E+01 4.12E+00 449.62
1/28/2026 13:00 78 100028 1.37358 2935.48 2.92E+01 4.12E+00 449.22
2/14/2026 21:12 79 100078 1.37358 2936.92 2.92E+01 4.12E+00 449.44
3/7/2026 14:44 80 100025 1.37388 2963.89 5.16E+01 4.47E+00 727.67
3/26/2026 21:40 81 100223 1.37442 3028.37 9.76E+01 5.60E+00 1306.88
4/14/2026 7:04 82 100056 1.37444 3026.39 9.98E+01 5.67E+00 1335.27
5/3/2026 10:00 83 100173 1.37445 3030.95 1.01E+02 5.71E+00 1347.03
5/22/2026 7:24 84 100293 1.37445 3034.62 1.01E+02 5.72E+00 1349.07
6/10/2026 22:20 85 100212 1.37445 3032.20 1.01E+02 5.72E+00 1348.12
7/1/2026 1:40 86 100047 1.37445 3027.21 1.01E+02 5.71E+00 1345.91
7/23/2026 9:00 87 100350 1.37445 3036.36 1.01E+02 5.72E+00 1349.98
8/7/2026 22:20 88 100310 1.37445 3035.14 1.01E+02 5.72E+00 1349.44
8/28/2026 1:20 89 100084 1.37445 3028.33 1.01E+02 5.71E+00 1346.41
9/17/2026 22:44 90 100116 1.37176 2977.84 9.17E+01 5.78E+00 1240.42
10/9/2026 18:48 91 100210 1.36297 2812.67 6.24E+01 6.11E+00 896.32
11/3/2026 3:44 92 100306 1.36283 2812.72 6.20E+01 6.12E+00 891.76
11/25/2026 12:24 93 100003 1.36269 2801.38 6.13E+01 6.11E+00 883.29
12/20/2026 13:08 94 100309 1.36268 2809.84 6.15E+01 6.13E+00 885.80
1/13/2027 17:04 95 100116 1.36268 2804.41 6.14E+01 6.11E+00 884.01
2/7/2027 15:16 96 100098 1.36268 2803.89 6.14E+01 6.11E+00 883.85
4/26/2027 20:04 97 100026 1.36268 2801.89 6.13E+01 6.11E+00 883.21
5/21/2027 16:24 98 100061 1.36268 2802.86 6.13E+01 6.11E+00 883.52
6/11/2027 9:56 99 100258 1.35727 2754.20 7.59E+01 5.02E+00 1031.80
6/30/2027 11:28 100 100340 1.35614 2745.17 7.89E+01 4.80E+00 1063.29
7/18/2027 12:44 101 100053 1.35599 2735.83 7.91E+01 4.76E+00 1064.37
8/5/2027 10:28 102 100073 1.35599 2736.37 7.91E+01 4.76E+00 1064.66
8/24/2027 10:40 103 100244 1.35599 2741.00 7.93E+01 4.77E+00 1066.55
9/9/2027 15:44 104 100236 1.35599 2740.79 7.92E+01 4.77E+00 1066.47
9/27/2027 17:52 105 100039 1.35599 2735.42 7.91E+01 4.76E+00 1064.38
10/15/2027 17:36 106 100059 1.35599 2735.96 7.91E+01 4.76E+00 1064.59
11/3/2027 14:04 107 100232 1.35599 2740.69 7.92E+01 4.77E+00 1066.43
11/21/2027 13:40 108 100114 1.35599 2737.46 7.92E+01 4.77E+00 1065.18
12/11/2027 4:16 109 100232 1.37790 2895.17 6.98E+01 4.37E+00 943.22
12/29/2027 12:20 110 100178 1.38465 2941.23 6.68E+01 4.27E+00 905.29
1/15/2028 19:16 111 100233 1.38521 2946.76 6.66E+01 4.27E+00 902.73
2/3/2028 20:16 112 100227 1.38529 2947.15 6.66E+01 4.26E+00 902.25
5/15/2028 3:24 113 100263 1.38530 2948.29 6.66E+01 4.27E+00 902.51
6/1/2028 8:08 114 100017 1.38530 2941.07 6.64E+01 4.26E+00 900.30
6/19/2028 13:24 115 100177 1.38530 2945.76 6.66E+01 4.26E+00 901.73
7/8/2028 4:24 116 100083 1.38530 2943.00 6.65E+01 4.26E+00 900.88
7/27/2028 5:56 117 100008 1.38530 2940.79 6.64E+01 4.25E+00 900.21
8/13/2028 7:52 118 100163 1.38530 2945.35 6.65E+01 4.26E+00 901.60
9/2/2028 21:56 119 100036 1.39903 3014.39 6.41E+01 4.29E+00 873.02
9/21/2028 9:00 120 100052 1.40051 3022.70 6.39E+01 4.29E+00 870.19
10/9/2028 19:24 121 100049 1.40080 3024.15 6.38E+01 4.29E+00 869.59
10/29/2028 17:56 122 100244 1.40082 3030.17 6.39E+01 4.30E+00 871.25
11/15/2028 20:56 123 100100 1.40082 3025.82 6.38E+01 4.30E+00 869.98
12/3/2028 23:48 124 100181 1.40082 3028.28 6.39E+01 4.30E+00 870.69
12/22/2028 22:52 125 100102 1.40082 3025.90 6.38E+01 4.30E+00 870.00
1/11/2029 6:08 126 100282 1.40082 3031.34 6.40E+01 4.30E+00 871.57
1/30/2029 3:32 127 100203 1.40082 3028.94 6.39E+01 4.30E+00 870.88
2/20/2029 14:40 128 100103 1.40033 3022.91 6.35E+01 4.30E+00 866.59
3/10/2029 7:56 129 100231 1.38545 2934.97 5.48E+01 4.39E+00 764.13
3/27/2029 17:24 130 100108 1.38219 2911.25 5.29E+01 4.41E+00 740.72
4/15/2029 13:52 131 100073 1.38186 2908.21 5.26E+01 4.41E+00 738.19
5/3/2029 14:52 132 100117 1.38181 2909.18 5.26E+01 4.41E+00 738.18
5/21/2029 20:52 133 100048 1.38180 2907.12 5.26E+01 4.41E+00 737.62
6/8/2029 13:12 134 100149 1.38180 2910.07 5.27E+01 4.41E+00 738.37
6/26/2029 6:20 135 100098 1.38180 2908.57 5.26E+01 4.41E+00 737.98
7/13/2029 19:36 136 100233 1.38180 2912.46 5.27E+01 4.41E+00 738.99

BY: William Hix DATE: 6/6/2016 CALCULATION SHEET CALC NO.: 24590-BOF-M4C-DEP-00001 SUBJECT: DFLAW Effluent Management Facility Air Emissions Estimate SHEET REV: B SHEET NO.: G-3
24590-G04B-F00012 Rev 13 (12/23/2015) Ref: 24590-WTP-3DP-G04B-00037, 24590-WTP-GPG-ENG-0127
Date Batch # Batch Volume
Batch Density Sodium TOC
Oxalate (C2O4‐2)
Adjusted TOC (TOC+Oxalate)
Gallons g/cc kmol kmol kmol kg
Equation 21
8/1/2029 5:00 137 100303 1.38180 2914.54 5.27E+01 4.42E+00 739.50
8/22/2029 4:52 138 100106 1.38178 2919.02 5.17E+01 4.46E+00 728.05
9/8/2029 0:52 139 100104 1.38154 3013.58 4.31E+01 4.90E+00 635.37
9/26/2029 12:44 140 100048 1.38152 3019.76 4.24E+01 4.93E+00 627.42
10/19/2029 20:08 141 100317 1.38152 3029.80 4.23E+01 4.96E+00 627.31
11/7/2029 9:04 142 100058 1.38152 3022.09 4.22E+01 4.94E+00 625.57
11/25/2029 22:48 143 100149 1.38152 3024.89 4.22E+01 4.95E+00 626.11
12/13/2029 23:08 144 100027 1.38152 3021.21 4.22E+01 4.94E+00 625.34
1/1/2030 0:04 145 100180 1.38152 3025.82 4.22E+01 4.95E+00 626.30
1/19/2030 3:04 146 100268 1.38152 3028.47 4.23E+01 4.95E+00 626.85
2/5/2030 15:52 147 100293 1.38152 3029.24 4.23E+01 4.96E+00 627.01
2/26/2030 14:28 148 100328 1.38191 3031.24 4.37E+01 4.96E+00 643.91
3/17/2030 1:28 149 100286 1.38427 3035.47 5.24E+01 5.00E+00 749.11
4/7/2030 7:24 150 100338 1.38468 3037.81 5.40E+01 5.01E+00 768.71
4/24/2030 16:04 151 100146 1.38473 3032.10 5.41E+01 5.01E+00 769.55
5/12/2030 23:48 152 100064 1.38474 3029.63 5.40E+01 5.00E+00 769.14
5/31/2030 15:48 153 100091 1.38474 3030.47 5.41E+01 5.00E+00 769.40
6/19/2030 23:16 154 100099 1.38474 3030.71 5.41E+01 5.00E+00 769.46
7/8/2030 4:32 155 100022 1.38474 3028.37 5.40E+01 5.00E+00 768.87
7/25/2030 19:44 156 100136 1.38474 3031.82 5.41E+01 5.00E+00 769.75
8/13/2030 4:04 157 100331 1.38474 3037.72 5.42E+01 5.01E+00 771.24
9/1/2030 22:36 158 100334 1.38186 3038.46 5.06E+01 5.10E+00 730.02
9/30/2030 11:32 159 100057 1.37166 3032.12 3.77E+01 5.40E+00 582.91
10/17/2030 13:04 160 100073 1.37086 3032.67 3.68E+01 5.43E+00 571.90
11/5/2030 13:08 161 100242 1.37067 3037.81 3.66E+01 5.44E+00 570.12
11/22/2030 11:08 162 100228 1.37066 3037.40 3.66E+01 5.44E+00 569.90
12/10/2030 22:20 163 100019 1.37066 3031.06 3.65E+01 5.43E+00 568.67
12/29/2030 5:20 164 100099 1.37066 3033.47 3.65E+01 5.43E+00 569.12
1/17/2031 5:40 165 100056 1.37066 3032.17 3.65E+01 5.43E+00 568.87
2/3/2031 13:48 166 100116 1.37066 3034.01 3.65E+01 5.43E+00 569.22
2/22/2031 1:52 167 100031 1.37066 3031.43 3.65E+01 5.43E+00 568.73
3/11/2031 16:40 168 100210 1.37007 3000.82 3.87E+01 5.18E+00 589.07
3/29/2031 16:52 169 100310 1.36827 2883.17 4.59E+01 4.37E+00 656.70
4/16/2031 21:44 170 100194 1.36808 2863.34 4.69E+01 4.27E+00 665.83
5/5/2031 21:12 171 100100 1.36805 2858.12 4.70E+01 4.26E+00 666.76
5/22/2031 16:24 172 100136 1.36805 2859.06 4.70E+01 4.26E+00 667.07
6/9/2031 13:04 173 100030 1.36805 2855.98 4.70E+01 4.25E+00 666.38
6/27/2031 12:28 174 100137 1.36805 2859.04 4.70E+01 4.26E+00 667.10
7/15/2031 23:12 175 100070 1.36805 2857.12 4.70E+01 4.25E+00 666.65
8/2/2031 6:36 176 100285 1.36805 2863.26 4.71E+01 4.26E+00 668.08
8/20/2031 13:56 177 100218 1.36805 2861.36 4.71E+01 4.26E+00 667.64
Average 100153 1.37726 2982.39 69.79 4.94 957.00
Minimum 100003 1.32225 2735.42 29.16 4.07 449.18
Maximum 100350 1.40559 3063.63 123.75 7.07 1584.27