Embed Size (px)
Citation preview
20
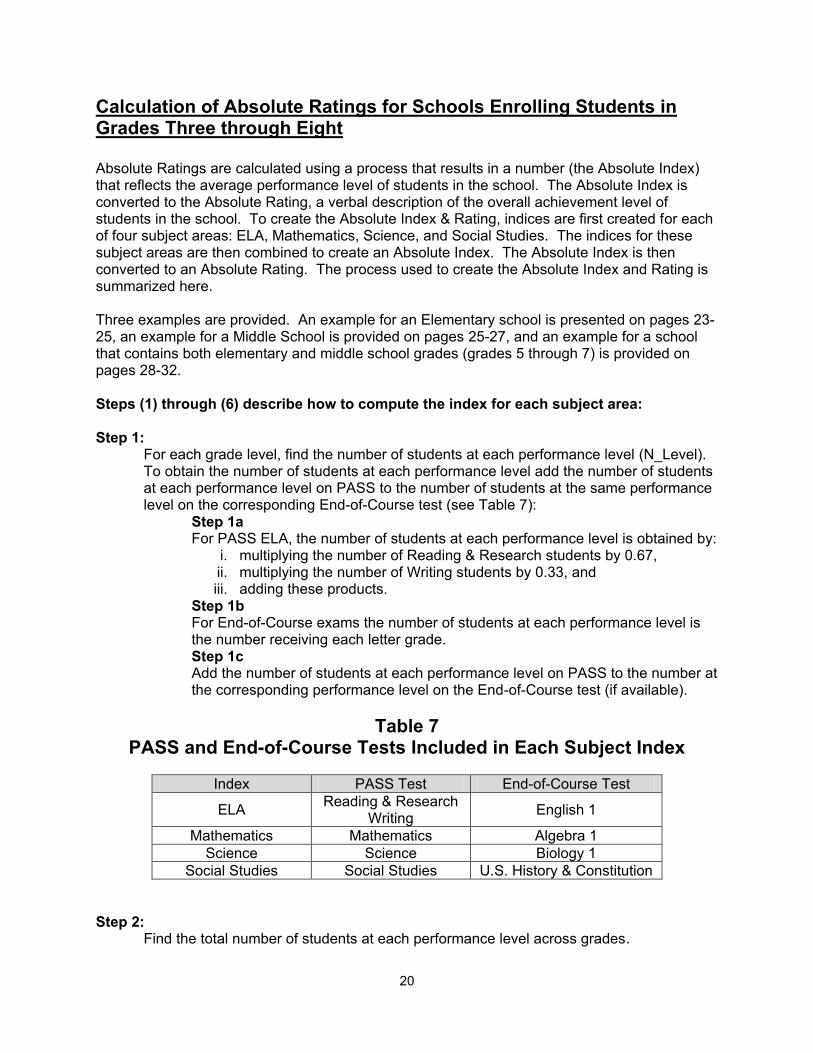
Calculation of Absolute Ratings for Schools Enrolling Students in Grades Three through Eight Absolute Ratings are calculated using a process that results in a number (the Absolute Index) that reflects the average performance level of students in the school. The Absolute Index is converted to the Absolute Rating, a verbal description of the overall achievement level of students in the school. To create the Absolute Index & Rating, indices are first created for each of four subject areas: ELA, Mathematics, Science, and Social Studies. The indices for these subject areas are then combined to create an Absolute Index. The Absolute Index is then converted to an Absolute Rating. The process used to create the Absolute Index and Rating is summarized here. Three examples are provided. An example for an Elementary school is presented on pages 23-25, an example for a Middle School is provided on pages 25-27, and an example for a school that contains both elementary and middle school grades (grades 5 through 7) is provided on pages 28-32. Steps (1) through (6) describe how to compute the index for each subject area:
Step 1:
For each grade level, find the number of students at each performance level (N_Level). To obtain the number of students at each performance level add the number of students at each performance level on PASS to the number of students at the same performance level on the corresponding End-of-Course test (see Table 7): Step 1a
For PASS ELA, the number of students at each performance level is obtained by: i. multiplying the number of Reading & Research students by 0.67, ii. multiplying the number of Writing students by 0.33, and iii. adding these products.
Step 1b For End-of-Course exams the number of students at each performance level is the number receiving each letter grade.
Step 1c Add the number of students at each performance level on PASS to the number at the corresponding performance level on the End-of-Course test (if available).
Table 7 PASS and End-of-Course Tests Included in Each Subject Index
Index PASS Test End-of-Course Test
ELA Reading & Research
Writing English 1
Mathematics Mathematics Algebra 1
Science Science Biology 1
Social Studies Social Studies U.S. History & Constitution
Step 2:
Find the total number of students at each performance level across grades.
21
Step 3:
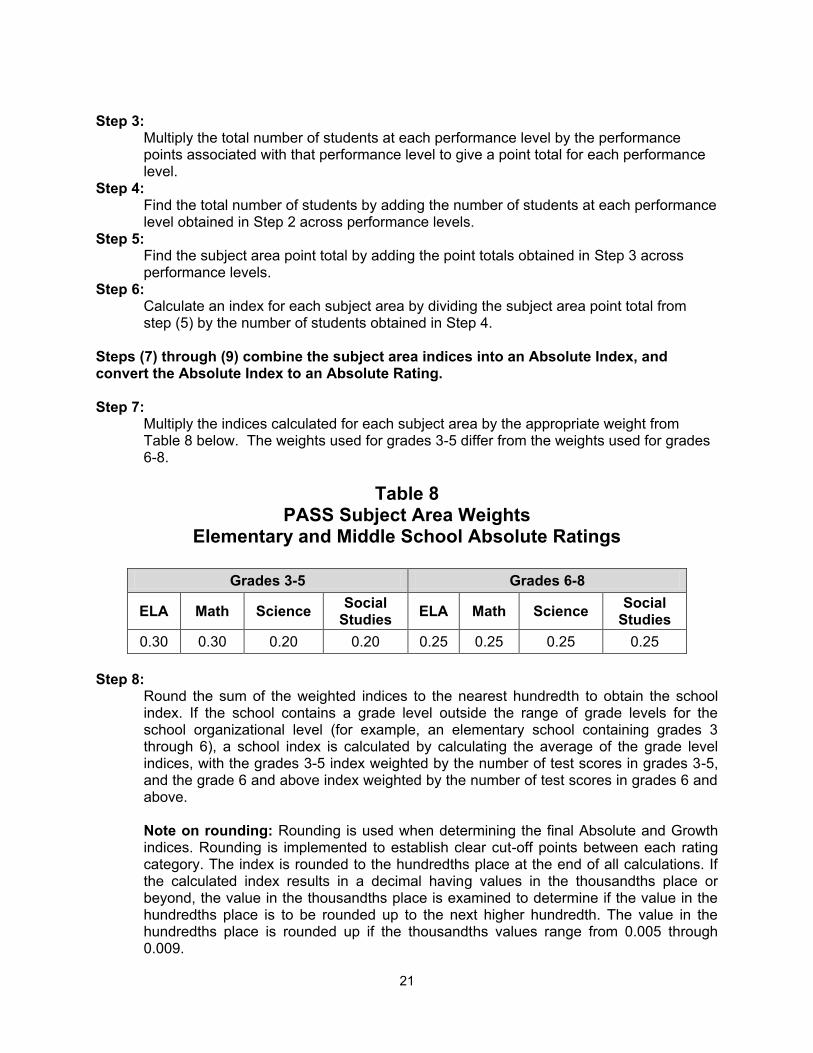
Multiply the total number of students at each performance level by the performance points associated with that performance level to give a point total for each performance level.
Step 4: Find the total number of students by adding the number of students at each performance level obtained in Step 2 across performance levels.
Step 5: Find the subject area point total by adding the point totals obtained in Step 3 across performance levels.
Step 6: Calculate an index for each subject area by dividing the subject area point total from step (5) by the number of students obtained in Step 4.
Steps (7) through (9) combine the subject area indices into an Absolute Index, and convert the Absolute Index to an Absolute Rating. Step 7:
Multiply the indices calculated for each subject area by the appropriate weight from Table 8 below. The weights used for grades 3-5 differ from the weights used for grades 6-8.
Table 8 PASS Subject Area Weights
Elementary and Middle School Absolute Ratings
Grades 3-5 Grades 6-8
ELA Math Science Social
Studies ELA Math Science
Social Studies
0.30 0.30 0.20 0.20 0.25 0.25 0.25 0.25
Step 8:
Round the sum of the weighted indices to the nearest hundredth to obtain the school index. If the school contains a grade level outside the range of grade levels for the school organizational level (for example, an elementary school containing grades 3 through 6), a school index is calculated by calculating the average of the grade level indices, with the grades 3-5 index weighted by the number of test scores in grades 3-5, and the grade 6 and above index weighted by the number of test scores in grades 6 and above.
Note on rounding: Rounding is used when determining the final Absolute and Growth indices. Rounding is implemented to establish clear cut-off points between each rating category. The index is rounded to the hundredths place at the end of all calculations. If the calculated index results in a decimal having values in the thousandths place or beyond, the value in the thousandths place is examined to determine if the value in the hundredths place is to be rounded up to the next higher hundredth. The value in the hundredths place is rounded up if the thousandths values range from 0.005 through 0.009.
22
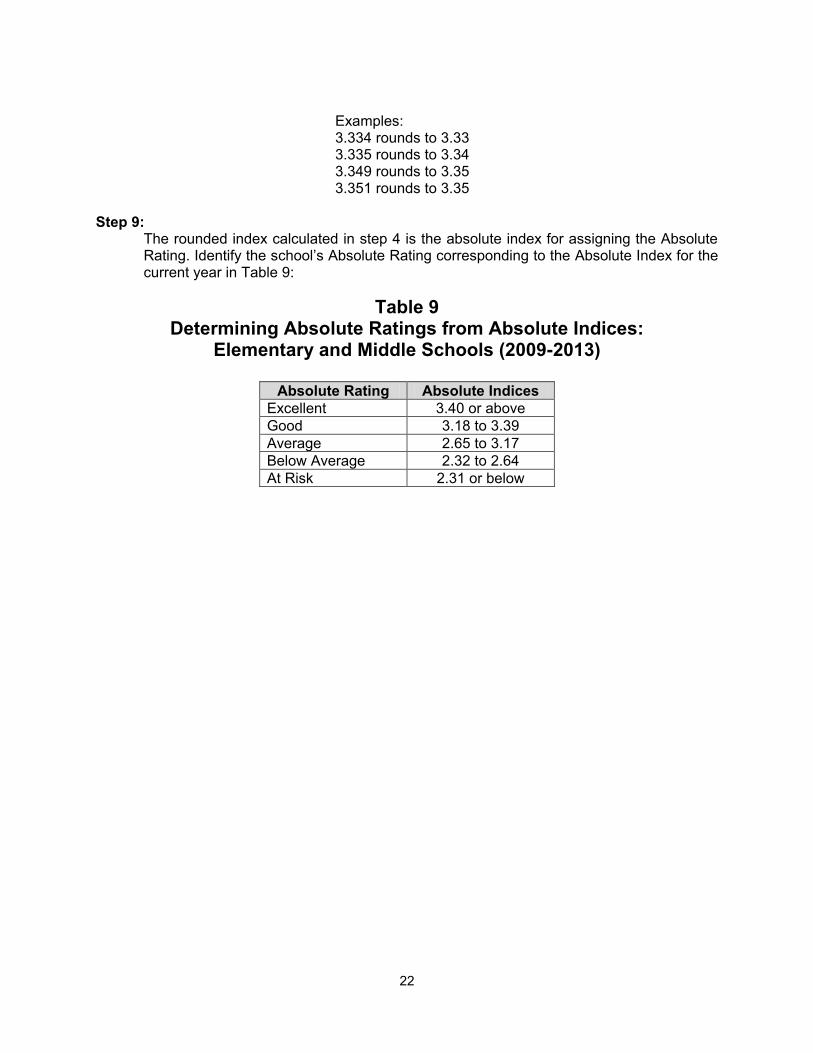
Examples: 3.334 rounds to 3.33 3.335 rounds to 3.34 3.349 rounds to 3.35 3.351 rounds to 3.35
Step 9:
The rounded index calculated in step 4 is the absolute index for assigning the Absolute Rating. Identify the school’s Absolute Rating corresponding to the Absolute Index for the current year in Table 9:
Table 9 Determining Absolute Ratings from Absolute Indices:
Elementary and Middle Schools (2009-2013)
Absolute Rating Absolute Indices
Excellent 3.40 or above
Good 3.18 to 3.39
Average 2.65 to 3.17
Below Average 2.32 to 2.64
At Risk 2.31 or below
23
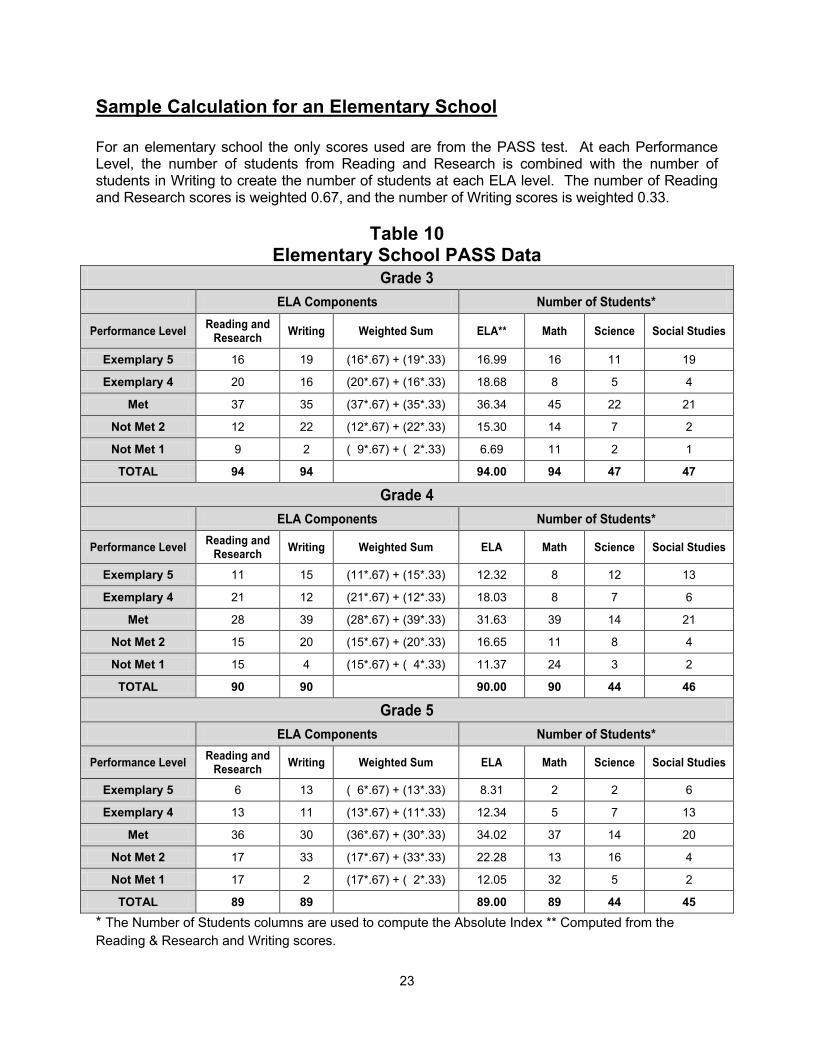
Sample Calculation for an Elementary School For an elementary school the only scores used are from the PASS test. At each Performance Level, the number of students from Reading and Research is combined with the number of students in Writing to create the number of students at each ELA level. The number of Reading and Research scores is weighted 0.67, and the number of Writing scores is weighted 0.33.
Table 10 Elementary School PASS Data
Grade 3
ELA Components Number of Students*
Performance Level Reading and
Research Writing Weighted Sum ELA** Math Science Social Studies
Exemplary 5 16 19 (16*.67) + (19*.33) 16.99 16 11 19
Exemplary 4 20 16 (20*.67) + (16*.33) 18.68 8 5 4
Met 37 35 (37*.67) + (35*.33) 36.34 45 22 21
Not Met 2 12 22 (12*.67) + (22*.33) 15.30 14 7 2
Not Met 1 9 2 ( 9*.67) + ( 2*.33) 6.69 11 2 1
TOTAL 94 94 94.00 94 47 47
Grade 4
ELA Components Number of Students*
Performance Level Reading and
Research Writing Weighted Sum ELA Math Science Social Studies
Exemplary 5 11 15 (11*.67) + (15*.33) 12.32 8 12 13
Exemplary 4 21 12 (21*.67) + (12*.33) 18.03 8 7 6
Met 28 39 (28*.67) + (39*.33) 31.63 39 14 21
Not Met 2 15 20 (15*.67) + (20*.33) 16.65 11 8 4
Not Met 1 15 4 (15*.67) + ( 4*.33) 11.37 24 3 2
TOTAL 90 90 90.00 90 44 46
Grade 5
ELA Components Number of Students*
Performance Level Reading and
Research Writing Weighted Sum ELA Math Science Social Studies
Exemplary 5 6 13 ( 6*.67) + (13*.33) 8.31 2 2 6
Exemplary 4 13 11 (13*.67) + (11*.33) 12.34 5 7 13
Met 36 30 (36*.67) + (30*.33) 34.02 37 14 20
Not Met 2 17 33 (17*.67) + (33*.33) 22.28 13 16 4
Not Met 1 17 2 (17*.67) + ( 2*.33) 12.05 32 5 2
TOTAL 89 89 89.00 89 44 45
* The Number of Students columns are used to compute the Absolute Index ** Computed from the
Reading & Research and Writing scores.
24
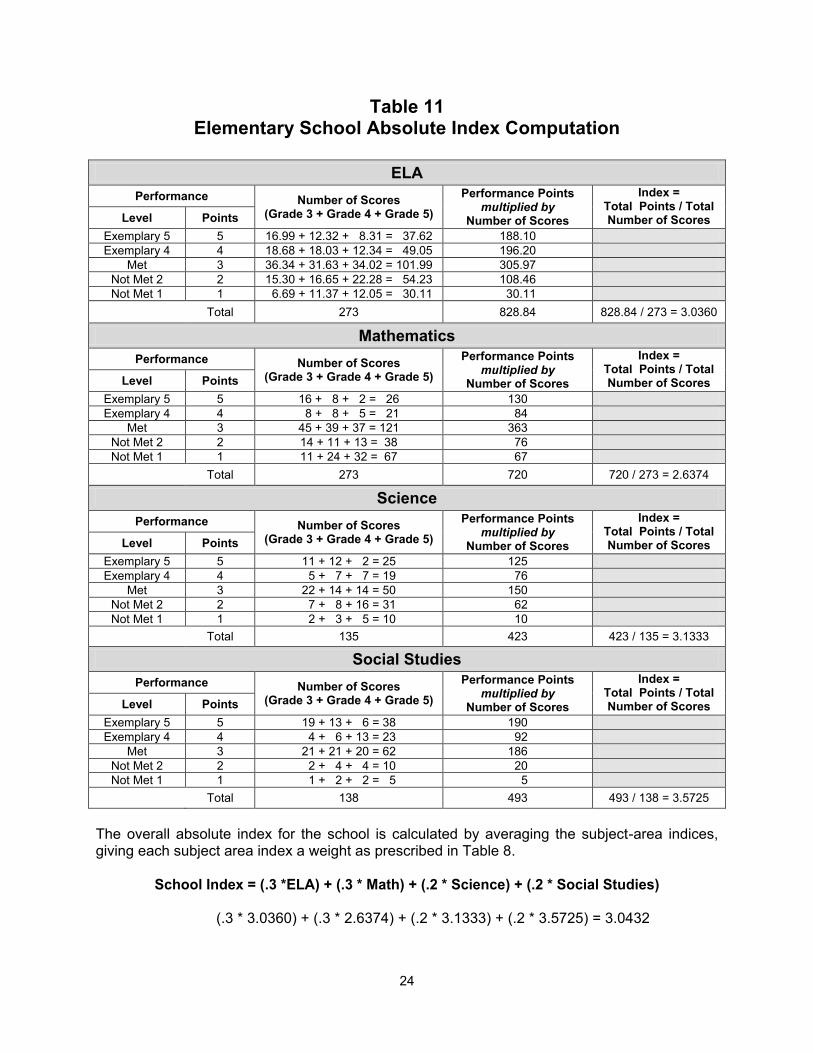
Table 11 Elementary School Absolute Index Computation
ELA
Performance Number of Scores (Grade 3 + Grade 4 + Grade 5)
Performance Points multiplied by
Number of Scores
Index = Total Points / Total Number of Scores Level Points
Exemplary 5 5 16.99 + 12.32 + 8.31 = 37.62 188.10
Exemplary 4 4 18.68 + 18.03 + 12.34 = 49.05 196.20
Met 3 36.34 + 31.63 + 34.02 = 101.99 305.97
Not Met 2 2 15.30 + 16.65 + 22.28 = 54.23 108.46
Not Met 1 1 6.69 + 11.37 + 12.05 = 30.11 30.11
Total 273 828.84 828.84 / 273 = 3.0360
Mathematics
Performance Number of Scores (Grade 3 + Grade 4 + Grade 5)
Performance Points multiplied by
Number of Scores
Index = Total Points / Total Number of Scores Level Points
Exemplary 5 5 16 + 8 + 2 = 26 130
Exemplary 4 4 8 + 8 + 5 = 21 84
Met 3 45 + 39 + 37 = 121 363
Not Met 2 2 14 + 11 + 13 = 38 76
Not Met 1 1 11 + 24 + 32 = 67 67
Total 273 720 720 / 273 = 2.6374
Science
Performance Number of Scores (Grade 3 + Grade 4 + Grade 5)
Performance Points multiplied by
Number of Scores
Index = Total Points / Total Number of Scores Level Points
Exemplary 5 5 11 + 12 + 2 = 25 125
Exemplary 4 4 5 + 7 + 7 = 19 76
Met 3 22 + 14 + 14 = 50 150
Not Met 2 2 7 + 8 + 16 = 31 62
Not Met 1 1 2 + 3 + 5 = 10 10
Total 135 423 423 / 135 = 3.1333
Social Studies
Performance Number of Scores (Grade 3 + Grade 4 + Grade 5)
Performance Points multiplied by
Number of Scores
Index = Total Points / Total Number of Scores Level Points
Exemplary 5 5 19 + 13 + 6 = 38 190
Exemplary 4 4 4 + 6 + 13 = 23 92
Met 3 21 + 21 + 20 = 62 186
Not Met 2 2 2 + 4 + 4 = 10 20
Not Met 1 1 1 + 2 + 2 = 5 5
Total 138 493 493 / 138 = 3.5725
The overall absolute index for the school is calculated by averaging the subject-area indices, giving each subject area index a weight as prescribed in Table 8.
School Index = (.3 *ELA) + (.3 * Math) + (.2 * Science) + (.2 * Social Studies)
(.3 * 3.0360) + (.3 * 2.6374) + (.2 * 3.1333) + (.2 * 3.5725) = 3.0432
25
The absolute index of 3.0432 rounds to 3.04. Based on Table 9, an index of 3.04 corresponds to an Absolute rating of “Average.”
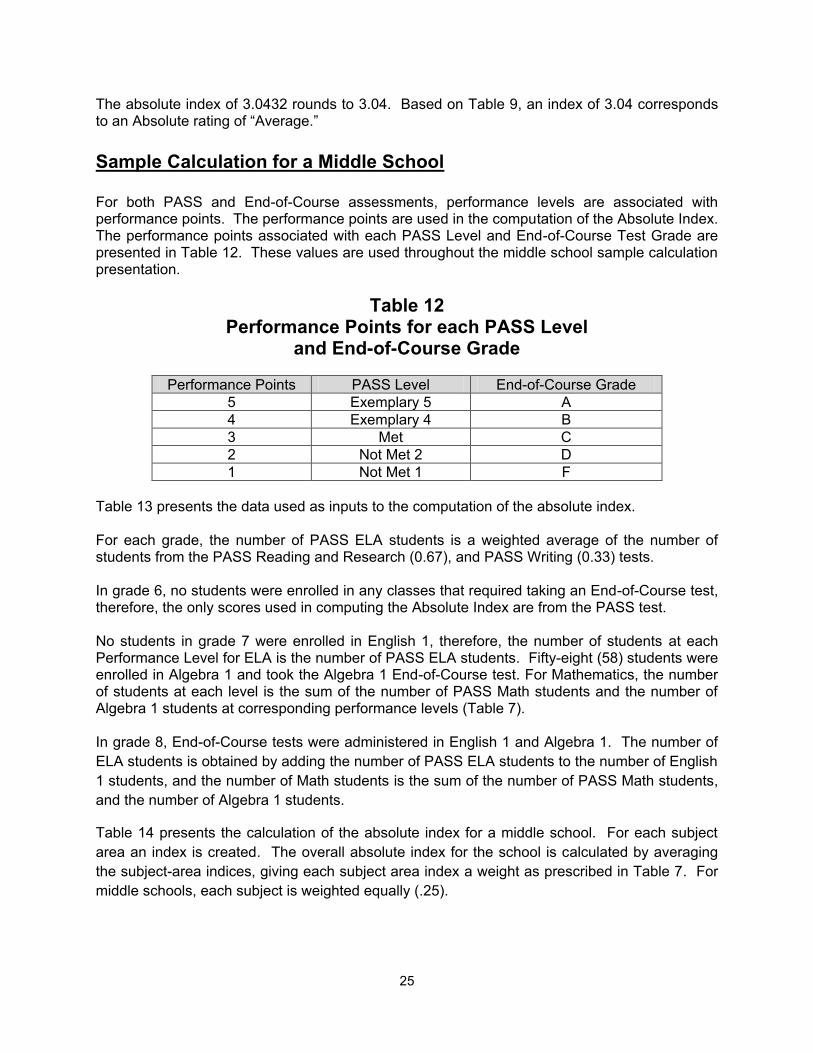
Sample Calculation for a Middle School For both PASS and End-of-Course assessments, performance levels are associated with performance points. The performance points are used in the computation of the Absolute Index. The performance points associated with each PASS Level and End-of-Course Test Grade are presented in Table 12. These values are used throughout the middle school sample calculation presentation.
Table 12 Performance Points for each PASS Level
and End-of-Course Grade
Performance Points PASS Level End-of-Course Grade
5 Exemplary 5 A
4 Exemplary 4 B
3 Met C
2 Not Met 2 D
1 Not Met 1 F
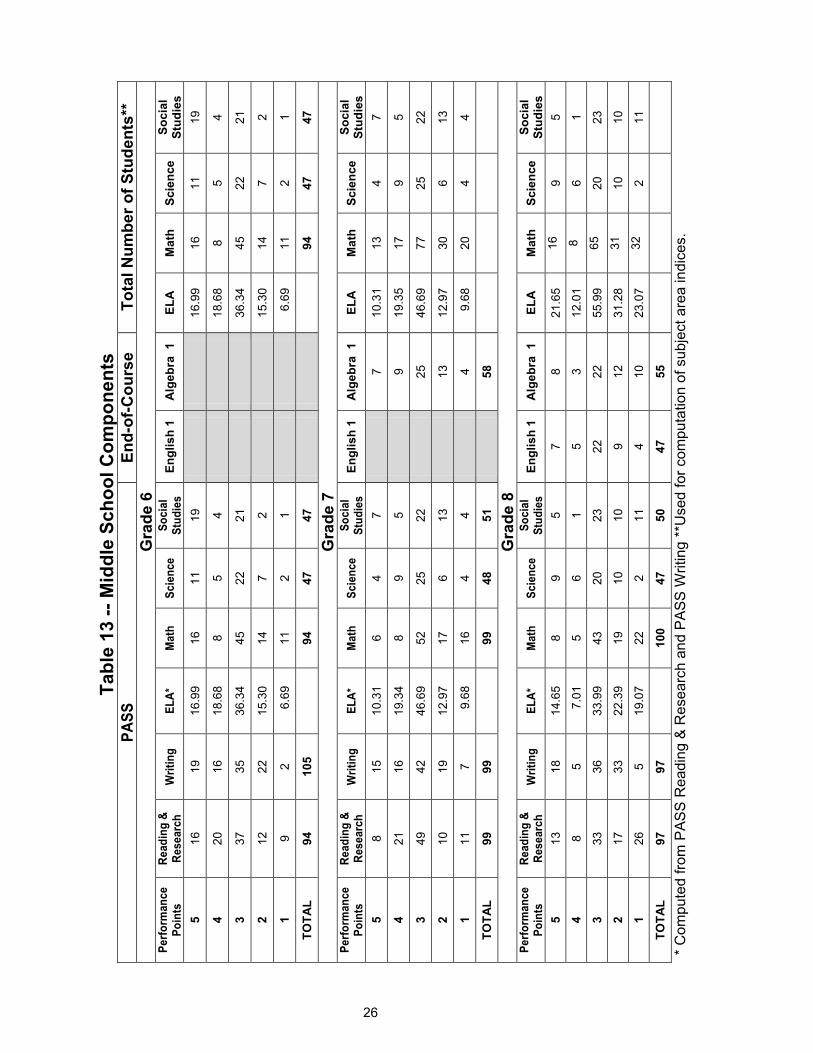
Table 13 presents the data used as inputs to the computation of the absolute index. For each grade, the number of PASS ELA students is a weighted average of the number of students from the PASS Reading and Research (0.67), and PASS Writing (0.33) tests. In grade 6, no students were enrolled in any classes that required taking an End-of-Course test, therefore, the only scores used in computing the Absolute Index are from the PASS test. No students in grade 7 were enrolled in English 1, therefore, the number of students at each Performance Level for ELA is the number of PASS ELA students. Fifty-eight (58) students were enrolled in Algebra 1 and took the Algebra 1 End-of-Course test. For Mathematics, the number of students at each level is the sum of the number of PASS Math students and the number of Algebra 1 students at corresponding performance levels (Table 7). In grade 8, End-of-Course tests were administered in English 1 and Algebra 1. The number of
ELA students is obtained by adding the number of PASS ELA students to the number of English
1 students, and the number of Math students is the sum of the number of PASS Math students,
and the number of Algebra 1 students.
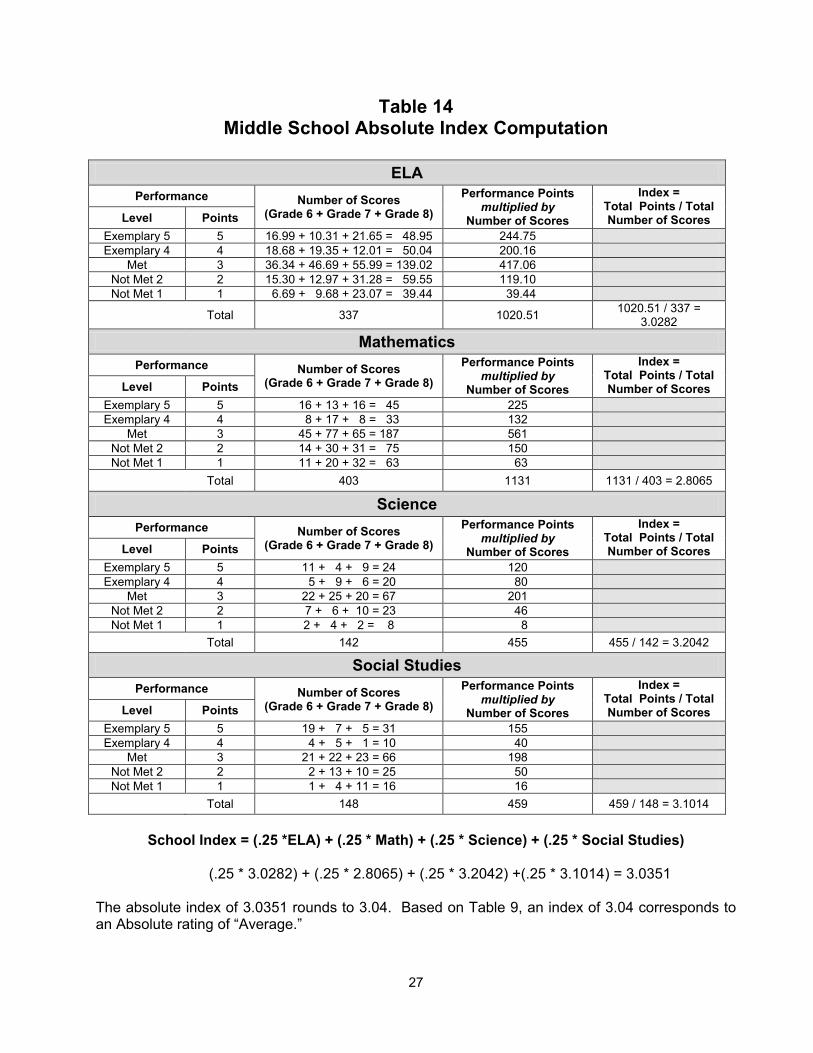
Table 14 presents the calculation of the absolute index for a middle school. For each subject
area an index is created. The overall absolute index for the school is calculated by averaging
the subject-area indices, giving each subject area index a weight as prescribed in Table 7. For
middle schools, each subject is weighted equally (.25).
26
Tab
le 1
3 -
- M
idd
le S
ch
oo
l C
om
po
ne
nts
P
AS
S
En
d-o
f-C
ou
rse
To
tal
Nu
mb
er
of
Stu
den
ts**
Gra
de 6
P
erf
orm
an
ce
P
oin
ts
Re
ad
ing
&
Re
se
arc
h
Wri
tin
g
EL
A*
Math
S
cie
nc
e
So
cia
l S
tud
ies
E
ng
lish
1
Alg
eb
ra
1
EL
A
Ma
th
Scie
nc
e
So
cia
l S
tud
ies
5
16
19
1
6.9
9
16
11
19
1
6.9
9
16
11
19
4
20
16
1
8.6
8
8
5
4
18.6
8
8
5
4
3
37
35
3
6.3
4
45
22
21
3
6.3
4
45
22
21
2
12
22
1
5.3
0
14
7
2
15.3
0
14
7
2
1
9
2
6.6
9
11
2
1
6
.69
11
2
1
TO
TA
L
94
105
94
47
47
94
47
47
Gra
de 7
P
erf
orm
an
ce
P
oin
ts
Re
ad
ing
&
Re
se
arc
h
Wri
tin
g
EL
A*
Math
S
cie
nc
e
So
cia
l S
tud
ies
E
ng
lish
1
Alg
eb
ra
1
EL
A
Ma
th
Scie
nc
e
So
cia
l S
tud
ies
5
8
15
1
0.3
1
6
4
7
7
10.3
1
13
4
7
4
21
16
1
9.3
4
8
9
5
9
19.3
5
17
9
5
3
49
42
4
6.6
9
52
25
22
25
4
6.6
9
77
25
22
2
10
19
1
2.9
7
17
6
13
13
1
2.9
7
30
6
13
1
11
7
9.6
8
16
4
4
4
9
.68
20
4
4
TO
TA
L
99
99
99
48
51
58
G
rad
e 8
P
erf
orm
an
ce
P
oin
ts
Re
ad
ing
&
Re
se
arc
h
Wri
tin
g
EL
A*
Math
S
cie
nc
e
So
cia
l S
tud
ies
E
ng
lish
1
Alg
eb
ra
1
EL
A
Ma
th
Scie
nc
e
So
cia
l S
tud
ies
5
13
18
1
4.6
5
8
9
5
7
8
21.6
5
16
9
5
4
8
5
7.0
1
5
6
1
5
3
12.0
1
8
6
1
3
33
36
3
3.9
9
43
20
23
22
22
5
5.9
9
65
20
23
2
17
33
2
2.3
9
19
10
10
9
12
3
1.2
8
31
10
10
1
26
5
19.0
7
22
2
11
4
10
2
3.0
7
32
2
11
TO
TA
L
97
97
100
47
50
47
55
*
Com
pute
d f
rom
PA
SS
Read
ing &
Re
se
arc
h a
nd P
AS
S W
ritin
g *
*Used
for
com
puta
tio
n o
f subje
ct
are
a indic
es.
27
Table 14 Middle School Absolute Index Computation
ELA
Performance Number of Scores (Grade 6 + Grade 7 + Grade 8)
Performance Points multiplied by
Number of Scores
Index = Total Points / Total Number of Scores Level Points
Exemplary 5 5 16.99 + 10.31 + 21.65 = 48.95 244.75
Exemplary 4 4 18.68 + 19.35 + 12.01 = 50.04 200.16
Met 3 36.34 + 46.69 + 55.99 = 139.02 417.06
Not Met 2 2 15.30 + 12.97 + 31.28 = 59.55 119.10
Not Met 1 1 6.69 + 9.68 + 23.07 = 39.44 39.44
Total 337 1020.51 1020.51 / 337 =
3.0282
Mathematics
Performance Number of Scores (Grade 6 + Grade 7 + Grade 8)
Performance Points multiplied by
Number of Scores
Index = Total Points / Total Number of Scores Level Points
Exemplary 5 5 16 + 13 + 16 = 45 225
Exemplary 4 4 8 + 17 + 8 = 33 132
Met 3 45 + 77 + 65 = 187 561
Not Met 2 2 14 + 30 + 31 = 75 150
Not Met 1 1 11 + 20 + 32 = 63 63
Total 403 1131 1131 / 403 = 2.8065
Science
Performance Number of Scores (Grade 6 + Grade 7 + Grade 8)
Performance Points multiplied by
Number of Scores
Index = Total Points / Total Number of Scores Level Points
Exemplary 5 5 11 + 4 + 9 = 24 120
Exemplary 4 4 5 + 9 + 6 = 20 80
Met 3 22 + 25 + 20 = 67 201
Not Met 2 2 7 + 6 + 10 = 23 46
Not Met 1 1 2 + 4 + 2 = 8 8
Total 142 455 455 / 142 = 3.2042
Social Studies
Performance Number of Scores (Grade 6 + Grade 7 + Grade 8)
Performance Points multiplied by
Number of Scores
Index = Total Points / Total Number of Scores Level Points
Exemplary 5 5 19 + 7 + 5 = 31 155
Exemplary 4 4 4 + 5 + 1 = 10 40
Met 3 21 + 22 + 23 = 66 198
Not Met 2 2 2 + 13 + 10 = 25 50
Not Met 1 1 1 + 4 + 11 = 16 16
Total 148 459 459 / 148 = 3.1014
School Index = (.25 *ELA) + (.25 * Math) + (.25 * Science) + (.25 * Social Studies)
(.25 * 3.0282) + (.25 * 2.8065) + (.25 * 3.2042) +(.25 * 3.1014) = 3.0351
The absolute index of 3.0351 rounds to 3.04. Based on Table 9, an index of 3.04 corresponds to an Absolute rating of “Average.”
28
Sample Calculation for a School with Elementary (3, 4, & 5) and Middle
School Grades (6, 7, & 8)
When a school contains both elementary school grades, the computation is more complex because the subject area weights for creating an elementary school absolute index differ from the subject area weights for creating a middle school absolute index (Table 7). To be consistent with the weightings defined by school type, creating the absolute index for a school with both elementary and middle school occurs in three steps:
1) Create an absolute index using data from any elementary grades (3, 4, & 5). 2) Create an absolute index using data from any middle grades (6, 7, & 8). 3) Create the school absolute index as a weighted average of the elementary absolute
index and the middle school index. The weightings are the number of students in the elementary school grades and the middle school grades.
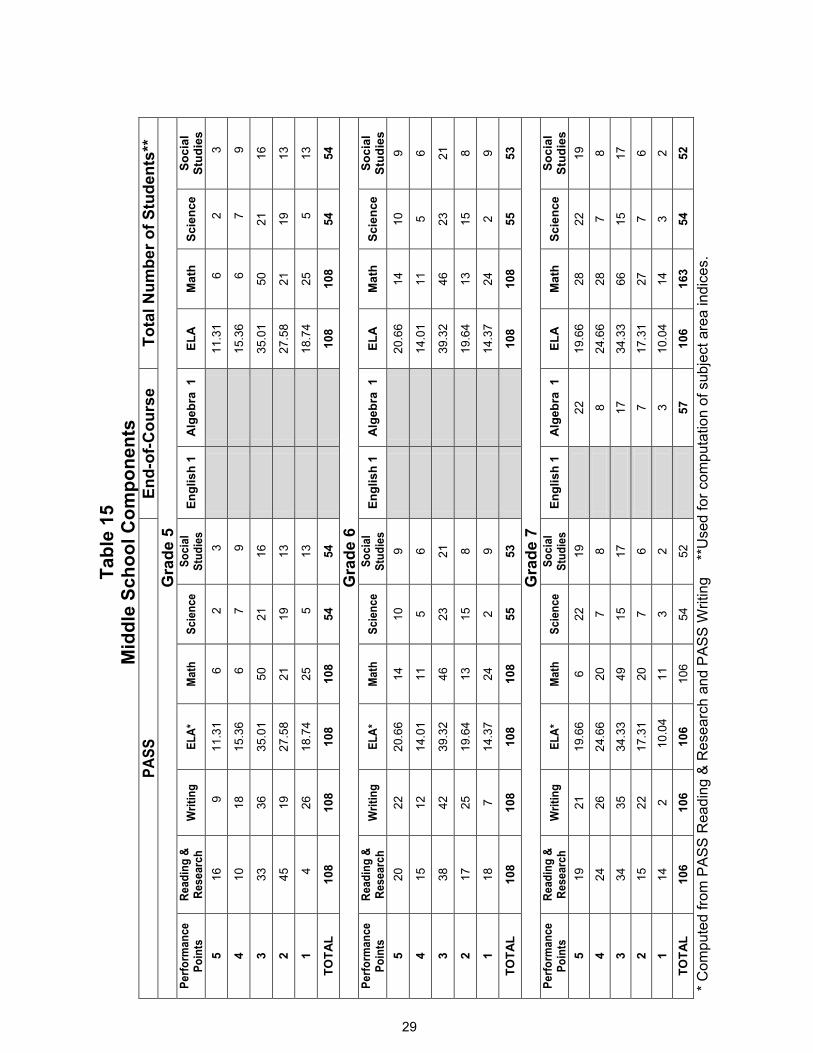
In this example a school contains grades 5, 6, and 7. In grades 5 and 6, no students were enrolled in any classes that required taking an End-of-Course test; therefore, the only scores used in computing the Absolute Index are from the PASS test. No students in grade 7 were enrolled in English 1; therefore, the number of students at each Performance Level for ELA comes entirely from PASS ELA. In grade 7, 57 students were enrolled in Algebra 1 and took the Algebra 1 End-of-Course test. For Mathematics, the number of students at each level is the sum of the number of students at each PASS performance level and the corresponding End-of-Course grade (see Table 7).
29
Tab
le 1
5
Mid
dle
Sch
oo
l C
om
po
nen
ts
PA
SS
E
nd
-of-
Co
urs
e
To
tal
Nu
mb
er
of
Stu
den
ts**
Gra
de 5
P
erf
orm
an
ce
P
oin
ts
Re
ad
ing
&
Re
se
arc
h
Wri
tin
g
EL
A*
Math
S
cie
nc
e
So
cia
l S
tud
ies
E
ng
lish
1
Alg
eb
ra
1
EL
A
Ma
th
Scie
nc
e
So
cia
l S
tud
ies
5
16
9
11.3
1
6
2
3
11.3
1
6
2
3
4
10
18
15.3
6
6
7
9
15.3
6
6
7
9
3
33
36
35.0
1
50
21
16
3
5.0
1
50
21
16
2
45
19
27.5
8
21
19
13
2
7.5
8
21
19
13
1
4
26
18.7
4
25
5
13
1
8.7
4
25
5
13
TO
TA
L
108
108
108
108
54
54
108
108
54
54
Gra
de 6
P
erf
orm
an
ce
P
oin
ts
Re
ad
ing
&
Re
se
arc
h
Wri
tin
g
EL
A*
Math
S
cie
nc
e
So
cia
l S
tud
ies
E
ng
lish
1
Alg
eb
ra
1
EL
A
Ma
th
Scie
nc
e
So
cia
l S
tud
ies
5
20
22
20.6
6
14
10
9
20.6
6
14
10
9
4
15
12
14.0
1
11
5
6
14.0
1
11
5
6
3
38
42
39.3
2
46
23
21
3
9.3
2
46
23
21
2
17
25
19.6
4
13
15
8
19.6
4
13
15
8
1
18
7
14.3
7
24
2
9
14.3
7
24
2
9
TO
TA
L
108
108
108
108
55
53
108
108
55
53
Gra
de 7
P
erf
orm
an
ce
P
oin
ts
Re
ad
ing
&
Re
se
arc
h
Wri
tin
g
EL
A*
Math
S
cie
nc
e
So
cia
l S
tud
ies
E
ng
lish
1
Alg
eb
ra
1
EL
A
Ma
th
Scie
nc
e
So
cia
l S
tud
ies
5
19
21
19.6
6
6
22
19
22
1
9.6
6
28
22
19
4
24
26
24.6
6
20
7
8
8
24.6
6
28
7
8
3
34
35
34.3
3
49
15
17
17
3
4.3
3
66
15
17
2
15
22
17.3
1
20
7
6
7
17.3
1
27
7
6
1
14
2
10.0
4
11
3
2
3
10.0
4
14
3
2
TO
TA
L
106
106
106
106
54
52
57
106
163
54
52
* C
om
pute
d f
rom
PA
SS
Re
ad
ing
& R
ese
arc
h a
nd
PA
SS
Wri
tin
g
**U
sed
for
com
puta
tio
n o
f subje
ct are
a indic
es.
30
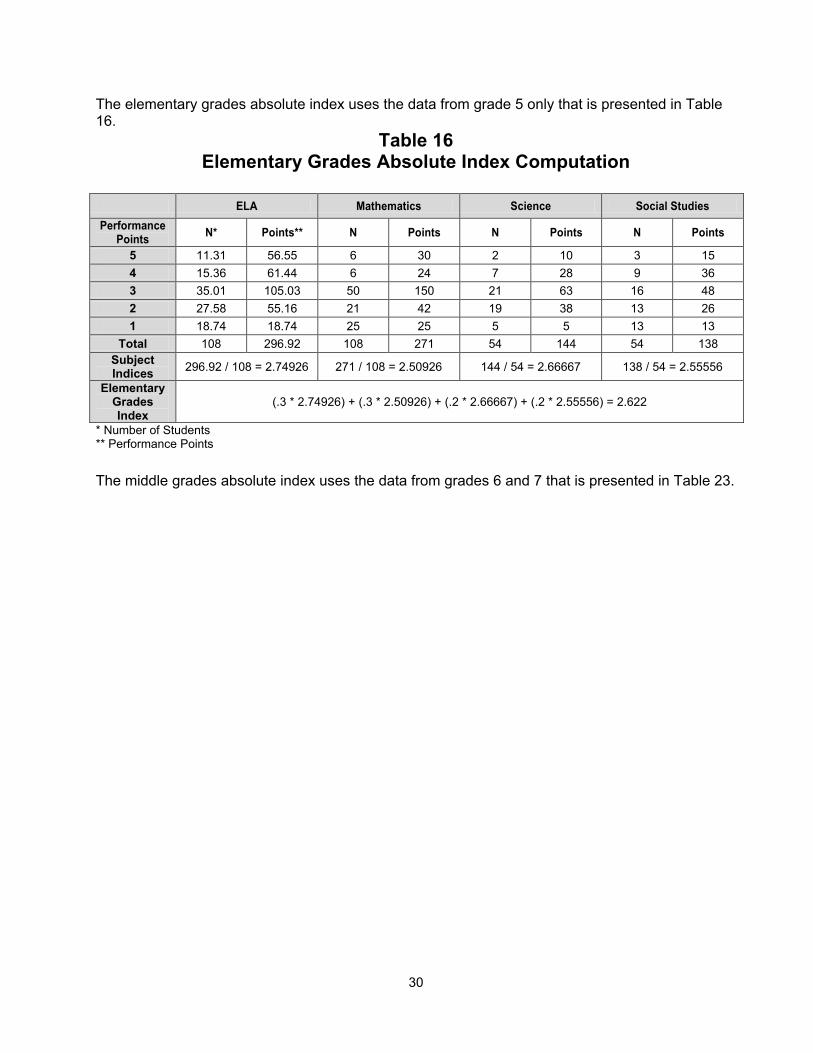
The elementary grades absolute index uses the data from grade 5 only that is presented in Table 16.
Table 16 Elementary Grades Absolute Index Computation
ELA Mathematics Science Social Studies
Performance Points
N* Points** N Points N Points N Points
5 11.31 56.55 6 30 2 10 3 15
4 15.36 61.44 6 24 7 28 9 36
3 35.01 105.03 50 150 21 63 16 48
2 27.58 55.16 21 42 19 38 13 26
1 18.74 18.74 25 25 5 5 13 13
Total 108 296.92 108 271 54 144 54 138
Subject Indices
296.92 / 108 = 2.74926 271 / 108 = 2.50926 144 / 54 = 2.66667 138 / 54 = 2.55556
Elementary Grades Index
(.3 * 2.74926) + (.3 * 2.50926) + (.2 * 2.66667) + (.2 * 2.55556) = 2.622
* Number of Students ** Performance Points
The middle grades absolute index uses the data from grades 6 and 7 that is presented in Table 23.
31
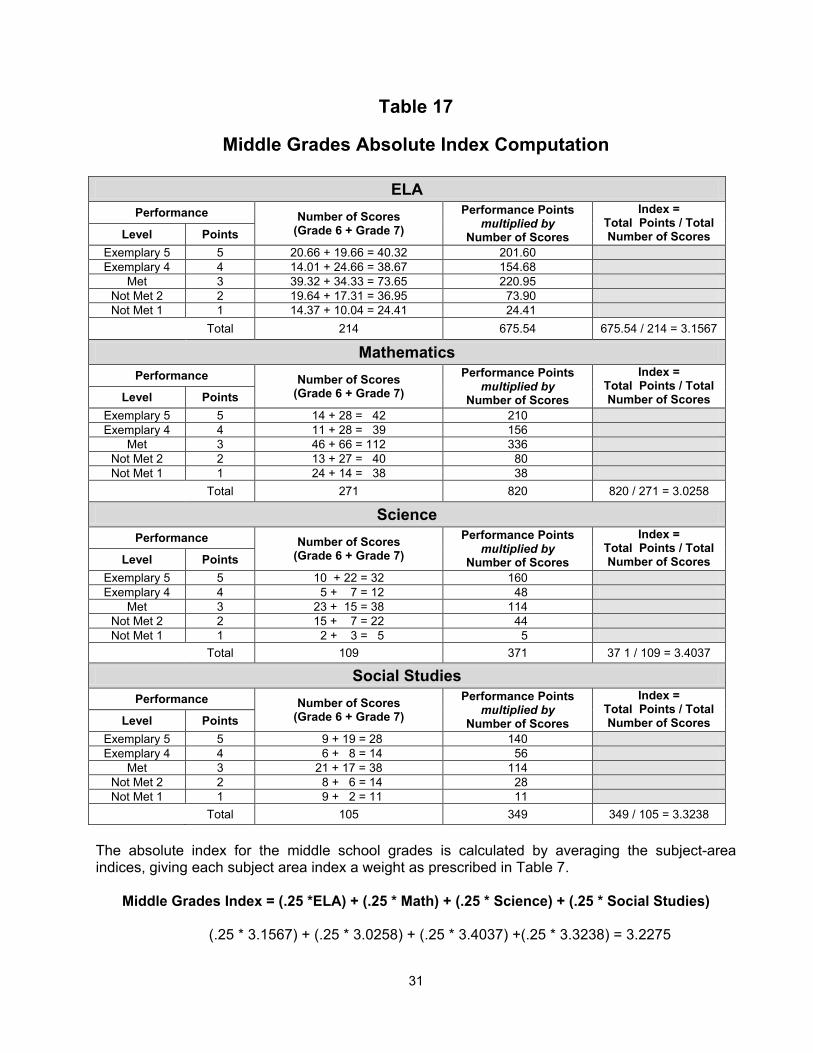
Table 17
Middle Grades Absolute Index Computation
ELA
Performance Number of Scores (Grade 6 + Grade 7)
Performance Points multiplied by
Number of Scores
Index = Total Points / Total Number of Scores Level Points
Exemplary 5 5 20.66 + 19.66 = 40.32 201.60
Exemplary 4 4 14.01 + 24.66 = 38.67 154.68
Met 3 39.32 + 34.33 = 73.65 220.95
Not Met 2 2 19.64 + 17.31 = 36.95 73.90
Not Met 1 1 14.37 + 10.04 = 24.41 24.41
Total 214 675.54 675.54 / 214 = 3.1567
Mathematics
Performance Number of Scores (Grade 6 + Grade 7)
Performance Points multiplied by
Number of Scores
Index = Total Points / Total Number of Scores Level Points
Exemplary 5 5 14 + 28 = 42 210
Exemplary 4 4 11 + 28 = 39 156
Met 3 46 + 66 = 112 336
Not Met 2 2 13 + 27 = 40 80
Not Met 1 1 24 + 14 = 38 38
Total 271 820 820 / 271 = 3.0258
Science
Performance Number of Scores (Grade 6 + Grade 7)
Performance Points multiplied by
Number of Scores
Index = Total Points / Total Number of Scores Level Points
Exemplary 5 5 10 + 22 = 32 160
Exemplary 4 4 5 + 7 = 12 48
Met 3 23 + 15 = 38 114
Not Met 2 2 15 + 7 = 22 44
Not Met 1 1 2 + 3 = 5 5
Total 109 371 37 1 / 109 = 3.4037
Social Studies
Performance Number of Scores (Grade 6 + Grade 7)
Performance Points multiplied by
Number of Scores
Index = Total Points / Total Number of Scores Level Points
Exemplary 5 5 9 + 19 = 28 140
Exemplary 4 4 6 + 8 = 14 56
Met 3 21 + 17 = 38 114
Not Met 2 2 8 + 6 = 14 28
Not Met 1 1 9 + 2 = 11 11
Total 105 349 349 / 105 = 3.3238
The absolute index for the middle school grades is calculated by averaging the subject-area indices, giving each subject area index a weight as prescribed in Table 7.
Middle Grades Index = (.25 *ELA) + (.25 * Math) + (.25 * Science) + (.25 * Social Studies)
(.25 * 3.1567) + (.25 * 3.0258) + (.25 * 3.4037) +(.25 * 3.3238) = 3.2275
32
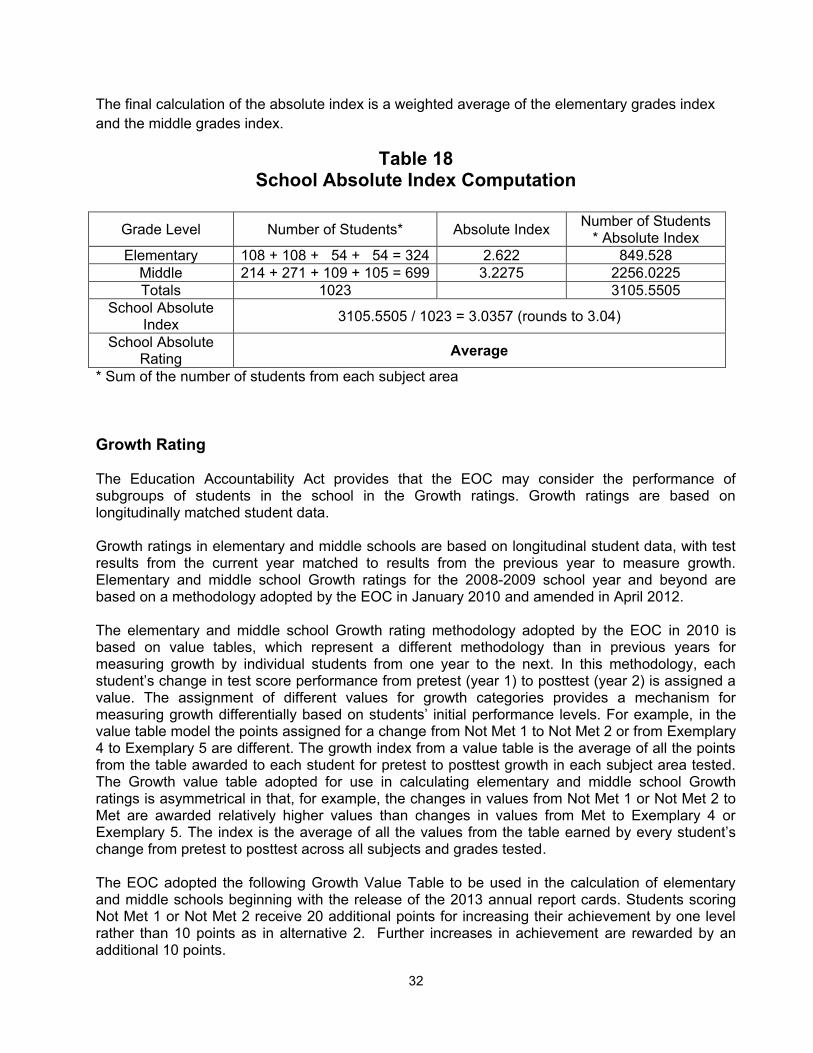
The final calculation of the absolute index is a weighted average of the elementary grades index
and the middle grades index.
Table 18 School Absolute Index Computation
Grade Level Number of Students* Absolute Index Number of Students
* Absolute Index
Elementary 108 + 108 + 54 + 54 = 324 2.622 849.528
Middle 214 + 271 + 109 + 105 = 699 3.2275 2256.0225
Totals 1023 3105.5505
School Absolute Index
3105.5505 / 1023 = 3.0357 (rounds to 3.04)
School Absolute Rating
Average
* Sum of the number of students from each subject area
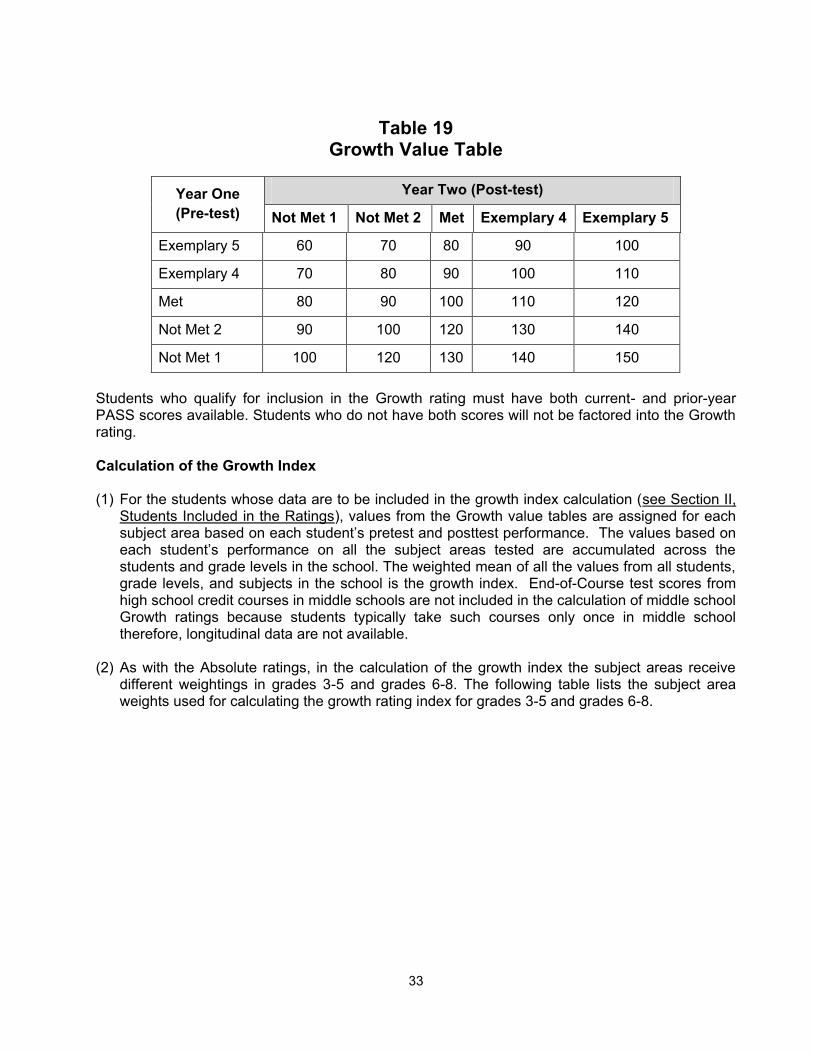
Growth Rating The Education Accountability Act provides that the EOC may consider the performance of subgroups of students in the school in the Growth ratings. Growth ratings are based on longitudinally matched student data. Growth ratings in elementary and middle schools are based on longitudinal student data, with test results from the current year matched to results from the previous year to measure growth. Elementary and middle school Growth ratings for the 2008-2009 school year and beyond are based on a methodology adopted by the EOC in January 2010 and amended in April 2012. The elementary and middle school Growth rating methodology adopted by the EOC in 2010 is based on value tables, which represent a different methodology than in previous years for measuring growth by individual students from one year to the next. In this methodology, each student’s change in test score performance from pretest (year 1) to posttest (year 2) is assigned a value. The assignment of different values for growth categories provides a mechanism for measuring growth differentially based on students’ initial performance levels. For example, in the value table model the points assigned for a change from Not Met 1 to Not Met 2 or from Exemplary 4 to Exemplary 5 are different. The growth index from a value table is the average of all the points from the table awarded to each student for pretest to posttest growth in each subject area tested. The Growth value table adopted for use in calculating elementary and middle school Growth ratings is asymmetrical in that, for example, the changes in values from Not Met 1 or Not Met 2 to Met are awarded relatively higher values than changes in values from Met to Exemplary 4 or Exemplary 5. The index is the average of all the values from the table earned by every student’s change from pretest to posttest across all subjects and grades tested. The EOC adopted the following Growth Value Table to be used in the calculation of elementary and middle schools beginning with the release of the 2013 annual report cards. Students scoring Not Met 1 or Not Met 2 receive 20 additional points for increasing their achievement by one level rather than 10 points as in alternative 2. Further increases in achievement are rewarded by an additional 10 points.
33
Table 19
Growth Value Table
Year One
(Pre-test)
Year Two (Post-test)
Not Met 1 Not Met 2 Met Exemplary 4 Exemplary 5
Exemplary 5 60 70 80 90 100
Exemplary 4 70 80 90 100 110
Met 80 90 100 110 120
Not Met 2 90 100 120 130 140
Not Met 1 100 120 130 140 150
Students who qualify for inclusion in the Growth rating must have both current- and prior-year PASS scores available. Students who do not have both scores will not be factored into the Growth rating. Calculation of the Growth Index (1) For the students whose data are to be included in the growth index calculation (see Section II,
Students Included in the Ratings), values from the Growth value tables are assigned for each subject area based on each student’s pretest and posttest performance. The values based on each student’s performance on all the subject areas tested are accumulated across the students and grade levels in the school. The weighted mean of all the values from all students, grade levels, and subjects in the school is the growth index. End-of-Course test scores from high school credit courses in middle schools are not included in the calculation of middle school Growth ratings because students typically take such courses only once in middle school therefore, longitudinal data are not available.
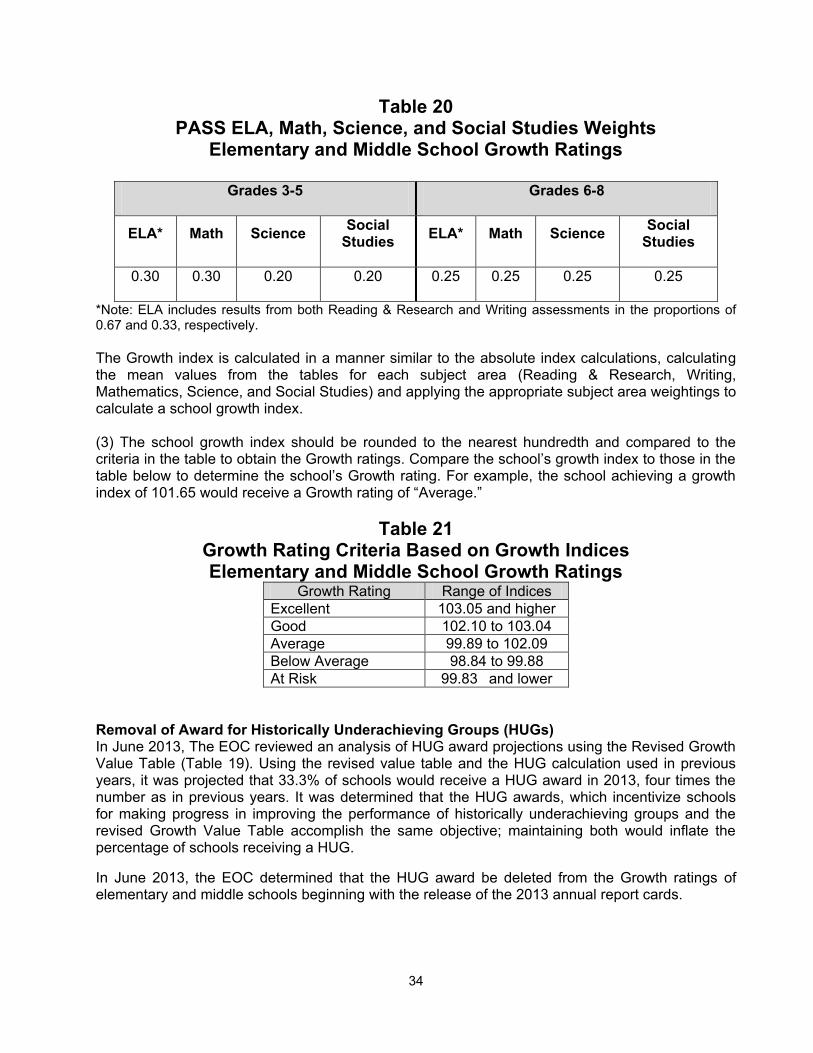
(2) As with the Absolute ratings, in the calculation of the growth index the subject areas receive
different weightings in grades 3-5 and grades 6-8. The following table lists the subject area weights used for calculating the growth rating index for grades 3-5 and grades 6-8.
34
Table 20 PASS ELA, Math, Science, and Social Studies Weights
Elementary and Middle School Growth Ratings
Grades 3-5 Grades 6-8
ELA* Math Science Social
Studies ELA* Math Science
Social Studies
0.30 0.30 0.20 0.20 0.25 0.25 0.25 0.25
*Note: ELA includes results from both Reading & Research and Writing assessments in the proportions of 0.67 and 0.33, respectively.
The Growth index is calculated in a manner similar to the absolute index calculations, calculating the mean values from the tables for each subject area (Reading & Research, Writing, Mathematics, Science, and Social Studies) and applying the appropriate subject area weightings to calculate a school growth index. (3) The school growth index should be rounded to the nearest hundredth and compared to the criteria in the table to obtain the Growth ratings. Compare the school’s growth index to those in the table below to determine the school’s Growth rating. For example, the school achieving a growth index of 101.65 would receive a Growth rating of “Average.”
Table 21 Growth Rating Criteria Based on Growth Indices Elementary and Middle School Growth Ratings
Growth Rating Range of Indices
Excellent 103.05 and higher
Good 102.10 to 103.04
Average 99.89 to 102.09
Below Average 98.84 to 99.88
At Risk 99.83 and lower
Removal of Award for Historically Underachieving Groups (HUGs) In June 2013, The EOC reviewed an analysis of HUG award projections using the Revised Growth Value Table (Table 19). Using the revised value table and the HUG calculation used in previous years, it was projected that 33.3% of schools would receive a HUG award in 2013, four times the number as in previous years. It was determined that the HUG awards, which incentivize schools for making progress in improving the performance of historically underachieving groups and the revised Growth Value Table accomplish the same objective; maintaining both would inflate the percentage of schools receiving a HUG.
In June 2013, the EOC determined that the HUG award be deleted from the Growth ratings of elementary and middle schools beginning with the release of the 2013 annual report cards.
35
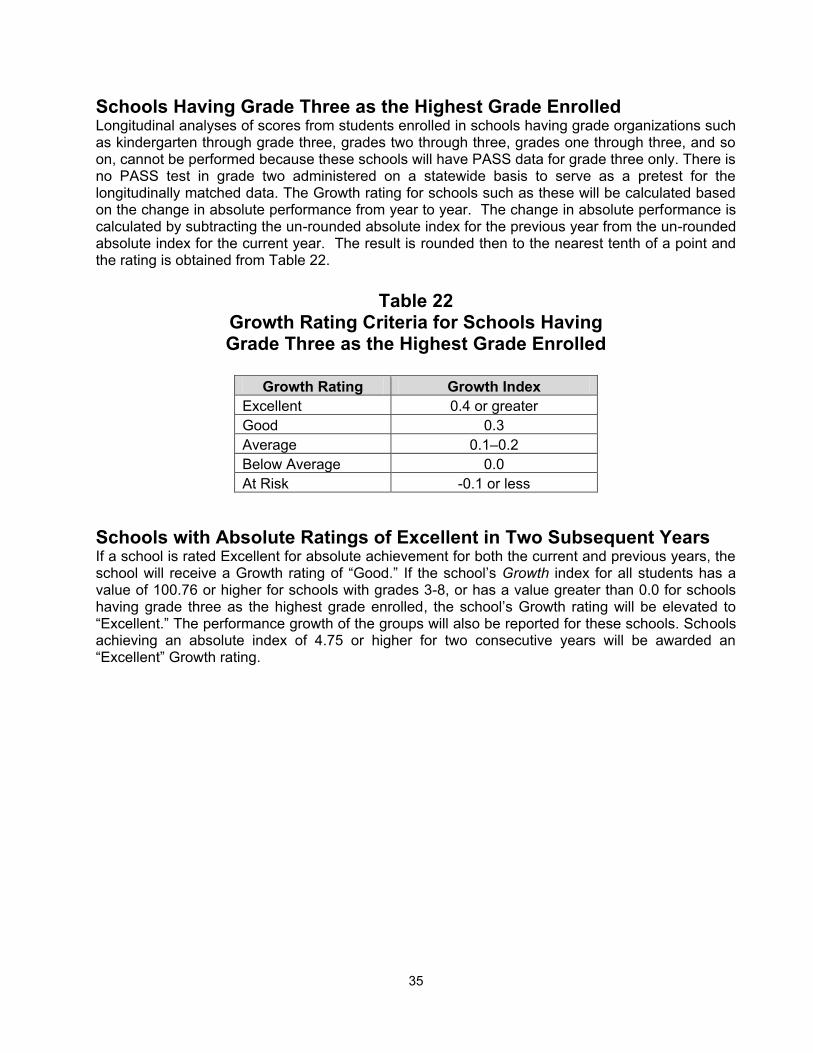
Schools Having Grade Three as the Highest Grade Enrolled Longitudinal analyses of scores from students enrolled in schools having grade organizations such as kindergarten through grade three, grades two through three, grades one through three, and so on, cannot be performed because these schools will have PASS data for grade three only. There is no PASS test in grade two administered on a statewide basis to serve as a pretest for the longitudinally matched data. The Growth rating for schools such as these will be calculated based on the change in absolute performance from year to year. The change in absolute performance is calculated by subtracting the un-rounded absolute index for the previous year from the un-rounded absolute index for the current year. The result is rounded then to the nearest tenth of a point and the rating is obtained from Table 22.
Table 22
Growth Rating Criteria for Schools Having Grade Three as the Highest Grade Enrolled
Growth Rating Growth Index
Excellent 0.4 or greater
Good 0.3
Average 0.1–0.2
Below Average 0.0
At Risk -0.1 or less
Schools with Absolute Ratings of Excellent in Two Subsequent Years If a school is rated Excellent for absolute achievement for both the current and previous years, the school will receive a Growth rating of “Good.” If the school’s Growth index for all students has a value of 100.76 or higher for schools with grades 3-8, or has a value greater than 0.0 for schools having grade three as the highest grade enrolled, the school’s Growth rating will be elevated to “Excellent.” The performance growth of the groups will also be reported for these schools. Schools achieving an absolute index of 4.75 or higher for two consecutive years will be awarded an “Excellent” Growth rating.
36
Ratings for High Schools In 2010-2011 and beyond, the Absolute and Growth Ratings for high schools are calculated on a weighted model using the following criteria: performance on HSAP of students at the school taking the test for the first time, longitudinal High School Assessment Program (HSAP) performance, the percentage of end-of-course tests administered at the school having scores of 70 or above, on-time graduation rate, and 5-year graduation rate. In August 2010 the EOC adopted recommendations from the High School Working Group that 5-year graduation rates be made a part of the high school ratings, that the point weights from the criteria making up the ratings be centered on 2009 performance, and that the high school Absolute indices should be comparable to the ranges of indices used for elementary and middle schools when assigning Absolute ratings. The full report of the High School Working Group can be found online at www.eoc.sc.gov.
Ratings Criteria – High Schools Longitudinal High School Assessment Program (HSAP) performance: This factor gauges
the percentage of students who pass the HSAP by the spring or subsequent summer graduation two years after taking the examination for the first time. Students transferring to other schools should be deleted from the calculation; however students dropping out are included. Longitudinal HSAP performance is the percentage of students who score a “2” level or higher on both ELA and Math within two years after taking it for the first time.
First-attempt HSAP performance: The percentage of students taking the High School Assessment Program (HSAP) for the first time who passed both the English language arts and mathematics subtests by scoring at the performance level of “2” or higher.
Percentage passing End-of-Course tests: The percent of passing scores (70 or higher) on
all of the End-of-Course tests administered in the high school during the school year and subsequent summer session. The end-of-course assessments currently include Algebra I, English I, U.S. History and the Constitution, and Biology I. In August 2010, the EOC adopted the following policy regarding End-of-Course test results linked to virtual and dual credit courses: End-of-course test scores linked to virtual and dual credit courses will be excluded from the high school rating calculation.
On-time Graduation rate: The percentage of students (including students with disabilities) enrolled on the 45th day of school of their first enrollment year as a ninth grader who earn a standard high school diploma (not GED), adjusted for transfers in and out of the school. Adjustments for students transferring out of the school or district cannot be made for those students for whom there is not evidence of enrollment in another state diploma granting program (for example, requests for transcripts from another state diploma granting program.) Data from students who meet the state diploma requirements as a result of attending summer school and/or successfully passing HSAP in the summer following their senior year will be included in the calculation of the on-time graduation rate.
The 5-year graduation rate for the current year represents an update to the on-time
graduation rate of the students in the previous year’s graduating class. For example, if a school had 100 students in the cohort of students in the graduating class of 2012 (the denominator) and 80 of those students received high school diplomas in 2012 (the numerator), its on-time graduation rate would be 80% (e.g., [(80/100)*100]). If 10 of the 20 students in the cohort who did not graduate in 2012 stayed in school and received high school diplomas in