Embed Size (px)
Citation preview
Bachelor of Engineering Electrical/Electronic Engineering (DT-021/4)
Calculation of the
Magnetic Field Level in
the Vicinity of a 400kV
Transmission Line
Power Systems Operations and Economics Daniel Greenan – D10119777
Calculation of the Magnetic Field level in the Vicinity of a 400kV Transmission Line
Page 2
Table of Contents
Introduction ............................................................................................................................... 4
Transmission Lines and the Public ............................................................................................. 6
400kV Overhead Line ................................................................................................................. 8
Magnetic Field ............................................................................................................................ 9
Attempts at Reducing Magnetic Field ..................................................................................... 11
Conclusion ................................................................................................................................ 13
Works Cited .............................................................................................................................. 14
Appendix .................................................................................................................................. 15

Calculation of the Magnetic Field level in the Vicinity of a 400kV Transmission Line
Page 3
Table of Graphs, Figures & Tables
Graph 1: Magnetic Field (Tesla) ............................................................................................................ 10
Graph 2: Magnetic Field (Gauss) ........................................................................................................... 10
Graph 3: Different Configurations for Analysis of Magnetic Fields ...................................................... 11
Graph 4: Magnetic Field with Conductors in Bundle 1 meter apart ..................................................... 12
Figure 1: Ireland’s National Grid (Designed in PowerPoint) ................................................................... 5
Figure 2: EirGrid’s Interconnector Plans (EirGrid, 2012) ......................................................................... 6
Figure 3: 400kV L12 Overhead Line Dimensions (Designed in PowerPoint) ........................................... 8
Figure 4: X and Y Values (PowerPoint) .................................................................................................... 9
Figure 5: EirGrid’s Future Plans for Expansion of Transmission Lines (Ivan Dudurych, 2011) .............. 13
Table 1: Surge Impedance Loading Table for Different Bundle Spacing (Nayak, 2006) ......................... 9
Calculation of the Magnetic Field level in the Vicinity of a 400kV Transmission Line
Page 4
Introduction
Electromagnetic Fields
Electric and magnetic fields (EMFs) are invisible lines of force that are created with the production of
electricity. Current is the flow of power. Therefore, if high units of power are required the voltage is
stepped up. The higher the current the stronger the electromagnetic forces will be. With higher
current and voltage (110-400kV) transmission, there is great concern for people who live in the
vicinity of these structures.
For Electric Fields the Force between two charges can be written as:
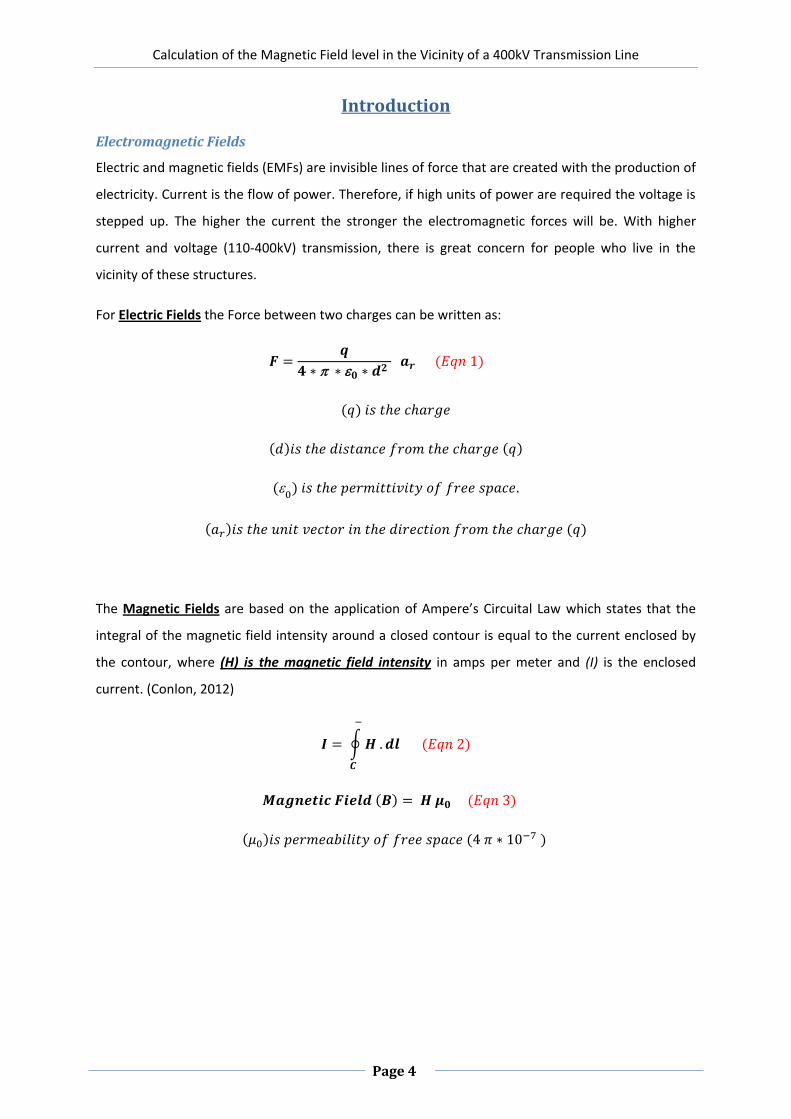
The Magnetic Fields are based on the application of Ampere’s Circuital Law which states that the
integral of the magnetic field intensity around a closed contour is equal to the current enclosed by
the contour, where (H) is the magnetic field intensity in amps per meter and (I) is the enclosed
current. (Conlon, 2012)
Calculation of the Magnetic Field level in the Vicinity of a 400kV Transmission Line
Page 5
Supply and Demand for Electricity
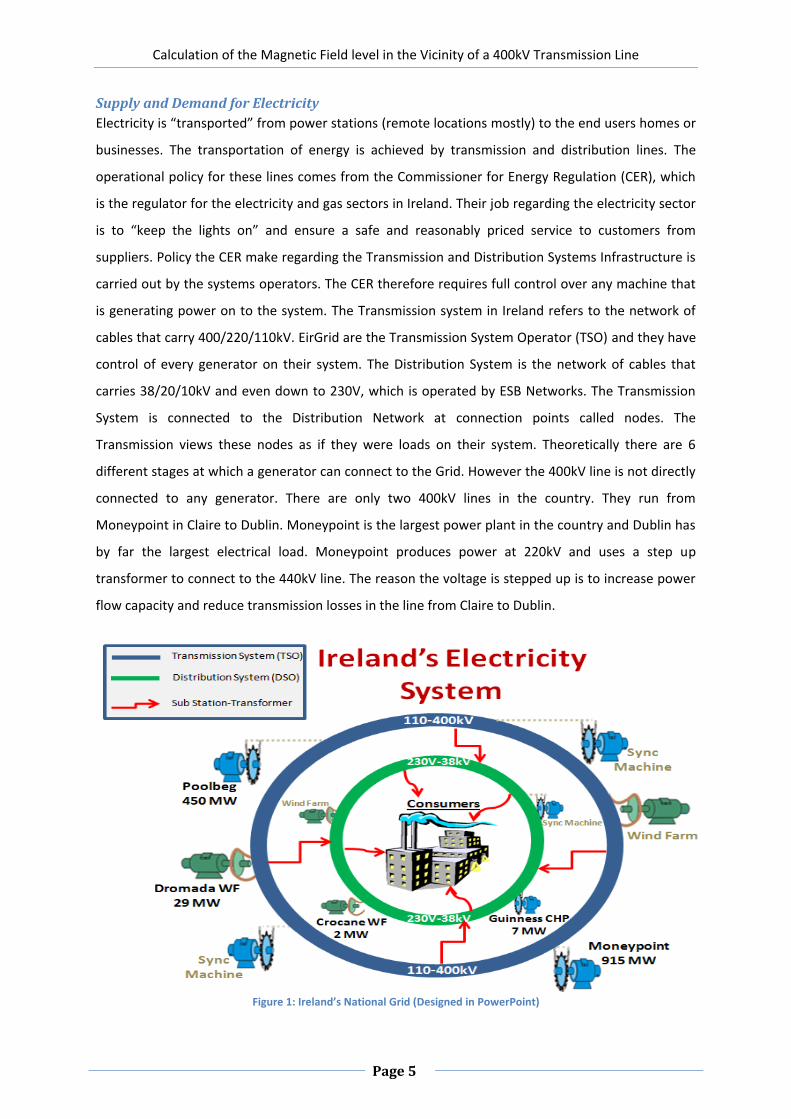
Electricity is “transported” from power stations (remote locations mostly) to the end users homes or
businesses. The transportation of energy is achieved by transmission and distribution lines. The
operational policy for these lines comes from the Commissioner for Energy Regulation (CER), which
is the regulator for the electricity and gas sectors in Ireland. Their job regarding the electricity sector
is to “keep the lights on” and ensure a safe and reasonably priced service to customers from
suppliers. Policy the CER make regarding the Transmission and Distribution Systems Infrastructure is
carried out by the systems operators. The CER therefore requires full control over any machine that
is generating power on to the system. The Transmission system in Ireland refers to the network of
cables that carry 400/220/110kV. EirGrid are the Transmission System Operator (TSO) and they have
control of every generator on their system. The Distribution System is the network of cables that
carries 38/20/10kV and even down to 230V, which is operated by ESB Networks. The Transmission
System is connected to the Distribution Network at connection points called nodes. The
Transmission views these nodes as if they were loads on their system. Theoretically there are 6
different stages at which a generator can connect to the Grid. However the 400kV line is not directly
connected to any generator. There are only two 400kV lines in the country. They run from
Moneypoint in Claire to Dublin. Moneypoint is the largest power plant in the country and Dublin has
by far the largest electrical load. Moneypoint produces power at 220kV and uses a step up
transformer to connect to the 440kV line. The reason the voltage is stepped up is to increase power
flow capacity and reduce transmission losses in the line from Claire to Dublin.
Figure 1: Ireland’s National Grid (Designed in PowerPoint)

Calculation of the Magnetic Field level in the Vicinity of a 400kV Transmission Line
Page 6
Transmission Lines and the Public
As populations around the world increase, there is a never ending need to provide electricity to
maintain high standards of living and with the large expansion of wind on the system, there is a
requirement to upgrade the transmission and distribution lines. With plans to develop 10GW of
wind farm projects over the next 20 years, EirGrid are now setting up to export electricity to England
and Europe. EirGrid are working on the East-West Interconnector which is due for completion this
year and the North-South Interconnector which is still in planning. Both these projects are of huge
importance to Ireland’s plans for exportation of any excess power that will be produced on to the
Grid in the future. The East –West Interconnector project has been executed with little interruption
or protest from the public. Most of the cable will be laid on the seabed of the Irish Sea and will
connect to converter stations at Rush North Beach, Dublin. However the North-South Interconnector
project has been crippled with planning objections. This is due to local residence objecting due to
the overhead line will have a negative visual impact and health implications.
Figure 2: EirGrid’s Interconnector Plans (EirGrid, 2012)
As the North-South project is fundamental to Ireland’s future security of supply the idea that the
visual landscape should take preference does not make sense. If the construction of a motorway is
stopped due to a planned issue, a county council can overrule the decision if the project is deemed
of national strategic importance.

Calculation of the Magnetic Field level in the Vicinity of a 400kV Transmission Line
Page 7
Therefore the only objection remaining is the health concerns of the local residence. This should not
be overlooked regardless of the importance of any project. A website called power line facts claims
that,
“A major new study published in the British Medical Journal looked at cancer data in England and
Wales between 1962 and 1995, for children aged up to 15 years old. The study found that children
whose birth address was within 200 meters of an overhead power line had a 70% increased risk of
leukaemia.”
Case Study
There were two possible case studies that could be assigned to each student.
1. Calculation the electric field level in the vicinity of a transmission or distribution line.
Or
2. Calculation the magnetic field level in the vicinity of a transmission or distribution line.
The size (voltage) and location (overhead or underground) was also assigned to each student. This
report stayed away from commenting on the health implications of being exposed to Electric or
Magnetic Fields. Instead the report will display the steps required to measure the magnetic field at
any point of distance away from the overhead line. From the Graphs that will be produced, the
reader will gain a clear view of the exposure to magnetic fields in relation to the distance from a
transmission line.
The transmission line assigned for this report was a 400kV overhead line and the task was to
calculate the Magnetic Field Level its vicinity.

Calculation of the Magnetic Field level in the Vicinity of a 400kV Transmission Line
Page 8
400kV Overhead Line
There are different types of design for every overhead line. The overhead chosen for this report is
the 400kV version L12 (National Grid, 2011). The dimensions are displayed in Figure 3. To determine
the magnetic field at a given distance from the overhead line, the distances from a set point to all
twelve conductors need to be known. There are six pairs (twelve) conductors in L12. The pairs are
spaced 500mm apart.
Figure 3: 400kV L12 Overhead Line Dimensions (Designed in PowerPoint)
The measurement of the magnetic field will be based along the 1 meter above ground line shown in
Figure 3. This analysis will therefore show the magnetic fields exposure to anyone walking around
the area of the overhead lines. (mx), (bx) and (tx) are the labels assigned to the conductors in
MatLab.

Calculation of the Magnetic Field level in the Vicinity of a 400kV Transmission Line
Page 9
Magnetic Field
The following equations are used to calculate the magnetic field. The results for Equation 4 and 5
depend on the number of conductors on the line and the distance of all the conductors from a given
point along the one meter line.
As there are 12 conductors, there will therefore be 12 (Bx) and 12 (By) values. The value of the
current (I) following in the conductors must also be calculated.
Surge Impedance Loading (SIL) level.
SIL level of a typical uncompensated 400kV with a bundle spacing of 450mm is 623MW as seen in
Table 1. The SIL increases as spacing increases. The SIL that will be used is 630MW for a 500mm
bundle spacing.
Table 1: Surge Impedance Loading Table for Different Bundle Spacing (Nayak, 2006)
Figure 4: X and Y Values (PowerPoint)

Calculation of the Magnetic Field level in the Vicinity of a 400kV Transmission Line
Page 10
Matlab was used to calculate the magnetic Field at any point for 100ms either side of the conductor
at 1m off the ground. As can be seen in Graph 1 the Magnetic field is 3.45 (μT) at the center of the
structure one meter above the ground. Graph 2 represents the magnetic field in Gauss (3.45 mG)
Graph 1: Magnetic Field (Tesla)
Graph 2: Magnetic Field (Gauss)
-100 -80 -60 -40 -20 0 20 40 60 80 1000
0.5
1
1.5
2
2.5
3
3.5x 10
-5
Magnetic f
lux (
T)
Meters
Magnetic Field Graph
Original 400/L12 Design
-100 -80 -60 -40 -20 0 20 40 60 80 1000
0.5
1
1.5
2
2.5
3
3.5x 10
-3
Magnetic f
lux (
G)
Meters
Magnetic Field Graph
Original 400/L12 Design

Calculation of the Magnetic Field level in the Vicinity of a 400kV Transmission Line
Page 11
Attempts at Reducing Magnetic Field
In an attempt to reduce the magnetic field along a range of points, 1 meter from the ground, the
distances of the conductors were changed in three different ways from the original design.
1. Original Design: This plot was calculated in Matlab using the dimensions from Figure 3 and
using Equations 4-6.
2. Compact Conductors: For this plot the bundles were brought closer together by a factor of
20% but the lowest conductor remained at 12 meters from the ground. However this change
is purely theoretical as to bring the conductors closer together could cause other
instabilities, (i.e. Structural, arcing, ect…)
3. Swapped Phases: As the angle of the current for the phase closest to the ground was zero for
the original Design, its magnitude was different to the other two phases as shown in the
Matlab code in the Appendix. The top and bottom phase were switched position and the
heights of the conductors were kept at the same as the Original Design. This design showed
the best improvement in the reduction of the magnetic field as shown in the Graph.
4. Minimum Height: The Minimum height allowed for the lowest conductor on a 400kV in 7.6
meters (National Grid, 2011). This simulation plotted the nearest conductor from the ground
at the minimum height but kept the distances between the phases the same as the Original
design. This resulted in a large increase in the magnetic field.
Graph 3: Different Configurations for Analysis of Magnetic Fields
-100 -80 -60 -40 -20 0 20 40 60 80 1000
1
2
3
4
5
6
7x 10
-5
Mag
netic
flu
x (T
)
Meters
Magnetic Field Graph
Original Design
Compact Conductors
Swapped Phases
Minimum Height

Calculation of the Magnetic Field level in the Vicinity of a 400kV Transmission Line
Page 12
Table 1 and Equation 7 from page 9 of this report, displayed that a change in the spacing of the
conductors from a bundle causes a change in the Surge Impedance Loading, a change in the current
that flows in each conductor and therefore a change in the Magnetic Field. The original design
spaced the conductors in a bundle 500mm apart. Graph 4 displays the Magnetic field of the Original
design with all twelve conductors spaced 500mm apart against the conductors spaced 1 meter apart.
Graph 4: Magnetic Field with Conductors in Bundle 1 meter apart
This change to the parameters of the overhead line bundles displayed the highest level of magnetic
field at 1 meter from the ground and therefore shows that the closer the conductor bundles can be
together the lower the magnetic field.
-100 -80 -60 -40 -20 0 20 40 60 80 1000
1
2
3
4
5
6x 10
-5
Magnetic f
lux (
T)
Meters
Magnetic Field Graph
Original 400/L12 Design
1m Spaced Conductors
Calculation of the Magnetic Field level in the Vicinity of a 400kV Transmission Line
Page 13
Conclusion
The line assigned for this report was the 400kV overhead line. This line operates at the transmission
level of electricity supply system. In Ireland the transmission range of voltage operation is 110-
400kV. The parameters for this design were sourced from the National Grid, UK website.
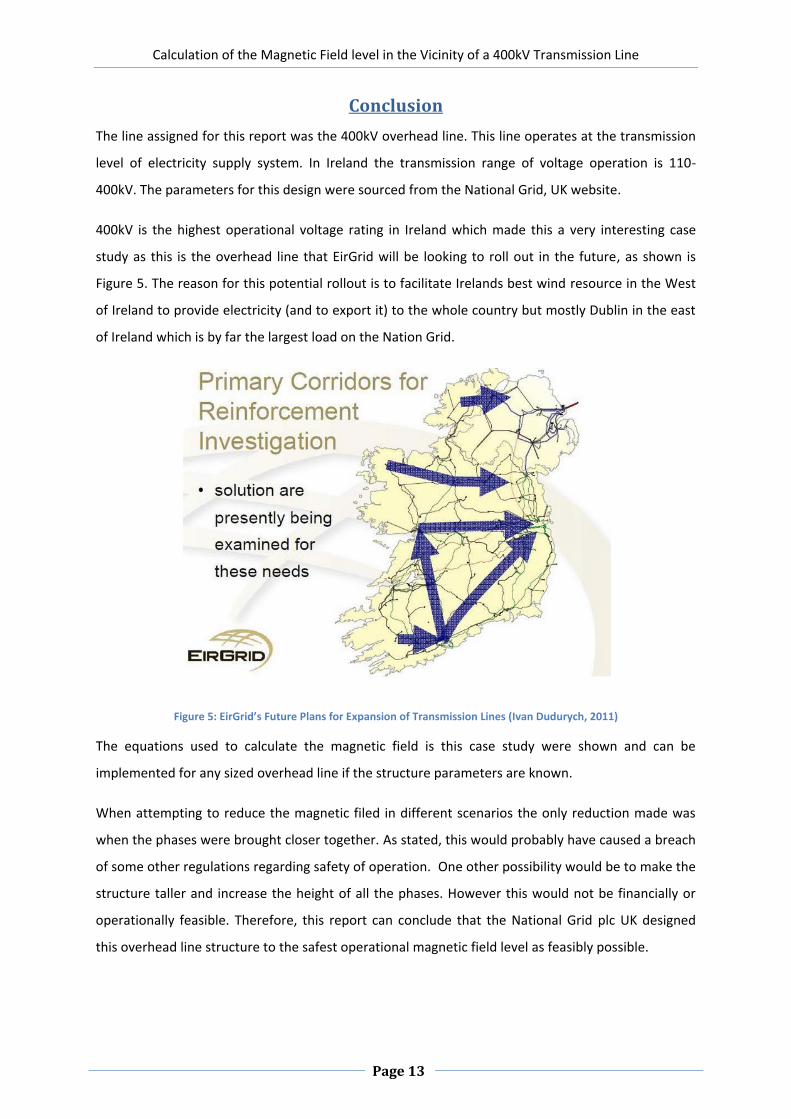
400kV is the highest operational voltage rating in Ireland which made this a very interesting case
study as this is the overhead line that EirGrid will be looking to roll out in the future, as shown is
Figure 5. The reason for this potential rollout is to facilitate Irelands best wind resource in the West
of Ireland to provide electricity (and to export it) to the whole country but mostly Dublin in the east
of Ireland which is by far the largest load on the Nation Grid.
Figure 5: EirGrid’s Future Plans for Expansion of Transmission Lines (Ivan Dudurych, 2011)
The equations used to calculate the magnetic field is this case study were shown and can be
implemented for any sized overhead line if the structure parameters are known.
When attempting to reduce the magnetic filed in different scenarios the only reduction made was
when the phases were brought closer together. As stated, this would probably have caused a breach
of some other regulations regarding safety of operation. One other possibility would be to make the
structure taller and increase the height of all the phases. However this would not be financially or
operationally feasible. Therefore, this report can conclude that the National Grid plc UK designed
this overhead line structure to the safest operational magnetic field level as feasibly possible.

Calculation of the Magnetic Field level in the Vicinity of a 400kV Transmission Line
Page 14
Works Cited Conlon, M., 2012. Technical aspects of Electromagnetic Fields and Shielding, Dublin: D.I.T.
EirGrid, 2012. EirGrid's East-West Twitter Page. [Online]
Available at: http://twitter.com/#!/ewicIreland/
[Accessed 2nd April 2012].
Ivan Dudurych, 2011. EirGrid plc. [Online]
Available at: www.eirgrid.com
[Accessed 2 april 2012].
National Grid, 2011. EMFs Information. [Online]
Available at:
http://www.emfs.info/Sources+of+EMFs/Overhead+power+lines/Calculating/geometries/
[Accessed 02 April 2012].
Nayak, R., 2006. EHV Transmission Line Capacity Enhancement through Increase in Serge Impedance
Loading Level. IEEE xplore, p. 3.
Calculation of the Magnetic Field level in the Vicinity of a 400kV Transmission Line
Page 15
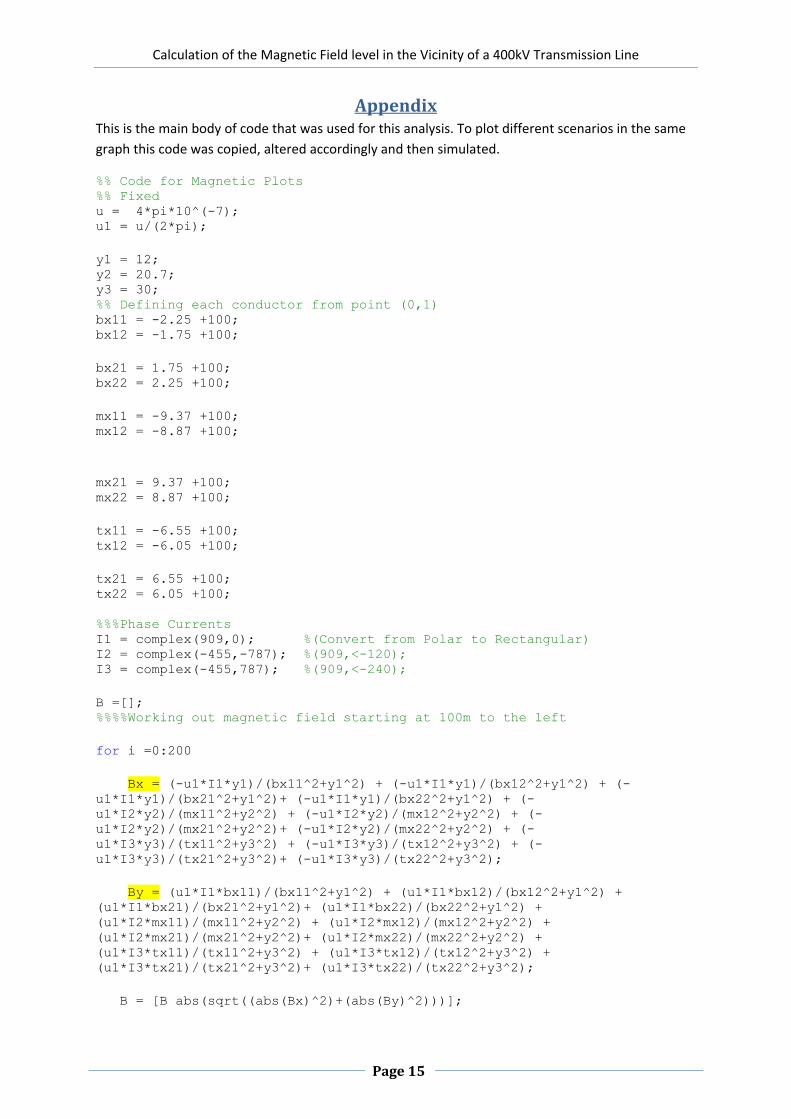
Appendix This is the main body of code that was used for this analysis. To plot different scenarios in the same
graph this code was copied, altered accordingly and then simulated.
%% Code for Magnetic Plots %% Fixed u = 4*pi*10^(-7); u1 = u/(2*pi);
y1 = 12; y2 = 20.7; y3 = 30; %% Defining each conductor from point (0,1) bx11 = -2.25 +100; bx12 = -1.75 +100;
bx21 = 1.75 +100; bx22 = 2.25 +100;
mx11 = -9.37 +100; mx12 = -8.87 +100;
mx21 = 9.37 +100; mx22 = 8.87 +100;
tx11 = -6.55 +100; tx12 = -6.05 +100;
tx21 = 6.55 +100; tx22 = 6.05 +100;
%%%Phase Currents I1 = complex(909,0); %(Convert from Polar to Rectangular) I2 = complex(-455,-787); %(909,<-120); I3 = complex(-455,787); %(909,<-240);
B =[]; %%%%Working out magnetic field starting at 100m to the left
for i =0:200
Bx = (-u1*I1*y1)/(bx11^2+y1^2) + (-u1*I1*y1)/(bx12^2+y1^2) + (-
u1*I1*y1)/(bx21^2+y1^2)+ (-u1*I1*y1)/(bx22^2+y1^2) + (-
u1*I2*y2)/(mx11^2+y2^2) + (-u1*I2*y2)/(mx12^2+y2^2) + (-
u1*I2*y2)/(mx21^2+y2^2)+ (-u1*I2*y2)/(mx22^2+y2^2) + (-
u1*I3*y3)/(tx11^2+y3^2) + (-u1*I3*y3)/(tx12^2+y3^2) + (-
u1*I3*y3)/(tx21^2+y3^2)+ (-u1*I3*y3)/(tx22^2+y3^2);
By = (u1*I1*bx11)/(bx11^2+y1^2) + (u1*I1*bx12)/(bx12^2+y1^2) +
(u1*I1*bx21)/(bx21^2+y1^2)+ (u1*I1*bx22)/(bx22^2+y1^2) +
(u1*I2*mx11)/(mx11^2+y2^2) + (u1*I2*mx12)/(mx12^2+y2^2) +
(u1*I2*mx21)/(mx21^2+y2^2)+ (u1*I2*mx22)/(mx22^2+y2^2) +
(u1*I3*tx11)/(tx11^2+y3^2) + (u1*I3*tx12)/(tx12^2+y3^2) +
(u1*I3*tx21)/(tx21^2+y3^2)+ (u1*I3*tx22)/(tx22^2+y3^2);
B = [B abs(sqrt((abs(Bx)^2)+(abs(By)^2)))];
Calculation of the Magnetic Field level in the Vicinity of a 400kV Transmission Line
Page 16
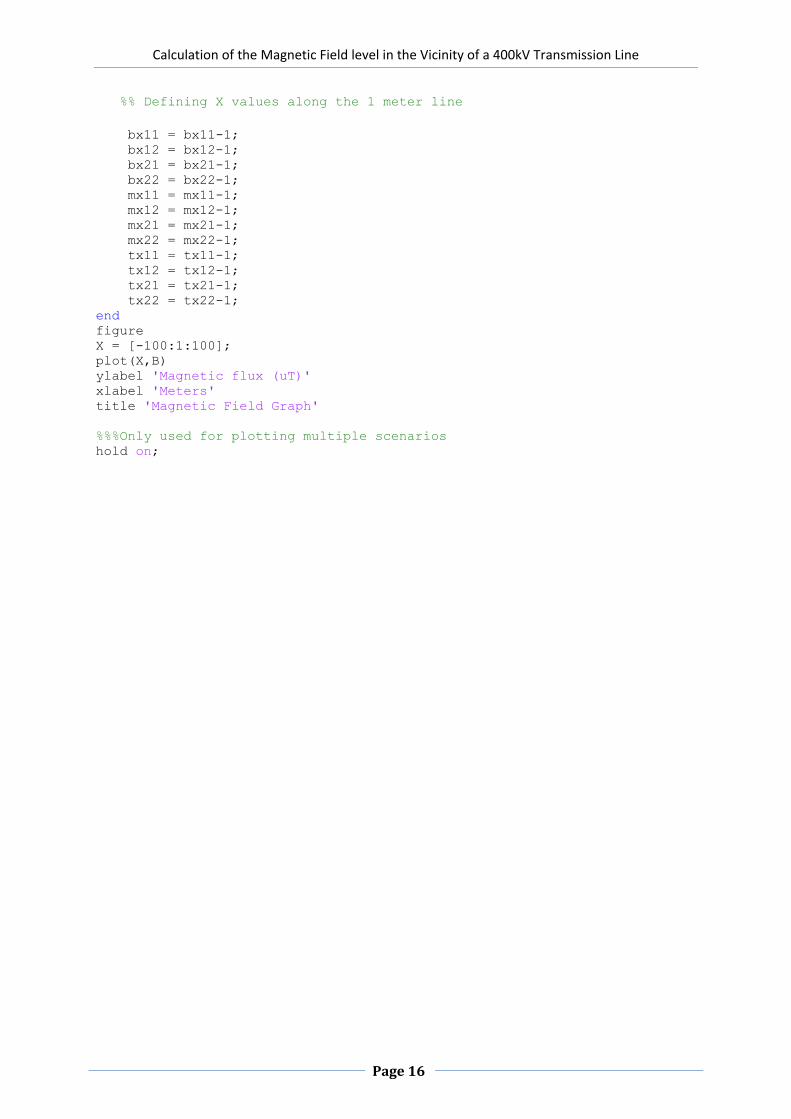
%% Defining X values along the 1 meter line
bx11 = bx11-1; bx12 = bx12-1; bx21 = bx21-1; bx22 = bx22-1; mx11 = mx11-1; mx12 = mx12-1; mx21 = mx21-1; mx22 = mx22-1; tx11 = tx11-1; tx12 = tx12-1; tx21 = tx21-1; tx22 = tx22-1; end figure X = [-100:1:100]; plot(X,B) ylabel 'Magnetic flux (uT)' xlabel 'Meters' title 'Magnetic Field Graph'
%%%Only used for plotting multiple scenarios
hold on;