Embed Size (px)
Citation preview
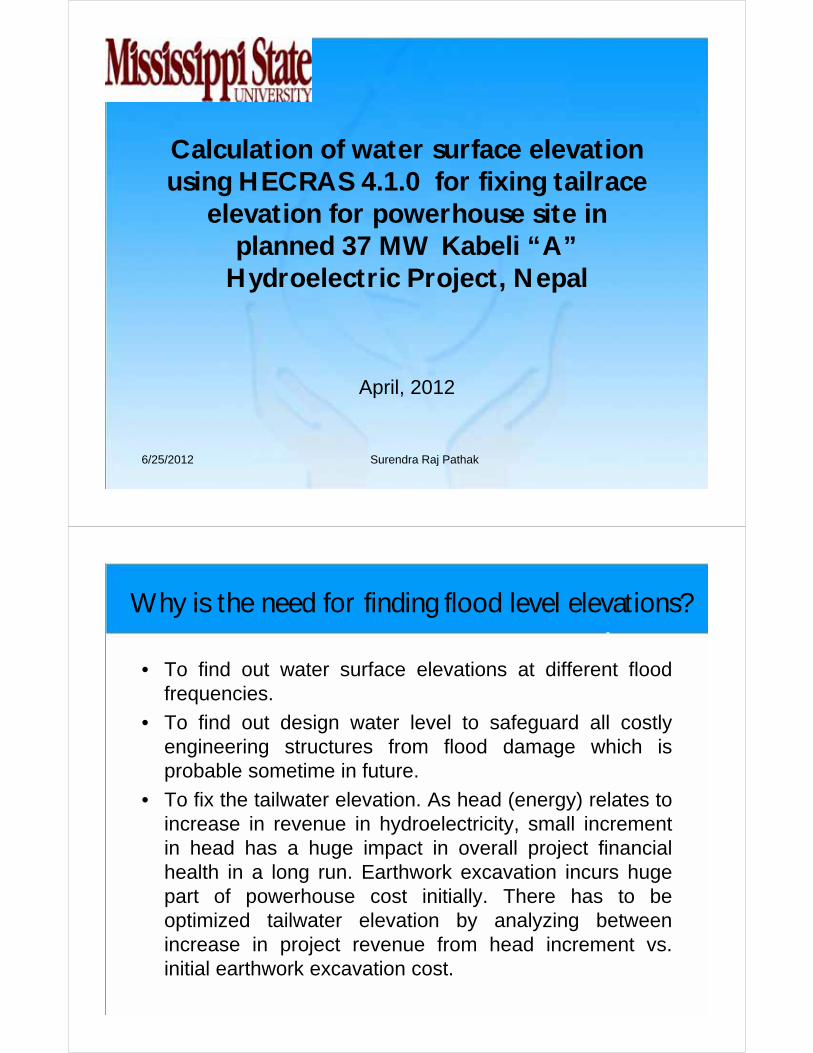
Calculation of water surface elevation using HECRAS 4.1.0 for fixing tailrace
elevation for powerhouse site in planned 37 MW Kabeli “A”
Hydroelectric Project, Nepal
April, 2012
6/25/2012 Surendra Raj Pathak
Why is the need for finding flood level elevations?
• To find out water surface elevations at different floodfrequencies.
• To find out design water level to safeguard all costlyengineering structures from flood damage which isprobable sometime in future.
• To fix the tailwater elevation. As head (energy) relates toincrease in revenue in hydroelectricity, small incrementin head has a huge impact in overall project financialhealth in a long run. Earthwork excavation incurs hugepart of powerhouse cost initially. There has to beoptimized tailwater elevation by analyzing betweenincrease in project revenue from head increment vs.initial earthwork excavation cost.
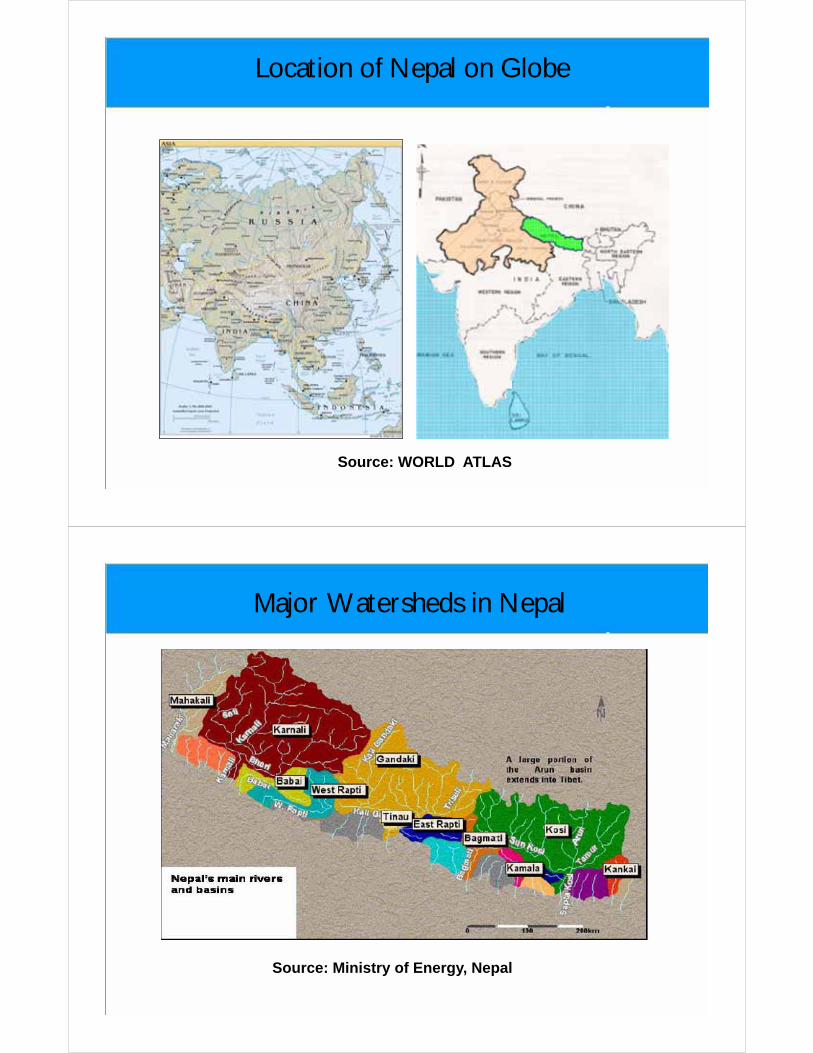
Location of Nepal on Globe
Source: WORLD ATLAS
Major Watersheds in Nepal
Source: Ministry of Energy, Nepal
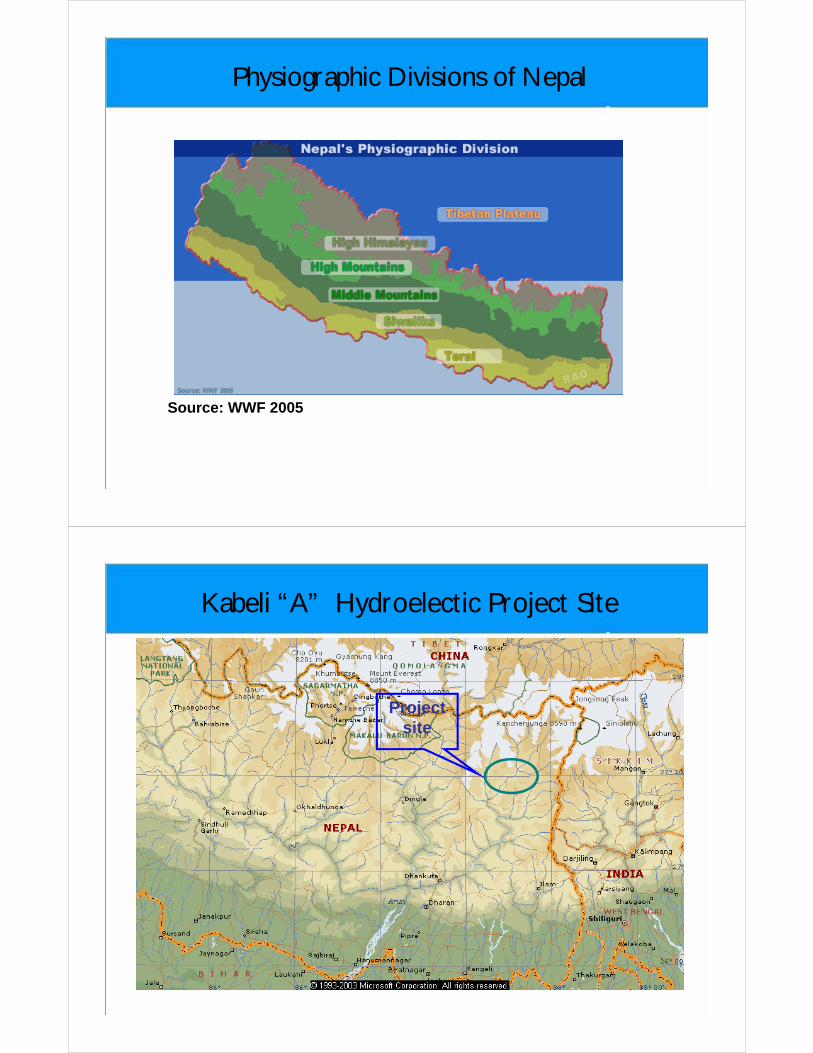
Physiographic Divisions of Nepal
Source: WWF 2005
Kabeli “A” Hydroelectic Project Site
Project site
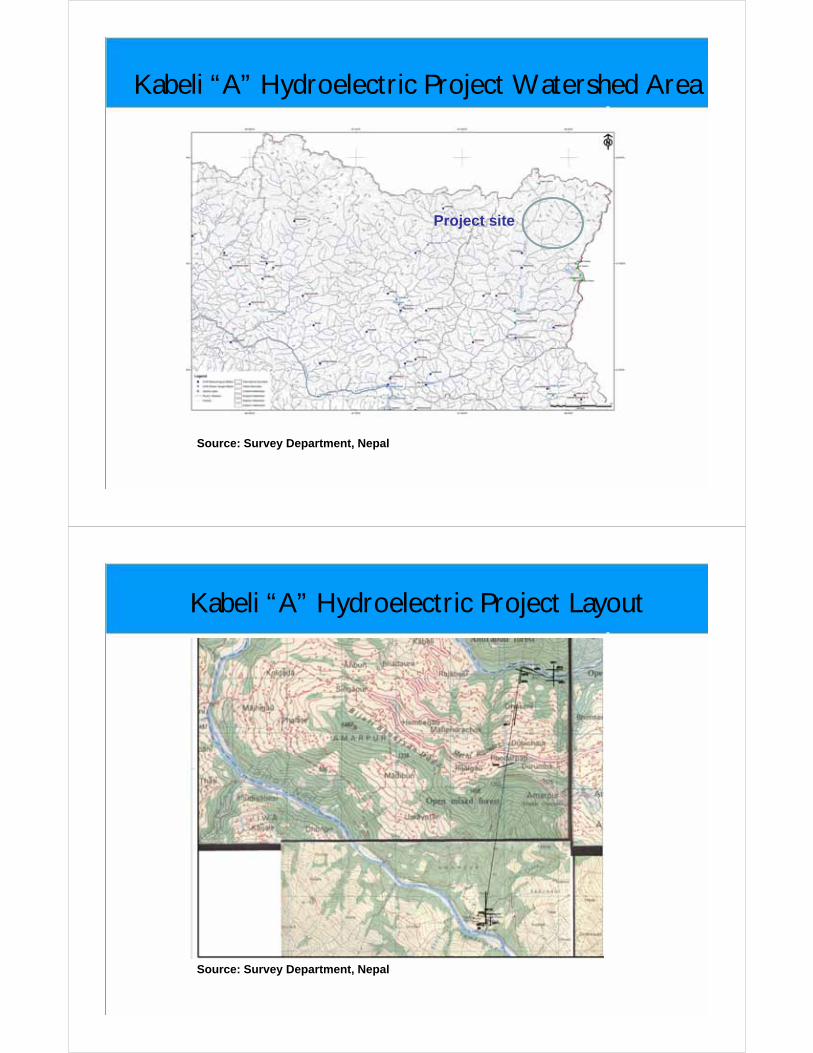
Kabeli “A” Hydroelectric Project Watershed Area
Source: Survey Department, Nepal
Project site
Kabeli “A” Hydroelectric Project Layout
Source: Survey Department, Nepal
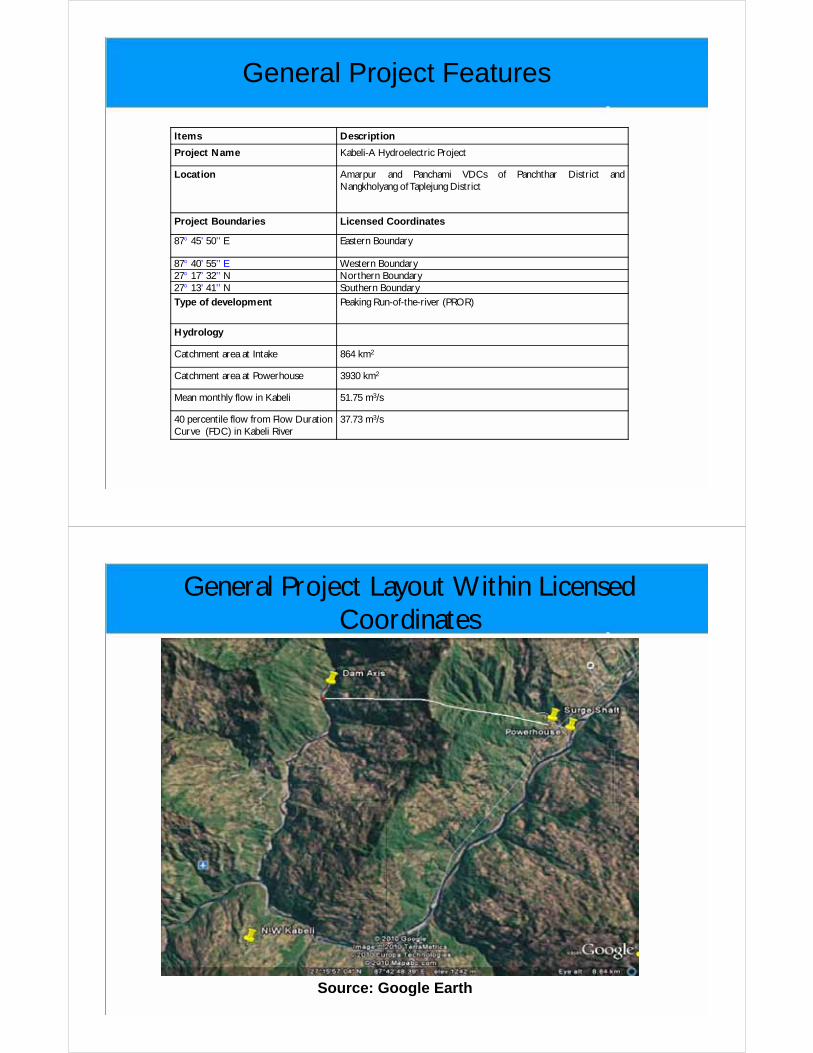
General Project Features
Items Description
Project Name Kabeli-A Hydroelectric Project
Location Amarpur and Panchami VDCs of Panchthar District andNangkholyang of Taplejung District
Project Boundaries Licensed Coordinates
87 45’ 50’’ E Eastern Boundary
87 40’ 55’’ E Western Boundary27 17’ 32’’ N Northern Boundary27 13’ 41’’ N Southern BoundaryType of development Peaking Run-of-the-river (PROR)
Hydrology
Catchment area at Intake 864 km2
Catchment area at Powerhouse 3930 km2
Mean monthly flow in Kabeli 51.75 m3/s
40 percentile flow from Flow Duration Curve (FDC) in Kabeli River
37.73 m3/s
General Project Layout Within Licensed Coordinates
Source: Google Earth
11
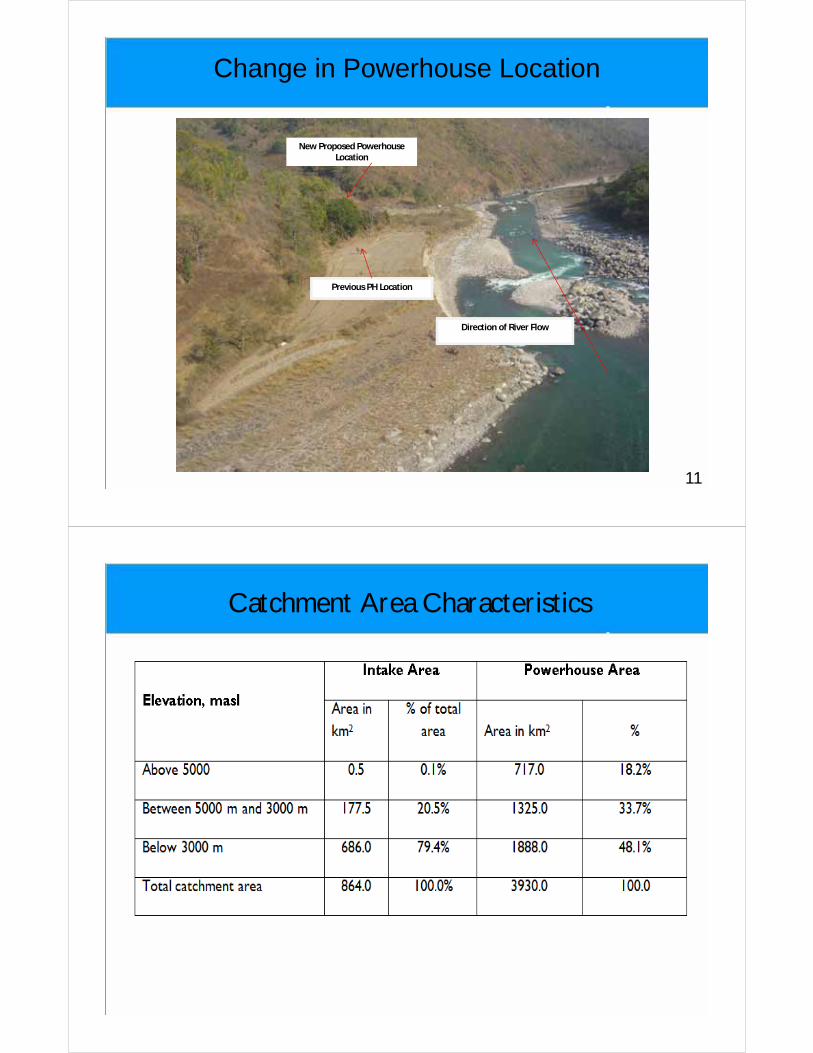
Change in Powerhouse Location
Previous PH Location
New Proposed Powerhouse Location
Direction of River Flow
Catchment Area Characteristics
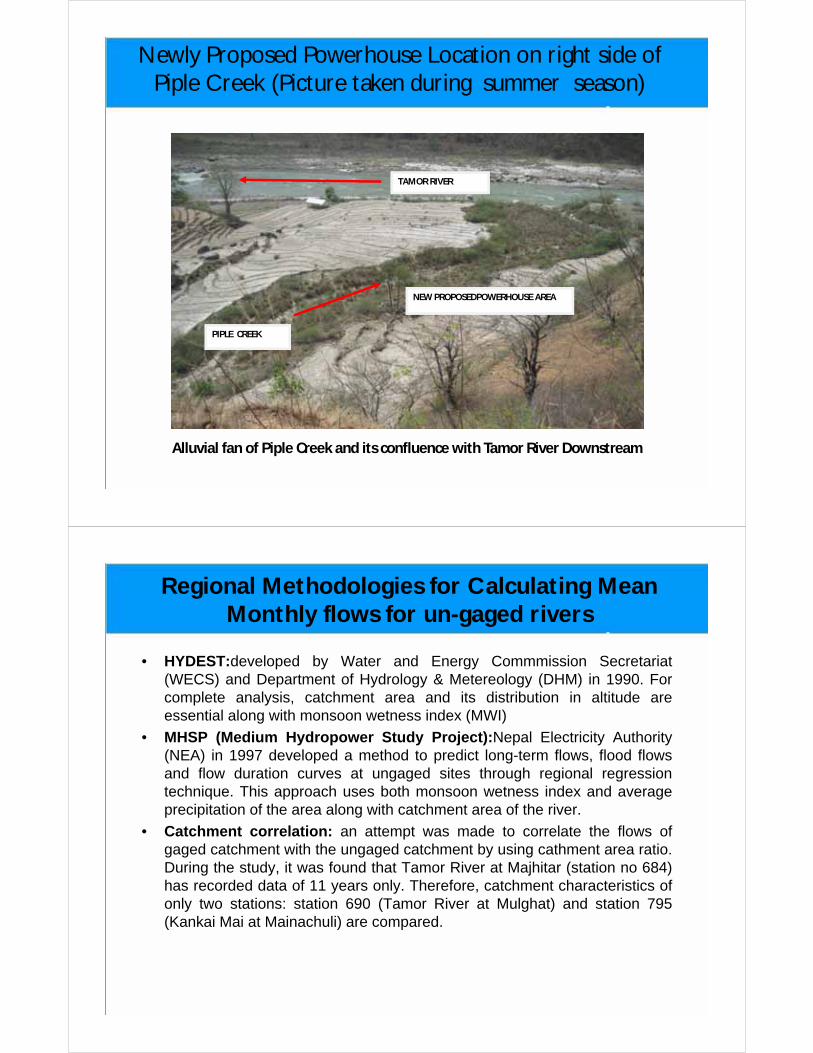
Newly Proposed Powerhouse Location on right side of Piple Creek (Picture taken during summer season)
Alluvial fan of Piple Creek and its confluence with Tamor River Downstream
TAMOR RIVER
PIPLE CREEK
NEW PROPOSEDPOWERHOUSE AREA
Regional Methodologies for Calculating Mean Monthly flows for un-gaged rivers
• HYDEST:developed by Water and Energy Commmission Secretariat(WECS) and Department of Hydrology & Metereology (DHM) in 1990. Forcomplete analysis, catchment area and its distribution in altitude areessential along with monsoon wetness index (MWI)
• MHSP (Medium Hydropower Study Project):Nepal Electricity Authority(NEA) in 1997 developed a method to predict long-term flows, flood flowsand flow duration curves at ungaged sites through regional regressiontechnique. This approach uses both monsoon wetness index and averageprecipitation of the area along with catchment area of the river.
• Catchment correlation: an attempt was made to correlate the flows ofgaged catchment with the ungaged catchment by using cathment area ratio.During the study, it was found that Tamor River at Majhitar (station no 684)has recorded data of 11 years only. Therefore, catchment characteristics ofonly two stations: station 690 (Tamor River at Mulghat) and station 795(Kankai Mai at Mainachuli) are compared.
Newly Proposed Powerhouse Location during rainy season (Monsoon)
RETAINING WALLS FOR PIPLE CREEK DIVERSION
TAMOR RIVER
NEWLY PROPOSED POWERHOUSE AREA
PIPLE CREEK
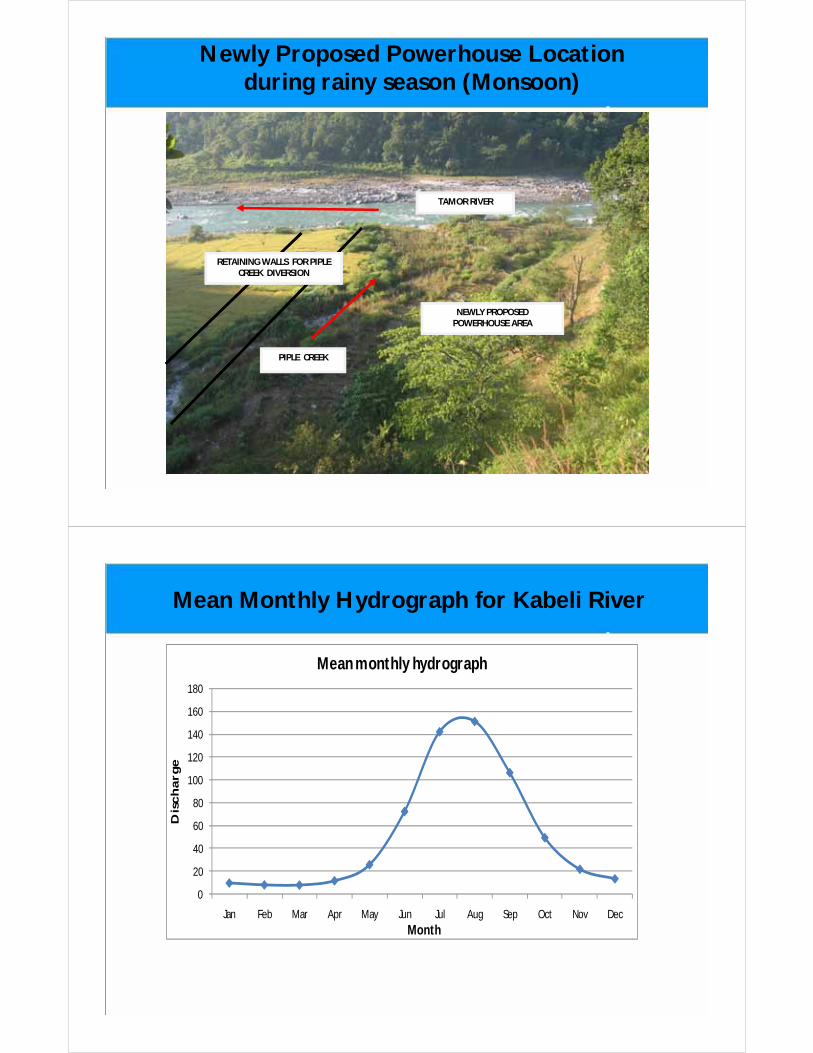
Mean Monthly Hydrograph for Kabeli River
0
20
40
60
80
100
120
140
160
180
Jan Feb Mar Apr May Jun Jul Aug Sep Oct Nov Dec
Dis
ch
arge
Month
Mean monthly hydrograph
Extreme Hydrology ( Flood Frequency Analysis) for Ungaged Catchment
• Catchment Area Ratio (CAR) Method:The maximum instantaneous flow dataof Tamor River at Mulghat (station number 690) is available from the year 1965to year 2006.Three distribution methods; Lognormal, Log Pearson III andGumbel distribution methods were used to estimate the flow for different returnperiods. The Log pearson III method has given the best fit curve, therefore theresult given by this method is taken
• Regression analysis method: Instantaneous maximum flow data from 15gaging stations, all lying within Koshi basin was collected and their individualfrequency analysis was carried out. Then, regression equations were developedbetween the catchment area below elevation 3000 m and T-year return period.
• Regional flood frequency analysis method: The same 15 gaging stations asmentioned in above method were selected for analysis in this method as well.The frequency analysis of maximum instantaneous floods was carried out foreach of the station and regression equation between the mean flood discharge(Q2.33) and the catchment area was developed. The equation used is:
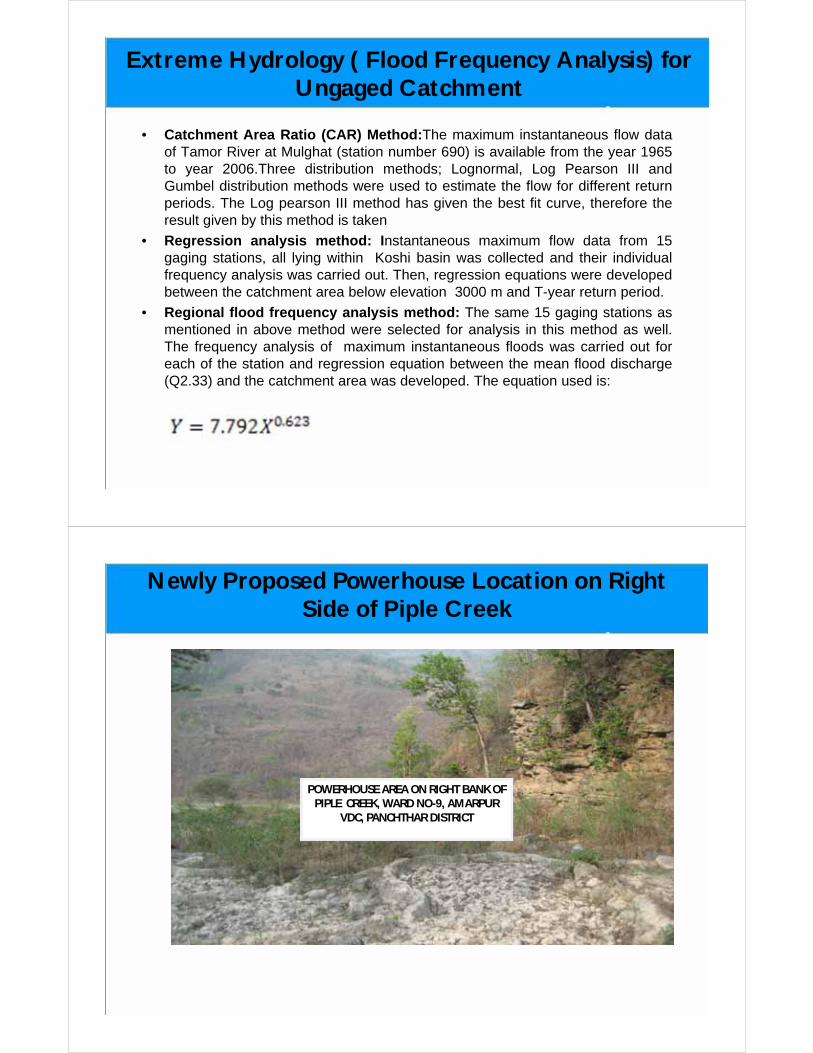
POWERHOUSE AREA ON RIGHT BANK OF PIPLE CREEK, WARD NO-9, AMARPUR
VDC, PANCHTHAR DISTRICT
Newly Proposed Powerhouse Location on Right Side of Piple Creek

What is Glacial Lake Outburst Flood (GLOF) ?
A glacial lake outburst flood (GLOF) is a type ofoutburst flood that occurs when the dam containinga glacial lake fails. The dam can consist of glacier iceor a terminal moraine. Failure can happen due toerosion, a buildup of water pressure, an avalanche ofrock or heavy snow, an earthquake or cryoseism,volcanic eruptions under the ice, or if a large enoughportion of a glacier breaks off and massivelydisplaces the waters in a glacial lake at its base.
Source:http://en.wikipedia.org/wiki/Glacial_lake_outburst_flood
Glacial Lake Outburst Flood (GLOF) events are likely with high seismic events in Himalayas
Source: http://www.swisseduc.ch/glaciers/glossary/glof-2-en.html
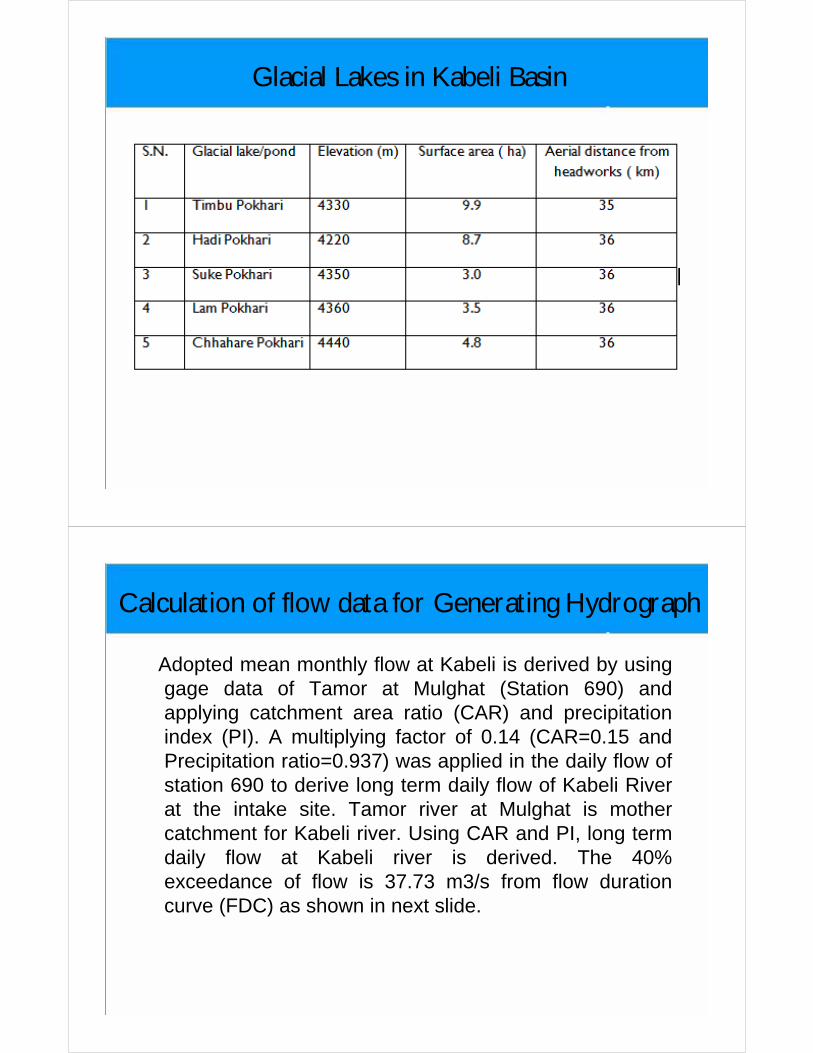
Glacial Lakes in Kabeli Basin
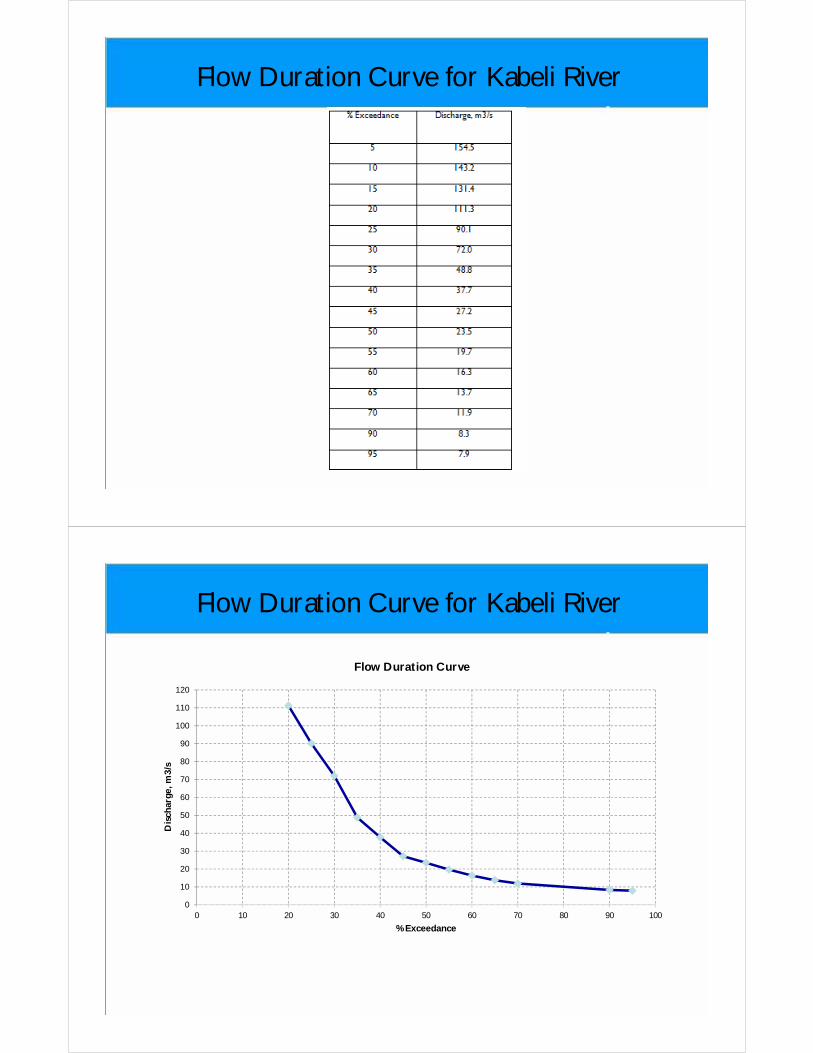
Calculation of flow data for Generating Hydrograph
Adopted mean monthly flow at Kabeli is derived by usinggage data of Tamor at Mulghat (Station 690) andapplying catchment area ratio (CAR) and precipitationindex (PI). A multiplying factor of 0.14 (CAR=0.15 andPrecipitation ratio=0.937) was applied in the daily flow ofstation 690 to derive long term daily flow of Kabeli Riverat the intake site. Tamor river at Mulghat is mothercatchment for Kabeli river. Using CAR and PI, long termdaily flow at Kabeli river is derived. The 40%exceedance of flow is 37.73 m3/s from flow durationcurve (FDC) as shown in next slide.
Flow Duration Curve for Kabeli River
Flow Duration Curve for Kabeli River
0
10
20
30
40
50
60
70
80
90
100
110
120
0 10 20 30 40 50 60 70 80 90 100
Dis
char
ge, m
3/s
% Exceedance
Flow Duration Curve
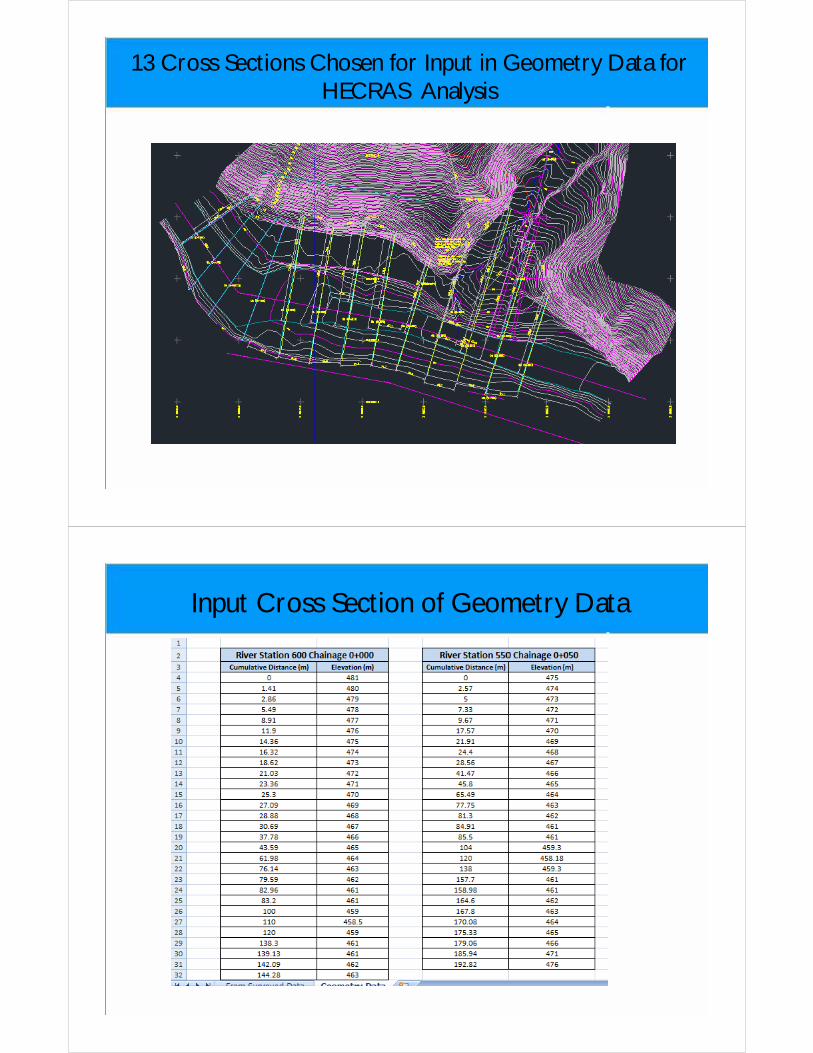
13 Cross Sections Chosen for Input in Geometry Data for HECRAS Analysis
Input Cross Section of Geometry Data
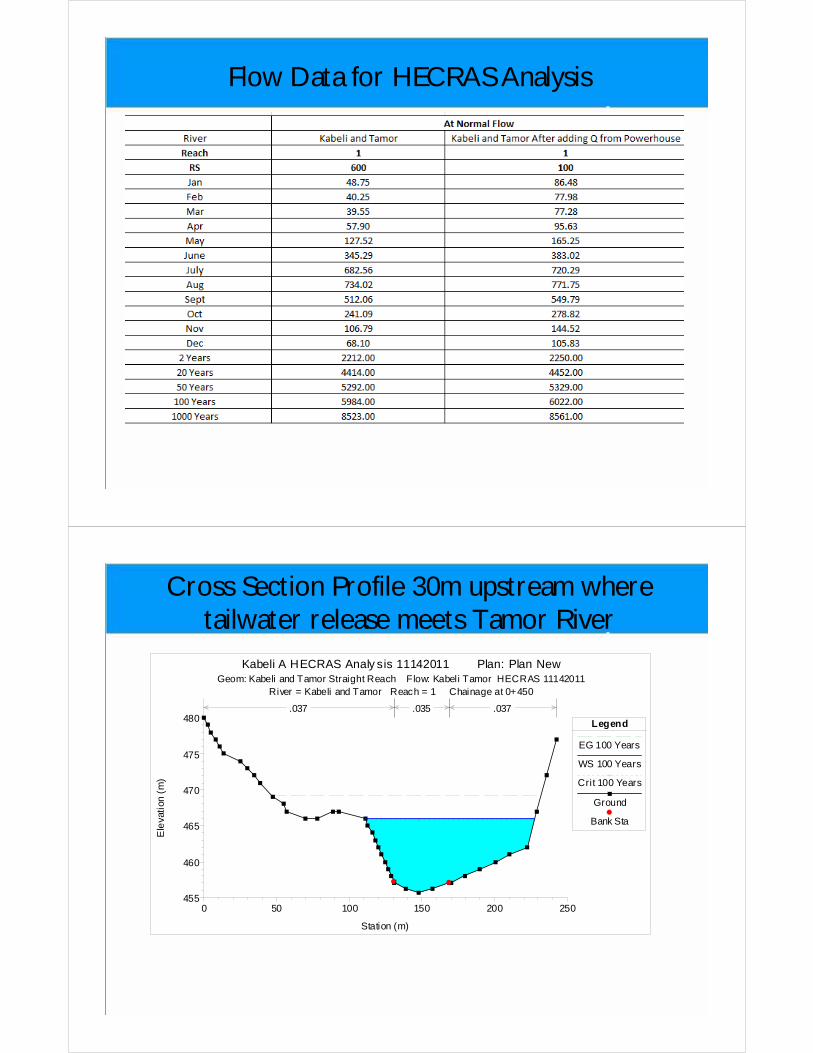
Flow Data for HECRAS Analysis
Cross Section Profile 30m upstream where tailwater release meets Tamor River
0 50 100 150 200 250455
460
465
470
475
480
Kabeli A HECRAS Analy sis 11142011 Plan: Plan NewGeom: Kabeli and Tamor Straight Reach Flow: Kabeli Tamor HECRAS 11142011
River = Kabeli and Tamor Reach = 1 Chainage at 0+450
Station (m)
Ele
vati
on (
m)
Legend
EG 100 Years
WS 100 Years
Crit 100 Years
Ground
Bank Sta
.037 .035 .037
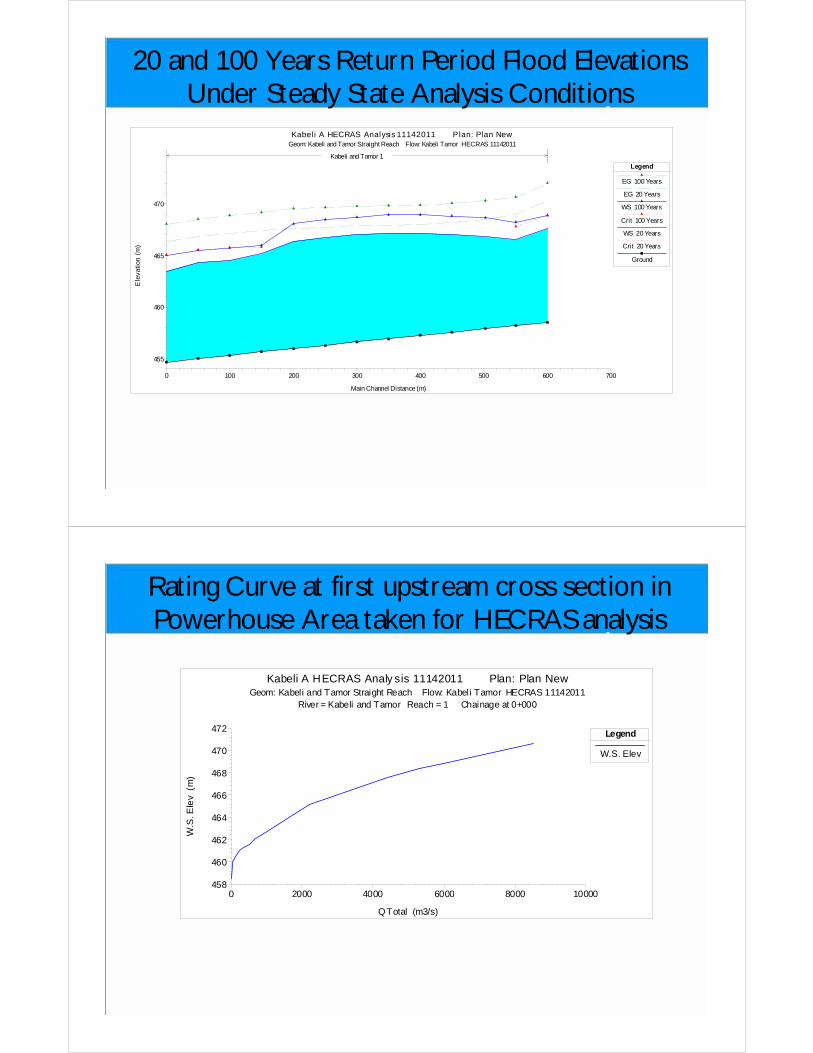
20 and 100 Years Return Period Flood Elevations Under Steady State Analysis Conditions
0 100 200 300 400 500 600 700
455
460
465
470
Kabeli A HECRAS Analysis 11142011 Plan: Plan NewGeom: Kabeli and Tamor Straight Reach Flow: Kabeli Tamor HECRAS 11142011
Main Channel Distance (m)
Ele
vatio
n (
m)
Legend
EG 100 Years
EG 20 Years
WS 100 Years
Crit 100 Years
WS 20 Years
Crit 20 Years
Ground
Kabeli and Tamor 1
Rating Curve at first upstream cross section in Powerhouse Area taken for HECRAS analysis
0 2000 4000 6000 8000 10000458
460
462
464
466
468
470
472
Kabeli A HECRAS Analy sis 11142011 Plan: Plan NewGeom: Kabeli and Tamor Straight Reach Flow: Kabeli Tamor HECRAS 11142011
River = Kabeli and Tamor Reach = 1 Chainage at 0+000
Q Total (m3/s)
W.S
. Ele
v (
m)
Legend
W.S. Elev
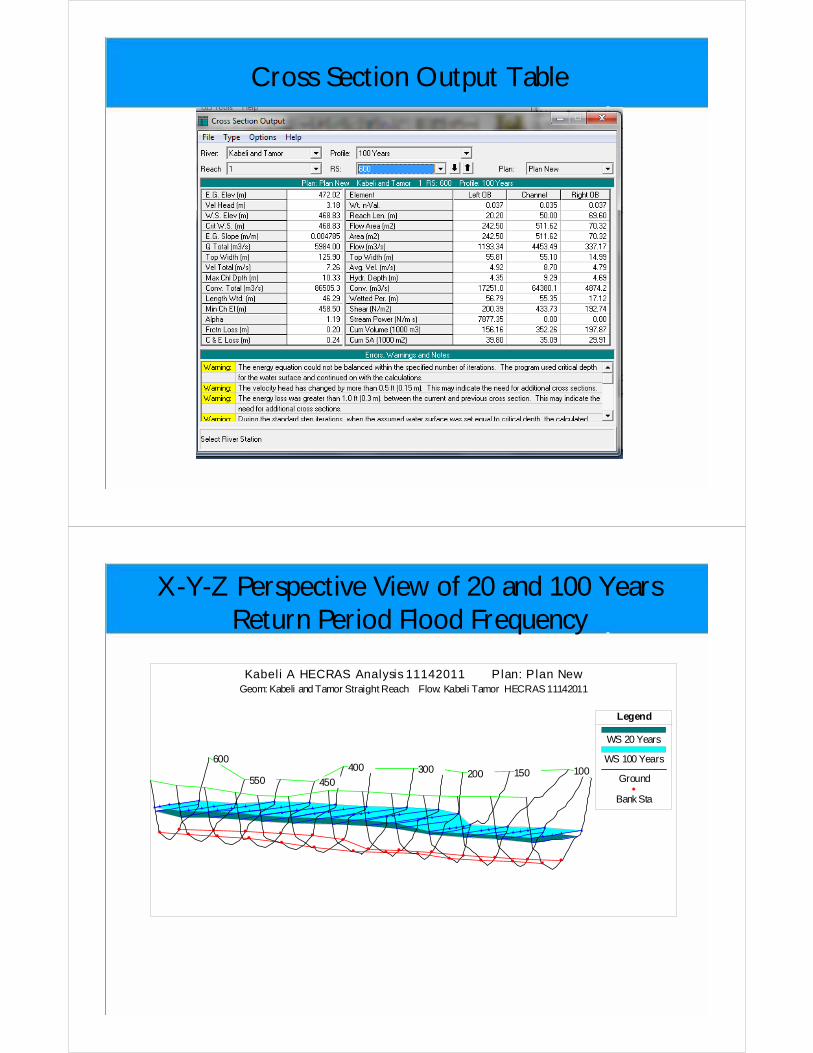
Cross Section Output Table
X-Y-Z Perspective View of 20 and 100 Years Return Period Flood Frequency
600
550 450
400 300 200 150 100
Kabeli A HECRAS Analysis 11142011 Plan: Plan NewGeom: Kabeli and Tamor Straight Reach Flow: Kabeli Tamor HECRAS 11142011
Legend
WS 20 Years
WS 100 Years
Ground
Bank Sta

Tail water Level Optimization: Optimum Tailwater level comes out as 458.5m
0
10000
20000
30000
40000
50000
60000
70000
80000
90000
456.5 457 457.5 458 458.5 459 459.5 460 460.5 461 461.5
Pre
sen
t va
lue
of
Co
st /R
even
ue
1000
NPR
Tailwater Level Elevation, masl
Tailwater Level Optimization
Incremental Revenue
Incremental cost
Sum of Incremental Cumulative Revenue Vs Cost wrtRL 462
ANY QUESTIONS?
THANK YOU