Embed Size (px)
Citation preview

Calculus of the Resources Cumulative Task Using Different Technics and Software
Ilie Margareta “Ovidius” University of Constanta, Faculty of Economic Sciences
Abstract
The present paper main objective is to reveals how one can use two software application tools:
Microsoft Project 2013 and Oracle Primavera P6 Professional for the project planning management, especially for industrial projects and for the calculus and graphical representation of resources cumulative task. The present planning consider four small processes with a total of 38 activities and seven resources. The two software are used for leveling the project’s resources and for giving the necessary information about the evolutions of cumulative tasks and how its values influences the cost of project. In conclusions comparison between the values and graphical representation presented by the two software shows differences of exemplifications, most of them from the graphical point of view.
Key words: cumulative task, planning software J.E.L. classification: M11
1. Introduction
The planning of processes and the phases or tasks or material is at the base of every business in terms of time reduction and, in the end, for the main goal of lowering the costs. The theory of planning have at its basis the schedule and leveling of tasks and resources on criteria like constrains or lacks etc. For this to be managed in programs and software were developed for easier, better planning and for dealing with complex systems and plans.
One of the important part of planning, due to its importance to schedule of the work in time (by minutes, hours, days, weeks etc.) and thus important for calendar and also for calculating the costs, is the resources cumulative task.
The resources cumulative task represent, in simple words, the sum of hours (or different time measurements) for a resources, considered in a constant sequentially manner, in order to evaluate and control the resource allocation in time. The resources cumulative task gives information and data for the calculus of the costs based on the resources allocation.
The relevance of the present work rises from the need to understand how to calculate the resources cumulative task using specific software: Microsoft Project 2013 and Oracle Primavera P6 Professional.
2. Data
The data used are represented by 38 coded tasks with durations between 2 and 7 days, representing 4 items and using 7 resources, also coded.
For easier representation and analysis the tasks were named with letters and were coded as follows: Axy, where: A is the code for the task, x – the number of the item and y – the number of the tasks type A that are used for the item x. Also, the resources were coded as RN, where N – the attributed to the resources. For the data used an example is presented in table 1 where, for paper space reason, only two items are presented. The table shows the task name, the task duration, the start day, the finish day, the resource name, the predecessors of the task and the item that the task
“Ovidius” University Annals, Economic Sciences Series Volume XVII, Issue 2 /2017
407

are belonging to and gives it the code. Table no. 1 Example of tasks for the items P1 and P2.
Nr. Crt.
Task Name Duration Start Finish Resource Names
Predecessors Item
1 A11 5 days Wed 03.01.18 Tue 09.01.18 R1 P1
2 B11 5 days Tue 09.01.18 Mon 15.01.18 R2 1FS-1 day P1
3 B12 7 days Fri 12.01.18 Mon 22.01.18 R2 2FS-2 days P1
4 C11 5 days Fri 19.01.18 Thu 25.01.18 R3 3FS-2 days P1
5 C12 5 days Tue 23.01.18 Mon 29.01.18 R3 4FS-3 days P1
6 D11 6 days Mon 29.01.18 Mon 05.02.18 R4 5FS-1 day P1
7 E11 2 days Mon 05.02.18 Tue 06.02.18 R5 6FS-1 day P1
8 A21 5 days Wed 03.01.18 Tue 09.01.18 R1 P2
9 A22 6 days Fri 05.01.18 Fri 12.01.18 R1 8FS-3 days P2
10 B21 4 days Wed 10.01.18 Mon 15.01.18 R2 9FS-3 days P2
11 B22 4 days Fri 12.01.18 Wed 17.01.18 R2 10FS-2 days P2
12 C21 5 days Tue 16.01.18 Mon 22.01.18 R3 11FS-2 days P2
13 D21 5 days Fri 19.01.18 Thu 25.01.18 R4 12FS-2 days P2
14 D22 5 days Thu 25.01.18 Wed 31.01.18 R4 13FS-1 day P2
15 F21 4 days Wed 31.01.18 Mon 05.02.18 R6 14FS-1 day P2
16 E21 3 days Mon 05.02.18 Wed 07.02.18 R5 15FS-1 day P2 Source: Author’s work. For the type of the organization of production the authors chosen the mixed planning with
finish-to-start lags between the tasks. 3. Calculate the resources cumulative task
The first step of any production planning is introduction of data and the first schedule of that data. In figure 1 and 2 the authors shows how the Microsoft project 2013 schedule the tasks fed to the software.
Figure no. 1. Tasks representation.
Source: Author’s representation using Microsoft project 2013.
“Ovidius” University Annals, Economic Sciences Series Volume XVII, Issue 2 /2017
408

Figure no. 2. Tasks representation. Bigger figure for better view
Source: Author’s representation using Microsoft project 2013. In figure 3 and 4 the authors shows how the Oracle Primavera P6 Professional schedule the
tasks fed to the software Figure no. 3. The first representation of the tasks.
Source: Author’s representation using Oracle Primavera P6 Professional. (See references) Figure no. 4. The first representation of the tasks. Bigger figure for better view
Source: Author’s representation using Oracle Primavera P6 Professional. For the resources cumulative task graphic representation the authors choose the two phases of
the leveling process: the unleveled phase and the leveled phase. In order to reveal the graphic representations of resources cumulative task one can use two at
least three possibilities: 1. Graphics elaborated by the software (see figures 8 and 9); 2. Graphics based on values extracted from the software reports (se figures 5, 6 and 7); 3. Queries for the software of both value and graphics, if the software has the capabilities
(both Microsoft Project 2013 and Oracle Primavera P6 Professional have those capabilities).
The authors choose for this paper the first and second way of graphic representation considering the need to reveal both types of problems.
First the authors extracted the values for the considered project, from the Microsoft project 2013. In figure 5 there is an example of the resource R1 with a total of 208 hours in 8 days, for 6 task, but we must have in mind that in this case the resources are unleveled.
“Ovidius” University Annals, Economic Sciences Series Volume XVII, Issue 2 /2017
409
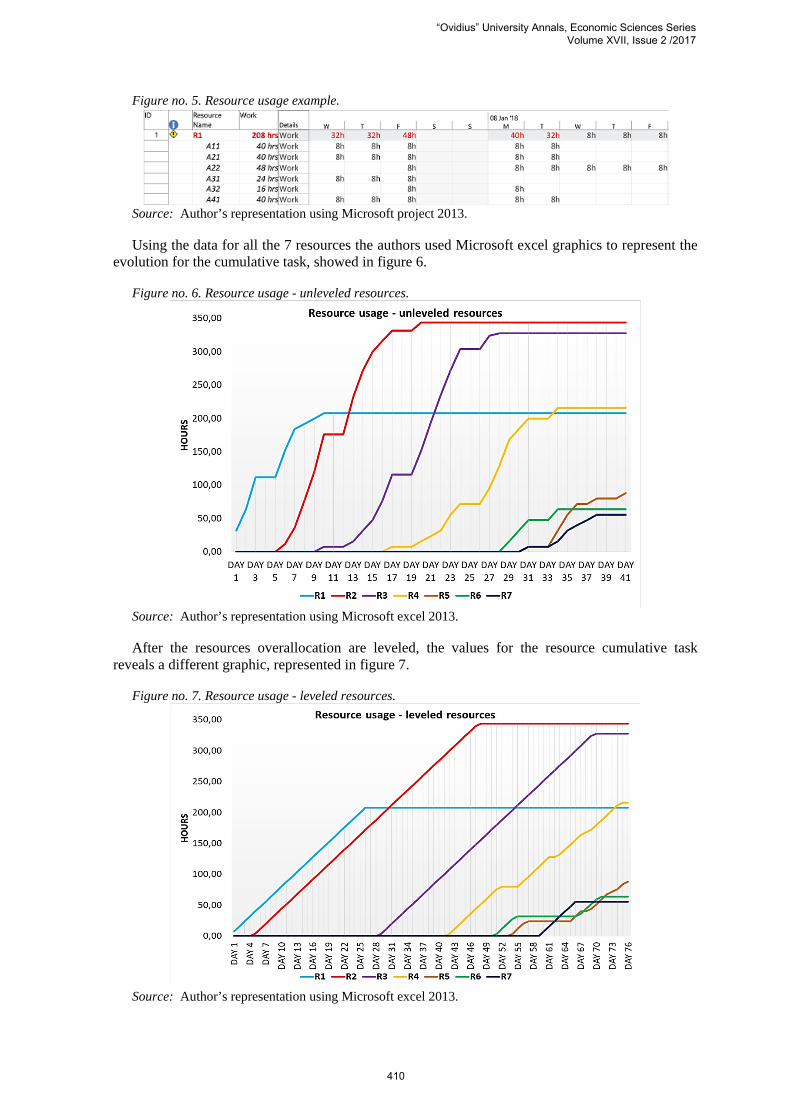
Figure no. 5. Resource usage example.
Source: Author’s representation using Microsoft project 2013. Using the data for all the 7 resources the authors used Microsoft excel graphics to represent the
evolution for the cumulative task, showed in figure 6. Figure no. 6. Resource usage - unleveled resources.
Source: Author’s representation using Microsoft excel 2013. After the resources overallocation are leveled, the values for the resource cumulative task
reveals a different graphic, represented in figure 7. Figure no. 7. Resource usage - leveled resources.
Source: Author’s representation using Microsoft excel 2013.
“Ovidius” University Annals, Economic Sciences Series Volume XVII, Issue 2 /2017
410

The second way to represent the resources cumulative task, that the authors considered, is the automatic graphical representation that the software have built in. The Oracle Primavera has default representation of resources cumulative task evolution (while in Microsoft project 2013 the resources cumulative task evolution must be accessed by the user), represented by a green line in figure 8, showing the case of unleveled overallocated resources.
Figure no. 8. Resource usage - unleveled resources.
Source: Author’s representation using Oracle Primavera P6 Professional. (See references) In figure 9 the Oracle Primavera shows cumulative task evolution in the case of leveled
overallocated resources is showen. Figure no. 9. Resource usage - leveled resources.
Source: Author’s representation using Oracle Primavera P6 Professional.
3. Conclusions
First the authors must emphasize that the leveling process for the used data had the same result as the leveling process was used on both software Microsoft Project 2013 and Oracle Primavera P6 Professional.
The graphical representations of resources cumulative task gives information and data for the calculus of the costs based on the resources allocation in order to calculate hourly or daily use of the resources and so to determine the costs or needs for new more resources for the decrease of the project time.
The two software has the capabilities to show the values and the graphics for the resources cumulative task. The authors choose to use a combination of values
“Ovidius” University Annals, Economic Sciences Series Volume XVII, Issue 2 /2017
411

4. References
• https://docs.oracle.com/cd/E68202_01/client_help//en_US/helpmain.htm?toc.htm?resources_window.htm (for figure no. 3);
• https://docs.oracle.com/cd/E68202_01/client_help//en_US/helpmain.htm?toc.htm?activities_window.htm (for figures no. 8 and 9);
• https://support.office.com/en-us/article/level-resource-assignments-49fb52d5-ff4a-4b1f-b5c1-af057ab38ba2 (for figure no.5);
“Ovidius” University Annals, Economic Sciences Series Volume XVII, Issue 2 /2017
412