Embed Size (px)
Citation preview

Caledonian Road Development
Prepared for: London Square
Prepared by: Andrew Smith
April 2018
©2018 Insight Advantage Ltd. Page 2 www.insight-advantage.co.uk
Contents
6 areas of London are covered in this report, in alphabetical order;
• Caledonian Road (N7)
• Crouch End (N8)
• Highbury (N5)
• Kings Cross (N1)
• Shoreditch (EC2A)
• Tufnell Park (N19)
Section Page
Number(s)
Summary 3
Infographic – Local Property Price Trends 4
Average Sales Asking Prices: All Property Types 5 - 6
Average Sales Asking Prices: Flats 6 - 7
Average Sales Asking Prices: 1 bed properties 8 - 9
Average Sales Asking Prices: 2 bed properties 9 - 10
Average Sold / Achieved Prices: All Property Types 11 -12
Average Sold / Achieved Prices: Flats 12 - 13
Snapshot of the Current Rental Market 14 -15
About the Data 15
©2018 Insight Advantage Ltd. Page 3 www.insight-advantage.co.uk
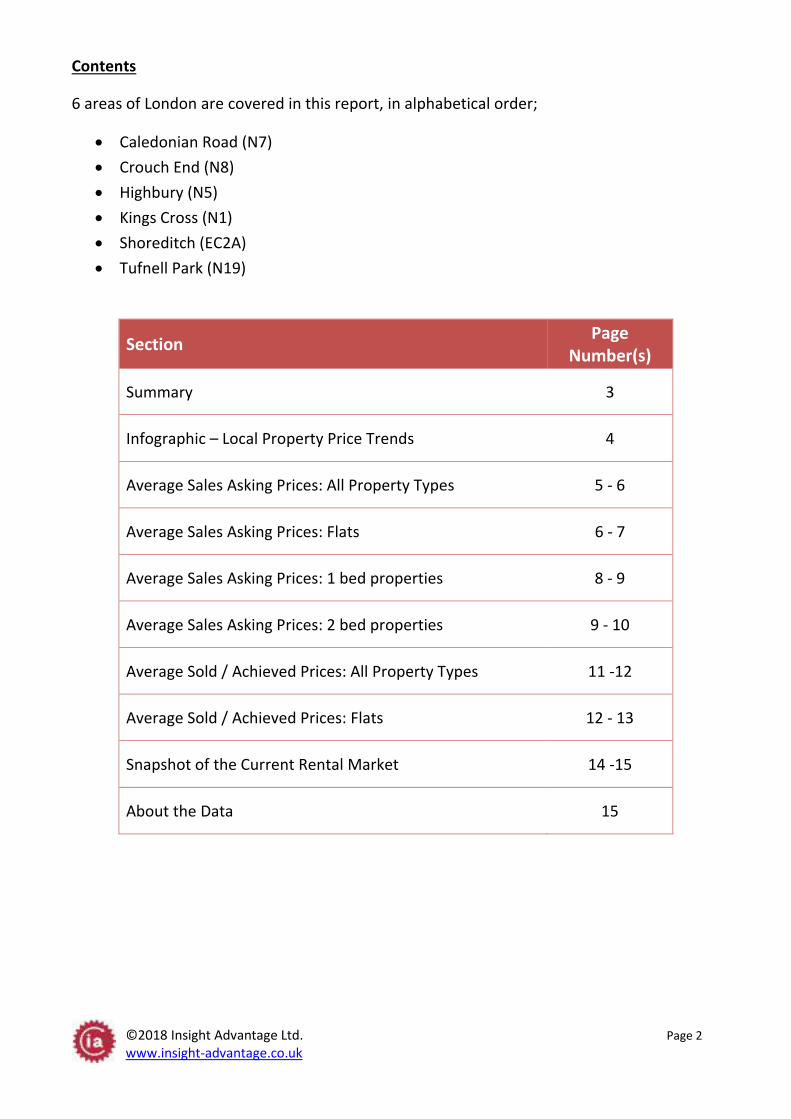
Summary
• The London Square Caledonian Road
neighbourhood is an ideal location between sought
after Islington and the vibrant regeneration area
around King’s Cross
• Excellent connections to Central London (just 3
miles from the West End) and surrounding counties
• London Square Caledonian Road gives residents the
choice of London Underground from Caledonian
Road station and Overground from Caledonian
Road and Barnsbury. Both stations are within 6 minutes’ walk.
• International links are very good too with the Piccadilly Line running direct to Heathrow Airport
and it’s also just one station from Caledonian Road to King’s Cross St Pancras International,
London’s Eurostar terminal
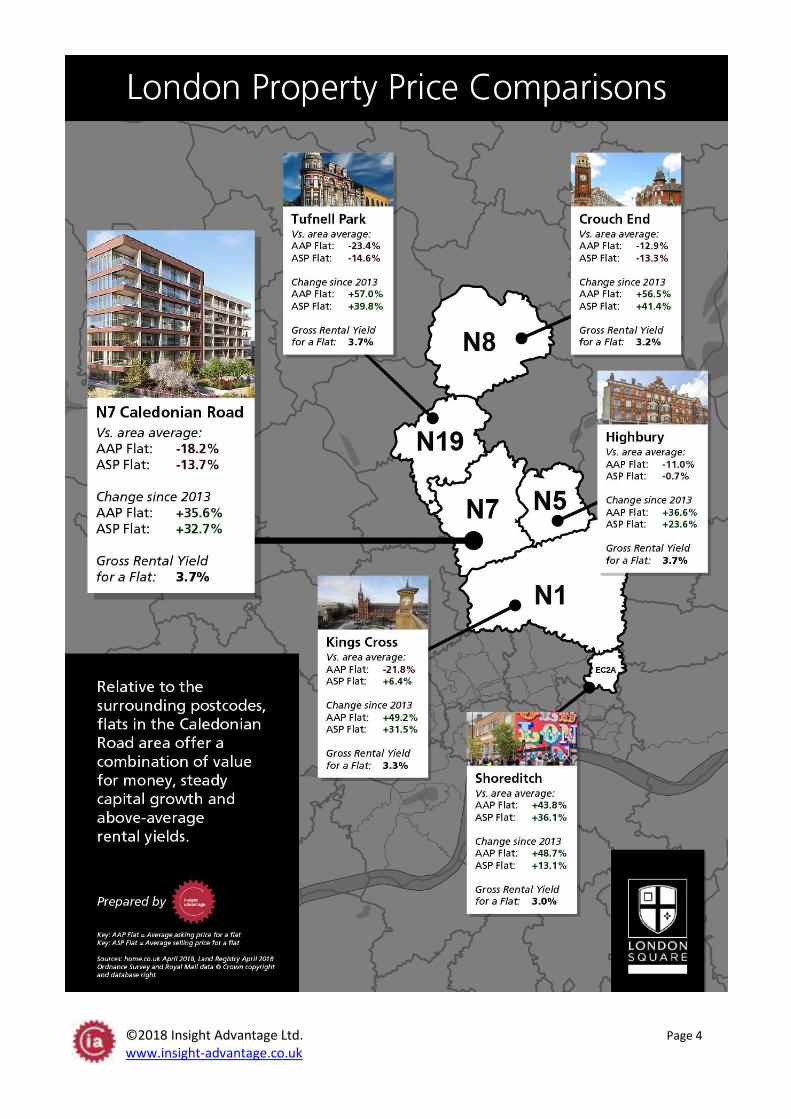
• For those looking to buy, the Caledonian Road area currently offers value for money and steady
capital growth, relative to the surrounding areas
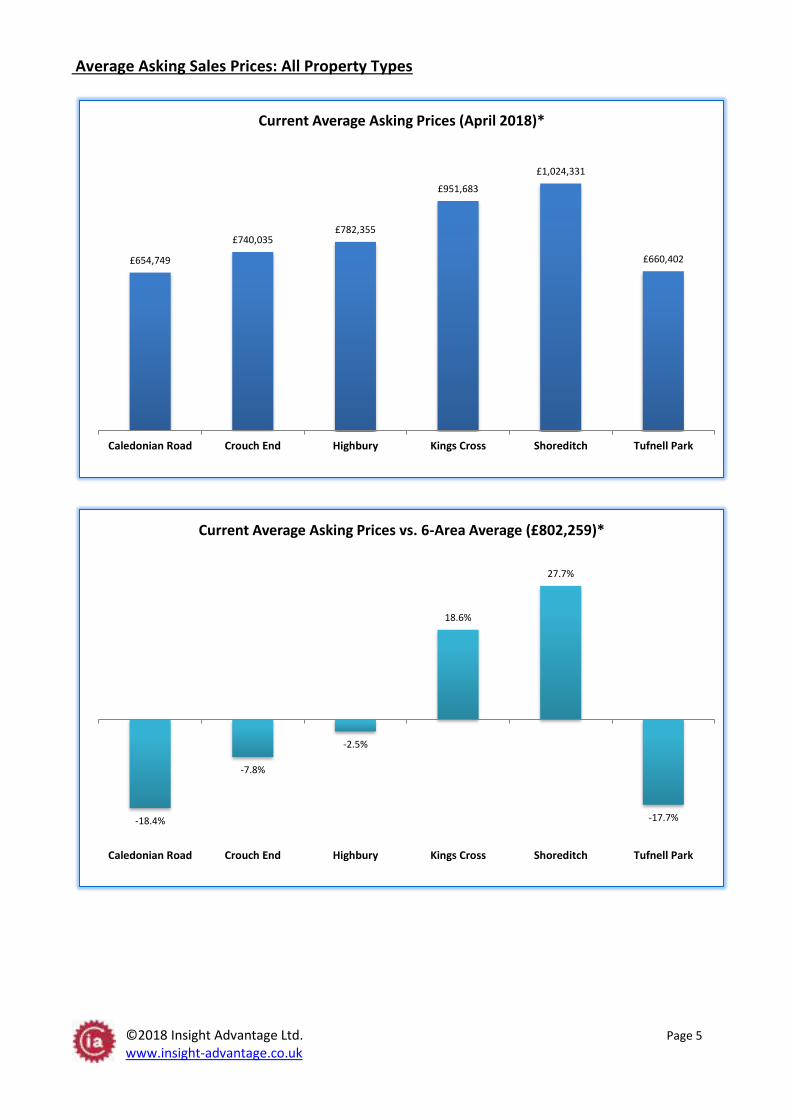
• Current average asking prices of £654,749 (all property) are 18.4% below the average for all the
6 areas. This is trend is consistent across the relevant property types for this development
o Average asking prices for flats is 18.2% below the average
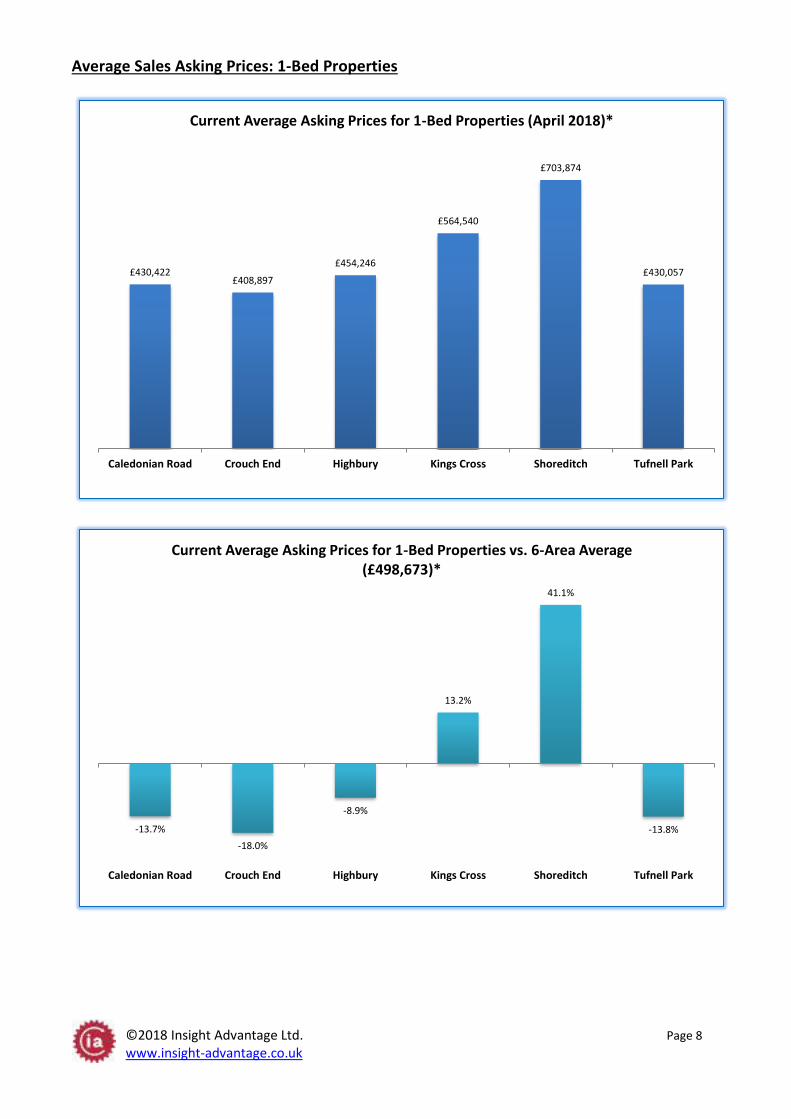
o Average asking prices for 1-bed properties is 13.7% below the average
o Average asking prices for 2-bed properties is 13.2% below the average
• Although many areas of London are experiencing a period of deflation, asking prices for flats in
the Caledonian Road area have fallen by only 1.3% in the last 12 months
o This is compared to a fall of 1.4% in average asking prices across all 6 areas
• However, actual achieved prices indicate that the Caledonian Road area is outperforming the 6-
area average
o Sold / achieved prices for all properties in the Caledonian Road area are currently 15.0%
below the 6-area average but have risen by 23.2% in the last 12 months, compared to
the 6-area average of just +5.4%
o Sold / achieved prices for flats in the Caledonian Road area are currently 13.7% below
the 6-area average but have risen by 1.9% in the last 12 months, compared to the 6-area
average of just +1.4%
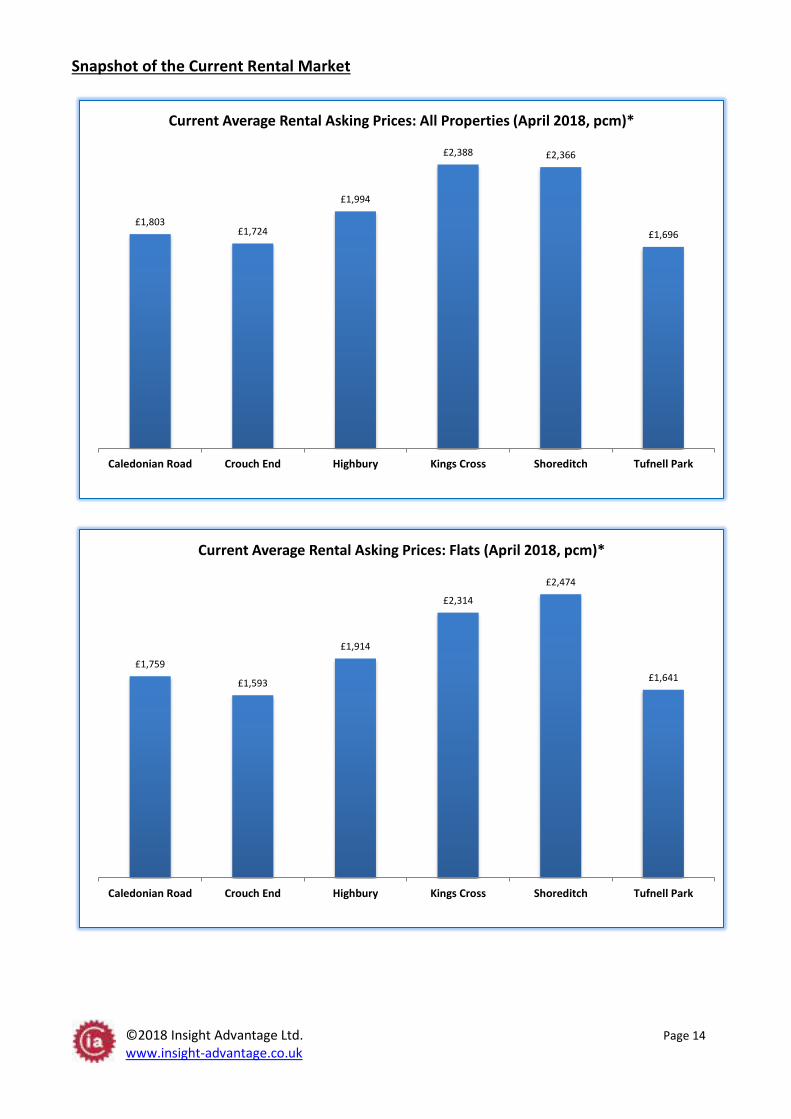
• Caledonian Road area also offers a buoyant rental market with average monthly asking rents
for flats in excess of £1,900 and above average gross rental yields
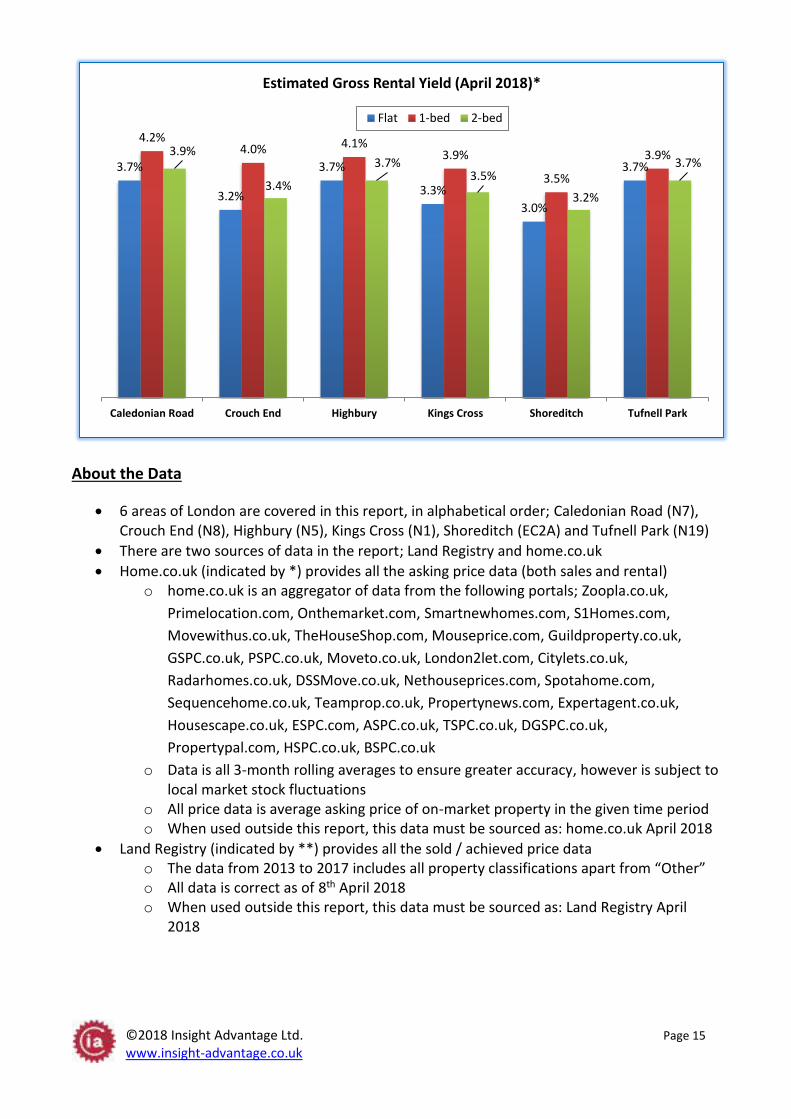
o The estimated gross rental yield for flats in Caledonian Road area is around 3.7% (+8.8%
on the 6-area average
o 1-bed properties are yielding 4.2% (+7.7%)
o 2-bed properties are yielding 3.9% (+8.3%)
©2018 Insight Advantage Ltd. Page 4 www.insight-advantage.co.uk
©2018 Insight Advantage Ltd. Page 5 www.insight-advantage.co.uk
Average Asking Sales Prices: All Property Types
£654,749
£740,035 £782,355
£951,683
£1,024,331
£660,402
Caledonian Road Crouch End Highbury Kings Cross Shoreditch Tufnell Park
Current Average Asking Prices (April 2018)*
-18.4%
-7.8%
-2.5%
18.6%
27.7%
-17.7%
Caledonian Road Crouch End Highbury Kings Cross Shoreditch Tufnell Park
Current Average Asking Prices vs. 6-Area Average (£802,259)*
©2018 Insight Advantage Ltd. Page 6 www.insight-advantage.co.uk
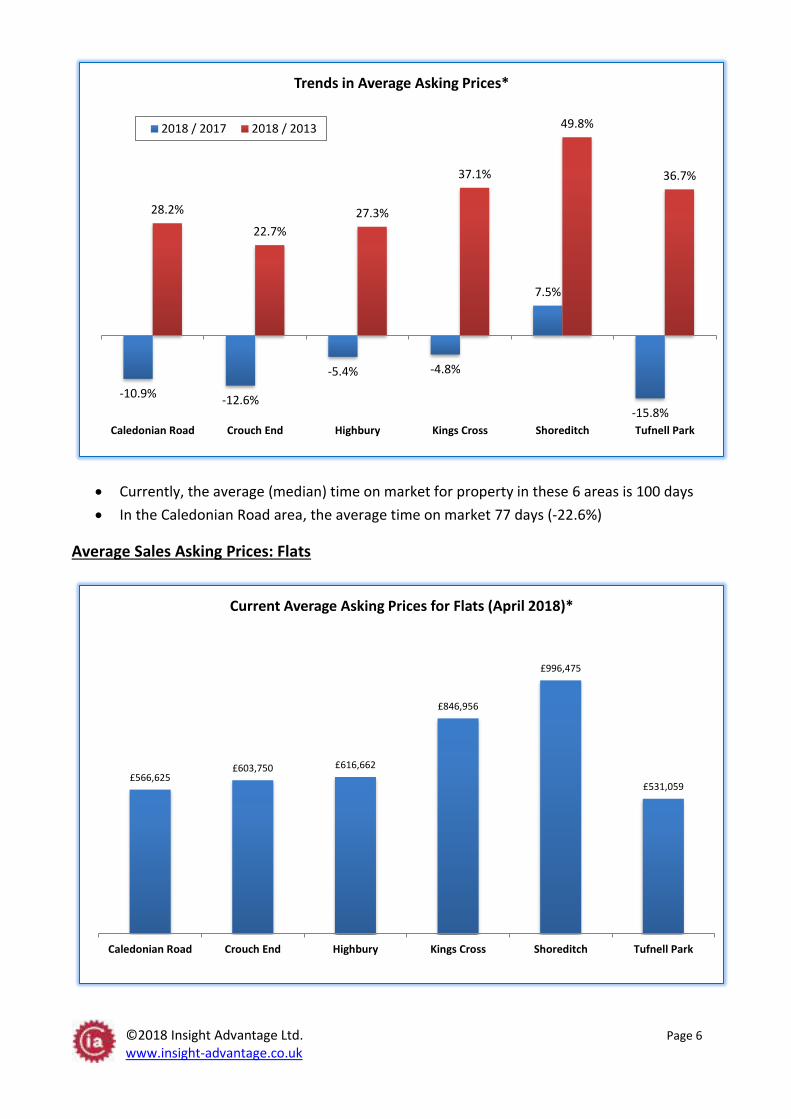
• Currently, the average (median) time on market for property in these 6 areas is 100 days
• In the Caledonian Road area, the average time on market 77 days (-22.6%)
Average Sales Asking Prices: Flats
-10.9%-12.6%
-5.4% -4.8%
7.5%
-15.8%
28.2%
22.7%
27.3%
37.1%
49.8%
36.7%
Caledonian Road Crouch End Highbury Kings Cross Shoreditch Tufnell Park
Trends in Average Asking Prices*
2018 / 2017 2018 / 2013
£566,625 £603,750 £616,662
£846,956
£996,475
£531,059
Caledonian Road Crouch End Highbury Kings Cross Shoreditch Tufnell Park
Current Average Asking Prices for Flats (April 2018)*

©2018 Insight Advantage Ltd. Page 7 www.insight-advantage.co.uk
-18.2%
-12.9%-11.0%
21.8%
43.8%
-23.4%
Caledonian Road Crouch End Highbury Kings Cross Shoreditch Tufnell Park
Current Average Asking Prices for Flats vs. 6-Area Average (£693,086)*
-1.3%
-6.9%
-1.8%
3.4%
8.2%
-7.6%
35.6%
56.5%
36.6%
49.1% 48.7%
57.0%
Caledonian Road Crouch End Highbury Kings Cross Shoreditch Tufnell Park
Trends in Asking Prices for Flats*
2018 / 2017 2018 / 2013
©2018 Insight Advantage Ltd. Page 8 www.insight-advantage.co.uk
Average Sales Asking Prices: 1-Bed Properties
£430,422 £408,897
£454,246
£564,540
£703,874
£430,057
Caledonian Road Crouch End Highbury Kings Cross Shoreditch Tufnell Park
Current Average Asking Prices for 1-Bed Properties (April 2018)*
-13.7%
-18.0%
-8.9%
13.2%
41.1%
-13.8%
Caledonian Road Crouch End Highbury Kings Cross Shoreditch Tufnell Park
Current Average Asking Prices for 1-Bed Properties vs. 6-Area Average (£498,673)*
©2018 Insight Advantage Ltd. Page 9 www.insight-advantage.co.uk
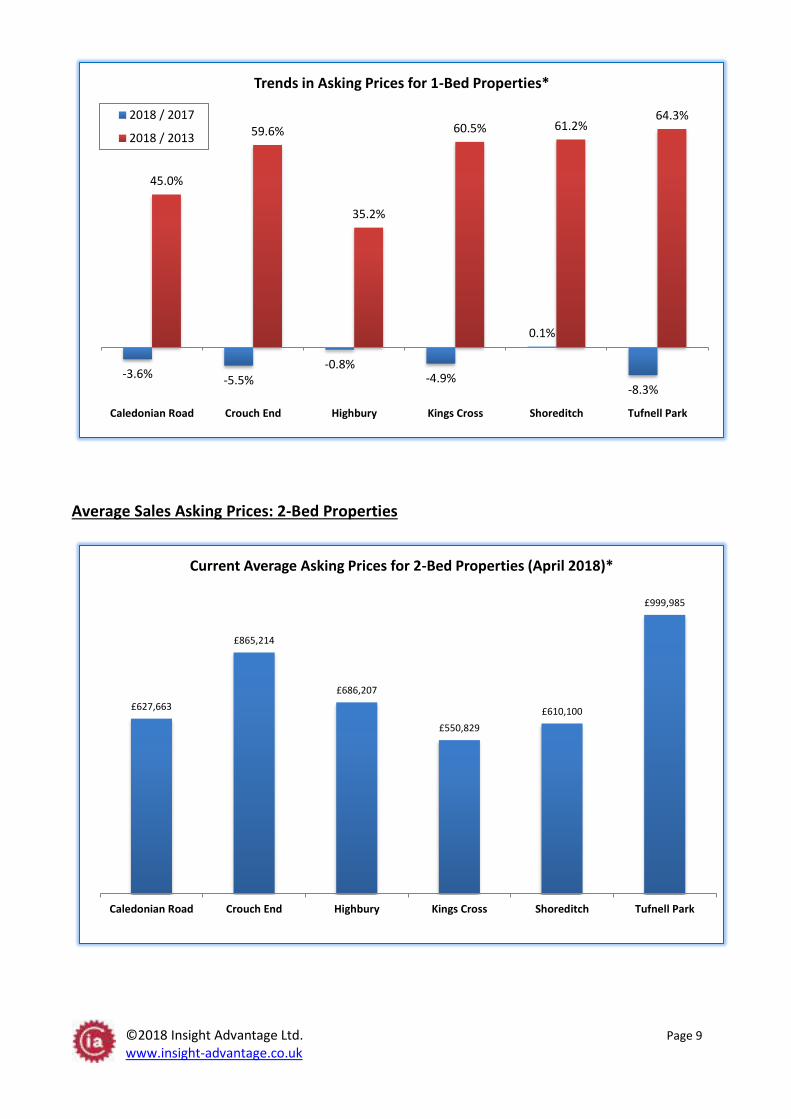
Average Sales Asking Prices: 2-Bed Properties
-3.6% -5.5%-0.8%
-4.9%
0.1%
-8.3%
45.0%
59.6%
35.2%
60.5% 61.2%64.3%
Caledonian Road Crouch End Highbury Kings Cross Shoreditch Tufnell Park
Trends in Asking Prices for 1-Bed Properties*
2018 / 2017
2018 / 2013
£627,663
£865,214
£686,207
£550,829
£610,100
£999,985
Caledonian Road Crouch End Highbury Kings Cross Shoreditch Tufnell Park
Current Average Asking Prices for 2-Bed Properties (April 2018)*
©2018 Insight Advantage Ltd. Page 10 www.insight-advantage.co.uk
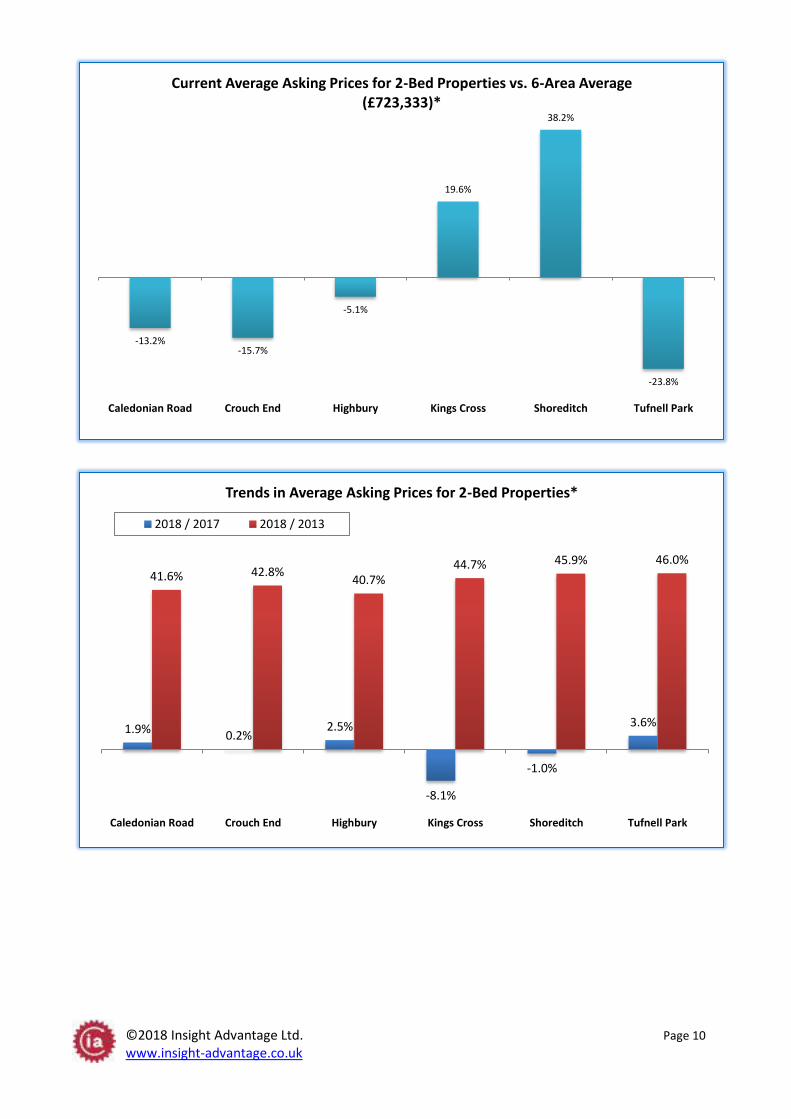
-13.2%-15.7%
-5.1%
19.6%
38.2%
-23.8%
Caledonian Road Crouch End Highbury Kings Cross Shoreditch Tufnell Park
Current Average Asking Prices for 2-Bed Properties vs. 6-Area Average (£723,333)*
1.9% 0.2%2.5%
-8.1%
-1.0%
3.6%
41.6% 42.8%40.7%
44.7% 45.9% 46.0%
Caledonian Road Crouch End Highbury Kings Cross Shoreditch Tufnell Park
Trends in Average Asking Prices for 2-Bed Properties*
2018 / 2017 2018 / 2013

©2018 Insight Advantage Ltd. Page 11 www.insight-advantage.co.uk
Average Sold / Achieved Prices: All Property Types
£742,001 £696,684
£837,628
£998,050
£1,178,506
£786,720
Caledonian Road Crouch End Highbury Kings Cross Shoreditch Tufnell Park
Average Sold / Achieved Prices for All Properties (2017)**
-15.0%
-20.2%
-4.1%
14.3%
35.0%
-9.9%
Caledonian Road Crouch End Highbury Kings Cross Shoreditch Tufnell Park
Average Sold / Achieved Prices for All Properties vs. 6-Area Average (£873,265)**
©2018 Insight Advantage Ltd. Page 12 www.insight-advantage.co.uk
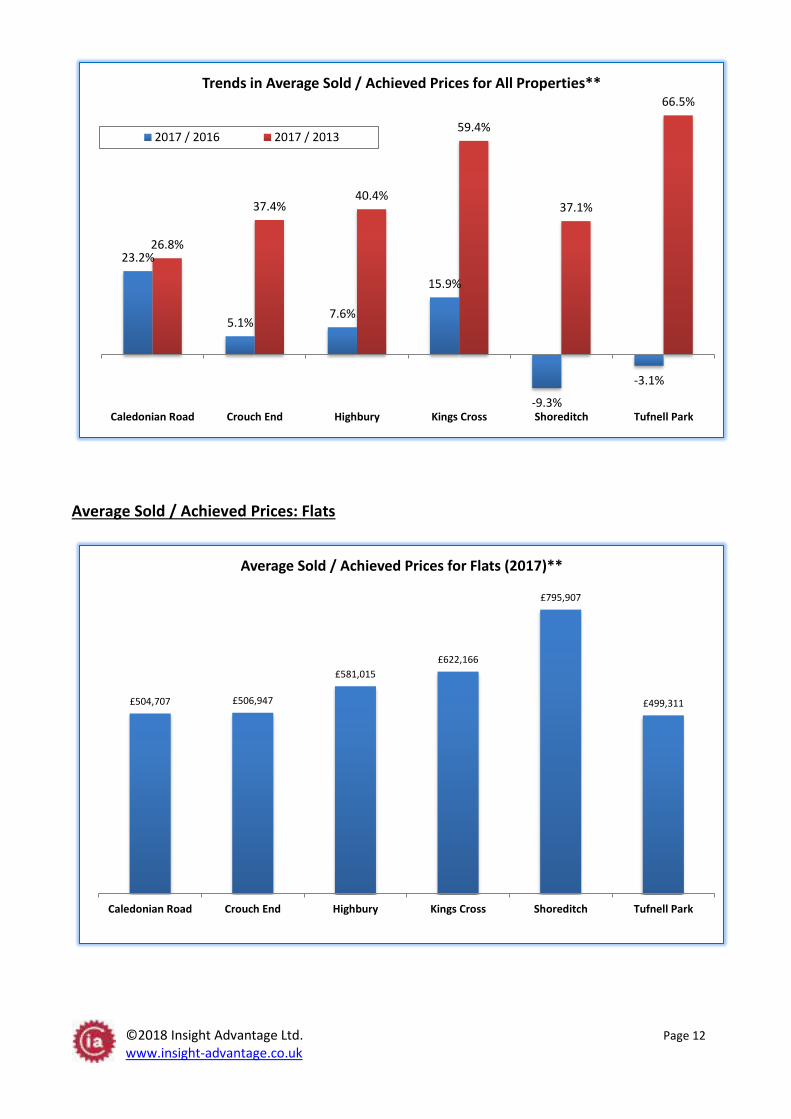
Average Sold / Achieved Prices: Flats
23.2%
5.1%7.6%
15.9%
-9.3%
-3.1%
26.8%
37.4%40.4%
59.4%
37.1%
66.5%
Caledonian Road Crouch End Highbury Kings Cross Shoreditch Tufnell Park
Trends in Average Sold / Achieved Prices for All Properties**
2017 / 2016 2017 / 2013
£504,707 £506,947
£581,015
£622,166
£795,907
£499,311
Caledonian Road Crouch End Highbury Kings Cross Shoreditch Tufnell Park
Average Sold / Achieved Prices for Flats (2017)**
©2018 Insight Advantage Ltd. Page 13 www.insight-advantage.co.uk
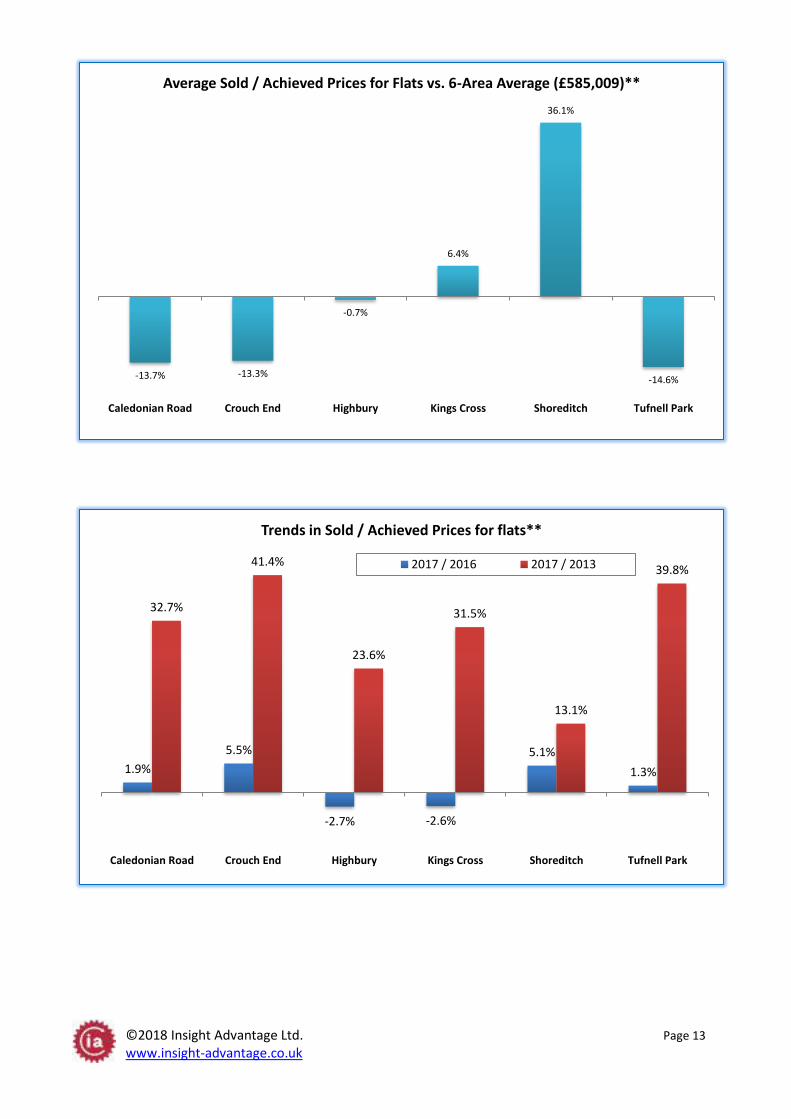
-13.7% -13.3%
-0.7%
6.4%
36.1%
-14.6%
Caledonian Road Crouch End Highbury Kings Cross Shoreditch Tufnell Park
Average Sold / Achieved Prices for Flats vs. 6-Area Average (£585,009)**
1.9%
5.5%
-2.7% -2.6%
5.1%
1.3%
32.7%
41.4%
23.6%
31.5%
13.1%
39.8%
Caledonian Road Crouch End Highbury Kings Cross Shoreditch Tufnell Park
Trends in Sold / Achieved Prices for flats**
2017 / 2016 2017 / 2013
©2018 Insight Advantage Ltd. Page 14 www.insight-advantage.co.uk
Snapshot of the Current Rental Market
£1,803 £1,724
£1,994
£2,388 £2,366
£1,696
Caledonian Road Crouch End Highbury Kings Cross Shoreditch Tufnell Park
Current Average Rental Asking Prices: All Properties (April 2018, pcm)*
£1,759
£1,593
£1,914
£2,314
£2,474
£1,641
Caledonian Road Crouch End Highbury Kings Cross Shoreditch Tufnell Park
Current Average Rental Asking Prices: Flats (April 2018, pcm)*
©2018 Insight Advantage Ltd. Page 15 www.insight-advantage.co.uk
About the Data
• 6 areas of London are covered in this report, in alphabetical order; Caledonian Road (N7), Crouch End (N8), Highbury (N5), Kings Cross (N1), Shoreditch (EC2A) and Tufnell Park (N19)
• There are two sources of data in the report; Land Registry and home.co.uk
• Home.co.uk (indicated by *) provides all the asking price data (both sales and rental) o home.co.uk is an aggregator of data from the following portals; Zoopla.co.uk,
Primelocation.com, Onthemarket.com, Smartnewhomes.com, S1Homes.com,
Movewithus.co.uk, TheHouseShop.com, Mouseprice.com, Guildproperty.co.uk,
GSPC.co.uk, PSPC.co.uk, Moveto.co.uk, London2let.com, Citylets.co.uk,
Radarhomes.co.uk, DSSMove.co.uk, Nethouseprices.com, Spotahome.com,
Sequencehome.co.uk, Teamprop.co.uk, Propertynews.com, Expertagent.co.uk,
Housescape.co.uk, ESPC.com, ASPC.co.uk, TSPC.co.uk, DGSPC.co.uk,
Propertypal.com, HSPC.co.uk, BSPC.co.uk
o Data is all 3-month rolling averages to ensure greater accuracy, however is subject to local market stock fluctuations
o All price data is average asking price of on-market property in the given time period o When used outside this report, this data must be sourced as: home.co.uk April 2018
• Land Registry (indicated by **) provides all the sold / achieved price data o The data from 2013 to 2017 includes all property classifications apart from “Other” o All data is correct as of 8th April 2018 o When used outside this report, this data must be sourced as: Land Registry April
2018
3.7%
3.2%
3.7%
3.3%
3.0%
3.7%
4.2%4.0% 4.1%
3.9%
3.5%
3.9%3.9%
3.4%
3.7%3.5%
3.2%
3.7%
Caledonian Road Crouch End Highbury Kings Cross Shoreditch Tufnell Park
Estimated Gross Rental Yield (April 2018)*
Flat 1-bed 2-bed

©2018 Insight Advantage Ltd. Page 16 www.insight-advantage.co.uk
Andrew Smith
+44 (0)7739 448890
www.insight-advantage.co.uk