Embed Size (px)
Citation preview

CALIBRATION EXPERIMENTS OF X-BAND HIGH PERFORMANCE AIRBORNE SAR SYSTEM (Pi-SAR2)
Takeshi Matsuoka*, Toshihiko Umehara, Akitsugu Nadai, Tatsuharu Kobayashi ,
Makoto Satake , Jyunpei Uemoto and Seiho Uratsuka
Radiowave Remote Sensing Group, Applied Electromagnetic Research Center
National Institute of Information and Communications Technology (NICT) 4-2-1, Nukui-kitamachi, Koganei, Tokyo, Japan -
(mattake, umehara, nandai, tkoba, satake, juemoto, pata)@nict.go.jp
KEY WORDS: airborne SAR, X-band, high resolution, polarimetry, interferometry ABSTRACT: NICT (National Institute of Information and Communications Technology, Japan) has developed an X-band high performance
airborne SAR system (Pi-SAR2) since 2006, as a successor to the Pi-SAR (X-band). Pi-SAR2 system is installed to the Gulfstream II business jet. Pi-SAR2 has polarimetric and interferometric functions with high spatial resolution of 0.3-0.6 m in along track (azimuth) direction and 0.3-0.5 m in cross track (slant-range) direction. In this paper we report the ground based calibration experiments using corner reflectors (CR) in conjunction with the Pi-SAR2 test flights. The calibration experiments were carried out at the runway of the Taiki aerospace experiment field in Hokkaido, Japan in December 1-2, 2008 and February 2, 2010. We also report the backscattering characteristics of snow cover on the runway of the X-band high-resolution SAR image.
1. INTRODUCTION NICT (National Institute of Information and Communications Technology, Japan) has developed a high performance airborne SAR system (Pi-SAR2) since 2006, as a successor to the Pi-SAR (X-band). Pi-SAR2 system is installed to the Gulfstream II business jet. Two antenna radomes are mounted under the base of both wings (Figure 1).
Figure 1. Pi-SAR2 installed to the Gulfstream II Table 1 shows the observation mode and the specifications of Pi-SAR2. Pi-SAR2 has polarimetric and interferometric functions with high spatial resolution of 0.3-0.6 m in along track (azimuth) direction and 0.3-0.5 m in cross track (slant-range) direction at X-band. High resolution in range direction is achieved by wide transmission bandwidth of 500 MHz (mode1). For optional experimental observation mode (mode0), sliding-spotlight beam steering of mechanical antenna movement in azimuth direction permits the high resolution in azimuth direction of 0.3 m with 2-looks. Noise equivalent backscattering coefficient (NEσ0) will be kept under -27 dB in slant-range distance of 5-10km between incidence angles from
20 to 60 degree at the platform altitude of 12000 m (Nadai et al., 2009). *In all modes, Pi-SAR2 acquires full polarimetric (HH/VV/HV/VH) and interferometric (VVs/HVs) data. *Values are estimated with the airplane altitude of 12000 m and the ground speed of 220 m/s
Table 1. Observation mode of Pi-SAR2 In this paper we report the ground based calibration experiment using corner reflectors (CR) in conjunction with the Pi-SAR2 test flight. We also report the backscattering characteristics of snow cover on the runway of the X-band high-resolution SAR image.
2. CALIBRATION EXPERIMENTS 2.1 Calibration site The calibration experiments were carried out at the runway of the Taiki aerospace experiment field in Hokkaido, Japan (Figure 2) in December 1-2, 2008 and February 2, 2010. We used 20 CRs (different shape and radar cross section) for radiometric and polarimetric calibrations. Figure 3 shows the arrangement of CRs on the runway (red circles show the reflectors used for SAR flight direction of 73deg). Pictures of CRs are shown in Figure 4.
3 ~7 km---Azimuth length
4 ~9 km> 10 km7~10 km5~10 kmSwath width
< -25 dB< -30 dB< -27 dB< -23 dBNEσ0
0.5~0.3 m (2looks)0.6 m (2looks)0.6 m (2looks)0.3 m (1look)Azimuth resolution
0.3 m1.0 m0.5 m0.3 mSlant range resolution
Sliding spotlightStrip mapStrip mapStrip mapmethod
500 MHz150 MHz300 MHz500 MHzBandwidth
Mode 0 (optional)Mode3Mode 2Mode 1Observation mode
International Archives of the Photogrammetry, Remote Sensing and Spatial Information Science, Volume XXXVIII, Part 8, Kyoto Japan 2010
138
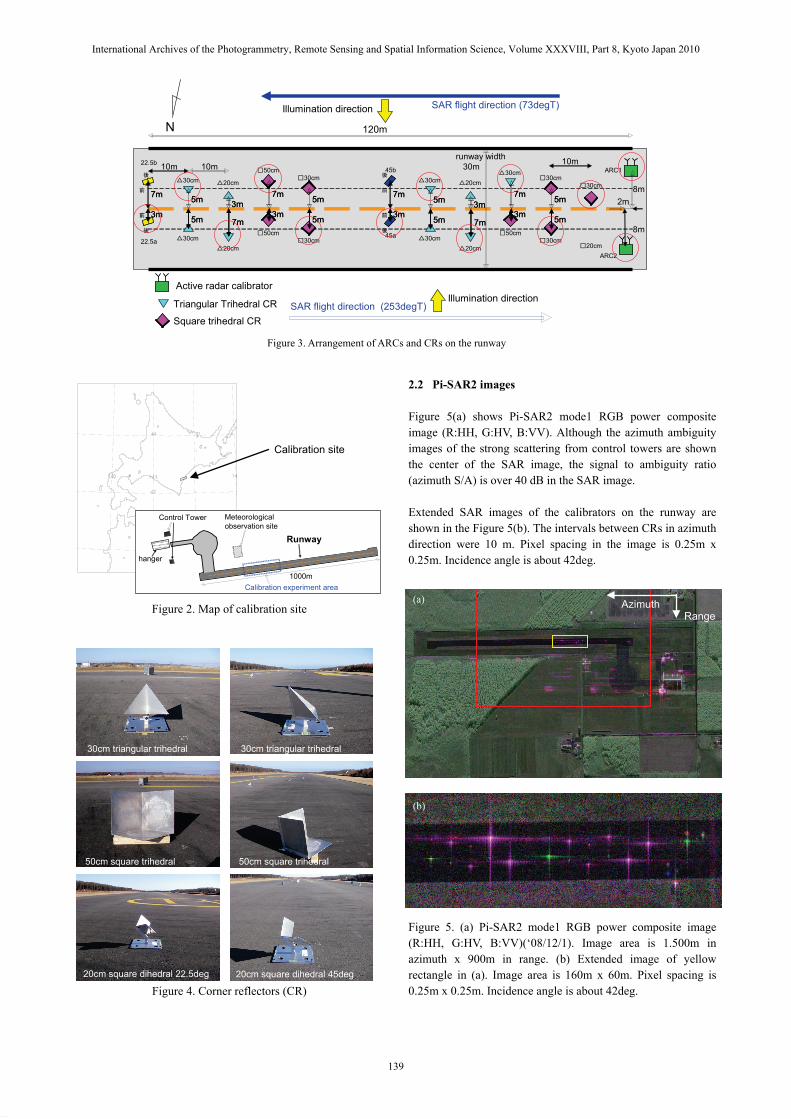
Figure 2. Map of calibration site
Figure 4. Corner reflectors (CR)
2.2 Pi-SAR2 images Figure 5(a) shows Pi-SAR2 mode1 RGB power composite image (R:HH, G:HV, B:VV). Although the azimuth ambiguity images of the strong scattering from control towers are shown the center of the SAR image, the signal to ambiguity ratio (azimuth S/A) is over 40 dB in the SAR image. Extended SAR images of the calibrators on the runway are shown in the Figure 5(b). The intervals between CRs in azimuth direction were 10 m. Pixel spacing in the image is 0.25m x 0.25m. Incidence angle is about 42deg. Figure 5. (a) Pi-SAR2 mode1 RGB power composite image (R:HH, G:HV, B:VV)(‘08/12/1). Image area is 1.500m in azimuth x 900m in range. (b) Extended image of yellow rectangle in (a). Image area is 160m x 60m. Pixel spacing is 0.25m x 0.25m. Incidence angle is about 42deg.
Figure 3. Arrangement of ARCs and CRs on the runway
Calibration site
10mrunway width30m
N
5m
5m
5m
5m
7m
3m
7m
3m
120m
Triangular Trihedral CR
Square trihedral CR
Active radar calibrator
8m
8m2m
SAR flight direction (73degT)
SAR flight direction (253degT)
Illumination direction
10m 10m
3m
7m
3m
7m
5m
5m
5m
5m
5m
5m
5m
5m
7m
3m
7m
3m
5m
5m
5m
5m
3m
7m
3m
7m前
後
前
後
22.5a
22.5b
△30cm
△30cm△20cm
△20cm
□50cm
□50cm
□30cm
□30cm
3m
7m
3m
7m
45b
45a
△30cm
△30cm△20cm
△20cm
□50cm
□30cm
□30cm
□30cm
□20cm
△30cm
3m
7m
3m
7m前
後
前
後
ARC1
ARC2
Illumination direction
Control Tower
hanger
Meteorological observation site
Runway
1000mCalibration experiment area
30cm triangular trihedral 30cm triangular trihedral
50cm square trihedral 50cm square trihedral
20cm square dihedral 22.5deg 20cm square dihedral 45deg
(a)
(b)
Azimuth Range
International Archives of the Photogrammetry, Remote Sensing and Spatial Information Science, Volume XXXVIII, Part 8, Kyoto Japan 2010
139
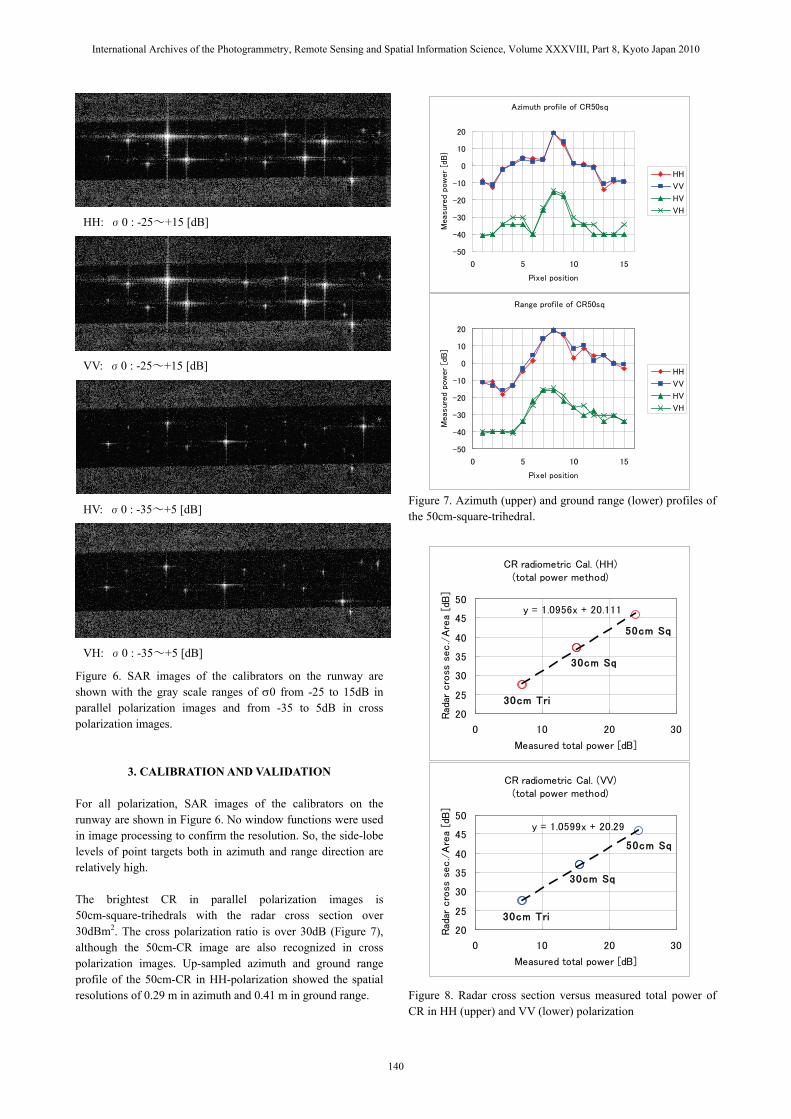
Figure 6. SAR images of the calibrators on the runway are shown with the gray scale ranges of σ0 from -25 to 15dB in parallel polarization images and from -35 to 5dB in cross polarization images.
3. CALIBRATION AND VALIDATION For all polarization, SAR images of the calibrators on the runway are shown in Figure 6. No window functions were used in image processing to confirm the resolution. So, the side-lobe levels of point targets both in azimuth and range direction are relatively high. The brightest CR in parallel polarization images is 50cm-square-trihedrals with the radar cross section over 30dBm2. The cross polarization ratio is over 30dB (Figure 7), although the 50cm-CR image are also recognized in cross polarization images. Up-sampled azimuth and ground range profile of the 50cm-CR in HH-polarization showed the spatial resolutions of 0.29 m in azimuth and 0.41 m in ground range.
Figure 7. Azimuth (upper) and ground range (lower) profiles of the 50cm-square-trihedral. Figure 8. Radar cross section versus measured total power of CR in HH (upper) and VV (lower) polarization
HH: σ0 : -25~+15 [dB]
VV: σ0 : -25~+15 [dB]
HV: σ0 : -35~+5 [dB]
VH: σ0 : -35~+5 [dB]
Azimuth profile of CR50sq
-50
-40
-30
-20
-10
0
10
20
0 5 10 15
Pixel position
Measure
d p
ow
er
[dB
}
HH
VV
HV
VH
Range profile of CR50sq
-50
-40
-30
-20
-10
0
10
20
0 5 10 15
Pixel position
Measure
d p
ow
er
[dB
]
HH
VV
HV
VH
CR radiometric Cal. (HH)(total power method)
y = 1.0956x + 20.111
20
25
30
35
40
45
50
0 10 20 30
Measured total power [dB]
Rad
ar c
ross
sec./
Are
a [d
B]
30cm Tri
30cm Sq
50cm Sq
CR radiometric Cal. (VV)(total power method)
y = 1.0599x + 20.29
20
25
30
35
40
45
50
0 10 20 30
Measured total power [dB]
Rad
ar c
ross
sec./
Are
a [d
B]
30cm Tri
30cm Sq
50cm Sq
International Archives of the Photogrammetry, Remote Sensing and Spatial Information Science, Volume XXXVIII, Part 8, Kyoto Japan 2010
140

3.1 Radiometric calibration For radiometric calibration, we used the integral method (Gray et al., 1990). Figure 8 shows the radar cross section versus measured total power of CR in HH and VV polarization. Using the result of radiometric calibration, we can estimate the backscattering coefficients (σ0). σ0 of runway surface and grass field were about -19dB and -13dB in the HH polarization SAR image, respectively. And the values are reasonable for X-band σ0. 3.2 Polarimetric calibration For polarimetric calibration, we used the Quegan’s method (Quegan, 1994). Figure 9 shows the polarization signature of 50cm-square-trihedrals CR before (a) and after (b) the polarimetric calibration. It seems that the polarization signatures after calibration agree well with the ideal polarization signature of the trihedral CR. Figure 9. Polarization signature of 50cm-square-trihedrals CR before (a) and after (b) the polarimetric calibration.
4. BACKSCATTERING FROM SNOW COVER Figure 10 shows the Pi-SAR2 RGB power composite image (R:HH, G:HV, B:VV) acquired in February 2, 2010. The image area is same as the red rectangle in Figure 5 (a). In February 2010, the runway was covered with 50 cm-depth dense snow except for the dark area in the SAR image which was snow-removal area on runway. The backscattering coefficient of snow covered runway was 11dB larger than the backscattering coefficient of runway with no snow. This suggests that our X-band SAR can estimate the snow depth.
Figure 10. Pi-SAR2 mode1 RGB power composite image (R:HH, G:HV, B:VV)(‘10/2/2). Incidence angle is about 42deg. The runway and surrounding area were covered with 50 cm-depth dense snow.
5. SUMMARY We performed the calibration experiments using the calibrators (CR) for calibration and validation of our new airborne SAR (Pi-SAR2). We confirmed the spatial resolution of 0.29m in azimuth and 0.41m in ground range (incidence angle of 42 deg). The polarization signature of CRs after polarimetric calibration show good agreement with the ideal polarization signature of the trihedral CR. The large backscattering from snow cover suggests that our X-band SAR can estimate the snow depth. We will report the test results of the interferometric function and spot-light mode in the near future. Acknowledgements: Authors would like to acknowledge the cooperation of NEC for the development of Pi-SAR2 system and image processing, Diamond Air Service for the operation of Pi-SAR2 flight. References: Gray A.L., P.W. Vachon, et al.. 1990. Synthetic Aperture Radar Calibration Using Reference Reflectors., IEEE Trans. on Geosci. and Remote Sensing, vol.28, no.3 pp.374-383. Nadai A., S. Uratsuka, T. Umehara, T. Matsuoka, T. Kobayashi, M. Satake, 2009. Development of X-band airborne polarimetric and interferometric SAR with sub-meter spatial resolution. Proc. IEEE IGARSS 2009. Quegan S., 1994. A Unified Algorithm for Phase and Cross-Talk Calibration of Polarimetric Data –Theory and Observations. IEEE Trans. on Geosci. and Remote Sensing, vol.32, no.1, pp.89-99.
(a)
(b)
Co-pol
Co-pol
X-pol
X-pol
Azimuth
Range
International Archives of the Photogrammetry, Remote Sensing and Spatial Information Science, Volume XXXVIII, Part 8, Kyoto Japan 2010
141