Embed Size (px)
Citation preview
Calibration Model for Detection of Potential Demodulating Behaviour in Biological Media Exposed to RF Energy See, CH, Abd-Alhameed, RA, Ghani, A, Ali, N, Excell, P, McEwan, NJ & Balzano, Q Author post-print (accepted) deposited by Coventry University’s Repository Original citation & hyperlink:
See, CH, Abd-Alhameed, RA, Ghani, A, Ali, N, Excell, P, McEwan, NJ & Balzano, Q 2017, 'Calibration Model for Detection of Potential Demodulating Behaviour in Biological Media Exposed to RF Energy' IET Science, Measurement and Technology, vol 11, no. 7, SMT-2017-0105, pp. 900-906 https://dx.doi.org/10.1049/iet-smt.2017.0105
DOI 10.1049/iet-smt.2017.0105 ISSN 1751-8822 ESSN 1751-8830 Publisher: IEEE © 2017 IEEE. Personal use of this material is permitted. Permission from IEEE must be obtained for all other uses, in any current or future media, including reprinting/republishing this material for advertising or promotional purposes, creating new collective works, for resale or redistribution to servers or lists, or reuse of any copyrighted component of this work in other works. Copyright © and Moral Rights are retained by the author(s) and/ or other copyright owners. A copy can be downloaded for personal non-commercial research or study, without prior permission or charge. This item cannot be reproduced or quoted extensively from without first obtaining permission in writing from the copyright holder(s). The content must not be changed in any way or sold commercially in any format or medium without the formal permission of the copyright holders. This document is the author’s post-print version, incorporating any revisions agreed during the peer-review process. Some differences between the published version and this version may remain and you are advised to consult the published version if you wish to cite from it.
IET Science, Measurement & Technology
Research Article
Calibration model for detection of potentialdemodulating behaviour in biological mediaexposed to RF energy
ISSN 1751-8822Received on 9th March 2017Revised 25th April 2017Accepted on 11th May 2017E-First on 18th July 2017doi: 10.1049/iet-smt.2017.0105www.ietdl.org
Chan H. See1,2 , Raed A. Abd-Alhameed2, Arfan Ghani3, Nazar T. Ali4, Peter S. Excell2,5, Neil J.McEwan2,5, Quirino Balzano6
1School of Engineering, University of Bolton, Deane Road, Bolton, BL3 5AB, UK2Antennas and Applied Electromagnetics Research Group, University of Bradford, Bradford, BD7 1DP, UK3School of Computing, Electronics and Mathematics, Coventry University, CV1 5FB, UK4Khalifa University of Science, Technology and Research (KUSTAR), Sharjah, UAE5Wrexham Glyndwr University, Wrexham, LL11 2AW, UK6Department of Electronic and Computer Engineering, University of Maryland, College Park MD, USA
E-mail: [email protected]
Abstract: Potential demodulating ability in biological tissue exposed to radio-frequency (RF) signals intrinsically requires anunsymmetrical diode-like non-linear response in tissue samples. This may be investigated by observing possible generation ofthe second harmonic in a cavity resonator designed to have fundamental and second harmonic resonant frequencies withcollocated antinodes. Such a response would be of interest as being a mechanism that could enable demodulation ofinformation-carrying waveforms having modulating frequencies in ranges that could interfere with cellular processes. Previousstudies have developed an experimental system to test for such responses: the present study reports a circuit model to facilitatecalibration of any non-linear RF energy conversion occurring within a test-piece inside the cavity. The method is validatedcomputationally and experimentally using a well-characterised non-linear device. The proposed model demonstrates that thesensitivity of the measurement equipment plays a vital role in deciding the required input power to detect any second harmonicsignal, which is expected to be very weak. The model developed here provides a lookup table giving the level of the secondharmonic signal in the detector as a function of the input power applied in a measurement. Experimental results are in goodagreement with the simulated results.
1 IntroductionWith the rapid growth of mobile communication usage over recentdecades, public concerns have been raised about the possiblebiological effects of non-ionising radiation with specific regard toradio-frequency (RF) radiation from mobile phones [1, 2]. Thepossible effects of this radiation can be categorised into twogroups: thermal effects resulting from high-level RF power andputative non-thermal effects due to low power radiation. Thermaleffects of RF radiation have been extensively studied by manyresearchers and are well understood and uncontroversial [1, 2]; incontrast, non-thermal effects of such radiation are still debated bymany scientists, with conflicting arguments still being presented.As a result, intensive effort worldwide continues to developresearch in aspects of bioelectromagnetics at macroscopic andmicroscopic levels. This has led to different defined levels ofanalysis, i.e. human level, tissue level, cell level and ionic level [3–22].
From the published literature [1–7], it may be observed thatmany of the works have treated RF and tissue interactionmechanism effects as a linear problem. Relatively few papers [8–13] have moved towards searching for proof of the existence ofnon-linear biological tissue responses, including molecularprocesses and microscopic studies at cellular level. These studiesare typically either theoretical or experimental, the latter coveringmolecular, cellular or tissue-level experiments or else statisticalstudies of whole-organism effects in human or animal cohorts.Recently, Balzano et al. [8–11] has proposed novel experiments todetect the presence of asymmetrical (rectifying) non-linearinteractions at cellular or tissue-sample level, under exposure bylow-amplitude RF carrier signals. These build on the observationthat demodulation of a modulated carrier inherently requires suchasymmetrical behaviour and this would necessarily cause the
production of second harmonics. Such demodulation has beenpostulated as a plausible mode for putative non-thermal effects ofRF radiation on any contiguous living system.
Balzano's proposals adopted the concept of an ingeniousdoubly-harmonic resonant cylindrical cavity model having co-located antinodes at fundamental and second harmonic frequencies[8–11]: the paper presented here develops an electric circuitmathematical model to link the cavity model with second harmonicgeneration from a given non-linear device. The results can be usedto indicate the amount of input power needed to stimulate thebiological sample in order to maximise the likelihood of detectingany second harmonic reradiation.
2 MethodologyThe proposed mathematical model is an extension of some of theauthors’ earlier work [23, 24]. It consists of two parts: cavity modeland electric circuit model: in addition, experimental verificationwas undertaken. In the cavity model, the electric field distributionswere studied at TE111 and TE113 modes. Following this, the cavitymodel was used to extract its S-parameters by using CSTMicrowave Studio [25] and ANSYS HFSS [26] software. Oncethese data were obtained, they could be adopted into the derivedequations from the proposed circuit model to compute the secondharmonic power level with a given input power.
2.1 Cavity model and electric fields analysis
The previously-reported practical work [13] was undertaken withan RF carrier frequency in the 880–890 MHz band. To examinewhether biological tissues exhibit unsymmetrical non-linearitywhen exposed to RF signals in this band, an efficient and highquality-factor dual-resonant cylindrical cavity with height 272 mm
IET Sci. Meas. Technol., 2017, Vol. 11 Iss. 7, pp. 900-906© The Institution of Engineering and Technology 2017
900
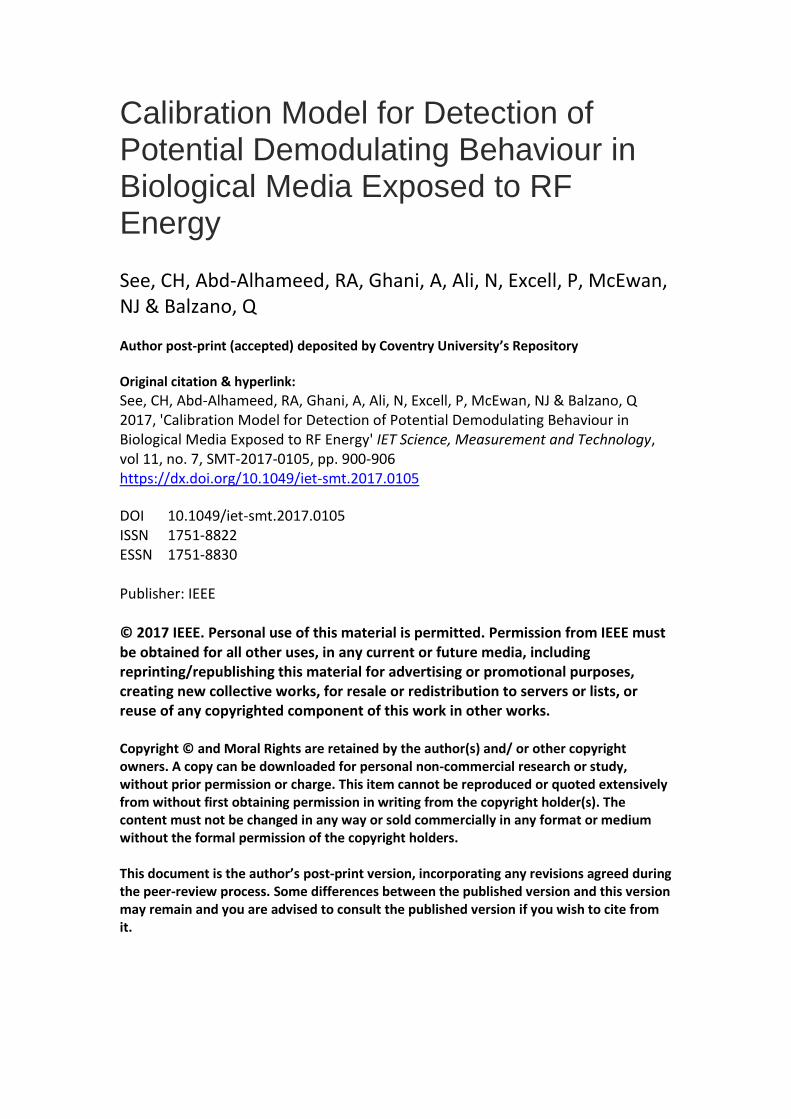
and diameter 248 mm was used, based on Balzano's proposals [8,10, 11]. Fig. 1 shows the cavity structure, including two loopantennas (for fundamental input and second-harmonic output) anda biosample support structure consisting of a butterfly-shapedLexan lamina (polycarbonate) [11] and a Petri dish [27]. Thissupporting structure is designed to minimise dielectric loss in thecavity, other than the energy dissipation in the biosample. Lexan ispractically lossless at the frequencies of operation of the cavity andhas a relative dielectric permeability of between 2.5 and 3.0. Theholes in the lamina were added to decrease the overall dielectricloading of the cavity. The central circle in the lamina has a 1 mmdepression to hold a 3.5 cm diameter Petri dish centrally.
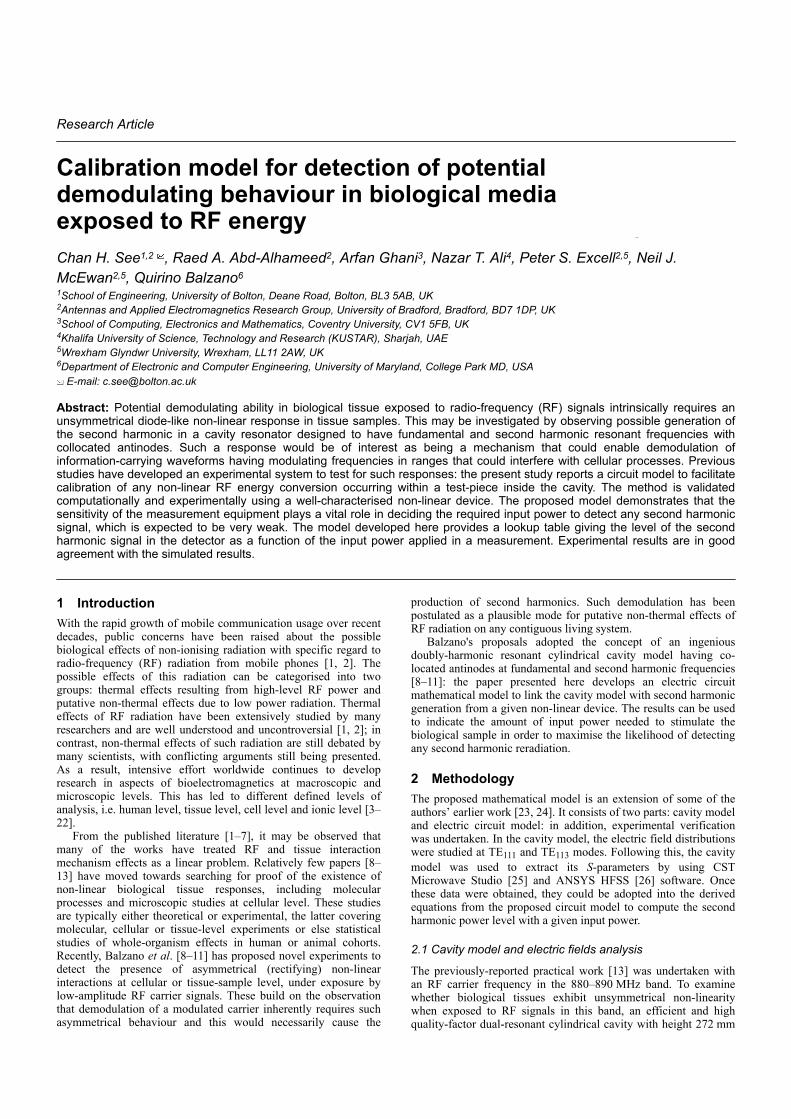
Loop antennas were selected for coupling because they couplewith both HΦ (the azimuthal magnetic field) and Er (the radialelectric field) and thus have a much wider reactive matching rangethan a monopole [8]. The cavity is excited by a loop antenna withdimensions of 14 × 105 mm located in the middle of the bottomplate, the dimensions corresponding to a total length of 0.4 λ at882 MHz. This acts as a transmitter to excite the TE111 cavitymode in the frequency range of 880–890 MHz. The other antennaon the side wall of the cavity has dimensions of 12.5 × 56.5 mm,which is equivalent to length of 0.48λ at 1764 MHz (the secondharmonic). This acts as a receiver to detect the energy of the TE113cavity mode in the 1760–1790 MHz band, i.e. exactly double theinput frequency. To maintain the highest sensitivity for detection ofsecond harmonic responses, it is important to place both antennasat maxima of their corresponding operating modes, i.e. TE111 orTE113. It is also essential to fine-tune the lengths of both antennasto achieve the resonance of the TE113 mode at exactly double theresonance frequency of the TE111 mode. To better understand thesemodes, Fig. 2 depicts the total electric field distributions for bothmodes. As can be seen, the TE111 mode has a maximum E-field inthe centre of the cavity while the TE113 also has a field maximumat this point, plus others at d/6 and 5d/6, where d is the height ofthe cavity.
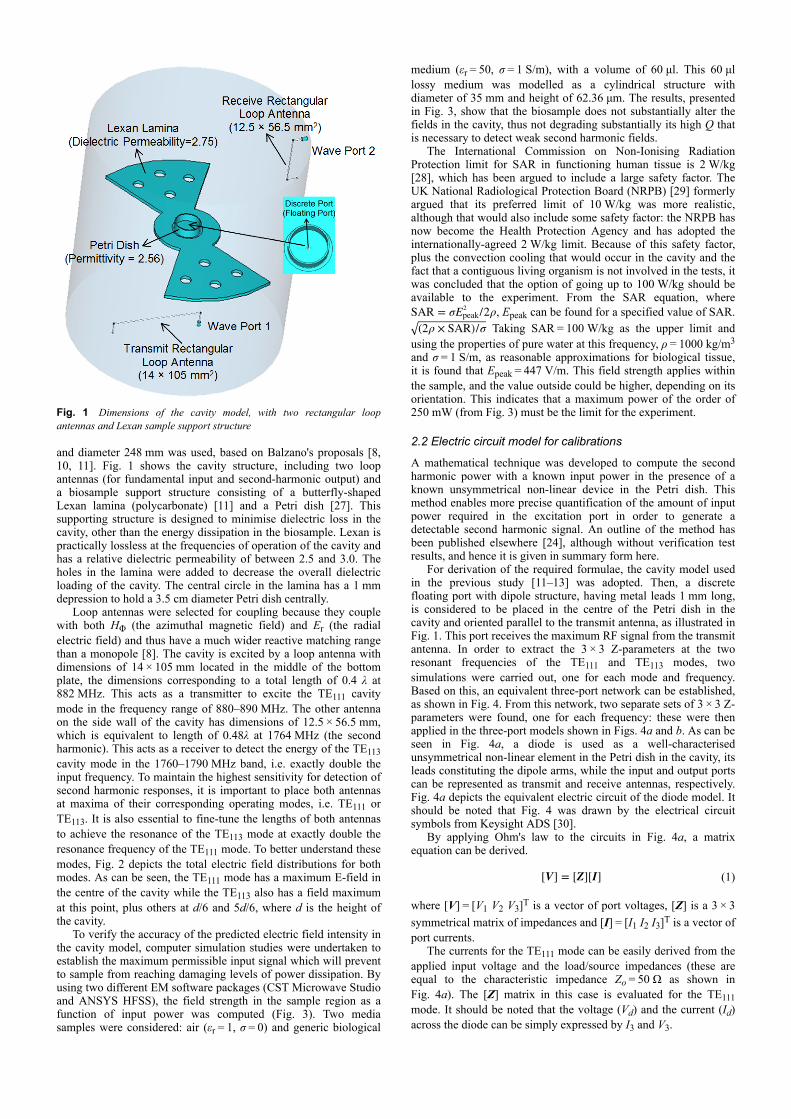
To verify the accuracy of the predicted electric field intensity inthe cavity model, computer simulation studies were undertaken toestablish the maximum permissible input signal which will preventto sample from reaching damaging levels of power dissipation. Byusing two different EM software packages (CST Microwave Studioand ANSYS HFSS), the field strength in the sample region as afunction of input power was computed (Fig. 3). Two mediasamples were considered: air (εr = 1, σ = 0) and generic biological
medium (εr = 50, σ = 1 S/m), with a volume of 60 μl. This 60 μllossy medium was modelled as a cylindrical structure withdiameter of 35 mm and height of 62.36 μm. The results, presentedin Fig. 3, show that the biosample does not substantially alter thefields in the cavity, thus not degrading substantially its high Q thatis necessary to detect weak second harmonic fields.
The International Commission on Non-Ionising RadiationProtection limit for SAR in functioning human tissue is 2 W/kg[28], which has been argued to include a large safety factor. TheUK National Radiological Protection Board (NRPB) [29] formerlyargued that its preferred limit of 10 W/kg was more realistic,although that would also include some safety factor: the NRPB hasnow become the Health Protection Agency and has adopted theinternationally-agreed 2 W/kg limit. Because of this safety factor,plus the convection cooling that would occur in the cavity and thefact that a contiguous living organism is not involved in the tests, itwas concluded that the option of going up to 100 W/kg should beavailable to the experiment. From the SAR equation, whereSAR = σEpeak
2 /2ρ, Epeak can be found for a specified value of SAR.(2ρ × SAR)/σ Taking SAR = 100 W/kg as the upper limit and
using the properties of pure water at this frequency, ρ = 1000 kg/m3
and σ = 1 S/m, as reasonable approximations for biological tissue,it is found that Epeak = 447 V/m. This field strength applies withinthe sample, and the value outside could be higher, depending on itsorientation. This indicates that a maximum power of the order of250 mW (from Fig. 3) must be the limit for the experiment.
2.2 Electric circuit model for calibrations
A mathematical technique was developed to compute the secondharmonic power with a known input power in the presence of aknown unsymmetrical non-linear device in the Petri dish. Thismethod enables more precise quantification of the amount of inputpower required in the excitation port in order to generate adetectable second harmonic signal. An outline of the method hasbeen published elsewhere [24], although without verification testresults, and hence it is given in summary form here.
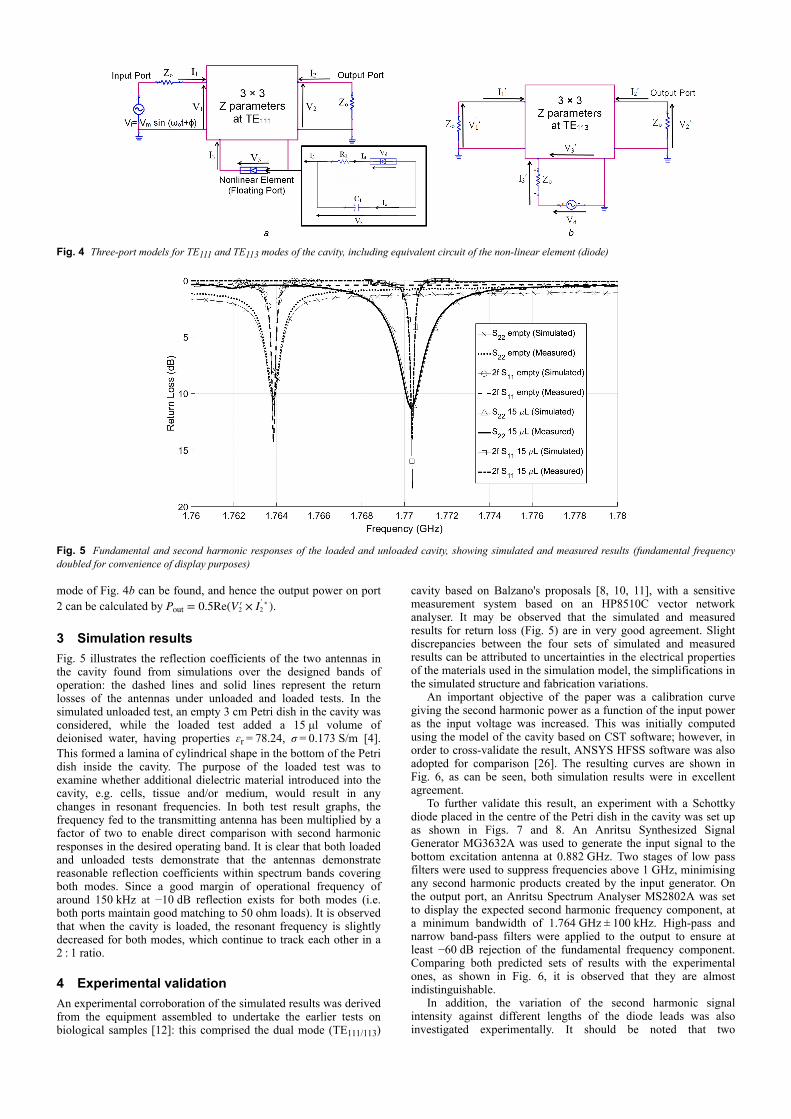
For derivation of the required formulae, the cavity model usedin the previous study [11–13] was adopted. Then, a discretefloating port with dipole structure, having metal leads 1 mm long,is considered to be placed in the centre of the Petri dish in thecavity and oriented parallel to the transmit antenna, as illustrated inFig. 1. This port receives the maximum RF signal from the transmitantenna. In order to extract the 3 × 3 Z-parameters at the tworesonant frequencies of the TE111 and TE113 modes, twosimulations were carried out, one for each mode and frequency.Based on this, an equivalent three-port network can be established,as shown in Fig. 4. From this network, two separate sets of 3 × 3 Z-parameters were found, one for each frequency: these were thenapplied in the three-port models shown in Figs. 4a and b. As can beseen in Fig. 4a, a diode is used as a well-characterisedunsymmetrical non-linear element in the Petri dish in the cavity, itsleads constituting the dipole arms, while the input and output portscan be represented as transmit and receive antennas, respectively.Fig. 4a depicts the equivalent electric circuit of the diode model. Itshould be noted that Fig. 4 was drawn by the electrical circuitsymbols from Keysight ADS [30].
By applying Ohm's law to the circuits in Fig. 4a, a matrixequation can be derived.
V = Z I (1)
where [V] = [V1 V2 V3]T is a vector of port voltages, [Z] is a 3 × 3symmetrical matrix of impedances and [I] = [I1 I2 I3]T is a vector ofport currents.
The currents for the TE111 mode can be easily derived from theapplied input voltage and the load/source impedances (these areequal to the characteristic impedance Zo = 50 Ω as shown inFig. 4a). The [Z] matrix in this case is evaluated for the TE111mode. It should be noted that the voltage (Vd) and the current (Id)across the diode can be simply expressed by I3 and V3.
Fig. 1 Dimensions of the cavity model, with two rectangular loopantennas and Lexan sample support structure
IET Sci. Meas. Technol., 2017, Vol. 11 Iss. 7, pp. 900-906© The Institution of Engineering and Technology 2017
901
For the diode parasitic components, values of R1 = 106.5 Ω andC1 = 1.5 fF were adopted [31]; then (1), subject to input voltage Viat port 1 can be established to compute Vd. Once Vd is found, it canbe applied as the excitation source to the non-linear element. Bysubstituting the Z-parameters of the TE111 mode into (1) andchoosing a value for the input voltage, the parameters V1, V2 and
Vd can be calculated. Then, the input power of the model can becalculated by Pin = 0.5 Re(V1 × I1).
The circuit in Fig. 4a was modified to apply to TE113 mode, asin Fig. 4b. By simple manipulation of the new voltage matrixelements, V′ = V1
′ V2′ V3
′ T and applying the standardShockley diode equation, the currents in the ports of the TE113
Fig. 2 Electric fields distributions through the centre of the cavity(a) Total E-field of TE111 mode on xz-plane, (b) Total E-field of TE111 mode on yz-plane, (c) Total E-field of TE113 mode on xz-plane, (d) Total E-field of TE113 mode on yz-plane
Fig. 3 Electric field intensity in the cavity with and without presence of biological tissue, as computed by two different simulation packages
902 IET Sci. Meas. Technol., 2017, Vol. 11 Iss. 7, pp. 900-906© The Institution of Engineering and Technology 2017
mode of Fig. 4b can be found, and hence the output power on port2 can be calculated by Pout = 0.5Re(V2′ × I2
′ ∗ ).
3 Simulation resultsFig. 5 illustrates the reflection coefficients of the two antennas inthe cavity found from simulations over the designed bands ofoperation: the dashed lines and solid lines represent the returnlosses of the antennas under unloaded and loaded tests. In thesimulated unloaded test, an empty 3 cm Petri dish in the cavity wasconsidered, while the loaded test added a 15 μl volume ofdeionised water, having properties ɛr = 78.24, σ = 0.173 S/m [4].This formed a lamina of cylindrical shape in the bottom of the Petridish inside the cavity. The purpose of the loaded test was toexamine whether additional dielectric material introduced into thecavity, e.g. cells, tissue and/or medium, would result in anychanges in resonant frequencies. In both test result graphs, thefrequency fed to the transmitting antenna has been multiplied by afactor of two to enable direct comparison with second harmonicresponses in the desired operating band. It is clear that both loadedand unloaded tests demonstrate that the antennas demonstratereasonable reflection coefficients within spectrum bands coveringboth modes. Since a good margin of operational frequency ofaround 150 kHz at −10 dB reflection exists for both modes (i.e.both ports maintain good matching to 50 ohm loads). It is observedthat when the cavity is loaded, the resonant frequency is slightlydecreased for both modes, which continue to track each other in a2 : 1 ratio.
4 Experimental validationAn experimental corroboration of the simulated results was derivedfrom the equipment assembled to undertake the earlier tests onbiological samples [12]: this comprised the dual mode (TE111/113)
cavity based on Balzano's proposals [8, 10, 11], with a sensitivemeasurement system based on an HP8510C vector networkanalyser. It may be observed that the simulated and measuredresults for return loss (Fig. 5) are in very good agreement. Slightdiscrepancies between the four sets of simulated and measuredresults can be attributed to uncertainties in the electrical propertiesof the materials used in the simulation model, the simplifications inthe simulated structure and fabrication variations.
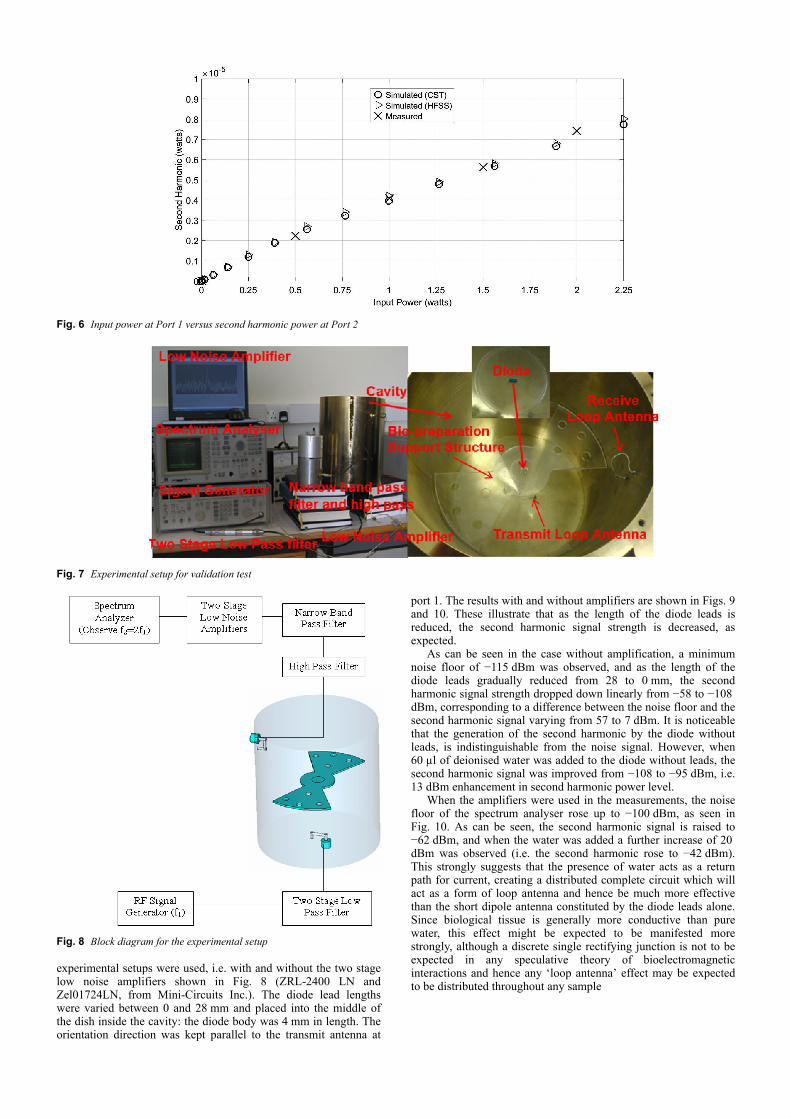
An important objective of the paper was a calibration curvegiving the second harmonic power as a function of the input poweras the input voltage was increased. This was initially computedusing the model of the cavity based on CST software; however, inorder to cross-validate the result, ANSYS HFSS software was alsoadopted for comparison [26]. The resulting curves are shown inFig. 6, as can be seen, both simulation results were in excellentagreement.
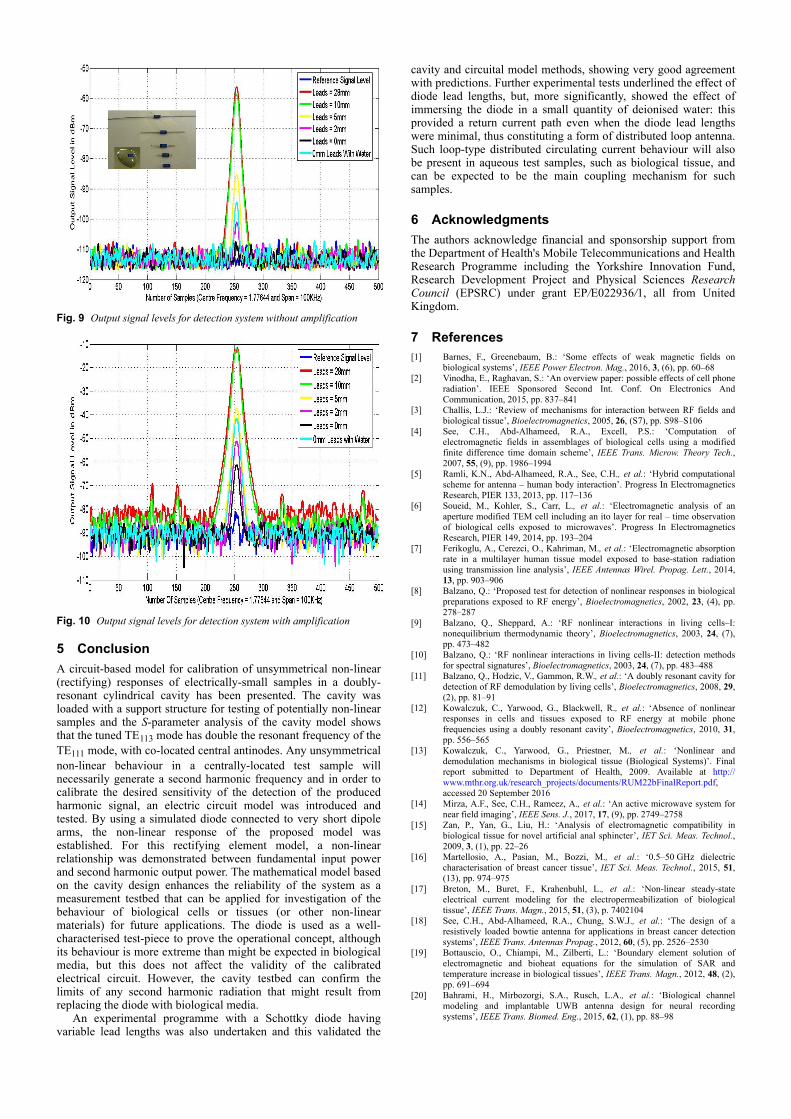
To further validate this result, an experiment with a Schottkydiode placed in the centre of the Petri dish in the cavity was set upas shown in Figs. 7 and 8. An Anritsu Synthesized SignalGenerator MG3632A was used to generate the input signal to thebottom excitation antenna at 0.882 GHz. Two stages of low passfilters were used to suppress frequencies above 1 GHz, minimisingany second harmonic products created by the input generator. Onthe output port, an Anritsu Spectrum Analyser MS2802A was setto display the expected second harmonic frequency component, ata minimum bandwidth of 1.764 GHz ± 100 kHz. High-pass andnarrow band-pass filters were applied to the output to ensure atleast −60 dB rejection of the fundamental frequency component.Comparing both predicted sets of results with the experimentalones, as shown in Fig. 6, it is observed that they are almostindistinguishable.
In addition, the variation of the second harmonic signalintensity against different lengths of the diode leads was alsoinvestigated experimentally. It should be noted that two
Fig. 4 Three-port models for TE111 and TE113 modes of the cavity, including equivalent circuit of the non-linear element (diode)
Fig. 5 Fundamental and second harmonic responses of the loaded and unloaded cavity, showing simulated and measured results (fundamental frequencydoubled for convenience of display purposes)
IET Sci. Meas. Technol., 2017, Vol. 11 Iss. 7, pp. 900-906© The Institution of Engineering and Technology 2017
903
experimental setups were used, i.e. with and without the two stagelow noise amplifiers shown in Fig. 8 (ZRL-2400 LN andZel01724LN, from Mini-Circuits Inc.). The diode lead lengthswere varied between 0 and 28 mm and placed into the middle ofthe dish inside the cavity: the diode body was 4 mm in length. Theorientation direction was kept parallel to the transmit antenna at
port 1. The results with and without amplifiers are shown in Figs. 9and 10. These illustrate that as the length of the diode leads isreduced, the second harmonic signal strength is decreased, asexpected.
As can be seen in the case without amplification, a minimumnoise floor of −115 dBm was observed, and as the length of thediode leads gradually reduced from 28 to 0 mm, the secondharmonic signal strength dropped down linearly from −58 to −108 dBm, corresponding to a difference between the noise floor and thesecond harmonic signal varying from 57 to 7 dBm. It is noticeablethat the generation of the second harmonic by the diode withoutleads, is indistinguishable from the noise signal. However, when60 µl of deionised water was added to the diode without leads, thesecond harmonic signal was improved from −108 to −95 dBm, i.e.13 dBm enhancement in second harmonic power level.
When the amplifiers were used in the measurements, the noisefloor of the spectrum analyser rose up to −100 dBm, as seen inFig. 10. As can be seen, the second harmonic signal is raised to−62 dBm, and when the water was added a further increase of 20 dBm was observed (i.e. the second harmonic rose to −42 dBm).This strongly suggests that the presence of water acts as a returnpath for current, creating a distributed complete circuit which willact as a form of loop antenna and hence be much more effectivethan the short dipole antenna constituted by the diode leads alone.Since biological tissue is generally more conductive than purewater, this effect might be expected to be manifested morestrongly, although a discrete single rectifying junction is not to beexpected in any speculative theory of bioelectromagneticinteractions and hence any ‘loop antenna’ effect may be expectedto be distributed throughout any sample
Fig. 6 Input power at Port 1 versus second harmonic power at Port 2
Fig. 7 Experimental setup for validation test
Fig. 8 Block diagram for the experimental setup
904 IET Sci. Meas. Technol., 2017, Vol. 11 Iss. 7, pp. 900-906© The Institution of Engineering and Technology 2017
5 ConclusionA circuit-based model for calibration of unsymmetrical non-linear(rectifying) responses of electrically-small samples in a doubly-resonant cylindrical cavity has been presented. The cavity wasloaded with a support structure for testing of potentially non-linearsamples and the S-parameter analysis of the cavity model showsthat the tuned TE113 mode has double the resonant frequency of theTE111 mode, with co-located central antinodes. Any unsymmetricalnon-linear behaviour in a centrally-located test sample willnecessarily generate a second harmonic frequency and in order tocalibrate the desired sensitivity of the detection of the producedharmonic signal, an electric circuit model was introduced andtested. By using a simulated diode connected to very short dipolearms, the non-linear response of the proposed model wasestablished. For this rectifying element model, a non-linearrelationship was demonstrated between fundamental input powerand second harmonic output power. The mathematical model basedon the cavity design enhances the reliability of the system as ameasurement testbed that can be applied for investigation of thebehaviour of biological cells or tissues (or other non-linearmaterials) for future applications. The diode is used as a well-characterised test-piece to prove the operational concept, althoughits behaviour is more extreme than might be expected in biologicalmedia, but this does not affect the validity of the calibratedelectrical circuit. However, the cavity testbed can confirm thelimits of any second harmonic radiation that might result fromreplacing the diode with biological media.
An experimental programme with a Schottky diode havingvariable lead lengths was also undertaken and this validated the
cavity and circuital model methods, showing very good agreementwith predictions. Further experimental tests underlined the effect ofdiode lead lengths, but, more significantly, showed the effect ofimmersing the diode in a small quantity of deionised water: thisprovided a return current path even when the diode lead lengthswere minimal, thus constituting a form of distributed loop antenna.Such loop-type distributed circulating current behaviour will alsobe present in aqueous test samples, such as biological tissue, andcan be expected to be the main coupling mechanism for suchsamples.
6 AcknowledgmentsThe authors acknowledge financial and sponsorship support fromthe Department of Health's Mobile Telecommunications and HealthResearch Programme including the Yorkshire Innovation Fund,Research Development Project and Physical Sciences ResearchCouncil (EPSRC) under grant EP/E022936/1, all from UnitedKingdom.
7 References[1] Barnes, F., Greenebaum, B.: ‘Some effects of weak magnetic fields on
biological systems’, IEEE Power Electron. Mag., 2016, 3, (6), pp. 60–68[2] Vinodha, E., Raghavan, S.: ‘An overview paper: possible effects of cell phone
radiation’. IEEE Sponsored Second Int. Conf. On Electronics AndCommunication, 2015, pp. 837–841
[3] Challis, L.J.: ‘Review of mechanisms for interaction between RF fields andbiological tissue’, Bioelectromagnetics, 2005, 26, (S7), pp. S98–S106
[4] See, C.H., Abd-Alhameed, R.A., Excell, P.S.: ‘Computation ofelectromagnetic fields in assemblages of biological cells using a modifiedfinite difference time domain scheme’, IEEE Trans. Microw. Theory Tech.,2007, 55, (9), pp. 1986–1994
[5] Ramli, K.N., Abd-Alhameed, R.A., See, C.H., et al.: ‘Hybrid computationalscheme for antenna – human body interaction’. Progress In ElectromagneticsResearch, PIER 133, 2013, pp. 117–136
[6] Soueid, M., Kohler, S., Carr, L., et al.: ‘Electromagnetic analysis of anaperture modified TEM cell including an ito layer for real – time observationof biological cells exposed to microwaves’. Progress In ElectromagneticsResearch, PIER 149, 2014, pp. 193–204
[7] Ferikoglu, A., Cerezci, O., Kahriman, M., et al.: ‘Electromagnetic absorptionrate in a multilayer human tissue model exposed to base-station radiationusing transmission line analysis’, IEEE Antennas Wirel. Propag. Lett., 2014,13, pp. 903–906
[8] Balzano, Q.: ‘Proposed test for detection of nonlinear responses in biologicalpreparations exposed to RF energy’, Bioelectromagnetics, 2002, 23, (4), pp.278–287
[9] Balzano, Q., Sheppard, A.: ‘RF nonlinear interactions in living cells–I:nonequilibrium thermodynamic theory’, Bioelectromagnetics, 2003, 24, (7),pp. 473–482
[10] Balzano, Q.: ‘RF nonlinear interactions in living cells-II: detection methodsfor spectral signatures’, Bioelectromagnetics, 2003, 24, (7), pp. 483–488
[11] Balzano, Q., Hodzic, V., Gammon, R.W., et al.: ‘A doubly resonant cavity fordetection of RF demodulation by living cells’, Bioelectromagnetics, 2008, 29,(2), pp. 81–91
[12] Kowalczuk, C., Yarwood, G., Blackwell, R., et al.: ‘Absence of nonlinearresponses in cells and tissues exposed to RF energy at mobile phonefrequencies using a doubly resonant cavity’, Bioelectromagnetics, 2010, 31,pp. 556–565
[13] Kowalczuk, C., Yarwood, G., Priestner, M., et al.: ‘Nonlinear anddemodulation mechanisms in biological tissue (Biological Systems)’. Finalreport submitted to Department of Health, 2009. Available at http://www.mthr.org.uk/research_projects/documents/RUM22bFinalReport.pdf,accessed 20 September 2016
[14] Mirza, A.F., See, C.H., Rameez, A., et al.: ‘An active microwave system fornear field imaging’, IEEE Sens. J., 2017, 17, (9), pp. 2749–2758
[15] Zan, P., Yan, G., Liu, H.: ‘Analysis of electromagnetic compatibility inbiological tissue for novel artificial anal sphincter’, IET Sci. Meas. Technol.,2009, 3, (1), pp. 22–26
[16] Martellosio, A., Pasian, M., Bozzi, M., et al.: ‘0.5–50 GHz dielectriccharacterisation of breast cancer tissue’, IET Sci. Meas. Technol., 2015, 51,(13), pp. 974–975
[17] Breton, M., Buret, F., Krahenbuhl, L., et al.: ‘Non-linear steady-stateelectrical current modeling for the electropermeabilization of biologicaltissue’, IEEE Trans. Magn., 2015, 51, (3), p. 7402104
[18] See, C.H., Abd-Alhameed, R.A., Chung, S.W.J., et al.: ‘The design of aresistively loaded bowtie antenna for applications in breast cancer detectionsystems’, IEEE Trans. Antennas Propag., 2012, 60, (5), pp. 2526–2530
[19] Bottauscio, O., Chiampi, M., Zilberti, L.: ‘Boundary element solution ofelectromagnetic and bioheat equations for the simulation of SAR andtemperature increase in biological tissues’, IEEE Trans. Magn., 2012, 48, (2),pp. 691–694
[20] Bahrami, H., Mirbozorgi, S.A., Rusch, L.A., et al.: ‘Biological channelmodeling and implantable UWB antenna design for neural recordingsystems’, IEEE Trans. Biomed. Eng., 2015, 62, (1), pp. 88–98
Fig. 9 Output signal levels for detection system without amplification
Fig. 10 Output signal levels for detection system with amplification
IET Sci. Meas. Technol., 2017, Vol. 11 Iss. 7, pp. 900-906© The Institution of Engineering and Technology 2017
905
[21] Hancock, C.P., Dharmasiri, N., White, M., et al.: ‘The design anddevelopment of an integrated multi-functional microwave antenna structurefor biological applications’, IEEE Trans. Microw. Theory Tech., 2013, 61, (5),pp. 2230–2241
[22] Scheeler, R., Kuester, E.F., Popovic, Z.: ‘Sensing depth of microwaveradiation for internal body temperature measurement’, IEEE Trans. AntennasPropag., 2014, 62, (3), pp. 1293–1303
[23] See, C.H., Abd-Alhameed, R.A., Excell, P.S.: ‘Mathematical model forcalibration of nonlinear responses in biological media exposed to RF energy’.IET Computational Electromagnetics Conf. (CEM), 31 March to 1 April2014, Imperial College London, 2014, pp. 1–2
[24] See, C.H., Abd-Alhameed, R.A., Mirza, A.F., et al.: ‘Mathematical model forcalibration of potential detection of nonlinear responses in biological mediaexposed to RF energy’, Appl. Comput. Electromagn. Soc. J., 2017, 32, (1), pp.1–7
[25] CST Microwave Studio software, CST AG, Darmstadt, Germany[26] ANSYS HFSS software, ANSYS Inc. Canonsburg PA, USA[27] Zhao, J.X.: ‘Numerical dosimetry for cells under millimetre-wave irradiation
using Petri dish exposure set-ups’, Phys. Med. Biol., 2005, 50, pp. 3405–3421[28] ICNIRP: ‘Guidelines for limiting exposure to time-varying electric, magnetic
and electromagnetic fields (up 300 GHz)’, Health Phys., 1998, 56, pp. 494–522
[29] N.R.P.B: ‘Board statement on restrictions on human exposure to static andtime varying electromagnetic fields and radiation’, Doc. NRPB, 1993, 4, pp.7–63
[30] Keysight ADS software, Keysight Technologies, 1400 FountaingroveParkway, Santa Rosa, CA 95403-1799
[31] Hu, Z., Ho, V.T., Ali, A.A., et al.: ‘High tangential signal sensitivity GaAsplanar doped barrier diodes for microwave/millimeter-wave power detectorapplications’, IEEE Microw. Wirel. Compon. Lett., 2005, 15, (3), pp. 150–152
906 IET Sci. Meas. Technol., 2017, Vol. 11 Iss. 7, pp. 900-906© The Institution of Engineering and Technology 2017


![슬라이드 1huniv.hongik.ac.kr/~wave/Lecture_board/2007_1/PATCH_… · PPT file · Web view... HFSS simulation HFSS [1] HFSS [2] HFSS [3] HFSS [4] HFSS [5] HFSS [6] HFSS [7] MICROSTRIP](https://img.pdfslide.net/doc/110x75/5a8896a37f8b9a001c8e9600/-wavelectureboard20071patchppt-fileweb-view-hfss-simulation.jpg)