Embed Size (px)
Citation preview
4th International Conference on Earthquake Geotechnical Engineering
June 25-28, 2007 Paper No. 1192
CALIBRATION OF EUROCODE 8 (EN1998-1) SITE-DEPENDENT ACCELERATION AND DISPLACEMENT SPECTRA USING RECORDS
FROM GREECE
Christina ATHANASSIADOU 1, Vassilios LEKIDIS2, Andreas KAPPOS 3 and Christos KARAKOSTAS4
ABSTRACT The 2004 Eurocode 8 (EC8) design spectra provisions are compared with elastic pseudoacceleration, pseudovelocity and displacement spectra which are derived from a representative sample of acceleration records from Greece. The sample is carefully selected based on magnitude, distance and peak ground acceleration criteria, and grouped into three ground condition categories according to the EC8 provisions. Using software developed in-house, EC8 Type-1 and Type-2 mean elastic (pseudoacceleration, pseudovelocity and displacement) spectra are computed for various ground conditions and are compared with the corresponding EC8 response spectra. Also, mean inelastic strength spectra are derived using two different approaches and are compared with the relevant EC8 design spectra. In the computation of the inelastic spectra, an analytical expression for the ductility-dependent component of the behaviour (force reduction) factor is proposed and used. Keywords: Design spectra, elastic spectra, inelastic spectra, Eurocode 8, strength reduction factor.
INTRODUCTION It is now widely recognised that elastic and inelastic spectra, either of pseudoacceleration or displacement, play a key role in modern Earthquake Engineering practice. For instance, elastic acceleration spectra play a major role in “conventional” force-based design that is still worldwide adopted by modern seismic codes, while in pushover analysis (now a commonly used tool for assessment of structures) a target displacement is necessary (ATC, 1996) and can be properly evaluated only through a response spectrum that provides realistic values of displacement. Direct displacement-based design or assessment methods (Priestley, 2000) also require reliable spectra for a large range of damping ratios, since the expected inelastic response of the structure is conveniently accounted for through a properly damped elastic spectrum; such spectra are equally important for seismic isolation studies. In the present study, a carefully selected and properly processed sample of Greek strong motion records is used as a basis for the evaluation of elastic pseudoacceleration, pseudovelocity and displacement spectra, as well as of inelastic strength spectra, using software developed in-house. The 1 Lecturer, Department of Civil Engineering, Aristotle University of Thessaloniki, Greece, Email: [email protected] Senior Researcher, Institute of Engineering Seismology and Earthquake Engineering (ITSAK), Thessaloniki, Greece, Email: [email protected] Professor, Department of Civil Engineering, Aristotle University of Thessaloniki, Greece, Email: [email protected] Senior Researcher, Institute of Engineering Seismology and Earthquake Engineering (ITSAK), Thessaloniki, Greece, Email: [email protected]
envelope of the spectra of each of the two horizontal components of each recorded earthquake are used for the computation of the mean elastic spectra, which are then compared with the corresponding EC8 provisions. Mean inelastic strength spectra are derived based on two alternative approaches: one is based on the direct computation of the inelastic spectra from the earthquake sample and the second is based on using the corresponding mean elastic spectra in conjunction with an expression proposed by the writers for the behaviour (force reduction) factor. Comparisons are then made with corresponding EC8-compatible design spectra, which are also derived using two different approaches. Greece is known to host more than 50% of the whole European earthquake activity, while all kinds of seismotectonic environments are present in its territory, with fault mechanisms comprising normal, thrust and strike-slip types. Therefore, the results of the present study are of interest for all other European countries where consideration of seismic actions is pivotal in the design of new structures, as well as the assessment of existing structures. It is noted that most of the published works on inelastic spectra so far concentrated on data sets from North America (e.g. Miranda 2000, FEMA 2005). Response spectra are computed here for different soil conditions prescribed in the final version of Eurocode 8 (CEN, 2004), and comparisons with the design spectra proposed in the Code are presented. Further evaluation of Eurocode spectral shapes is of significant practical importance, given that these shapes have been revised several times during the development of the final version of the code (CEN, 2004), particularly regarding the values to be used for the ‘soil factor’ S and the ‘corner periods’ defining the various branches of the spectra (SC8 Project Team 1 1999, Rey et al. 2002, Pousse et al. 2005).
SELECTED EARTHQUAKE MOTIONS A key factor in studies like the present one is the proper choice of a representative sample among the available strong motion records in the area under consideration, in this work Greece. For the compilation of the sample, the strong motion database of the Institute of Engineering Seismology and Earthquake Engineering (ITSAK) was used. The database contains recordings from the permanent accelerograph network of ITSAK, which constitutes a significant part of the National Permanent Strong Motion Network, and covers the entire Greek territory. Based on both international practice and the personal experience of the research team, the following criteria were applied in the selection of the acceleration time histories:
Earthquake magnitude Mw ≥ 5.0 and epicentral distance R from 5 km to 100 km. Value of peak ground acceleration αg ≥ 0.10g and/or strong motion having caused damage in
the neighbourhood of the recording site. Availability of sufficient geotechnical data, to classify existing soil conditions at the
recording site according to the 2004 EC8 ground types (CEN, 2004). Due to the relatively small number of records in the database, in some cases earthquakes of magnitude somewhat less than 5.0 were selected, on condition that the amplitude of the horizontal motions was significant (αg>0.10g). The sample also includes records THEA7802, KORA8101, and AMAA8805 that were recorded by the accelerograph network of the Institute of Geodynamics, National Observatory of Athens (GNOA). The final record sample used in the present study is presented in Table 1. It consists of 73 records (time histories of horizontal components) of 26 strong earthquakes that occurred within the Greek territory in the last 28 years, and which were recorded by 25 stations of the ITSAK permanent network and 3 stations of the GNOA network. For each record in the Table, the date (in mmddyy format), time (in hhmmss format), geographic coordinates, magnitude, epicentral distance, code name, component (Longitudinal /Transverse), soil category at the site of the recording station, and peak ground acceleration are given. The sample is deemed sufficient, ranging in terms of magnitude between 4.4 and 6.9, and in terms of αg between 50 and 400 cm/sec2. Of particular interest are the four records (KYT10602 and ANS10601) from a strong (M=6.9) intermediate depth (focal depth of 66 km)
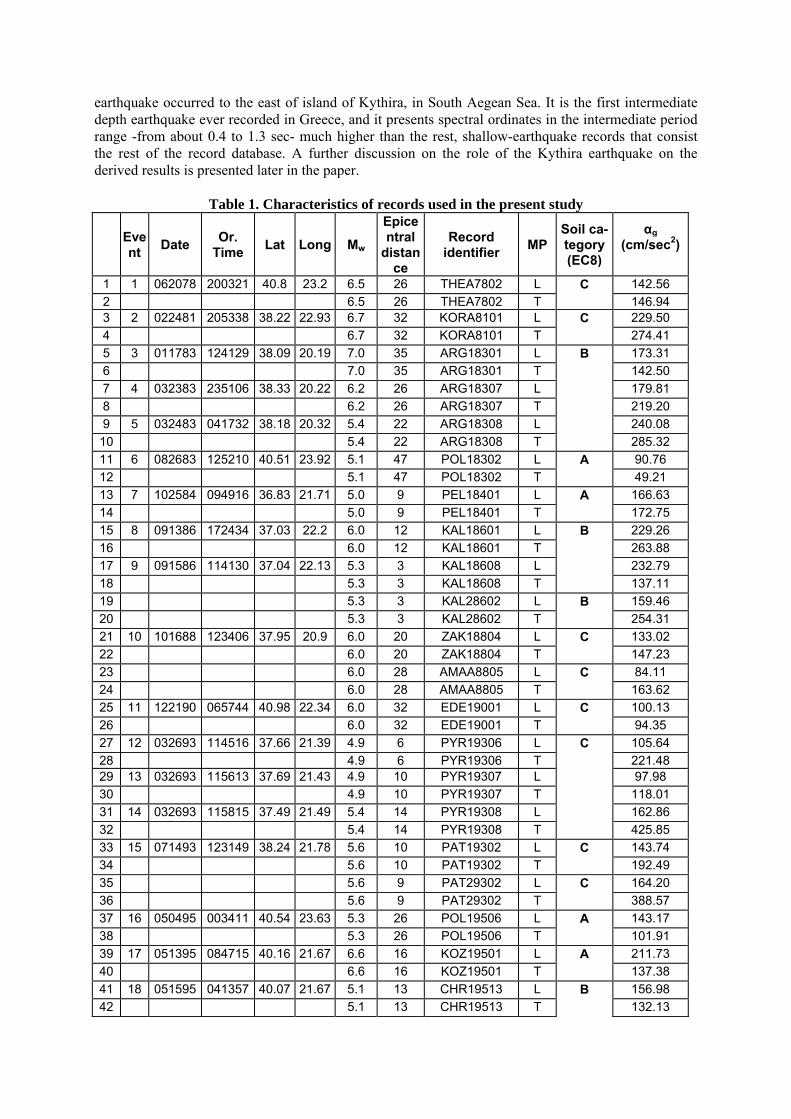
earthquake occurred to the east of island of Kythira, in South Aegean Sea. It is the first intermediate depth earthquake ever recorded in Greece, and it presents spectral ordinates in the intermediate period range -from about 0.4 to 1.3 sec- much higher than the rest, shallow-earthquake records that consist the rest of the record database. A further discussion on the role of the Kythira earthquake on the derived results is presented later in the paper.
Table 1. Characteristics of records used in the present study
Event Date Or.
Time Lat Long Mw
Epicentral
distance
Record identifier MP
Soil ca-tegory (ΕC8)
αg (cm/sec2)
1 1 062078 200321 40.8 23.2 6.5 26 THEA7802 L C 142.56 2 6.5 26 THEA7802 T 146.94 3 2 022481 205338 38.22 22.93 6.7 32 KORA8101 L C 229.50 4 6.7 32 KORA8101 T 274.41 5 3 011783 124129 38.09 20.19 7.0 35 ARG18301 L B 173.31 6 7.0 35 ARG18301 T 142.50 7 4 032383 235106 38.33 20.22 6.2 26 ARG18307 L 179.81 8 6.2 26 ARG18307 T 219.20 9 5 032483 041732 38.18 20.32 5.4 22 ARG18308 L 240.08
10 5.4 22 ARG18308 T 285.32 11 6 082683 125210 40.51 23.92 5.1 47 POL18302 L A 90.76 12 5.1 47 POL18302 T 49.21 13 7 102584 094916 36.83 21.71 5.0 9 PEL18401 L A 166.63 14 5.0 9 PEL18401 T 172.75 15 8 091386 172434 37.03 22.2 6.0 12 KAL18601 L B 229.26 16 6.0 12 KAL18601 T 263.88 17 9 091586 114130 37.04 22.13 5.3 3 KAL18608 L 232.79 18 5.3 3 KAL18608 T 137.11 19 5.3 3 KAL28602 L B 159.46 20 5.3 3 KAL28602 T 254.31 21 10 101688 123406 37.95 20.9 6.0 20 ZAK18804 L C 133.02 22 6.0 20 ZAK18804 T 147.23 23 6.0 28 AMAA8805 L C 84.11 24 6.0 28 AMAA8805 T 163.62 25 11 122190 065744 40.98 22.34 6.0 32 EDE19001 L C 100.13 26 6.0 32 EDE19001 T 94.35 27 12 032693 114516 37.66 21.39 4.9 6 PYR19306 L C 105.64 28 4.9 6 PYR19306 T 221.48 29 13 032693 115613 37.69 21.43 4.9 10 PYR19307 L 97.98 30 4.9 10 PYR19307 T 118.01 31 14 032693 115815 37.49 21.49 5.4 14 PYR19308 L 162.86 32 5.4 14 PYR19308 T 425.85 33 15 071493 123149 38.24 21.78 5.6 10 PAT19302 L C 143.74 34 5.6 10 PAT19302 T 192.49 35 5.6 9 PAT29302 L C 164.20 36 5.6 9 PAT29302 T 388.57 37 16 050495 003411 40.54 23.63 5.3 26 POL19506 L A 143.17 38 5.3 26 POL19506 T 101.91 39 17 051395 084715 40.16 21.67 6.6 16 KOZ19501 L A 211.73 40 6.6 16 KOZ19501 T 137.38 41 18 051595 041357 40.07 21.67 5.1 13 CHR19513 L B 156.98 42 5.1 13 CHR19513 T 132.13
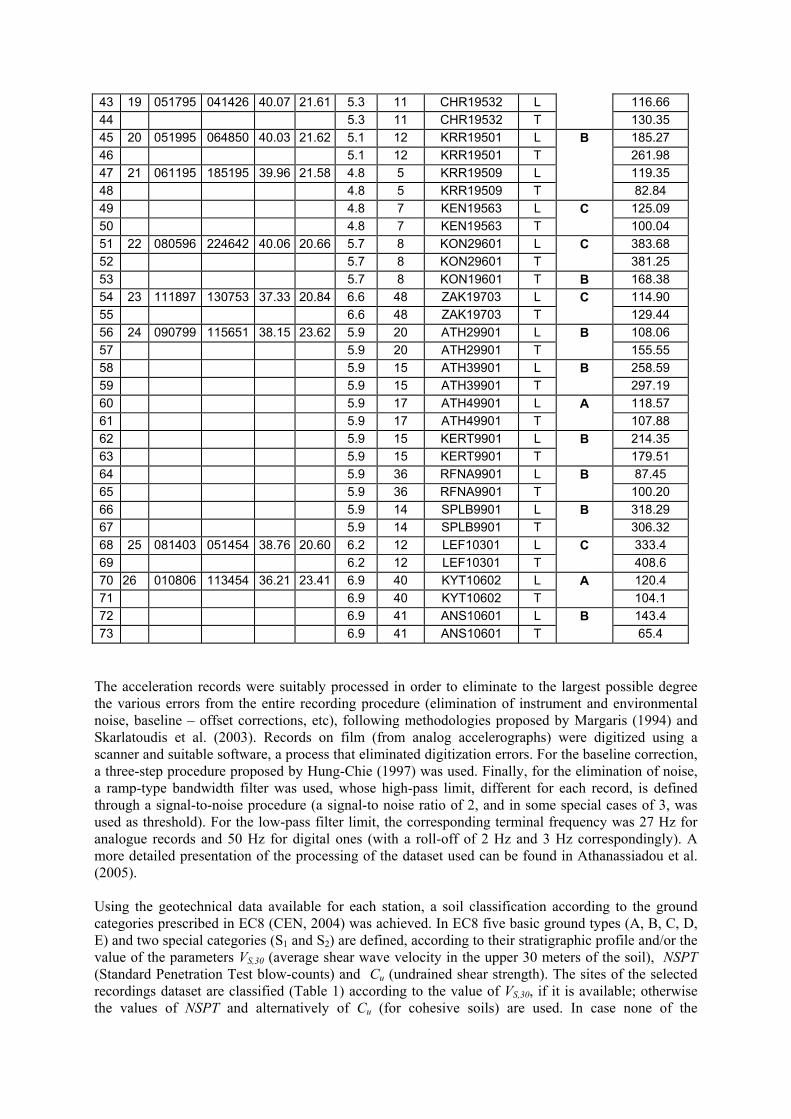
43 19 051795 041426 40.07 21.61 5.3 11 CHR19532 L 116.66 44 5.3 11 CHR19532 T 130.35 45 20 051995 064850 40.03 21.62 5.1 12 KRR19501 L B 185.27 46 5.1 12 KRR19501 T 261.98 47 21 061195 185195 39.96 21.58 4.8 5 KRR19509 L 119.35 48 4.8 5 KRR19509 T 82.84 49 4.8 7 KEN19563 L C 125.09 50 4.8 7 KEN19563 T 100.04 51 22 080596 224642 40.06 20.66 5.7 8 KON29601 L C 383.68 52 5.7 8 KON29601 T 381.25 53 5.7 8 KON19601 T B 168.38 54 23 111897 130753 37.33 20.84 6.6 48 ZAK19703 L C 114.90 55 6.6 48 ZAK19703 T 129.44 56 24 090799 115651 38.15 23.62 5.9 20 ATH29901 L B 108.06 57 5.9 20 ATH29901 T 155.55 58 5.9 15 ATH39901 L B 258.59 59 5.9 15 ATH39901 T 297.19 60 5.9 17 ATH49901 L A 118.57 61 5.9 17 ATH49901 T 107.88 62 5.9 15 KERT9901 L B 214.35 63 5.9 15 KERT9901 T 179.51 64 5.9 36 RFNA9901 L B 87.45 65 5.9 36 RFNA9901 T 100.20 66 5.9 14 SPLB9901 L B 318.29 67 5.9 14 SPLB9901 T 306.32 68 25 081403 051454 38.76 20.60 6.2 12 LEF10301 L C 333.4 69 6.2 12 LEF10301 T 408.6 70 26 010806 113454 36.21 23.41 6.9 40 KYT10602 L A 120.4 71 6.9 40 KYT10602 T 104.1 72 6.9 41 ANS10601 L B 143.4 73 6.9 41 ANS10601 T 65.4
The acceleration records were suitably processed in order to eliminate to the largest possible degree the various errors from the entire recording procedure (elimination of instrument and environmental noise, baseline – offset corrections, etc), following methodologies proposed by Margaris (1994) and Skarlatoudis et al. (2003). Records on film (from analog accelerographs) were digitized using a scanner and suitable software, a process that eliminated digitization errors. For the baseline correction, a three-step procedure proposed by Hung-Chie (1997) was used. Finally, for the elimination of noise, a ramp-type bandwidth filter was used, whose high-pass limit, different for each record, is defined through a signal-to-noise procedure (a signal-to noise ratio of 2, and in some special cases of 3, was used as threshold). For the low-pass filter limit, the corresponding terminal frequency was 27 Hz for analogue records and 50 Hz for digital ones (with a roll-off of 2 Hz and 3 Hz correspondingly). A more detailed presentation of the processing of the dataset used can be found in Athanassiadou et al. (2005). Using the geotechnical data available for each station, a soil classification according to the ground categories prescribed in EC8 (CEN, 2004) was achieved. In EC8 five basic ground types (A, B, C, D, E) and two special categories (S1 and S2) are defined, according to their stratigraphic profile and/or the value of the parameters VS,30 (average shear wave velocity in the upper 30 meters of the soil), NSPT (Standard Penetration Test blow-counts) and Cu (undrained shear strength). The sites of the selected recordings dataset are classified (Table 1) according to the value of VS,30, if it is available; otherwise the values of NSPT and alternatively of Cu (for cohesive soils) are used. In case none of the
aforementioned parameters (VS,30, NSPT, Cu) was available for the sites of recording stations, categorization was based on a qualitative description of the stratigraphic profile and information from the corresponding geological map (IGME maps, scale 1:50,000). The recording stations were classified in three ground types : A (rock, VS,30 >800m/s), B (very dense sand/gravel or very stiff clay, 360<VS,30≤800) and C (dense or medium dense sand/gravel or stiff clay, 180<VS,30≤360), as prescribed by EC8; no data were available for D or E sites, a situation common to that encountered in previous studies involving European records (Rey et al., 2002). For a more direct comparison with the EC8 provisions, Type 1 and Type 2 spectra were computed from the corresponding records (with surface-wave magnitude Ms >5.5 or ≤5, respectively). The 73 records of the database were classified as follows: (a) for Type 1 spectra, 6 records in ground category A, 18 records in ground category B and 18 records in ground category C (b) for Type 2 spectra, 6 records in ground category A, 15 records in ground category B and 10 records in ground category C . The derivation of spectra was made using the envelope of the two (L and T) records from each earthquake recorded at a station, rather than treating them as independent motions, an approach also followed in several previous studies (e.g. Rey et al., 2002). It should be noted that for soil category A the available records of the database are not enough in number to be deemed adequate for a statistically representative sample, so the results for either earthquake Type should be rather considered as giving a general trend of the expected spectral shapes that are to be expected. The availability of more recorded ground motions in the future will help in determining more representative results for the category A soil case. For the computation of spectra, the INELSP-2k program, developed at the Civil Engineering Department of the University of Thessaloniki (Kappos 1999), was used. The software was developed primarily for the computation of inelastic spectra, but can also be used for the computation of elastic ones. The spectra were evaluated for the period range 0.01 to 2.5 sec, using a smaller step (ΔΤ=0.025 sec) for shorter periods (T ≤ 0.5 sec), that gradually increases to ΔΤ=0.20 sec for Τ > 2.0 sec.
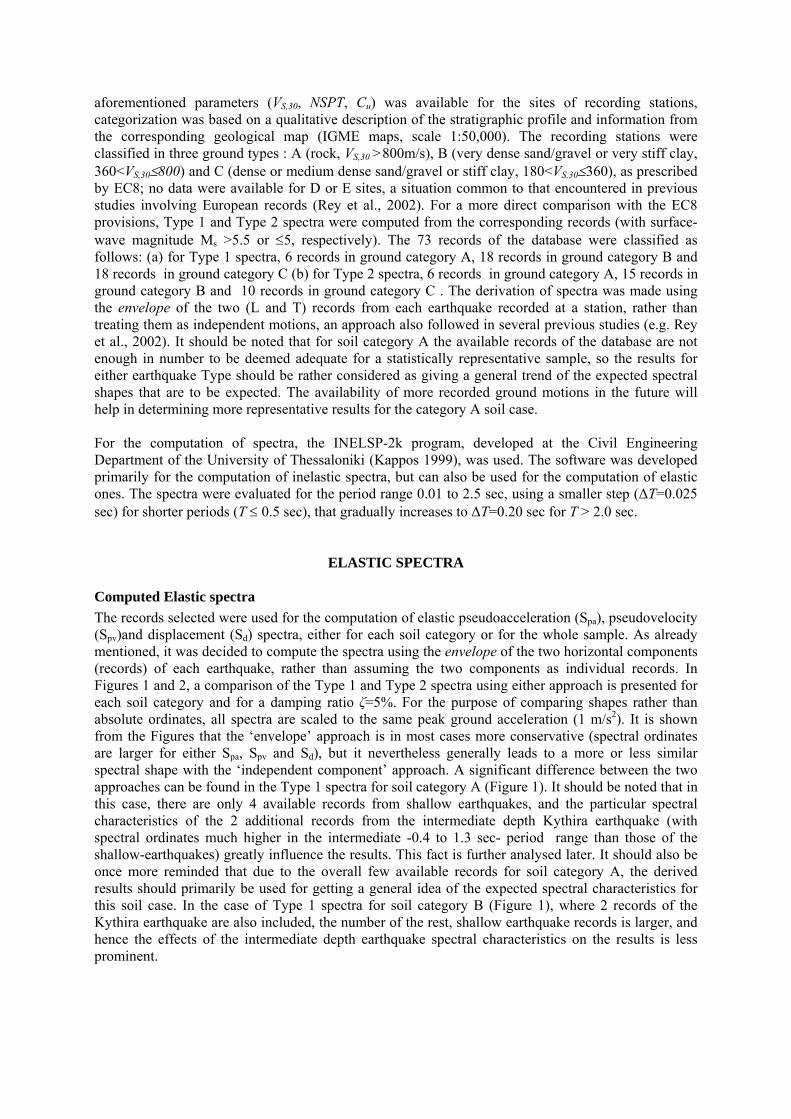
ELASTIC SPECTRA Computed Elastic spectra The records selected were used for the computation of elastic pseudoacceleration (Spa), pseudovelocity (Spv)and displacement (Sd) spectra, either for each soil category or for the whole sample. As already mentioned, it was decided to compute the spectra using the envelope of the two horizontal components (records) of each earthquake, rather than assuming the two components as individual records. In Figures 1 and 2, a comparison of the Type 1 and Type 2 spectra using either approach is presented for each soil category and for a damping ratio ζ=5%. For the purpose of comparing shapes rather than absolute ordinates, all spectra are scaled to the same peak ground acceleration (1 m/s2). It is shown from the Figures that the ‘envelope’ approach is in most cases more conservative (spectral ordinates are larger for either Spa, Spv and Sd), but it nevertheless generally leads to a more or less similar spectral shape with the ‘independent component’ approach. A significant difference between the two approaches can be found in the Type 1 spectra for soil category A (Figure 1). It should be noted that in this case, there are only 4 available records from shallow earthquakes, and the particular spectral characteristics of the 2 additional records from the intermediate depth Kythira earthquake (with spectral ordinates much higher in the intermediate -0.4 to 1.3 sec- period range than those of the shallow-earthquakes) greatly influence the results. This fact is further analysed later. It should also be once more reminded that due to the overall few available records for soil category A, the derived results should primarily be used for getting a general idea of the expected spectral characteristics for this soil case. In the case of Type 1 spectra for soil category B (Figure 1), where 2 records of the Kythira earthquake are also included, the number of the rest, shallow earthquake records is larger, and hence the effects of the intermediate depth earthquake spectral characteristics on the results is less prominent.
same PGA (ag = 1.0 m/sec2)
0,0
0,5
1,0
1,5
2,0
2,5
3,0
0,0 0,5 1,0 1,5 2,0 2,5
same PGA (ag = 1.0 m/sec2)
0,0
50,0
100,0
150,0
200,0
0,0 0,5 1,0 1,5 2,0 2,5T (sec)
S pv (
mm
/sec
)
T (sec)
S pa (
m/s
ec2 )
subsoil A: envelopesubsoil A: two comp.subsoil B: envelopesubsoil B: two comp.subsoil C: envelopesubsoil C: two comp.
ζ = 5%subsoil A: envelopsubsoil A: two comp.subsoil B: envelopsubsoil B: two comp.subsoil C: envelopsubsoil C: two comp.
ζ = 5%
(a) (b) same PGA (ag = 1.0 m/sec2)
0
10
20
30
40
0,0 0,5 1,0 1,5 2,0 2,5T (sec)
S d (m
m)
subsoil A: envelopesubsoil A: two comp.subsoil B: envelopesubsoil B: two comp.subsoil C: two comp.subsoil C: EC8 - type 1
ζ = 5%
(c) Figure 1. Type 1 elastic spectra : ‘envelope’ vs. ‘independent components’ approach
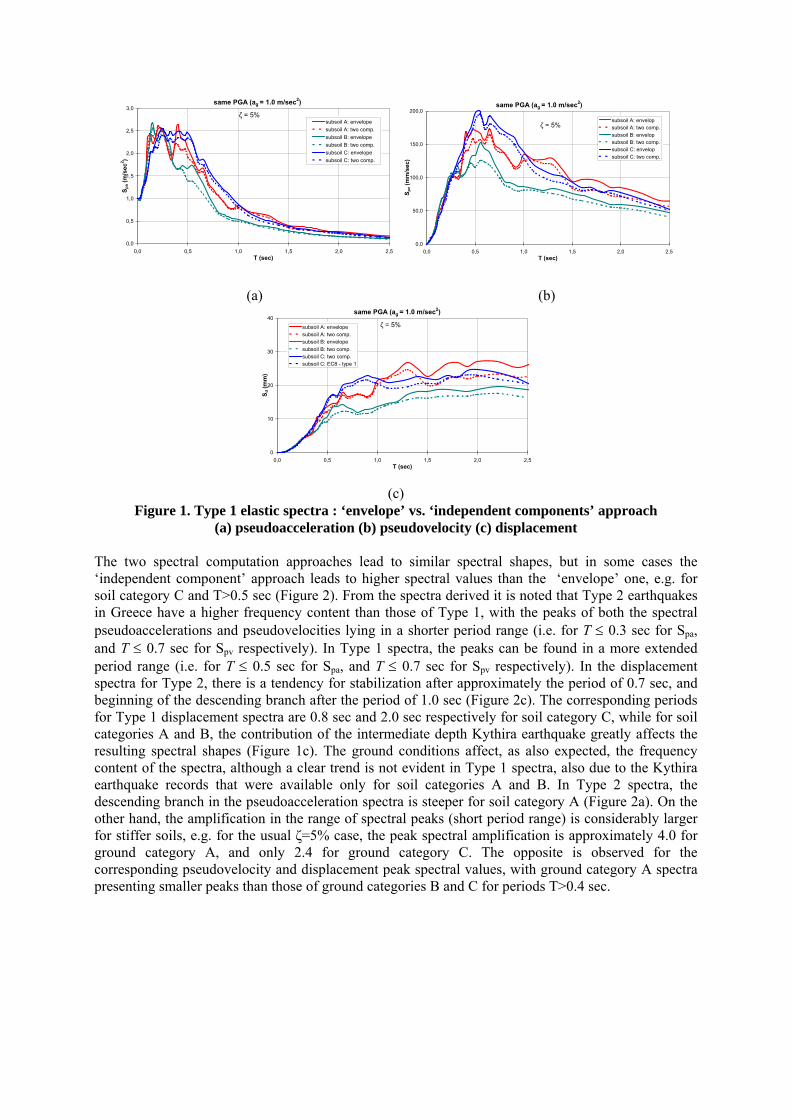
(a) pseudoacceleration (b) pseudovelocity (c) displacement The two spectral computation approaches lead to similar spectral shapes, but in some cases the ‘independent component’ approach leads to higher spectral values than the ‘envelope’ one, e.g. for soil category C and T>0.5 sec (Figure 2). From the spectra derived it is noted that Type 2 earthquakes in Greece have a higher frequency content than those of Type 1, with the peaks of both the spectral pseudoaccelerations and pseudovelocities lying in a shorter period range (i.e. for T ≤ 0.3 sec for Spa, and T ≤ 0.7 sec for Spv respectively). In Type 1 spectra, the peaks can be found in a more extended period range (i.e. for T ≤ 0.5 sec for Spa, and T ≤ 0.7 sec for Spv respectively). In the displacement spectra for Type 2, there is a tendency for stabilization after approximately the period of 0.7 sec, and beginning of the descending branch after the period of 1.0 sec (Figure 2c). The corresponding periods for Type 1 displacement spectra are 0.8 sec and 2.0 sec respectively for soil category C, while for soil categories A and B, the contribution of the intermediate depth Kythira earthquake greatly affects the resulting spectral shapes (Figure 1c). The ground conditions affect, as also expected, the frequency content of the spectra, although a clear trend is not evident in Type 1 spectra, also due to the Kythira earthquake records that were available only for soil categories A and B. In Type 2 spectra, the descending branch in the pseudoacceleration spectra is steeper for soil category A (Figure 2a). On the other hand, the amplification in the range of spectral peaks (short period range) is considerably larger for stiffer soils, e.g. for the usual ζ=5% case, the peak spectral amplification is approximately 4.0 for ground category A, and only 2.4 for ground category C. The opposite is observed for the corresponding pseudovelocity and displacement peak spectral values, with ground category A spectra presenting smaller peaks than those of ground categories B and C for periods T>0.4 sec.
same PGA (ag = 1.0m/sec2)
0,0
0,5
1,0
1,5
2,0
2,5
3,0
3,5
4,0
0,0 0,5 1,0 1,5 2,0 2,5T (sec)
S pa (
m/s
ec2 )
subsoil A: envelopsubsoil A: two comp.subsoil B: envelopsubsoil B: two comp.subsoil C: envelopsubsoil C: two comp.
ζ = 5%
same PGA (ag = 1.0 m/sec2)
0,0
20,0
40,0
60,0
80,0
100,0
120,0
140,0
0,0 0,5 1,0 1,5 2,0 2,5T (sec)
S pv (
mm
/sec
)
subsoil A: envelopesubsoil A: two comp.subsoil B: envelopesubsoil B: two comp.subsoil C: envelopesubsoil C: two comp.
ζ = 5%
(a) (b)
same PGA (ag = 1.0 m/sec2)
0
5
10
15
20
0,0 0,5 1,0 1,5 2,0 2T (sec)
S d (m
m)
,5
subsoil A: envelopesubsoil A: two comp.subsoil B: envelopesubsoil B: two comp.subsoil C: envelopesubsoil C: two comp.
ζ = 5%
(c)
Figure 2. Type 2 elastic spectra : ‘envelope’ vs. ‘independent components’ approach (a) pseudoacceleration (b) pseudovelocity (c) displacement
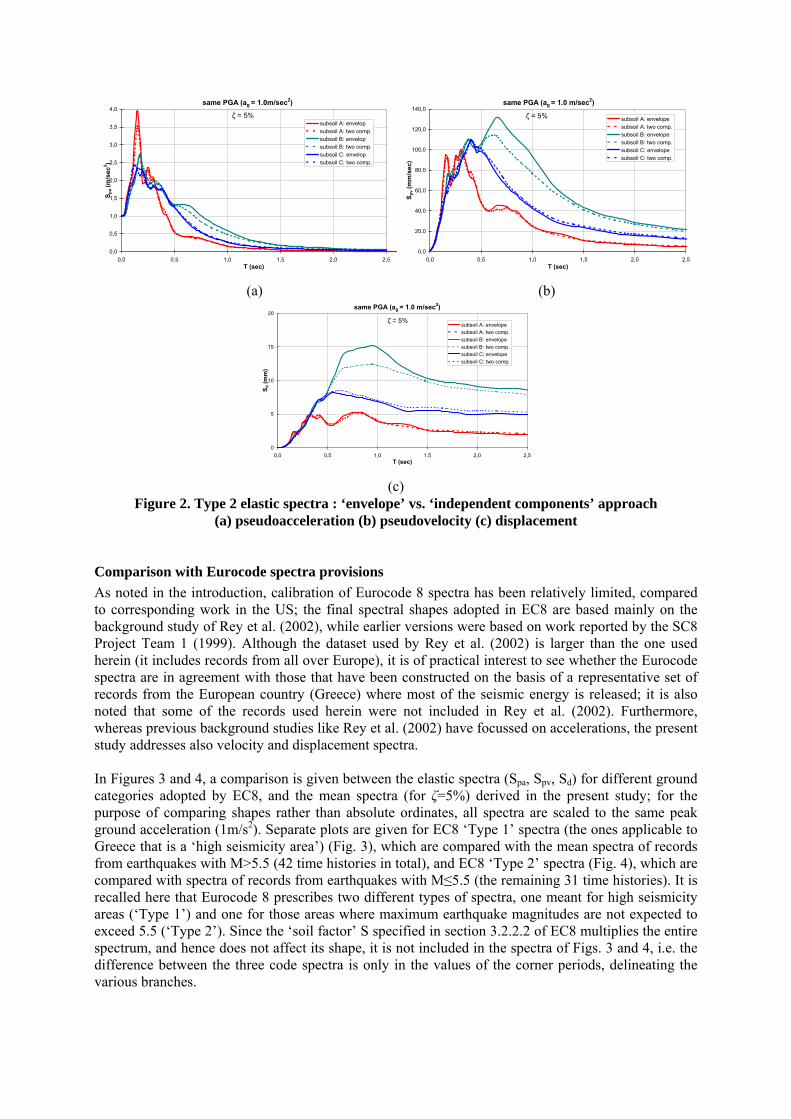
Comparison with Eurocode spectra provisions As noted in the introduction, calibration of Eurocode 8 spectra has been relatively limited, compared to corresponding work in the US; the final spectral shapes adopted in EC8 are based mainly on the background study of Rey et al. (2002), while earlier versions were based on work reported by the SC8 Project Team 1 (1999). Although the dataset used by Rey et al. (2002) is larger than the one used herein (it includes records from all over Europe), it is of practical interest to see whether the Eurocode spectra are in agreement with those that have been constructed on the basis of a representative set of records from the European country (Greece) where most of the seismic energy is released; it is also noted that some of the records used herein were not included in Rey et al. (2002). Furthermore, whereas previous background studies like Rey et al. (2002) have focussed on accelerations, the present study addresses also velocity and displacement spectra. In Figures 3 and 4, a comparison is given between the elastic spectra (Spa, Spv, Sd) for different ground categories adopted by EC8, and the mean spectra (for ζ=5%) derived in the present study; for the purpose of comparing shapes rather than absolute ordinates, all spectra are scaled to the same peak ground acceleration (1m/s2). Separate plots are given for EC8 ‘Type 1’ spectra (the ones applicable to Greece that is a ‘high seismicity area’) (Fig. 3), which are compared with the mean spectra of records from earthquakes with M>5.5 (42 time histories in total), and EC8 ‘Type 2’ spectra (Fig. 4), which are compared with spectra of records from earthquakes with M≤5.5 (the remaining 31 time histories). It is recalled here that Eurocode 8 prescribes two different types of spectra, one meant for high seismicity areas (‘Type 1’) and one for those areas where maximum earthquake magnitudes are not expected to exceed 5.5 (‘Type 2’). Since the ‘soil factor’ S specified in section 3.2.2.2 of EC8 multiplies the entire spectrum, and hence does not affect its shape, it is not included in the spectra of Figs. 3 and 4, i.e. the difference between the three code spectra is only in the values of the corner periods, delineating the various branches.
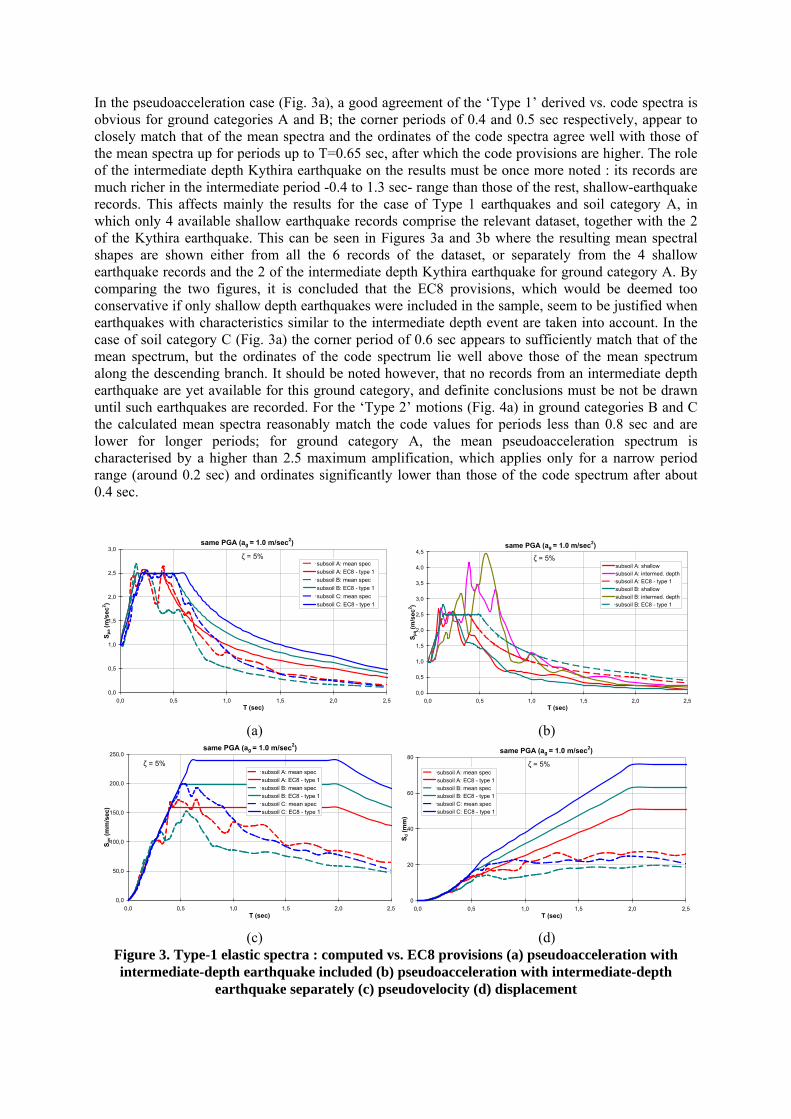
In the pseudoacceleration case (Fig. 3a), a good agreement of the ‘Type 1’ derived vs. code spectra is obvious for ground categories A and B; the corner periods of 0.4 and 0.5 sec respectively, appear to closely match that of the mean spectra and the ordinates of the code spectra agree well with those of the mean spectra up for periods up to T=0.65 sec, after which the code provisions are higher. The role of the intermediate depth Kythira earthquake on the results must be once more noted : its records are much richer in the intermediate period -0.4 to 1.3 sec- range than those of the rest, shallow-earthquake records. This affects mainly the results for the case of Type 1 earthquakes and soil category A, in which only 4 available shallow earthquake records comprise the relevant dataset, together with the 2 of the Kythira earthquake. This can be seen in Figures 3a and 3b where the resulting mean spectral shapes are shown either from all the 6 records of the dataset, or separately from the 4 shallow earthquake records and the 2 of the intermediate depth Kythira earthquake for ground category A. By comparing the two figures, it is concluded that the EC8 provisions, which would be deemed too conservative if only shallow depth earthquakes were included in the sample, seem to be justified when earthquakes with characteristics similar to the intermediate depth event are taken into account. In the case of soil category C (Fig. 3a) the corner period of 0.6 sec appears to sufficiently match that of the mean spectrum, but the ordinates of the code spectrum lie well above those of the mean spectrum along the descending branch. It should be noted however, that no records from an intermediate depth earthquake are yet available for this ground category, and definite conclusions must be not be drawn until such earthquakes are recorded. For the ‘Type 2’ motions (Fig. 4a) in ground categories B and C the calculated mean spectra reasonably match the code values for periods less than 0.8 sec and are lower for longer periods; for ground category A, the mean pseudoacceleration spectrum is characterised by a higher than 2.5 maximum amplification, which applies only for a narrow period range (around 0.2 sec) and ordinates significantly lower than those of the code spectrum after about 0.4 sec.
same PGA (ag = 1.0 m/sec2)
0,0
0,5
1,0
1,5
2,0
2,5
3,0
0,0 0,5 1,0 1,5 2,0 2,5T (sec)
S pa (
m/s
ec2 )
subsoil A: mean specsubsoil A: EC8 - type 1subsoil B: mean specsubsoil B: EC8 - type 1subsoil C: mean specsubsoil C: EC8 - type 1
ζ = 5%
same PGA (ag = 1.0 m/sec2)
0,0
0,5
1,0
1,5
2,0
2,5
3,0
3,5
4,0
4,5
0,0 0,5 1,0 1,5 2,0 2T (sec)
S pa (
m/s
ec2 )
,5
subsoil A: shallowsubsoil A: intermed. depthsubsoil A: EC8 - type 1subsoil B: shallowsubsoil B: intermed. depthsubsoil B: EC8 - type 1
ζ = 5%
(a) (b)
same PGA (ag = 1.0 m/sec2)
0,0
50,0
100,0
150,0
200,0
250,0
0,0 0,5 1,0 1,5 2,0 2,5T (sec)
S pv (
mm
/sec
)
subsoil A: mean specsubsoil A: EC8 - type 1subsoil B: mean specsubsoil B: EC8 - type 1subsoil C: mean specsubsoil C: EC8 - type 1
ζ = 5%
same PGA (ag = 1.0 m/sec2)
0
20
40
60
80
0,0 0,5 1,0 1,5 2,0 2,5T (sec)
S d (m
m)
subsoil A: mean specsubsoil A: EC8 - type 1subsoil B: mean specsubsoil B: EC8 - type 1subsoil C: mean specsubsoil C: EC8 - type 1
ζ = 5%
(c) (d)
Figure 3. Type-1 elastic spectra : computed vs. EC8 provisions (a) pseudoacceleration with intermediate-depth earthquake included (b) pseudoacceleration with intermediate-depth
earthquake separately (c) pseudovelocity (d) displacement
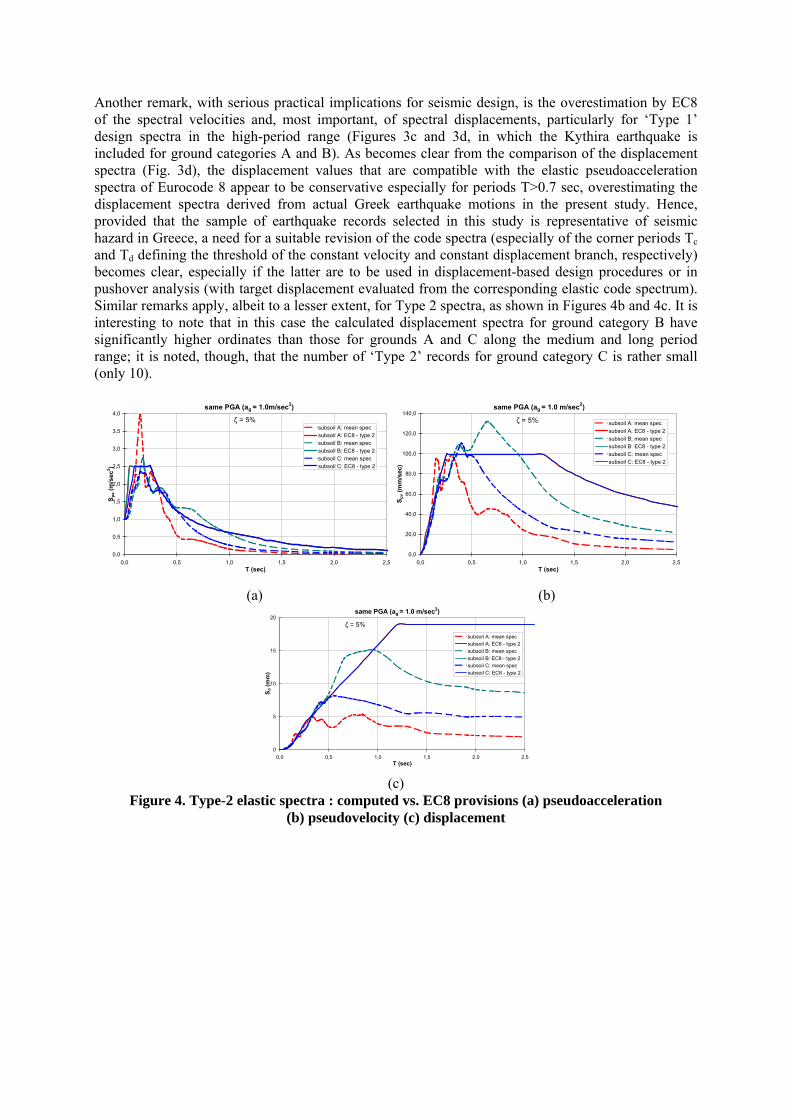
Another remark, with serious practical implications for seismic design, is the overestimation by EC8 of the spectral velocities and, most important, of spectral displacements, particularly for ‘Type 1’ design spectra in the high-period range (Figures 3c and 3d, in which the Kythira earthquake is included for ground categories A and B). As becomes clear from the comparison of the displacement spectra (Fig. 3d), the displacement values that are compatible with the elastic pseudoacceleration spectra of Eurocode 8 appear to be conservative especially for periods T>0.7 sec, overestimating the displacement spectra derived from actual Greek earthquake motions in the present study. Hence, provided that the sample of earthquake records selected in this study is representative of seismic hazard in Greece, a need for a suitable revision of the code spectra (especially of the corner periods Tc and Td defining the threshold of the constant velocity and constant displacement branch, respectively) becomes clear, especially if the latter are to be used in displacement-based design procedures or in pushover analysis (with target displacement evaluated from the corresponding elastic code spectrum). Similar remarks apply, albeit to a lesser extent, for Type 2 spectra, as shown in Figures 4b and 4c. It is interesting to note that in this case the calculated displacement spectra for ground category B have significantly higher ordinates than those for grounds A and C along the medium and long period range; it is noted, though, that the number of ‘Type 2’ records for ground category C is rather small (only 10).
same PGA (ag = 1.0m/sec2)
0,0
0,5
1,0
1,5
2,0
2,5
3,0
3,5
4,0
0,0 0,5 1,0 1,5 2,0 2,5T (sec)
S pa (
m/s
ec2 )
subsoil A: mean specsubsoil A: EC8 - type 2subsoil B: mean specsubsoil B: EC8 - type 2subsoil C: mean specsubsoil C: EC8 - type 2
ζ = 5%
same PGA (ag = 1.0 m/sec2)
0,0
20,0
40,0
60,0
80,0
100,0
120,0
140,0
0,0 0,5 1,0 1,5 2,0 2,5T (sec)
S pv (
mm
/sec
)
subsoil A: mean specsubsoil A: EC8 - type 2subsoil B: mean specsubsoil B: EC8 - type 2subsoil C: mean specsubsoil C: EC8 - type 2
ζ = 5%
(a) (b)
same PGA (ag = 1.0 m/sec2)
0
5
10
15
20
0,0 0,5 1,0 1,5 2,0 2,5T (sec)
S d (m
m)
subsoil A: mean specsubsoil A: EC8 - type 2subsoil B: mean specsubsoil B: EC8 - type 2subsoil C: mean specsubsoil C: EC8 - type 2
ζ = 5%
(c)
Figure 4. Type-2 elastic spectra : computed vs. EC8 provisions (a) pseudoacceleration (b) pseudovelocity (c) displacement
INELASTIC SPECTRA
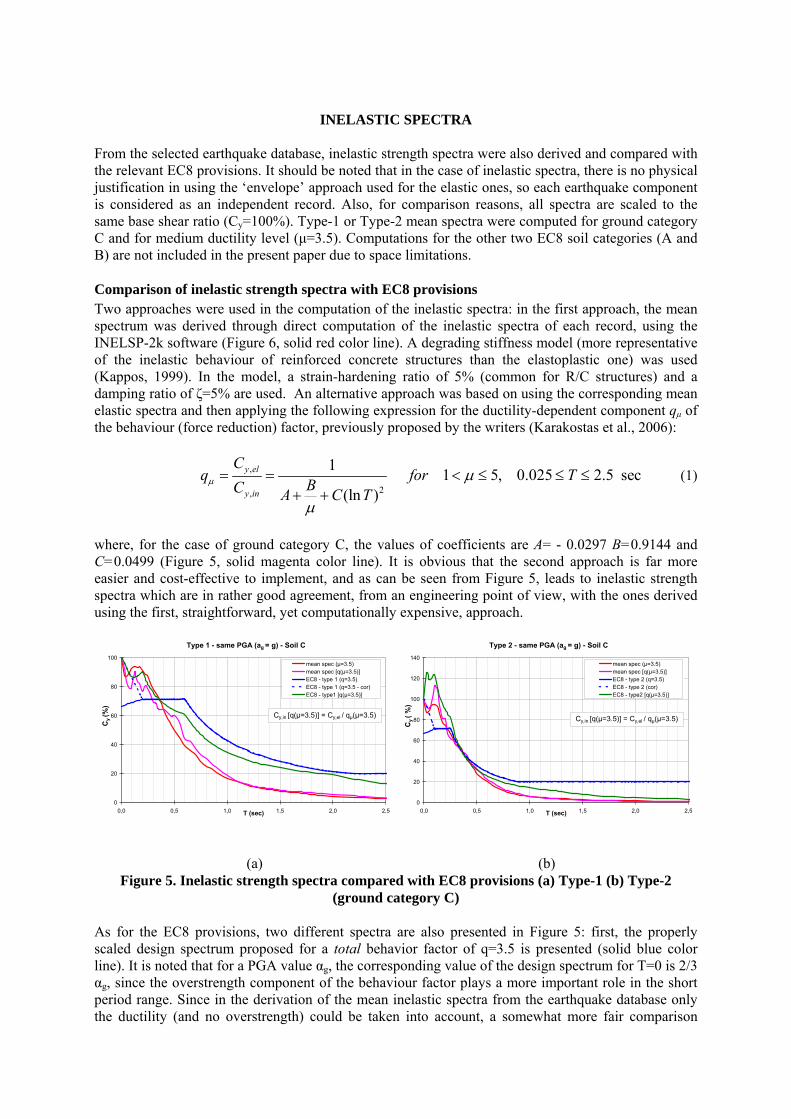
From the selected earthquake database, inelastic strength spectra were also derived and compared with the relevant EC8 provisions. It should be noted that in the case of inelastic spectra, there is no physical justification in using the ‘envelope’ approach used for the elastic ones, so each earthquake component is considered as an independent record. Also, for comparison reasons, all spectra are scaled to the same base shear ratio (Cy=100%). Type-1 or Type-2 mean spectra were computed for ground category C and for medium ductility level (μ=3.5). Computations for the other two EC8 soil categories (A and B) are not included in the present paper due to space limitations. Comparison of inelastic strength spectra with EC8 provisions Two approaches were used in the computation of the inelastic spectra: in the first approach, the mean spectrum was derived through direct computation of the inelastic spectra of each record, using the INELSP-2k software (Figure 6, solid red color line). A degrading stiffness model (more representative of the inelastic behaviour of reinforced concrete structures than the elastoplastic one) was used (Kappos, 1999). In the model, a strain-hardening ratio of 5% (common for R/C structures) and a damping ratio of ζ=5% are used. An alternative approach was based on using the corresponding mean elastic spectra and then applying the following expression for the ductility-dependent component qμ of the behaviour (force reduction) factor, previously proposed by the writers (Karakostas et al., 2006):
,
2,
1 1 5, 0.025 2.5 sec(ln )
y el
y in
Cq forBC A C Tμ μ
μ
= = < ≤ ≤ ≤+ +
T (1)
where, for the case of ground category C, the values of coefficients are A= - 0.0297 B=0.9144 and C=0.0499 (Figure 5, solid magenta color line). It is obvious that the second approach is far more easier and cost-effective to implement, and as can be seen from Figure 5, leads to inelastic strength spectra which are in rather good agreement, from an engineering point of view, with the ones derived using the first, straightforward, yet computationally expensive, approach.
Type 1 - same PGA (ag = g) - Soil C
0
20
40
60
80
100
0,0 0,5 1,0 1,5 2,0 2,5T (sec)
Cy (%
)
mean spec (μ=3.5)mean spec [q(μ=3.5)]EC8 - type 1 (q=3.5)EC8 - type 1 (q=3.5 - cor)EC8 - type1 [q(μ=3.5)]
Cy,in [q(μ=3.5)] = Cy,el / qμ(μ=3.5)
Type 2 - same PGA (ag = g) - Soil C
0
20
40
60
80
100
120
140
0,0 0,5 1,0 1,5 2,0 2,5T (sec)
Cy ( %
)
mean spec (μ=3.5)mean spec [q(μ=3.5)]EC8 - type 2 (q=3.5)EC8 - type 2 (cor)EC8 - type2 [q(μ=3.5)]
Cy,in [q(μ=3.5)] = Cy,el / qμ(μ=3.5)
(a) (b) Figure 5. Inelastic strength spectra compared with EC8 provisions (a) Type-1 (b) Type-2
(ground category C) As for the EC8 provisions, two different spectra are also presented in Figure 5: first, the properly scaled design spectrum proposed for a total behavior factor of q=3.5 is presented (solid blue color line). It is noted that for a PGA value αg, the corresponding value of the design spectrum for T=0 is 2/3 αg, since the overstrength component of the behaviour factor plays a more important role in the short period range. Since in the derivation of the mean inelastic spectra from the earthquake database only the ductility (and no overstrength) could be taken into account, a somewhat more fair comparison
would be with the first branch of the spectrum adjusted to give PGA= ag for T=0 (dotted blue line). Another EC8 compatible design spectrum was derived using the elastic design spectrum proposed by EC8 in conjunction with the proposed expression of equation (1) for the ductility-dependent component qμ (i.e. in a manner similar to the aforementioned second approach in the construction of the mean inelastic spectrum) (solid green colour line in Figure 5). It can be seen from Figure 5 that for ground category C, the EC8 design spectrum has greater ordinates than those of the derived inelastic spectra only for T>0.35 sec for Type-1 and T>0.25 sec for Type-2 spectra, and, especially in the Type-1 case, quickly becomes very conservative after these periods. On the contrary, for shorter periods the EC8 design spectrum seems to significantly underestimate the respective mean spectra derived from the Greek earthquake sample. This holds in general true even when the aforementioned correction of the spectral shape due to exclusion of the overstrength factor in the 0≤T ≤TB period range is taken into account; of course the overstrength component of the q-factor also affects the second branch of the spectrum (Kappos, 1999). On the other hand, the second EC8 compatible design spectrum (derived using the proposed q
B
μ expression from the elastic one) seems to better agree with the derived mean inelastic spectra for almost the entire period range and in both the Type-1 and Type-2 case; this is expected since in this case, no overstrength effects are taken directly or indirectly into account.
CONCLUSIONS
The computation of mean elastic spectra using the envelope of the spectra of the two horizontal components (records) of each earthquake, rather than treating the two components as individual records seems to lead in most cases to more conservative results (i.e. to higher spectral ordinates). However, both approaches generally lead to to more or less similar spectral shapes. The inclusion of the intermediate-depth Kythira earthquake in the same set as the shallow-depth earthquakes, significantly affects the resulting spectral shapes in the intermediate (0.4 to 1.3 sec) period range. Comparisons with the EC8 elastic response Type-1 spectra shows a satisfactory agreement for pseudoaccelerations, and an overestimation by EC8 of the spectral velocities and, most important, of spectral displacements. For Type-2 elastic spectra, EC8 seems to generally agree with the mean spectral accelerations, velocities and displacements derived from the Greek earthquake dataset. In the computation of inelastic strength spectra, an alternative, cost-effective procedure that makes use of an analytical expression for the ductility-dependent component of the behaviour factor leads to spectral shapes similar to that of their ‘standard’ computation. Differences between the EC8 design spectrum and the mean inelastic strength spectrum for soil category C derived from the earthquake sample should at least partly be attributed to the inclusion of overstrength effects in the EC8-specified behaviour factor.
AKNOWLEDGEMENTS The writers would like to thank the Greek Earthquake Planning and Protection Organization (OASP) for its support to the research reported herein through a grant (2000-2002); the conclusions presented herein do not necessarily reflect the views of the funding Organization. The writers also gratefully acknowledge the contribution of ITSAK researchers Drs. N. Theodulidis and B. Margaris to the selection and processing of the records used in this study, and the contribution of ITSAK researcher Dr N. Klimis to the classification of the recording stations according to Eurocode 8 criteria.
REFERENCES Applied Technology Council. ATC-40: Seismic evaluation and retrofit of concrete buildings. Rep.
SSC 96-01, CSSC-ATC, Redwood City, Calif., 1996. Athanassiadou, C., Kappos, A., Karakostas, C., Klimis, N., Lekidis, V., Margaris, V., and
Theodulidis, N. “Elastic and inelastic spectra for Greek earthquakes, based on a representative set of records”. Proceedings of the 5th International Conference on Earthquake Resistant Structures (ERES2005), Skiathos, Greece, 733-743, 2005.
CEN (Comité Européen de Normalisation). Eurocode 8: Design of structures for earthquake resistance – Part 1: General rules, seismic actions and rules for buildings (EN 1998-1). Brussels, May 2004.
FEMA. Improvement of nonlinear static seismic analysis procedures (FEMA-440/ATC-55). FEMA-NEHRP, 390 p., 2005
Hung-Chie Ch. “Stable baseline correction of digital strong motion data”. Bulletin of Seismological Society of America, 87, 932-944, 1997.
Kappos, A.J. “Evaluation of behaviour factors on the basis of ductility and overstrength studies”. Engineering Structures, 21, issue 9, 823-835, 1999.
Kappos, A.J. (editor). Dynamic Loading and Design of Structures. London: SPON Press (Taylor & Francis Group), 2001.
Kappos A.J. and Kyriakakis, P. “A reevaluation of scaling techniques for natural records”. Soil Dynamics & Earthquake Engineering, 20, 111-123, 2000.
Karakostas, C.Z., Athanasiadou, C.J., Kappos A.J. and Lekidis, V.A. “Site-dependant design spectra and strength modification factors based on records in Greece”. Submitted for publication to Soil Dynamics & Earthquake Engineering, 2006.
Margaris, B.N. “New fast digitization and correction procedures of the Greek strong motion records”. Proceedings of XXIV Gen. Ass. Eur. Seism. Com., Athens, Greece, II, 779-786, 1994.
Miranda, E. “Inelastic displacement ratios for structures on firm sites”. Journal of Structural Engineering, ASCE, 126, issue 10, 1150-1159, 2000.
Mori A. and Crouse C. “Strong motion data from Japanese earthquakes”. World Data Center for Solid Earth Geopthysics, Report. SE-29, 1981.
Nau, J.M. and Hall, W.F. “Scaling methods for earthquake response spectra”. Journal of Structural Engineering, ASCE, 110, issue 7, 1533-1548, 1984.
Papazachos B. “Large seismic faults in the Hellenic arc”. Annali di Geofisica, 39, 891-903, 1996. Pousse, G., et al. “Eurocode 8 design response spectra evaluation using the K-net japanese database”.
Journal of Earthquake Engineering, 9, issue 4, 547–574, 2005. Priestley, M.J.N. “Performance based seismic design”. Bulletin of the New Zealand Society for
Earthquake Engineering, 33, issue 3, 325-346, 2000. Rey, J., Faccioli, E. and Bommer, J.J. “Derivation of design soil coefficients (S) and response spectral
shapes for Eurocode 8 using the European Strong-Motion Database”. Journal of Seismology, 6, issue 4, 547–555, 2002.
SC8 Project Team 1 (C.S. Oliveira, convenor). Commentaries on Proposed Amendments to Eurocode 8 - Part 1-1. Unpublished Report, Dec. 1999.
Skarlatoudis, A.A., Papazachos, C.B., & Margaris, B.N. “Determination of noise spectra from strong motion data recorded in Greece”. J. Seismology, 7, 533-540, 2003.
Theodulidis N. “Strong motion simulation of large intermediate depth earthquakes in SE Europe”. CD-ROM Proccedings of the 12th ECEE, paper no. 668.Vancouver, Canada, 2002.