Embed Size (px)
Citation preview

Calibration of Fast Response Differential Mobility Spectrometers
Jon Symonds
Cambustion Ltd, Cambridge, UK
Contents
• Introduction to fast response Differential Mobility Spectrometers (with reference to Cambustion DMS series)
• Data Processing and Data Inversion
• Size and Number Calibration of the Charging & Classification System
• Morphological Effects
• Calibration for Mass Measurement
• Sampling and Dilution Systems
• Traceability and Uncertainty

The Need for Fast Response•Aerosols can change rapidly, SMPS scan can take 2 minutes.•Fast response electrical mobility analysers:
� Electrical Aerosol Spectrometer, Tartu University / Airel Ltd� Cambustion DMS500� TSI EEPS� TSI FMPS� Cambustion DMS50
• DMS Series and EEPS especially aimed at measuring engine exhaust aerosols� Adoption of such systems by automotive researchers ⇒ “order of magnitude accuracy” no longer good enough
• But… all such instruments currently compromise on sensitivity and spectral resolution over SMPS systems
This paper uses the DMS series an example. Both these instruments are available with integrated sampling and dilution systems, so this paper considers the ‘whole picture’ of calibration.
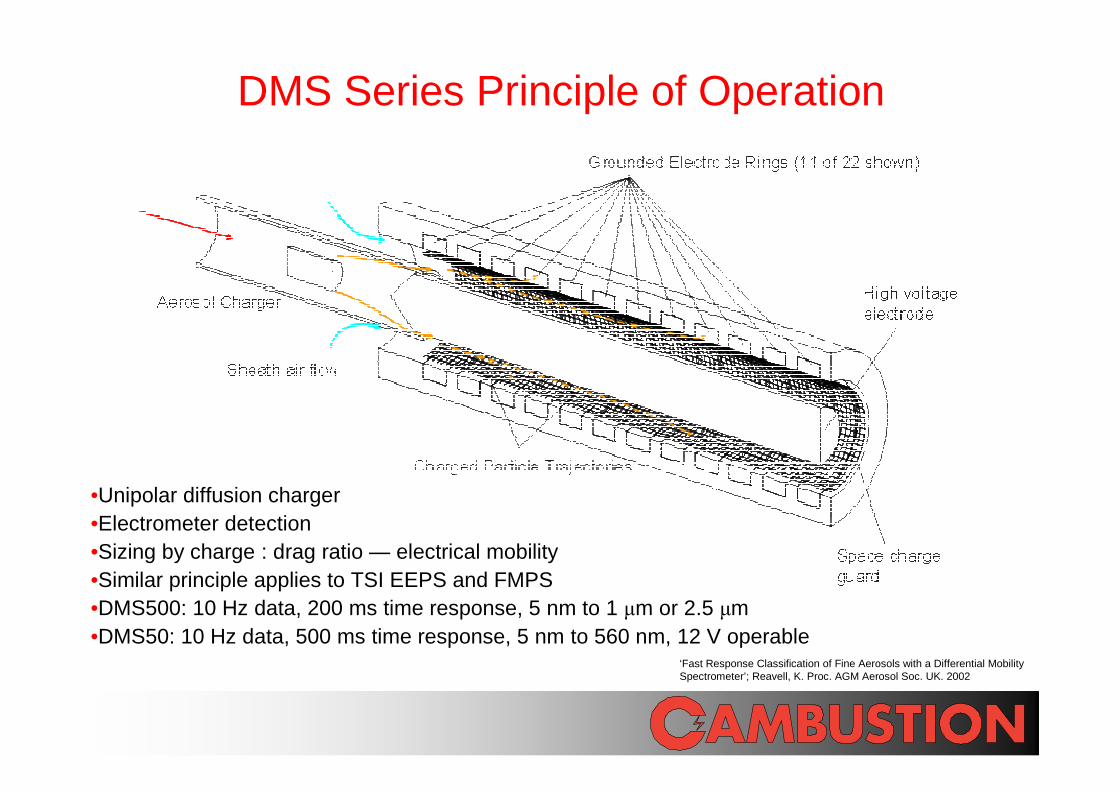
DMS Series Principle of Operation
•Unipolar diffusion charger•Electrometer detection•Sizing by charge : drag ratio — electrical mobility•Similar principle applies to TSI EEPS and FMPS•DMS500: 10 Hz data, 200 ms time response, 5 nm to 1 µm or 2.5 µm •DMS50: 10 Hz data, 500 ms time response, 5 nm to 560 nm, 12 V operable
‘Fast Response Classification of Fine Aerosols with a Differential Mobility Spectrometer’; Reavell, K. Proc. AGM Aerosol Soc. UK. 2002
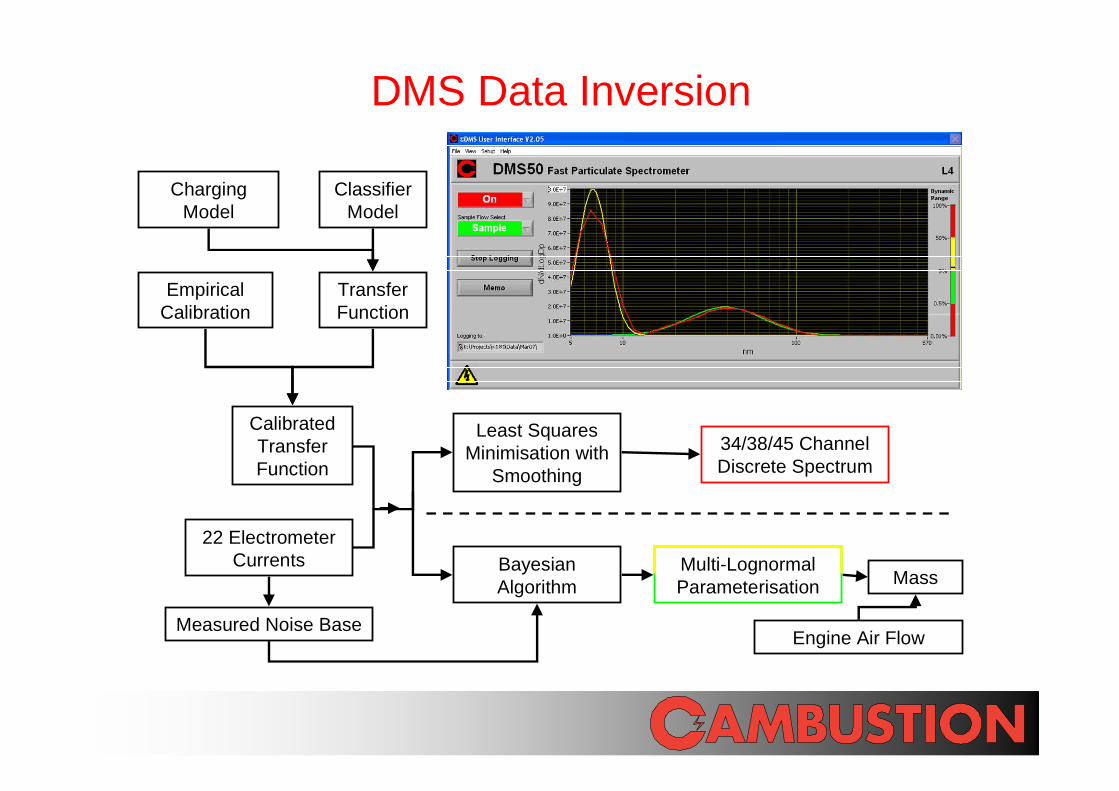
DMS Data Inversion
22 Electrometer Currents
Charging Model
Classifier Model
Transfer Function
Empirical Calibration
Calibrated Transfer Function
Least Squares Minimisation with
Smoothing
34/38/45 Channel Discrete Spectrum
Bayesian Algorithm
Multi-Lognormal Parameterisation
Measured Noise Base
Mass
Engine Air Flow
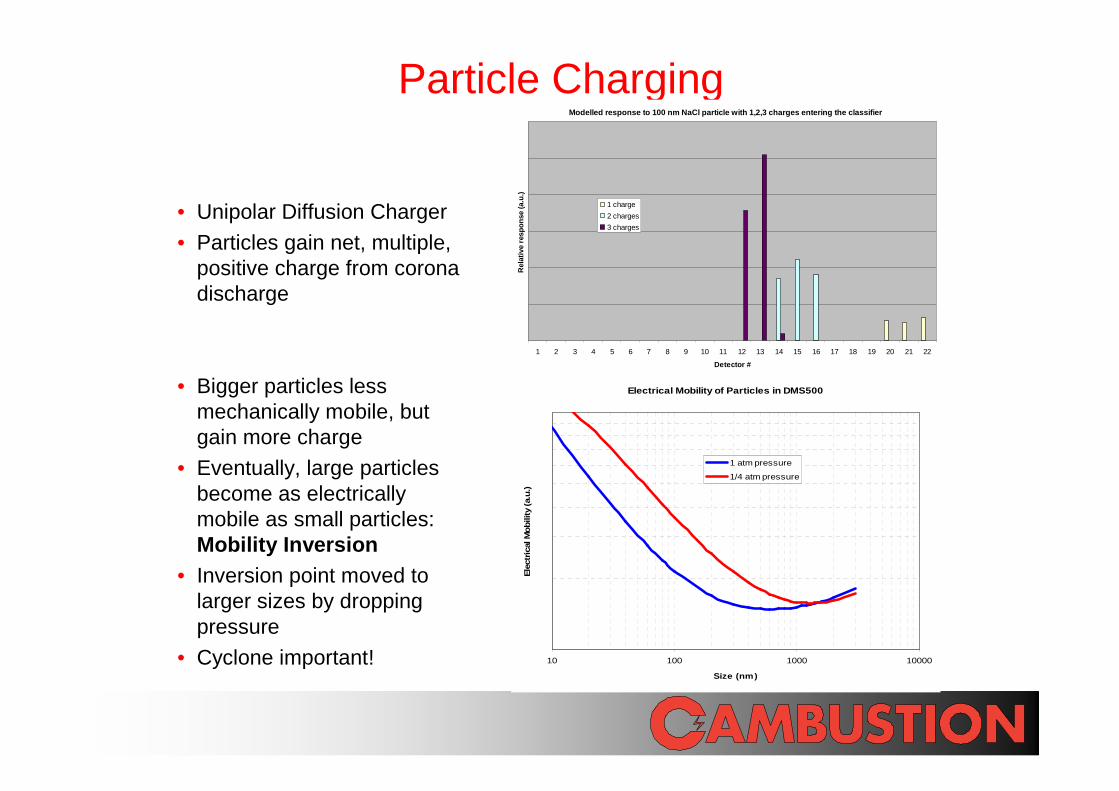
Particle Charging
• Unipolar Diffusion Charger
• Particles gain net, multiple, positive charge from corona discharge
• Bigger particles less mechanically mobile, but gain more charge
• Eventually, large particles become as electrically mobile as small particles: Mobility Inversion
• Inversion point moved to larger sizes by dropping pressure
• Cyclone important!
Modelled response to 100 nm NaCl particle with 1,2, 3 charges entering the classifier
1 2 3 4 5 6 7 8 9 10 11 12 13 14 15 16 17 18 19 20 21 22
Detector #
Rel
ativ
e re
spon
se (a
.u.)
1 charge
2 charges
3 charges
Electrical Mobility of Particles in DMS500
10 100 1000 10000
Size (nm)
Ele
ctric
al M
obility
(a.
u.)
1 atm pressure
1/4 atm pressure
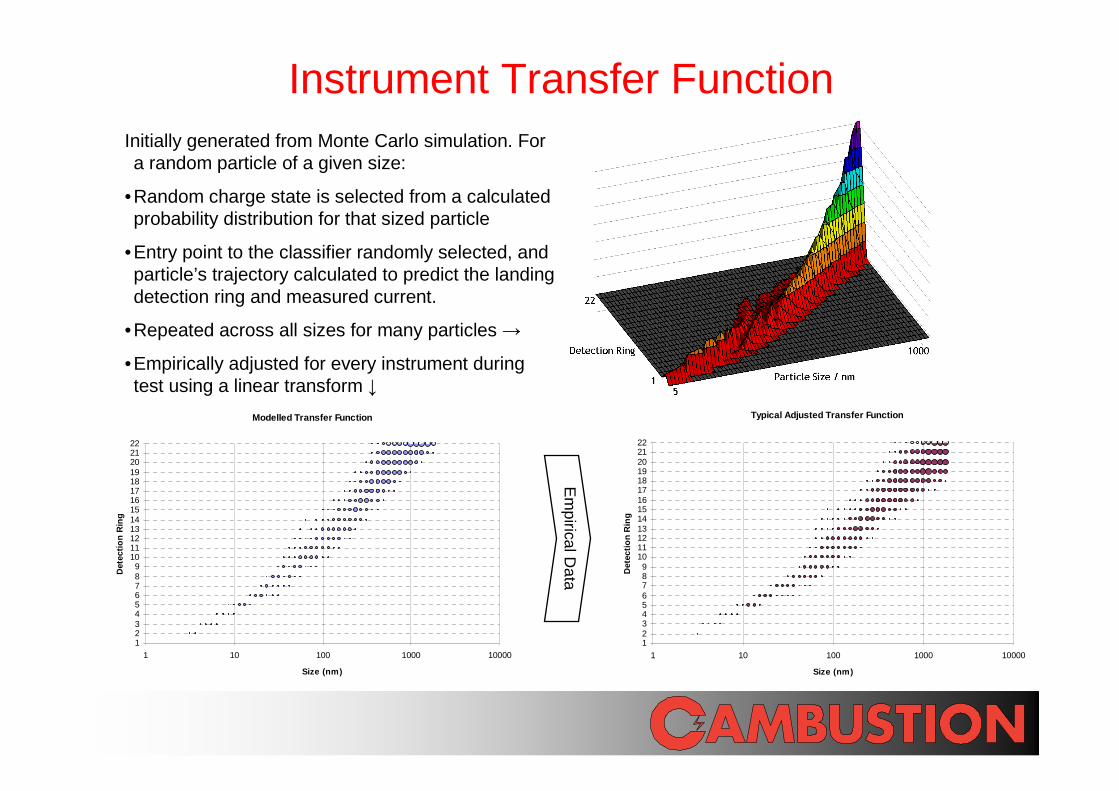
Instrument Transfer Function
Typical Adjusted Transfer Function
123456789
10111213141516171819202122
1 10 100 1000 10000
Size (nm)
Det
ectio
n R
ing
Initially generated from Monte Carlo simulation. For a random particle of a given size:
•Random charge state is selected from a calculated probability distribution for that sized particle
•Entry point to the classifier randomly selected, and particle’s trajectory calculated to predict the landing detection ring and measured current.
•Repeated across all sizes for many particles →
•Empirically adjusted for every instrument during test using a linear transform ↓
Modelled Transfer Function
123456789
10111213141516171819202122
1 10 100 1000 10000
Size (nm)
Det
ectio
n R
ing
Em
pirical Data

Size Calibration: PSL• Duke Scientific (now Thermo Scientific) Polystyrene Latex Spheres
• NIST Traceable, traceability provided by microscopy
• Large surfactant / impurity mode makes unsuitable for smaller sizes:
• Lognormal parameterisation used for ease of analysis & improved apparent spectral resolution
299nm PSL Spheres - Standard DMS500 Spectral Output
0.00E+00
2.00E+05
4.00E+05
6.00E+05
8.00E+05
1.00E+06
1.20E+06
1.00 10.0 100 1000
Dp (nm)
Standard
Lognormal
dN/dlogDp /cc
SURFACTANT PEAK PSL
PEAK
Regulator HEPA Collison Nebuliser Neutraliser
Diffusion Dryer
HEPA
DMS
spill
PSL suspension
air
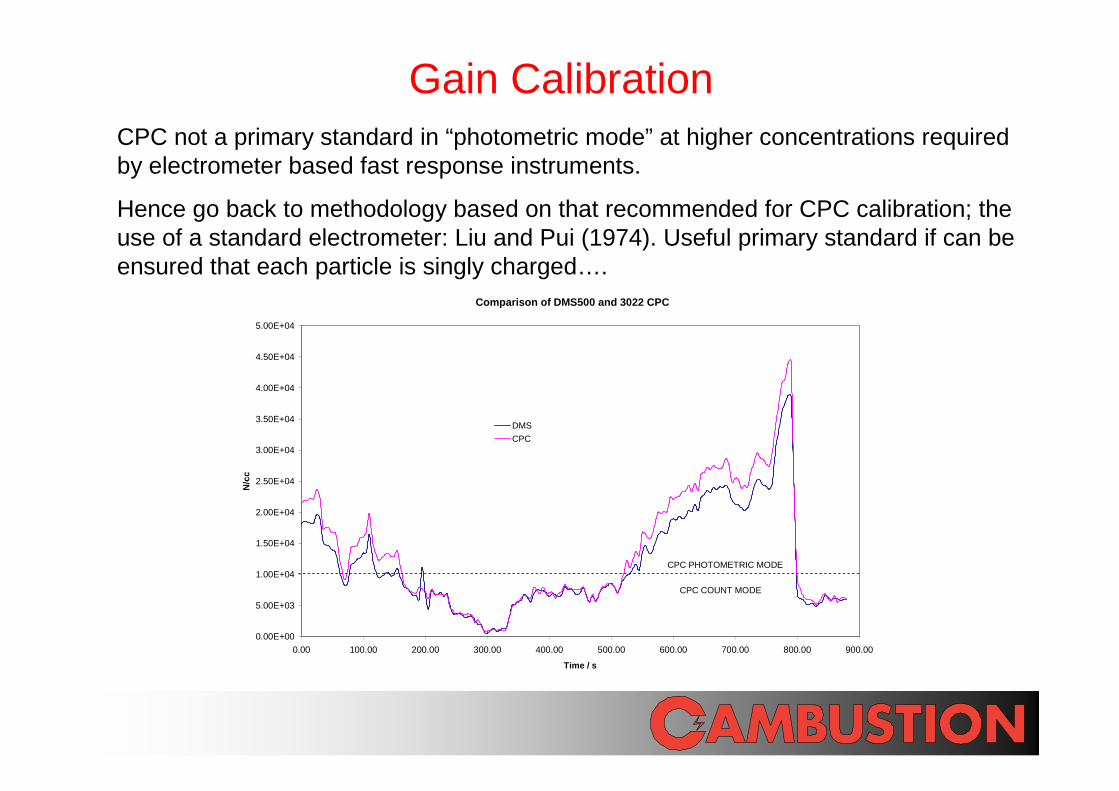
Gain Calibration
Comparison of DMS500 and 3022 CPC
0.00E+00
5.00E+03
1.00E+04
1.50E+04
2.00E+04
2.50E+04
3.00E+04
3.50E+04
4.00E+04
4.50E+04
5.00E+04
0.00 100.00 200.00 300.00 400.00 500.00 600.00 700.00 800.00 900.00
Time / s
N/c
c
DMS
CPC
CPC PHOTOMETRIC MODE
CPC COUNT MODE
CPC not a primary standard in “photometric mode” at higher concentrations required by electrometer based fast response instruments.
Hence go back to methodology based on that recommended for CPC calibration; the use of a standard electrometer: Liu and Pui (1974). Useful primary standard if can be ensured that each particle is singly charged….
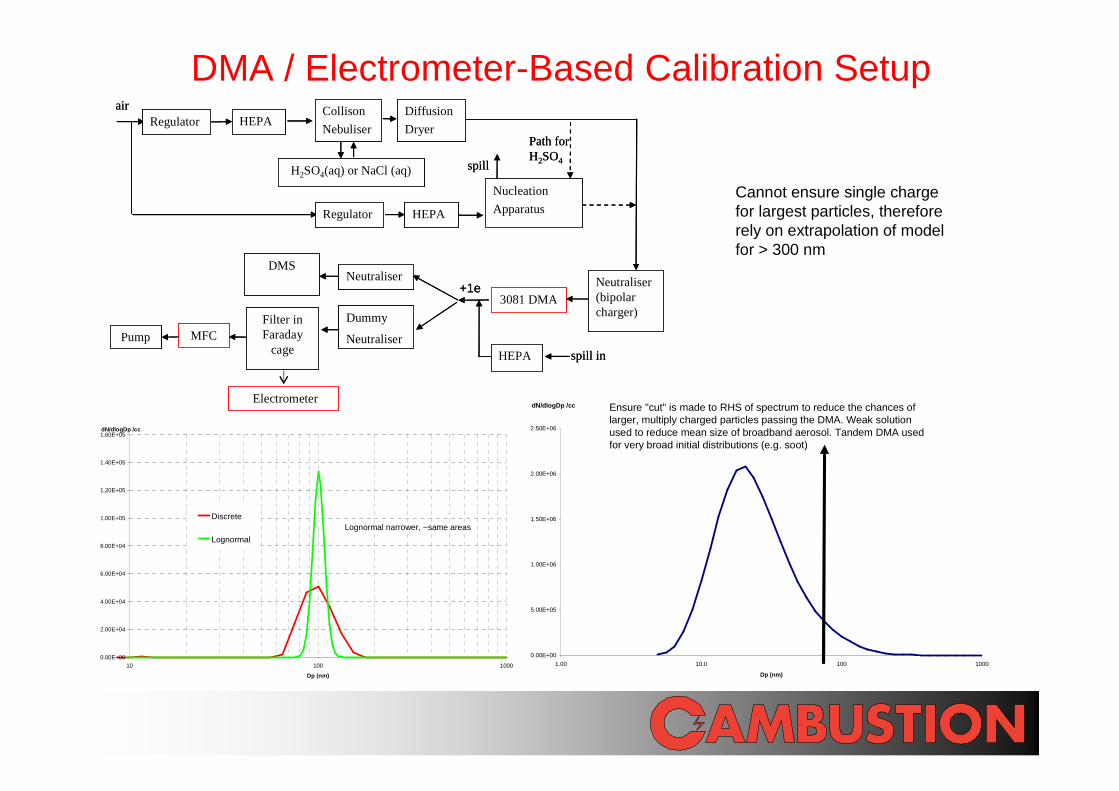
DMA / Electrometer-Based Calibration Setup
0.00E+00
5.00E+05
1.00E+06
1.50E+06
2.00E+06
2.50E+06
1.00 10.0 100 1000
Dp (nm)
dN/dlogDp /cc Ensure "cut" is made to RHS of spectrum to reduce the chances of larger, multiply charged particles passing the DMA. Weak solution used to reduce mean size of broadband aerosol. Tandem DMA used for very broad initial distributions (e.g. soot)
Cannot ensure single charge for largest particles, therefore rely on extrapolation of model for > 300 nm
Regulator HEPACollison
Nebuliser
Neutraliser (bipolar charger)
Diffusion
Dryer
HEPA
spillH2SO4(aq) or NaCl (aq)
air
Nucleation
ApparatusRegulator HEPA
3081 DMA
NeutraliserDMS
spill in
Filter in Faraday
cageMFCPump
Electrometer
Path for H2SO4
Dummy
Neutraliser
+1e
Regulator HEPACollison
Nebuliser
Neutraliser (bipolar charger)
Diffusion
Dryer
HEPA
spillH2SO4(aq) or NaCl (aq)
air
Nucleation
ApparatusRegulator HEPA
3081 DMA
NeutraliserDMS
spill in
Filter in Faraday
cageMFCPump
Electrometer
Path for H2SO4
Dummy
Neutraliser
+1e
0.00E+00
2.00E+04
4.00E+04
6.00E+04
8.00E+04
1.00E+05
1.20E+05
1.40E+05
1.60E+05
10 100 1000
Dp (nm)
Discrete
Lognormal
dN/dlogDp /cc
Lognormal narrower, ~same areas
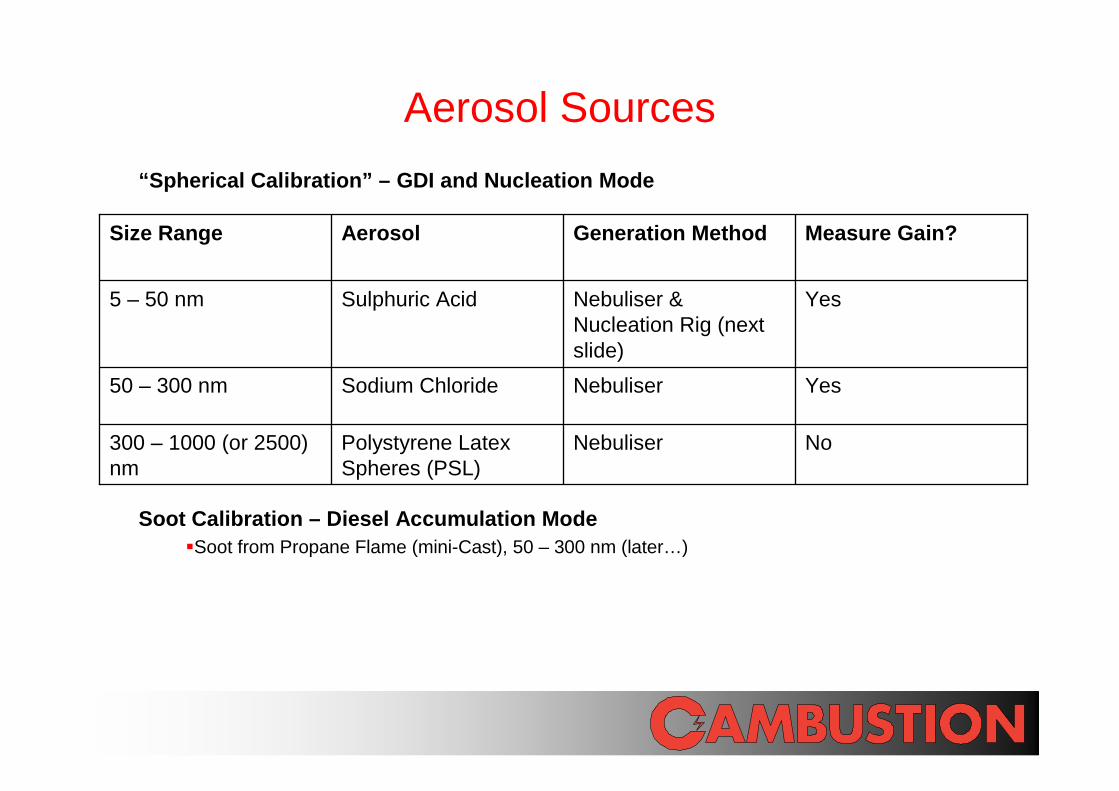
Aerosol Sources
“Spherical Calibration” – GDI and Nucleation Mode
Soot Calibration – Diesel Accumulation Mode �Soot from Propane Flame (mini-Cast), 50 – 300 nm (later…)
300 – 1000 (or 2500) nm
50 – 300 nm
5 – 50 nm
Size Range
Polystyrene Latex Spheres (PSL)
Sodium Chloride
Sulphuric Acid
Aerosol
Nebuliser
Nebuliser
Nebuliser & Nucleation Rig (next slide)
Generation Method
No
Yes
Yes
Measure Gain?
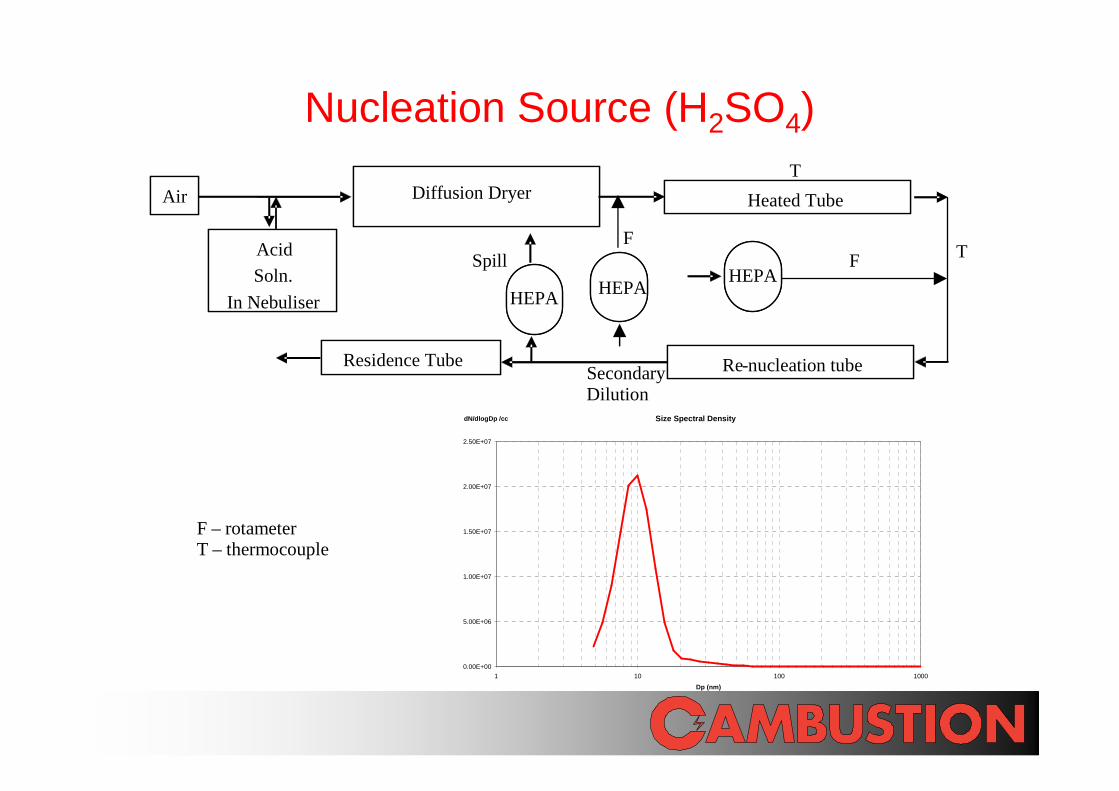
Nucleation Source (H2SO4)
F – rotameter T – thermocouple
Size Spectral Density
0.00E+00
5.00E+06
1.00E+07
1.50E+07
2.00E+07
2.50E+07
1 10 100 1000
Dp (nm)
dN/dlogDp /cc
Acid
Soln.
In Nebuliser
Diffusion Dryer Heated Tube
HEPA
FF
Re-nucleation tube
HEPAHEPA
Residence Tube
Air
SecondaryDilution
Spill
T
T
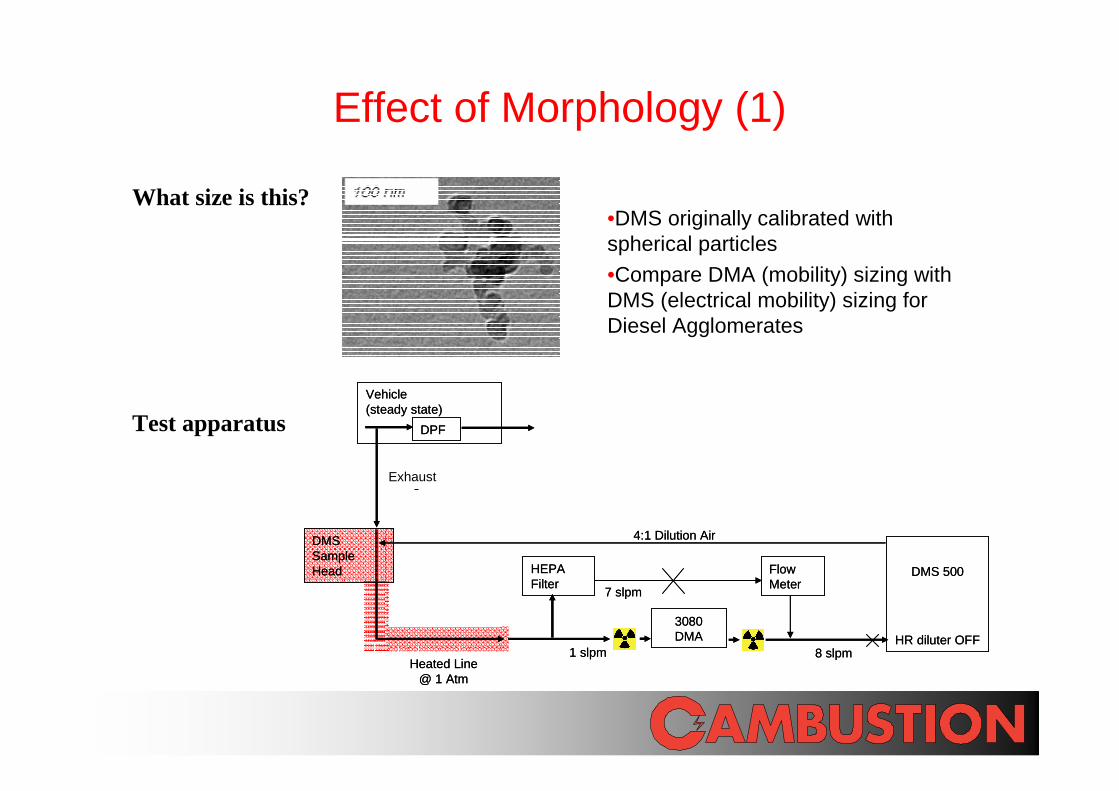
Effect of Morphology (1)
What size is this?
Vehicle (steady state)
Feedgas
DPF
DMS Sample Head DMS 500
HR diluter OFF
4:1 Dilution Air
Heated Line @ 1 Atm
3080 DMA
Flow Meter
HEPA Filter
1 slpm
7 slpm
8 slpm
Vehicle (steady state)
Feedgas
DPF
DMS Sample Head DMS 500
HR diluter OFF
4:1 Dilution Air
Heated Line @ 1 Atm
3080 DMA
Flow Meter
HEPA Filter
1 slpm
7 slpm
8 slpm
Test apparatus
•DMS originally calibrated with spherical particles
•Compare DMA (mobility) sizing with DMS (electrical mobility) sizing for Diesel Agglomerates
Exhaust
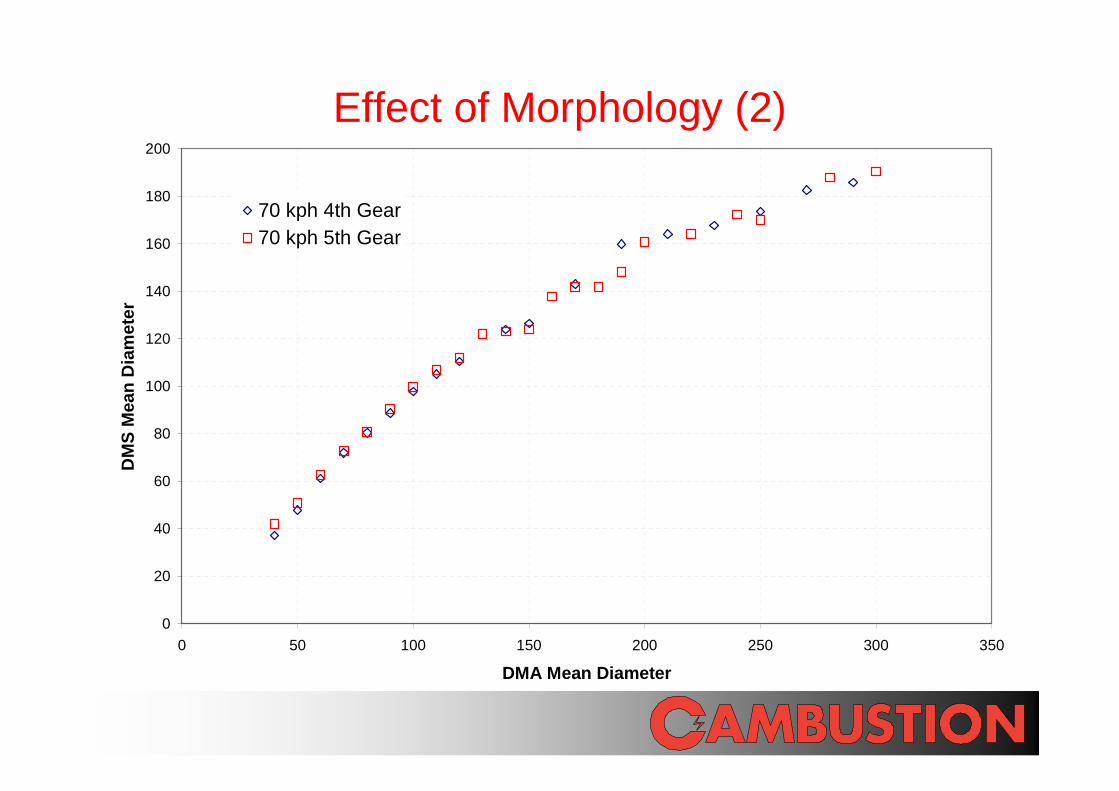
Effect of Morphology (2)
0
20
40
60
80
100
120
140
160
180
200
0 50 100 150 200 250 300 350
DMA Mean Diameter
DM
S M
ean
Dia
met
er
70 kph 4th Gear70 kph 5th Gear
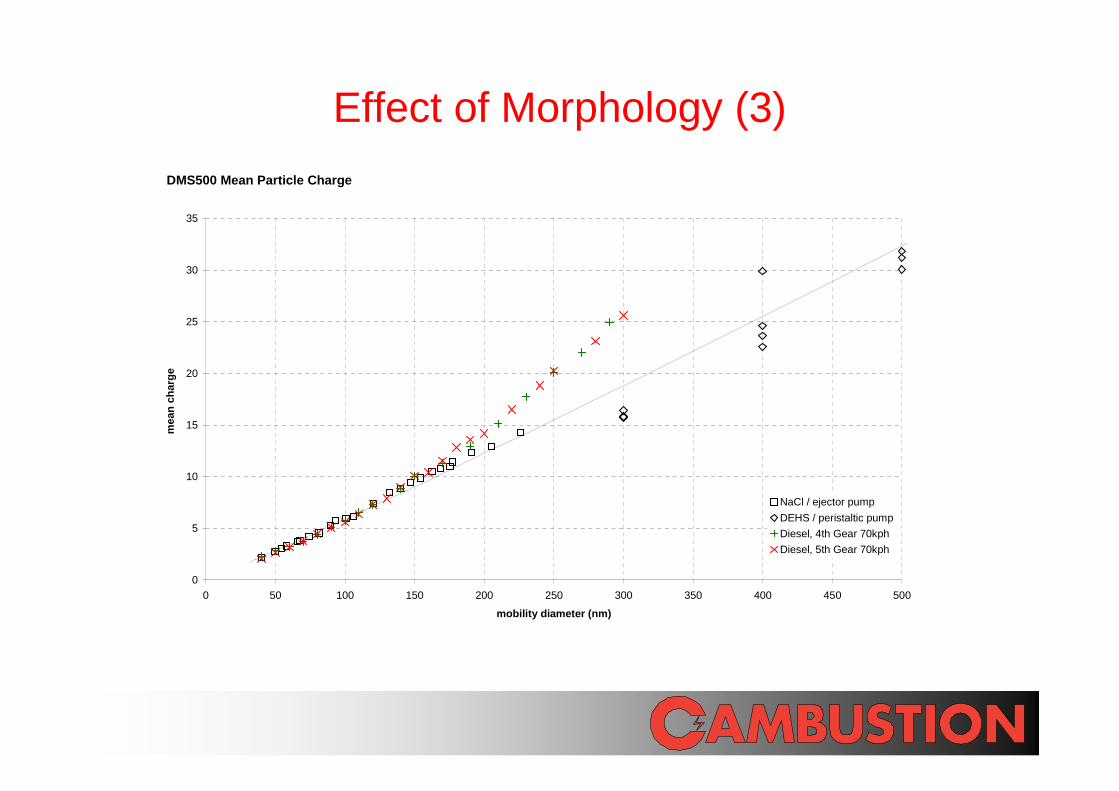
Effect of Morphology (3)
DMS500 Mean Particle Charge
0
5
10
15
20
25
30
35
0 50 100 150 200 250 300 350 400 450 500
mobility diameter (nm)
mea
n ch
arge
NaCl / ejector pump
DEHS / peristaltic pump
Diesel, 4th Gear 70kph
Diesel, 5th Gear 70kph
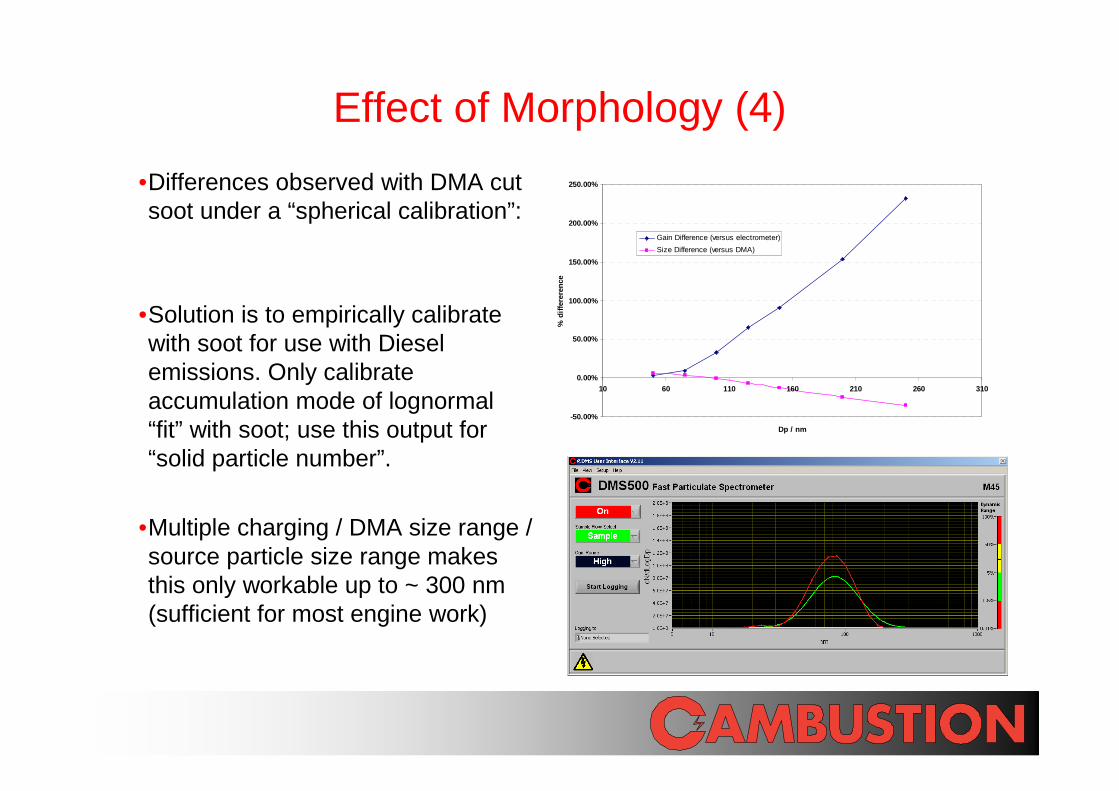
Effect of Morphology (4)
•Differences observed with DMA cut soot under a “spherical calibration”:
•Solution is to empirically calibrate with soot for use with Diesel emissions. Only calibrate accumulation mode of lognormal “fit” with soot; use this output for “solid particle number”.
•Multiple charging / DMA size range / source particle size range makes this only workable up to ~ 300 nm (sufficient for most engine work)
-50.00%
0.00%
50.00%
100.00%
150.00%
200.00%
250.00%
10 60 110 160 210 260 310
Dp / nm
% d
iffer
eren
ce
Gain Difference (versus electrometer)
Size Difference (versus DMA)
Results after “soot calibration”
0.0E+00
5.0E+05
1.0E+06
1.5E+06
2.0E+06
2.5E+06
3.0E+06
3.5E+06
4.0E+06
4.5E+06
Trans
ients Idle
Trans
ients
Cold S
tart
War
m up
Fast I
dle
Fast I
dle40
00 rp
mTra
nsien
ts
"MOT"
N/c
c/s
Ave Acc N/cc CPC + VPR
Ave DMS Spherical Calibration
Ave Acc N/cc DMS Agglomerate Cal
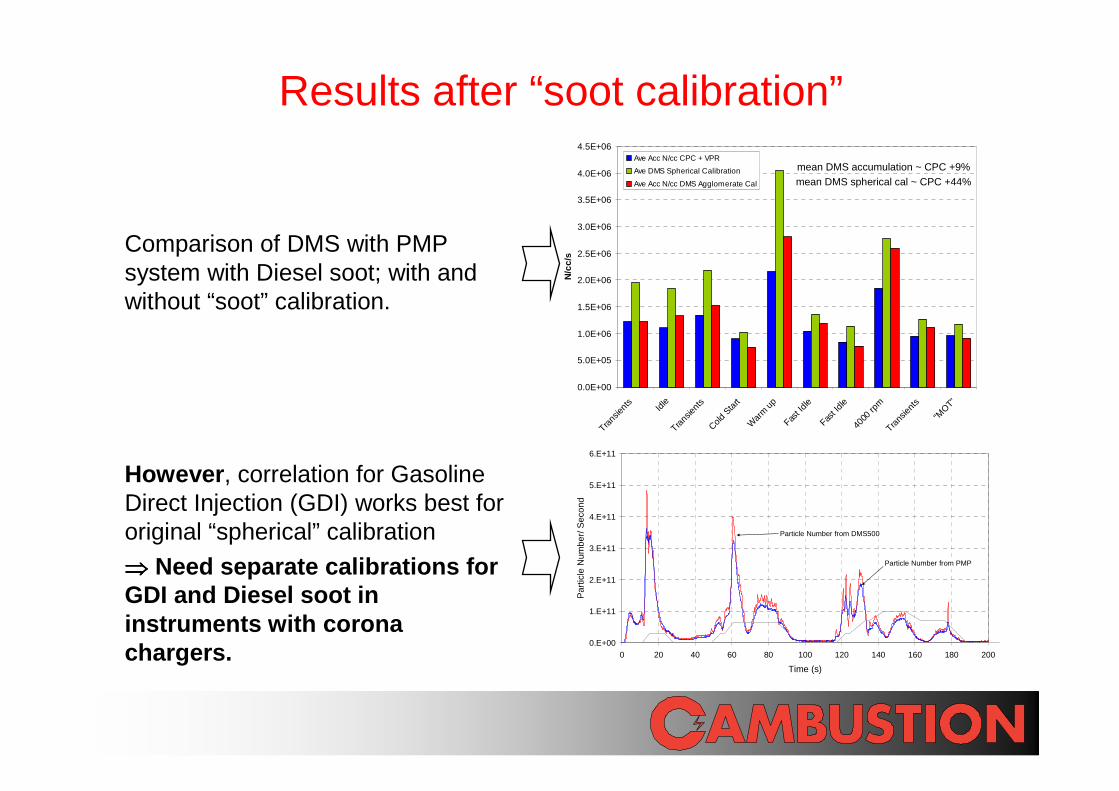
mean DMS accumulation ~ CPC +9%mean DMS spherical cal ~ CPC +44%
Comparison of DMS with PMP system with Diesel soot; with and without “soot” calibration.
However , correlation for Gasoline Direct Injection (GDI) works best for original “spherical” calibration
⇒⇒⇒⇒ Need separate calibrations for GDI and Diesel soot in instruments with corona chargers.
0.E+00
1.E+11
2.E+11
3.E+11
4.E+11
5.E+11
6.E+11
0 20 40 60 80 100 120 140 160 180 200
Time (s)
Par
ticle
Num
ber/
Sec
ond
Particle Number from DMS500
Particle Number from PMP
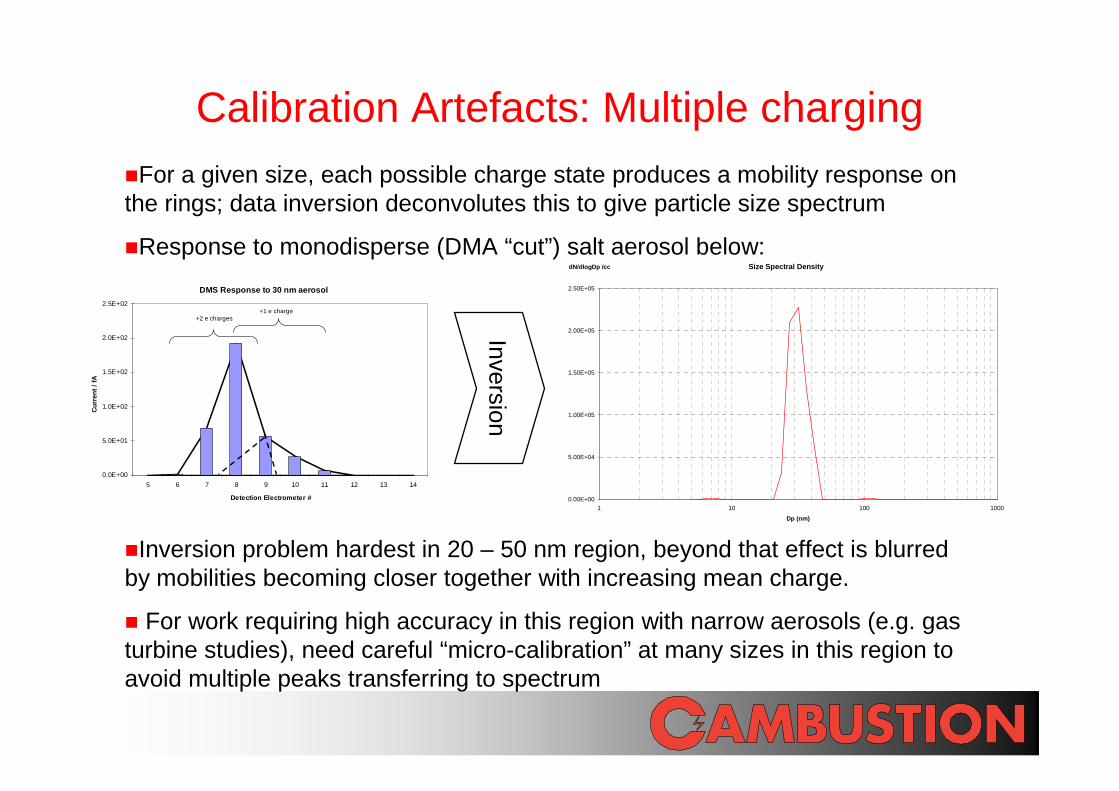
Calibration Artefacts: Multiple charging�For a given size, each possible charge state produces a mobility response on the rings; data inversion deconvolutes this to give particle size spectrum
�Response to monodisperse (DMA “cut”) salt aerosol below:
�Inversion problem hardest in 20 – 50 nm region, beyond that effect is blurred by mobilities becoming closer together with increasing mean charge.
� For work requiring high accuracy in this region with narrow aerosols (e.g. gas turbine studies), need careful “micro-calibration” at many sizes in this region to avoid multiple peaks transferring to spectrum
Size Spectral Density
0.00E+00
5.00E+04
1.00E+05
1.50E+05
2.00E+05
2.50E+05
1 10 100 1000
Dp (nm)
dN/dlogDp /cc
Inversion
DMS Response to 30 nm aerosol
0.0E+00
5.0E+01
1.0E+02
1.5E+02
2.0E+02
2.5E+02
5 6 7 8 9 10 11 12 13 14
Detection Electrometer #
Cur
rent
/ fA
+2 e charges+1 e charge
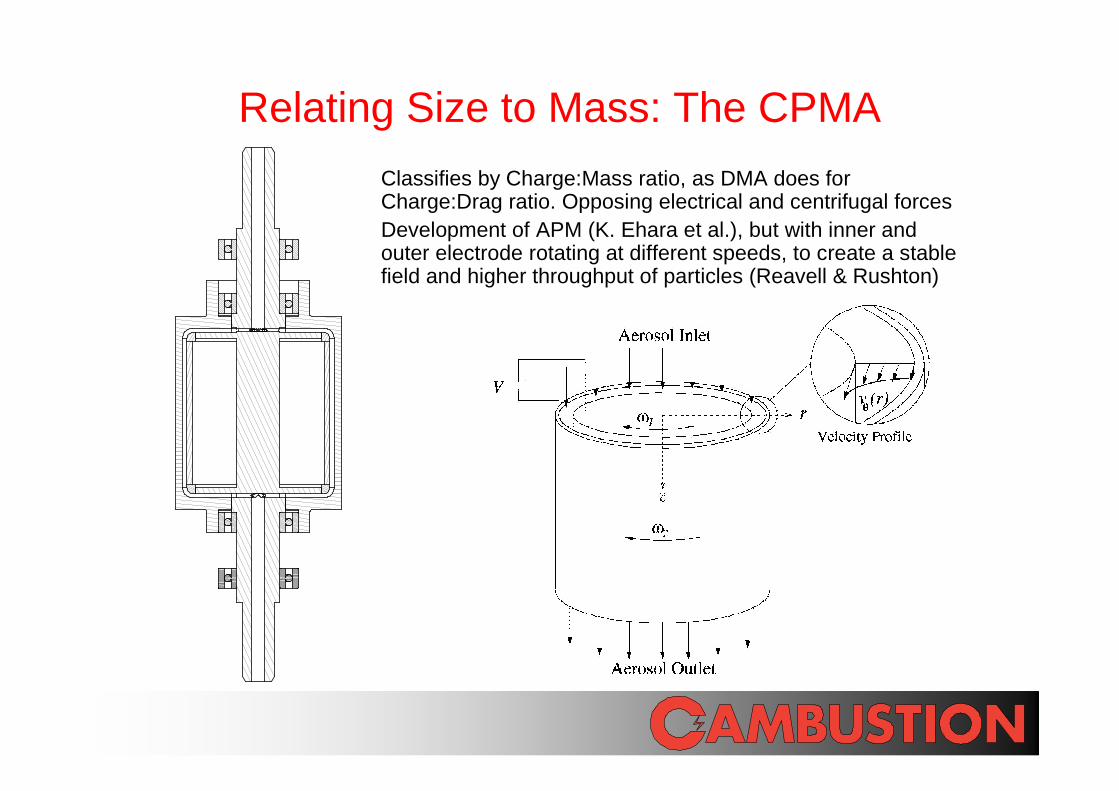
Relating Size to Mass: The CPMA
Classifies by Charge:Mass ratio, as DMA does for Charge:Drag ratio. Opposing electrical and centrifugal forcesDevelopment of APM (K. Ehara et al.), but with inner and outer electrode rotating at different speeds, to create a stablefield and higher throughput of particles (Reavell & Rushton)
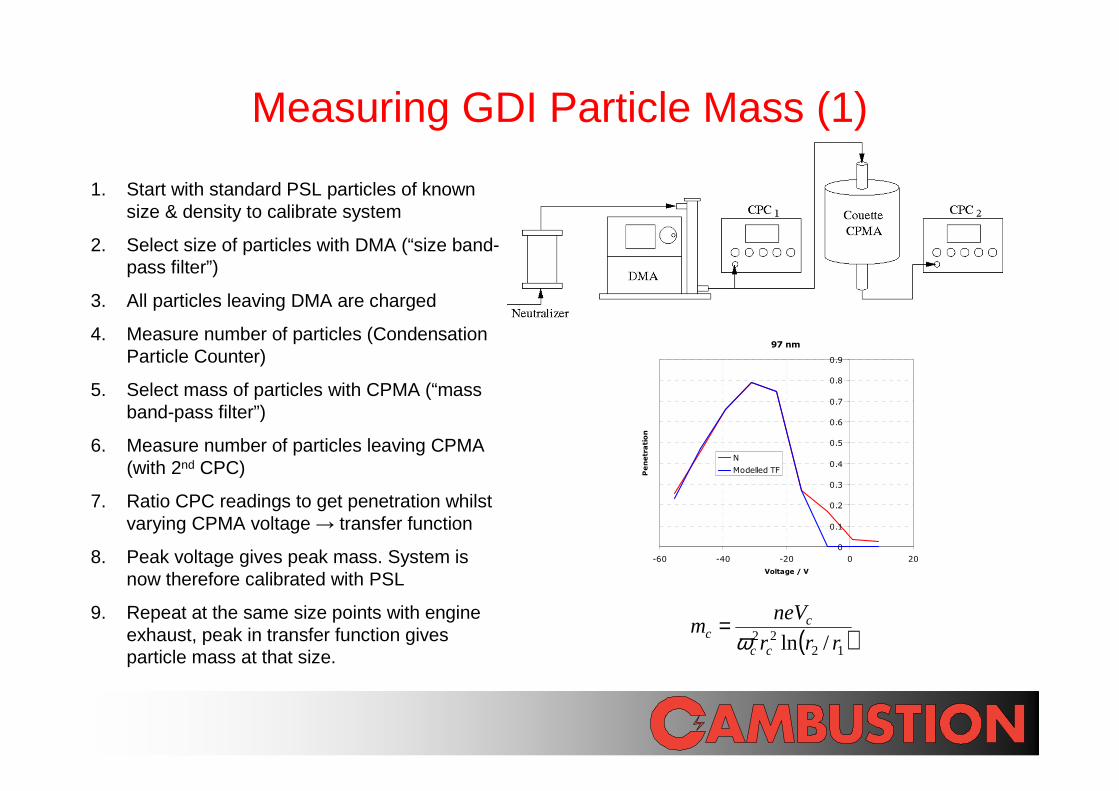
Measuring GDI Particle Mass (1)
1. Start with standard PSL particles of known size & density to calibrate system
2. Select size of particles with DMA (“size band-pass filter”)
3. All particles leaving DMA are charged
4. Measure number of particles (Condensation Particle Counter)
5. Select mass of particles with CPMA (“mass band-pass filter”)
6. Measure number of particles leaving CPMA (with 2nd CPC)
7. Ratio CPC readings to get penetration whilst varying CPMA voltage → transfer function
8. Peak voltage gives peak mass. System is now therefore calibrated with PSL
9. Repeat at the same size points with engine exhaust, peak in transfer function gives particle mass at that size.
97 nm
0
0.1
0.2
0.3
0.4
0.5
0.6
0.7
0.8
0.9
-60 -40 -20 0 20
Voltage / V
Penetration
N
Modelled TF
( )1222 /ln rrr
neVm
cc
cc ω
=
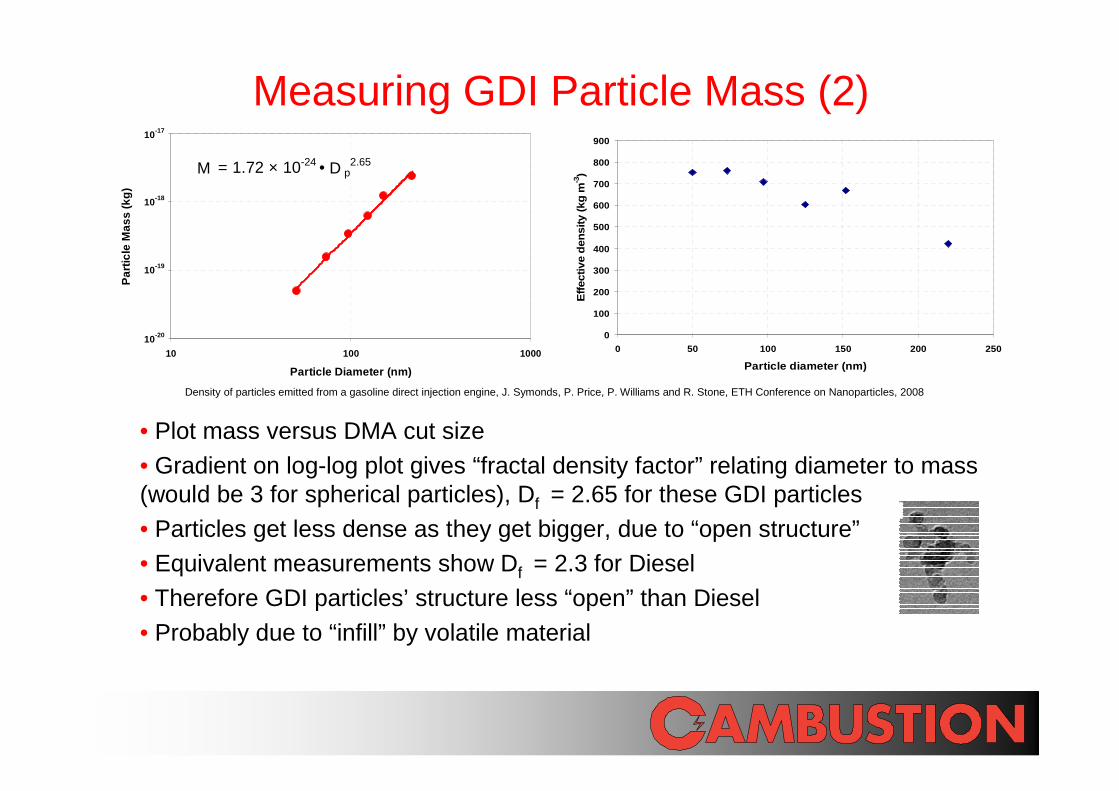
Measuring GDI Particle Mass (2)
• Plot mass versus DMA cut size
• Gradient on log-log plot gives “fractal density factor” relating diameter to mass (would be 3 for spherical particles), Df = 2.65 for these GDI particles
• Particles get less dense as they get bigger, due to “open structure”• Equivalent measurements show Df = 2.3 for Diesel
• Therefore GDI particles’ structure less “open” than Diesel
• Probably due to “infill” by volatile material
0
100
200
300
400
500
600
700
800
900
0 50 100 150 200 250
Particle diameter (nm)
Effe
ctiv
e de
nsity
(kg
m-3)M = 1.72 × 10⁻²⁴ • D p
2.65
1E-20
1E-19
1E-18
1E-17
10 100 1000
Particle Diameter (nm)
Par
ticle
Mas
s (k
g)
10-20
10-19
10-18
10-17
Density of particles emitted from a gasoline direct injection engine, J. Symonds, P. Price, P. Williams and R. Stone, ETH Conference on Nanoparticles, 2008
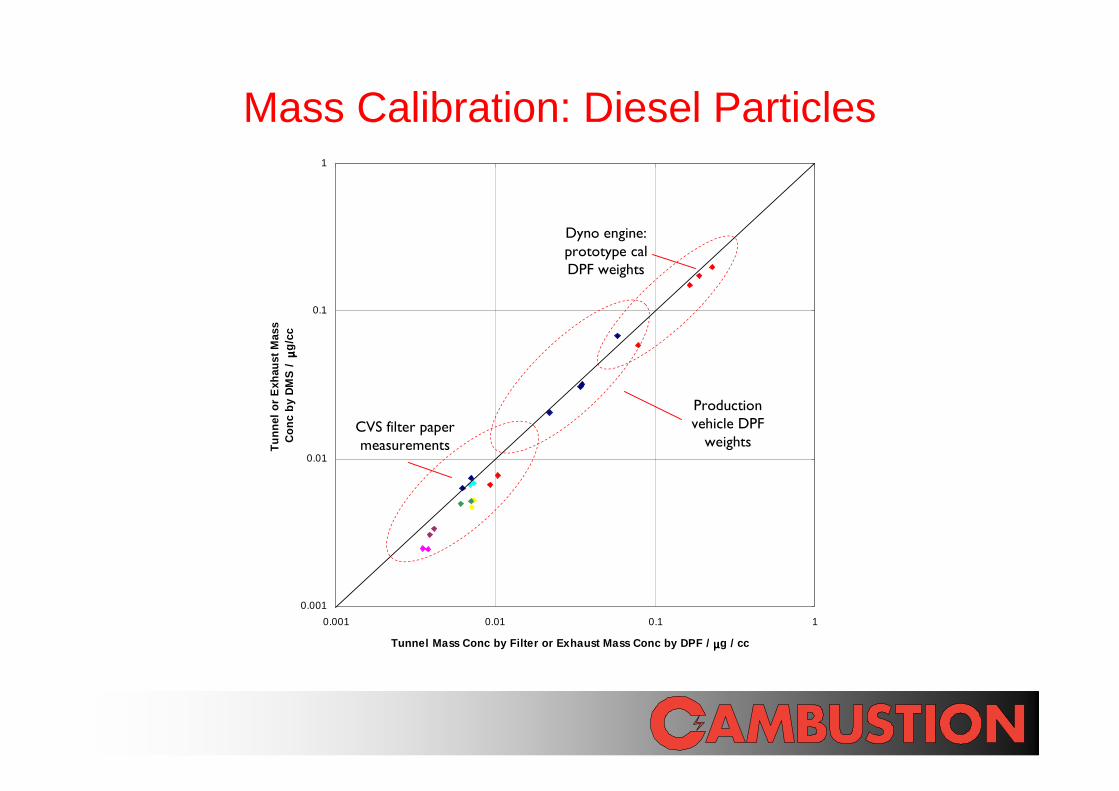
Mass Calibration: Diesel Particles
0.001
0.01
0.1
1
0.001 0.01 0.1 1
Tunnel Mass Conc by Filter or Exhaust Mass Conc by DPF / µµµµg / cc
Tun
nel o
r E
xhau
st M
ass
Con
c by
DM
S /
µµ µµg
/cc
Production vehicle DPF weights
CVS filter paper measurements
Dyno engine: prototype cal DPF weights
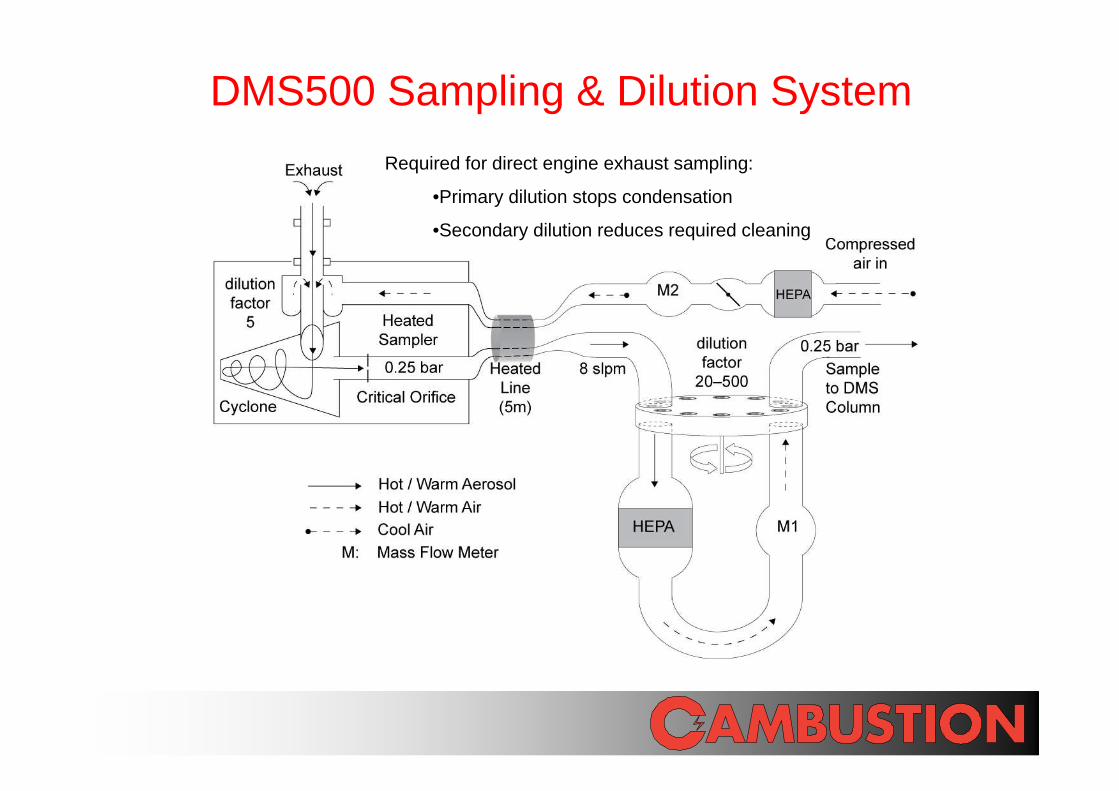
DMS500 Sampling & Dilution System
Required for direct engine exhaust sampling:
•Primary dilution stops condensation
•Secondary dilution reduces required cleaning
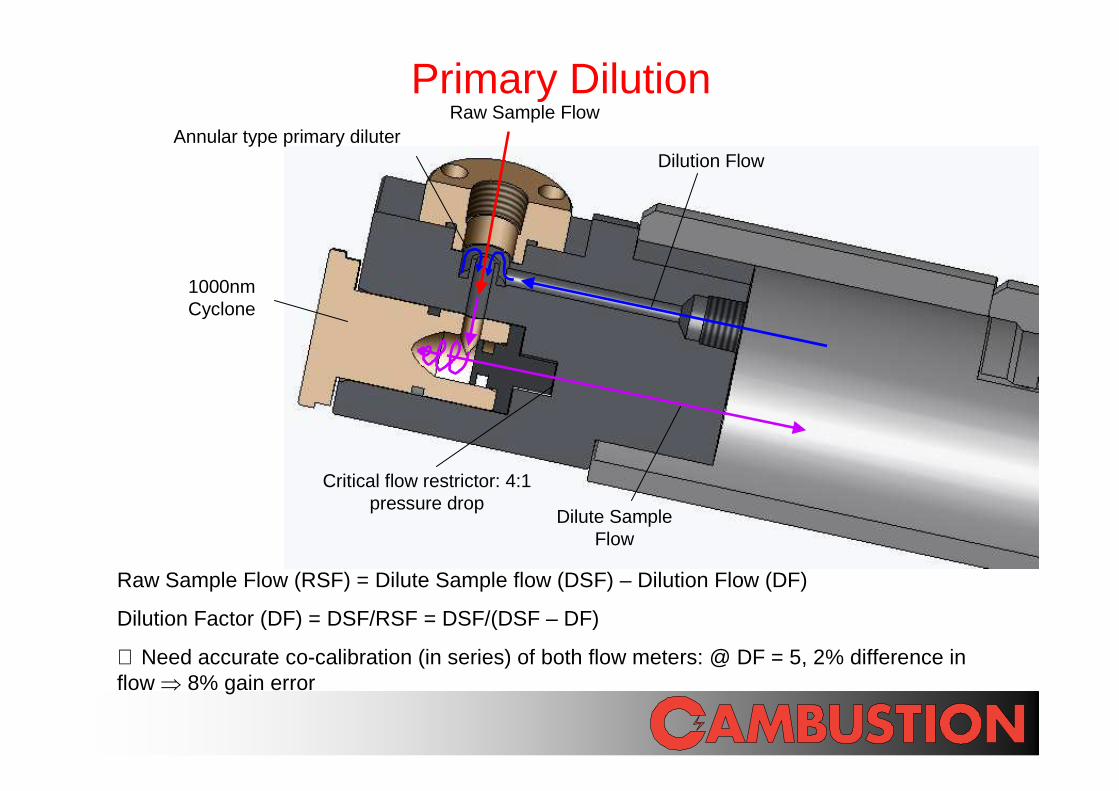
Primary Dilution
1000nm Cyclone
Raw Sample Flow
Dilution FlowAnnular type primary diluter
Dilute Sample Flow
Critical flow restrictor: 4:1 pressure drop
Raw Sample Flow (RSF) = Dilute Sample flow (DSF) – Dilution Flow (DF)
Dilution Factor (DF) = DSF/RSF = DSF/(DSF – DF)
∴ Need accurate co-calibration (in series) of both flow meters: @ DF = 5, 2% difference in flow ⇒ 8% gain error

Sample Line Losses
Sample Line Losses Fit “Turbulent Model” given in Hinds even for laminar flow!
Sample Line Efficiency: Diesel Exhaust Particles (R e = 1600, P = 1 bar, T = 383 K, ∆∆∆∆ l = 4 m, i.d. = 4.7 mm)
0%
10%
20%
30%
40%
50%
60%
70%
80%
90%
100%
10 100Particle diameter nm
Pe
netr
atio
n
ExperimentalTurbulentLaminar
Effect of Sample Line Losses on Typical Diesel Spec trum
0.00E+00
1.00E+07
2.00E+07
3.00E+07
4.00E+07
5.00E+07
6.00E+07
7.00E+07
1.00 10.0 100 1000
Dp (nm)
No Losses
2.5 m sample line
8 m sample line
dN/dlogDp /cc
Symonds, Olfert & Reavell, 2007
Kumar, Fennell, Symonds & Britter, 2008
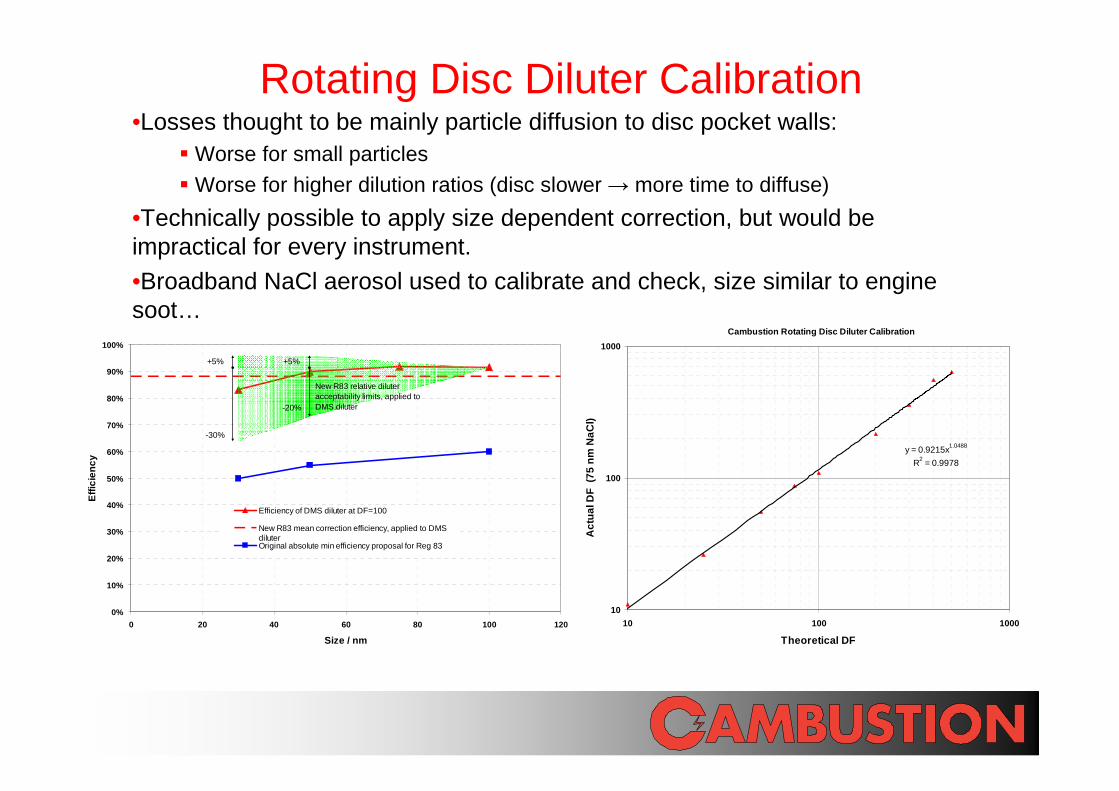
Rotating Disc Diluter Calibration•Losses thought to be mainly particle diffusion to disc pocket walls:
� Worse for small particles
� Worse for higher dilution ratios (disc slower → more time to diffuse)
•Technically possible to apply size dependent correction, but would be impractical for every instrument.
•Broadband NaCl aerosol used to calibrate and check, size similar to engine soot…
Cambustion Rotating Disc Diluter Calibration
y = 0.9215x1.0488
R2 = 0.9978
10
100
1000
10 100 1000
Theoretical DF
Act
ual D
F (
75 n
m N
aCl)
0%
10%
20%
30%
40%
50%
60%
70%
80%
90%
100%
0 20 40 60 80 100 120
Size / nm
Effi
cien
cy
Efficiency of DMS diluter at DF=100
New R83 mean correction efficiency, applied to DMSdiluterOriginal absolute min efficiency proposal for Reg 83
+5%
-30%
+5%
-20%
New R83 relative diluter acceptability limits, applied to DMS diluter
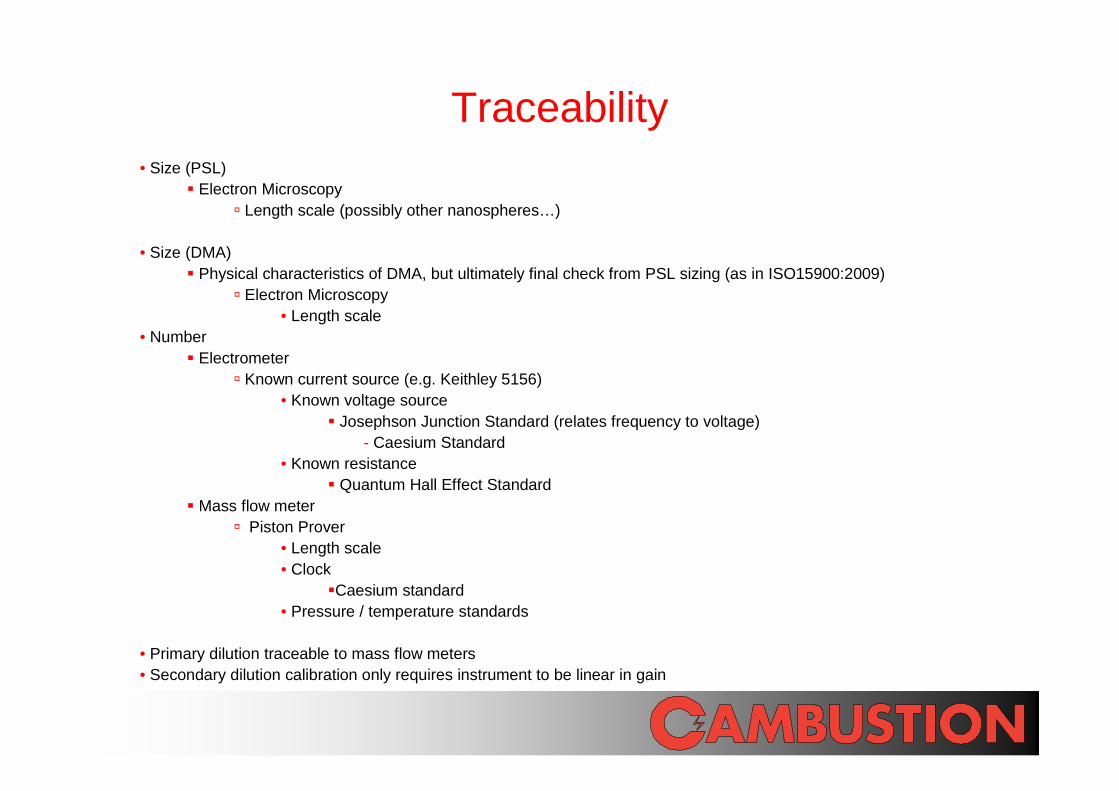
Traceability• Size (PSL)
� Electron Microscopy � Length scale (possibly other nanospheres…)
• Size (DMA)� Physical characteristics of DMA, but ultimately final check from PSL sizing (as in ISO15900:2009)
� Electron Microscopy• Length scale
• Number� Electrometer
� Known current source (e.g. Keithley 5156)• Known voltage source
� Josephson Junction Standard (relates frequency to voltage)- Caesium Standard
• Known resistance� Quantum Hall Effect Standard
� Mass flow meter� Piston Prover
• Length scale• Clock
�Caesium standard• Pressure / temperature standards
• Primary dilution traceable to mass flow meters• Secondary dilution calibration only requires instrument to be linear in gain
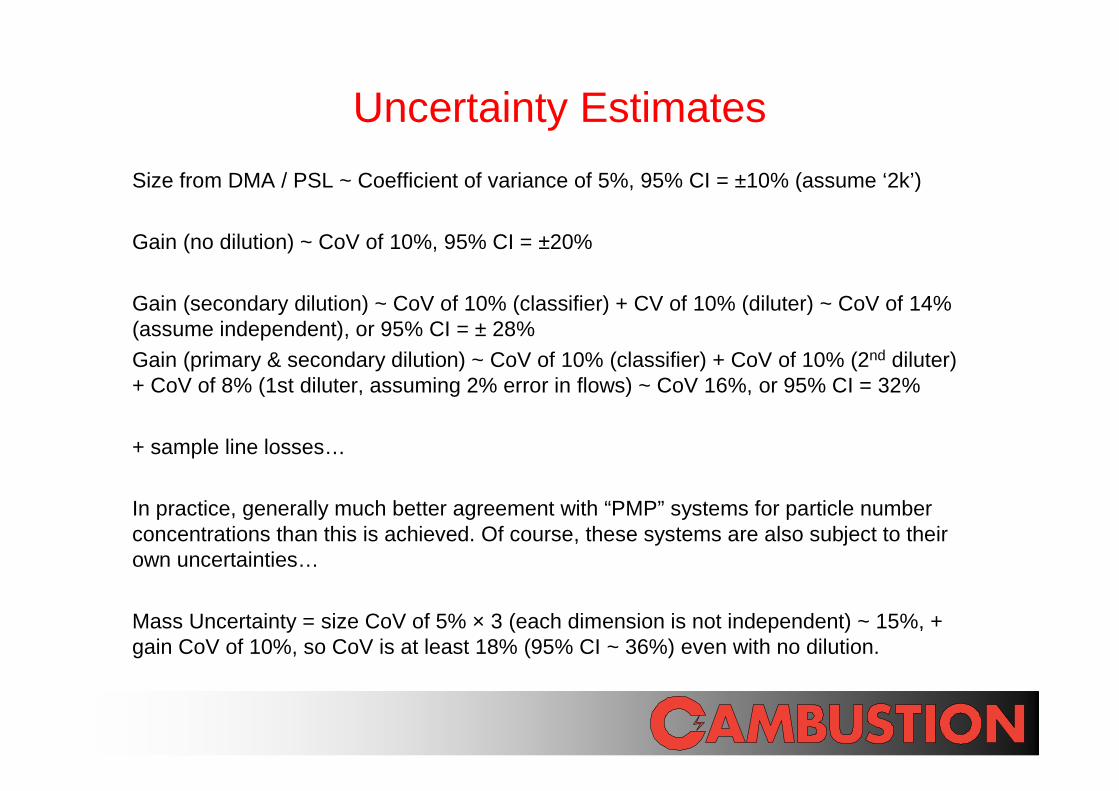
Uncertainty Estimates
Size from DMA / PSL ~ Coefficient of variance of 5%, 95% CI = ±10% (assume ‘2k’)
Gain (no dilution) ~ CoV of 10%, 95% CI = ±20%
Gain (secondary dilution) ~ CoV of 10% (classifier) + CV of 10% (diluter) ~ CoV of 14% (assume independent), or 95% CI = ± 28%
Gain (primary & secondary dilution) ~ CoV of 10% (classifier) + CoV of 10% (2nd diluter) + CoV of 8% (1st diluter, assuming 2% error in flows) ~ CoV 16%, or 95% CI = 32%
+ sample line losses…
In practice, generally much better agreement with “PMP” systems for particle number concentrations than this is achieved. Of course, these systems are also subject to their own uncertainties…
Mass Uncertainty = size CoV of 5% × 3 (each dimension is not independent) ~ 15%, + gain CoV of 10%, so CoV is at least 18% (95% CI ~ 36%) even with no dilution.
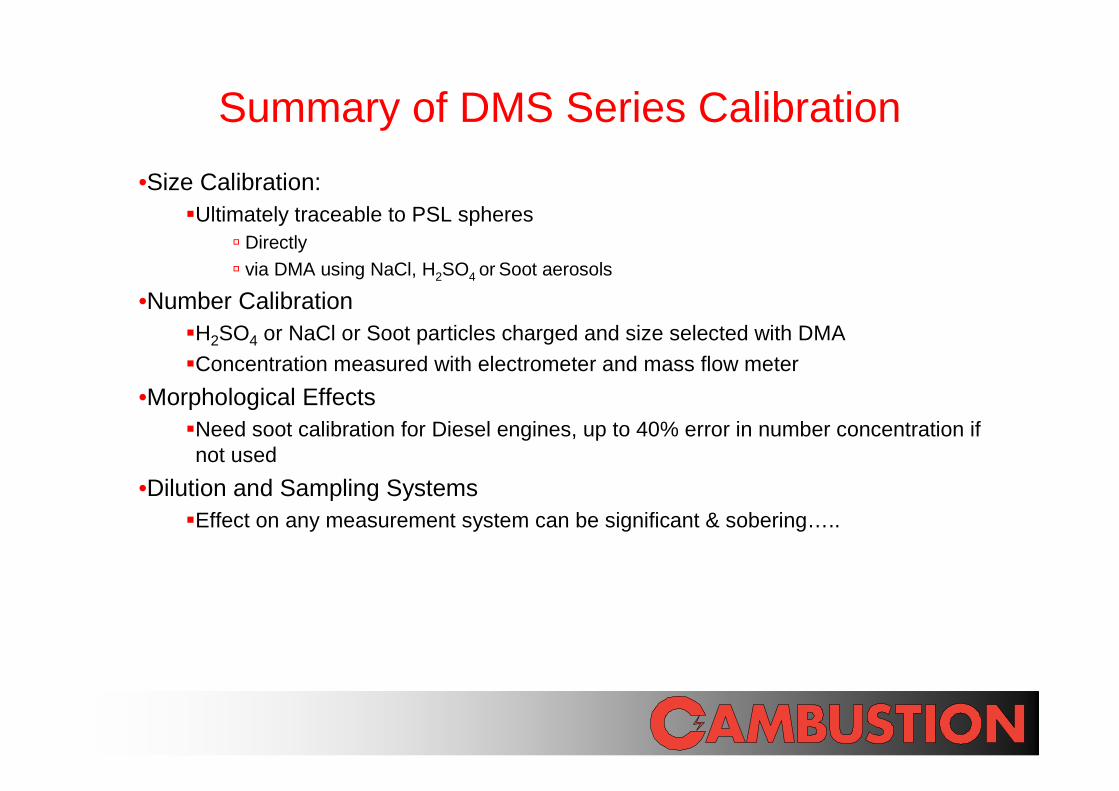
Summary of DMS Series Calibration
•Size Calibration:�Ultimately traceable to PSL spheres
� Directly� via DMA using NaCl, H2SO4 or Soot aerosols
•Number Calibration�H2SO4 or NaCl or Soot particles charged and size selected with DMA
�Concentration measured with electrometer and mass flow meter
•Morphological Effects�Need soot calibration for Diesel engines, up to 40% error in number concentration if not used
•Dilution and Sampling Systems�Effect on any measurement system can be significant & sobering…..
Acknowledgements‘Team DMS R&D’:Kingsley Reavell, Chris Nickolaus, Tim Hands, Nick Collings, Mark Rushton, Andy Livesey, Andrew Ellison & James Burrell (Cambustion)
‘Team DMS Calibration’:Justin Hunt & Joe Evans (Cambustion)
CPMA Research: Jason Olfert (Universities of Cambridge & Alberta)
CPMA Data from GDI engine: Philip Price, Richard Stone (Oxford University), Paul Williams (Manchester University)
Sample Line Losses: Prashant Kumar (University of Surrey), Paul Fennell (Imperial College), Rex Britter (University of Cambridge), Jason Olfert
CambustionJ6 The Paddocks
347 Cherry Hinton RoadCambridgeCB1 8DH
United [email protected]
+44 1223 210250