Embed Size (px)
Citation preview
NATIONAL CENTER Series 2
For HEALTH STATISTICS Number 21
VITAL and HEALTH STATISTXCSDATA EVALUATION AND METHODS RESEARCH
Calibrationof Two BicycleErgometersUsedby theHealthExaminationSurvey
A description of the calibration of two bicycle ergometers,
including detoils on techniques and on precision of measure-
ment, and the absolute workloads for each bicycle.
Washington, D. C. February 1967
U.S. DEPARTMENT OF
HEALTH, EDUCATION, AND WELFARE Public Health Service
John W. Gardner William H. Stewart
Secretary Surgeon General


NATIONAL CENTER FOR HEALTH STATISTICS
FORREST E. LINDER, PH.D., Di~ectoi-
THEODORE D. WOOLSEY, Deputy Direc~o~
OSWALD K. SAGEN, PH.D.,Assist&t Director
WALT R. SIMMONS,M.A.,~tUti.StiCL7~ Advisor
ALICEM.WATERHOUSE,M.D.,Medical ~onsu[tant
JAMES E.KELLY, D.D.S.,Dental Advisor
LOUIS R. STOLCIS,M.A.,Executive O//icer
DONALD GREEN, In/onnczzionO//ice~
OFFICE OF HEALTH STATISTICS ANALYSIS
IWAO M. MORIYAMA, PH.D., Chief
DIVISION OF VITAL STATISTICS
ROBERT D. GROVE, PH.D., Cbie/’
DIVISION OF HEALTH INTERVIEW STATISTICS
PHILIP S. LAWRENCE, SC.D., Cbie/
DIVISION OF HEALTH RECORDS STATISTICS
MONROE G. SIRKEN, PH.D., Chic/
DIVISION OF HEALTH EXAMINATION STATISTICS
ARTHUR J.MCDOWELL, Chic/
DIVISION OF DATA PROCESSING
LEONARD D. MCGANN, Cbie/
Public Health Service Publication No. 1000-Series 2-No. 21
Library of Congress Catalog Card Number 66-62208
FOREWORD
Between 1963 and 1965 the Health Examination Survey (HES) under-
took a study of the noninstitutionalized population of the United Statesaged 6-11 years. A total of 7,119 children of a sample of 7,417 were ex-amined. This group was so chosen as to represent a population of 23.8
million children.One part of the examination was a test for exercise tolerance. The
child was seated on a “bicycle, ” which he was instructed to pedal for 2minutes. The “bicycle” was actually an ergometer. It was set at a pre-determined load so that the rate of work that the child performed inpedaling was indicated by the dial setting. The child’s pulse rate atthe end of a 2-minute ride served to measure his response to exercise.Two different bicycle ergometers were used.
The question naturally arose as to the accuracy of the workload
settings. This was a matter of concern for two reasons. If other popu-lations were to be compared with the U.S. population using a similartest it was naturally important that the true work required by the HEStest be accurately known. For example, a comparison of Swedish andAmerican children which purported to show differences between thesetwo populations in their “physical fitness” might understate or overstatethe difference if the test instruments they used were calibrated dif-ferently. This was of less concern, however, in comparing differentsubgroups of U.S. children. For that purpose it was important to knowhow the two bicycle ergometers used by HES compared with each other,
since it was entirely possible (if the bicycles were not calibrated at
the same level) thar apparent differences between subgroups of the
population might really be differences between the bicycle ergometersused in their tests or that real ~pulation differences might be concealed.
The H ES therefore contracted with Stein Industries, Inc., to conduct
a physical calibration of the two ergometers used in the survey ofchildren 6-11 years old. The results of this calibration are presented inthis report. They are pertinent not only to the Health Examination Survey
but also to other studies which use similar ergometers for population
studies.
Tavia GordonDivision of Health Exam-
ination Statistics

CONTENTSPage
Foreword ------------------------------------------------------------
Introduction ----------------------------------------------------------
Physical Description and Operation of Ergometer -------------------------
Calibration Techniques and Equipment -----------------------------------
Measurements and Procedures ------------------------------------------
Results --------------------------------------------------------------
Discussion of Restits and Sources of Error ------------------------------
Text TablesTable 1. Tachometer calibration: measured pedaling speed on specified
ergometer units at indicated loads and pedaling speeds ---------
2. Calibration averages: average load measurements unspecifiedergometer units at indicated loads and pedaling speeds ---------
3. Calibration detail: loadmeasurements onspecifiedergometerunits at indicated loads and pedaling speeds ------------------
4. Calibration error: standard error and relative error of loadmeasurements on specified ergometer units at indicated loadsand pedaling speeds ----------------------------------------
Appendix I. CaIlbration Formulas --------------------------------------
Appendix II. Calibrator t_or Ergometer Model Ak13&3--------------------
i
1
1
2
3
4
6
3
4
5
7
9
10
IN THIS REPOR T the calibration of two bicycle ergometers is de-
scvibed. These evgometeys weve used for measuying exevcise tolerance
in Cycle II of the Health Examination SuYvey, which consisted of ex-
aminations of a nationwide probability sample of the noninstitutionalized
population of the United States aged 6-11 yeavs.
The technique used in calibration is descyibed, and the pyecision of
mea.swement is indicated. At the pyescvibed pedaling speeds the true
wovkloads weve less than the indicated wovkloads. The amount of dif-
ference uayied from one bicycie to the othey. The bicycles diffeyed in
othev @eYfoYmance chayacteyistics as well. Both evgometeys appeayed
to be stable duying the peyiod of testing; that is, while they weye not in
pyecise calibration they weye apparently reliable.
SYMBOLS
Data notavailable ----------------------- ---
Category nonapplicable ------------------ . . .
Quantity zero -------------------------- -
Quantity more than O but less than 0.05---- 0.0
Figure does not meet standards ofreliability or precision ----------------- *

CALIBRATION OF
TWO BICYCLE ERGOMETERS USED BY THEHEALTH EXAMINATION SURVEY
Edward S. Stein and Mark S. Rothstein, Stein ln,dustYies, Inc.C. Joseph C lernents, Jr., Prototyfles, Inc.
INTRODUCTION
This report describes the calibration of twoergometers—Model AM 368—manufactured byElema-Schonander of Sweden. The work was per-formed by Stein Industries, Inc., of Kensington,Md.
The report explains the methods used, de-scribes the special device constructed for the
calibration, and tabulates the results. Also in-cluded are a brief summary of the results, adiscussion of the sources of error, and the for-mulas to estimate the accuracy of the calibrationtechnique.
The calibration described here was made forthe purpose of determining differences in energyloading between two ergometers used in theHealth Examination Survey (HES). The aim of thecalibration was to obtain true measures ofpower, and consequently energy, expended by asubject as a function of the various load settingson the two machines.
It was found that in addition to a discrepancybetween the two machines tested, each unit dis-played inaccuracies in both pedaling speed (&L-chometer indications) and electrical workload
selected by the operator.
PHYSICAL DESCRIPTION AND
OPERATION OF ERGOMETER
The ergometer is a device for making con-trolled work and energy measurements based onthe principle of presenting a constant powerloadto the subject. This power expended over a bownperiod of time can be converted to a knownamount of work. Work is the integral of the
power multiplied by the time during which thatpower is developed.
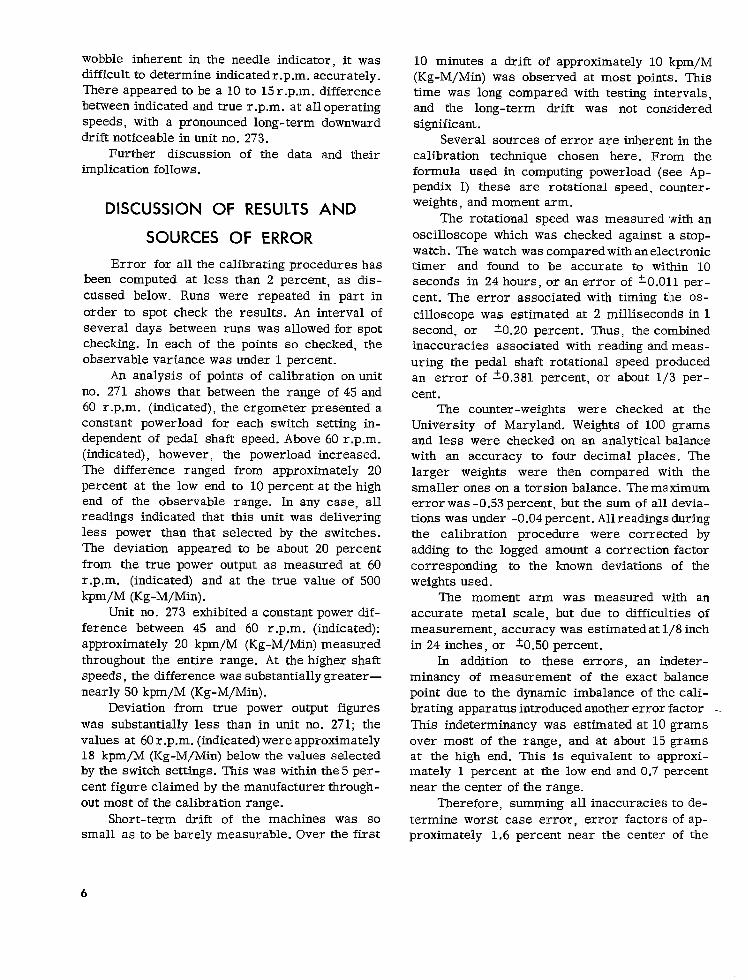
The ergometer consists of a bicycle seat anda pedal crank coupled to an electrical generator(see fig. 1). The output of the generator is con-
@olled by an electrical servo system designedto keep the output voltage constant over a widerange of pedal shaft speeds. This voltage is im-pressed upon a series of load resistors whichare, in turn, connected to the output circuit byindividual switches. Thus, the operator may se-lect the amount or size of the load applied againstthe subject.
Additional circuitry is incorporated in theergometer to compensate for any drift in the
load resistors due to temperature change insidethe unit. The result is an essentially constantpowerload during the testing period, provided
1

Figure I. Illustration of the ergometer.
the pedal shaft speed is maintained within pre- scribed limits.
The subject supplies power to the ergometer by turning the pedals at nearly constant speeds, developing torque which results from the force exerted by his foot on the pedal. This torque can be measured by obtaining the product of the sub- ject’s force on the pedal times the distance from the center of the pedal to the center of the pedal shaft. The product of this torque (which is pro- portional to the force applied) and the number of revolutions per minute yield a figure represent- ing the rate of work, or power.
Since the ergometer is soconstructed as to yield a constant powerload over a fairly wide range of r.p.m., an unusual characteristic re- sults in that as the speed of the shaft increases, the torque required to turn the pedal shaft de- creases. Thus, as the subject tires and is unable to sustain a constant speed, the apparent drag
increases as his pedal speed decreases. This differs, of course, from the sensation experienced on a real bicycle. There the torque is set by the drag associated with factors such as terrain and wind resistance, and it tends to remain con- stant. The sensation is that the amount of work increases with the speed. Thus, on a bicycle, by diminishing speed the rider decreases his rate ofdoing work and his rate of tiring. The ergom- eter, on the other hand, tends to tire the sub- ject at a constant rate as he slows down by making the drag at the pedals increase.
CALIBRATION TECHNIQUES AND
EQUIPMENT
A calibrating technique was required to ascertain whether the two ergometers did in fact present similar loads for similar switch settings. Besides measuring the uniformity be- tween the two ergometers, it was necessary to be able to determine the actual force exerted by the subject upon the pedals when working against various loads.
A mechanical power source, consisting of a known rotational force, was applied to the sprocket shaft in such a way as to drive it at the nominal speedof 60 r.p.m., as well as 45 and 75 r.p.m. This simulated the subject’s operation of the ergometer. The transmitted power for various settings of the load switches and for several different speeds was measured accurately.
The tests were performed on both ergom- eters within a few days of each other to avoid the possibility of drift or other changes taking place in the calibration apparatus between tests. The ergometers were in no way adjusted or altered prior to or during the calibration runs.
The calibrating accuracy was to be within 2 percent of true. In order to achieve such accuracy, it was necessary to keep the speed of the input shaft constant to within 1 percent while taking measurements on the ergometers.
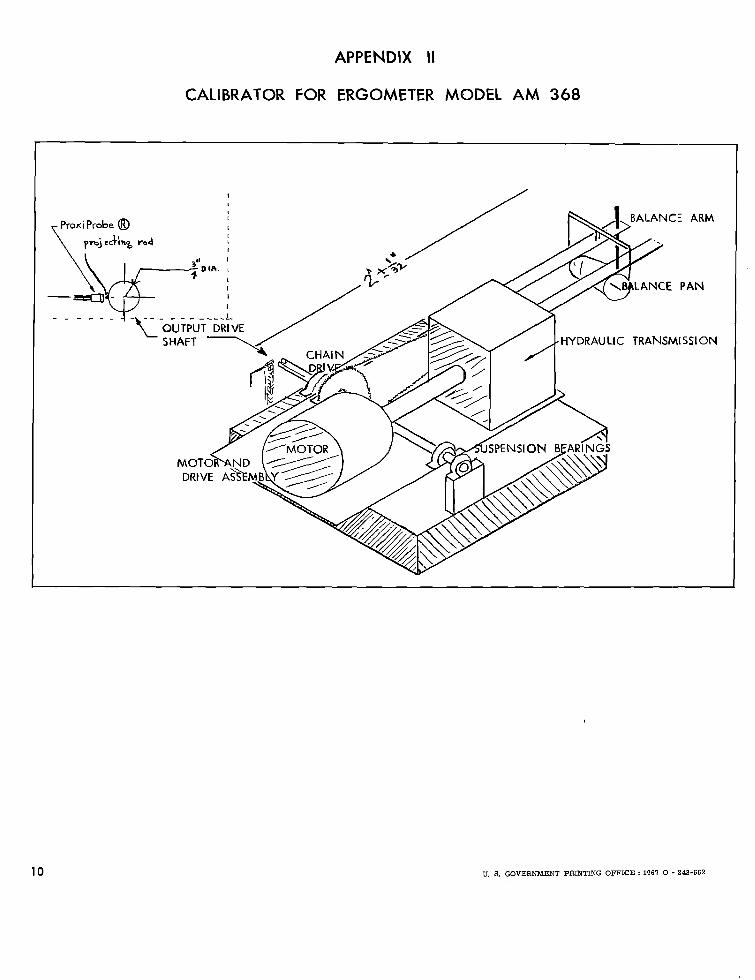
A calibrating device was constructed con- sisting of an electric motor coupled to a Vickers hydraulic transmission (see Appendix II). The motor was rated at H horsepower and operated continuously at 1,725 r.p.m. The hydraulic pump
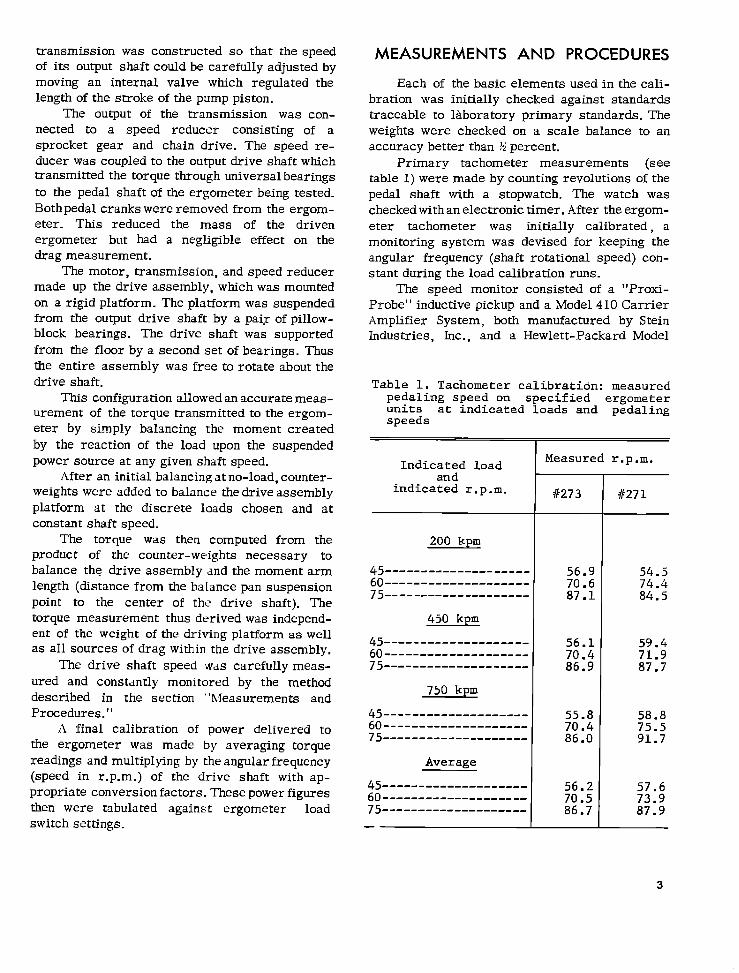
Uansmission was constructed so that the speedof its output shaft could be carefully adjusted bymoving an internal valve which regulated thelength of the smoke of the pump piston.
The output of the transmission was con-
nected to a speed reducer consisting of asprocket gear and chain drive. The speed re-ducer was coupled to the output drive shaft whichtransmitted the torque through universal bearings
to the pedal shaft of the ergometer being tested.
Both pedal cranks were removed from the ergom-eter. This reduced the mass of the drivenergometer but had a negligible effect on thedrag measurement.
The motor, transmission, and speed reducermade up the drive assembly, which was mountedon a rigid platform. The platform was suspendedfrom the output drive shaft by a paiy of pillow-block bearings. The drive shaft was supportedfrom the floor by a second set of bearings. Thusthe entire assembly was free to rotate about the
drive shaft.This configuration allowed an accurate meas-
urement of the torque transmitted to the ergom-eter by simply balancing the moment created
by the reaction of the load upon the suspendedpower source at any given shaft speed.
After an initial balancing at no-load, counter-weights were added to balance the drive assemblyplatform at the discrete loads chosen and atconstant shaft speed.
The torque was then computed from theproduct of the counter-weights necessary tobalance the drive assembly and the moment armlength (distance from the balance pan suspension
point to the center of the drive shaft). Thetorque measurement thus derived was independ-ent of the weight of the driving platform as wellas all sources of drag within the drive assembly.
The drive shaft speed was carefully meas-ured and constantly monitored by the method
described in the section ‘‘hleasurements andProcedures. ”
A final calibration of power delivered tothe ergometer was made by averaging torque
readings and multiplying by the angular frequency(speed in r.p.m.) of the drive shaft with ap-propriate conversion factors. These power figuresthen were tabulated against ergometer loadswitch settings.
MEASUREMENTS AND PROCEDURES
Each of the basic elements used in the cali-bration was initially checked against standardstraceable to l&borator y primary standards. Theweights were checked on a scale balance to anaccuracy better than %percent.
Primary tachometer measurements (seetable 1) were made by counting revolutions of thepedal shaft with a stopwatch. The watch was
checked with an electronic timer. After the ergom-eter tachometer was initially calibrated, a
monitoring system was devised for keeping theangular frequency (shaft rotational speed) con-stant during the load calibration runs.
The speed monitor consisted of a “Proxi-Probe” inductive pickup and a Model 410 CarrierAmplifier System, both manufactured by SteinIndustries, Inc., and a Hewlett-Packard Model
Table 1. Tachometer calibration: measuredpedaling speed on specified ergometerunits at indicated loads and pedalingspeeds
Indicated loadand
indicated r.p. rn.
200 kpm
45--------------------60--------------------75--------------------
450 kpm
45---------------------------- -------- ----
::--------------------
750 kpm
45--------------------60--------------------75--------------------
Average
45--------------------60---------------------75--------------------
Measured r.p. m.
#273
56.970.687.1
56.170.486.9
55.870.486.0
56.270.586.7
#27 1
54.574.484.5
59.471.987.7
58.875.591.7
57.673.987.9
3

140A oscilloscope. The inductive probe was
brought close to a projecting rod on the driveshaft (see Appendix II). The output of the probewas amplified by the carrier amplifier and dis-played on the oscilloscope. The time base was setfor 2 seconds sweep time and set for internal
trigger.Every third revolution triggered the oscillo-
scope, and the next succeeding pulse was displayedon the scope face with the sweep magnified 10:1.By making careful measurements of the point on
the sweep where the second of the two pulses oc-curred, it was possible to obtain accurate andinstantaneous speed readings.
The speed was continually monitored duringall of the runs and readjusted as necessary.
The actual testing procedure began with thecalibration of the weights to be used in balancingthe drive assembly. Balancing of the assemblyitself was accomplished next, after which thedrive shaft was attached to the ergometer, Thetransmission was set to drive the ergometer ata given rate of speed. The shaft was timed for
approximately 60 seconds to get the true r.p.m.indications.
At each load point (each setting of theswitches) the pedal shaft speed was checked forabout 10 seconds with the monitoring system,adjusted if necessary, and monitored again.
As the drive assembly became imbalancebecause of the drag exerted against it from the
electrical generator of the ergometer, weightswere placed on the suspension balance pan atthe end of the moment arm until the assemblyregained and held balance for a period of 1 minute.The amount of weight required to balance theassembly was logged, the ergometer turned off,the load switches reset, and the drive assemblyrebalanced without weights. This procedure wasrepeated for each of the load setting at intervalsof approximately 3 minutes, with each test runrequiring about 3 minutes.
The data collected (quantity of weights foreach point in each run) were then multiplied by
the length of the moment arm, yielding the ap-
plied torque. The torque, multiplied by theangular frequency (shaft speed) and appropriateconversion factors, yielded the calculated powerin kpm/M (Kg- M/Min). (See Appendix I.)
RESULTS
Tables 1-3 show, respectively, the resultsof the tachometer calibrations, a summ~zw y ofthe ergometer load calibrations, and the detailedcalibration data for each test run performed.
It should be noted that the tachometers onboth units drifted considerably. Because of the
Table 2. Calibration averages: averageload measurements on specified ergometerunits at indicated loads and pedalingspeeds
Indicated load
200250300350400450500550600650700750
Unit #273
kpm---------kpm---------kpm---------kpm---------kpm---------kpm---------kpm---------kpm---------kpm---------kpm---------kpm---------kDm---------
Indicated load
200250300350400450500550600650700750
Unit #271
kpm---------kpm---------kpm---------kpm---------kpm---------kpm---------kpm---------kpm---------kpm---------kpm---------kpm---------kpm---------
Calculated load
45/56r.p. m.]
168212260306354404449497546597644691
60/71r.p.m.]
182228279329377427471522577627676723
75/87r.p. m.L
——
230271321375418485535582642697749799.—
Calculated loacl
45/58r.p.m.:
141182225268312356399442486532573615
60/74r.p. m.l
141182229273310353401439482528569609
lIndicated r.p.m, /true r.p.m.
——
7sI/88
r.p.m.i
173210268307354398445492542595636686
4

Table 3. Calibration detail: load measurements on specified ergometer units at indi-cated loads and pedaling speeds
Indicated load
Unit #273
200 Kim------------------------------250 kpm -------.------------.---------300 kpm --.---.------.--------....----350 Kim------------------------------400 kpm ---.--------------------.-----45o kpm -.------.---.------.------..--500 Kim------------------------------55o kpm -----------------..--.--------600 Kim------------------------------650 kpm -..---.-------.--.-.-.--------700 kpm -.....-----.--.----.--.-..----750 Kim------------------------------
Indicated load
Unit #271
200 kpm --------.---..-----.----------250 kpm ------------------------------300 kpm ---.--------------------------35o kpm -.----------------------------400 kpm -----------.------------------450 kpm --.-----------------.---------500 Kim------------------------------550 Kim------------------------------600 Kim------------------------------650 kpm ------------------------------700 Kim------------------------------750 Kim------------------------------
Calculated load
45/56 r.p.m.t
174212258306357408454502542605647688
168216263307353405449:::
595642692
162208257305354402447494546593643691
166213261307353402446498548596644691
45/58 r.p.m.l
138181221269312356400443489533574617
141181224265310357397436480529571612-—
141182229270315356400444491537576623
60/71 r.p.m.l
176222272323370421464515568618667719
i80226278329378425472524583632680722
Calculated load
145184227268309356398444485529570609
181226277327376425468519573624674719
;;;
287337384435481531583633683732
60/74 r.p.m.l
153198252296336380434472517566611655
142184228274311352400439482524565608
127165207249284326369406447494531565
75/87r.p.m.L
230271321375418485535582642697749799
75/88 ~r.p.m.
173210268307354398445492542595636686
lhdicated r.p.m./true r.p.m.
5
wobble inherent in the needle indicator, it wasdifficult to determine indicated r.p.m. accurately.There appeared to be a 10 to 15 r.p.m. differencebetween indicated and true r.p.m. at all operatingspeeds, with a pronounced long-term downwarddrift noticeable in unit no. 273.
Further discussion of the data and theirimplication follows.
DISCUSSION OF RESULTS AND
SOURCES OF ERROR
Error for all the calibrating procedures hasbeen computed at less than 2 percent, as dis-
cussed below. Runs were repeated in part in
order to spot check the results. An interval ofseveral days between runs was allowed for spotchecking. In each of the points so checked, theobservable variance was under 1 percent.
An analysis of points of calibration on unit
no. 271 shows that between the range of 45 and60 r.p.m. (indicated), the ergometer presented aconstant power load for each switch setting in-dependent of pedal shaft speed. Above 60 r.p.m.
(indicated), however, the powerload increased.The difference ranged from approximately 20percent at the low end to 10 percent at the high
end of the observable range. In any case, allreadings indicated that this unit was deliveringless power than that selected by the switches.The deviation appeared to be about 20 percentfrom the true power output as measured at 60r .p ,m. (indicated) and at the true value of 500kpm/M (Kg-M/Min).
Unit no. 273 exhibited a constant power dif-ference between 45 and 60 r.p.m. (indicated):approximately 20 kpm/M (Kg-M/Min) measured
throughout the entire range. At the higher shaftspeeds, the difference was substantially greater—
nearly 50 kpm/M (Kg-M/Min).Deviation from true power output figures
was substantially less than in unit no. 271; thevalues at 60 r p.m. (indicated) were approximately18 kpm/M (Kg-M/Min) below the values selectedby the switch settings. This was within the 5 per-
cent figure claimed by the manufacturer through-out most of the calibration range.
Short-term drift of the machines was sosmall as to be barely measurable. Over the first
10 minutes a ckift of approximately 10 kpm/M(Kg-M/Min) was observed at most points. Thistime was long compared with testing intervals,and the long-term drift was not consideredsignificant.
Several sources of error are inherent in thecalibration technique chosen here. Frc~m theformula used in computing powerload (see Ap-pendix I) these are rotational speed, cc~unter -weights, and moment arm.
The rotational speed was measured with anoscilloscope which was checked against i~ stop-
watch. The watch was compared with an electronictimer and found to be accurate to within 10seconds in 24 hours, or an error of ~0.01. 1 per-
cent. The error associated with timing the os -
cilloscope was estimated at 2 milliseconds in 1second, or ~0,20 percent. Thus, the co]mbinedinaccuracies associated with reading and meas-
uring the pedal shaft rotational speed producedan error of *0.381 percent, or about 1/3 per-
cent.The counter-weights were checked at the
University of Maryland. Weights of 100 gramsand less were checked on an analytical balancewith an accuracy to four decimal places. Thelarger weights were then compared with thesmaller ones on a torsion balance. The ma ximumerror was -0.53 percent, but the sum of all devia-tions was under -0.04 percent. All readings duringthe calibration procedure were corrected byadding to the logged amount a correction factorcorresponding to the known deviations of theweights used.
The moment arm was measured with anaccurate metal scale, but due to difficulties of
measurement, accuracy was estimated at 1./8 inchin 24 inches, or LO.50 percent.
In addition to these errors, an indeter-minacy of measurement of the exact lbalancepoint due to the dynamic imbalance of the cali-brating apparatus introduced another error factor
This indeterminacy was estimated at 10 gramsover most of the range, and at about 15 gramsat the high end. This is equivalent to approxim-ately 1 percent at the low end and 0.7 percentnear the center of the range.
Therefore, summing all inaccuracies to de-
termine worst case error, error factors of ap-proximately 1.6 percent near the center of the
6

Table 4. Calibration error: standard error and relative error of load measurements onspecified ergometer units at indicated loads and pedaling speeds
Indicated load
Unit #273
zoo Kim----------------250 kpm----------------300 Kim----------------35o Kim----------------400 Kim----------------450 kpm------------_---500 kpm----------------550 kpm----------------600 lcpm-------------- .-650 kpm----------------700 kpm----------------750 kpm----------------
Indicated load
Unit #271
200 lcprn----------------250 kpm----------------300 kpm----------------350 kpm----------------400 kpm----------------450 kpm----------------500 kpm----------------550 kpm----------------600 kpm----------------650 kpm----------------700 kpm----------------750 kpm----------------
EGzIEzzStandard error in kpm
5.03.32.81.0
;:;3.63.62.55.32.21.7
I
45/58 r.p.m.l 60/74 r.p.m.l
Standard error in kpm
2.91.43.52.22.60.51.5
::;
;:;6.1
13.016.622.523.526.o27.032,533.035.036.240.145.0
45/56 r.p.m.l 60/71 r.p.m.l
Relative error in percent
3.0
H0.30.50.70.80.70.50.90.30.3
3.5
:::1,8
1.31.1
45/58 r.p.m.l 60/74 r.p.m.l
Relative error in percent
2.00.8
1.0
u1.0
9.3
8.68.47.78.17.57.36.8
;::
lIndicated r.p.m./ true r.p.m.
7

range and 2 percent at the low end are obtained.Another way to evaluate the relative error is toexamine the data in table 3 by standard statisticalmethods. This is done ti table 4. At each indi-
cated load the standard error ~ (w
in the usual notation) and the relative error
(100 s / Z) are tabulated for each indicated loadsetting. The relative error is greater at lower
loads and at higher r.p.m., but it is generally ofthe order of magnitude indicated by the previouscalculations. Some of this r‘error ,“ of course,represents variation in the ergometers’ per-formance over the succession of runs, but it isevident from the previous reckoning that theergometer variation must be small indeed and that
almost all of the indicated variation representsmeasurement error.
The exceptions to this rule of high re-liability are the measurements of bicycle no.271made at a nominal speed of 60 r .p.m. Relativeerror of the three runs at this speed rangedroughly between 7 and 10 percent. These highvalues may represent some technical lapse, butin all likelihood they are largely a measure ofmachine instability at that speed. The three
runs were actually done at true speeds of 72,77, and 84 r.p.m., respectively. The variationin speed arose from the great instability of thetachometer. In trying to reproduce a normaloperating situation the machine was being usedin a range outside of the recommended 45-75r p.m. and across a range of speeds. This may
well be an accurate representation of the usualoperating experience, but if it is, the operating
experience with this machine includes a sub-stantial measurement variability.
000
8
APPENDIX 1
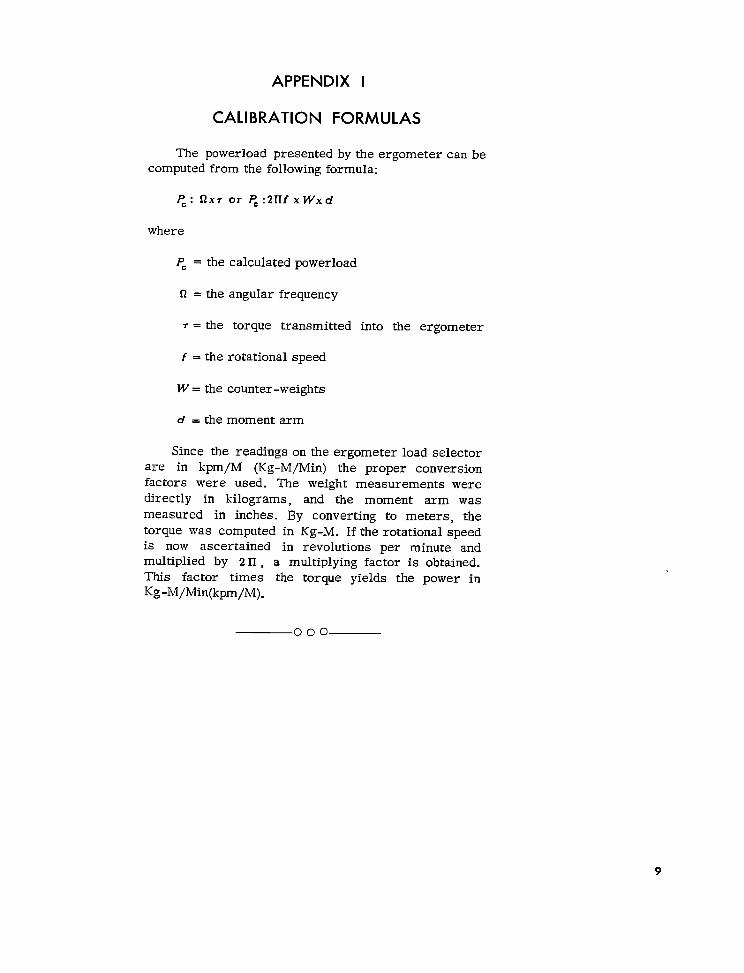
CALIBRATION FORMULAS
The powerload presented by the ergometer can becomputed from the following formula:
where
PC = the calculated powerload
Cl = the angular frequency
7 = the torque transmitted into the ergometer
f = the rotational speed
W = the counter-weights
d = the moment arm
Since the readings on the ergometer load selector
are in kpm/M (Kg-M/Min) the proper conversionfactors were used. The weight measurements weredirectly in kilograms, and the moment arm wasmeasured in inches. By converting to meters, thetorque was computed in Kg-M. If the rotational speedis now ascertained in revolutions per minute andmultiplied by 211, a multiplying factor is obtained.This factor times the torque yields the power inKg-hl/Min(kpm/M).
000
9
APPENDIX II
CALIBRATOR FOR ERGOMETER MODEL AM 368
I /
\~– i
3“ ‘~Dlfi. t
—==UI -
---- ___ ---- -------
\OUTPUT DR;VESHAFT ~ ‘/’
/“ BALANCIE ARM
●
‘/F x.4’%-
TRAN.SM[ SS1 ON
U. S. GOVES.NMENT PRINTING OFFICE :1967 0-243-662

Series 1. Programs and collection procedures .-Reports which describe the general programs of the National Center for Health Statistics and its offices and divisions, data collection methods used, definitions, and other material necessary for understanding the data.
Series 2. Data evaluation and methods yesearch .-Studies mental tests of new survey methods,
of new statistical methodology including: experi- studies of vital statistics collection methods, new analytical
techniques, objective evaluations of reliability of collected data, contributions to statistical theory.
Series 3. Analytical studies.- Reports presenting analytical or interpretive studies based on vital and health statistics, carrying the analysis further than the expository types of reports in the other series.
Series 4. Documents and committee reports .-Final reports of major committees concerned with vital and health statistics, and documents such as recommended model vital registration laws and revised birth and death certificates.
Series 10. Data from the Health Interview Survey .-Statistics on illness, accidental injuries, disability, use of hospital, medical, dental, and other services, and. other health-related topics, based on data collected in a continuing national household interview survey.
Series 11. Data from the Health Examination Survejl _ .-Data from direct examination, testing, and measure- ment of national samples of the population prov+de the basis for two types of reports: (1) estimates of the medically defined prevalence of specific diseases in the United States and the distributions of the population with respect to physical, physiological, and psychological characteristics; and (2) analysis of relationships among the various measurelnents without reference to an explicit finite universe of persons.
Series 12. Data from the Znstitutional Population Surveys . .-Statistics relating to the health characteristics of persons in institutions, and on medical, nursing, an? personal care received, based on national samples of establishments providing these services and samples of the residents or patients.
Series 13. Data from. the Hospital Discharge Survey _ .-Statistics relating to discharged patients in short-stay hospitals, based on a sample of patient records in a national sample of hospitals.
Series 20. Data on mortality .-Various statistics on mortality other than as included in annual or monthly reports- special analyses by cause of death, age, andot5er demographic variables, also geographic and time series analyses.
Series 21. Data on natality, marriage, anddivorce . -Various statistics onnatality, marriage, and divorce other than as included in annual or monthly reports -special analyses by demographic variables, also geographic and time series analyses, studies of fertility.
OUTLtNE OF REPORT SERIES FOR VITAL AND HEALTH STATISTICS
Public Health Service Publication No. 1000
Series 22. Data from the National Natality and Mortality S?rrveys . -Statistics on characteristics of births and deaths not available from the vital records, based on sample surveys stemming from these records, including such topics as mortality by socioeconomic class, medical experience in the last year of life, characteristics of pregnancy, etc.
For a list of titles of renorts published in these series, write to: Office of Information and Publications National Center for IIealth Statistics U.S. Public Health Service washingron, D.C. 20201


![Control andSelf-Calibrationof MicroscaleRateIntegrating ... · Gyroscopes(FOGs)andintegrated-opticsgyroscopes[16,17]. The operating principle of optical gyroscopes is based on the](https://img.pdfslide.net/doc/110x75/5fb8aa0c6cc97e21462b9a03/control-andself-calibrationof-microscalerateintegrating-gyroscopesfogsandintegrated-opticsgyroscopes1617.jpg)