Embed Size (px)
Citation preview
Software Quality
Unit 2. Advanced techniques
Calidad del Software
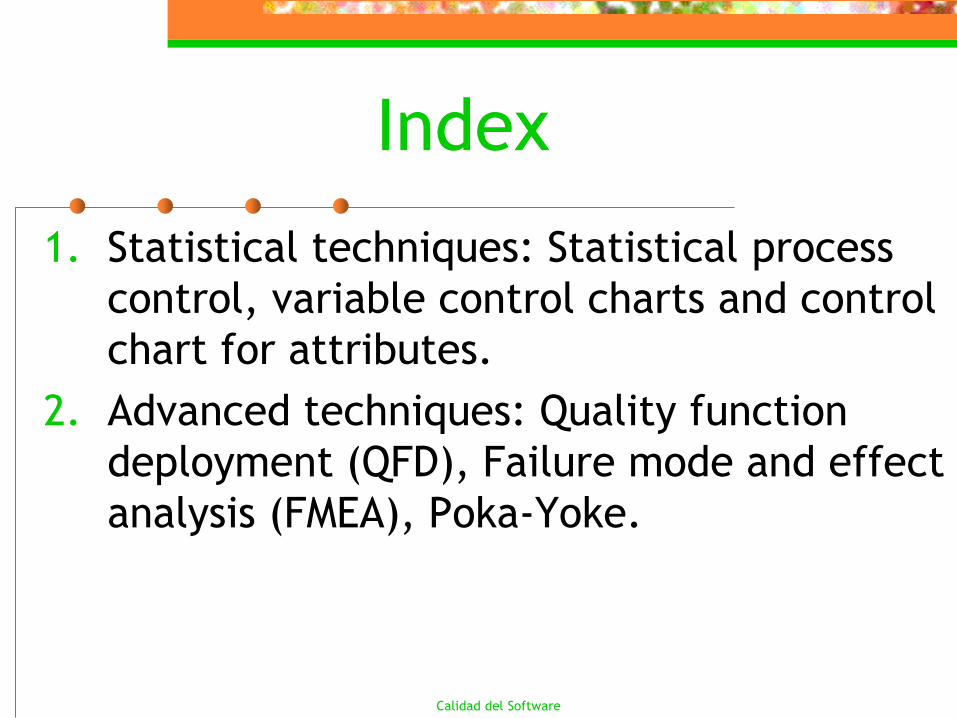
Index
1. Statistical techniques: Statistical process
control, variable control charts and control
chart for attributes.
2. Advanced techniques: Quality function
deployment (QFD), Failure mode and effect
analysis (FMEA), Poka-Yoke.
Calidad del Software
GOALS:
Process stability observation trough
statistical techniques.
Continuous process improvement.
To study the way in which process
variables can affect essential
characteristic of the product or service.
Statistical process control (SPC)
Calidad del Software
SPC is a tool which permits to predict, reduce and maintain variations within reasonable limits.
It is possible to find out:
•Controllable variables (assignable causes): changes in the raw material, breakdown in the machinery...
•Uncontrollable variables (non assignable causes): random variables …
Statistical process control (SPC)
Calidad del Software
A process is said to be under statistical
control when it is only affected by random
variables due to non assignable causes.
If it is also affected by assignable causes, it
is said that the process is out of statistical
control.
In SPC variations are measured, it is study
their causes and they are corrected.
Statistical process control (SPC)
Calidad del Software
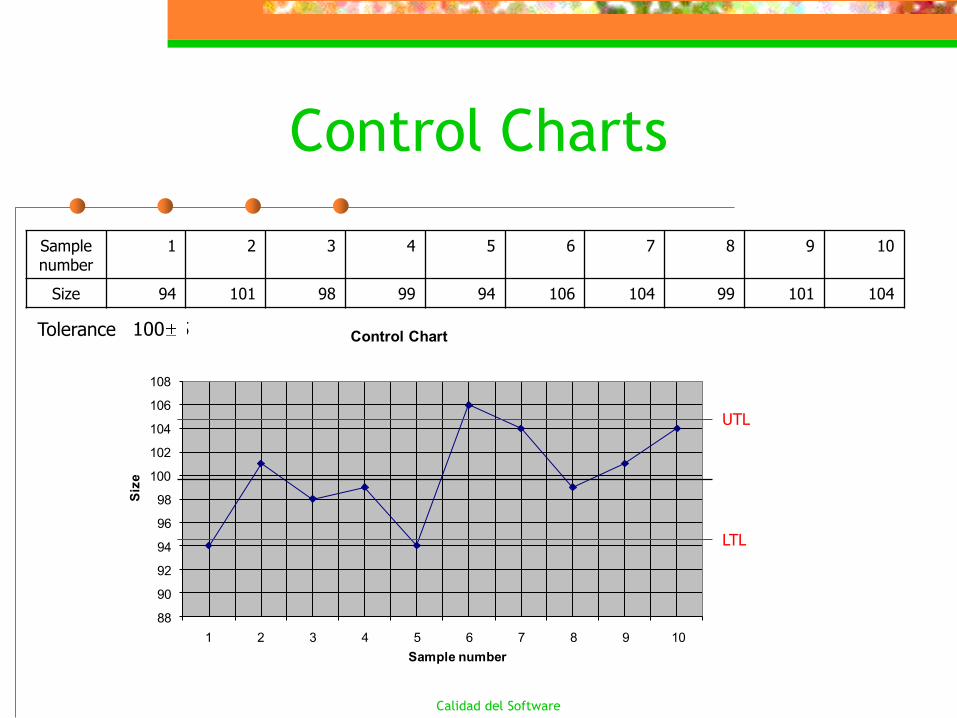
It is a plotting graph in which a central line and tolerance limits (upper and lower) appears. This lines permit to study the variation of a determine variable (plotted values) with respect to the central line.
To do that, samples are periodically taken during the manufacturing process. The average and variability of the process are studied, and the process are kept under statistical control.
Control Charts
Calidad del Software
Control Charts
88
90
92
94
96
98
100
102
104
106
108
1 2 3 4 5 6 7 8 9 10
Siz
e
Sample number
Control Chart
UTL
LTL
Samplenumber
1 2 3 4 5 6 7 8 9 10
Size 94 101 98 99 94 106 104 99 101 104
Tolerance 5100
Calidad del Software
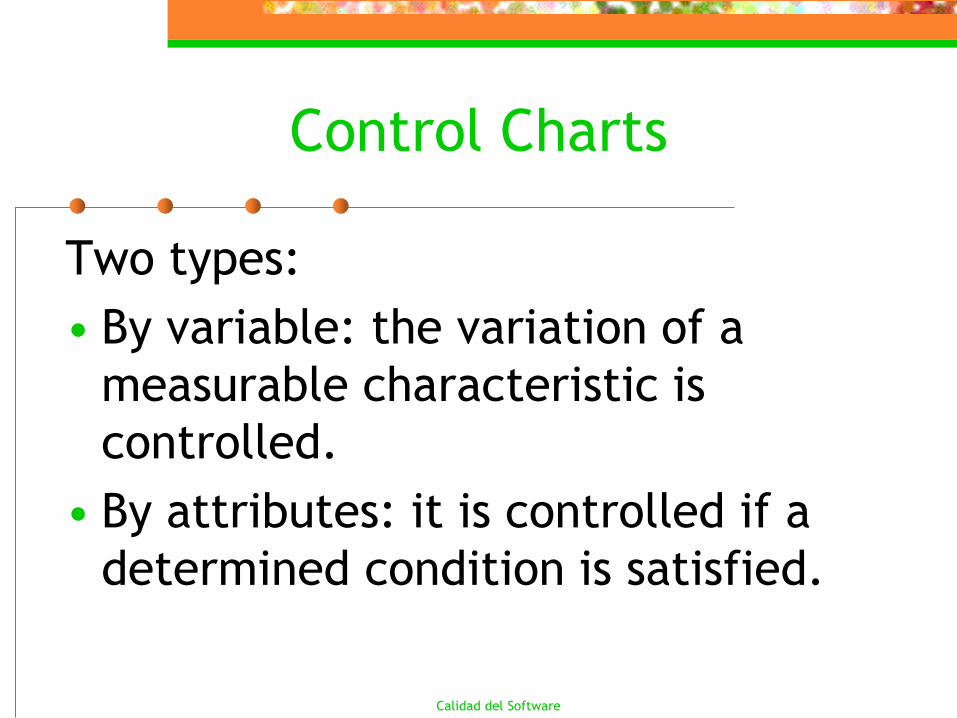
Two types:
• By variable: the variation of a
measurable characteristic is
controlled.
• By attributes: it is controlled if a
determined condition is satisfied.
Control Charts
Calidad del Software
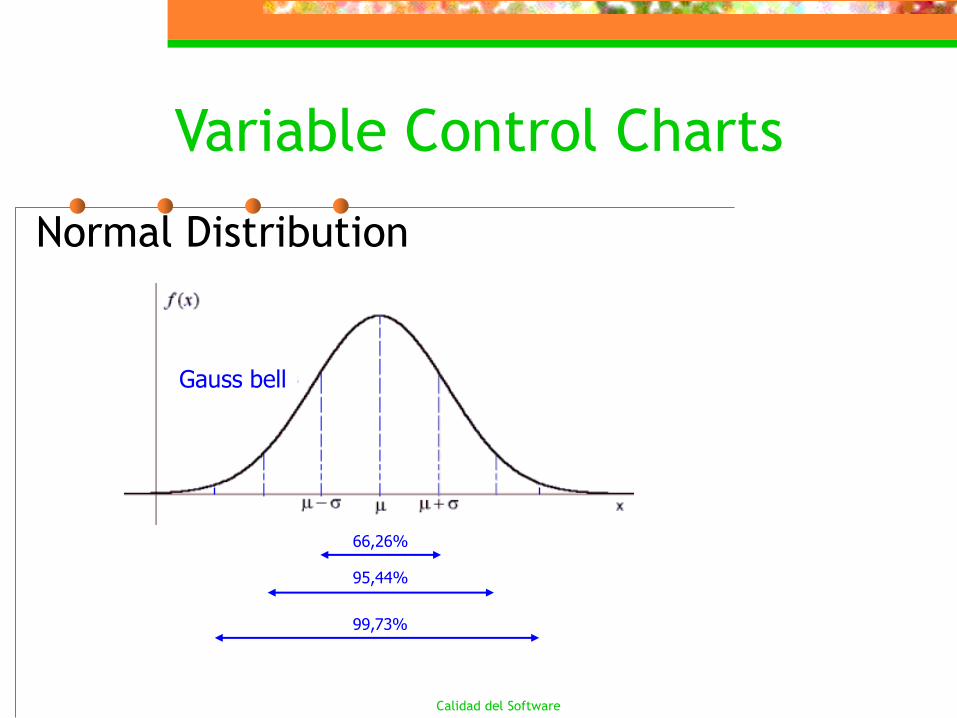
Normal Distribution
Variable Control Charts
66,26%
95,44%
99,73%
Gauss bell
Calidad del Software
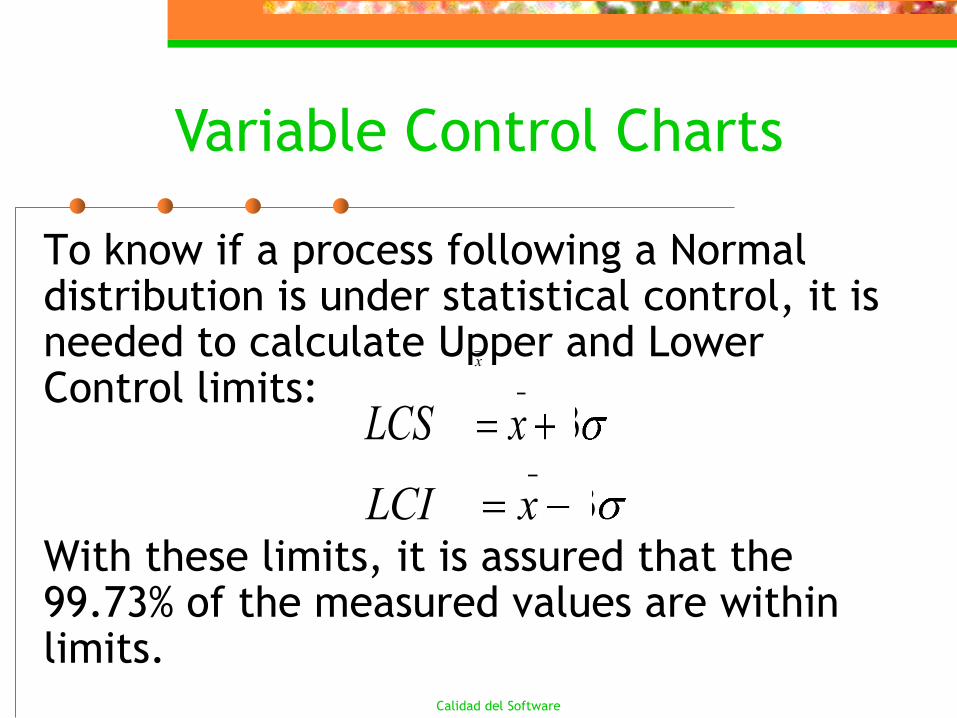
To know if a process following a Normal distribution is under statistical control, it is needed to calculate Upper and Lower Control limits:
With these limits, it is assured that the 99.73% of the measured values are within limits.
Variable Control Charts
x
3xLCI
3xLCS
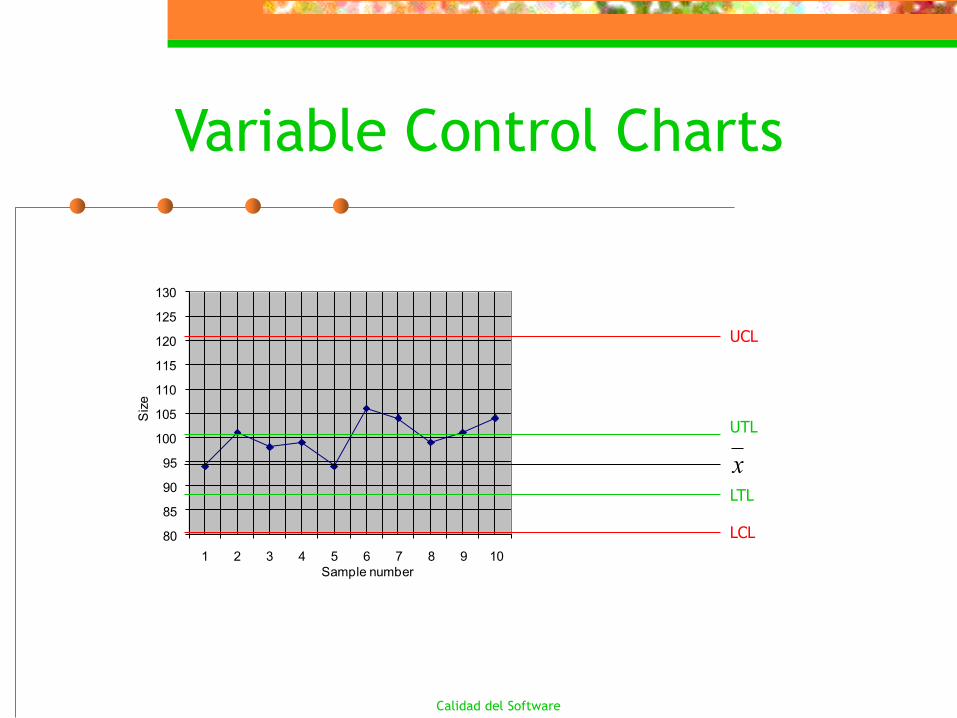
Calidad del Software
Variable Control Charts
80
85
90
95
100
105
110
115
120
125
130
1 2 3 4 5 6 7 8 9 10
Siz
e
Sample number
UTL
LTL
UCL
LCL
x
Calidad del Software
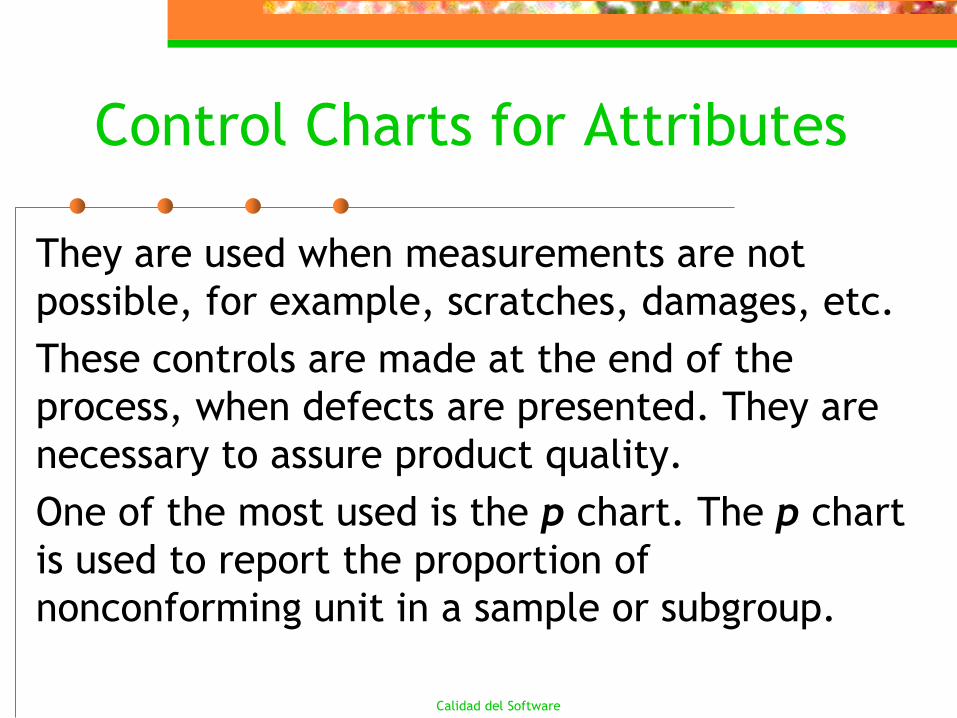
They are used when measurements are not
possible, for example, scratches, damages, etc.
These controls are made at the end of the
process, when defects are presented. They are
necessary to assure product quality.
One of the most used is the p chart. The p chart
is used to report the proportion of
nonconforming unit in a sample or subgroup.
Control Charts for Attributes
Calidad del Software
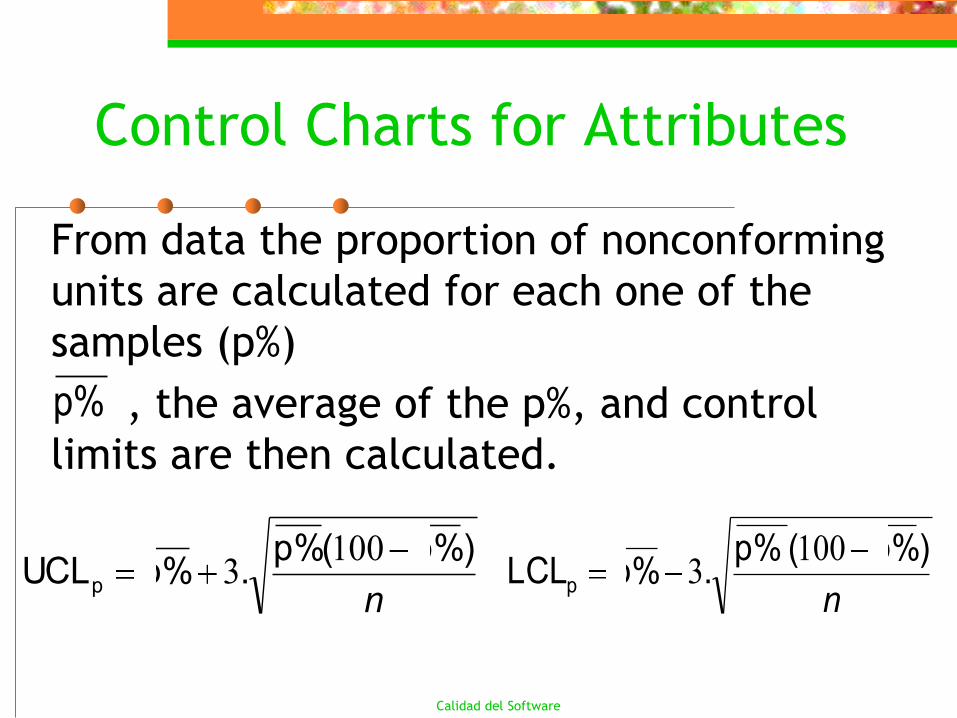
From data the proportion of nonconforming
units are calculated for each one of the
samples (p%)
, the average of the p%, and control
limits are then calculated.
Control Charts for Attributes
n
)p%(p%.p%UCLp
1003
n
)p%( p%.p%LCLp
1003
p%
Calidad del Software
Control Charts for Attributes
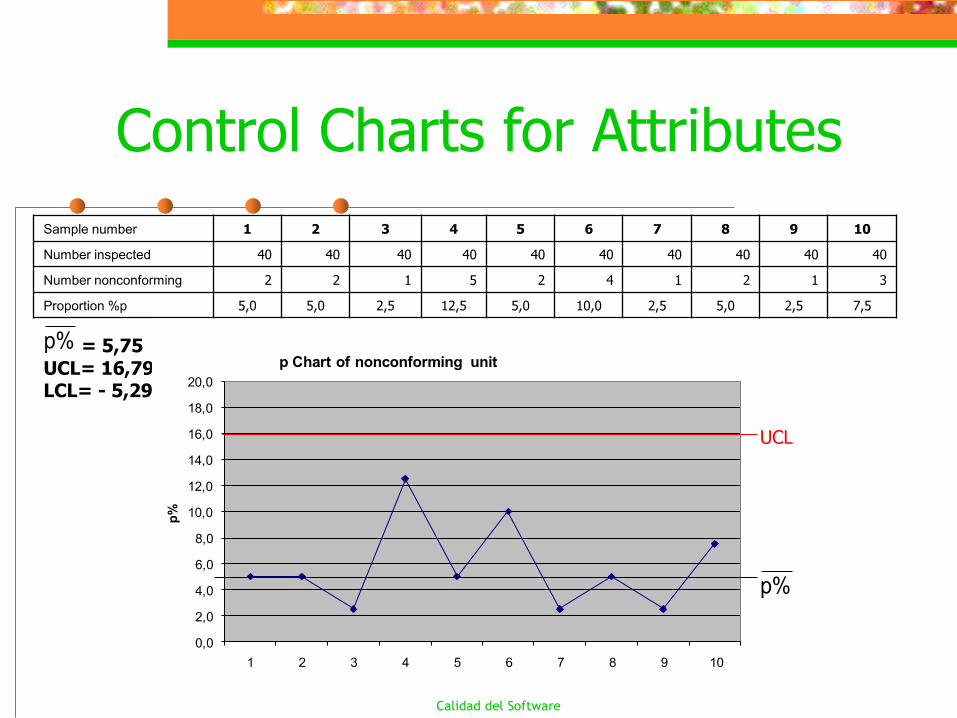
Sample number 1 2 3 4 5 6 7 8 9 10
Number inspected 40 40 40 40 40 40 40 40 40 40
Number nonconforming 2 2 1 5 2 4 1 2 1 3
Proportion %p 5,0 5,0 2,5 12,5 5,0 10,0 2,5 5,0 2,5 7,5
p% = 5,75UCL= 16,79LCL= - 5,29
0,0
2,0
4,0
6,0
8,0
10,0
12,0
14,0
16,0
18,0
20,0
1 2 3 4 5 6 7 8 9 10
p%
p Chart of nonconforming unit
p%
UCL
Calidad del Software
It is said that a process or machine is
capable when they meet specifications.
Process capability is not only used to assure
that process are under statistical control,
but also to minimize the number of
nonconforming units.
Process Capability
Calidad del Software
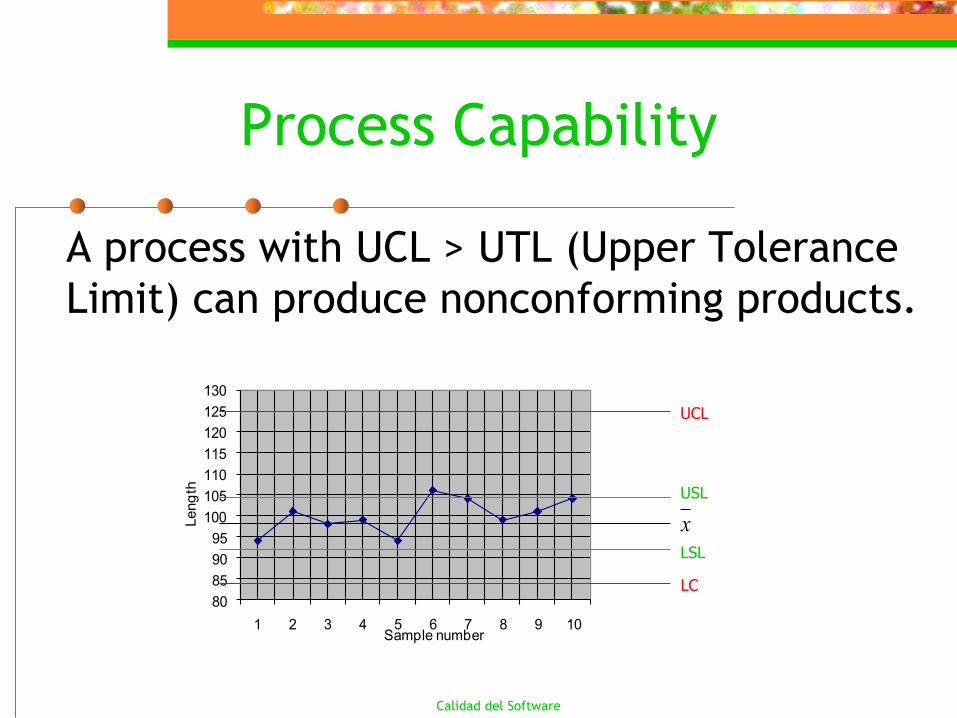
A process with UCL > UTL (Upper Tolerance
Limit) can produce nonconforming products.
80
85
90
95
100
105
110
115
120
125
130
1 2 3 4 5 6 7 8 9 10
Leng
th
Sample number
USL
LSL
UCL
LC
x
Process Capability
Calidad del Software
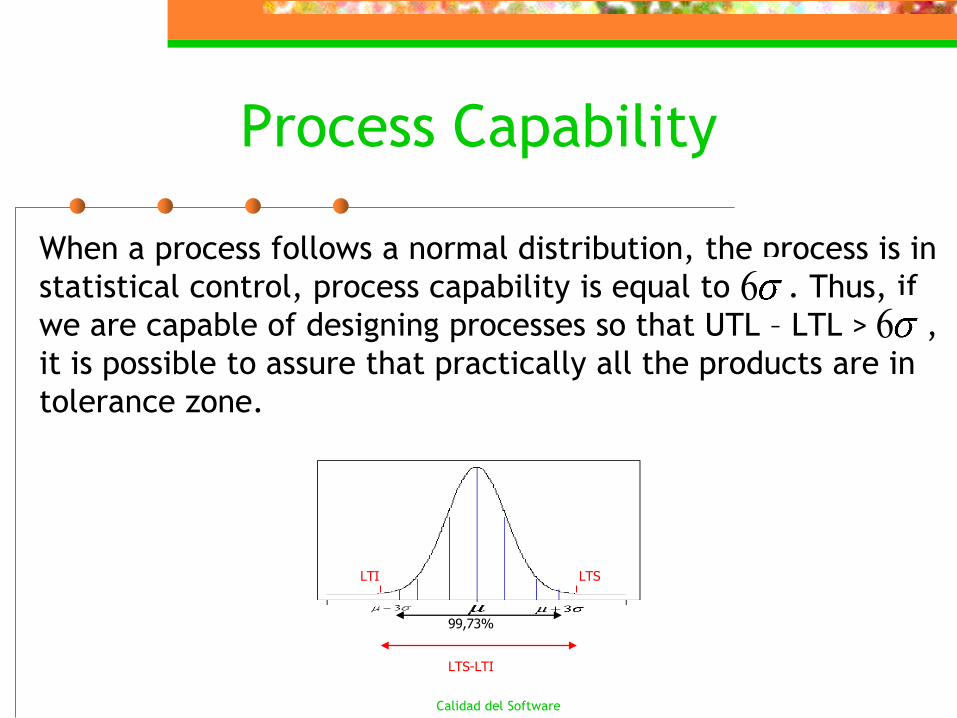
When a process follows a normal distribution, the process is in
statistical control, process capability is equal to . Thus, if
we are capable of designing processes so that UTL – LTL > ,
it is possible to assure that practically all the products are in
tolerance zone.
6
Process Capability
LTI LTS
LTS-LTI
99,73%
6
Calidad del Software
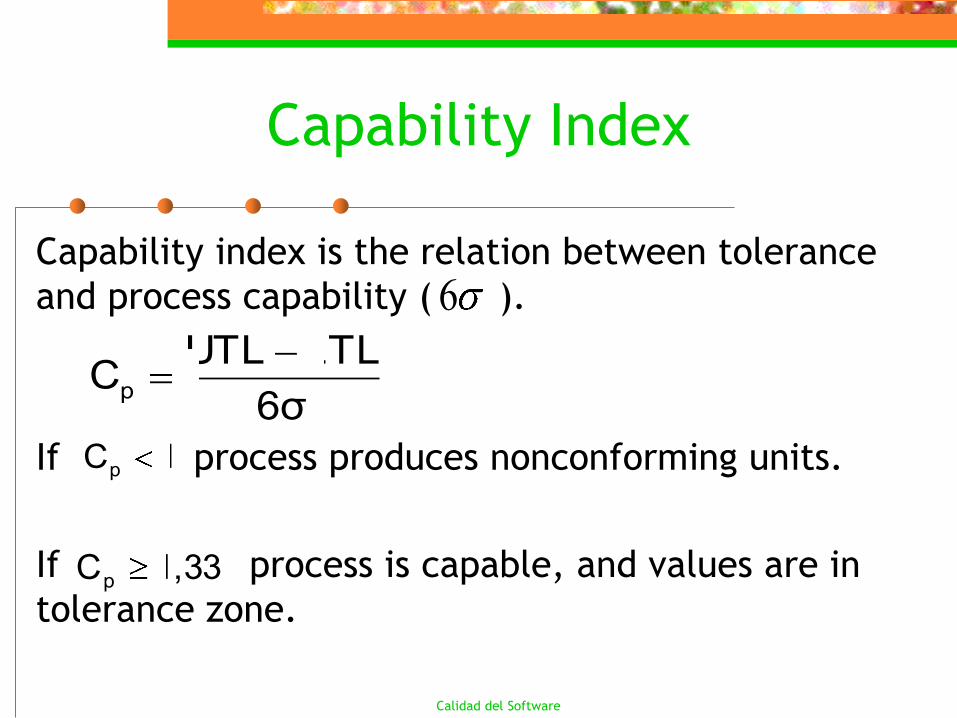
Capability index is the relation between tolerance
and process capability ( ).
If process produces nonconforming units.
If process is capable, and values are in
tolerance zone.
Capability Index
6
6σ
LTLUTLCp
1Cp
1,33Cp
Calidad del Software
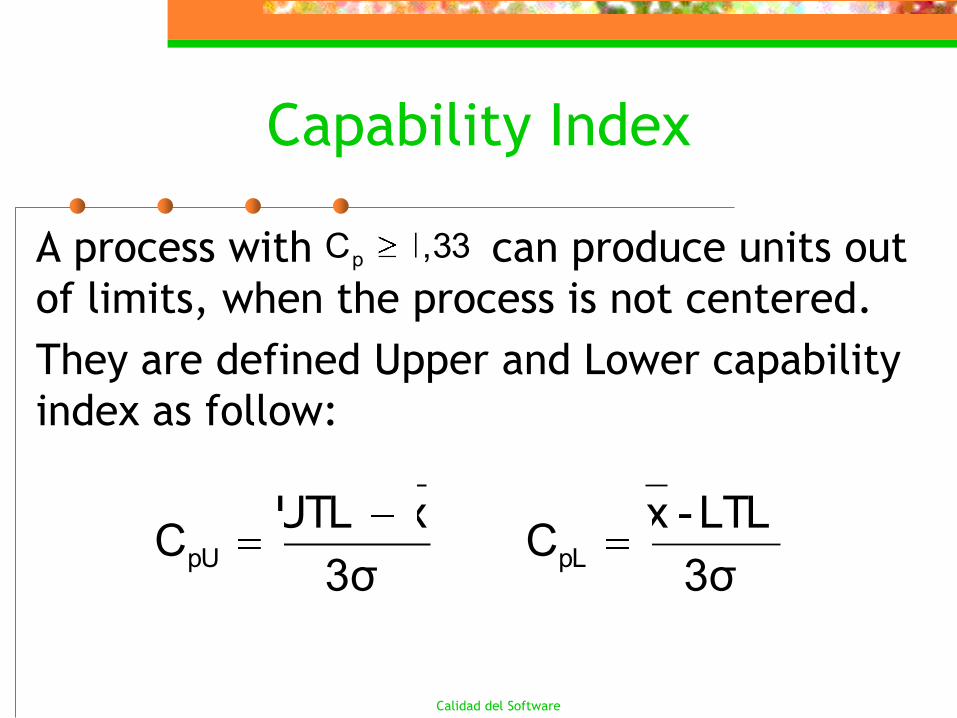
Capability Index
A process with can produce units out
of limits, when the process is not centered.
They are defined Upper and Lower capability
index as follow:
1,33Cp
3σ
xUTLCpU
3σ
LTL-xCpL
Calidad del Software
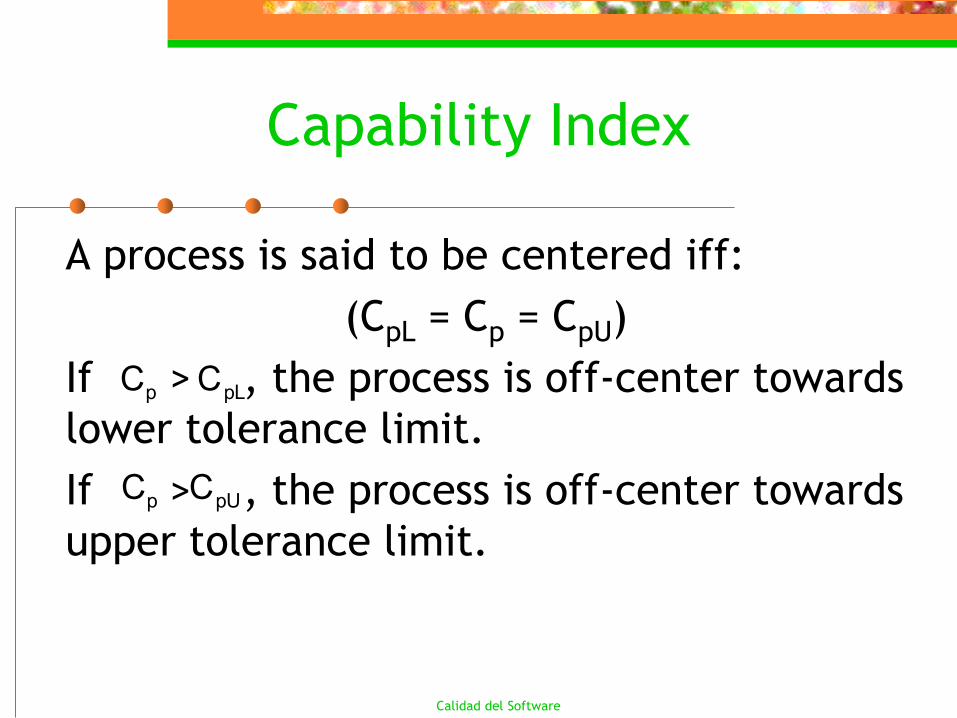
A process is said to be centered iff:
(CpL = Cp = CpU)
If > , the process is off-center towards
lower tolerance limit.
If > , the process is off-center towards
upper tolerance limit.
Capability Index
pC pUC
pC pLC
Calidad del Software
It is an acceptation by inspection
technique.
A shipment or lot is accepted if a small
sample of the product meets
specifications.
Sampling plans
Calidad del Software
PROBLEMS:
•How to determine the size of the
sample?
•Which criteria use to accept or reject
the lot?
Sampling plans
Calidad del Software
SOLUTIONS:
•Characteristic function of defect per
lot.
•Specific software for determining
•UNE 66020 tables.
Sampling plans
Calidad del Software
It is a very useful tool to:
• Know customer wishes.
• Define product or service characteristics and requirements.
• Reduce development time.
• Reduce complaints.
• Remove non valuable processes.
Quality Function Deployment (QFD)
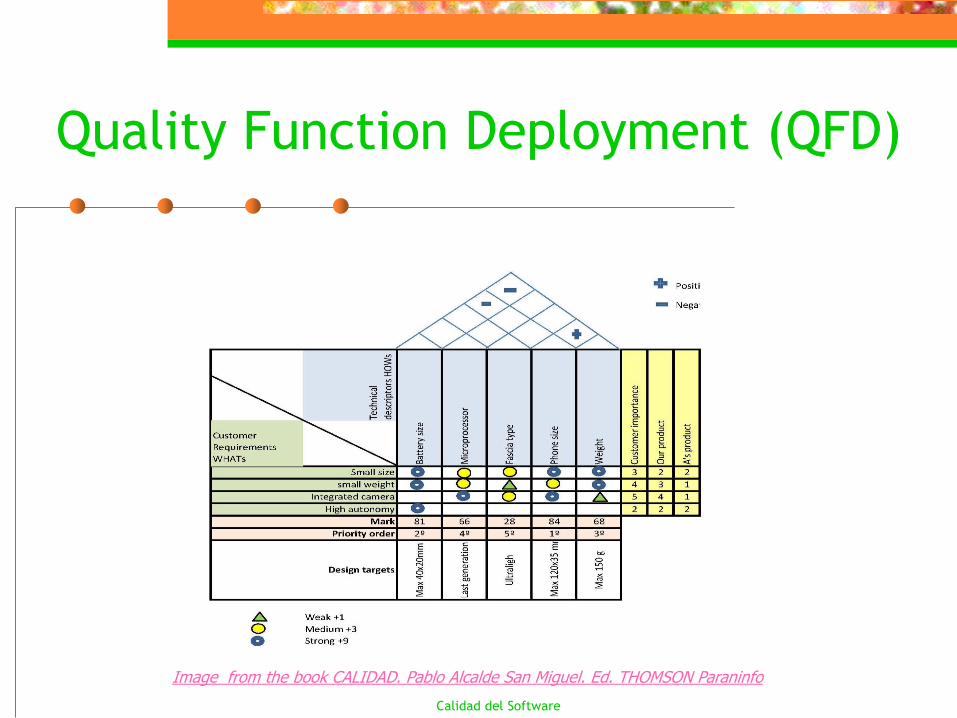
Calidad del Software
House of quality is the primary tool used
in QFD. It is a matrix in which Customer
Requirements (CR) are correlated with
prioritized Technical Descriptors(TD).
Quality Function Deployment (QFD)
Calidad del Software
Steps to build up the matrix:
1. List Customer Requirements (WHATs).
2. Group customer data.
3. Assign priorities to CR’s.
4. List Technical Descriptors (HOWs).
5. Group technical descriptors (affinity
diagram).
Quality Function Deployment (QFD)
Calidad del Software
6. Develop a relationship matrix between
WHATs & HOWs.
7. Develop an interrelationship matrix
between HOWs.
8. Competitive assessment (compare with
current products in the market).
Quality Function Deployment (QFD)
Calidad del Software
9. Develop objective measures per Technical
Descriptor (TD).
10.Establish objectives per TD.
11.Select TD of urgent attention.
Quality Function Deployment (QFD)
Calidad del Software
Quality Function Deployment (QFD)
Image from the book CALIDAD. Pablo Alcalde San Miguel. Ed. THOMSON Paraninfo
Calidad del Software
FMEA is a preventive and multidisciplinary teamwork technique that it is performed in a planned and systematically way in order to detect failures in a design, product or service.
Failure Mode and Effect Analysis
(FMEA)
Calidad del Software
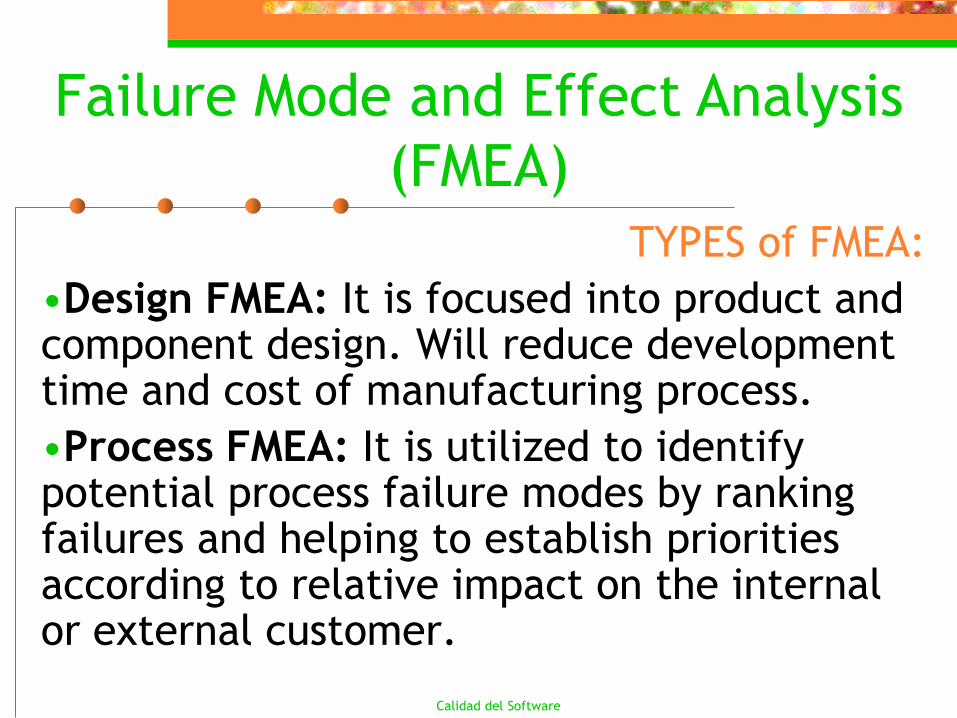
TYPES of FMEA:
•Design FMEA: It is focused into product and component design. Will reduce development time and cost of manufacturing process.
•Process FMEA: It is utilized to identify potential process failure modes by ranking failures and helping to establish priorities according to relative impact on the internal or external customer.
Failure Mode and Effect Analysis
(FMEA)
Calidad del Software
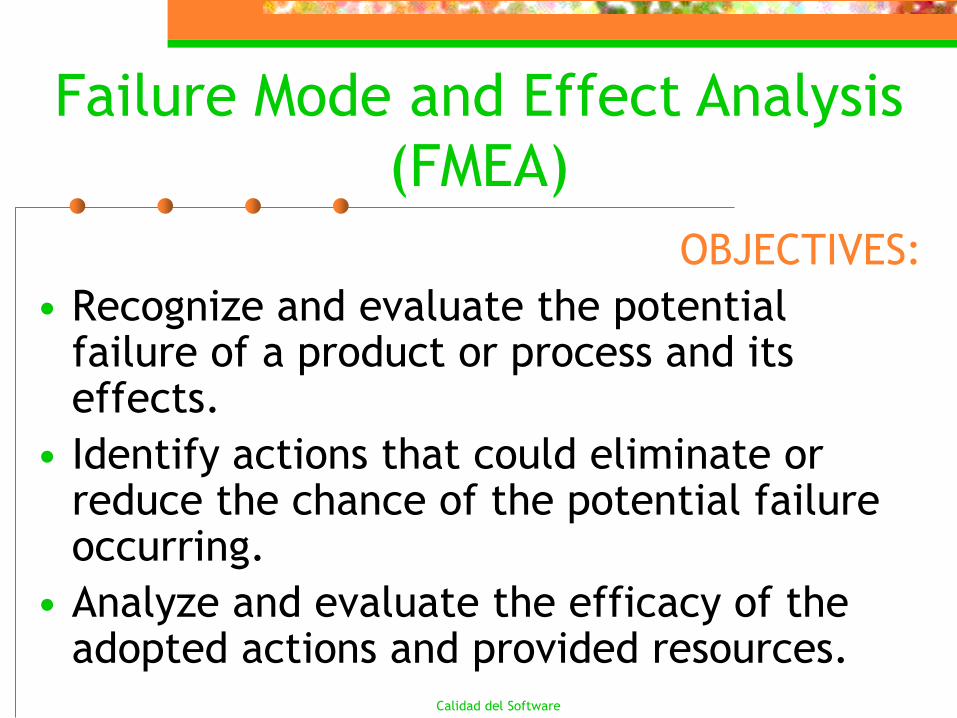
OBJECTIVES:
• Recognize and evaluate the potential failure of a product or process and its effects.
• Identify actions that could eliminate or reduce the chance of the potential failure occurring.
• Analyze and evaluate the efficacy of the adopted actions and provided resources.
Failure Mode and Effect Analysis
(FMEA)
Calidad del Software
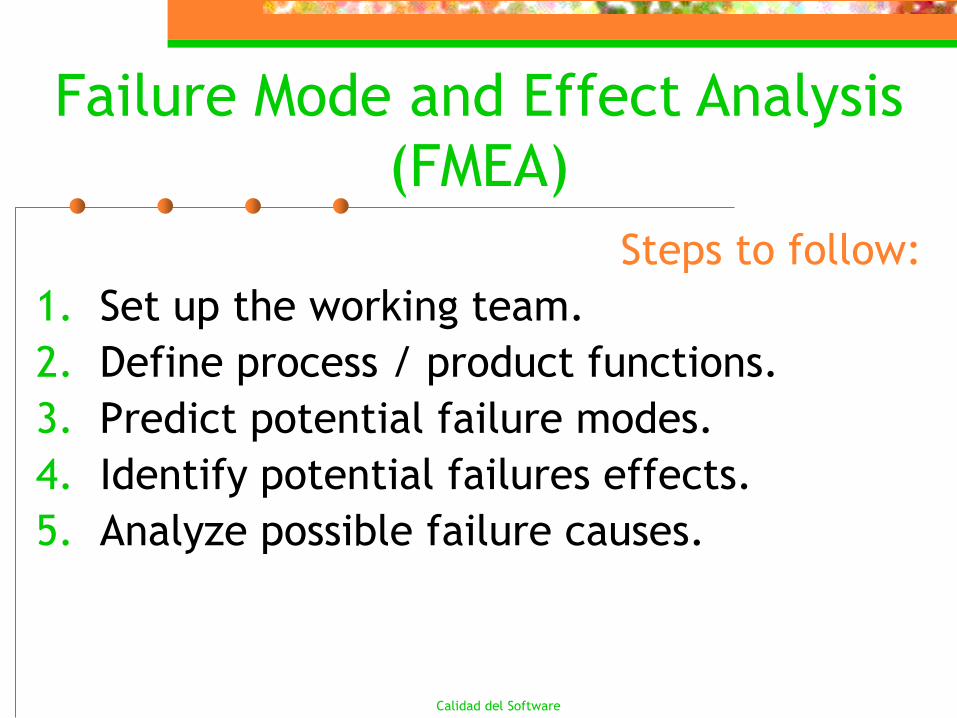
Steps to follow:
1. Set up the working team.
2. Define process / product functions.
3. Predict potential failure modes.
4. Identify potential failures effects.
5. Analyze possible failure causes.
Failure Mode and Effect Analysis
(FMEA)
Calidad del Software
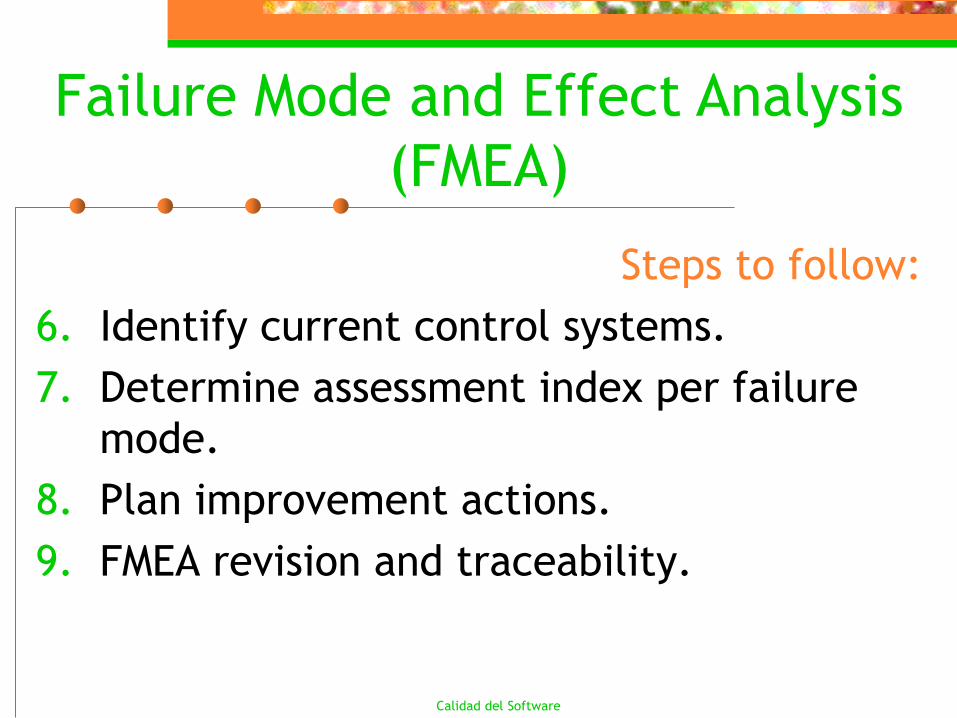
Steps to follow:
6. Identify current control systems.
7. Determine assessment index per failure
mode.
8. Plan improvement actions.
9. FMEA revision and traceability.
Failure Mode and Effect Analysis
(FMEA)
Failure Mode and Effect Analysis
(FMEA)
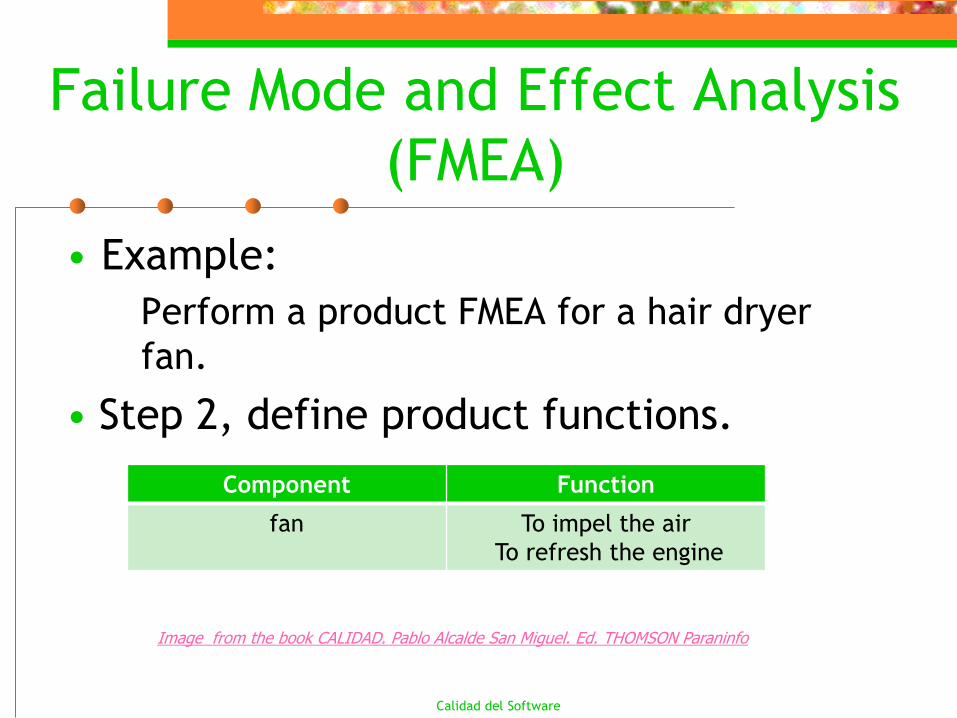
• Example:
Perform a product FMEA for a hair dryer
fan.
• Step 2, define product functions.
Calidad del Software
Image from the book CALIDAD. Pablo Alcalde San Miguel. Ed. THOMSON Paraninfo
Component Function
fan To impel the air
To refresh the engine
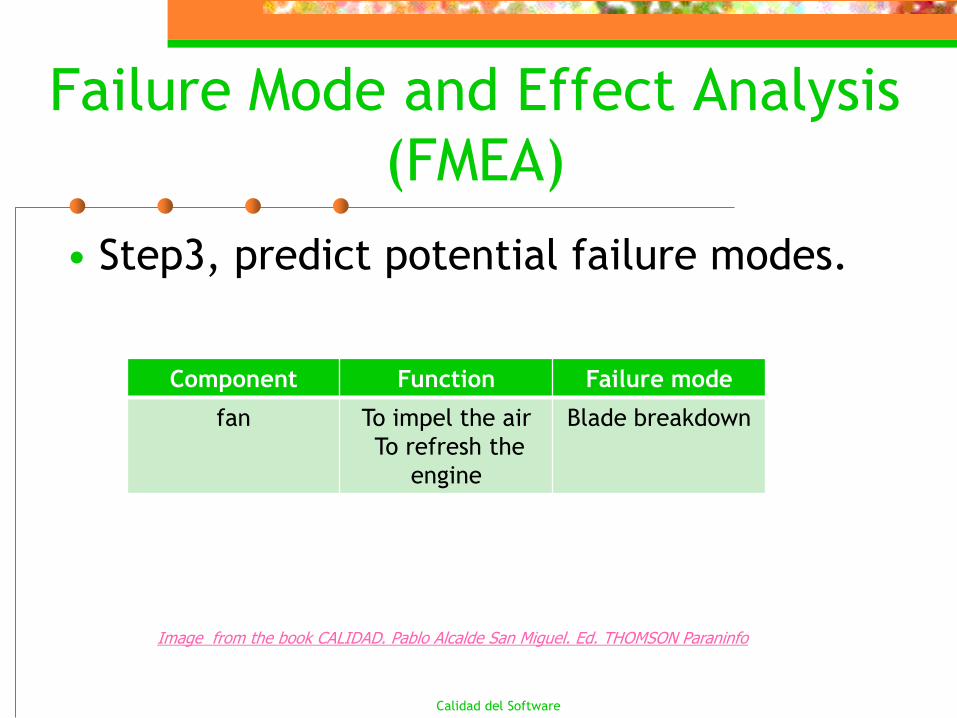
Failure Mode and Effect Analysis
(FMEA)
• Step3, predict potential failure modes.
Calidad del Software
Component Function Failure mode
fan To impel the air
To refresh the
engine
Blade breakdown
Image from the book CALIDAD. Pablo Alcalde San Miguel. Ed. THOMSON Paraninfo
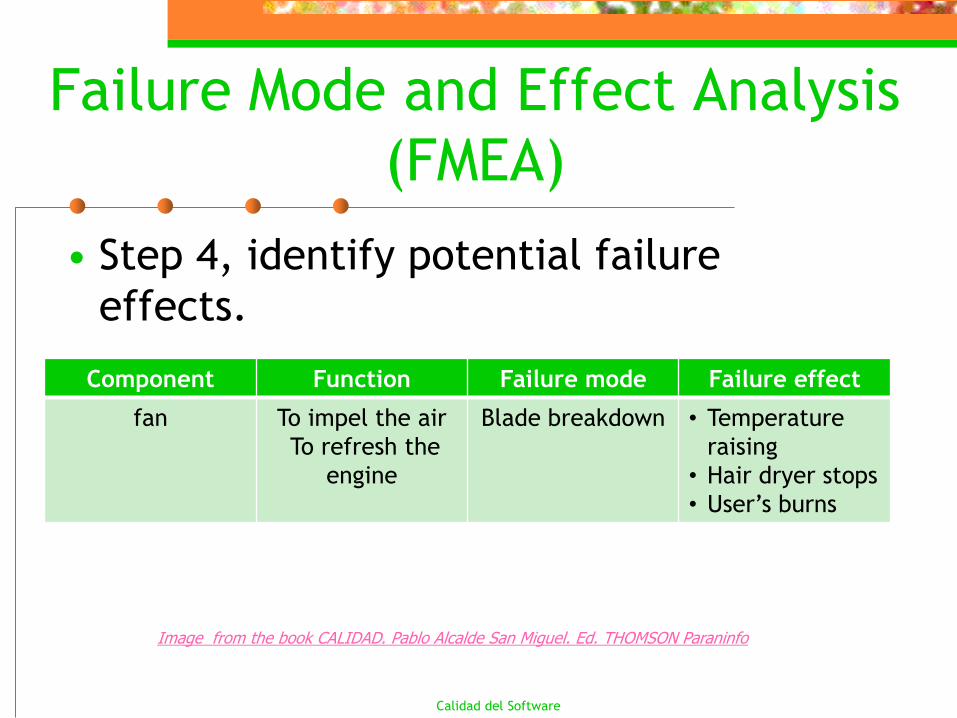
Failure Mode and Effect Analysis
(FMEA)
• Step 4, identify potential failure
effects.
Calidad del Software
Component Function Failure mode Failure effect
fan To impel the air
To refresh the
engine
Blade breakdown • Temperature
raising
• Hair dryer stops
• User’s burns
Image from the book CALIDAD. Pablo Alcalde San Miguel. Ed. THOMSON Paraninfo
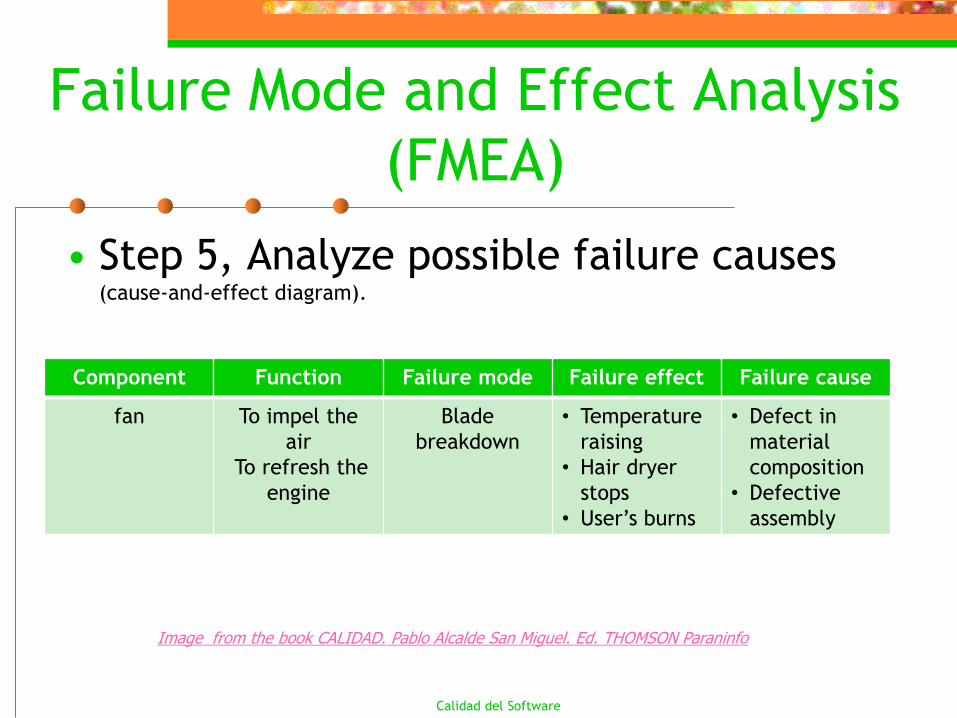
Failure Mode and Effect Analysis
(FMEA)
• Step 5, Analyze possible failure causes (cause-and-effect diagram).
Calidad del Software
Component Function Failure mode Failure effect Failure cause
fan To impel the
air
To refresh the
engine
Blade
breakdown
• Temperature
raising
• Hair dryer
stops
• User’s burns
• Defect in
material
composition
• Defective
assembly
Image from the book CALIDAD. Pablo Alcalde San Miguel. Ed. THOMSON Paraninfo
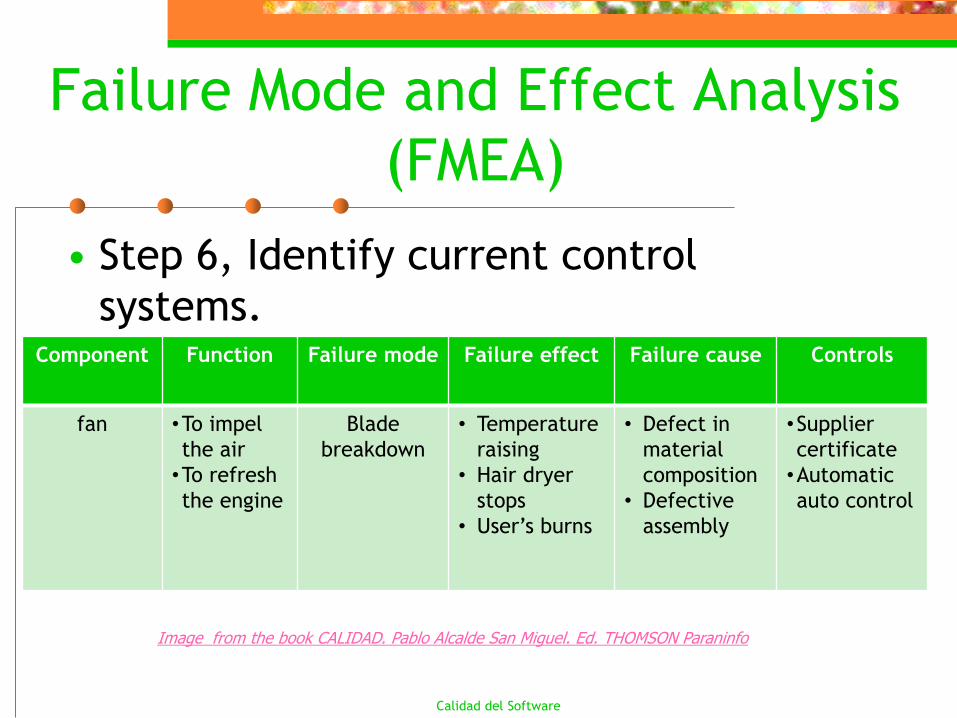
Failure Mode and Effect Analysis
(FMEA)
• Step 6, Identify current control
systems.
Calidad del Software
Component Function Failure mode Failure effect Failure cause Controls
fan •To impel
the air
•To refresh
the engine
Blade
breakdown
• Temperature
raising
• Hair dryer
stops
• User’s burns
• Defect in
material
composition
• Defective
assembly
•Supplier
certificate
•Automatic
auto control
Image from the book CALIDAD. Pablo Alcalde San Miguel. Ed. THOMSON Paraninfo
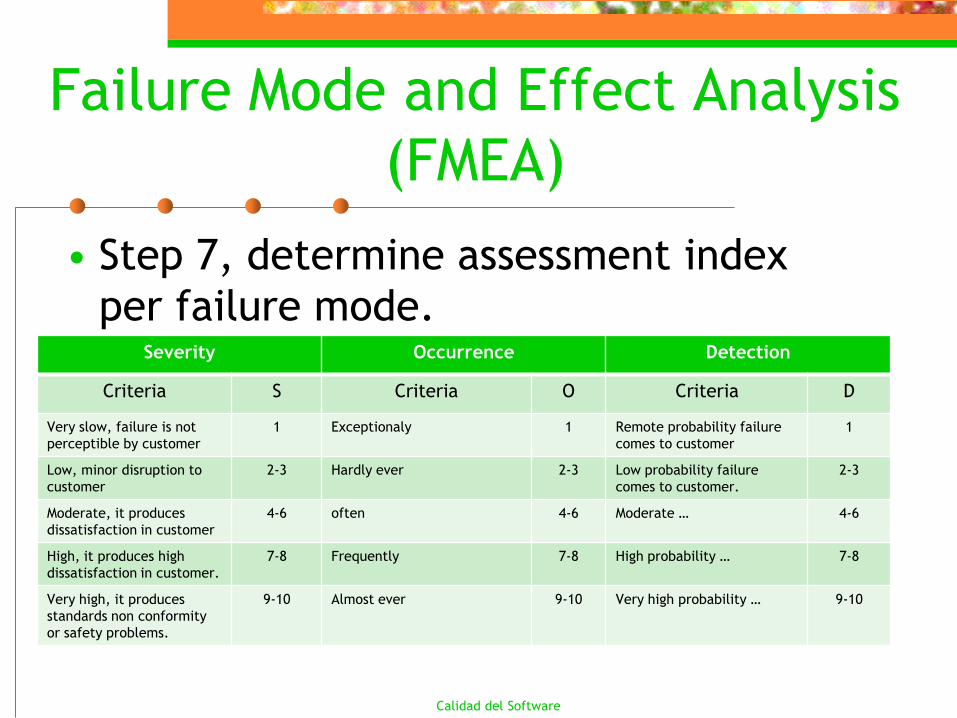
Failure Mode and Effect Analysis
(FMEA)
• Step 7, determine assessment index
per failure mode.
Calidad del Software
Severity Occurrence Detection
Criteria S Criteria O Criteria D
Very slow, failure is not
perceptible by customer
1 Exceptionaly 1 Remote probability failure
comes to customer
1
Low, minor disruption to
customer
2-3 Hardly ever 2-3 Low probability failure
comes to customer.
2-3
Moderate, it produces
dissatisfaction in customer
4-6 often 4-6 Moderate … 4-6
High, it produces high
dissatisfaction in customer.
7-8 Frequently 7-8 High probability … 7-8
Very high, it produces
standards non conformity
or safety problems.
9-10 Almost ever 9-10 Very high probability … 9-10
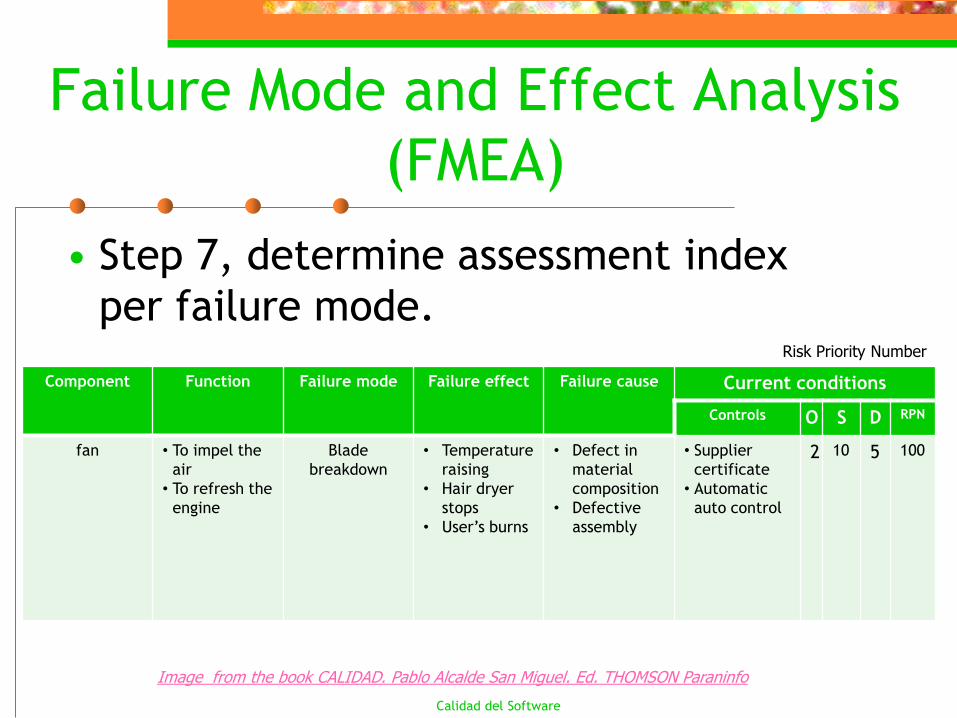
Failure Mode and Effect Analysis
(FMEA)
• Step 7, determine assessment index
per failure mode.
Calidad del Software
Component Function Failure mode Failure effect Failure cause Current conditions
Controls O S D RPN
fan • To impel the
air
• To refresh the
engine
Blade
breakdown
• Temperature
raising
• Hair dryer
stops
• User’s burns
• Defect in
material
composition
• Defective
assembly
• Supplier
certificate
• Automatic
auto control
2 10 5 100
Image from the book CALIDAD. Pablo Alcalde San Miguel. Ed. THOMSON Paraninfo
Risk Priority Number
Failure Mode and Effect Analysis
(FMEA)
• Step 8, to plan improvement actions
• An individual or group is designed as
responsible.
• A new assessment of failure modes with
the actions taken are made.
• Concrete actions:
Changes in product, service or process design
Inspection or control increment
Calidad del Software
Failure Mode and Effect Analysis
(FMEA)
• Step 9, FMEA revision and traceability.
• After corrective actions has been
implemented, resulting severity,
occurrence and detection ranks should be
re-calculated.
• Periodic reviews are planned to update
the FMEA.
Calidad del Software
Calidad del Software
It is a quality technique proposed by a Japanese engineer Shigeo Shingo in the sixties. The term means “mistake-proofing”.
Poka-Yoke refers to a special inspection mechanism which is used primarily to detect and prevent causes of defects in a system.
Poka-Yoke is a method of preventing errors by putting limits on how an operation can be performed in order to force the correct completion of the operation.
Poka-Yoke
Calidad del Software
CERO DEFECTS
•A defect is the result or effect of a
simple error.
•With 100% inspections in errors source,
defects are removed.
•100% inspections have a cost and it
must be bounded by the expected profit.
Poka-Yoke
Calidad del Software
Shingeo Shingo’s CERO DEFECTS :
•Inspection in error source.
•100% inspections using simple and
cheap Poka-Yoke systems.
•Immediate action, operations are
stopped when an error occurs. Moreover,
they do not continue until cause is
remove.
Poka-Yoke
Calidad del Software
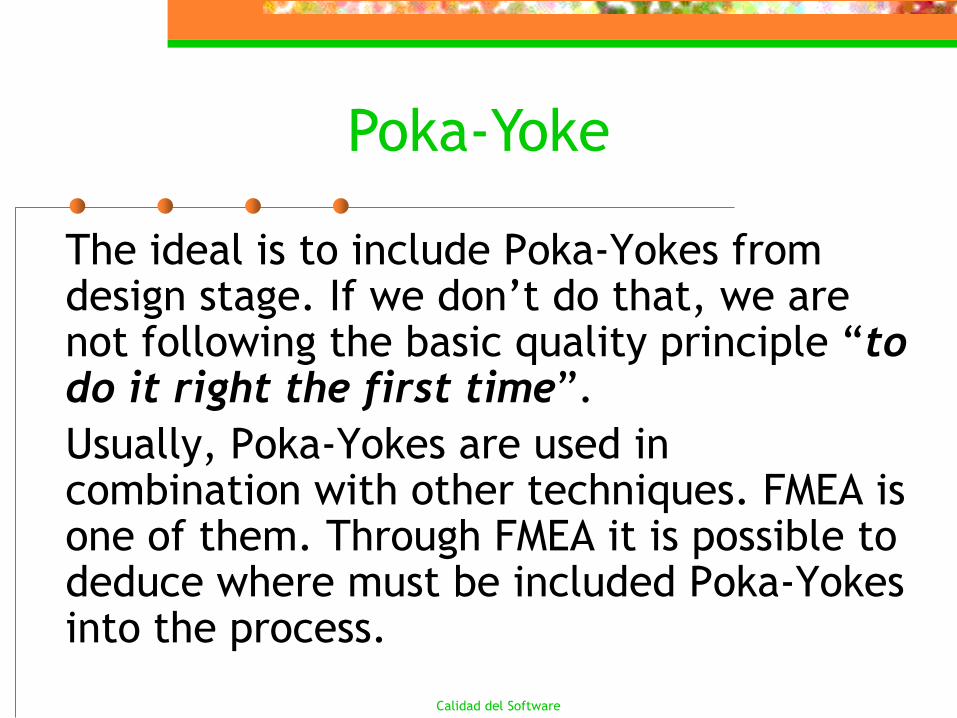
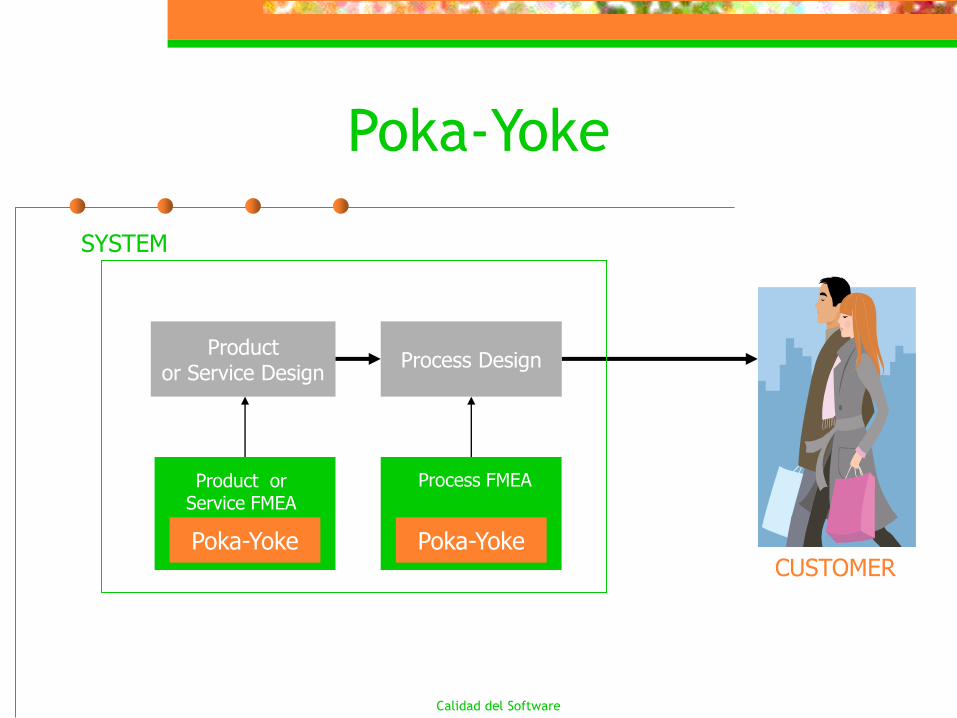
The ideal is to include Poka-Yokes from design stage. If we don’t do that, we are not following the basic quality principle “to do it right the first time”.
Usually, Poka-Yokes are used in combination with other techniques. FMEA is one of them. Through FMEA it is possible to deduce where must be included Poka-Yokes into the process.
Poka-Yoke
Calidad del Software
Poka-Yoke
Productor Service Design
Process Design
SYSTEM
Poka-Yoke
Product or Service FMEA
Poka-Yoke
Process FMEA
CUSTOMER
Calidad del Software
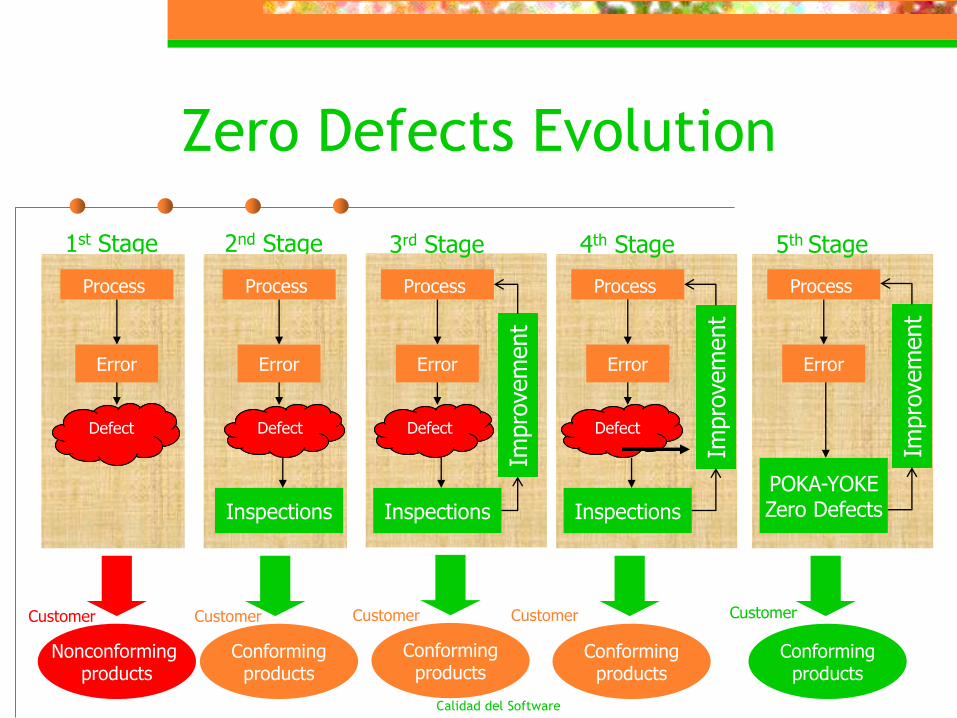
Zero Defects Evolution
Nonconforming products
Customer
1st Stage
Error
Defect
Process
Customer
Conformingproducts
2nd StageEtapa
Error
Defect
Inspections
Process
Conformingproducts
Customer
Error
Defect
Inspections
Process
Impro
vem
ent
3rd Stage
Error
Defect
Inspections
Process
4th Stage
Impro
vem
ent
Error
POKA-YOKEZero Defects
Process
5th Stage
Impro
vem
ent
Conformingproducts
Customer
Conformingproducts
Customer