Embed Size (px)
Citation preview
Blaine HansonDepartment of Land, Air and Water Resources
University of California, [email protected]
California Agriculture, Water and You
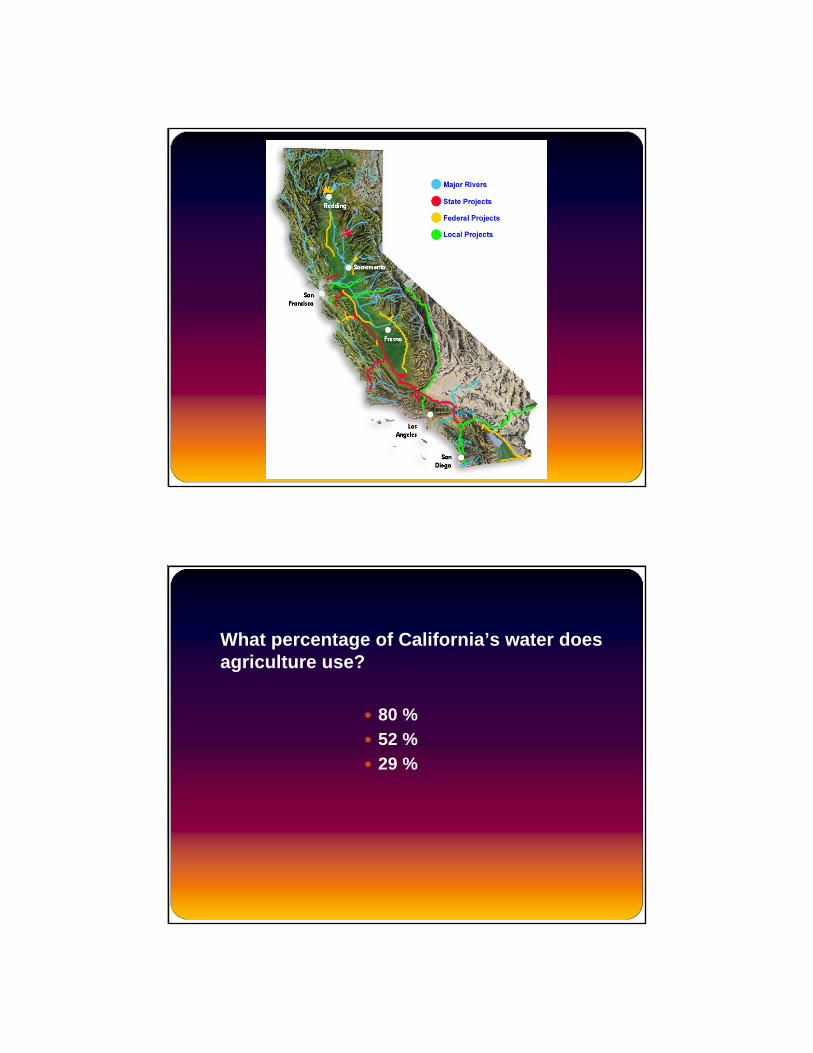
What percentage of California’s water does agriculture use?
80 %52 %29 %
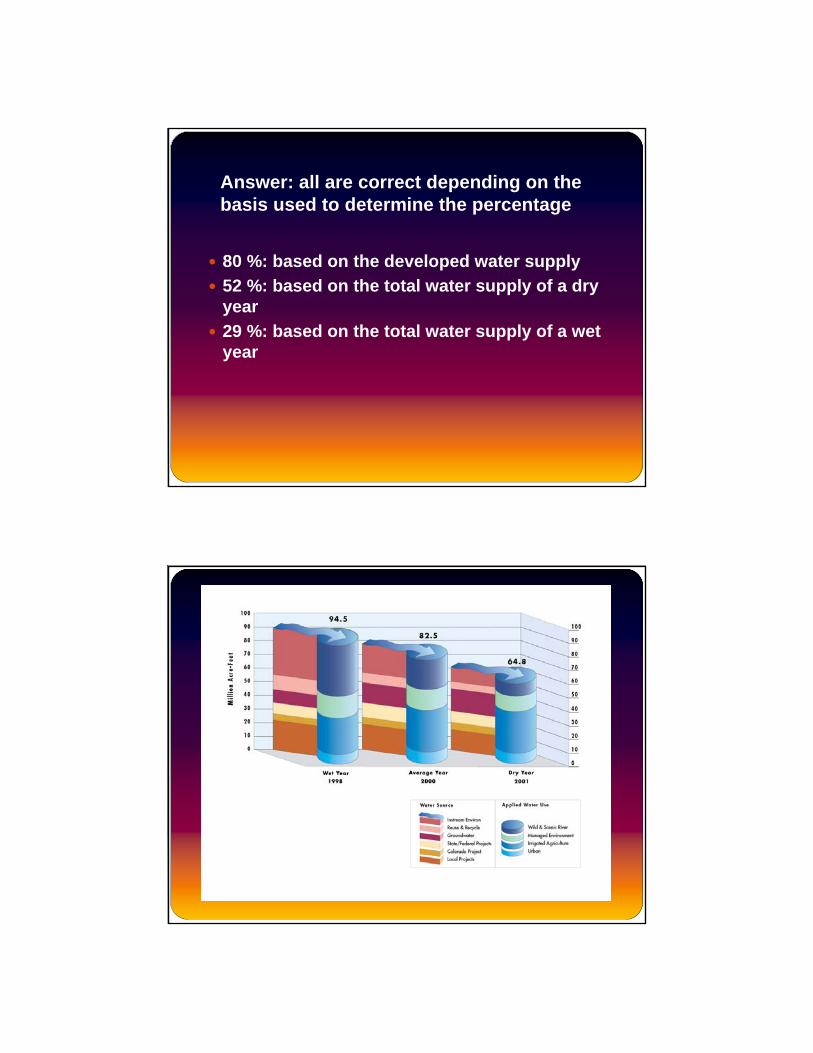
Answer: all are correct depending on the basis used to determine the percentage
80 %: based on the developed water supply52 %: based on the total water supply of a dry year29 %: based on the total water supply of a wet year
Perceptions of agriculture
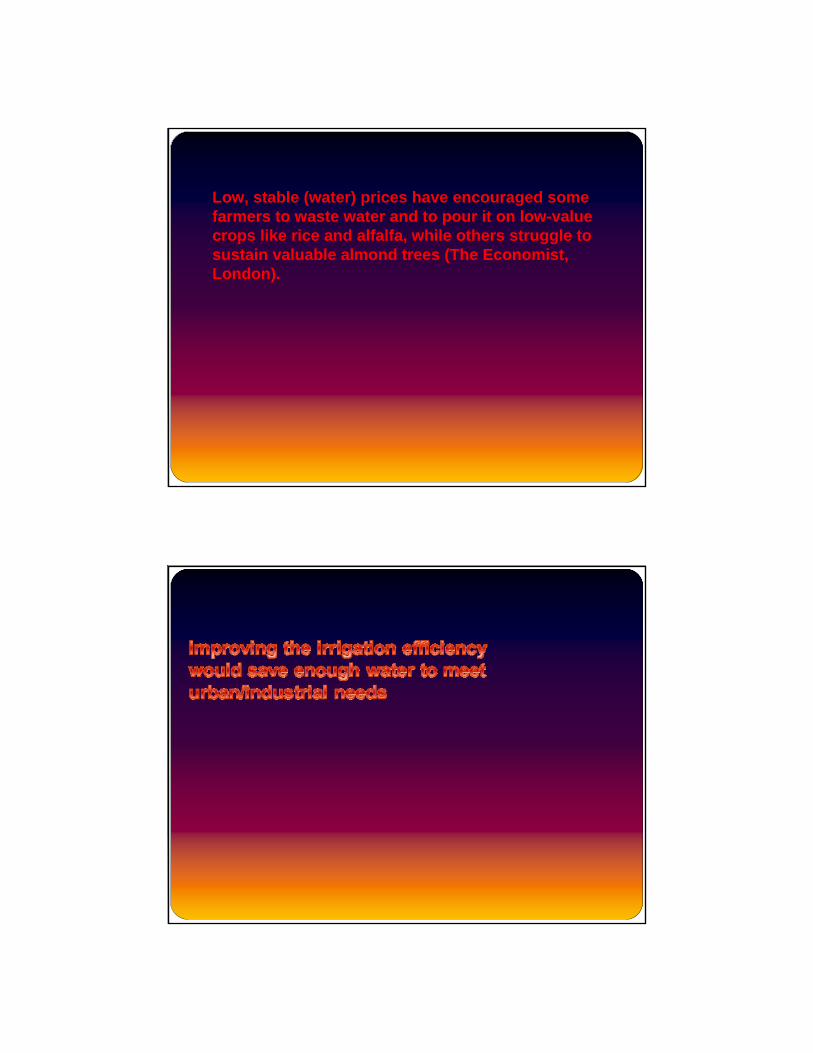
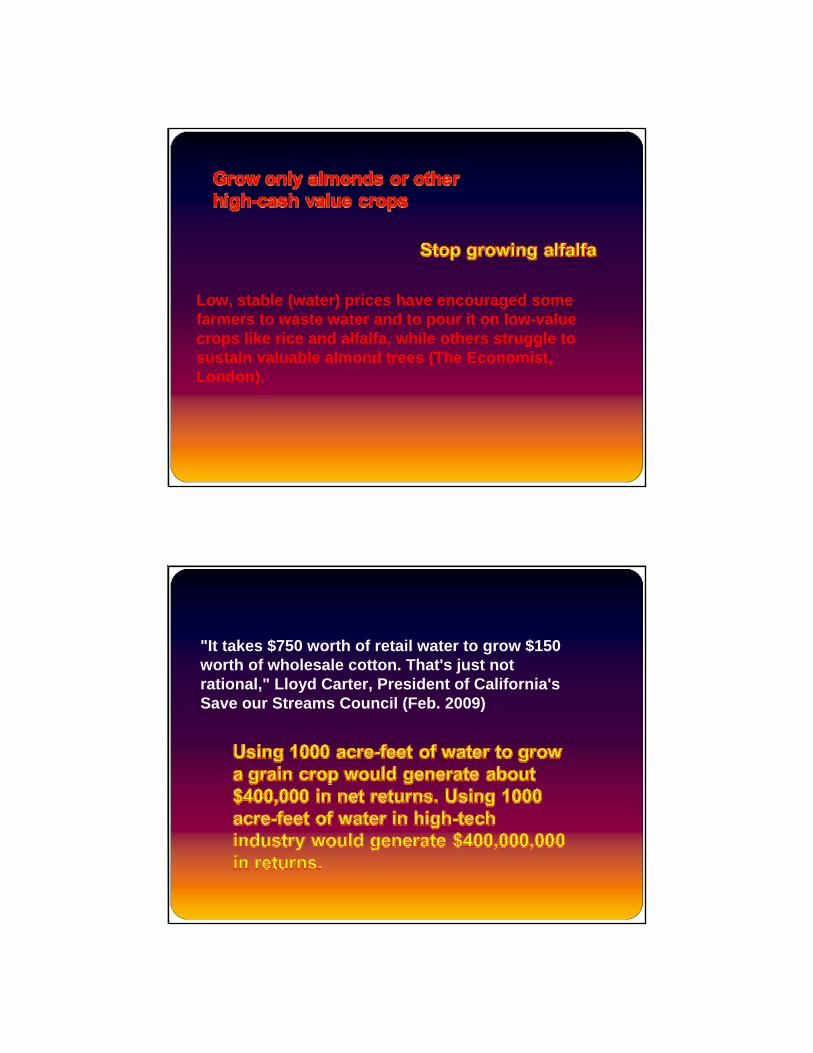
Low, stable (water) prices have encouraged some farmers to waste water and to pour it on low-value crops like rice and alfalfa, while others struggle to sustain valuable almond trees (The Economist, London).
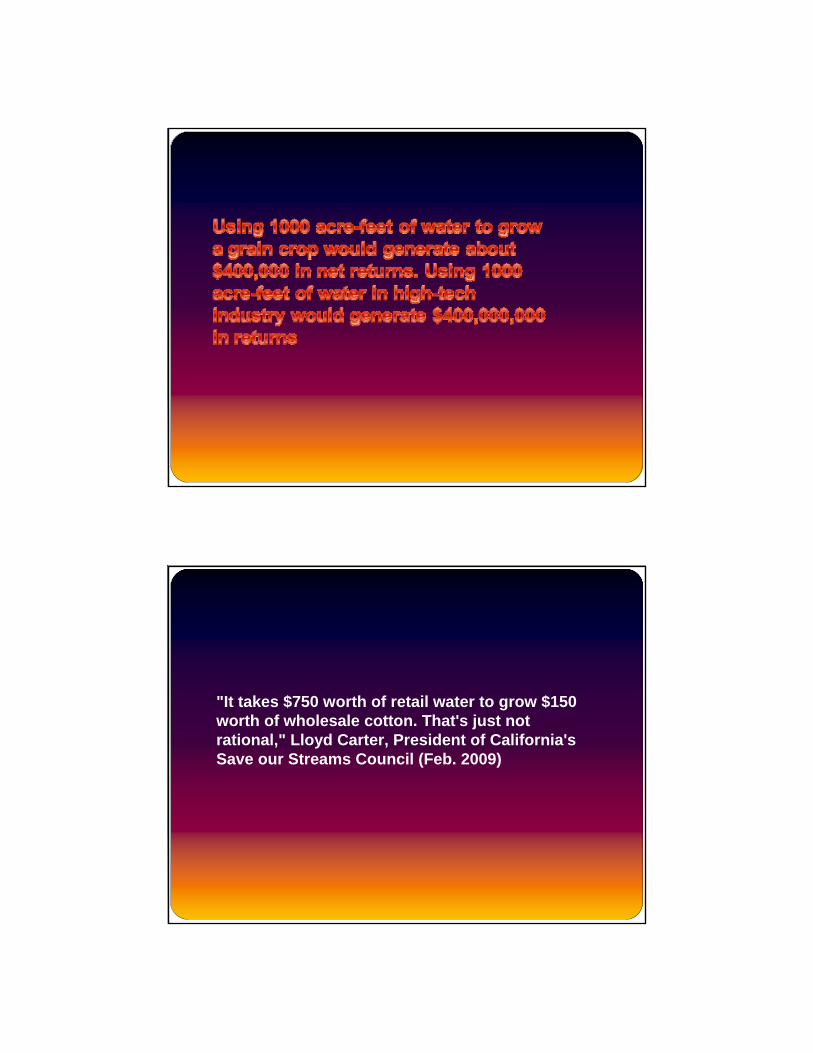
"It takes $750 worth of retail water to grow $150 worth of wholesale cotton. That's just not rational," Lloyd Carter, President of California's Save our Streams Council (Feb. 2009)
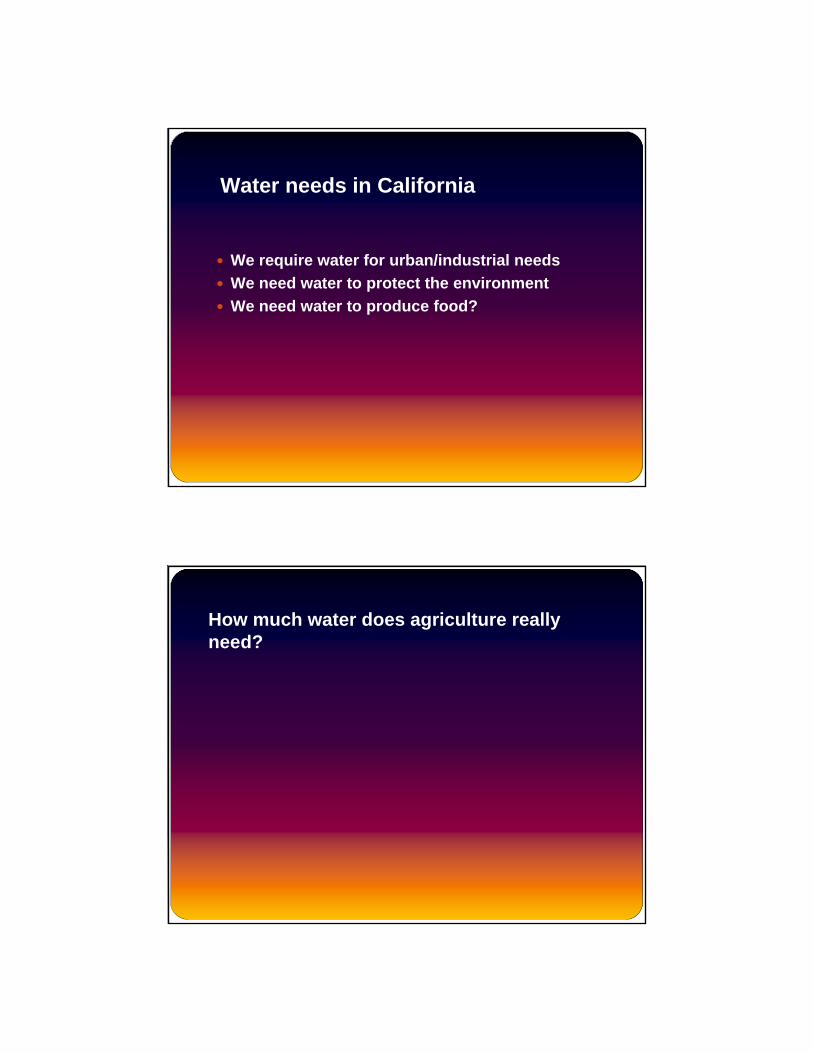
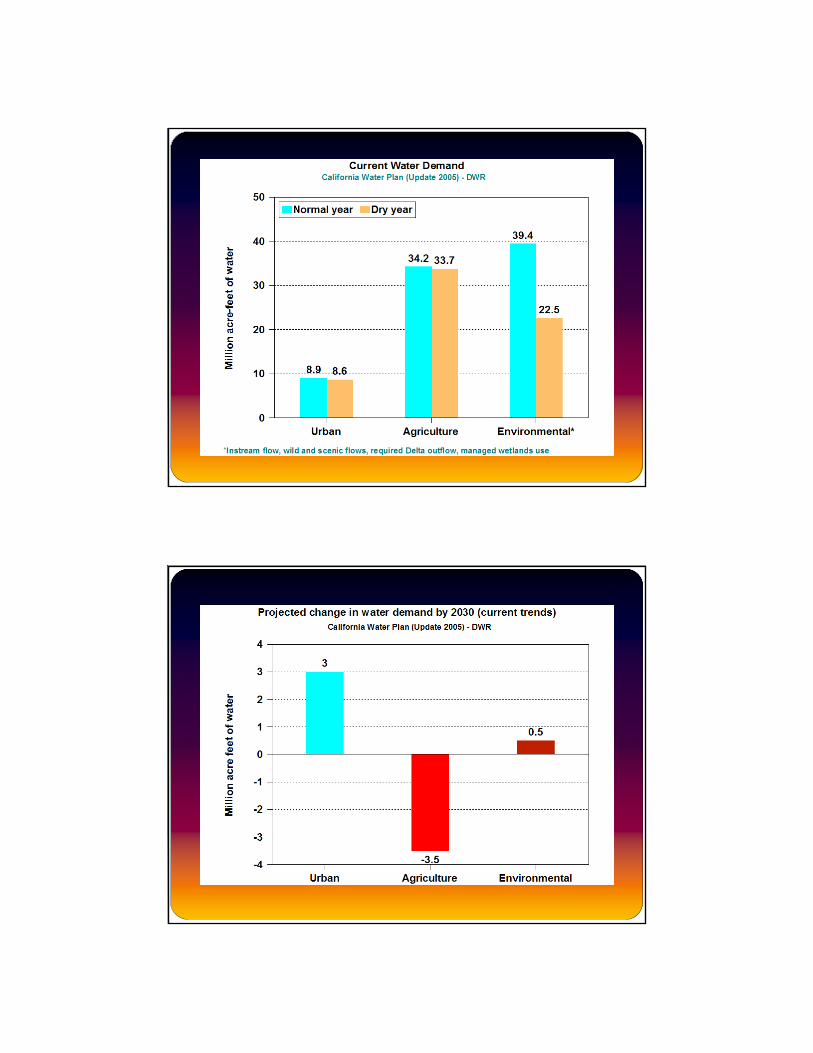
Water needs in California
We require water for urban/industrial needsWe need water to protect the environmentWe need water to produce food?
How much water does agriculture really need?
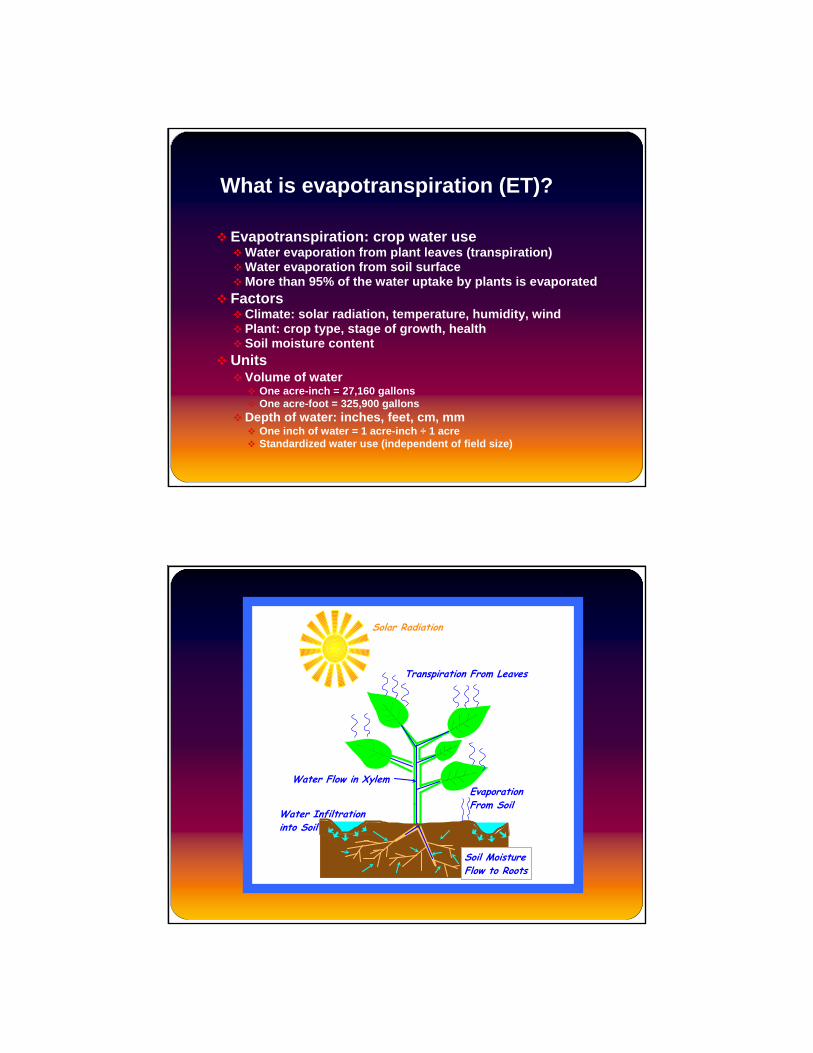
What is evapotranspiration (ET)?
Evapotranspiration: crop water useWater evaporation from plant leaves (transpiration)Water evaporation from soil surfaceMore than 95% of the water uptake by plants is evaporated
FactorsClimate: solar radiation, temperature, humidity, windPlant: crop type, stage of growth, healthSoil moisture content
UnitsVolume of water
One acre-inch = 27,160 gallonsOne acre-foot = 325,900 gallons
Depth of water: inches, feet, cm, mmOne inch of water = 1 acre-inch ÷ 1 acreStandardized water use (independent of field size)
Transpiration From Leaves
Water Flow in Xylem
Solar Radiation
Water Infiltrationinto Soil
Evaporation From Soil
Soil Moisture Flow to Roots
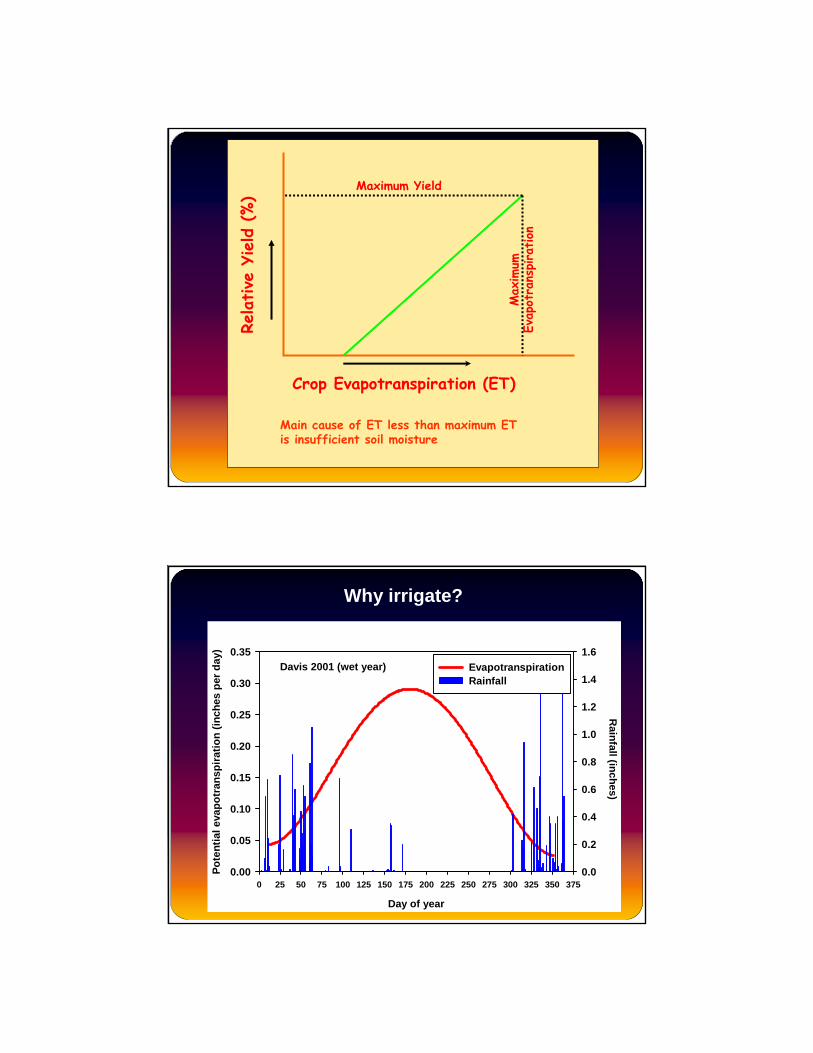
Crop Evapotranspiration (ET)
Relative
Yield (%)
Maximum Yield
Max
imum
Evap
otra
n spira
tion
Main cause of ET less than maximum ETis insufficient soil moisture
Davis 2001 (wet year)
Day of year
0 25 50 75 100 125 150 175 200 225 250 275 300 325 350 375
Pote
ntia
l eva
potr
ansp
iratio
n (in
ches
per
day
)
0.00
0.05
0.10
0.15
0.20
0.25
0.30
0.35
Rainfall (inches)
0.0
0.2
0.4
0.6
0.8
1.0
1.2
1.4
1.6EvapotranspirationRainfall
Why irrigate?
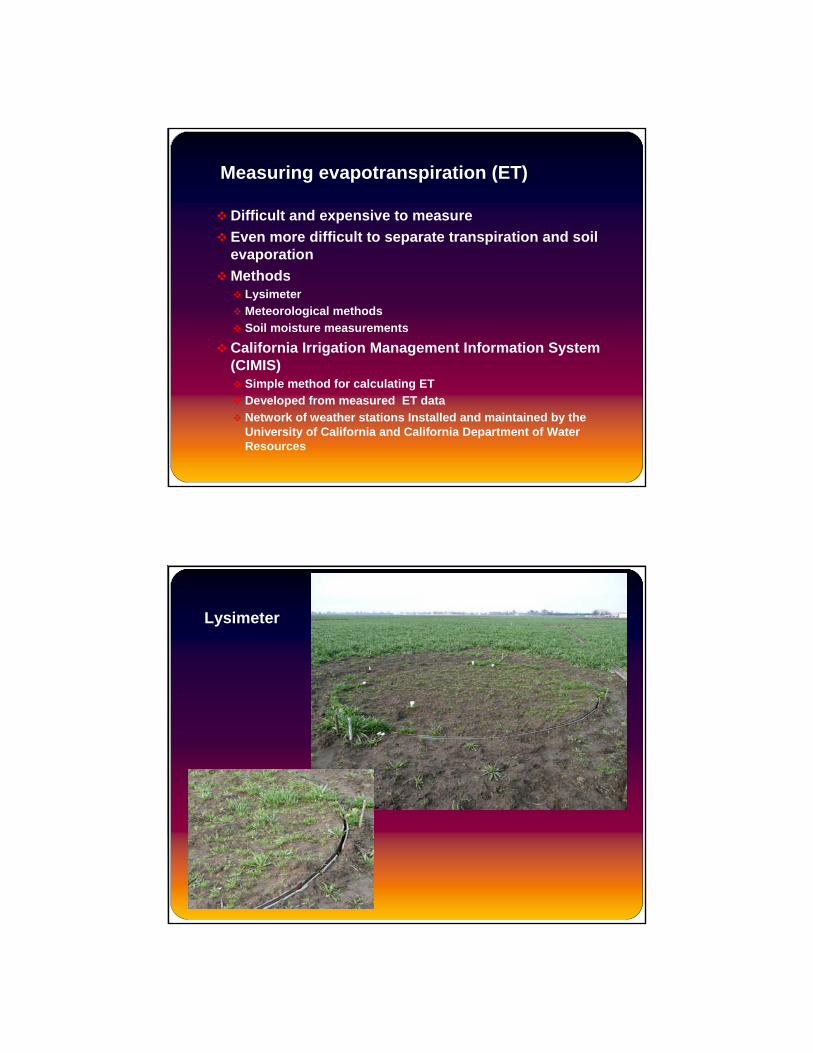
Measuring evapotranspiration (ET)
Difficult and expensive to measureEven more difficult to separate transpiration and soil evaporationMethods
LysimeterMeteorological methodsSoil moisture measurements
California Irrigation Management Information System (CIMIS)
Simple method for calculating ET Developed from measured ET dataNetwork of weather stations Installed and maintained by the University of California and California Department of Water Resources
Lysimeter
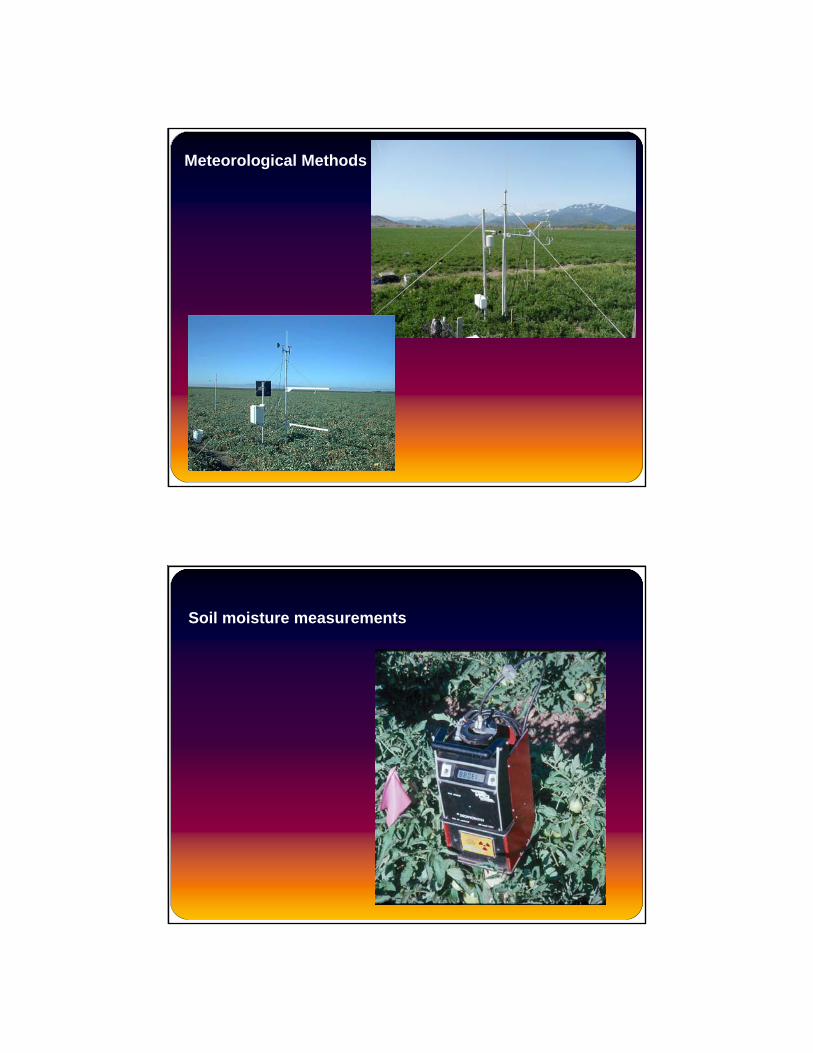
Meteorological Methods
Soil moisture measurements
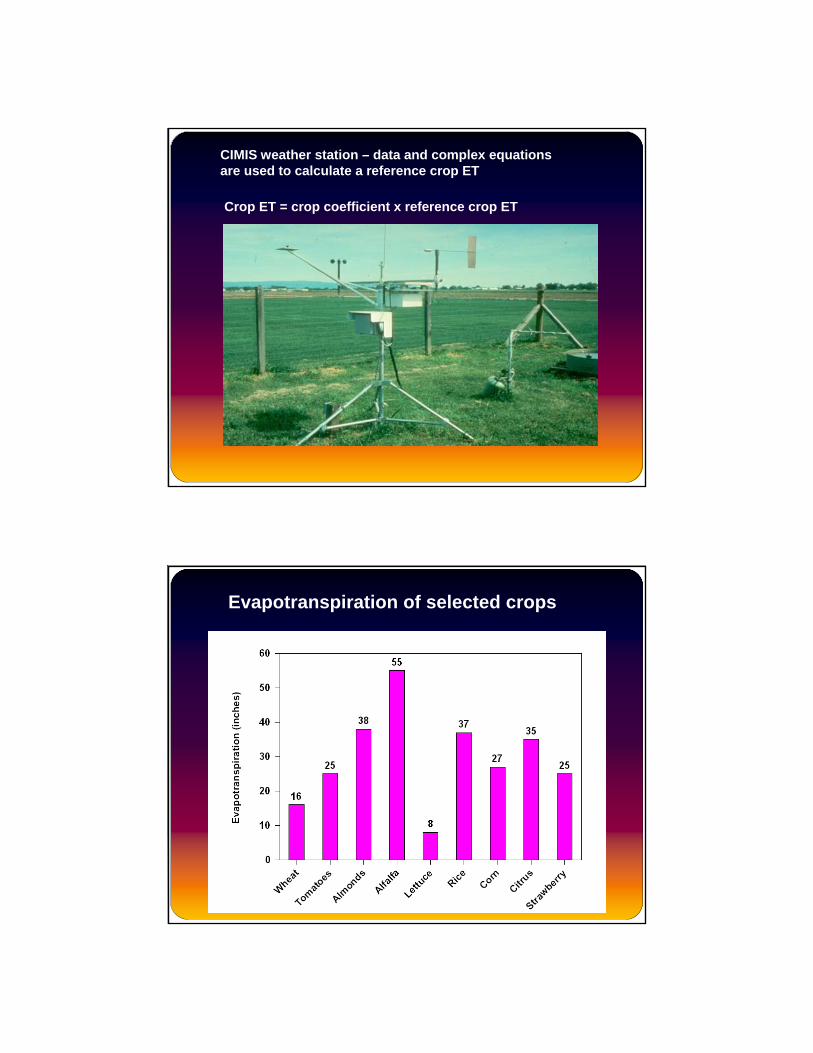
CIMIS weather station – data and complex equations are used to calculate a reference crop ET
Crop ET = crop coefficient x reference crop ET
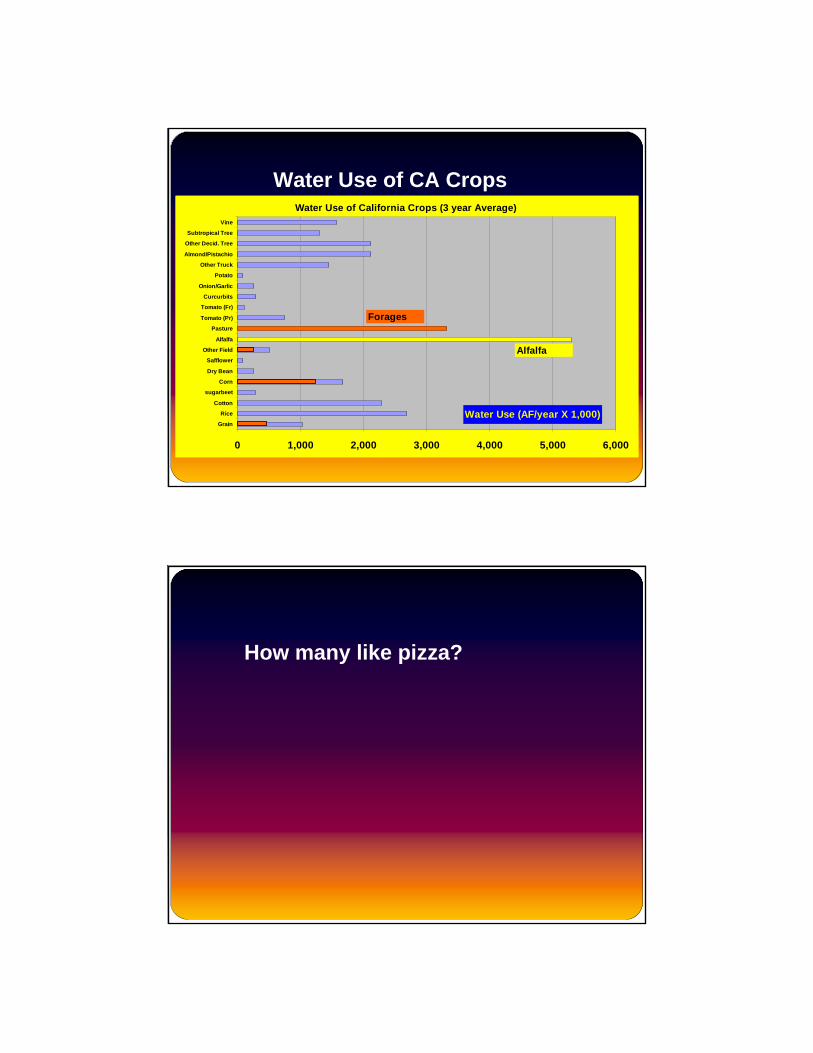
Evapotranspiration of selected crops
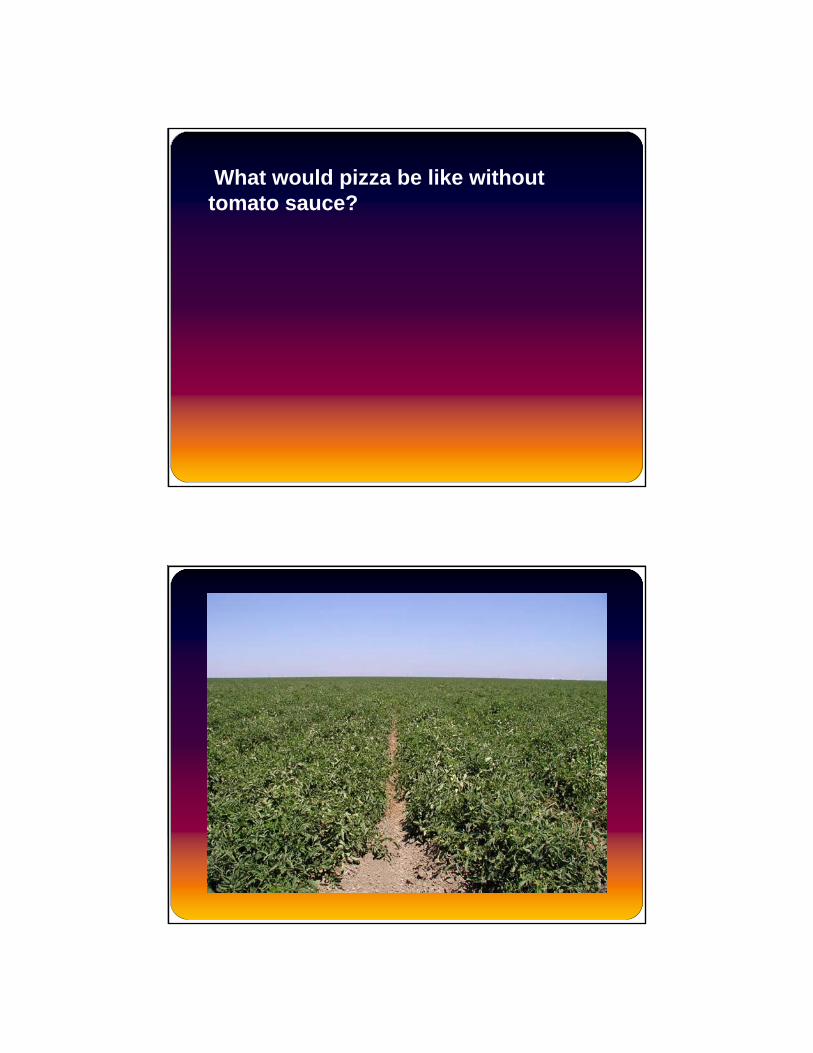
Water Use of California Crops (3 year Average)
0 1,000 2,000 3,000 4,000 5,000 6,000
Grain
Rice
Cotton
sugarbeet
Corn
Dry Bean
Safflower
Other Field
Alfalfa
Pasture
Tomato (Pr)
Tomato (Fr)
Curcurbits
Onion/Garlic
Potato
Other Truck
Almond/Pistachio
Other Decid. Tree
Subtropical Tree
Vine
Water Use (AF/year X 1,000)
Alfalfa
Forages
Water Use of CA Crops
How many like pizza?
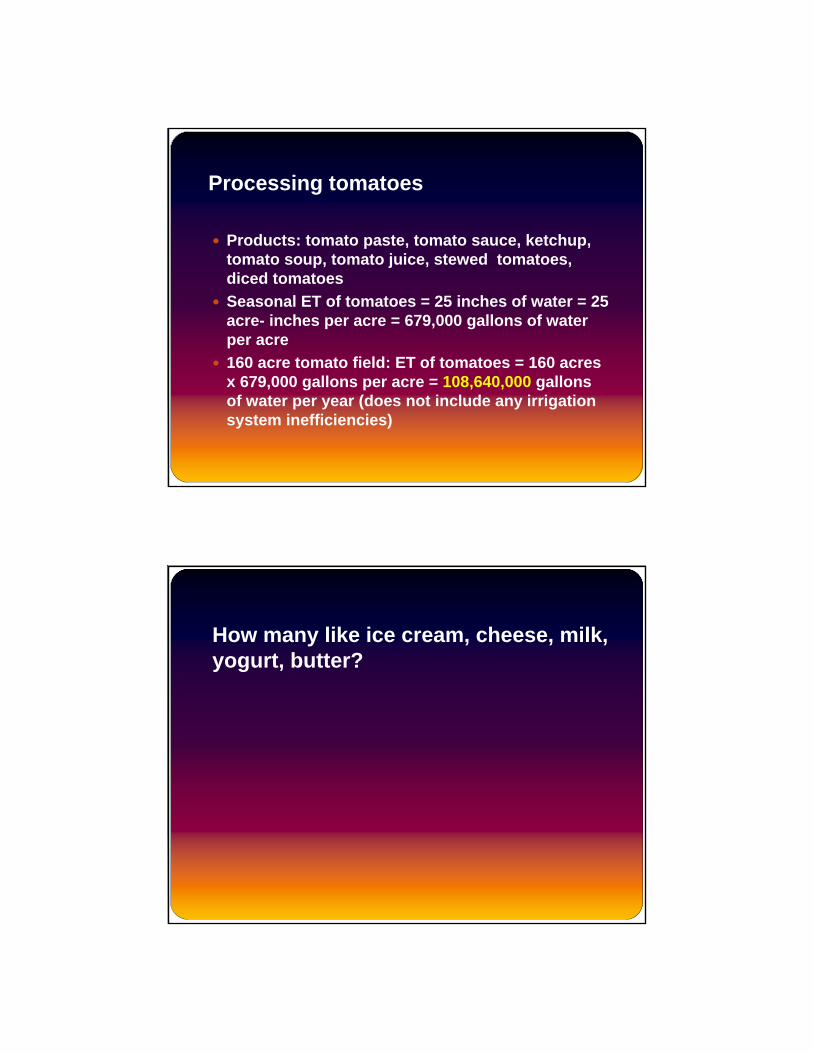
What would pizza be like without tomato sauce?
Processing tomatoes
Products: tomato paste, tomato sauce, ketchup, tomato soup, tomato juice, stewed tomatoes, diced tomatoesSeasonal ET of tomatoes = 25 inches of water = 25 acre- inches per acre = 679,000 gallons of water per acre160 acre tomato field: ET of tomatoes = 160 acres x 679,000 gallons per acre = 108,640,000 gallons of water per year (does not include any irrigation system inefficiencies)
How many like ice cream, cheese, milk, yogurt, butter?
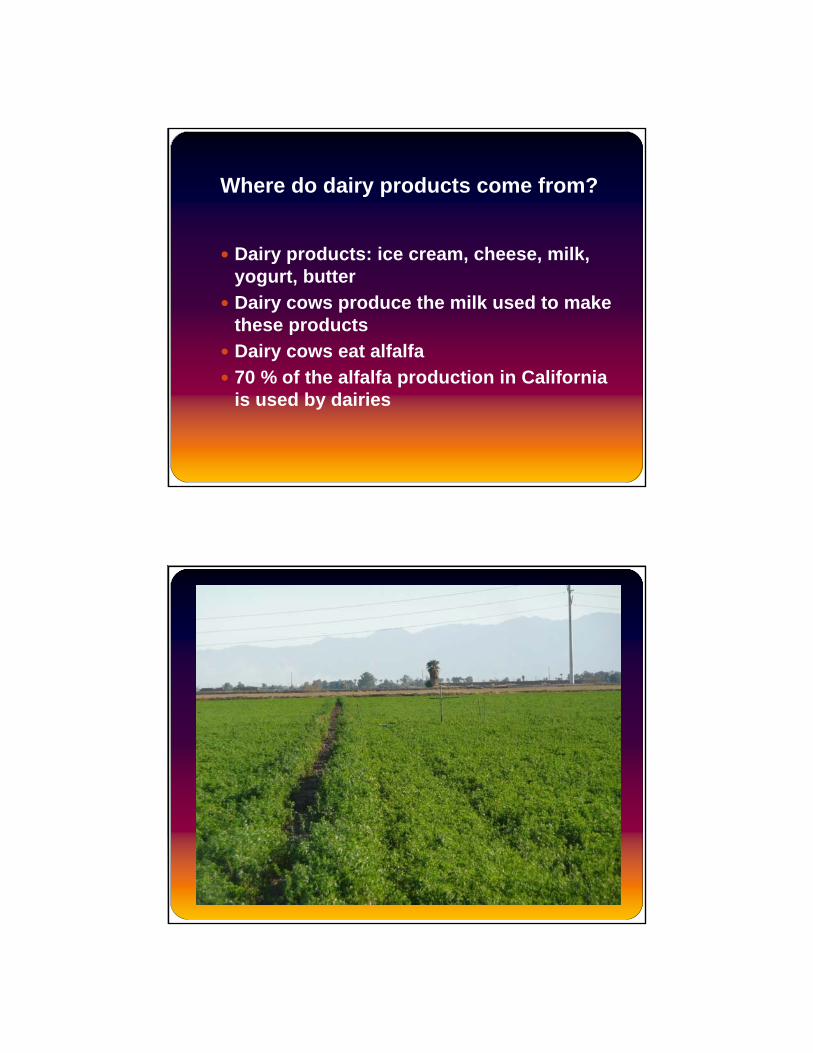
Where do dairy products come from?
Dairy products: ice cream, cheese, milk, yogurt, butterDairy cows produce the milk used to make these productsDairy cows eat alfalfa70 % of the alfalfa production in California is used by dairies
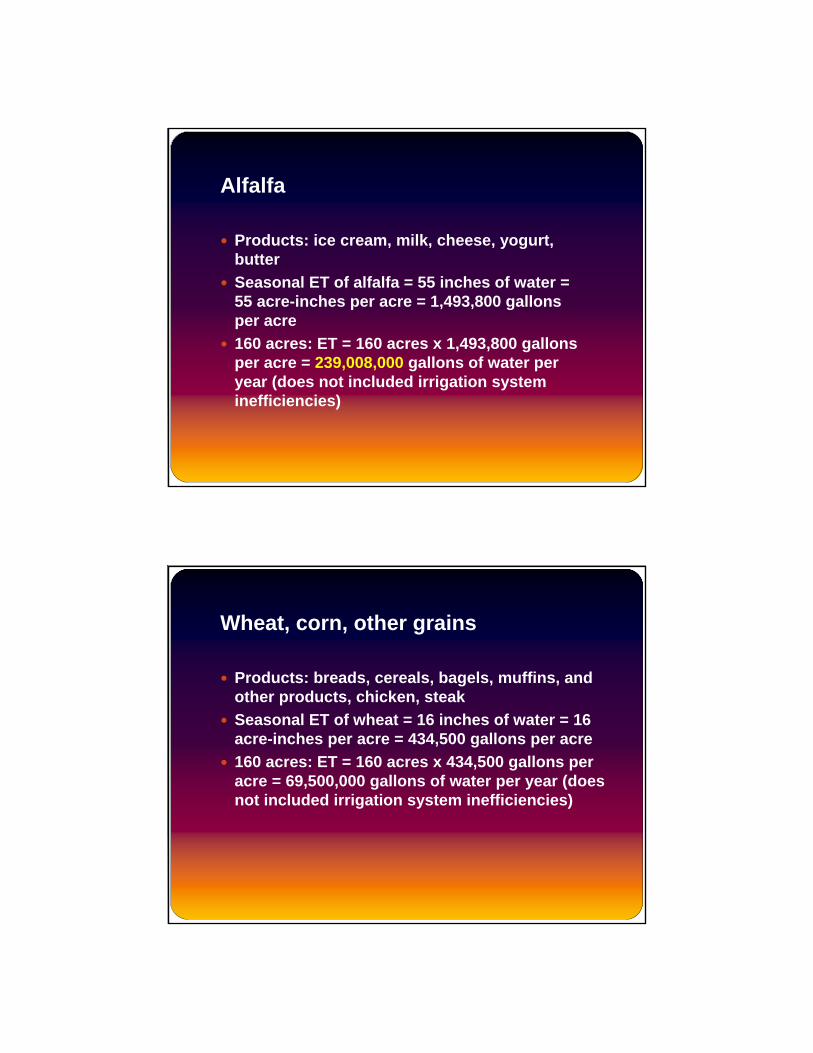
Alfalfa
Products: ice cream, milk, cheese, yogurt, butterSeasonal ET of alfalfa = 55 inches of water = 55 acre-inches per acre = 1,493,800 gallons per acre160 acres: ET = 160 acres x 1,493,800 gallons per acre = 239,008,000 gallons of water per year (does not included irrigation system inefficiencies)
Wheat, corn, other grains
Products: breads, cereals, bagels, muffins, and other products, chicken, steakSeasonal ET of wheat = 16 inches of water = 16 acre-inches per acre = 434,500 gallons per acre160 acres: ET = 160 acres x 434,500 gallons per acre = 69,500,000 gallons of water per year (does not included irrigation system inefficiencies)
The bottom line: it takes a lot of water to produce the crops that produce our food
What crops should be grown in California?

Maximize dollar returns?
Only high cash value crops should be grownTree cropsVegetable cropsTomatoes
Low cash value crops should not be grownWheatCornCottonAlfalfa?
Maximize human health?
What crops should be grown in California?
From a business point of view: grow crops that produce the highest dollar returnsFrom a human health point of view: grow crops that are needed to maximize human healthCurrent situation: most of the crops grown in California are higher cash value cropsConcern: how to allocate water for crops that are low-cash value but are necessary for human health
Low, stable (water) prices have encouraged some farmers to waste water and to pour it on low-value crops like rice and alfalfa, while others struggle to sustain valuable almond trees (The Economist, London).
"It takes $750 worth of retail water to grow $150 worth of wholesale cotton. That's just not rational," Lloyd Carter, President of California's Save our Streams Council (Feb. 2009)
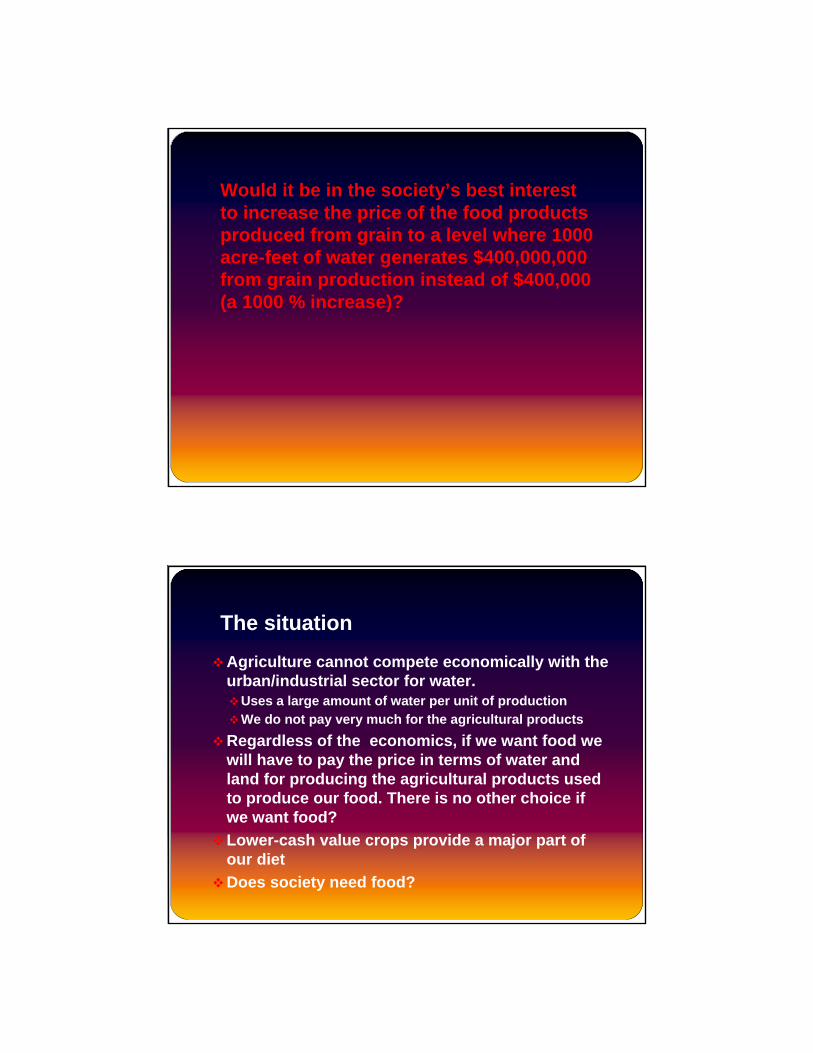
Would it be in the society’s best interest to increase the price of the food products produced from grain to a level where 1000 acre-feet of water generates $400,000,000from grain production instead of $400,000 (a 1000 % increase)?
The situation
Agriculture cannot compete economically with the urban/industrial sector for water.
Uses a large amount of water per unit of productionWe do not pay very much for the agricultural products
Regardless of the economics, if we want food we will have to pay the price in terms of water and land for producing the agricultural products used to produce our food. There is no other choice if we want food?Lower-cash value crops provide a major part of our dietDoes society need food?
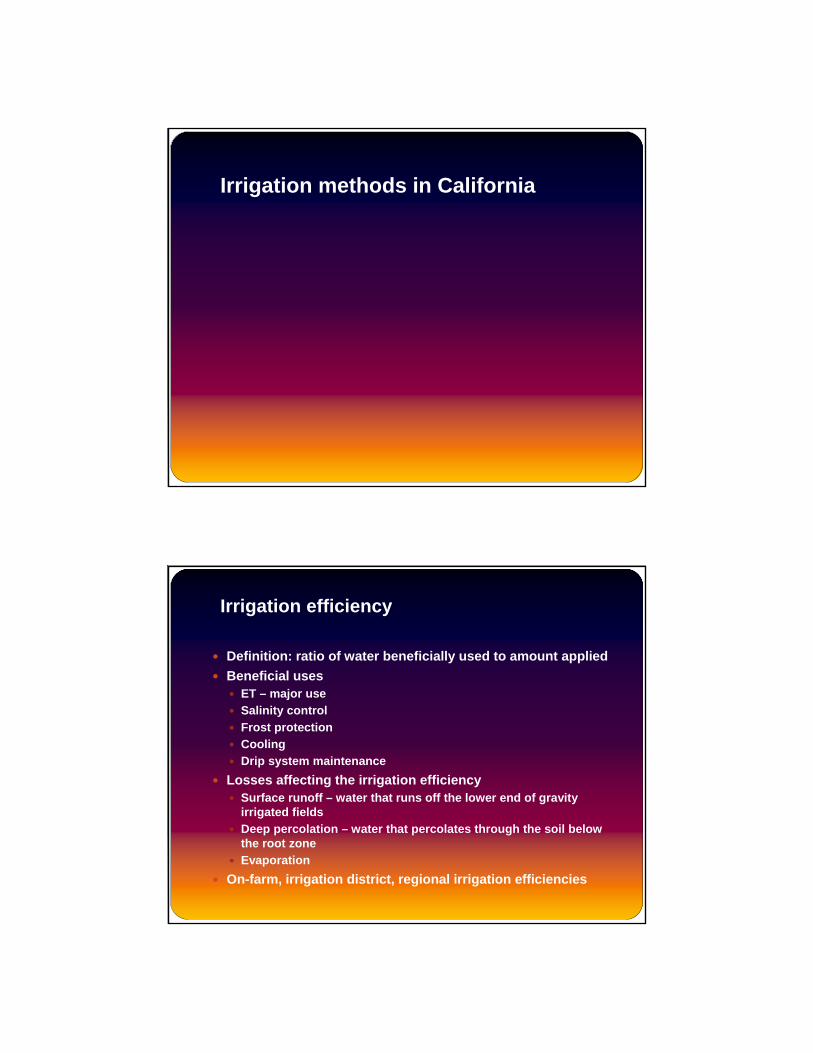
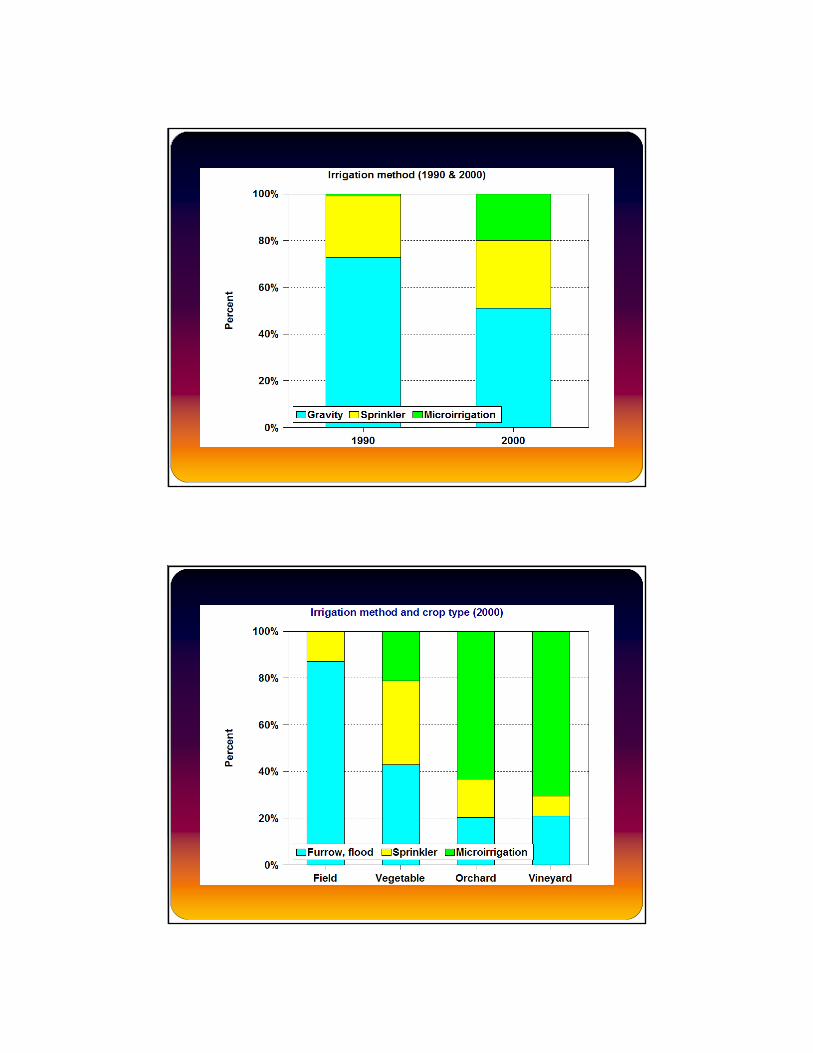
Irrigation methods in California
Irrigation efficiency
Definition: ratio of water beneficially used to amount appliedBeneficial uses
ET – major useSalinity controlFrost protectionCoolingDrip system maintenance
Losses affecting the irrigation efficiencySurface runoff – water that runs off the lower end of gravity irrigated fieldsDeep percolation – water that percolates through the soil below the root zoneEvaporation
On-farm, irrigation district, regional irrigation efficiencies
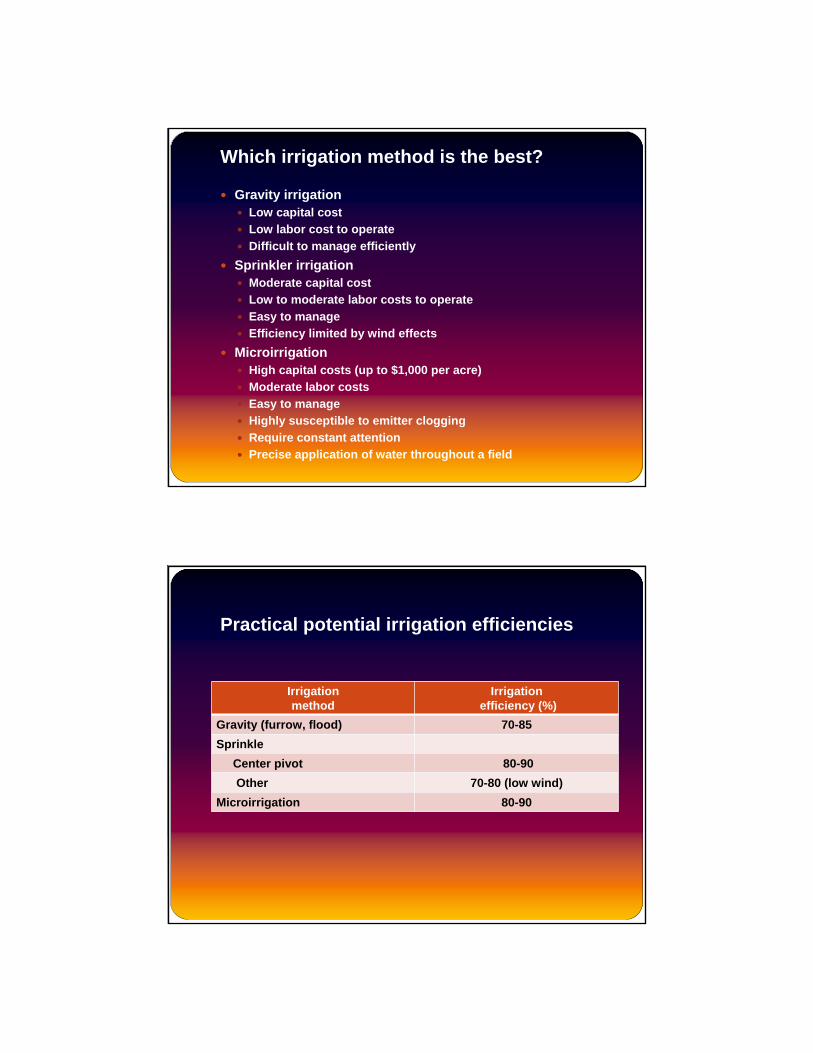
Which irrigation method is the best?
Gravity irrigationLow capital costLow labor cost to operateDifficult to manage efficiently
Sprinkler irrigationModerate capital costLow to moderate labor costs to operateEasy to manageEfficiency limited by wind effects
MicroirrigationHigh capital costs (up to $1,000 per acre)Moderate labor costsEasy to manage Highly susceptible to emitter cloggingRequire constant attentionPrecise application of water throughout a field
Practical potential irrigation efficiencies
Irrigation method
Irrigationefficiency (%)
Gravity (furrow, flood) 70-85Sprinkle
Center pivot 80-90Other 70-80 (low wind)
Microirrigation 80-90
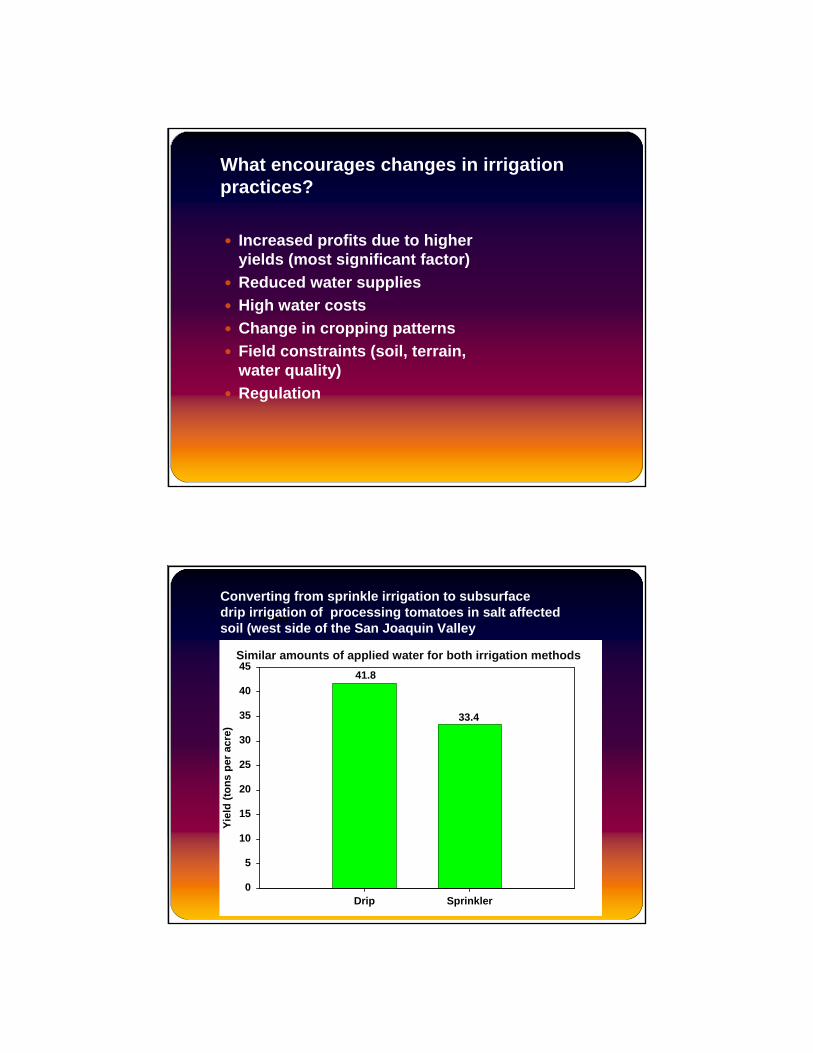
What encourages changes in irrigation practices?
Increased profits due to higher yields (most significant factor)Reduced water suppliesHigh water costsChange in cropping patternsField constraints (soil, terrain, water quality)Regulation
Drip Sprinkler
Yiel
d (to
ns p
er a
cre)
0
5
10
15
20
25
30
35
40
4541.8
33.4
Similar amounts of applied water for both irrigation methods
Yield
Converting from sprinkle irrigation to subsurface drip irrigation of processing tomatoes in salt affected soil (west side of the San Joaquin Valley
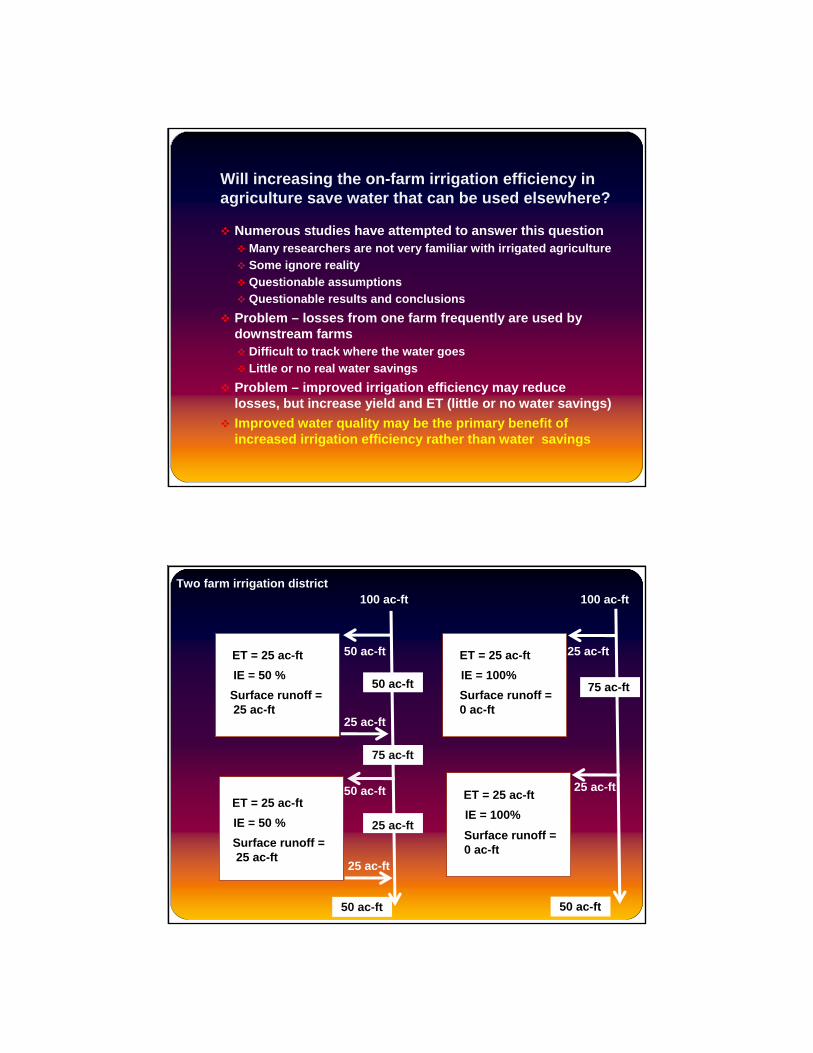
Will increasing the on-farm irrigation efficiency in agriculture save water that can be used elsewhere?
Numerous studies have attempted to answer this questionMany researchers are not very familiar with irrigated agricultureSome ignore reality Questionable assumptionsQuestionable results and conclusions
Problem – losses from one farm frequently are used by downstream farms
Difficult to track where the water goes Little or no real water savings
Problem – improved irrigation efficiency may reduce losses, but increase yield and ET (little or no water savings)Improved water quality may be the primary benefit of increased irrigation efficiency rather than water savings
Two farm irrigation district
ET = 25 ac-ftIE = 50 % IE = 100%
100 ac-ft
25 ac-ft
100 ac-ft
ET = 25 ac-ft
ET = 25 ac-ft ET = 25 ac-ft
IE = 50 % IE = 100%
50 ac-ft
50 ac-ft
75 ac-ft
50 ac-ft
50 ac-ft
25 ac-ft
25 ac-ft
25 ac-ft
25 ac-ft
50 ac-ft
75 ac-ftSurface runoff = 0 ac-ft
Surface runoff =25 ac-ft
Surface runoff =25 ac-ft
Surface runoff = 0 ac-ft
How do we balance the demands for water by the urban/industrial, environmental, and agricultural sectors with the water supply?
No one appears to have the answer!
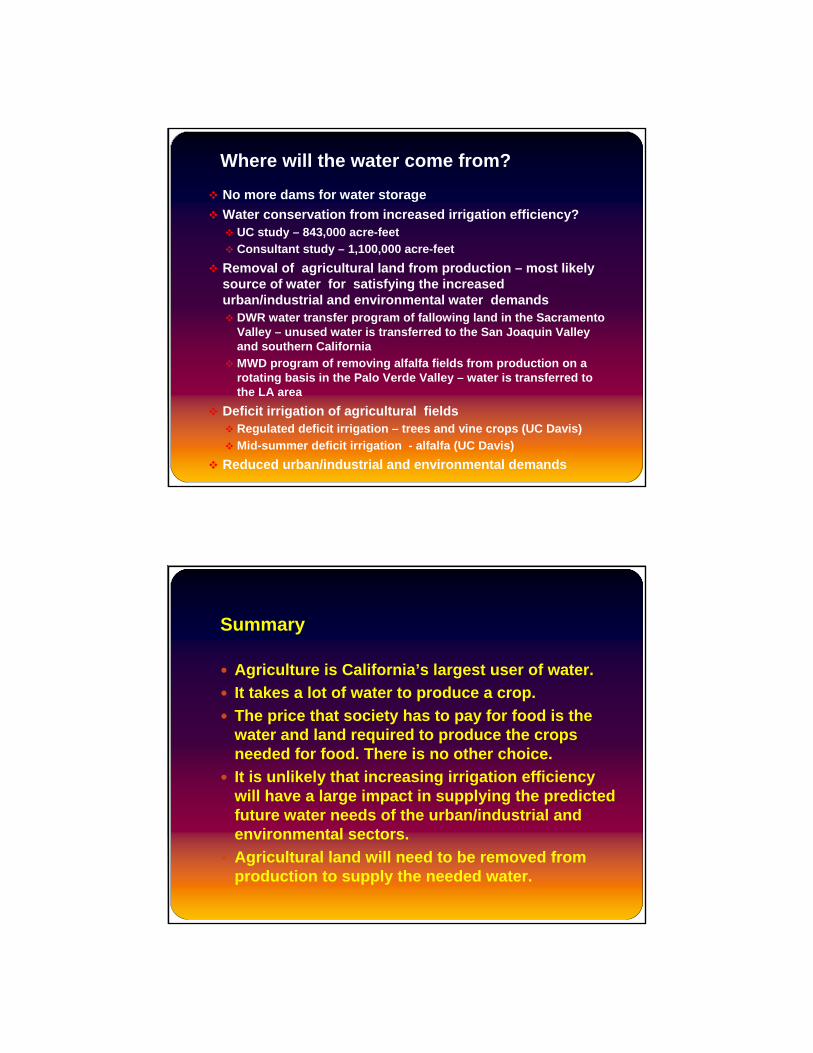
Where will the water come from?
No more dams for water storageWater conservation from increased irrigation efficiency?
UC study – 843,000 acre-feetConsultant study – 1,100,000 acre-feet
Removal of agricultural land from production – most likely source of water for satisfying the increased urban/industrial and environmental water demands
DWR water transfer program of fallowing land in the Sacramento Valley – unused water is transferred to the San Joaquin Valley and southern CaliforniaMWD program of removing alfalfa fields from production on a rotating basis in the Palo Verde Valley – water is transferred to the LA area
Deficit irrigation of agricultural fieldsRegulated deficit irrigation – trees and vine crops (UC Davis)Mid-summer deficit irrigation - alfalfa (UC Davis)
Reduced urban/industrial and environmental demands
Summary
Agriculture is California’s largest user of water.It takes a lot of water to produce a crop.The price that society has to pay for food is the water and land required to produce the crops needed for food. There is no other choice. It is unlikely that increasing irrigation efficiency will have a large impact in supplying the predicted future water needs of the urban/industrial and environmental sectors. Agricultural land will need to be removed from production to supply the needed water.

Life is Good