Embed Size (px)
Citation preview
California Air Resources Board Innovative Clean Air Technology
Grant ICAT99-2
Low Temperature Oxidation System Demonstration at
RSR Quemetco, Inc. City of Industry, California
Final Report June 28, 2001
Submitted By:
BOC Process Gas Solutions 575 Mountain Avenue
Murray Hill, NJ 07974
2
Table of Contents Table of Contents 2 Cover Letter 3 Executive Summary 4 Acknowledgments 4 Industry Overview 4 LoTOx Process Description 5 LoTOx Process Chemistry 6 LoTOx System Description 7 LoTOx System Demonstration Objectives 8 LoTOx Demonstration Trailer Sub-Systems 9 Description of Testing 15 Range of Gas Test Conditions 15 Demonstration Test Results 15 Summary and Conclusions 24 Test Protocol Attachment A Grant Disbursement Request Attachment B Expense Documentation Attachment C
June 28, 2001 Ms. Emma Plasencia Air Resources Board Research Division P.O. Box 2815 Sacramento, CA 95812 RE: ICAT99-2 Grant Final Report And Grant Disbursement Request ICAT99-2 Grant is to BOC Gases for the demonstration of Low Temperature Oxidation of NOx Using Ozone Injection For Industrial Furnace Applications. The grant partially covers the cost of demonstrating the LoTOxTM Technology on a reverberatory furnace used for lead smelting, using the BOC Gases LoTOx Mobile Demonstration Trailer at a City of Industry, California facility operated by Quemetco Inc., an RSR Corporation subsidiary (referred to herein as RSR Quemetco). Progress Report 1 covered Deliverables 1 - 4 of the grant. This Final Report covers the remaining Deliverables 5, 6 and 7 which comprise the actual on-site testing and data collection, the data analysis, and writing of this final report. Also included in Attachment B is the Disbursement Request for the full remaining funds of the ICAT Grant, including the 10% holdings. The expense documentation is included in Attachment C. Very truly yours, Robert Ferrell Vice President, LoTOx Business Development BOC Process Gas Solutions
4
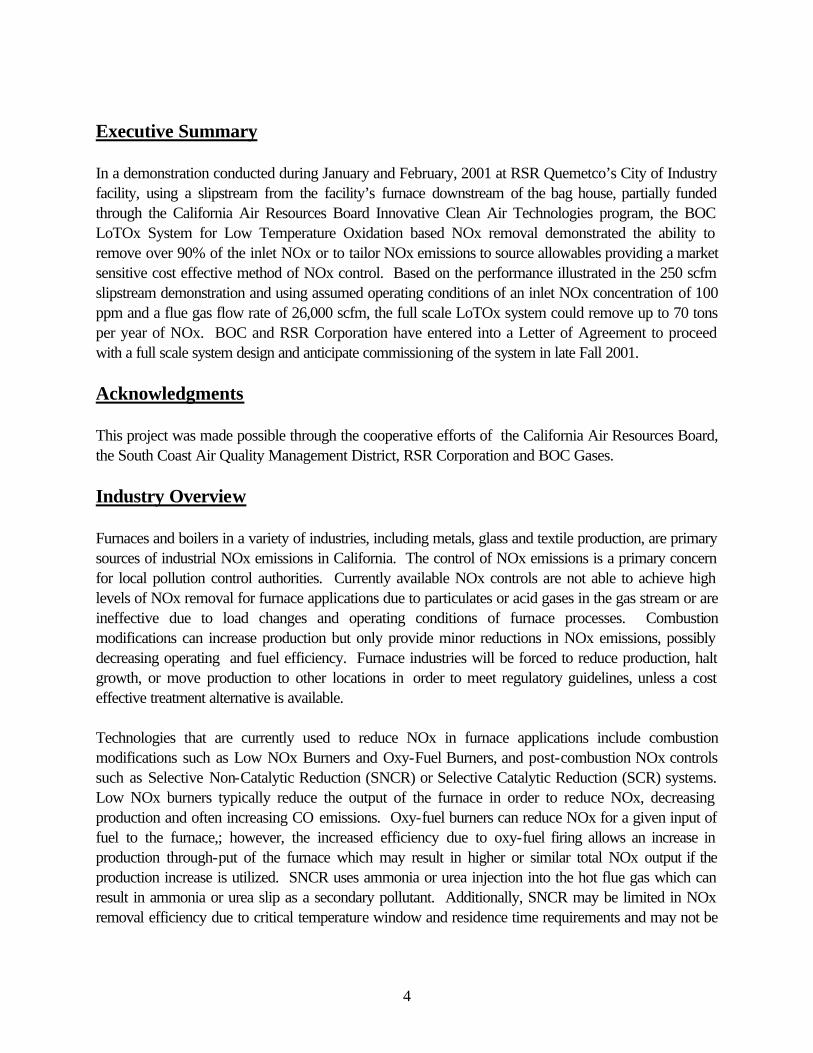
Executive Summary In a demonstration conducted during January and February, 2001 at RSR Quemetco’s City of Industry facility, using a slipstream from the facility’s furnace downstream of the bag house, partially funded through the California Air Resources Board Innovative Clean Air Technologies program, the BOC LoTOx System for Low Temperature Oxidation based NOx removal demonstrated the ability to remove over 90% of the inlet NOx or to tailor NOx emissions to source allowables providing a market sensitive cost effective method of NOx control. Based on the performance illustrated in the 250 scfm slipstream demonstration and using assumed operating conditions of an inlet NOx concentration of 100 ppm and a flue gas flow rate of 26,000 scfm, the full scale LoTOx system could remove up to 70 tons per year of NOx. BOC and RSR Corporation have entered into a Letter of Agreement to proceed with a full scale system design and anticipate commissioning of the system in late Fall 2001. Acknowledgments This project was made possible through the cooperative efforts of the California Air Resources Board, the South Coast Air Quality Management District, RSR Corporation and BOC Gases. Industry Overview Furnaces and boilers in a variety of industries, including metals, glass and textile production, are primary sources of industrial NOx emissions in California. The control of NOx emissions is a primary concern for local pollution control authorities. Currently available NOx controls are not able to achieve high levels of NOx removal for furnace applications due to particulates or acid gases in the gas stream or are ineffective due to load changes and operating conditions of furnace processes. Combustion modifications can increase production but only provide minor reductions in NOx emissions, possibly decreasing operating and fuel efficiency. Furnace industries will be forced to reduce production, halt growth, or move production to other locations in order to meet regulatory guidelines, unless a cost effective treatment alternative is available. Technologies that are currently used to reduce NOx in furnace applications include combustion modifications such as Low NOx Burners and Oxy-Fuel Burners, and post-combustion NOx controls such as Selective Non-Catalytic Reduction (SNCR) or Selective Catalytic Reduction (SCR) systems. Low NOx burners typically reduce the output of the furnace in order to reduce NOx, decreasing production and often increasing CO emissions. Oxy-fuel burners can reduce NOx for a given input of fuel to the furnace,; however, the increased efficiency due to oxy-fuel firing allows an increase in production through-put of the furnace which may result in higher or similar total NOx output if the production increase is utilized. SNCR uses ammonia or urea injection into the hot flue gas which can result in ammonia or urea slip as a secondary pollutant. Additionally, SNCR may be limited in NOx removal efficiency due to critical temperature window and residence time requirements and may not be
5
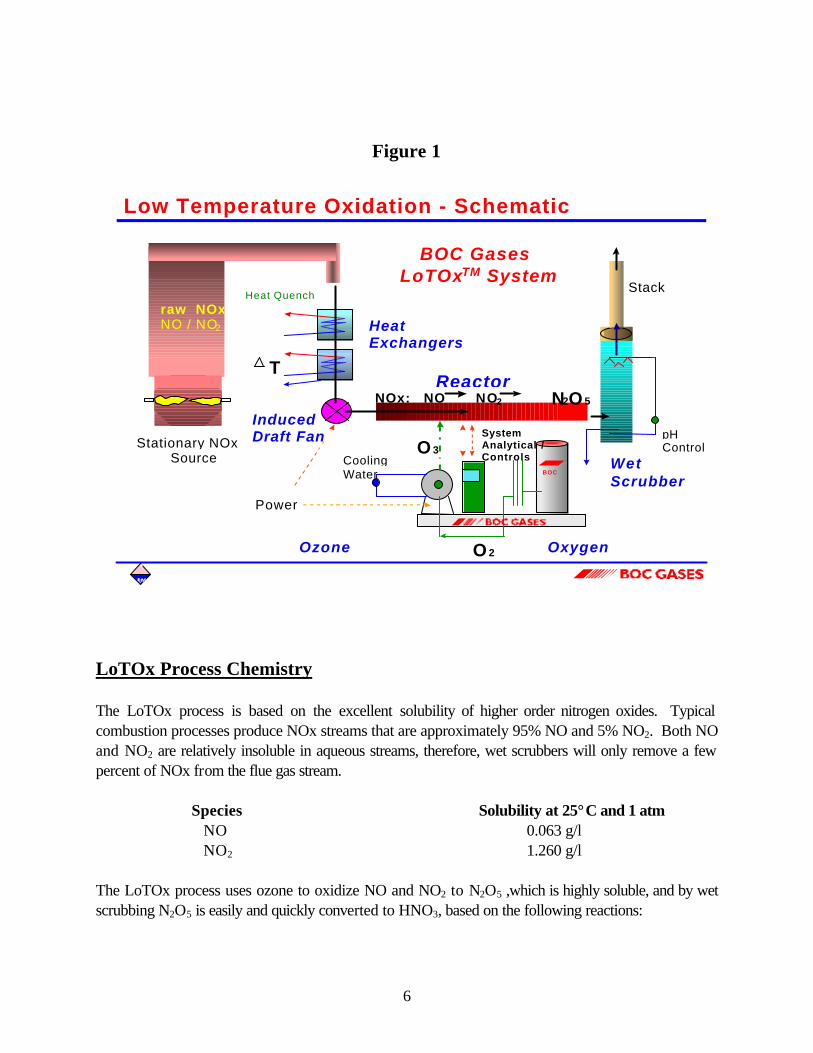
able to cost effectively achieve mandated removal requirements. SCR uses expensive catalysts and ammonia to reduce NOx. Catalyst based systems are prone to deactivation in particulate laden gas streams, such as those produced by furnaces, resulting in maintenance problems, high lifetime costs and lower NOx removal efficiency over time. Additionally, the narrow temperature window for effective NOx treatment with SCR may produce ammonia slip, or result in larger, expensive treatment systems for industrial processes with variable production loads. LoTOx Process Description The LoTOx System is a NOx removal system that uses ozone, injected into the flue gas stream to oxidize insoluble NOx to soluble oxidized compounds. Ozone is produced on site and on demand by passing oxygen through an ozone generator. LoTOx is a low temperature system,; therefore, it does not require heat input to maintain operational efficiency or to prevent treatment chemical slip, like ammonia, as is common with SCR and SNCR systems. Ozone is produced in response to the amount of NOx present in the flue gas generated by the process. The low operating temperature allows stable and consistent control regardless of variation in flow, load, or NOx content. There are no adverse effects of acid gases or particulates on the LoTOx System and some particulates may even enhance the reaction by producing sites for nucleation of moisture and by catalyzing the oxidation reaction. Ozone rapidly reacts with insoluble NO and NO2 molecules to form soluble N2O5. The species N2O5 is highly soluble and will rapidly react with moisture in the gas stream to form nitric acid. The conversion of NOx into the aqueous phase in the scrubber is rapid and irreversible, allowing nearly complete removal of NOx. The rapid reaction rate of ozone with NOx makes ozone highly selective for treatment of NOx in the presence of other compounds such as CO and SOx, resulting in high ozone utilization efficiency for NOx removal with no reaction with CO and SOx at the design retention time. Figure 1 is an overall process diagram of the LoTOx technology.
6
Figure 1
Low Temperature Oxidation - Schematic
Stationary NOx Source
Ozone
HeatExchangers
InducedDraft Fan
Oxygen
SystemAnalytical /Controls Wet
Scrubber
Reactor
raw NOxNO / NO2
T
O 3
O 2
CoolingWater
Power
Heat Quench
N2O 5
Stack
pHControl
NOx: NO NO 2
BOC
BOC Gases LoTOxTM System
LoTOx Process Chemistry The LoTOx process is based on the excellent solubility of higher order nitrogen oxides. Typical combustion processes produce NOx streams that are approximately 95% NO and 5% NO2. Both NO and NO2 are relatively insoluble in aqueous streams, therefore, wet scrubbers will only remove a few percent of NOx from the flue gas stream. Species Solubility at 25°C and 1 atm NO 0.063 g/l NO2 1.260 g/l
The LoTOx process uses ozone to oxidize NO and NO2 to N2O5 ,which is highly soluble, and by wet scrubbing N2O5 is easily and quickly converted to HNO3, based on the following reactions:
7
NO + O3 à NO2 + O2 2NO2 + O3 à N2O5 + O2 N2O5 + H2O à 2HNO3
Both N2O5 and HNO3 are extremely soluble in water. N2O5 reacts instantaneously with water forming HNO3. Since HNO3 is so highly soluble (approaching infinity) it is difficult to measure, and therefore reliable solubility data is not available in published literature. However, HNO3 mixes with water in all proportions and therefore the N2O5 to HNO3 reaction is irreversible in the presence of water. LoTOx System Description All LoTOx System components are reliable and well-understood technologies used in a variety of other applications and industries.
• Oxygen is stored as a liquid in a vacuum jacketed vessel or can be generated on-site or delivered by pipeline. Oxygen installations are safe and common to hospitals, universities, and a variety of industries. RSR Quemetco is currently supplied with oxygen via an on-site Vacuum Swing Adsorption (VSA) plant, which is used in their furnace oxy-fuel burners.
• Ozone is generated on-site using an ozone generator. Ozone generators are now
commonly used for drinking water, waste water and swimming pool water treatment. Ozone generators are safe, industrial components that are highly reliable, and provide long service life. An ozone generator is similar to a shell and tube heat exchanger. Ozone is produced as oxygen is passed through the water cooled tubes of the heat exchanger. Inside the tubes is a glass dielectric containing an electrode connected to a power source. As an electrical current passes through the glass tube, a corona discharge is produced along its surface. As oxygen passes through the corona, O2 molecules are dissociated, freeing oxygen atoms , which quickly combine with the available oxygen molecules to form O3 molecules in the oxygen stream. Ozone is always contained within the stainless steel ozone generator, process piping, or reaction section of the process gas stream and is completely consumed in the process posing no environmental threat Ozone is produced as a treatment chemical “on demand” in the exact proportion required for the measured level of NOx to be removed.
• Ozone is injected into a reaction duct installed in the process gas stream. The reaction duct
provides uniform distribution of the ozone and adequate mixing to effect rapid reaction. The residence time in the reaction duct allows complete reaction of ozone to oxidize insoluble NO and NO2 to highly soluble N2O5.
8
• The N2O5 is then absorbed from the gas phase into the liquid phase by water in an aqueous
scrubber. . The oxidation of NOx with ozone that creates the N2O5 and the subsequently produced dilute nitric acid, is similar to the process that occurs in the atmosphere, when smog reacts with moisture, resulting in acid rain. Scrubber systems are highly efficient and the reaction into the liquid phase is irreversible. The dilute acidic scrubber liquor can be neutralized with caustic before release to a sanitary sewer or Waste Water Treatment Plant facility.
LoTOx System Demonstration Objectives The LoTOx Trailer demonstration at RSR had three main objectives:
(1) To collect data for determining the ozone requirements for treating RSR’s flue gas for NOx removal, and for optimizing the oxidizer residence time / temperature model BOC uses to develop the most cost effective design for the components of a full scale LoTOx System.
(2) To characterize the variations in key process parameters (such as NOx levels, flow
rate, process temperature) and the response capability required from the control system, the ozone generator and the instrument packages so that the full scale LoTOx System control strategy can be determined.
(3) To provide sufficient operating experience and insight into the LoTOx system
behavior for treatment of flue gases from the furnace in order to familiarize RSR with the ease of the LoTOx System operation and BOC engineers with RSR operational issues to be considered in design and operation of the full scale system.
To accomplish this testing, a test protocol was developed that would accomplish the characterizations identified above, and enable the collection of the required data. The protocol was submitted with the initial progress report and is also included herein as Exhibit A. The duration of the testing lasted from January 16, to February 16, 2001. During the testing, a variety of production conditions were experienced, and the following process variations were observed: 1. NOx variations from 0 ppm to 800+ ppm (500 ppm maximum recordable by data acquisition
system) at the inlet to the LoTOx trailer, with NO doping gas added to stabilize inlet NOx levels to the desired test protocol parameters.
9
2. Temperature variations from 150°F to 225°F using the LoTOx trailer water cooled heat exchanger and electric heater to control to the desired test protocol parameters.
3. Flow variations from 150 scfm to 300 scfm, using the LoTOx trailer blower to control flow to the
desired test protocol parameters It must be noted that during the testing period RSR Quemetco was subjected to frequent utility directed power interruptions which required suspension of testing for periods lasting many hours and most likely produced variations in RSR Quemetco’s typical operating conditions. Due to the delays caused by the frequent interruptions the entire test protocol was not completed, however this did not impact the characterization of the process. LoTOx System Demonstration Trailer Sub-Systems
• 40 ppd Ozone Generator with Closed Loop Chiller • Gas Conditioning Module: Gas Cooler, 0-300 scfm FRP Blower, Gas Reheater • Reactor Module: 100’ 8” dia.SS and 6” dia. CPVC Oxidation Reactor Loop, Multiple O3
Diffusers • Scrubber Module: Spray and/or Packed Column Scrubber, Recirculating Chemical
Dosing System • Data Acquisition Module: MMI, PLC-based Controls, NOx, SOx, CO, O2, O3
Analyzers, Sample Conditioning System, Flow and Temperature Instruments • Safety Systems: Wash Station; Ambient O3, NOx, SOx, CO, O2 monitors • Off-Trailer Support Van (Operator Station; Storage of Equipment and Supplies)
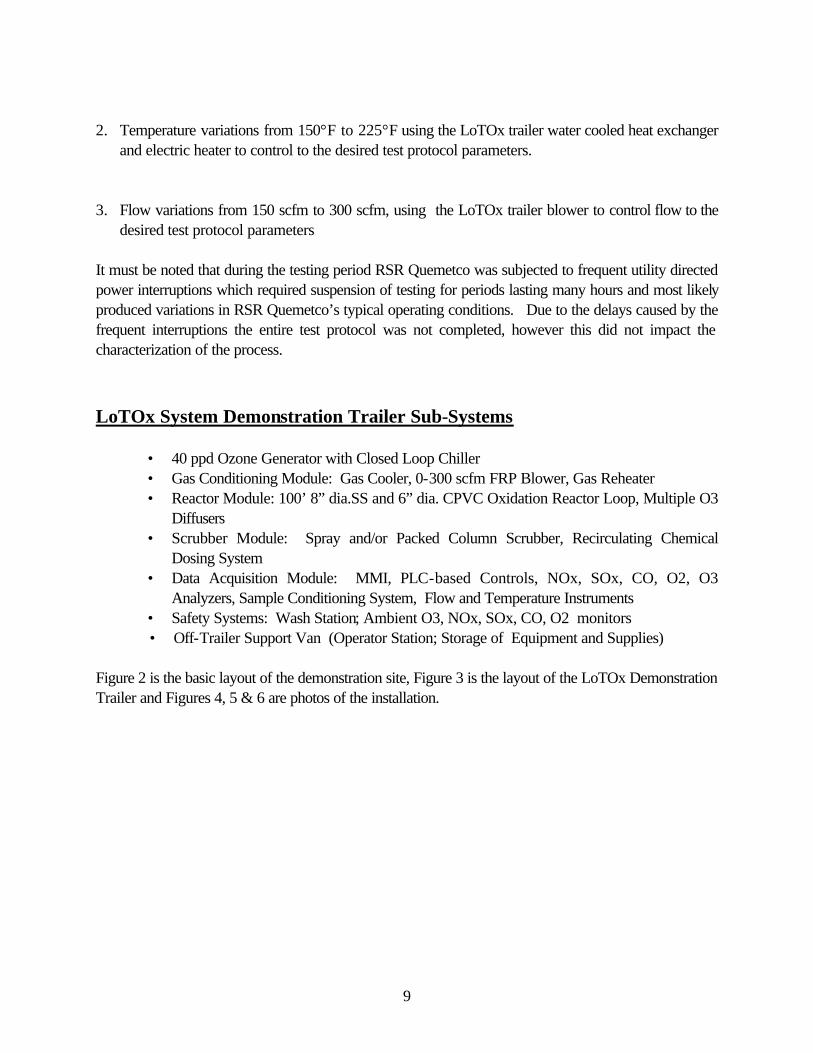
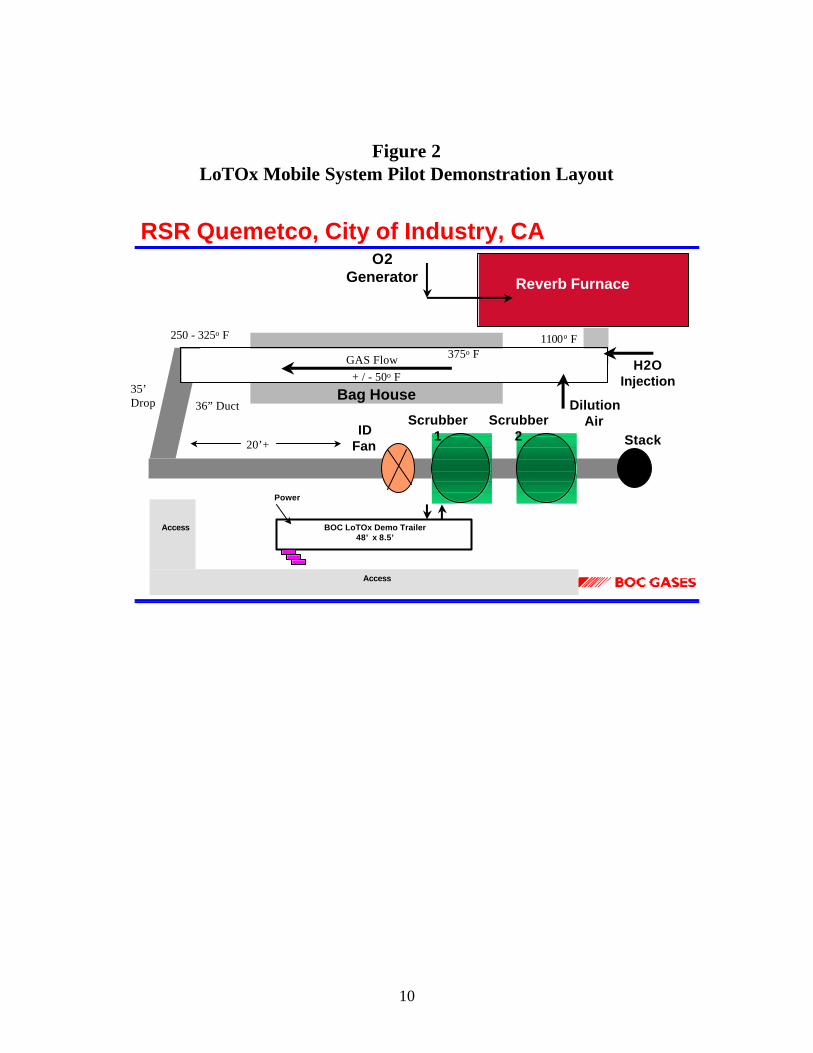
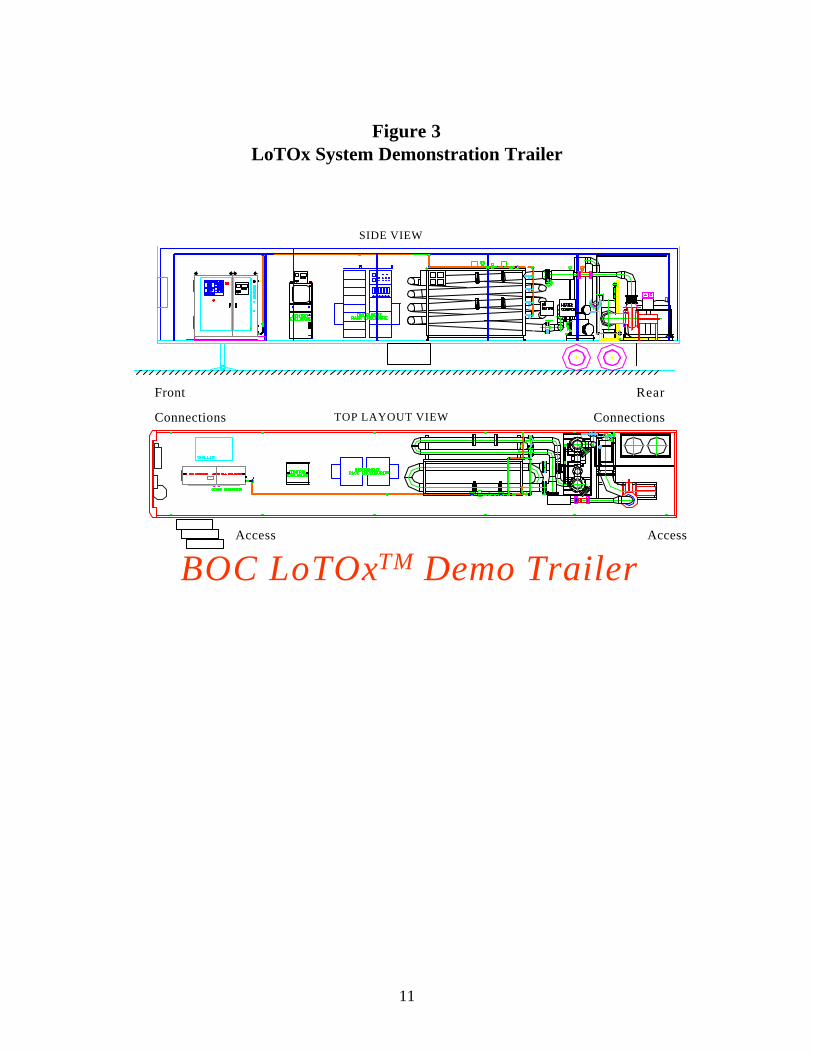
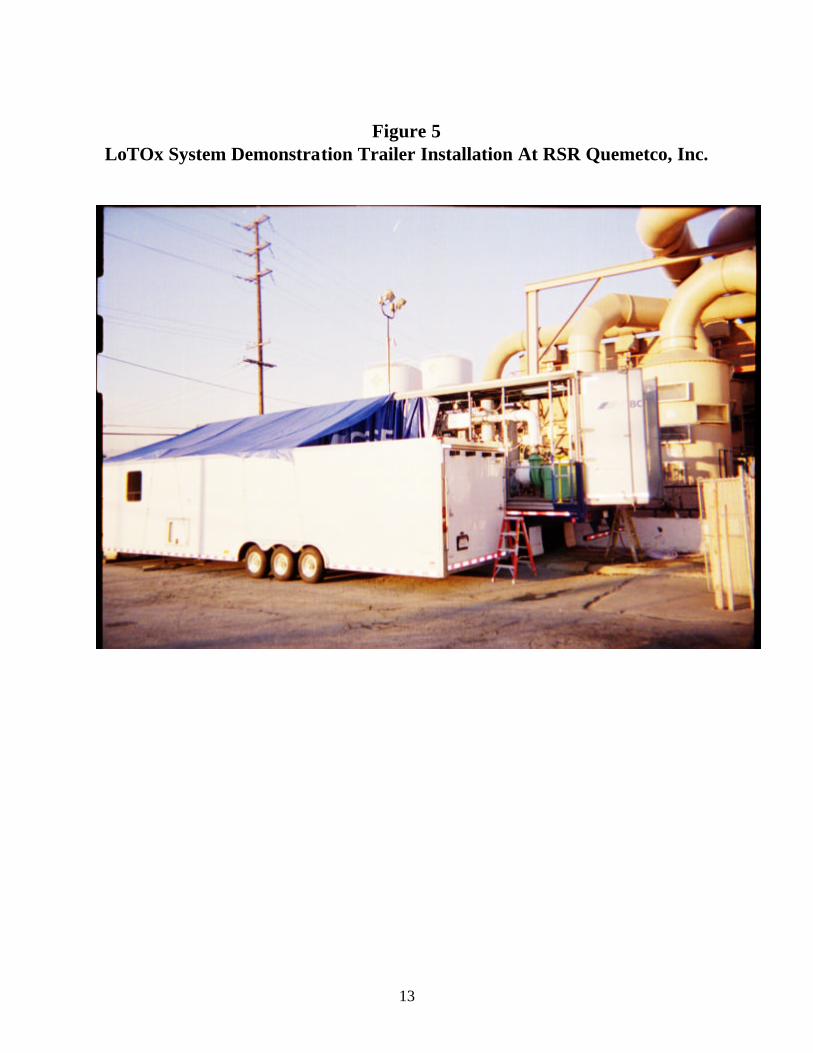
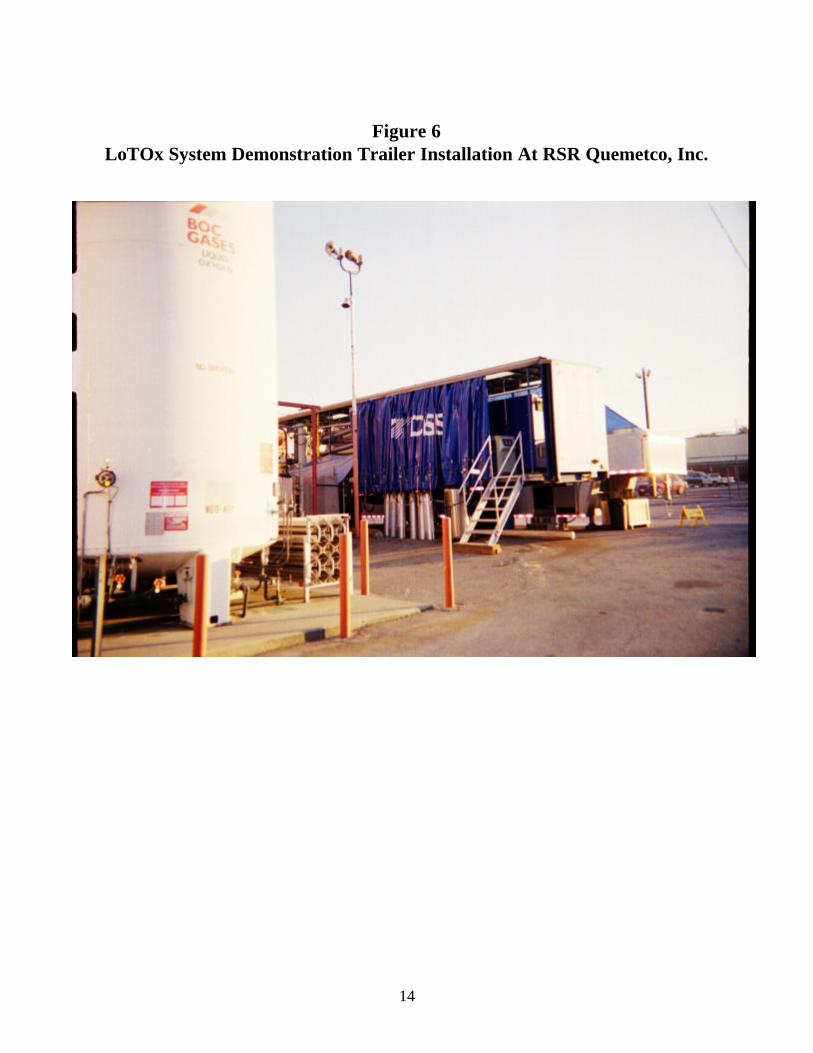
Figure 2 is the basic layout of the demonstration site, Figure 3 is the layout of the LoTOx Demonstration Trailer and Figures 4, 5 & 6 are photos of the installation.
10
Figure 2
LoTOx Mobile System Pilot Demonstration Layout
RSR Quemetco, City of Industry, CA
Reverb Furnace
Bag House
IDFan
Scrubber1
Scrubber2 Stack
DilutionAir
250 - 325o F
36” Duct35’Drop
20’+
GAS Flow
O2Generator
1100o F
H2OInjection
375o F
+ / - 50o F
BOC LoTOx Demo Trailer48’ x 8.5’
Access
Access
Power
11
Figure 3 LoTOx System Demonstration Trailer
SIDE VIEW
TOP LAYOUT VIEW
BOC LoTOxTM Demo Trailer
Front Rear
Connections Connections
Access Access
12
Figure 4 LoTOx System Demonstration Trailer Installation At RSR Quemetco, Inc.
13
Figure 5 LoTOx System Demonstration Trailer Installation At RSR Quemetco, Inc.
14
Figure 6 LoTOx System Demonstration Trailer Installation At RSR Quemetco, Inc.
15
Description of Testing The testing focused on measuring incoming NOx and flow variations, varied ozone dosage, residence time and temperature data, and the impact of these variations on treatment efficiency. The experimentation was conducted in manual operation mode to affect these parametric changes, varying specific parametric settings and recording the results as part of the data acquisition system. The residence time and treatment effectiveness test series provided valuable information for characterization of the process gas stream. Information was tracked for ozone usage in relation to percentage of NOx removal, residual O3 and temperature effects. During testing the following process information was recorded in the MMI: • Inlet and Outlet NOx, SOx, CO and O2. • Flue Gas Flow and O2(O3) Gas Flow. • Temperature Profile in the Oxidation Reactor. • Weight percent of O3 produced by the O3 Generator, and residual O3 at the scrubber exit. Range of Gas Test Conditions
• Gas Flow Range: 150 to 300 scfm • Temperature Inlet: 150 to 250 ºF • Inlet NOx : 0 - 500 ppmvd • Inlet SOx : 0 - 5000 ppmvd • Inlet O2 0 - 25 vol% • Inlet CO: 0 - 100 ppmvd
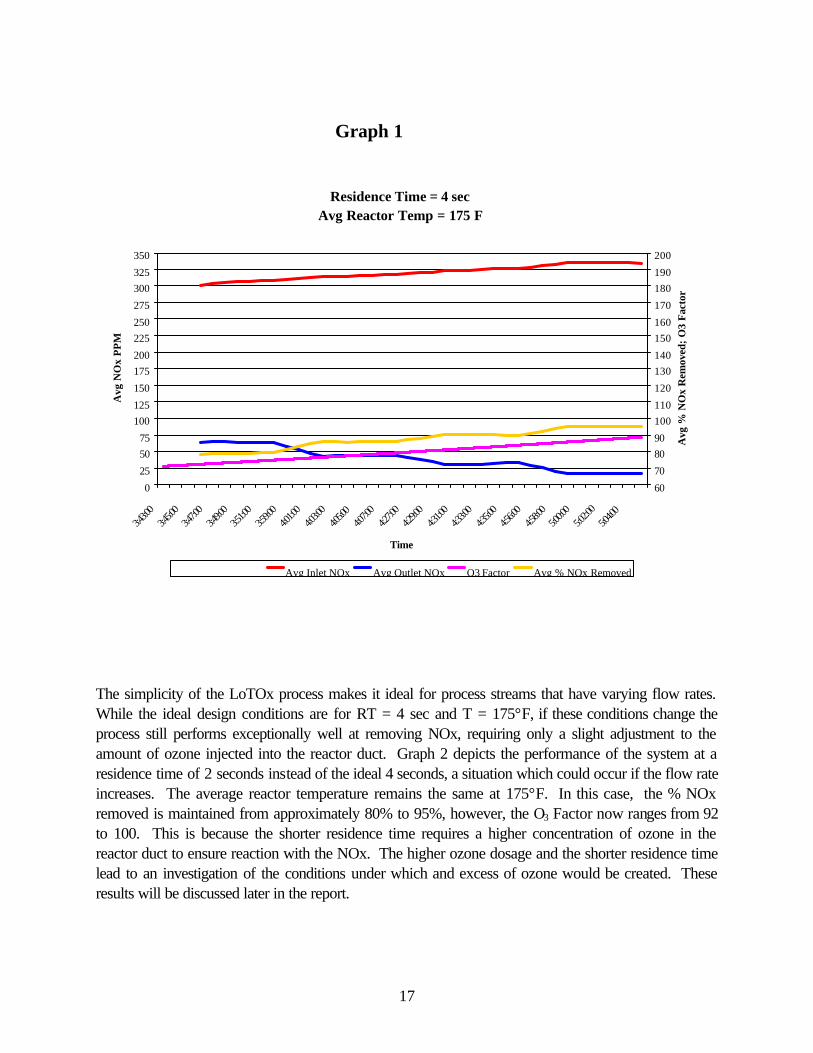
Demonstration Test Results There are three primary process variables which impact the NOx control capabilities of LoTOx process: Temperature of the flue gas (T), Residence Time of the flue gas in the reactor duct (RT) and Amount of Ozone (O3 Factor♣) injected into the reactor duct. Based on the results of the LoTOx demonstration testing the most efficient control parameters for the full scale system are a temperature of 175°F or less, a residence time of 4 seconds and an ozone injection factor of 80 to 90. The O3 Factor is representative of the O3 to NOx ratio at the inlet to the reaction duct. The presented data uses O3 Factor for the sake of clarity and to provide meaningful data while maintaining confidentiality of proprietary intellectual information.
♣ Note that , due to the confidential nature of the data, the Amount of Ozone reported herein is represented as a normalized “O3 Factor” which still illustrates the performance of the technology.

16
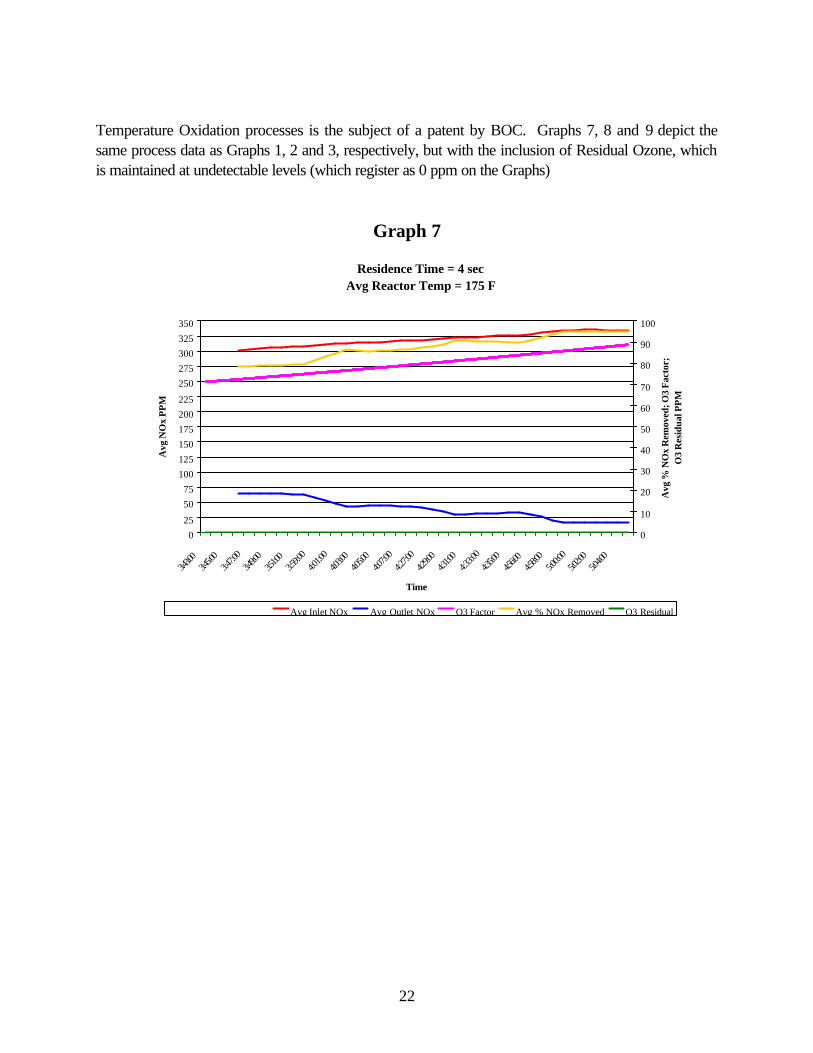
Graph 1 depicts the performance conditions of the LoTOx Process for the design conditions of RT = 4 sec, T = 175°F and O3 Factor = 70 to 90. Under these design conditions the NOx removal achieved ranges from 80% at an O3 Factor of 70 to 95% at an O3 Factor of 90.
17
Graph 1
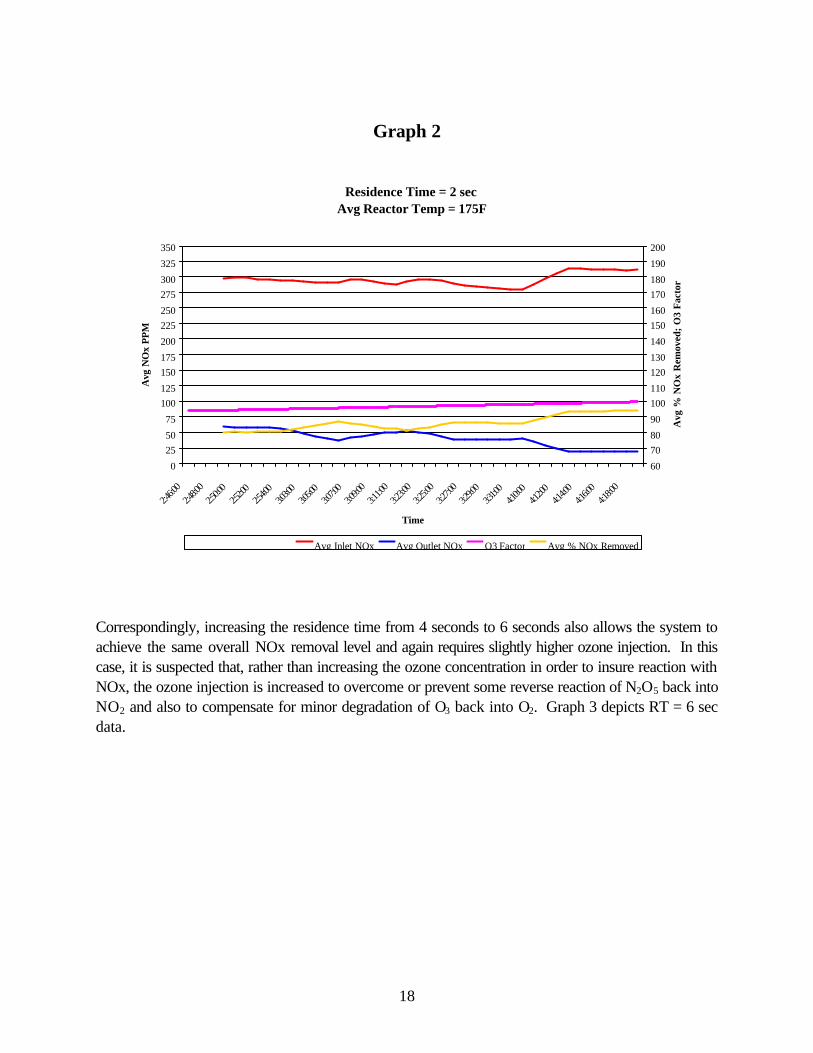
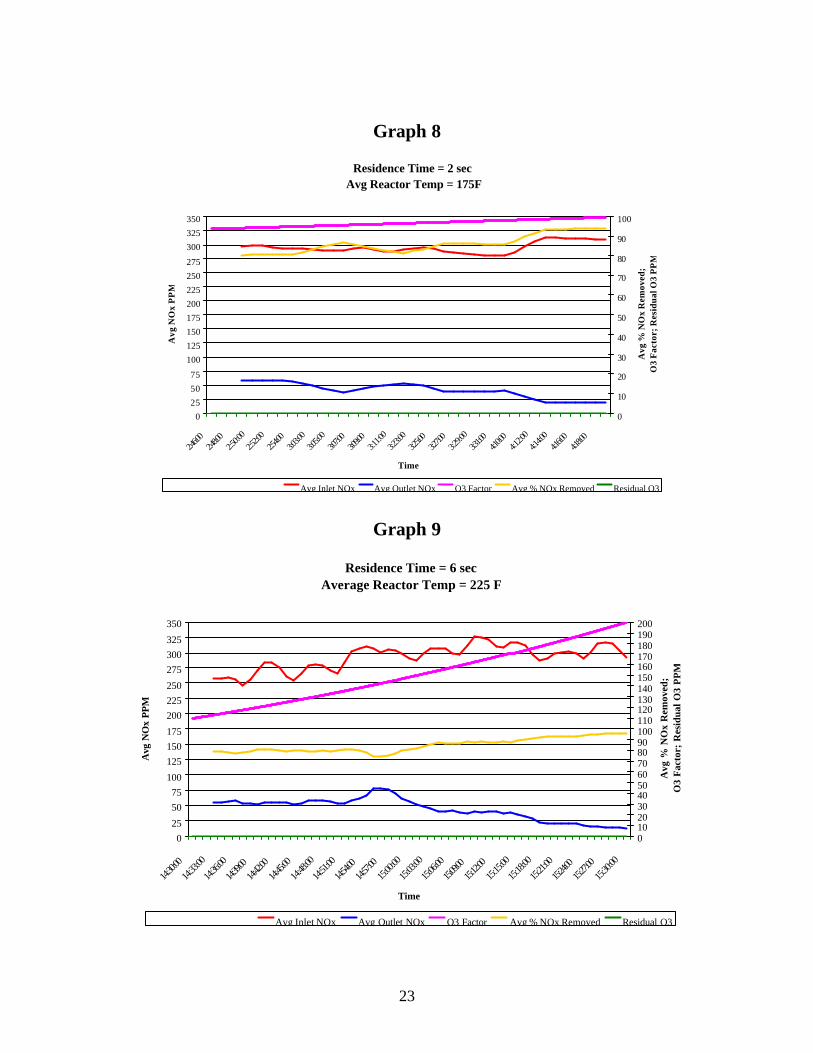
The simplicity of the LoTOx process makes it ideal for process streams that have varying flow rates. While the ideal design conditions are for RT = 4 sec and T = 175°F, if these conditions change the process still performs exceptionally well at removing NOx, requiring only a slight adjustment to the amount of ozone injected into the reactor duct. Graph 2 depicts the performance of the system at a residence time of 2 seconds instead of the ideal 4 seconds, a situation which could occur if the flow rate increases. The average reactor temperature remains the same at 175°F. In this case, the % NOx removed is maintained from approximately 80% to 95%, however, the O3 Factor now ranges from 92 to 100. This is because the shorter residence time requires a higher concentration of ozone in the reactor duct to ensure reaction with the NOx. The higher ozone dosage and the shorter residence time lead to an investigation of the conditions under which and excess of ozone would be created. These results will be discussed later in the report.
Residence Time = 4 secAvg Reactor Temp = 175 F
0
25
5075
100125
150
175200
225250
275
300325
350
3:43:0
03:4
5:00
3:47:0
03:4
9:00
3:51:0
03:5
9:00
4:01:0
04:0
3:00
4:05:0
04:0
7:00
4:27:0
04:2
9:00
4:31:0
04:3
3:00
4:35:0
04:5
6:00
4:58:0
05:0
0:00
5:02:0
05:0
4:00
Time
Avg
NO
x P
PM
60
70
8090
100110
120
130140
150160
170
180190
200
Avg
% N
Ox
Rem
oved
; O
3 Fa
ctor
Avg Inlet NOx Avg Outlet NOx O3 Factor Avg % NOx Removed
18
Graph 2
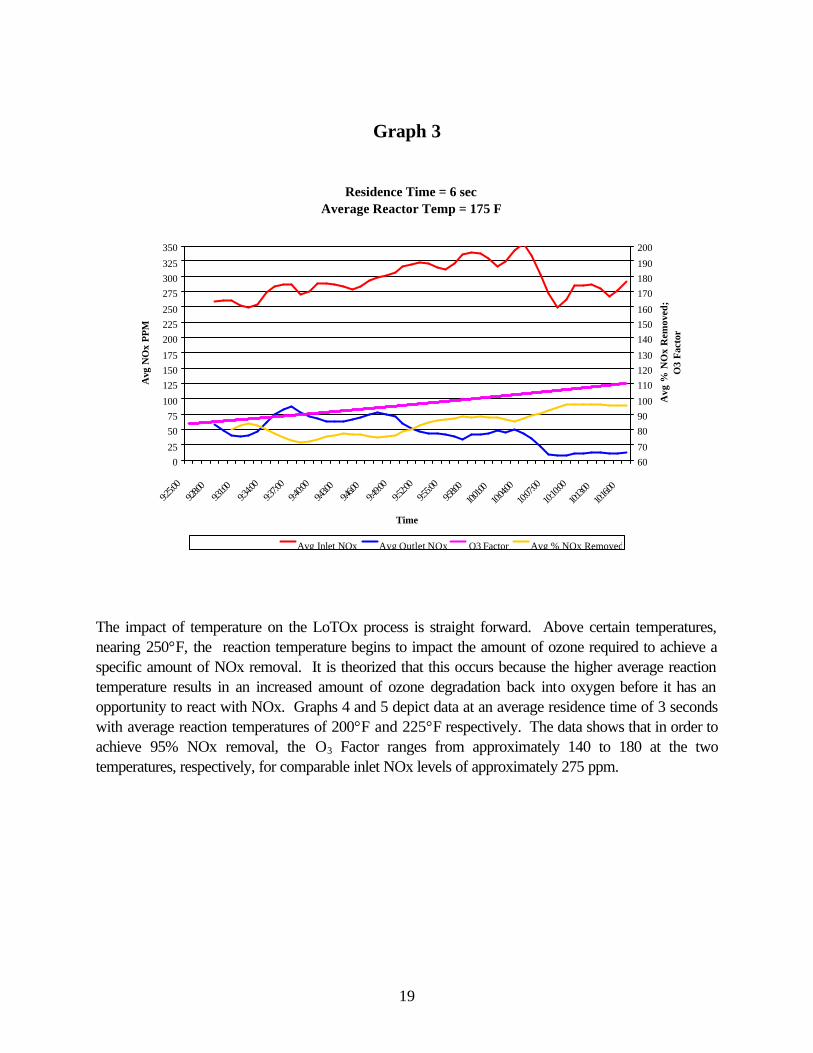
Correspondingly, increasing the residence time from 4 seconds to 6 seconds also allows the system to achieve the same overall NOx removal level and again requires slightly higher ozone injection. In this case, it is suspected that, rather than increasing the ozone concentration in order to insure reaction with NOx, the ozone injection is increased to overcome or prevent some reverse reaction of N2O5 back into NO2 and also to compensate for minor degradation of O3 back into O2. Graph 3 depicts RT = 6 sec data.
Residence Time = 2 sec Avg Reactor Temp = 175F
0
2550
75
100125
150175
200
225250
275300
325
350
2:46:0
02:4
8:00
2:50:0
02:5
2:00
2:54:0
03:0
3:00
3:05:0
03:0
7:00
3:09:0
03:1
1:00
3:23:0
03:2
5:00
3:27:0
03:2
9:00
3:31:0
04:1
0:00
4:12:0
04:1
4:00
4:16:0
04:1
8:00
Time
Avg
NO
x PP
M
60
7080
90
100110
120130
140
150160
170180
190
200
Avg
% N
Ox
Rem
oved
; O
3 F
acto
r
Avg Inlet NOx Avg Outlet NOx O3 Factor Avg % NOx Removed
19
Graph 3
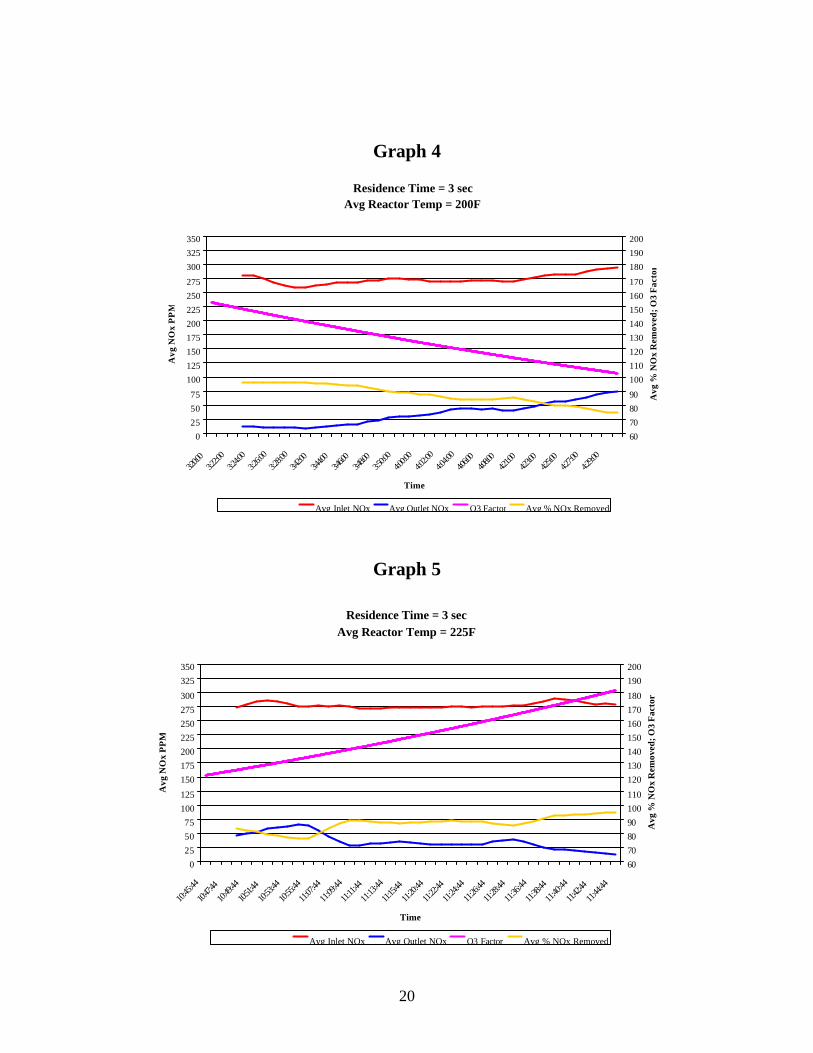
The impact of temperature on the LoTOx process is straight forward. Above certain temperatures, nearing 250°F, the reaction temperature begins to impact the amount of ozone required to achieve a specific amount of NOx removal. It is theorized that this occurs because the higher average reaction temperature results in an increased amount of ozone degradation back into oxygen before it has an opportunity to react with NOx. Graphs 4 and 5 depict data at an average residence time of 3 seconds with average reaction temperatures of 200°F and 225°F respectively. The data shows that in order to achieve 95% NOx removal, the O3 Factor ranges from approximately 140 to 180 at the two temperatures, respectively, for comparable inlet NOx levels of approximately 275 ppm.
Residence Time = 6 secAverage Reactor Temp = 175 F
025
5075
100
125150175
200225250
275300325
350
9:25:0
09:2
8:00
9:31:0
09:3
4:00
9:37:0
09:4
0:00
9:43:0
09:4
6:00
9:49:0
09:5
2:00
9:55:0
09:5
8:00
10:01:00
10:04:
00
10:07:
00
10:10:
00
10:13:00
10:16:
00
Time
Avg
NO
x PP
M
6070
8090100
110120130
140150160
170180190
200
Avg
% N
Ox
Rem
oved
;O
3 Fa
ctor
Avg Inlet NOx Avg Outlet NOx O3 Factor Avg % NOx Removed
20
Graph 4
Graph 5
Residence Time = 3 secAvg Reactor Temp = 200F
0
25
50
75
100
125
150
175
200
225
250
275
300
325
350
3:20:0
03:2
2:00
3:24:0
03:2
6:00
3:28:0
03:4
2:00
3:44:0
03:4
6:00
3:48:0
03:5
0:00
4:00:0
04:0
2:00
4:04:0
04:0
6:00
4:08:0
04:2
1:00
4:23:0
04:2
5:00
4:27:0
04:2
9:00
Time
Avg
NO
x P
PM
60
70
80
90
100
110
120
130
140
150
160
170
180
190
200
Avg
% N
Ox
Rem
oved
; O3
Fac
tor
Avg Inlet NOx Avg Outlet NOx O3 Factor Avg % NOx Removed
Residence Time = 3 secAvg Reactor Temp = 225F
0255075
100125
150175200225250275300
325350
10:45:
44
10:47:
44
10:49:
44
10:51:
44
10:53:
44
10:55:
44
11:07:
44
11:09:
44
11:11:
44
11:13:
44
11:15:
44
11:20:
44
11:22:
44
11:24:
44
11:26:
44
11:28:
44
11:36:
44
11:38:
44
11:40:
44
11:42:
44
11:44:
44
Time
Avg
NO
x P
PM
60708090100110
120130140150160170180
190200
Avg
% N
Ox
Rem
oved
; O3
Fac
tor
Avg Inlet NOx Avg Outlet NOx O3 Factor Avg % NOx Removed
21
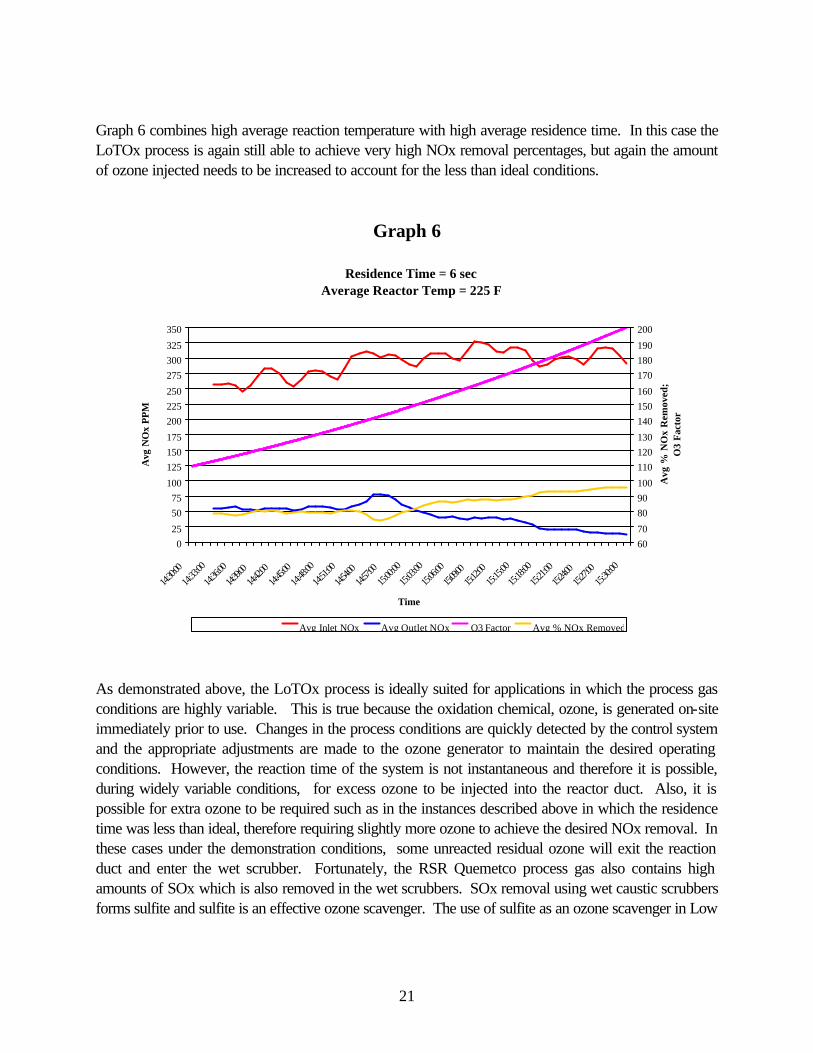
Graph 6 combines high average reaction temperature with high average residence time. In this case the LoTOx process is again still able to achieve very high NOx removal percentages, but again the amount of ozone injected needs to be increased to account for the less than ideal conditions.
Graph 6
As demonstrated above, the LoTOx process is ideally suited for applications in which the process gas conditions are highly variable. This is true because the oxidation chemical, ozone, is generated on-site immediately prior to use. Changes in the process conditions are quickly detected by the control system and the appropriate adjustments are made to the ozone generator to maintain the desired operating conditions. However, the reaction time of the system is not instantaneous and therefore it is possible, during widely variable conditions, for excess ozone to be injected into the reactor duct. Also, it is possible for extra ozone to be required such as in the instances described above in which the residence time was less than ideal, therefore requiring slightly more ozone to achieve the desired NOx removal. In these cases under the demonstration conditions, some unreacted residual ozone will exit the reaction duct and enter the wet scrubber. Fortunately, the RSR Quemetco process gas also contains high amounts of SOx which is also removed in the wet scrubbers. SOx removal using wet caustic scrubbers forms sulfite and sulfite is an effective ozone scavenger. The use of sulfite as an ozone scavenger in Low
Residence Time = 6 secAverage Reactor Temp = 225 F
025
5075
100
125150175
200225250
275300325
350
14:30:
00
14:33:
00
14:36:
00
14:39:00
14:42:
0014:
45:00
14:48:
00
14:51:
00
14:54:00
14:57:
0015:
00:00
15:03:
00
15:06:
00
15:09:00
15:12:
0015:
15:00
15:18:
00
15:21:
00
15:24:00
15:27:
0015:
30:00
Time
Avg
NO
x PP
M
6070
8090100
110120130
140150160
170180190
200
Avg
% N
Ox
Rem
oved
;O
3 Fa
ctor
Avg Inlet NOx Avg Outlet NOx O3 Factor Avg % NOx Removed
22
Temperature Oxidation processes is the subject of a patent by BOC. Graphs 7, 8 and 9 depict the same process data as Graphs 1, 2 and 3, respectively, but with the inclusion of Residual Ozone, which is maintained at undetectable levels (which register as 0 ppm on the Graphs)
Graph 7
Residence Time = 4 secAvg Reactor Temp = 175 F
0
25
50
75
100
125
150
175
200
225
250
275
300
325
350
3:43:00
3:45:0
03:4
7:00
3:49:0
03:51
:003:5
9:00
4:01:0
04:0
3:00
4:05:0
04:0
7:00
4:27:0
04:2
9:00
4:31:0
04:3
3:00
4:35:0
04:56
:004:5
8:00
5:00:0
05:0
2:00
5:04:0
0
Time
Avg
NO
x P
PM
0
10
20
30
40
50
60
70
80
90
100
Avg
% N
Ox
Rem
oved
; O3
Fact
or;
O3
Res
idua
l PP
M
Avg Inlet NOx Avg Outlet NOx O3 Factor Avg % NOx Removed O3 Residual
23
Graph 8
Graph 9
Residence Time = 2 sec Avg Reactor Temp = 175F
0
25
50
75
100
125
150
175
200
225
250
275
300
325
350
2:46:0
02:4
8:00
2:50:0
02:5
2:00
2:54:0
03:0
3:00
3:05:0
03:0
7:00
3:09:0
03:1
1:00
3:23:0
03:2
5:00
3:27:0
03:2
9:00
3:31:0
04:1
0:00
4:12:0
04:1
4:00
4:16:0
04:1
8:00
Time
Avg
NO
x P
PM
0
10
20
30
40
50
60
70
80
90
100
Avg
% N
Ox
Rem
oved
;O
3 F
acto
r; R
esid
ual O
3 P
PM
Avg Inlet NOx Avg Outlet NOx O3 Factor Avg % NOx Removed Residual O3
Residence Time = 6 secAverage Reactor Temp = 225 F
025
5075
100
125150175
200225250
275300325
350
14:30:
00
14:33:
00
14:36:
00
14:39:00
14:42:
0014:
45:00
14:48:
00
14:51:
00
14:54:00
14:57:
0015:
00:00
15:03:
00
15:06:
00
15:09:00
15:12:
0015:
15:00
15:18:
00
15:21:
00
15:24:00
15:27:
0015:
30:00
Time
Avg
NO
x PP
M
0102030405060708090100110120130140150160170180190200
Avg
% N
Ox
Rem
oved
;O
3 F
acto
r; R
esid
ual O
3 P
PM
Avg Inlet NOx Avg Outlet NOx O3 Factor Avg % NOx Removed Residual O3
24
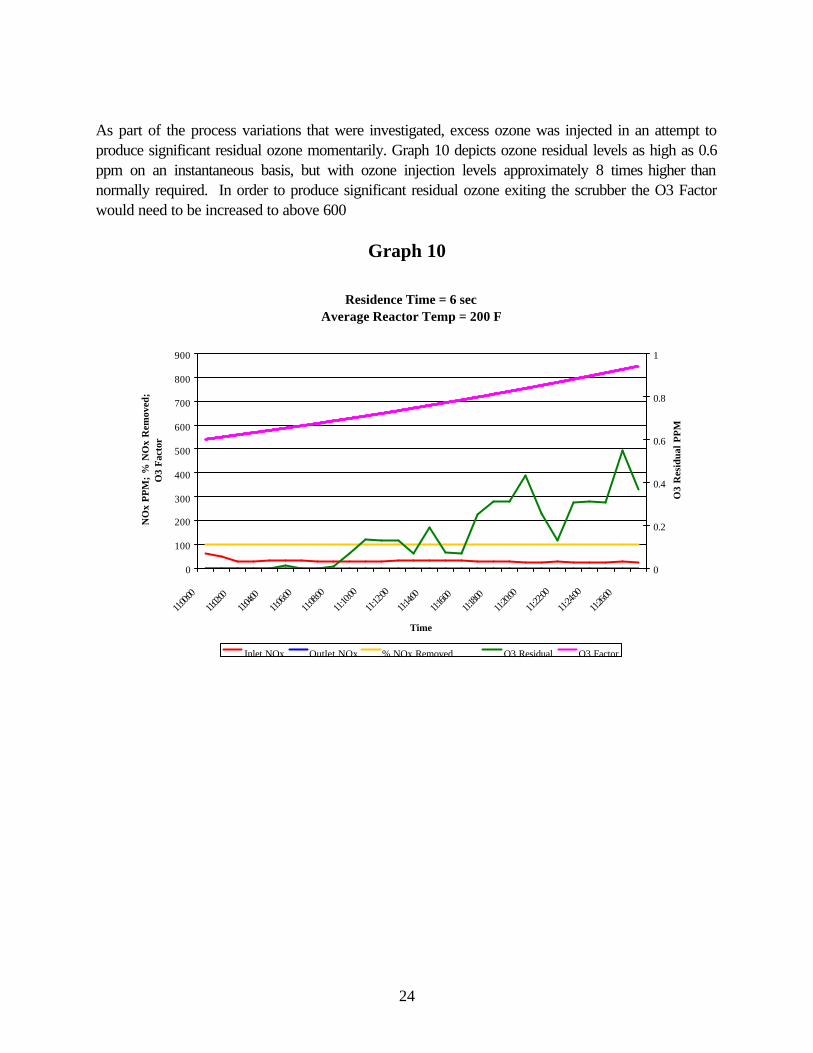
As part of the process variations that were investigated, excess ozone was injected in an attempt to produce significant residual ozone momentarily. Graph 10 depicts ozone residual levels as high as 0.6 ppm on an instantaneous basis, but with ozone injection levels approximately 8 times higher than normally required. In order to produce significant residual ozone exiting the scrubber the O3 Factor would need to be increased to above 600
Graph 10
Residence Time = 6 secAverage Reactor Temp = 200 F
0
100
200
300
400
500
600
700
800
900
11:00:
00
11:02:00
11:04:00
11:06:
00
11:08:
00
11:10:
00
11:12:
00
11:14:
0011:1
6:0011:1
8:0011:
20:00
11:22:
00
11:24:
00
11:26:
00
Time
NO
x P
PM
; %
NO
x R
emov
ed;
O3
Fact
or
0
0.2
0.4
0.6
0.8
1
O3
Res
idua
l PP
M
Inlet NOx Outlet NOx % NOx Removed O3 Residual O3 Factor
25
Summary and Conclusion From the test data it is clear that the LoTOx process is extremely effective and efficient at removing NOx from the RSR Quemetco furnace flue gases. The optimal operating conditions, which in combination, would produce the desired NOx removal at minimal reaction time, and minimal ozone demand, existed at an average residence time of 4 seconds and an average reactor temperature of 175°F or less. NOx removal efficiencies ranging from 80% to 95% were demonstrated as achievable and controllable using injection of ozone at factors of 70 to 90 at the optimum design conditions. NOx removal efficiencies of 80% to 95% were also achievable with temperature variations ranging up to 225°F and residence times ranging from 2 seconds to 6 seconds, by increasing the ozone injection factor up to 180. Additionally, the LoTOx System allows the ability to tailor the NOx emissions to the source allowables providing market sensitive NOx control. Full scale systems include automated control systems which automatically adjust the ozone injection rates in order to maintain a desired outlet NOx level, therefore enabling the system to automatically respond to variations in the process conditions. The testing also demonstrated that residual ozone levels can be maintained at undetectable levels despite variations in the process conditions, due to the effectiveness of sulfite, which is formed as a by-product of RSR Quemetco’s SOx removal system, as an ozone scavenger. When operating in “control” mode as part of full scale, conventional LoTOx systems (as opposed to the manual control system used for the demonstration) the continuous control system adjustment of the ozone demand combined with the capacity of sulfite to consume residual O3 , would allow for an extremely robust system design, able to accommodate large variations in the process flue gas without significantly impacting the performance of the LoTOx system for removing NOx. Design engineering of a full scale LoTOx System for RSR Quemetco’s facility has commenced and is expected to be commissioned by the end of Calendar Year 2001.
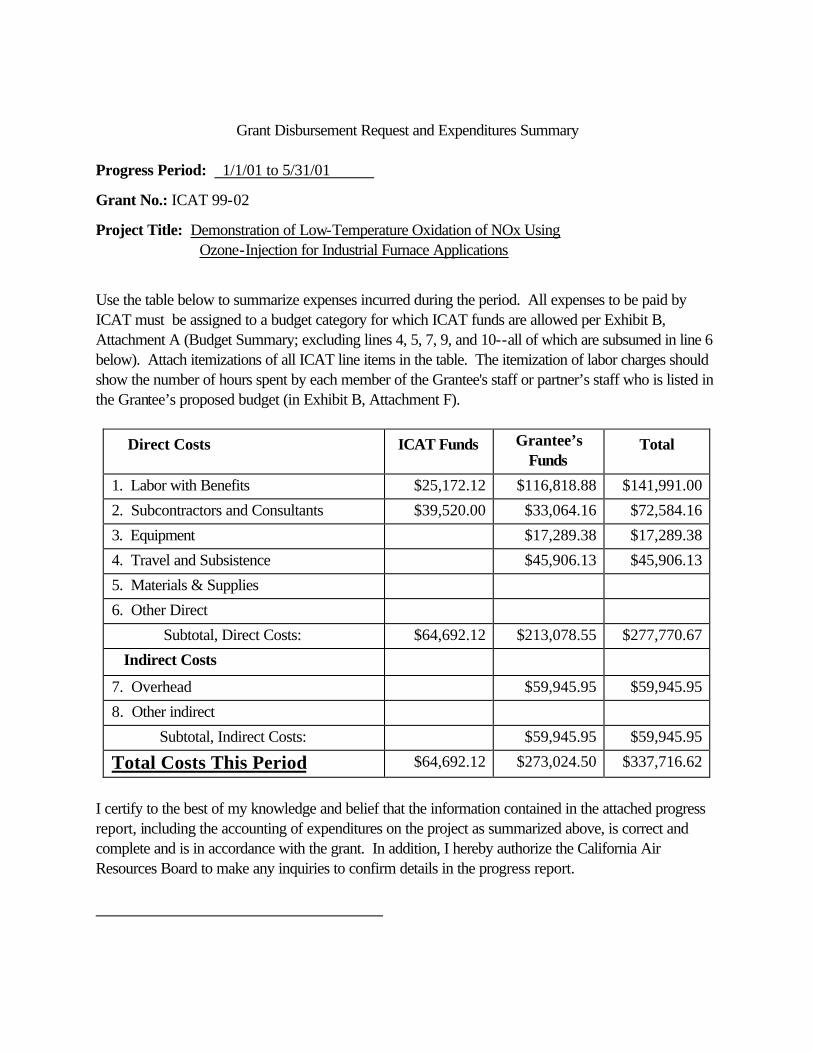
Grant Disbursement Request and Expenditures Summary
Progress Period: 1/1/01 to 5/31/01
Grant No.: ICAT 99-02
Project Title: Demonstration of Low-Temperature Oxidation of NOx Using Ozone-Injection for Industrial Furnace Applications
Use the table below to summarize expenses incurred during the period. All expenses to be paid by ICAT must be assigned to a budget category for which ICAT funds are allowed per Exhibit B, Attachment A (Budget Summary; excluding lines 4, 5, 7, 9, and 10--all of which are subsumed in line 6 below). Attach itemizations of all ICAT line items in the table. The itemization of labor charges should show the number of hours spent by each member of the Grantee's staff or partner’s staff who is listed in the Grantee’s proposed budget (in Exhibit B, Attachment F).
Direct Costs ICAT Funds Grantee’s
Funds
Total
1. Labor with Benefits $25,172.12 $116,818.88 $141,991.00
2. Subcontractors and Consultants $39,520.00 $33,064.16 $72,584.16
3. Equipment $17,289.38 $17,289.38
4. Travel and Subsistence $45,906.13 $45,906.13
5. Materials & Supplies
6. Other Direct
Subtotal, Direct Costs: $64,692.12 $213,078.55 $277,770.67
Indirect Costs
7. Overhead $59,945.95 $59,945.95
8. Other indirect
Subtotal, Indirect Costs: $59,945.95 $59,945.95
Total Costs This Period $64,692.12 $273,024.50 $337,716.62
I certify to the best of my knowledge and belief that the information contained in the attached progress report, including the accounting of expenditures on the project as summarized above, is correct and complete and is in accordance with the grant. In addition, I hereby authorize the California Air Resources Board to make any inquiries to confirm details in the progress report.

27
Grantee Signature - Robert Ferrell Date: ______________