Embed Size (px)
Citation preview
California Community ClinicsA Financial Profile, 2005–2008
Prepared by Capital Linkin collaboration with the California HealthCare Foundation
Connecting Health Centers to Capital Resources
ii | California Community Clinics – Financial Profi le, 2005 – 2008 Prepared by Capital Link
Copyright © 2010 Capital Link. All rights reserved.
Prepared by Capital Link California Community Clinics – Financial Profi le, 2005 – 2008 | iii Prepared by Capital Link California Community Clinics – Financial Profi le, 2005 – 2008 | iii
CAPITAL LINK is pleased to provide this report, prepared for the California HealthCare Foundation, to evaluate the fi nan-
cial health of California clinics and to highlight their historical growth patterns, capital fi nancing opportunities and other trends that may infl uence their future fi nancial performance and growth prospects. This study was supported by a grant from the California HealthCare Foundation, based in Oakland, California.
The California HealthCare Foundation is an independent philanthropy committed to improving the way health care is delivered and fi nanced in California. By promoting innovations in care and broader access to information, the Foundation’s goal is to ensure that all Californians can get the care they need, when they need it, at a price they can afford. For more information, visit www.chcf.org.
Capital Link, established in 1998, is a non-profi t organization dedicated to assisting community health centers in accessing capital for building and equipment projects. From market feasibility and program, staff and facility plans to comprehensive fi nancing assistance, Capital Link provides extensive technical assistance to health centers to strengthen their abilities to plan and carry out successful capital projects. Additionally, Capital Link works in partnership with primary care associations, consultants and other entities interested in improving access to capital for health centers.
Capital Link was founded by the National Association of Community Health Centers, Community Health Center Capital Fund, Massachusetts League of Community Health Centers, and Primary Care Associations in Illinois, North Carolina and Texas. Capital Link receives funding from governmental agencies, private foundations and fees charged to clients for services. For more information, visit www.caplink.org.
ACKNOWLEDGEMENT
iv | California Community Clinics – Financial Profi le, 2005 – 2008 Prepared by Capital Link
TABLE OF CONTENTS
Chapter 1 Executive Summary 1
Chapter 2 Description Of California Community Clinics 5
Chapter 3 Community Clinic & Health Center Revenues 31
Chapter 4 Operating Revenues: Major Categories And Growth Rates 40
Chapter 5 Operating Expenses: Major Categories And Trends 45
Chapter 6 Detailed Analysis Of Patient Service Revenue By Payor 49
Chapter 7 Key Financial Ratios And Measures 57
Chapter 8 Subgroup Analysis: Comparison By Clinic Revenue Size 65
Chapter 9 Subgroup Analysis: Comparison By Clinic Type 82
Chapter 10 Clinics And Capital Access 100
Chapter 11 State And Federal Policy And Fiscal Environment 107
Appendix A Methodology 111
Appendix B Maps of Urban Areas 115
Prepared by Capital Link California Community Clinics – Financial Profi le, 2005 – 2008 | 1
AS OF EARLY 2010, California remains deeply mired in the worst economic and unemploy-ment crisis since the Great Depression. According to the UCLA Center for Health Policy
Research, nearly 2 million Californians lost their health insurance during 2008 and 2009 — years characterized by a deep recession and mass layoffs — bringing the total number of uninsured in the state to more than 8 million. Today, nearly one-quarter of all adult Californians lack health insurance. As demand for clinic services is growing, the state is once again faced with a massive budget defi cit that it will attempt to reconcile through combinations of program cuts, payment delays, and possible tax increases. It is likely that the reach of clinic programs and services will once again be dramatically affected by the budget balancing process at the same time that more uninsured patients will need their services.
The following report profi les the fi nancial health of California clinics from 2005 to 2008 and highlights key indicators of fi nancial performance as well as related utilization trends that may infl uence their future fi nancial sustainability as clinics continue to respond to the increasing service demands in their communities. Prepared for the California HealthCare Foundation by Capital Link, this report examines data on California community clinics reported to the California Offi ce of Statewide Health Planning and Development (OSHPD) and to the Internal Revenue Service in Form 990 tax fi lings for the years 2005–2008. This report represents an update to the initial Financial Profi le of California Community Clinics 2003–2006 report that was also conducted by Capital Link and published in March 2009.1
1
EXECUTIVE SUMMARY 1. Community clinics are an integral part of the California primary care and safety-net system.
2. California community clinics continue to grow.
3. Their patients are growing poorer.
4. The low-income and uninsured patients seen at California clinics are growing at a faster pace than similar population groups in the state at large.
5. The California clinic system is still somewhat fi nancially vulnerable.
6. Community clinics are very dependent on government payor sources.
7. There has been some overall fi scal improvement in the operations of community clinics.
8. The federal Health Center Growth Initiative signifi cantly increased the proportion of FQHC Section 330 clinics in the state.
9. Staffi ng levels are growing rapidly.
10. The growth in the community clinics is occurring at the site level.
KEY FINDINGS
1For a complete description of the methodology used in this study, including the strengths and weaknesses of the OSHPD and IRS 990 data sources and the process used to gather a list of comprehensive primary care clinics, please see Appendix A.
2 | California Community Clinics – Financial Profi le, 2005 – 2008 Prepared by Capital Link
The key fi ndings of this study include:
1. Community clinics are an integral part of the California primary care and safety-net system, particularly for low-income, uninsured and underinsured individuals and families. California community clinics served at least 10% of the total population in California in 2008 and 44%3 of the individuals living at or below the federal poverty level. Approxi-mately 12% of the women and over 14% of the children in California used a community clinic in 2008. In 2008, community clinics served a broad range of individuals, including at least 16% of the Hispanic population in California.2
2. California community clinics continue to grow, most notably in terms of revenue, patient users, encounters and staff. In 2008, comprehensive primary care clinics reported a total of 3.6 million patients across the state, growing 9% over the 2005 utilization results. Patient visits increased 11% to nearly 11.8 million patient encounters in 2008.
3. The economic profi le of the community clinic patients is changing with the low-income population growing poorer. Nearly 2/3 of clinic patients in 2008 were under 100% of the Federal Poverty Level (FPL) and 83% of the clinic patient base was under 200% of the FPL. The portion of patients under 100% of poverty grew substantially faster than the other income groups, increasing from 62% in 2005 to 65% of total patients in 2008. This increase was offset by similar decrease in the portion
of patients over 200% of poverty patients. In 2008, the clinics served 44% of the state’s population under 100% of poverty and 24% of those under 200% of poverty. This trend indicates that community health centers are serving a greater number of the poorest patients in their communities.
4. The low-income and uninsured patients seen at California clinics are growing at a faster pace than similar population groups in the state at large. Between the years of 2005 and 2008, the state’s population living below 200% of poverty grew 6%, peaking at over 12.4 million people in 2008. Individuals living below 100% of poverty in the state grew at a much higher rate of 13% during the time period.3 At the same time, the number of patients under 200% of poverty served by community clinics grew 9%, totaling more than 3 million people, while patients living at below 100% of the FPL increased 15%. The uninsured population in California grew from 6.76 million people in 2005 to almost 6.82 million in 2008.4 Despite the nominal growth, the uninsured population served by clinics grew 27% over the time period from 929,000 uninsured patients in 2005 to 1,182,000 in 2008. By 2008, clinics served over 17% of the uninsured population in the state. Nevertheless, a very signifi cant proportion of the uninsured population is not served at a clinic. This lack of access may result in a high incidence of individuals seeking care in an emergency room for conditions that could have been treated more cost effectively in a clinic and reinforces clinics’ role as safety net providers in their communities.
2US Census, 2008 People Quick Facts.3Data Source: CA Population: Census, Current Population Survey, Annual Social and Economic Supplement4Data Source: http://www.census.gov/hhes/www/macro/032008/health/h05_000.htm — U.S. Census Bureau Current Population Survey, 2008
Prepared by Capital Link California Community Clinics – Financial Profi le, 2005 – 2008 | 3 Prepared by Capital Link California Community Clinics – Financial Profi le, 2005 – 2008 | 3
5. The California clinic system as a whole is still somewhat fi nancially vulnerable and continues to be highly stratifi ed in terms of fi nancial strength. While the data shows that approximately 25% of the clinics at any given time are in relatively healthy fi nancial shape, at least 25% of clinics continue to be in danger of fi nancial failure. At least 25% of all state clinics operated “in the red” on a bottom-line basis in any given year during the period and performed signifi cantly below their national peers. Because most clinics do not have signifi cant cash reserves, losing money for any signifi cant period of time can result in signifi cant fi nancial distress or failure. Although the remaining 50% of California clinics operating in the middle tiers are generally improving and appear to be consolidating their fi nancial position, they still remain vulnerable to fi nancial downturns due to tight margins and relatively low reserves.
6. Community clinics are very dependent on government payor sources, which in 2008 accounted for 89% of Net Patient Service Revenue (Medi-Cal, Medicare, and All Others), with Medi-Cal representing the majority of NPSR altogether. Given the low levels of cash reserves held by most clinics, the entire clinic sector can be placed in fi nancial jeopardy as a result of the budget cuts and reconciliation processes, affecting clinic services for California’s most vulnerable residents, clinic jobs and the stability of local economies.
7. Financial trends from 2005 – 2008 suggest that there has been some overall fi scal improvement in the operations of community clinics. Averages of Operating Margins, Days Cash on Hand, and Days in Accounts Receivables have shown small but improving trends for all the categories of community clinics. However, clinics in general continue to operate with positive but narrow margins. The median California clinic had an Operating Margin of slightly greater than 2.2% on average over the period. While at least in positive territory, the median Operating Margins are slim and limit the clinic’s capacity to build fi nancial reserves for economic downturns or to gener-ate resources for signifi cant capital investments.
8. The federal Health Center Growth Initiative, implemented during the Bush administration, signifi cantly increased the proportion of FQHC Section 330 clinics in the state. As such, FQHCs have increased their majority representation of total state-wide clinics, accounting for 68% of the clinic sites, 78% of the total encounters, and 81% of the overall revenue in 2008. While FQHC Section 330 clinics grew from 2005 to 2008, the other types of clinics in the state decreased, though some of this decrease was a result of conver-sion to FQHC status.
4 | California Community Clinics – Financial Profi le, 2005 – 2008 Prepared by Capital Link
9. Staffi ng levels are growing rapidly, particularly in the area of support staff. In 2008, the primary care clinics employed 3,627 primary care providers (PCPs) and reported nearly 17,400 full-time equivalent (FTE) staff positions. Though total patients and visits grew 9% and 11% respectively from 2005 to 2008, total Primary Care Provider FTEs rose 13% and total staff FTEs rose 31%. The growth in staffi ng highlights the importance of clinics as employers and economic forces in their communities.
10. The growth in the community clinics is occurring at the site level. As shown above, the number of comprehensive primary care clinic sites in the state grew over 4% to 719 from 2005–2008. On the other hand, the data set also shows that the number of patients and encounters served by these clinics grew signifi cantly faster at 9% and 11% respectively over the same time period. Similarly, the total number of full-time-equivalent employees working from these sites grew 25%. With patients, visits, and employees all growing faster than the number of sites, it can be inferred that the intensity of overall activity and service provision per site has increased.
Prepared by Capital Link California Community Clinics – Financial Profi le, 2005 – 2008 | 5 Prepared by Capital Link California Community Clinics – Financial Profi le, 2005 – 2008 | 5
GENERAL BACKGROUND
Description of Community Clinics
CALIFORNIA COMMUNITY CLINICS are non-profi t, tax-exempt clinics that offer comprehensive primary health care, dental care, mental
health, school-based health programs and other community-based health services to anyone in need regardless of their insurance status or ability to pay. For decades, community clinics have been a pillar of the California health care safety net, providing a source of quality primary care for the state’s low-income and most vulnerable communities.
Community clinics are mission-driven organizations created to help overcome systematic barriers to primary health care access including poverty, lack of health insurance, immigration status, ethnicity, language and culture, disability, homelessness, geographic isolation and other diverse needs. These barriers continue to exist despite expansions in publicly supported health insurance programs for uninsured popula-tions. Community clinics address access barriers through tailored programs and delivery systems that offer culturally and linguistically appropriate, high quality, primary and preventive health services.
Most community clinics provide a wide range of services beyond what might traditionally be considered health care. Typically, this
list includes translation, transportation, education, nutrition services, support groups, mental health services, access to health insurance coverage, and more. Often considered by their patients to be commu-nity centers as much as health clinics, these organizations have a long history of linking their patients with food, clothing, housing, and other resources and services they do not themselves provide.5
Clinics Included in this Study — OSHPD Reporting
Primary care clinics operated by non-profi t corporations are the only safety-net clinics required to be licensed by the California Department of Public Health, Licensing and Certifi cation Division. Community and Free primary care clinics are licensed under Section 1204(a) of the California Health & Safety Code and are required to report data on an annual basis to the California Offi ce of Statewide Health Planning and Development (OSHPD), which is a source of data for this study along with IRS 990 reports. Unless otherwise noted, all charts and data tables for California community clinics presented in this report are based on OSHPD data. Charts that are based on IRS 990 reports are specifi cally noted. National comparative fi nancial data is based on data from audited fi nancial statements.
5Schacht & Associates. “Promoting Health Justice: Opportunities for California Clinics and Regional Associations”, prepared for the California Primary Care Association, June 4, 2008.
2
DESCRIPTION OF CALIFORNIA COMMUNITY CLINICS
6 | California Community Clinics – Financial Profi le, 2005 – 2008 Prepared by Capital Link
Licensed primary care clinics include the following types of organizations:
Federally Qualifi ed Health Centers (FQHCs);•
FQHC Look-Alikes (FQHC LA);•
Free-standing nonprofi t Rural Health Clinics (RHCs) (although • there are for-profi t RHCs, they are not licensed by DPH and consequently do not report to OSHPD);
Indian Health Clinics licensed by DPH, some of which may be • FQHCs;
Free clinics; and•
Family planning clinics and other types of nonprofi t community • clinics serving specifi c populations, such as alcohol and drug treatment programs.
Clinic Types Excluded From This Study
Health care safety net clinics that are not licensed by DPH and therefore do not report to OSHPD and are not included in this study include the following types of organizations:
Private for-profi t clinics;•
Clinics operated by governmental entities such as counties or • cities;
County clinics that do not report to OSHPD, even though in • some instances they may be an FQHC;
Tribal clinics located on tribal lands; and •
Hospital owned and operated clinics.•
Although these clinics are not required to be licensed as primary care clinics, they represent an important part of the overall health care safety net in California.
DESCRIPTIONS OF CLINIC TYPESINCLUDED IN STUDY
Federally Qualifi ed Health Centers (FQHCs)
A signifi cant portion of the safety net providers in California are Federally Qualifi ed Health Centers (FQHCs). Sometimes called “community health centers,” FQHCs include not only community health centers, but also migrant health centers, health care for the homeless health centers, public housing health centers and in certain instances, centers that are affi liated with counties or hospital systems.
All FQHCs are nonprofi t, community-based organizations or public entities that provide comprehensive primary and preventive health care and related social services to medically underserved individuals and families regardless of their abilities to pay. FQHCs are governed by a community board of directors, at least 51% of whom must be users of the health center’s services. Most FQHCs operate independently (that is, not under a hospital’s license) and serve a variety of patients including children, families, the elderly, Medicaid and Medicare recipi-ents, low-income uninsured and underinsured individuals, high-risk populations, farm workers, and the homeless. FQHCs provide a wide range of cost-effective primary and preventive medical services as well as other services including mental health, dental, nutrition counseling, translation and community outreach. There are two sub-categories of FQHCs:
Section 330 health centers – Health centers are authorized under Section 330 of the U.S. Public Health Service Act, 42 USC, 254b. “Section 330s” receive a substantial annual operating grant from the federal Bureau of Primary Health Care (BPHC) to help cover the costs of providing care to those who cannot afford to pay. Until
Prepared by Capital Link California Community Clinics – Financial Profi le, 2005 – 2008 | 7 Prepared by Capital Link California Community Clinics – Financial Profi le, 2005 – 2008 | 7
recently, Section 330 included separate subcategories of funding for community and migrant health centers, health care for the homeless programs and public housing primary care programs. Currently, these subcategories of funding have been consolidated and are now known collectively as “Section 330 health centers.”
Look-Alike health centers – These health centers operate much like “330s” but do not receive an annual operating grant from the BPHC.
All FQHCs enjoy the benefi t of federally protected Medicaid and Medicare reimbursement through a Prospective Payment System (PPS), which is based on cost. 6 In return, FQHCs are required by the federal government to provide care on a sliding fee basis to all patients. Section 330 health centers receive additional benefi ts such as:
Annual operating grant from the BPHC;•
Eligibility for the BPHC’s Loan Guarantee Program;•
Access to discounted pharmaceuticals through the US Public • Health Service’s 340B Drug Pricing Program;
Free malpractice insurance through the Federal Tort Claims Act • (FTCA);
Free technical assistance and training on numerous health and • management issues; and
Free compliance surveys through the Joint Commission • (formerly known as the Joint Commission on Accreditation of Healthcare Organizations–JCAHO).
At the national level there are approximately 1,200 FQHCs providing care in over 7,500 service delivery sites in every state and territory. These health centers serve as the medical and health care home for 20 million people nationally, and 70% of health center patients have family incomes at or below poverty. Most of these patients have limited primary care options outside of a health center as 38% of health center patients are uninsured and another 36% depend on Medicaid. Additionally, about half of health center patients reside in rural areas, while the other half tend to live in economically depressed inner city communities.7
In 2002, President Bush announced a Health Center Growth Initiative to dramatically expand the number of community health centers—aiming to provide access to 1,200 new communities nation-wide and serve 15 million underserved individuals by 2008. California clinics were very successful in obtaining grants through the Presiden-tial Growth Initiative, which signifi cantly changed the landscape of community clinics in California. As discussed later in this report, the number of FQHCs signifi cantly increased during this period primarily through existing independent clinics converting to FQHC status. As a result, FQHCs are caring for an increasing portion of the California low-income and uninsured population.
As per federal reporting, there were 1138 California FQHCs in 2008 that received operating grants from the Section 330 program operated by the BPHC, the vast majority of which are also licensed by OSHPD
6The PPS establishes a minimum per visit payment rate under Medicaid for each FQHC for each fi scal year based on costs. PPS also provides for “wrap-around” payments to cover the difference between payment received by the FQHC for treating a managed care enrollee and the payment to which the FQHC is entitled under PPS.
7National Association of Community Health Centers. America’s Health Centers Fact Sheet, March 2009.8The 2008 total number of FQHCs in California based on OSHPD data varies from the BPHC total because a) some organizations on the BPHC list sub-contract with several other indepen-
dent clinics for specifi c services. Each of these clinics reports separately to OSHPD as an FQHC, thereby raising the total number in the state as compared to BPHC reporting. b) the county-owned FQHCs that report to BPHC are not required to report to OSHPD.
8 | California Community Clinics – Financial Profi le, 2005 – 2008 Prepared by Capital Link
as primary care clinics. FQHCs in California see a higher percentage of uninsured, low-income, and Medicaid patients than their national counterparts. In 2008, California FQHC clinics saw 2,521,822 patients, of which 44% were uninsured, 39% were covered by Medic-aid, and 76% had incomes of under 100% of poverty.9
Rural Health Centers (RHCs)
Rural Health Centers were created through the Rural Health Clinic Services Act of 1977 (Public Law 95-210), which was estab-lished to address the inadequate supply of physicians and other providers serving Medicare and Medicaid benefi ciaries in rural areas. An RHC is an outpatient facility that meets federal requirements designed to ensure the health and safety of patients. To qualify as a Rural Health Center, the clinic must be located in a rural area desig-nated by the Health Resources and Services Administration as having a shortage of personal health care services or primary care medical services (Medically Underserved Area (MUA) or Health Professional Shortage Area (HPSA)). RHCs may be for-profi t or nonprofi t.10 RHCs do not receive federal grant funds to support the cost of care to those who cannot afford to pay. However, like FQHCs, RHCs do receive federally-protected PPS Medi-Cal and Medicare reimburse-ment, which is based on cost.
Indian Health Service Clinics
An agency within the US Department of Health and Human Services, the Indian Health Service (IHS) operates a health care system for American and Alaskan Natives, which includes health clinics. IHS clinics receive Medicaid and Medicare reimbursement through an “all inclusive rate” negotiated with the Centers for Medicare and Medicaid services. In addition, federally-recognized tribes can also establish and operate health clinics on their own or through the IHS system. The Urban Indian Health Program (UIHP) provides outpatient services to Native Americans living in urban areas. All UIHP facilities are automatically qualifi ed to receive FQHC designation. Other programs and facilities operated by federally-recognized tribes may apply for designation as an FQHC or RHC and if approved, receive reimburse-ment through FQHC or RHC guidelines rather than the IHS negotiated rates.11 Tribal clinics that are not located on tribal lands are licensed by OSHPD and are included in this study.
Free Clinics
“Free clinic” is specifi cally defi ned in California statute as “a clinic operated by a tax-exempt, nonprofi t organization supported in whole or part by voluntary donations, gifts, grants, or government funds or contributions.” Free clinics rely on volunteer providers to deliver care services and on private donations to support clinic operations.12
9Health Resources and Services Administration. Uniform Data System (UDS) California Roll-up Report, 200810Only nonprofi t RHCs are licensed by DPH and consequently are required to report to OSHPD. 11California HealthCare Foundation. “California’s Safety-Net Clinics: A Primer”, November 2005, p.15.12Ibid, p. 17.
Prepared by Capital Link California Community Clinics – Financial Profi le, 2005 – 2008 | 9 Prepared by Capital Link California Community Clinics – Financial Profi le, 2005 – 2008 | 9
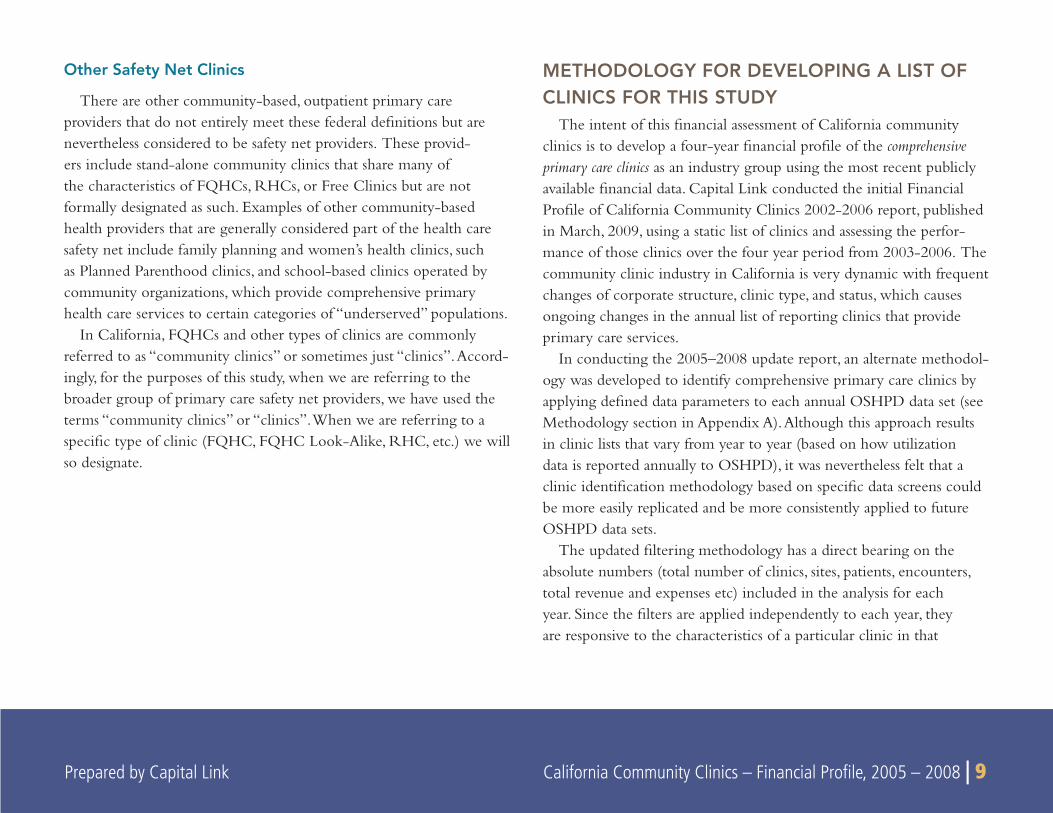
Other Safety Net Clinics
There are other community-based, outpatient primary care providers that do not entirely meet these federal defi nitions but are nevertheless considered to be safety net providers. These provid-ers include stand-alone community clinics that share many of the characteristics of FQHCs, RHCs, or Free Clinics but are not formally designated as such. Examples of other community-based health providers that are generally considered part of the health care safety net include family planning and women’s health clinics, such as Planned Parenthood clinics, and school-based clinics operated by community organizations, which provide comprehensive primary health care services to certain categories of “underserved” populations.
In California, FQHCs and other types of clinics are commonly referred to as “community clinics” or sometimes just “clinics”. Accord-ingly, for the purposes of this study, when we are referring to the broader group of primary care safety net providers, we have used the terms “community clinics” or “clinics”. When we are referring to a specifi c type of clinic (FQHC, FQHC Look-Alike, RHC, etc.) we will so designate.
METHODOLOGY FOR DEVELOPING A LIST OF CLINICS FOR THIS STUDY
The intent of this fi nancial assessment of California community clinics is to develop a four-year fi nancial profi le of the comprehensive primary care clinics as an industry group using the most recent publicly available fi nancial data. Capital Link conducted the initial Financial Profi le of California Community Clinics 2002-2006 report, published in March, 2009, using a static list of clinics and assessing the perfor-mance of those clinics over the four year period from 2003-2006. The community clinic industry in California is very dynamic with frequent changes of corporate structure, clinic type, and status, which causes ongoing changes in the annual list of reporting clinics that provide primary care services.
In conducting the 2005–2008 update report, an alternate methodol-ogy was developed to identify comprehensive primary care clinics by applying defi ned data parameters to each annual OSHPD data set (see Methodology section in Appendix A). Although this approach results in clinic lists that vary from year to year (based on how utilization data is reported annually to OSHPD), it was nevertheless felt that a clinic identifi cation methodology based on specifi c data screens could be more easily replicated and be more consistently applied to future OSHPD data sets.
The updated fi ltering methodology has a direct bearing on the absolute numbers (total number of clinics, sites, patients, encounters, total revenue and expenses etc) included in the analysis for each year. Since the fi lters are applied independently to each year, they are responsive to the characteristics of a particular clinic in that
10 | California Community Clinics – Financial Profi le, 2005 – 2008 Prepared by Capital Link
year, as opposed to only the most recent year (2006 for the original study). The fi lters are very sensitive to the way organizations are reporting to OSHPD, particularly in relation to the type of visit.
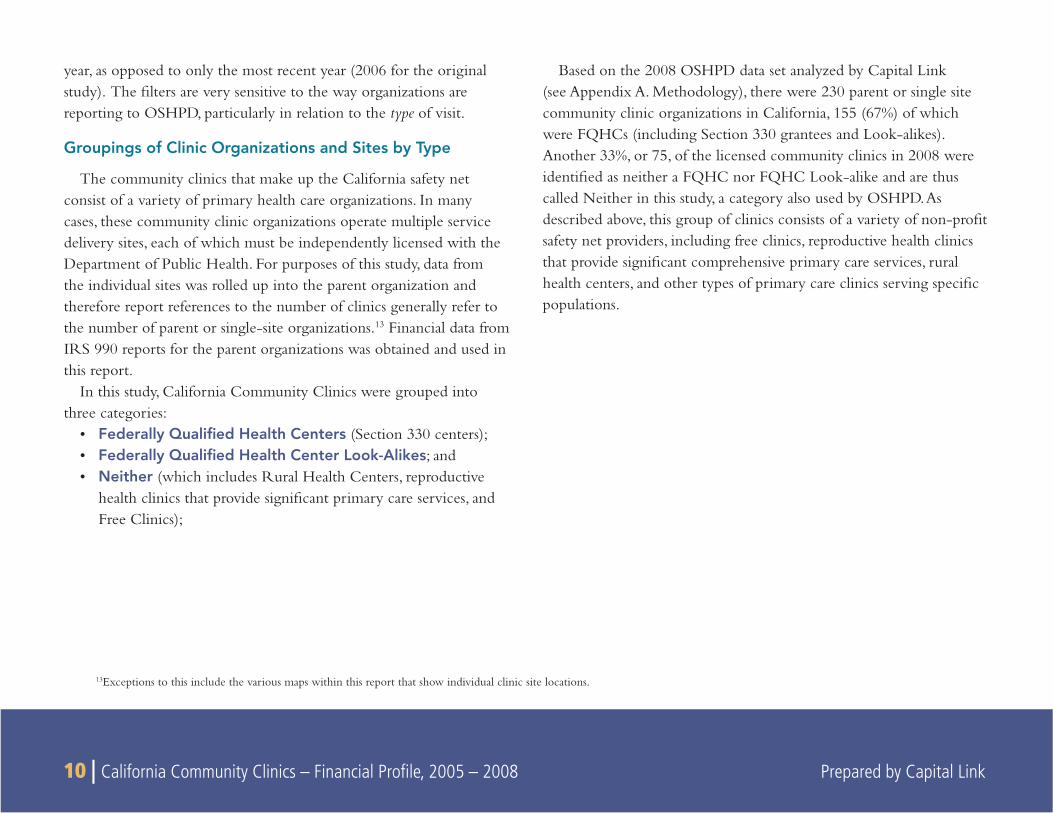
Groupings of Clinic Organizations and Sites by Type
The community clinics that make up the California safety net consist of a variety of primary health care organizations. In many cases, these community clinic organizations operate multiple service delivery sites, each of which must be independently licensed with the Department of Public Health. For purposes of this study, data from the individual sites was rolled up into the parent organization and therefore report references to the number of clinics generally refer to the number of parent or single-site organizations.13 Financial data from IRS 990 reports for the parent organizations was obtained and used in this report.
In this study, California Community Clinics were grouped into three categories:
Federally Qualifi ed Health Centers• (Section 330 centers);Federally Qualifi ed Health Center Look-Alikes• ; andNeither• (which includes Rural Health Centers, reproductive health clinics that provide signifi cant primary care services, and Free Clinics);
Based on the 2008 OSHPD data set analyzed by Capital Link (see Appendix A. Methodology), there were 230 parent or single site community clinic organizations in California, 155 (67%) of which were FQHCs (including Section 330 grantees and Look-alikes). Another 33%, or 75, of the licensed community clinics in 2008 were identifi ed as neither a FQHC nor FQHC Look-alike and are thus called Neither in this study, a category also used by OSHPD. As described above, this group of clinics consists of a variety of non-profi t safety net providers, including free clinics, reproductive health clinics that provide signifi cant comprehensive primary care services, rural health centers, and other types of primary care clinics serving specifi c populations.
13Exceptions to this include the various maps within this report that show individual clinic site locations.
Prepared by Capital Link California Community Clinics – Financial Profi le, 2005 – 2008 | 11
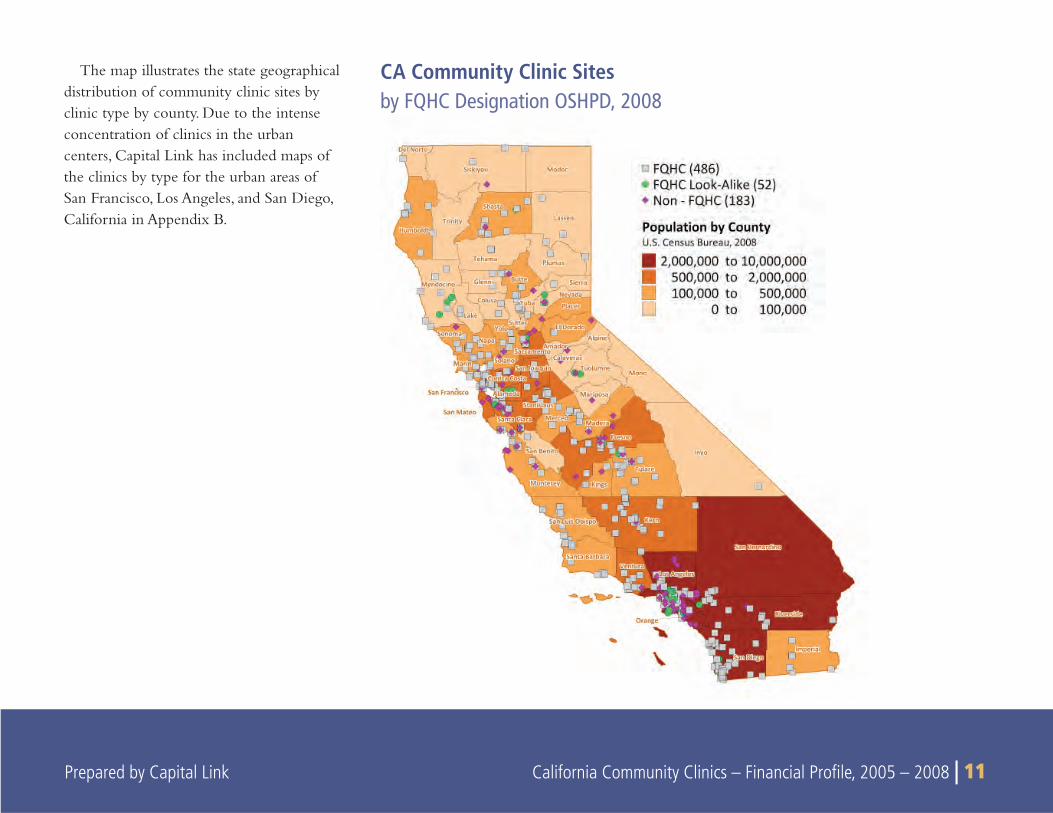
CA Community Clinic Sites by FQHC Designation OSHPD, 2008
The map illustrates the state geographical distribution of community clinic sites by clinic type by county. Due to the intense concentration of clinics in the urban centers, Capital Link has included maps of the clinics by type for the urban areas of San Francisco, Los Angeles, and San Diego, California in Appendix B.
12 | California Community Clinics – Financial Profi le, 2005 – 2008 Prepared by Capital Link
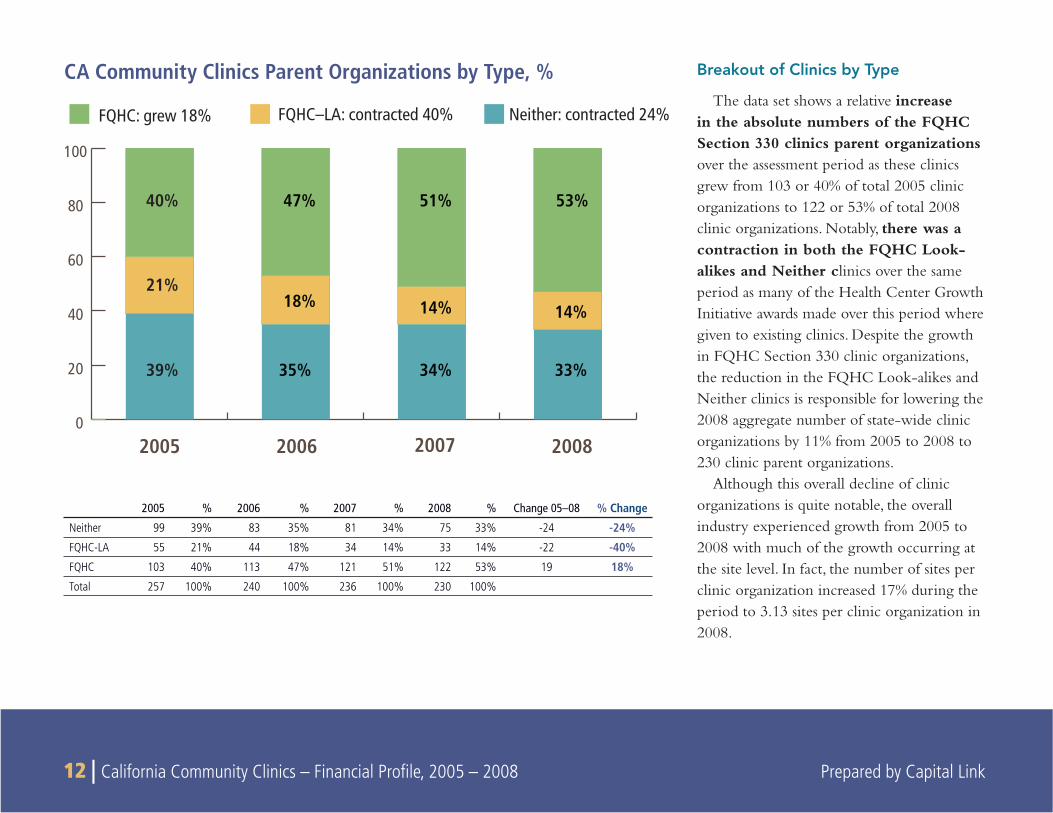
Breakout of Clinics by Type
The data set shows a relative increase in the absolute numbers of the FQHC Section 330 clinics parent organizations over the assessment period as these clinics grew from 103 or 40% of total 2005 clinic organizations to 122 or 53% of total 2008 clinic organizations. Notably, there was a contraction in both the FQHC Look-alikes and Neither clinics over the same period as many of the Health Center Growth Initiative awards made over this period where given to existing clinics. Despite the growth in FQHC Section 330 clinic organizations, the reduction in the FQHC Look-alikes and Neither clinics is responsible for lowering the 2008 aggregate number of state-wide clinic organizations by 11% from 2005 to 2008 to 230 clinic parent organizations.
Although this overall decline of clinic organizations is quite notable, the overall industry experienced growth from 2005 to 2008 with much of the growth occurring at the site level. In fact, the number of sites per clinic organization increased 17% during the period to 3.13 sites per clinic organization in 2008.
CA Community Clinics Parent Organizations by Type, %
2005 2006 2007 2008
FQHC–LA: contracted 40% Neither: contracted 24%
0
20
40
60
80
100
21%
47%
18%
35%
51%
14%
34%
53%
14%
33%
40%
39%
FQHC: grew 18%
2005 % 2006 % 2007 % 2008 % Change 05–08 % Change
Neither 99 39% 83 35% 81 34% 75 33% -24 -24%
FQHC-LA 55 21% 44 18% 34 14% 33 14% -22 -40%
FQHC 103 40% 113 47% 121 51% 122 53% 19 18%
Total 257 100% 240 100% 236 100% 230 100%
Prepared by Capital Link California Community Clinics – Financial Profi le, 2005 – 2008 | 13 Prepared by Capital Link California Community Clinics – Financial Profi le, 2005 – 2008 | 13
The decline in clinic organizations may be due to several factors such as:
The nature of awards provided under the Health Center • Growth Initiative that expanded the FQHC Section 330 program encouraged growth in the industry through exist-ing FQHCs. This may have prompted independent clinics to come under the corporate umbrella of existing FQHCs to take advantage of the funding opportunity.
There may have been consolidation in the community clinic • industry.
Some clinics may have gone out of business during the time • period.
The decrease in organizations is at least partially attributed to the • variability in the way that clinics report utilization data. Given the numerous PCT codes used for tracking patient visits, clinics reported patient visits differently from year to year, causing some clinics to be included in the data set in one year but excluded in the next. While the number of clinic organizations analyzed in this report decreases, it should not be inferred that the number of overall community clinics has declined. In fact, the number of total licensed clinics as reported in the unfi ltered (raw) OSHPD data has remained relatively constant.
14 | California Community Clinics – Financial Profi le, 2005 – 2008 Prepared by Capital Link
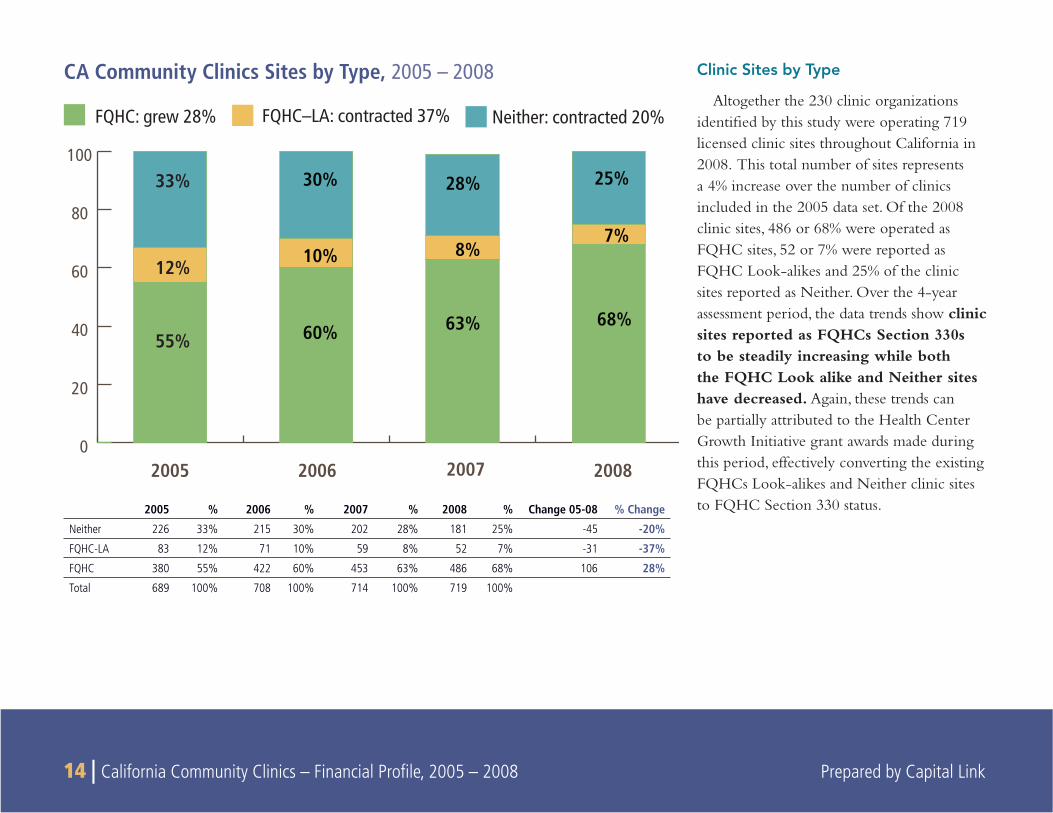
Clinic Sites by Type
Altogether the 230 clinic organizations identifi ed by this study were operating 719 licensed clinic sites throughout California in 2008. This total number of sites represents a 4% increase over the number of clinics included in the 2005 data set. Of the 2008 clinic sites, 486 or 68% were operated as FQHC sites, 52 or 7% were reported as FQHC Look-alikes and 25% of the clinic sites reported as Neither. Over the 4-year assessment period, the data trends show clinic sites reported as FQHCs Section 330s to be steadily increasing while both the FQHC Look alike and Neither sites have decreased. Again, these trends can be partially attributed to the Health Center Growth Initiative grant awards made during this period, effectively converting the existing FQHCs Look-alikes and Neither clinic sites to FQHC Section 330 status.
CA Community Clinics Sites by Type, 2005 – 2008
2005 2006 2007 2008
FQHC–LA: contracted 37% Neither: contracted 20%
0
20
40
60
80
100
12%
60%
10%
30%
63%
8%
28%
68%
7%
25%
55%
33%
FQHC: grew 28%
2005 % 2006 % 2007 % 2008 % Change 05-08 % Change
Neither 226 33% 215 30% 202 28% 181 25% -45 -20%
FQHC-LA 83 12% 71 10% 59 8% 52 7% -31 -37%
FQHC 380 55% 422 60% 453 63% 486 68% 106 28%
Total 689 100% 708 100% 714 100% 719 100%
Prepared by Capital Link California Community Clinics – Financial Profi le, 2005 – 2008 | 15
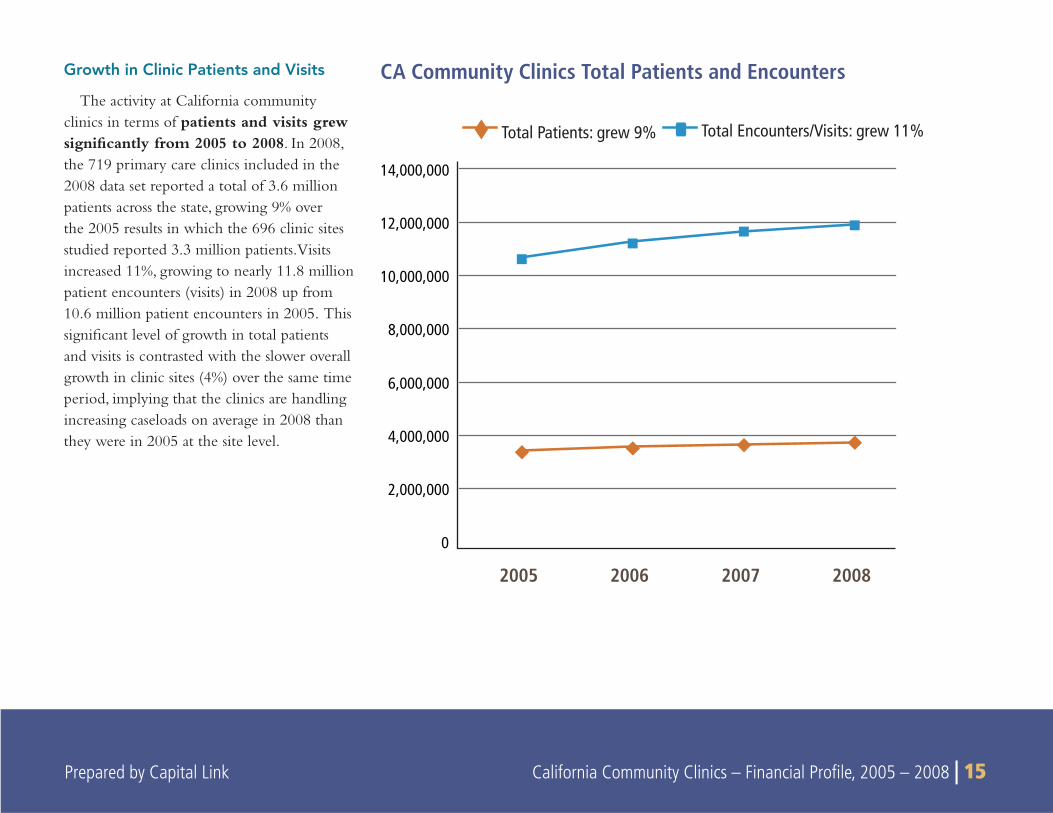
Growth in Clinic Patients and Visits
The activity at California community clinics in terms of patients and visits grew signifi cantly from 2005 to 2008. In 2008, the 719 primary care clinics included in the 2008 data set reported a total of 3.6 million patients across the state, growing 9% over the 2005 results in which the 696 clinic sites studied reported 3.3 million patients. Visits increased 11%, growing to nearly 11.8 million patient encounters (visits) in 2008 up from 10.6 million patient encounters in 2005. This signifi cant level of growth in total patients and visits is contrasted with the slower overall growth in clinic sites (4%) over the same time period, implying that the clinics are handling increasing caseloads on average in 2008 than they were in 2005 at the site level.
CA Community Clinics Total Patients and Encounters
0
2,000,000
4,000,000
6,000,000
8,000,000
10,000,000
12,000,000
14,000,000
2005 2006 2007 2008
Total Patients: grew 9% Total Encounters/Visits: grew 11%
16 | California Community Clinics – Financial Profile, 2005 – 2008 Prepared by Capital Link
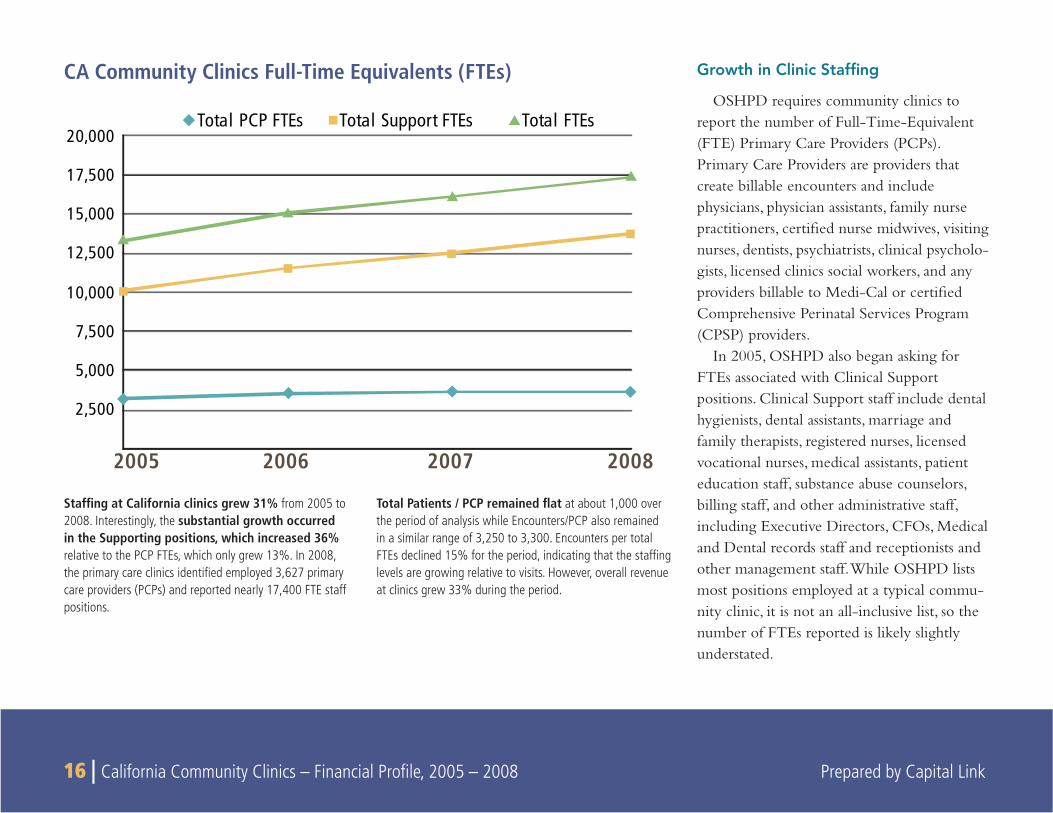
Growth in Clinic Staffing
OSHPD requires community clinics to report the number of Full-Time-Equivalent (FTE) Primary Care Providers (PCPs). Primary Care Providers are providers that create billable encounters and include physicians, physician assistants, family nurse practitioners, certified nurse midwives, visiting nurses, dentists, psychiatrists, clinical psycholo-gists, licensed clinics social workers, and any providers billable to Medi-Cal or certified Comprehensive Perinatal Services Program (CPSP) providers.
In 2005, OSHPD also began asking for FTEs associated with Clinical Support positions. Clinical Support staff include dental hygienists, dental assistants, marriage and family therapists, registered nurses, licensed vocational nurses, medical assistants, patient education staff, substance abuse counselors, billing staff, and other administrative staff, including Executive Directors, CFOs, Medical and Dental records staff and receptionists and other management staff. While OSHPD lists most positions employed at a typical commu-nity clinic, it is not an all-inclusive list, so the number of FTEs reported is likely slightly understated.
CA Community Clinics Full-Time Equivalents (FTEs)
Staffing at California clinics grew 31% from 2005 to 2008. Interestingly, the substantial growth occurred in the Supporting positions, which increased 36% relative to the PCP FTEs, which only grew 13%. In 2008, the primary care clinics identified employed 3,627 primary care providers (PCPs) and reported nearly 17,400 FTE staff positions.
Total Patients / PCP remained flat at about 1,000 over the period of analysis while Encounters/PCP also remained in a similar range of 3,250 to 3,300. Encounters per total FTEs declined 15% for the period, indicating that the staffing levels are growing relative to visits. However, overall revenue at clinics grew 33% during the period.
2005 2006 2007 2008
2,500
5,000
7,500
10,000
12,500
15,000
17,500
20,000 Total PCP FTEs Total Support FTEs Total FTEs
Prepared by Capital Link California Community Clinics – Financial Profile, 2005 – 2008 | 17
Growth in the California Clinic Industry
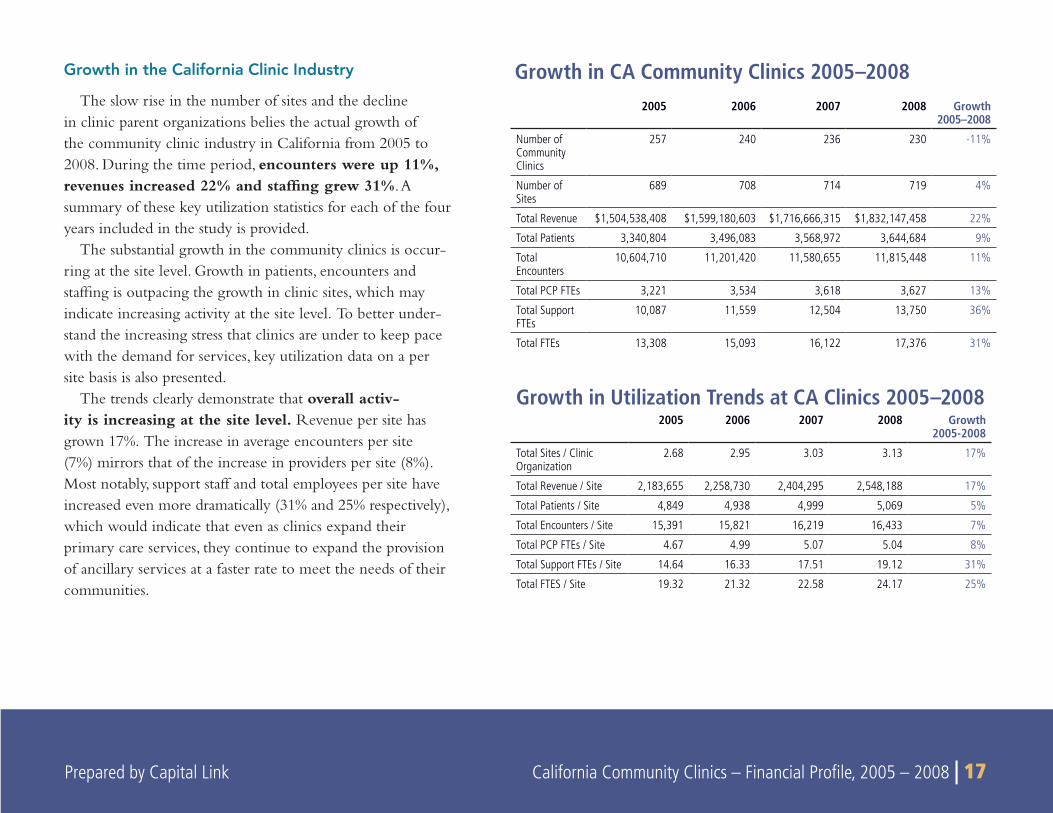
The slow rise in the number of sites and the decline in clinic parent organizations belies the actual growth of the community clinic industry in California from 2005 to 2008. During the time period, encounters were up 11%, revenues increased 22% and staffing grew 31%. A summary of these key utilization statistics for each of the four years included in the study is provided.
The substantial growth in the community clinics is occur-ring at the site level. Growth in patients, encounters and staffing is outpacing the growth in clinic sites, which may indicate increasing activity at the site level. To better under-stand the increasing stress that clinics are under to keep pace with the demand for services, key utilization data on a per site basis is also presented.
The trends clearly demonstrate that overall activ-ity is increasing at the site level. Revenue per site has grown 17%. The increase in average encounters per site (7%) mirrors that of the increase in providers per site (8%). Most notably, support staff and total employees per site have increased even more dramatically (31% and 25% respectively), which would indicate that even as clinics expand their primary care services, they continue to expand the provision of ancillary services at a faster rate to meet the needs of their communities.
2005 2006 2007 2008 Growth 2005–2008
Number of Community Clinics
257 240 236 230 -11%
Number of Sites
689 708 714 719 4%
Total Revenue $1,504,538,408 $1,599,180,603 $1,716,666,315 $1,832,147,458 22%
Total Patients 3,340,804 3,496,083 3,568,972 3,644,684 9%
Total Encounters
10,604,710 11,201,420 11,580,655 11,815,448 11%
Total PCP FTEs 3,221 3,534 3,618 3,627 13%
Total Support FTEs
10,087 11,559 12,504 13,750 36%
Total FTEs 13,308 15,093 16,122 17,376 31%
Growth in Utilization Trends at CA Clinics 2005–20082005 2006 2007 2008 Growth
2005-2008
Total Sites / Clinic Organization
2.68 2.95 3.03 3.13 17%
Total Revenue / Site 2,183,655 2,258,730 2,404,295 2,548,188 17%
Total Patients / Site 4,849 4,938 4,999 5,069 5%
Total Encounters / Site 15,391 15,821 16,219 16,433 7%
Total PCP FTEs / Site 4.67 4.99 5.07 5.04 8%
Total Support FTEs / Site 14.64 16.33 17.51 19.12 31%
Total FTES / Site 19.32 21.32 22.58 24.17 25%
Growth in CA Community Clinics 2005–2008
18 | California Community Clinics – Financial Profi le, 2005 – 2008 Prepared by Capital Link
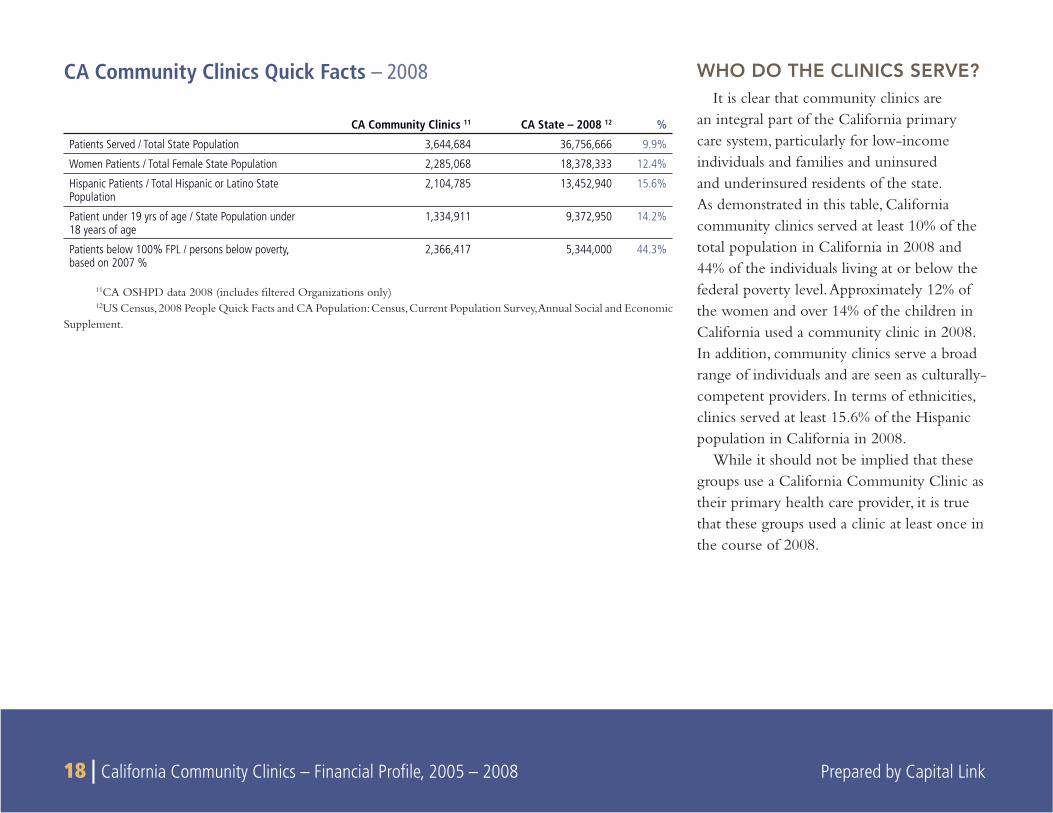
WHO DO THE CLINICS SERVE?It is clear that community clinics are
an integral part of the California primary care system, particularly for low-income individuals and families and uninsured and underinsured residents of the state. As demonstrated in this table, California community clinics served at least 10% of the total population in California in 2008 and 44% of the individuals living at or below the federal poverty level. Approximately 12% of the women and over 14% of the children in California used a community clinic in 2008. In addition, community clinics serve a broad range of individuals and are seen as culturally-competent providers. In terms of ethnicities, clinics served at least 15.6% of the Hispanic population in California in 2008.
While it should not be implied that these groups use a California Community Clinic as their primary health care provider, it is true that these groups used a clinic at least once in the course of 2008.
CA Community Clinics Quick Facts – 2008
CA Community Clinics 11 CA State – 2008 12 %
Patients Served / Total State Population 3,644,684 36,756,666 9.9%
Women Patients / Total Female State Population 2,285,068 18,378,333 12.4%
Hispanic Patients / Total Hispanic or Latino State Population
2,104,785 13,452,940 15.6%
Patient under 19 yrs of age / State Population under 18 years of age
1,334,911 9,372,950 14.2%
Patients below 100% FPL / persons below poverty, based on 2007 %
2,366,417 5,344,000 44.3%
11CA OSHPD data 2008 (includes fi ltered Organizations only)12US Census, 2008 People Quick Facts and CA Population: Census, Current Population Survey, Annual Social and Economic
Supplement.
Prepared by Capital Link California Community Clinics – Financial Profi le, 2005 – 2008 | 19
2005 2006 2007 2008
100 – 200% FPLUnder 100% FPL
0
20
40
60
80
10010%7%
21%
62%
11%6%
20%
63%
12%6%
20%
63%
11%5%
18%
65%
Above 200% FPL Unknown
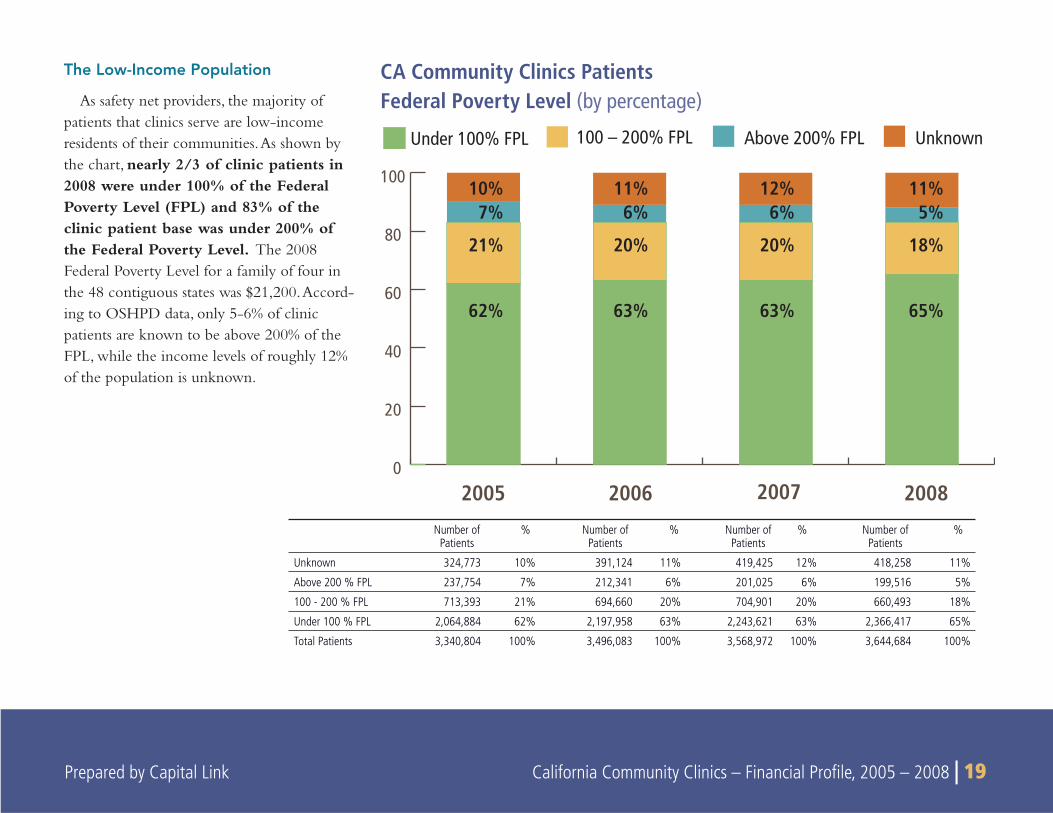
CA Community Clinics Patients Federal Poverty Level (by percentage)
The Low-Income Population
As safety net providers, the majority of patients that clinics serve are low-income residents of their communities. As shown by the chart, nearly 2/3 of clinic patients in 2008 were under 100% of the Federal Poverty Level (FPL) and 83% of the clinic patient base was under 200% of the Federal Poverty Level. The 2008 Federal Poverty Level for a family of four in the 48 contiguous states was $21,200. Accord-ing to OSHPD data, only 5-6% of clinic patients are known to be above 200% of the FPL, while the income levels of roughly 12% of the population is unknown.
Number of Patients
% Number of Patients
% Number of Patients
% Number of Patients
%
Unknown 324,773 10% 391,124 11% 419,425 12% 418,258 11%
Above 200 % FPL 237,754 7% 212,341 6% 201,025 6% 199,516 5%
100 - 200 % FPL 713,393 21% 694,660 20% 704,901 20% 660,493 18%
Under 100 % FPL 2,064,884 62% 2,197,958 63% 2,243,621 63% 2,366,417 65%
Total Patients 3,340,804 100% 3,496,083 100% 3,568,972 100% 3,644,684 100%
20 | California Community Clinics – Financial Profi le, 2005 – 2008 Prepared by Capital Link
2005 2006 2007 20080
500,000
1,000,000
1,500,000
2,000,000
2,500,000Under 100% FPL 100 – 200% FPL Above 200% FPL Unknown
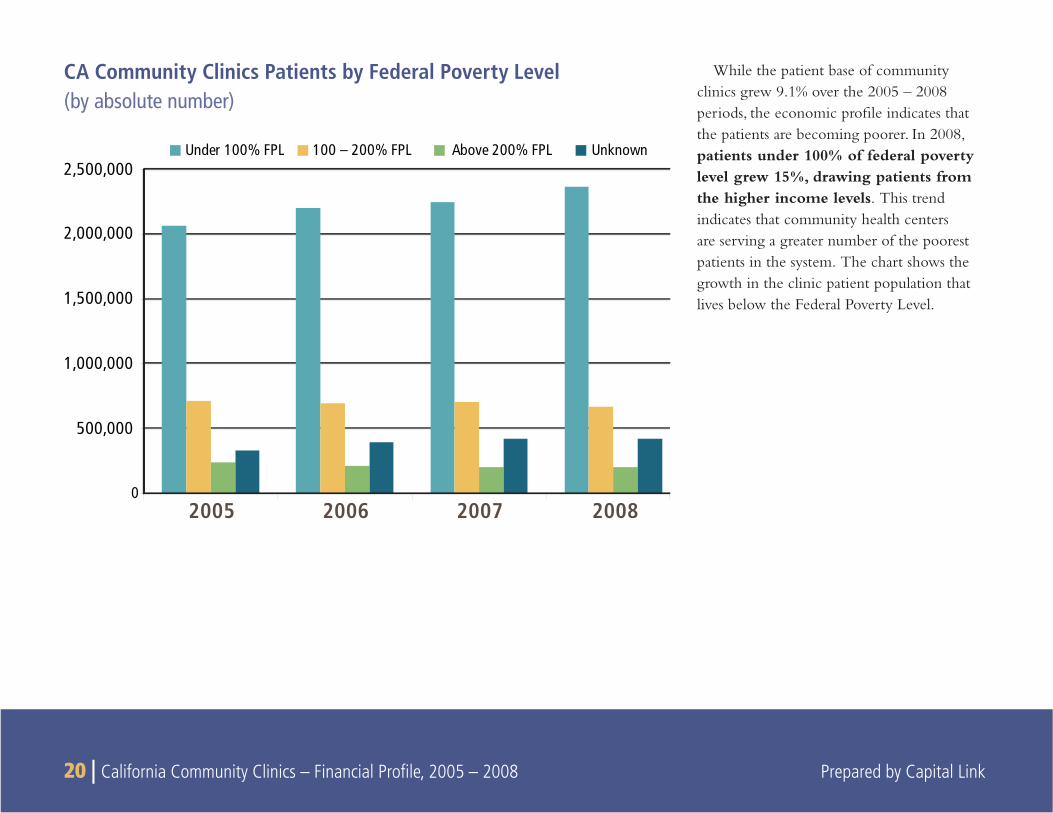
While the patient base of community clinics grew 9.1% over the 2005 – 2008 periods, the economic profi le indicates that the patients are becoming poorer. In 2008, patients under 100% of federal poverty level grew 15%, drawing patients from the higher income levels. This trend indicates that community health centers are serving a greater number of the poorest patients in the system. The chart shows the growth in the clinic patient population that lives below the Federal Poverty Level.
CA Community Clinics Patients by Federal Poverty Level (by absolute number)
Prepared by Capital Link California Community Clinics – Financial Profi le, 2005 – 2008 | 21
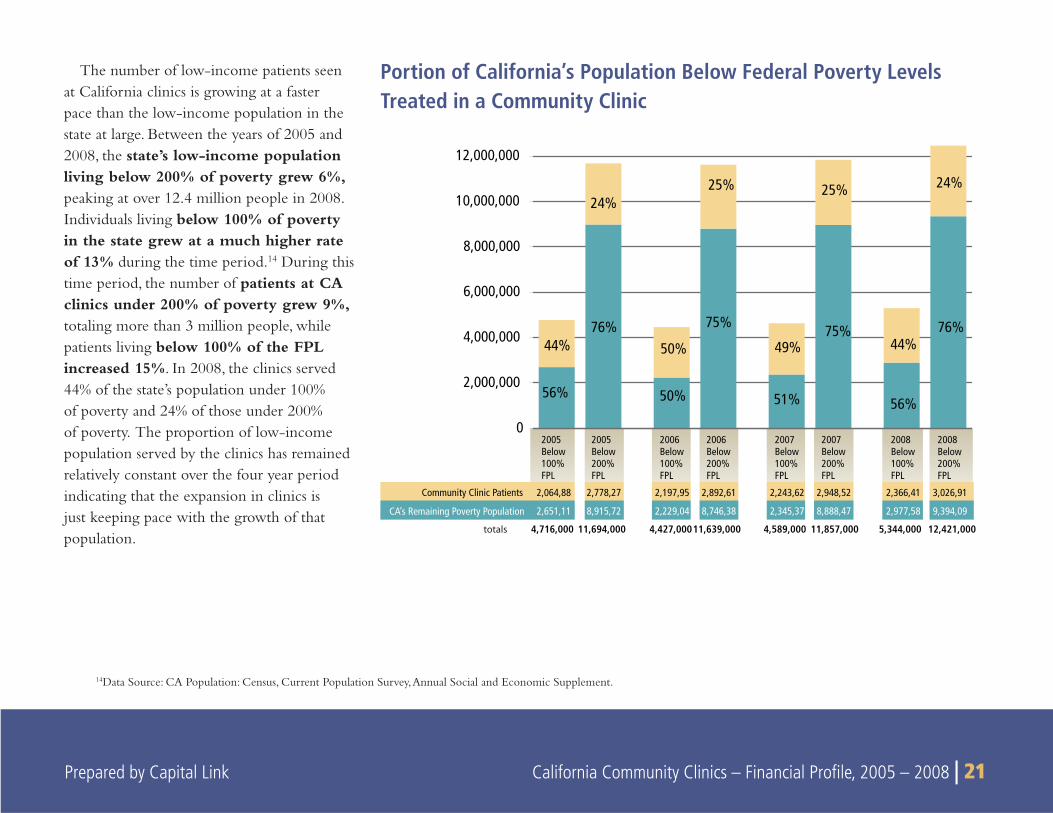
The number of low-income patients seen at California clinics is growing at a faster pace than the low-income population in the state at large. Between the years of 2005 and 2008, the state’s low-income population living below 200% of poverty grew 6%, peaking at over 12.4 million people in 2008. Individuals living below 100% of poverty in the state grew at a much higher rate of 13% during the time period.14 During this time period, the number of patients at CA clinics under 200% of poverty grew 9%, totaling more than 3 million people, while patients living below 100% of the FPL increased 15%. In 2008, the clinics served 44% of the state’s population under 100% of poverty and 24% of those under 200% of poverty. The proportion of low-income population served by the clinics has remained relatively constant over the four year period indicating that the expansion in clinics is just keeping pace with the growth of that population.
Portion of California’s Population Below Federal Poverty Levels Treated in a Community Clinic
14Data Source: CA Population: Census, Current Population Survey, Annual Social and Economic Supplement.
24%
44%
25%
49%
25%
50%
24%
44%
12,421,0005,344,00011,857,0004,589,00011,639,0004,427,00011,694,0004,716,000
0
2,000,000
4,000,000
6,000,000
8,000,000
10,000,000
12,000,000
Community Clinic Patients 2,064,88 2,778,27 2,197,95 2,892,61 2,243,62 2,948,52 2,366,41 3,026,91
CA’s Remaining Poverty Population 2,651,11 8,915,72 2,229,04 8,746,38 2,345,37 8,888,47 2,977,58 9,394,09
2005Below100%FPL
2005Below200%FPL
2006Below100%FPL
2006Below200%FPL
2007Below100%FPL
2007Below200%FPL
2008Below100%FPL
2008Below200%FPL
56%
76%
50%
75%
51%
75% 76%
56%
totals
22 | California Community Clinics – Financial Profi le, 2005 – 2008 Prepared by Capital Link
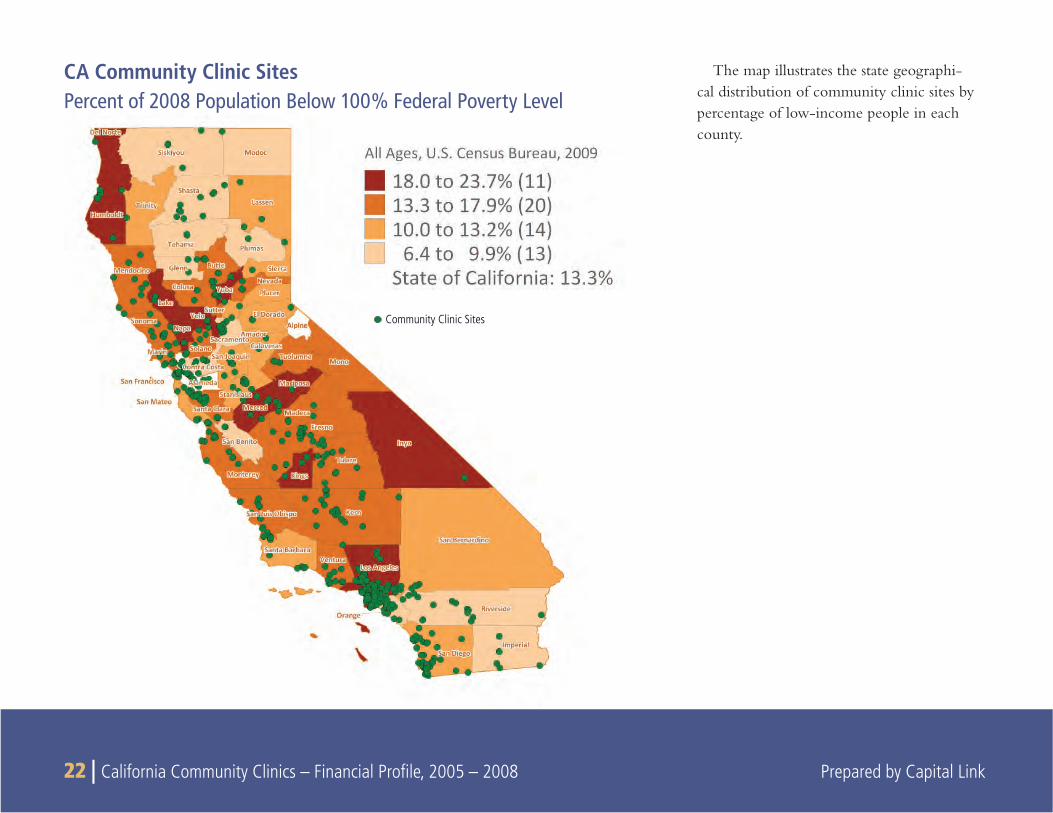
The map illustrates the state geographi-cal distribution of community clinic sites by percentage of low-income people in each county.
CA Community Clinic SitesPercent of 2008 Population Below 100% Federal Poverty Level
Community Clinic Sites
Prepared by Capital Link California Community Clinics – Financial Profi le, 2005 – 2008 | 23
2005 2006 2007 20080
500,000
1,000,000
1,500,000
2,000,000
2,500,000
3,000,000
3,500,000
4,000,000
4,500,000
5,000,000
5,500,000
6,000,000
6,500,000
7,000,000
14% 14% 14% 17%
86% 86%86% 83%
California’s Remaining Uninsured
-
Community Clinic’s Self-Pay/Sliding Fee/Free Care Patients
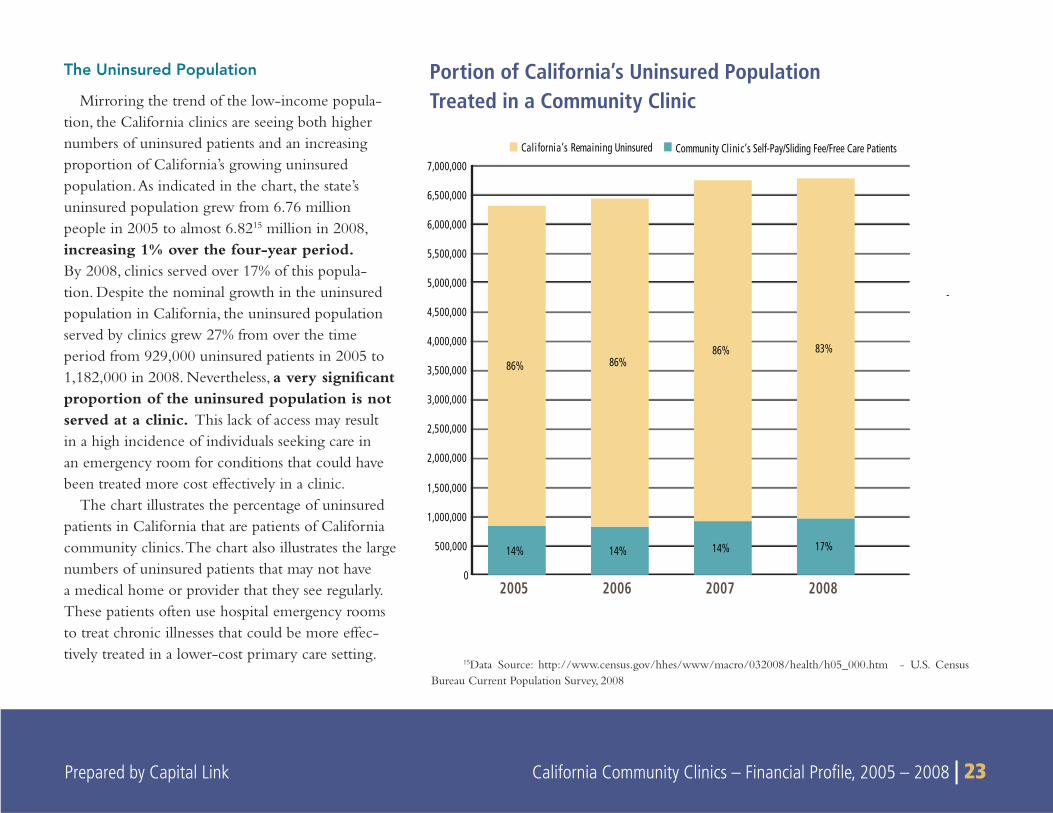
Portion of California’s Uninsured Population Treated in a Community Clinic
The Uninsured Population
Mirroring the trend of the low-income popula-tion, the California clinics are seeing both higher numbers of uninsured patients and an increasing proportion of California’s growing uninsured population. As indicated in the chart, the state’s uninsured population grew from 6.76 million people in 2005 to almost 6.8215 million in 2008, increasing 1% over the four-year period. By 2008, clinics served over 17% of this popula-tion. Despite the nominal growth in the uninsured population in California, the uninsured population served by clinics grew 27% from over the time period from 929,000 uninsured patients in 2005 to 1,182,000 in 2008. Nevertheless, a very signifi cant proportion of the uninsured population is not served at a clinic. This lack of access may result in a high incidence of individuals seeking care in an emergency room for conditions that could have been treated more cost effectively in a clinic.
The chart illustrates the percentage of uninsured patients in California that are patients of California community clinics. The chart also illustrates the large numbers of uninsured patients that may not have a medical home or provider that they see regularly. These patients often use hospital emergency rooms to treat chronic illnesses that could be more effec-tively treated in a lower-cost primary care setting.
15Data Source: http://www.census.gov/hhes/www/macro/032008/health/h05_000.htm - U.S. Census Bureau Current Population Survey, 2008
24 | California Community Clinics – Financial Profi le, 2005 – 2008 Prepared by Capital Link
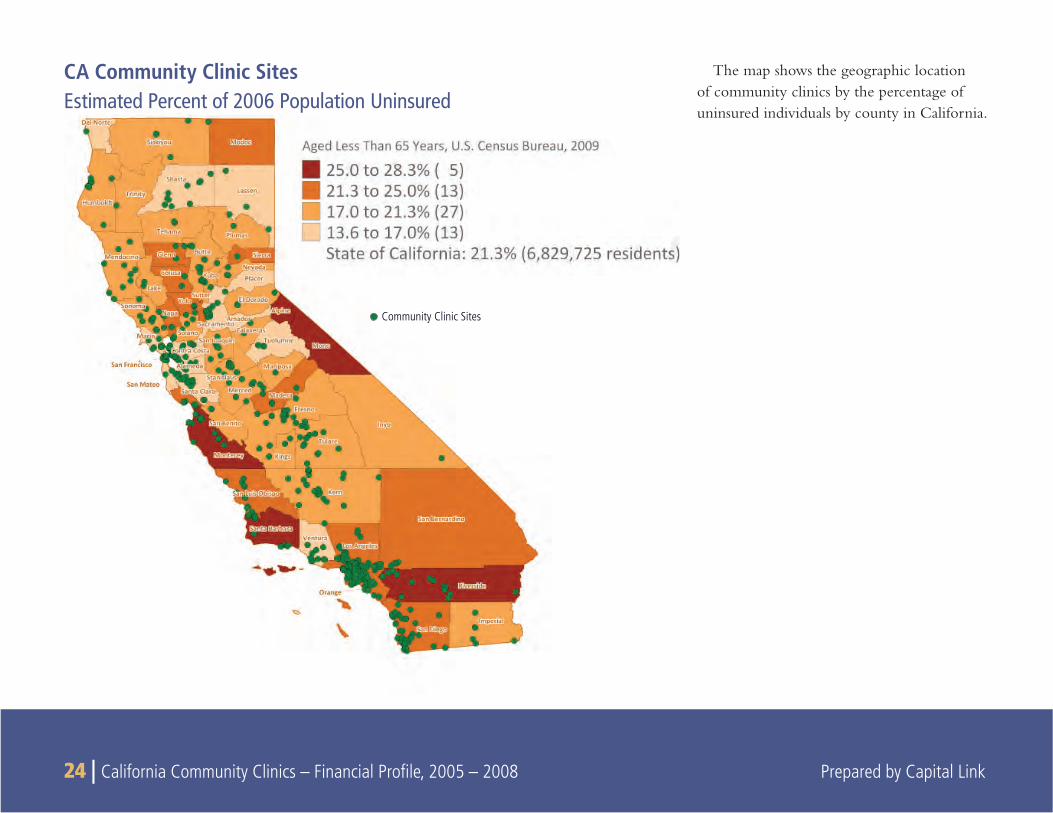
The map shows the geographic location of community clinics by the percentage of uninsured individuals by county in California.
CA Community Clinic SitesEstimated Percent of 2006 Population Uninsured
Community Clinic Sites
Prepared by Capital Link California Community Clinics – Financial Profi le, 2005 – 2008 | 25
California’s Community Clinics Patient RacePercent of Uninsured
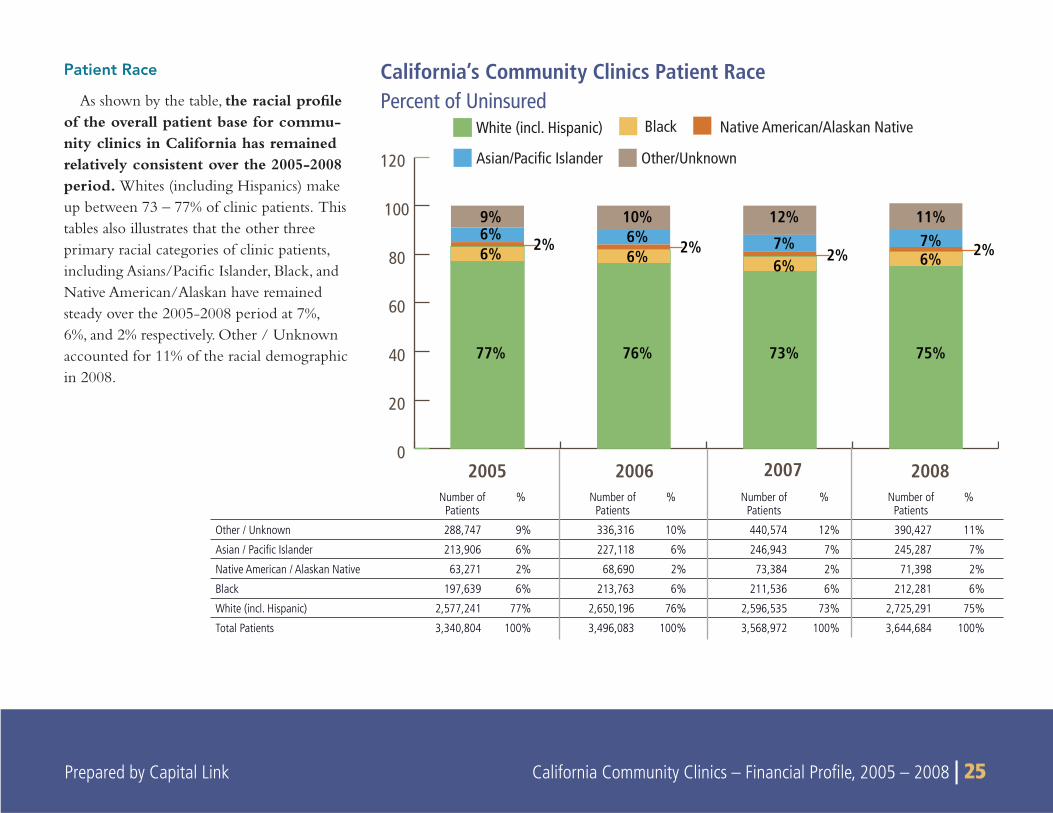
Patient Race
As shown by the table, the racial profi le of the overall patient base for commu-nity clinics in California has remained relatively consistent over the 2005-2008 period. Whites (including Hispanics) make up between 73 – 77% of clinic patients. This tables also illustrates that the other three primary racial categories of clinic patients, including Asians/Pacifi c Islander, Black, and Native American/Alaskan have remained steady over the 2005-2008 period at 7%, 6%, and 2% respectively. Other / Unknown accounted for 11% of the racial demographic in 2008.
2005 2006 2007 2008
BlackWhite (incl. Hispanic)
Asian/Pacific Islander Other/Unknown
0
20
40
60
80
100
120
9%6%6%
77%
2%
Native American/Alaskan Native
10%6%6%
76%
2%
12%
7%6%
73%
2%
11%7%6%
75%
2%
Number of Patients
% Number of Patients
% Number of Patients
% Number of Patients
%
Other / Unknown 288,747 9% 336,316 10% 440,574 12% 390,427 11%
Asian / Pacifi c Islander 213,906 6% 227,118 6% 246,943 7% 245,287 7%
Native American / Alaskan Native 63,271 2% 68,690 2% 73,384 2% 71,398 2%
Black 197,639 6% 213,763 6% 211,536 6% 212,281 6%
White (incl. Hispanic) 2,577,241 77% 2,650,196 76% 2,596,535 73% 2,725,291 75%
Total Patients 3,340,804 100% 3,496,083 100% 3,568,972 100% 3,644,684 100%
26 | California Community Clinics – Financial Profi le, 2005 – 2008 Prepared by Capital Link
CA Community Clinics Patient Ethnicity
2005 2006 2007 2008
Non-HispanicUnknown
0
20
40
60
80
100
120
38%
55%
37%
7%
56%
37%
6%
58%
37%6%
56%
6%
Hispanic
2005 2006 2007 2008
Number of Patients
% Number of Patients
% Number of Patients
% Number of Patients
%
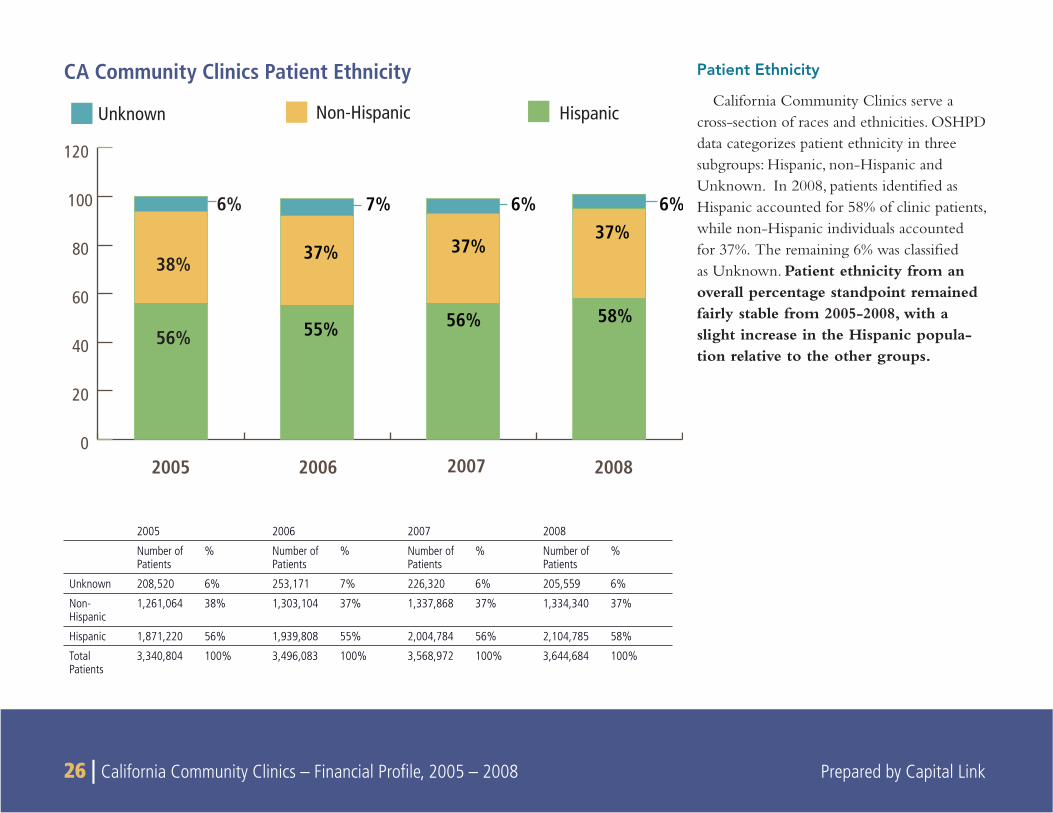
Unknown 208,520 6% 253,171 7% 226,320 6% 205,559 6%
Non-Hispanic
1,261,064 38% 1,303,104 37% 1,337,868 37% 1,334,340 37%
Hispanic 1,871,220 56% 1,939,808 55% 2,004,784 56% 2,104,785 58%
Total Patients
3,340,804 100% 3,496,083 100% 3,568,972 100% 3,644,684 100%
Patient Ethnicity
California Community Clinics serve a cross-section of races and ethnicities. OSHPD data categorizes patient ethnicity in three subgroups: Hispanic, non-Hispanic and Unknown. In 2008, patients identifi ed as Hispanic accounted for 58% of clinic patients, while non-Hispanic individuals accounted for 37%. The remaining 6% was classifi ed as Unknown. Patient ethnicity from an overall percentage standpoint remained fairly stable from 2005-2008, with a slight increase in the Hispanic popula-tion relative to the other groups.
Prepared by Capital Link California Community Clinics – Financial Profi le, 2005 – 2008 | 27
Under 1 year
1-4 years
5-12 years
13-19 years
20-34 years
35-44 years
45-64 years
65 years and over
100,000
200,000
300,000
400,000
500,000
600,000
700,000
800,000
Male
Female
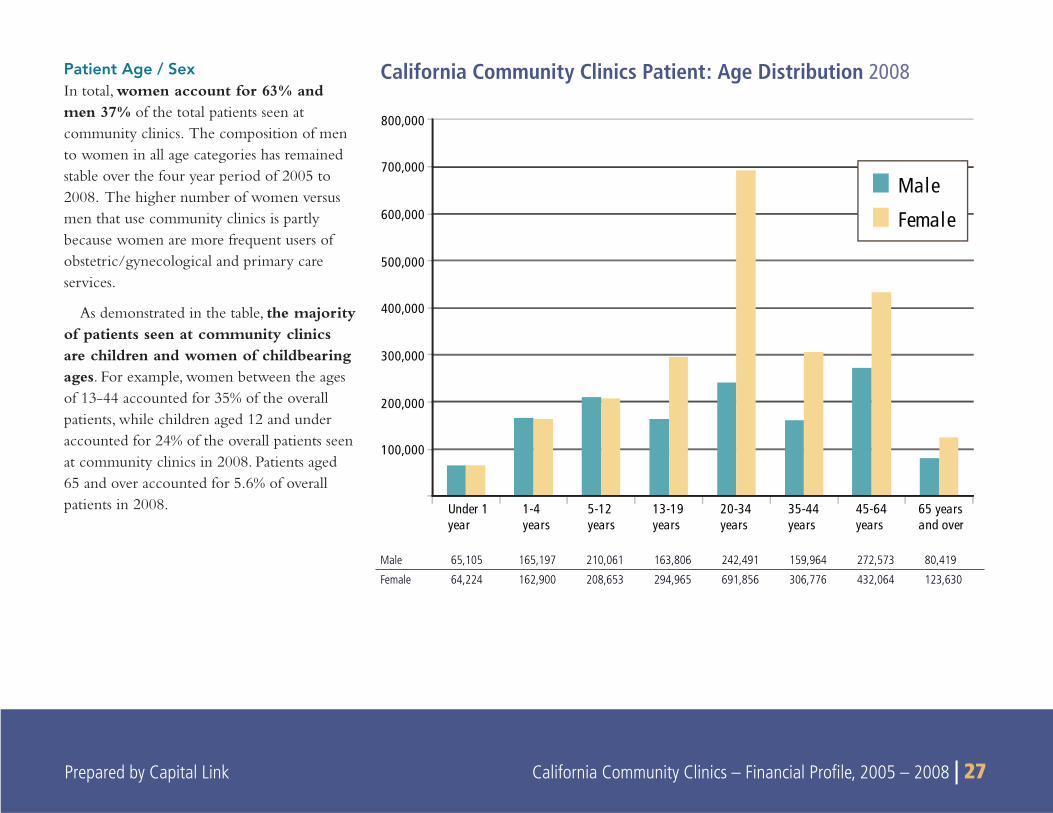
California Community Clinics Patient: Age Distribution 2008Patient Age / SexIn total, women account for 63% and men 37% of the total patients seen at community clinics. The composition of men to women in all age categories has remained stable over the four year period of 2005 to 2008. The higher number of women versus men that use community clinics is partly because women are more frequent users of obstetric/gynecological and primary care services.
As demonstrated in the table, the majority of patients seen at community clinics are children and women of childbearing ages. For example, women between the ages of 13-44 accounted for 35% of the overall patients, while children aged 12 and under accounted for 24% of the overall patients seen at community clinics in 2008. Patients aged 65 and over accounted for 5.6% of overall patients in 2008.
Male 65,105 165,197 210,061 163,806 242,491 159,964 272,573 80,419
Female 64,224 162,900 208,653 294,965 691,856 306,776 432,064 123,630
28 | California Community Clinics – Financial Profi le, 2005 – 2008 Prepared by Capital Link
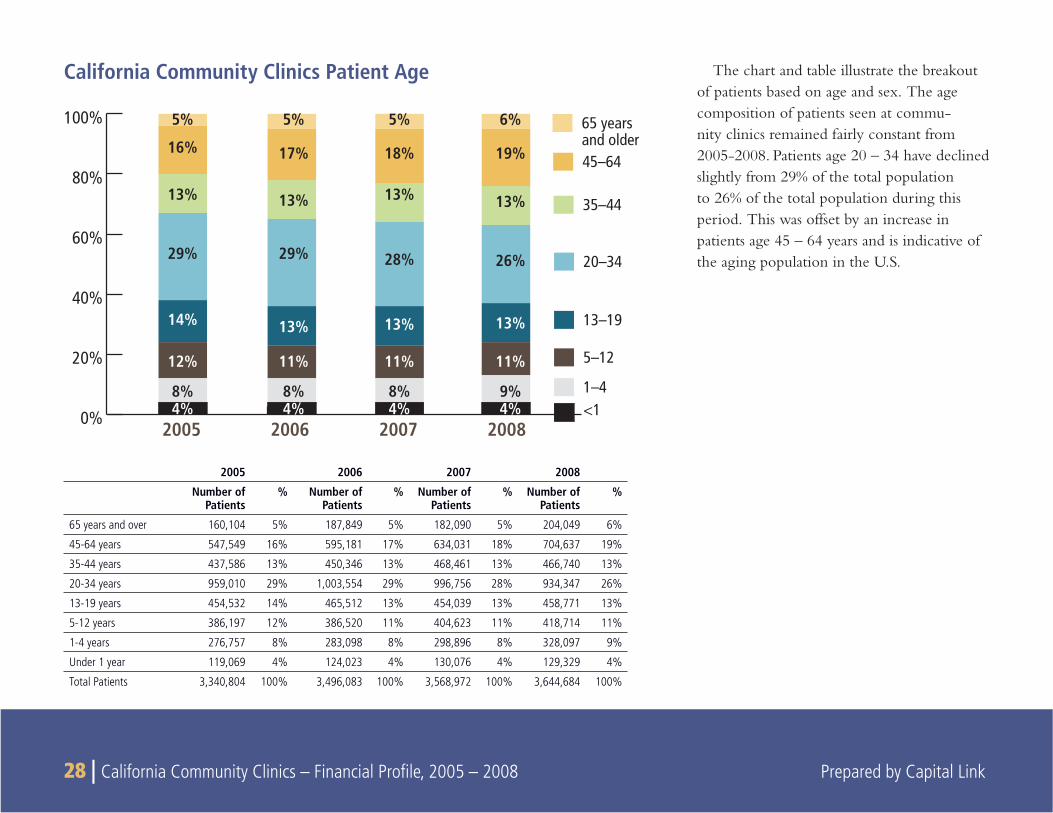
The chart and table illustrate the breakout of patients based on age and sex. The age composition of patients seen at commu-nity clinics remained fairly constant from 2005-2008. Patients age 20 – 34 have declined slightly from 29% of the total population to 26% of the total population during this period. This was offset by an increase in patients age 45 – 64 years and is indicative of the aging population in the U.S.
California Community Clinics Patient Age
2005 2006 2007 2008
Number of Patients
% Number of Patients
% Number of Patients
% Number of Patients
%
65 years and over 160,104 5% 187,849 5% 182,090 5% 204,049 6%
45-64 years 547,549 16% 595,181 17% 634,031 18% 704,637 19%
35-44 years 437,586 13% 450,346 13% 468,461 13% 466,740 13%
20-34 years 959,010 29% 1,003,554 29% 996,756 28% 934,347 26%
13-19 years 454,532 14% 465,512 13% 454,039 13% 458,771 13%
5-12 years 386,197 12% 386,520 11% 404,623 11% 418,714 11%
1-4 years 276,757 8% 283,098 8% 298,896 8% 328,097 9%
Under 1 year 119,069 4% 124,023 4% 130,076 4% 129,329 4%
Total Patients 3,340,804 100% 3,496,083 100% 3,568,972 100% 3,644,684 100%
0%
20%
40%
60%
80%
100% 65 yearsand older45–64
5%
16%
13%
29%
14%
12%
8%4%
5%
17%
13%
29%
13%
11%
8%4%
5%
18%
13%
28%
13%
11%
8%4%
6%
19%
13%
26%
13%
11%
9%4%
35–44
20–34
13–19
5–12
1–4<1
2005 2006 2007 2008
Prepared by Capital Link California Community Clinics – Financial Profi le, 2005 – 2008 | 29 Prepared by Capital Link California Community Clinics – Financial Profi le, 2005 – 2008 | 29
FEDERAL POLICIES AFFECTING GROWTH AND DEVELOPMENT OF HEALTH CENTERS
Growth of the Health Center and Clinic System
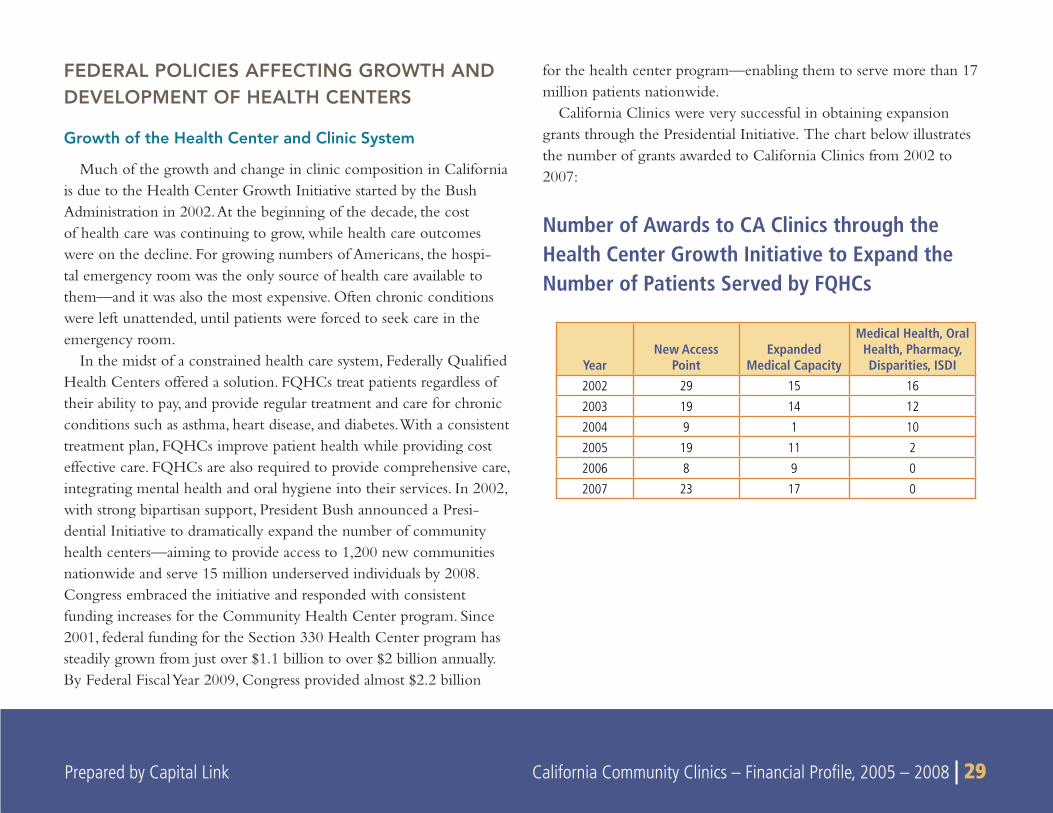
Much of the growth and change in clinic composition in California is due to the Health Center Growth Initiative started by the Bush Administration in 2002. At the beginning of the decade, the cost of health care was continuing to grow, while health care outcomes were on the decline. For growing numbers of Americans, the hospi-tal emergency room was the only source of health care available to them—and it was also the most expensive. Often chronic conditions were left unattended, until patients were forced to seek care in the emergency room.
In the midst of a constrained health care system, Federally Qualifi ed Health Centers offered a solution. FQHCs treat patients regardless of their ability to pay, and provide regular treatment and care for chronic conditions such as asthma, heart disease, and diabetes. With a consistent treatment plan, FQHCs improve patient health while providing cost effective care. FQHCs are also required to provide comprehensive care, integrating mental health and oral hygiene into their services. In 2002, with strong bipartisan support, President Bush announced a Presi-dential Initiative to dramatically expand the number of community health centers—aiming to provide access to 1,200 new communities nationwide and serve 15 million underserved individuals by 2008. Congress embraced the initiative and responded with consistent funding increases for the Community Health Center program. Since 2001, federal funding for the Section 330 Health Center program has steadily grown from just over $1.1 billion to over $2 billion annually. By Federal Fiscal Year 2009, Congress provided almost $2.2 billion
for the health center program—enabling them to serve more than 17 million patients nationwide.
California Clinics were very successful in obtaining expansion grants through the Presidential Initiative. The chart below illustrates the number of grants awarded to California Clinics from 2002 to 2007:
Number of Awards to CA Clinics through the Health Center Growth Initiative to Expand the Number of Patients Served by FQHCs
YearNew Access
PointExpanded
Medical Capacity
Medical Health, Oral Health, Pharmacy, Disparities, ISDI
2002 29 15 16
2003 19 14 12
2004 9 1 10
2005 19 11 2
2006 8 9 0
2007 23 17 0
30 | California Community Clinics – Financial Profi le, 2005 – 2008 Prepared by Capital Link
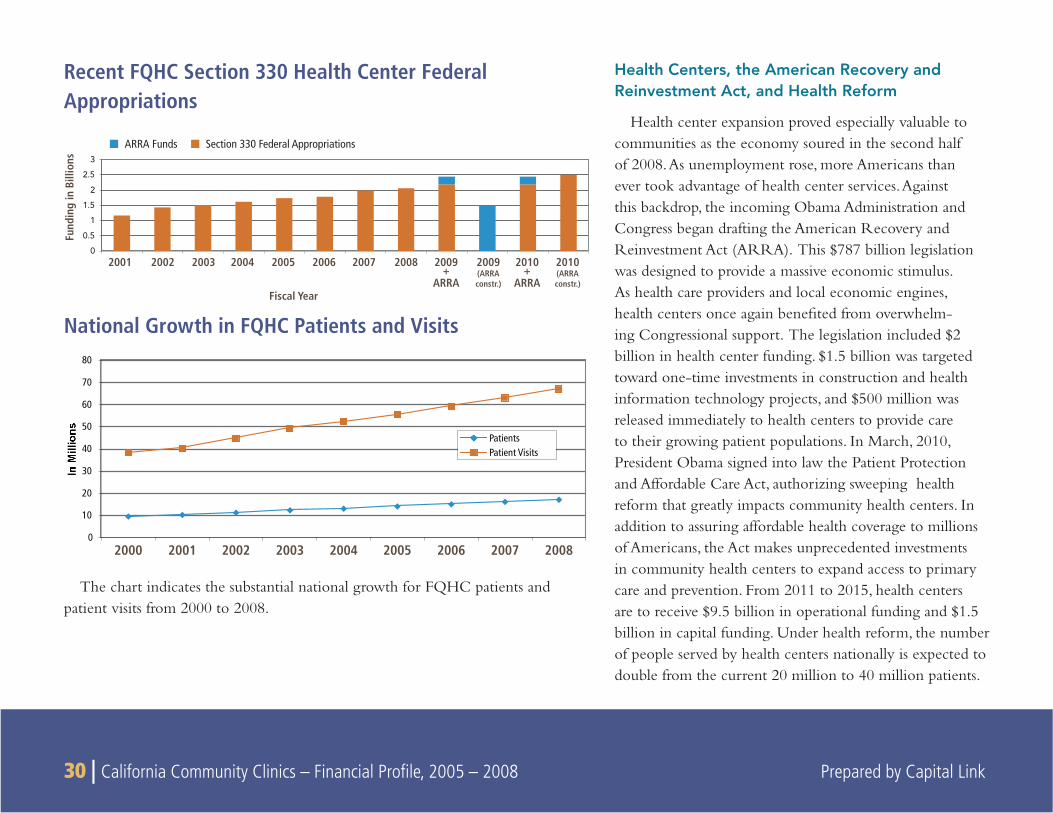
Health Centers, the American Recovery and Reinvestment Act, and Health Reform
Health center expansion proved especially valuable to communities as the economy soured in the second half of 2008. As unemployment rose, more Americans than ever took advantage of health center services. Against this backdrop, the incoming Obama Administration and Congress began drafting the American Recovery and Reinvestment Act (ARRA). This $787 billion legislation was designed to provide a massive economic stimulus. As health care providers and local economic engines, health centers once again benefi ted from overwhelm-ing Congressional support. The legislation included $2 billion in health center funding. $1.5 billion was targeted toward one-time investments in construction and health information technology projects, and $500 million was released immediately to health centers to provide care to their growing patient populations. In March, 2010, President Obama signed into law the Patient Protection and Affordable Care Act, authorizing sweeping health reform that greatly impacts community health centers. In addition to assuring affordable health coverage to millions of Americans, the Act makes unprecedented investments in community health centers to expand access to primary care and prevention. From 2011 to 2015, health centers are to receive $9.5 billion in operational funding and $1.5 billion in capital funding. Under health reform, the number of people served by health centers nationally is expected to double from the current 20 million to 40 million patients.
Recent FQHC Section 330 Health Center Federal Appropriations
0
0.5
1
1.5
2
2.5
3
2001 2002
Fiscal Year
Fund
ing
in B
illio
ns
2003 2004 2005 2006 2007 2008 2009+
ARRA
2009(ARRAconstr.)
2010(ARRAconstr.)
2010+
ARRA
Section 330 Federal AppropriationsARRA Funds
National Growth in FQHC Patients and Visits
0
10
20
30
40
50
60
70
80
2000 2001 2002 2003 2004 2005 2006 2007 2008
PatientsPatient Visits
The chart indicates the substantial national growth for FQHC patients and patient visits from 2000 to 2008.
Prepared by Capital Link California Community Clinics – Financial Profi le, 2005 – 2008 | 31
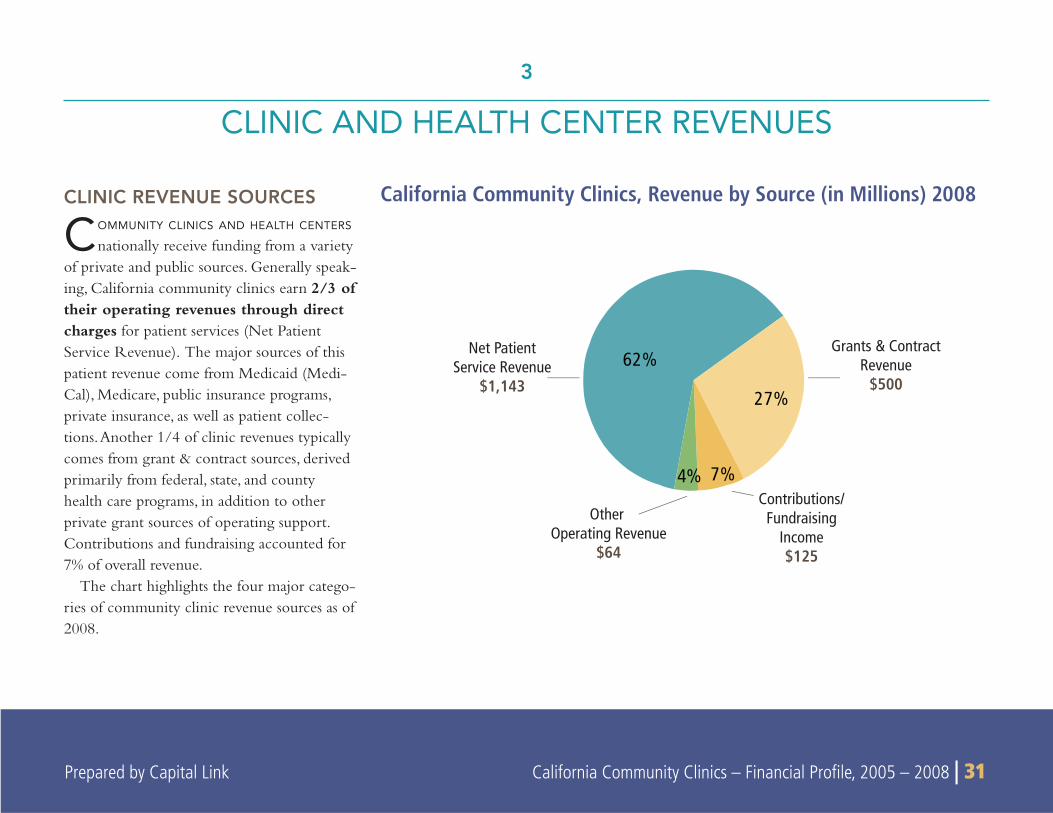
CLINIC REVENUE SOURCES
COMMUNITY CLINICS AND HEALTH CENTERS nationally receive funding from a variety
of private and public sources. Generally speak-ing, California community clinics earn 2/3 of their operating revenues through direct charges for patient services (Net Patient Service Revenue). The major sources of this patient revenue come from Medicaid (Medi-Cal), Medicare, public insurance programs, private insurance, as well as patient collec-tions. Another 1/4 of clinic revenues typically comes from grant & contract sources, derived primarily from federal, state, and county health care programs, in addition to other private grant sources of operating support. Contributions and fundraising accounted for 7% of overall revenue.
The chart highlights the four major catego-ries of community clinic revenue sources as of 2008.
3
CLINIC AND HEALTH CENTER REVENUES
62%
27%
7%4%
Net PatientService Revenue
$1,143
Other Operating Revenue
$64
Contributions/Fundraising
Income$125
Grants & ContractRevenue
$500
California Community Clinics, Revenue by Source (in Millions) 2008
32 | California Community Clinics – Financial Profi le, 2005 – 2008 Prepared by Capital Link
0%
20%
40%
60%
80%
100%
2005 2006 2007 2008
2008200720062005 $– $1,000 $2,000
(Mill
ions
)
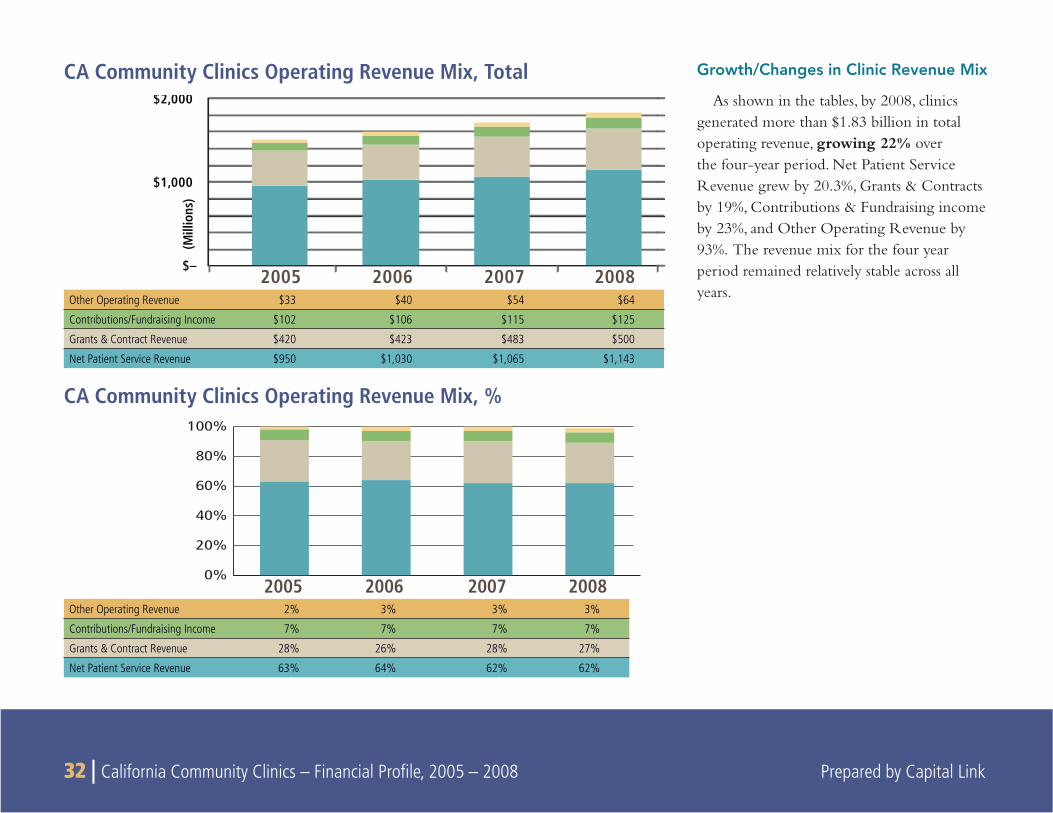
Growth/Changes in Clinic Revenue Mix
As shown in the tables, by 2008, clinics generated more than $1.83 billion in total operating revenue, growing 22% over the four-year period. Net Patient Service Revenue grew by 20.3%, Grants & Contracts by 19%, Contributions & Fundraising income by 23%, and Other Operating Revenue by 93%. The revenue mix for the four year period remained relatively stable across all years.
CA Community Clinics Operating Revenue Mix, Total
Other Operating Revenue $33 $40 $54 $64
Contributions/Fundraising Income $102 $106 $115 $125
Grants & Contract Revenue $420 $423 $483 $500
Net Patient Service Revenue $950 $1,030 $1,065 $1,143
Other Operating Revenue 2% 3% 3% 3%
Contributions/Fundraising Income 7% 7% 7% 7%
Grants & Contract Revenue 28% 26% 28% 27%
Net Patient Service Revenue 63% 64% 62% 62%
CA Community Clinics Operating Revenue Mix, %
Prepared by Capital Link California Community Clinics – Financial Profi le, 2005 – 2008 | 33
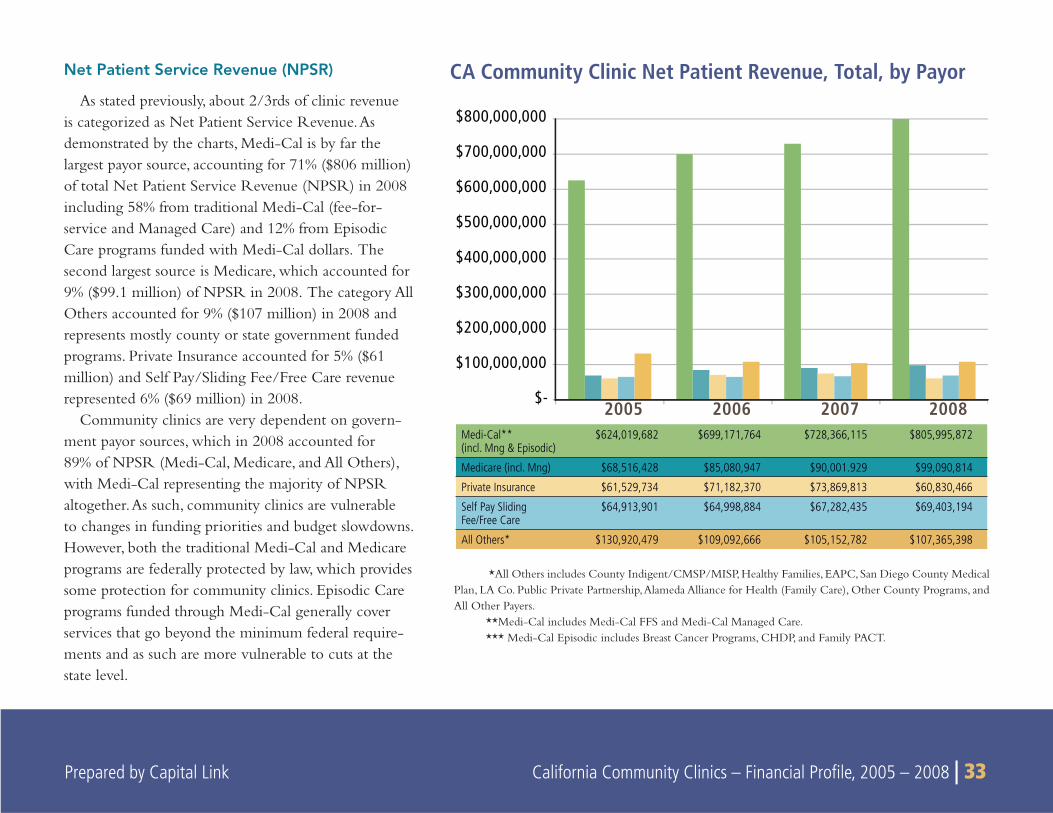
Net Patient Service Revenue (NPSR)
As stated previously, about 2/3rds of clinic revenue is categorized as Net Patient Service Revenue. As demonstrated by the charts, Medi-Cal is by far the largest payor source, accounting for 71% ($806 million) of total Net Patient Service Revenue (NPSR) in 2008 including 58% from traditional Medi-Cal (fee-for-service and Managed Care) and 12% from Episodic Care programs funded with Medi-Cal dollars. The second largest source is Medicare, which accounted for 9% ($99.1 million) of NPSR in 2008. The category All Others accounted for 9% ($107 million) in 2008 and represents mostly county or state government funded programs. Private Insurance accounted for 5% ($61 million) and Self Pay/Sliding Fee/Free Care revenue represented 6% ($69 million) in 2008.
Community clinics are very dependent on govern-ment payor sources, which in 2008 accounted for 89% of NPSR (Medi-Cal, Medicare, and All Others), with Medi-Cal representing the majority of NPSR altogether. As such, community clinics are vulnerable to changes in funding priorities and budget slowdowns. However, both the traditional Medi-Cal and Medicare programs are federally protected by law, which provides some protection for community clinics. Episodic Care programs funded through Medi-Cal generally cover services that go beyond the minimum federal require-ments and as such are more vulnerable to cuts at the state level.
CA Community Clinic Net Patient Revenue, Total, by Payor
*All Others includes County Indigent/CMSP/MISP, Healthy Families, EAPC, San Diego County Medical Plan, LA Co. Public Private Partnership, Alameda Alliance for Health (Family Care), Other County Programs, and All Other Payers.
**Medi-Cal includes Medi-Cal FFS and Medi-Cal Managed Care.*** Medi-Cal Episodic includes Breast Cancer Programs, CHDP, and Family PACT.
2005 2006 2007 2008 $-
$100,000,000
$200,000,000
$300,000,000
$400,000,000
$500,000,000
$600,000,000
$700,000,000
$800,000,000
Medi-Cal** (incl. Mng & Episodic)
$624,019,682 $699,171,764 $728,366,115 $805,995,872
Medicare (incl. Mng) $68,516,428 $85,080,947 $90,001.929 $99,090,814
Private Insurance $61,529,734 $71,182,370 $73,869,813 $60,830,466
Self Pay Sliding Fee/Free Care
$64,913,901 $64,998,884 $67,282,435 $69,403,194
All Others* $130,920,479 $109,092,666 $105,152,782 $107,365,398
34 | California Community Clinics – Financial Profi le, 2005 – 2008 Prepared by Capital Link
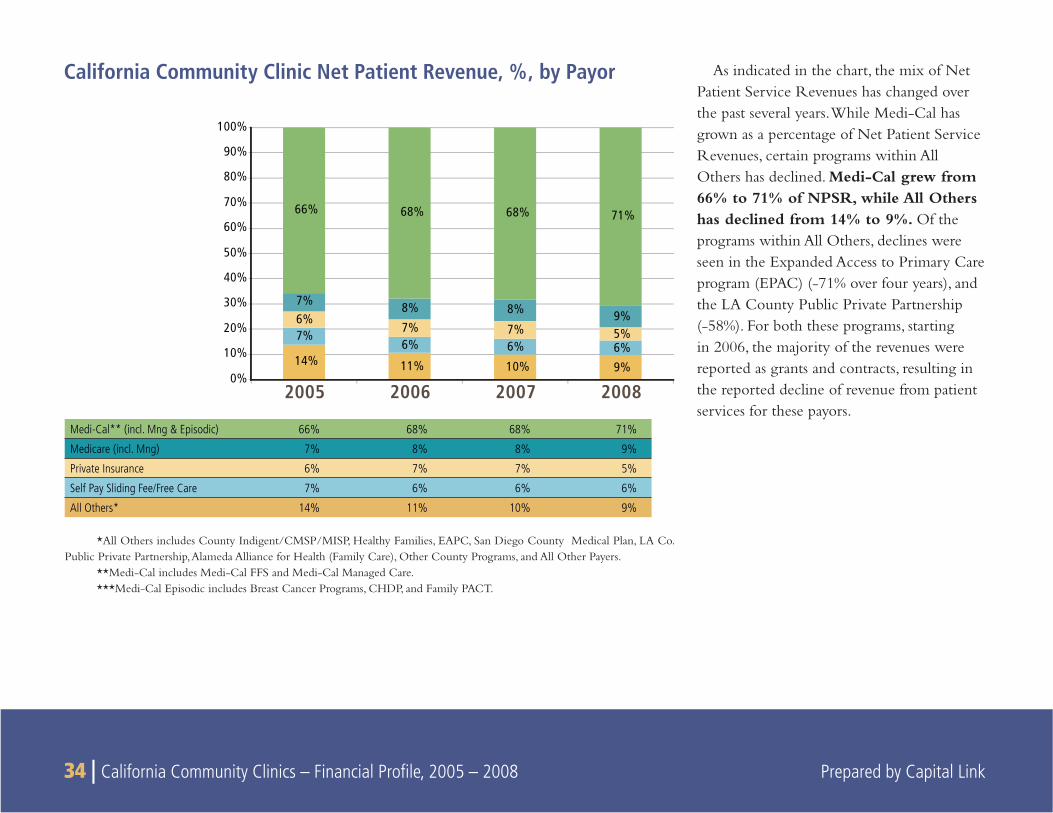
As indicated in the chart, the mix of Net Patient Service Revenues has changed over the past several years. While Medi-Cal has grown as a percentage of Net Patient Service Revenues, certain programs within All Others has declined. Medi-Cal grew from 66% to 71% of NPSR, while All Others has declined from 14% to 9%. Of the programs within All Others, declines were seen in the Expanded Access to Primary Care program (EPAC) (-71% over four years), and the LA County Public Private Partnership (-58%). For both these programs, starting in 2006, the majority of the revenues were reported as grants and contracts, resulting in the reported decline of revenue from patient services for these payors.
California Community Clinic Net Patient Revenue, %, by Payor
*All Others includes County Indigent/CMSP/MISP, Healthy Families, EAPC, San Diego County Medical Plan, LA Co. Public Private Partnership, Alameda Alliance for Health (Family Care), Other County Programs, and All Other Payers.
**Medi-Cal includes Medi-Cal FFS and Medi-Cal Managed Care.***Medi-Cal Episodic includes Breast Cancer Programs, CHDP, and Family PACT.
2005 2006 2007 20080%
10%
20%
30%
40%
50%
60%
70%
80%
90%
100%
14% 11% 10% 9%
7%6% 6% 6%
6%7% 7% 5%
7% 8% 8% 9%
66% 68% 68% 71%
Medi-Cal** (incl. Mng & Episodic) 66% 68% 68% 71%
Medicare (incl. Mng) 7% 8% 8% 9%
Private Insurance 6% 7% 7% 5%
Self Pay Sliding Fee/Free Care 7% 6% 6% 6%
All Others* 14% 11% 10% 9%
Prepared by Capital Link California Community Clinics – Financial Profi le, 2005 – 2008 | 35
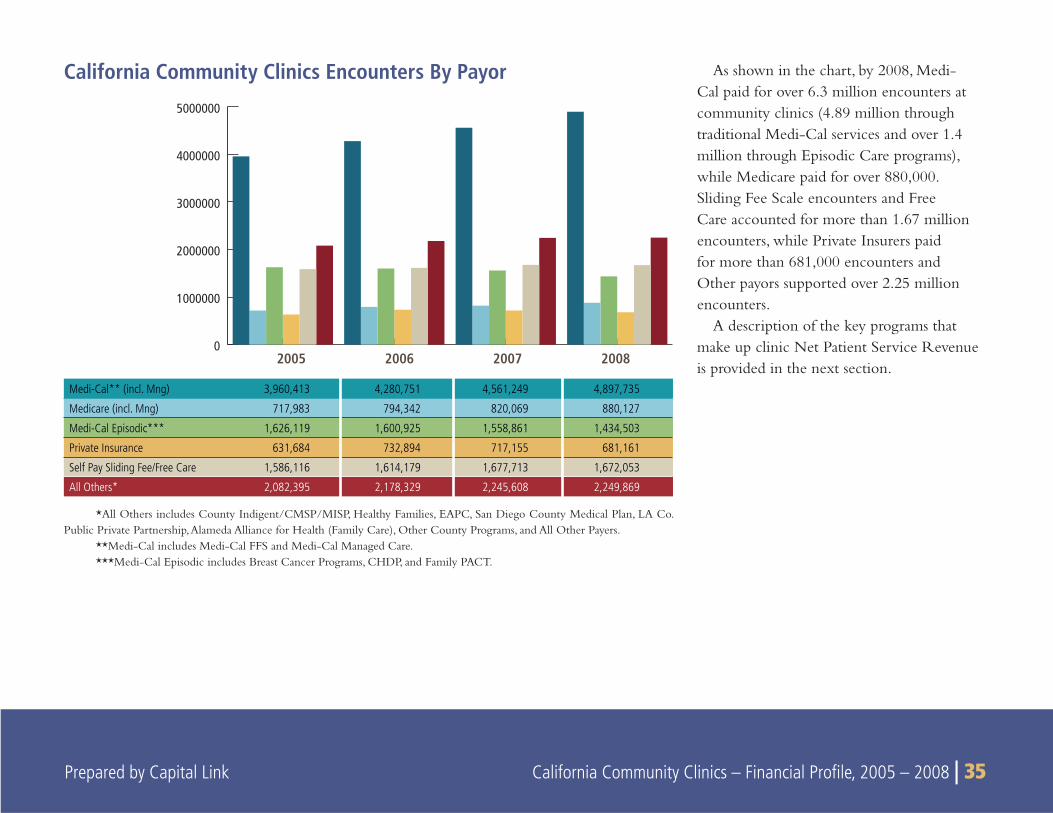
As shown in the chart, by 2008, Medi-Cal paid for over 6.3 million encounters at community clinics (4.89 million through traditional Medi-Cal services and over 1.4 million through Episodic Care programs), while Medicare paid for over 880,000. Sliding Fee Scale encounters and Free Care accounted for more than 1.67 million encounters, while Private Insurers paid for more than 681,000 encounters and Other payors supported over 2.25 million encounters.
A description of the key programs that make up clinic Net Patient Service Revenue is provided in the next section.
California Community Clinics Encounters By Payor
Medi-Cal** (incl. Mng) 3,960,413 4,280,751 4,561,249 4,897,735
Medicare (incl. Mng) 717,983 794,342 820,069 880,127
Medi-Cal Episodic*** 1,626,119 1,600,925 1,558,861 1,434,503
Private Insurance 631,684 732,894 717,155 681,161
Self Pay Sliding Fee/Free Care 1,586,116 1,614,179 1,677,713 1,672,053
All Others* 2,082,395 2,178,329 2,245,608 2,249,869
0
1000000
2000000
3000000
4000000
5000000
2005 2006 2007 2008
*All Others includes County Indigent/CMSP/MISP, Healthy Families, EAPC, San Diego County Medical Plan, LA Co. Public Private Partnership, Alameda Alliance for Health (Family Care), Other County Programs, and All Other Payers.
**Medi-Cal includes Medi-Cal FFS and Medi-Cal Managed Care.***Medi-Cal Episodic includes Breast Cancer Programs, CHDP, and Family PACT.
36 | California Community Clinics – Financial Profi le, 2005 – 2008 Prepared by Capital Link
CALIFORNIA’S MEDICAID PROGRAMMedi-Cal, California’s Medicaid program, is a public health insur-
ance program that provides needed health care services to low-income individuals, including families with children, pregnant women, seniors, persons with disabilities, foster care, and low-income people with specifi c illnesses. Medi-Cal is fi nanced equally by the state and federal governments. In 2006, California ranked the second lowest of all 50 states and the District of Columbia in total Medicaid spending per benefi ciary.16
In California, the payor sources of the clinic safety net providers closely resemble that of health centers and clinics nationally. In 2008, Medi-Cal insures roughly 38% of the patients that visit commu-nity clinics in the state, providing an indispensable revenue stream to support their operations. FQHCs in particular benefi t from the Medicaid visits as they are reimbursed on a Prospective Payment System (PPS) basis, which is based on cost.17 This reimbursement structure helps to ensure that the clinic is “made whole” for each Medicaid patient it treats so that FQHC grant revenues can be dedicated to care for the uninsured rather than subsidizing care for Medicaid patients. Overall in 2008, revenues earned from Medi-Cal represented approximately 44% of total clinic revenues in the state.
OSHPD records Medi-Cal revenue under different categories including Medi-Cal, Medi-Cal Managed Care and through various “Episodic Care” programs. For the purposes of this study, Medi-Cal revenues and encounters is sometimes broken out into three
groups: Medi-Cal, Medi-Cal Managed Care, and Medi-Cal Episodic Programs. Those subgroups follow.
Medi-Cal
This category includes all encounters and revenue that were reimbursed under the traditional fee-for-service method.
Medi-Cal Managed Care
In some California counties, the Medi-Cal Managed Care Division (MMCD) contracts for health care services through established networks of organized systems of care, which emphasize primary and preventive care. Providers are paid under contracts that reimburse for a package of care designed to make cost-effective use of health care resources that improve health care access and assure quality of care.
Medi-Cal Episodic Programs
While not funded according to traditional Medi-Cal eligibil-ity guidelines, the following programs are paid for with Medi-Cal funding:
Breast Cancer Programs
Breast Cancer Programs includes the Breast Cancer Early Detec-tion Program and the Breast and Cervical Cancer Treatment Program. These programs are open to eligible individuals diagnosed with breast and/or cervical cancer who are in need of treatment.18
16Kaiser Family Foundation State Health Facts http://www.statehealthfacts.org/comparetable.jsp?ind=183&cat=4&sub=47&rgnhl=6 17As discussed earlier, the PPS establishes a minimum per visit payment rate under Medicaid for each FQHC for each fi scal year. PPS also provides for “wrap-around” payments to cover the
difference between payment received by the FQHC for treating a managed care enrollee and the payment to which the FQHC is entitled under PPS. 18California Dept. of Healthcare Services, http://www.dhcs.ca.gov/services/medi-cal/Pages/BCCTP.aspx
Prepared by Capital Link California Community Clinics – Financial Profi le, 2005 – 2008 | 37 Prepared by Capital Link California Community Clinics – Financial Profi le, 2005 – 2008 | 37
Children’s Health and Disability Program (CHDP)
The CHDP provides complete health assessments for the early detection and prevention of disease and disabilities for low-income children and youth. A health assessment consists of a health history, physical examination, developmental assessment, nutritional assessment, dental assessment, vision and hearing tests, a tuberculin test, labora-tory tests, immunizations, health education/anticipatory guidance, and referral for any needed diagnosis and treatment. The CHDP program oversees the screening and follow-up components of the federally mandated Early and Periodic Screening, Diagnosis, and Treatment (EPSDT) program for Medi-Cal eligible children and youth.
Family PACT
California Family Planning, Access, Care and Treatment (Family PACT), funded under Medi-Cal, is California’s innovative approach to providing comprehensive family planning services to eligible low-income men and women. This clinical program increases access to services by expanding the provider network to include medical providers, pharmacies and laboratories. This program provides community clinics with nearly 8% of their overall operating revenue.
Medicare
Medicare is a federally-sponsored health insurance program for people 65 years of age or older, people younger than 65 with a disabil-ity, and people with kidney failure. Funded through Title XVIII of the Social Security Act, it provides coverage for hospital care (Part A), medical services (Part B) and prescription drugs (Part D). Through the
Medicare Part B program, community clinics in California provided health care services to nearly 199,000 patients in 2008. Services to these patients accounted for approximately 6% of total clinic revenues in 2008.
Private Insurance
Private Insurance refers to private or commercial insurance programs that cover individual patients. Private Insurance accounted for 6% of NPSR and 3% of Total Operating Revenue in 2008.
All Others
The “All Others” category contains a variety of city, county and state funded programs that altogether accounted for 9% of NPSR and 6% of Total Revenue in 2008. Those programs and their relative percentage of Total Operating Revenue in 2008 are as follows:
County Indigent / CMSP / MISP (1.6%)•
Healthy Families / State Children’s Health Insurance Program • (SCHIP) (1.5%)
Expanded Access to Primary Care program – patient collections • (EAPC) (0.3%)
San Diego County Medical Plan (0%)•
LA County Public Private Partnership (0.7%)•
Alameda Alliance for Health (Family Care) (0.3%) •
Other County Payors (0.3%)•
All Other Payors (1.1%)•
38 | California Community Clinics – Financial Profi le, 2005 – 2008 Prepared by Capital Link
GRANT & CONTRACT REVENUE
Federal Funds
Most federal grant funding for clinics is derived from the FQHC Section 330 grant program. The Bureau of Primary Health Care provides federal grant programs to support health center programs across the country. For FQHCs qualifi ed as Section 330 health centers, the federal operating grant helps support services for uninsured and underinsured clients in need of basic care and typically comprises the largest single source of Grant & Contract revenue. The federal health center program continues to enjoy strong bipartisan support in both chambers of Congress and by President Bush. Despite the on-going federal budget challenges, the annual federal appropriation for the health center program has increased every fi scal year since the mid-1990s. While only FQHC Section 330 health centers received this federal operating support in 2008, this support constituted 16% of total California clinic revenues in 2008, and was the second largest source of revenue after the Medi-Cal program.
State Programs
State Programs include State-Other programs and the State-EAPC program. State-Other program revenue accounted for 2.3% of Total Operating Revenue in 2008.
State-EAPC
The state Expanded Access to Primary Care (EAPC) program is administered by the Department of Health Care Services. The mission of the EAPC program is to improve the quality of health care and
to expand access to primary and preventive health care to medically underserved areas and populations. Benefi ciaries are those persons at or below 200% of the federal poverty level who do not have any third-party health or dental coverage. In 2006, OSHPD began reporting the state grant portion of the EAPC program separate from other state programs. The state EAPC grant program accounted for roughly 1.6% of total community clinic revenues as of 2008.
County and Local Programs
County and Local Grant and Contract Programs accounted for 8% of Total Operating Revenue in 2008 and represented county programs such as the LA County Partnership, and the San Diego Medical Plan.
Contributions & Fundraising
Contributions & Fundraising accounted for 6.9% of Total Operat-ing Revenue in 2008. Of that amount, 3.9% was derived from Private Grants and 3.0% was derived from Donations and Contributions.
Other Operating Revenue
Other Operating Revenue accounted for 3% of Total Operating Revenue in 2008. Other Operating Revenue includes revenue gener-ated from non-patient care operations, such as rental and interest income.
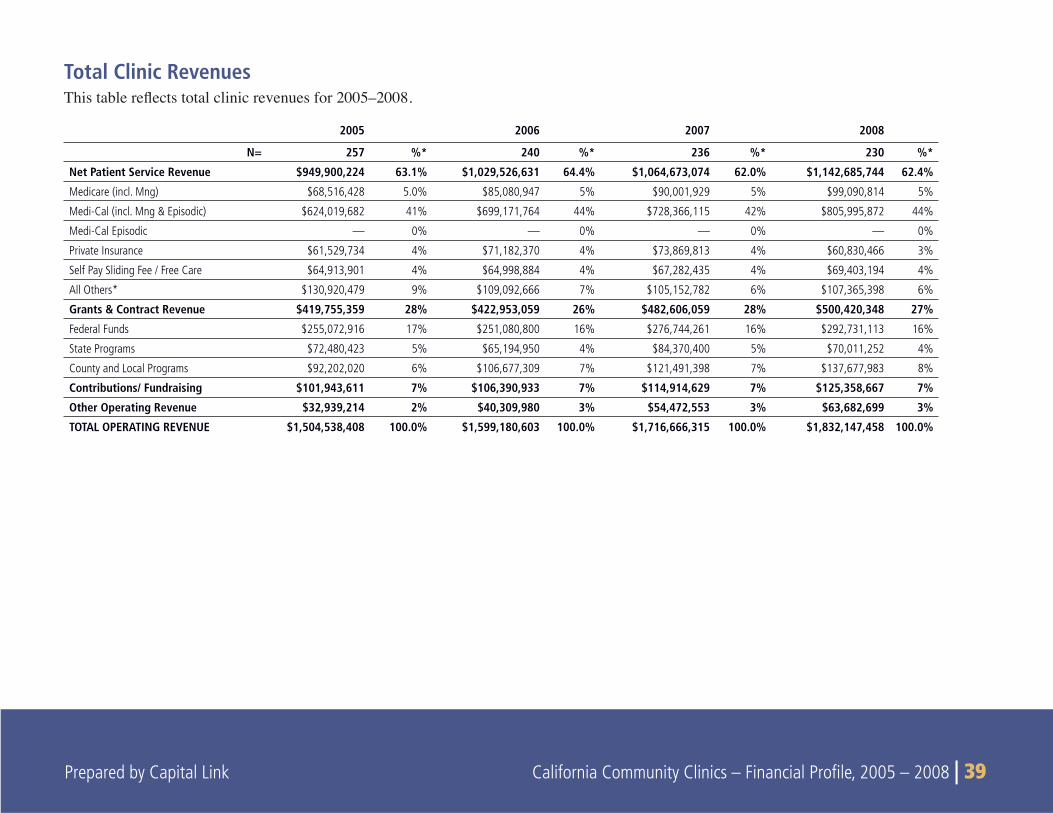
Prepared by Capital Link California Community Clinics – Financial Profi le, 2005 – 2008 | 39
Total Clinic RevenuesThis%table%re!%ects%total%clinic%revenues%1or%200552006.%
2005 2006 2007 2008
N= 257 %* 240 %* 236 %* 230 %*
Net Patient Service Revenue $949,900,224 63.1% $1,029,526,631 64.4% $1,064,673,074 62.0% $1,142,685,744 62.4%
Medicare (incl. Mng) $68,516,428 5.0% $85,080,947 5% $90,001,929 5% $99,090,814 5%
Medi-Cal (incl. Mng & Episodic) $624,019,682 41% $699,171,764 44% $728,366,115 42% $805,995,872 44%
Medi-Cal Episodic — 0% — 0% — 0% — 0%
Private Insurance $61,529,734 4% $71,182,370 4% $73,869,813 4% $60,830,466 3%
Self Pay Sliding Fee / Free Care $64,913,901 4% $64,998,884 4% $67,282,435 4% $69,403,194 4%
All Others* $130,920,479 9% $109,092,666 7% $105,152,782 6% $107,365,398 6%
Grants & Contract Revenue $419,755,359 28% $422,953,059 26% $482,606,059 28% $500,420,348 27%
Federal Funds $255,072,916 17% $251,080,800 16% $276,744,261 16% $292,731,113 16%
State Programs $72,480,423 5% $65,194,950 4% $84,370,400 5% $70,011,252 4%
County and Local Programs $92,202,020 6% $106,677,309 7% $121,491,398 7% $137,677,983 8%
Contributions/ Fundraising $101,943,611 7% $106,390,933 7% $114,914,629 7% $125,358,667 7%
Other Operating Revenue $32,939,214 2% $40,309,980 3% $54,472,553 3% $63,682,699 3%
TOTAL OPERATING REVENUE $1,504,538,408 100.0% $1,599,180,603 100.0% $1,716,666,315 100.0% $1,832,147,458 100.0%
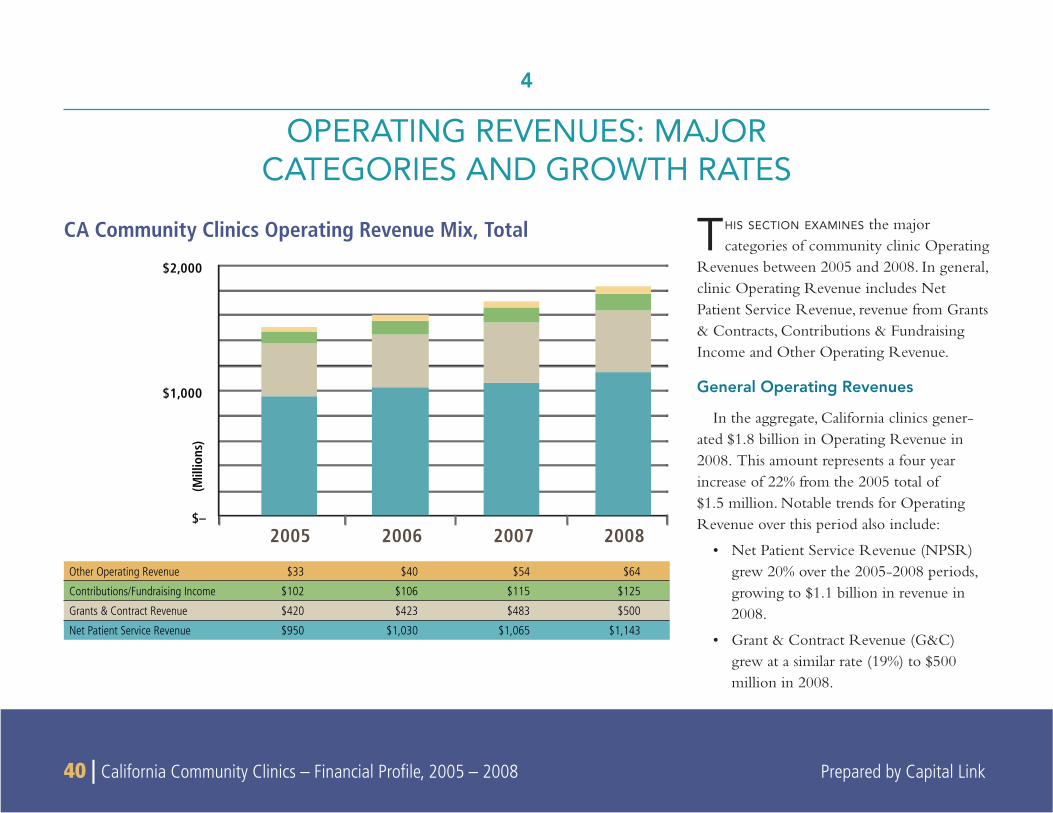
40 | California Community Clinics – Financial Profi le, 2005 – 2008 Prepared by Capital Link
THIS SECTION EXAMINES the major categories of community clinic Operating
Revenues between 2005 and 2008. In general, clinic Operating Revenue includes Net Patient Service Revenue, revenue from Grants & Contracts, Contributions & Fundraising Income and Other Operating Revenue.
General Operating Revenues
In the aggregate, California clinics gener-ated $1.8 billion in Operating Revenue in 2008. This amount represents a four year increase of 22% from the 2005 total of $1.5 million. Notable trends for Operating Revenue over this period also include:
Net Patient Service Revenue (NPSR) • grew 20% over the 2005-2008 periods, growing to $1.1 billion in revenue in 2008.
Grant & Contract Revenue (G&C) • grew at a similar rate (19%) to $500 million in 2008.
4
OPERATING REVENUES: MAJORCATEGORIES AND GROWTH RATES
CA Community Clinics Operating Revenue Mix, Total
2008200720062005$–
$1,000
$2,000
(Mill
ions
)
Other Operating Revenue $33 $40 $54 $64
Contributions/Fundraising Income $102 $106 $115 $125
Grants & Contract Revenue $420 $423 $483 $500
Net Patient Service Revenue $950 $1,030 $1,065 $1,143
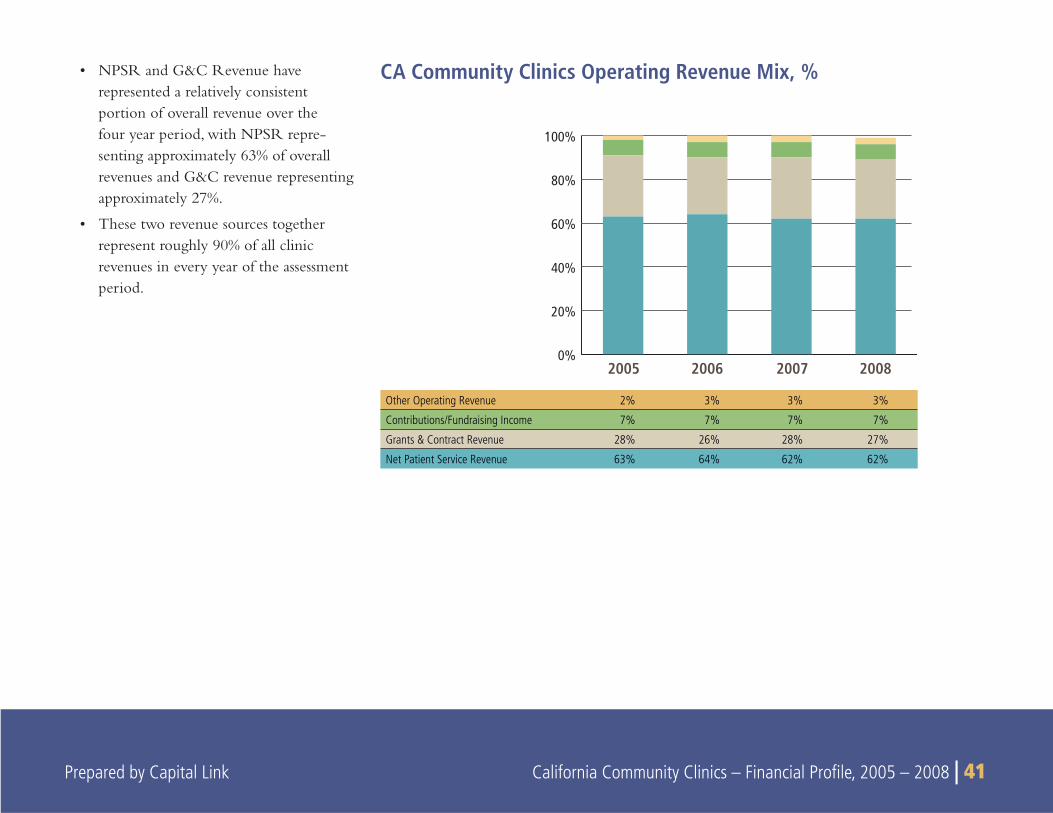
Prepared by Capital Link California Community Clinics – Financial Profi le, 2005 – 2008 | 41
CA Community Clinics Operating Revenue Mix, %
Other Operating Revenue 2% 3% 3% 3%
Contributions/Fundraising Income 7% 7% 7% 7%
Grants & Contract Revenue 28% 26% 28% 27%
Net Patient Service Revenue 63% 64% 62% 62%
0%
20%
40%
60%
80%
100%
2005 2006 2007 2008
NPSR and G&C Revenue have • represented a relatively consistent portion of overall revenue over the four year period, with NPSR repre-senting approximately 63% of overall revenues and G&C revenue representing approximately 27%.
These two revenue sources together • represent roughly 90% of all clinic revenues in every year of the assessment period.
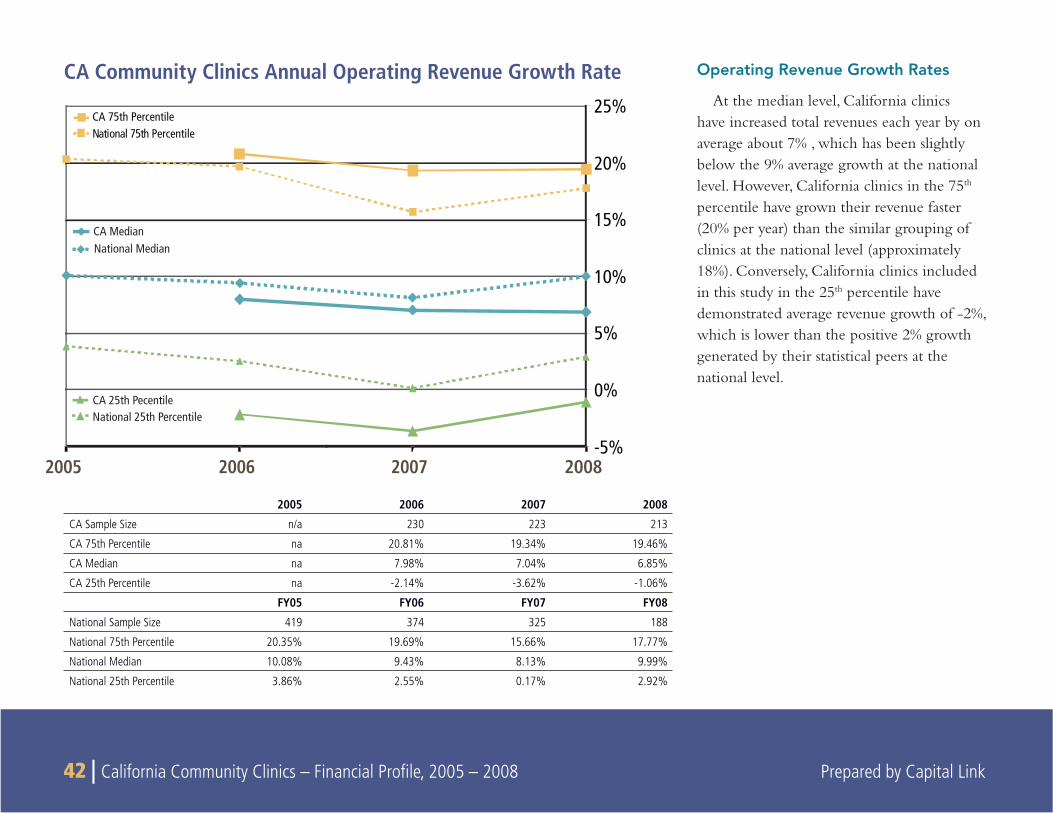
42 | California Community Clinics – Financial Profi le, 2005 – 2008 Prepared by Capital Link
2008200720062005-5%
0%
5%
10%
15%
20%
25%CA 75th Percentile
National 75th Percentile
CA MedianNational Median
CA 25th PecentileNational 25th Percentile
CA Community Clinics Annual Operating Revenue Growth Rate Operating Revenue Growth Rates
At the median level, California clinics have increased total revenues each year by on average about 7% , which has been slightly below the 9% average growth at the national level. However, California clinics in the 75th percentile have grown their revenue faster (20% per year) than the similar grouping of clinics at the national level (approximately 18%). Conversely, California clinics included in this study in the 25th percentile have demonstrated average revenue growth of -2%, which is lower than the positive 2% growth generated by their statistical peers at the national level.
2005 2006 2007 2008
CA Sample Size n/a 230 223 213
CA 75th Percentile na 20.81% 19.34% 19.46%
CA Median na 7.98% 7.04% 6.85%
CA 25th Percentile na -2.14% -3.62% -1.06%
FY05 FY06 FY07 FY08
National Sample Size 419 374 325 188
National 75th Percentile 20.35% 19.69% 15.66% 17.77%
National Median 10.08% 9.43% 8.13% 9.99%
National 25th Percentile 3.86% 2.55% 0.17% 2.92%
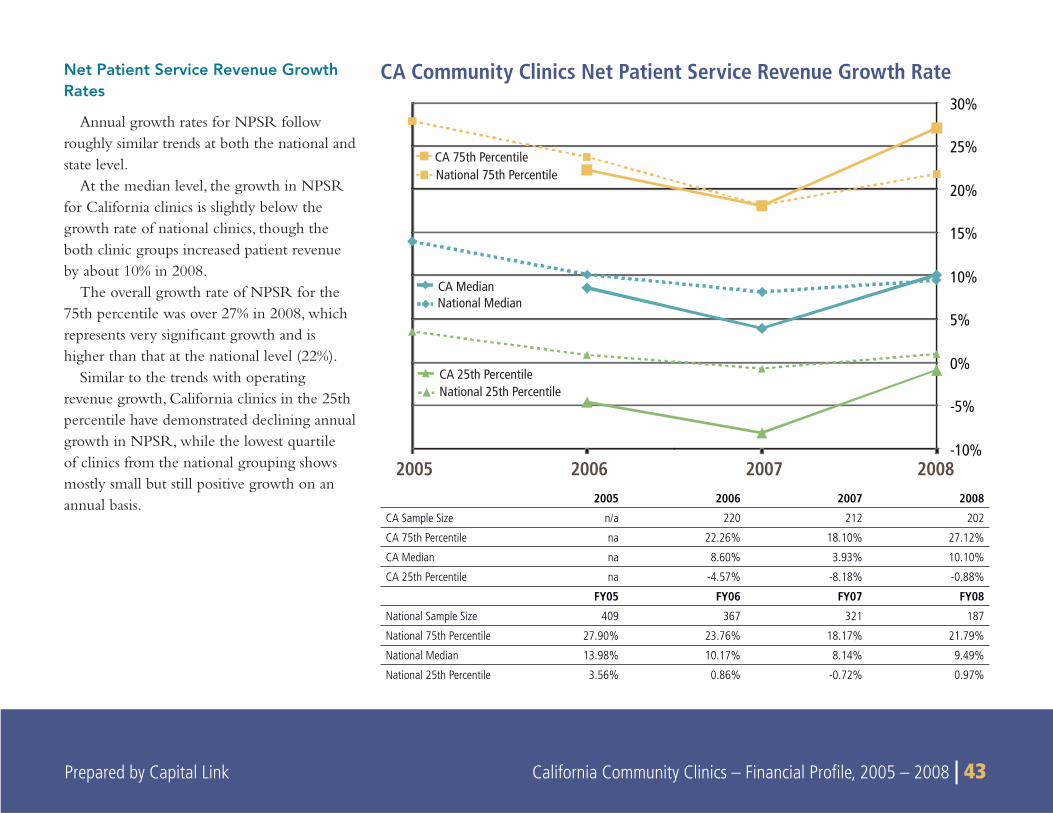
Prepared by Capital Link California Community Clinics – Financial Profi le, 2005 – 2008 | 43
2008200720062005-10%
-5%
0%
5%
10%
15%
20%
25%
30%
CA 75th PercentileNational 75th Percentile
CA MedianNational Median
CA 25th PercentileNational 25th Percentile
Net Patient Service Revenue Growth Rates
Annual growth rates for NPSR follow roughly similar trends at both the national and state level.
At the median level, the growth in NPSR for California clinics is slightly below the growth rate of national clinics, though the both clinic groups increased patient revenue by about 10% in 2008.
The overall growth rate of NPSR for the 75th percentile was over 27% in 2008, which represents very signifi cant growth and is higher than that at the national level (22%).
Similar to the trends with operating revenue growth, California clinics in the 25th percentile have demonstrated declining annual growth in NPSR, while the lowest quartile of clinics from the national grouping shows mostly small but still positive growth on an annual basis.
CA Community Clinics Net Patient Service Revenue Growth Rate
2005 2006 2007 2008
CA Sample Size n/a 220 212 202
CA 75th Percentile na 22.26% 18.10% 27.12%
CA Median na 8.60% 3.93% 10.10%
CA 25th Percentile na -4.57% -8.18% -0.88%
FY05 FY06 FY07 FY08
National Sample Size 409 367 321 187
National 75th Percentile 27.90% 23.76% 18.17% 21.79%
National Median 13.98% 10.17% 8.14% 9.49%
National 25th Percentile 3.56% 0.86% -0.72% 0.97%
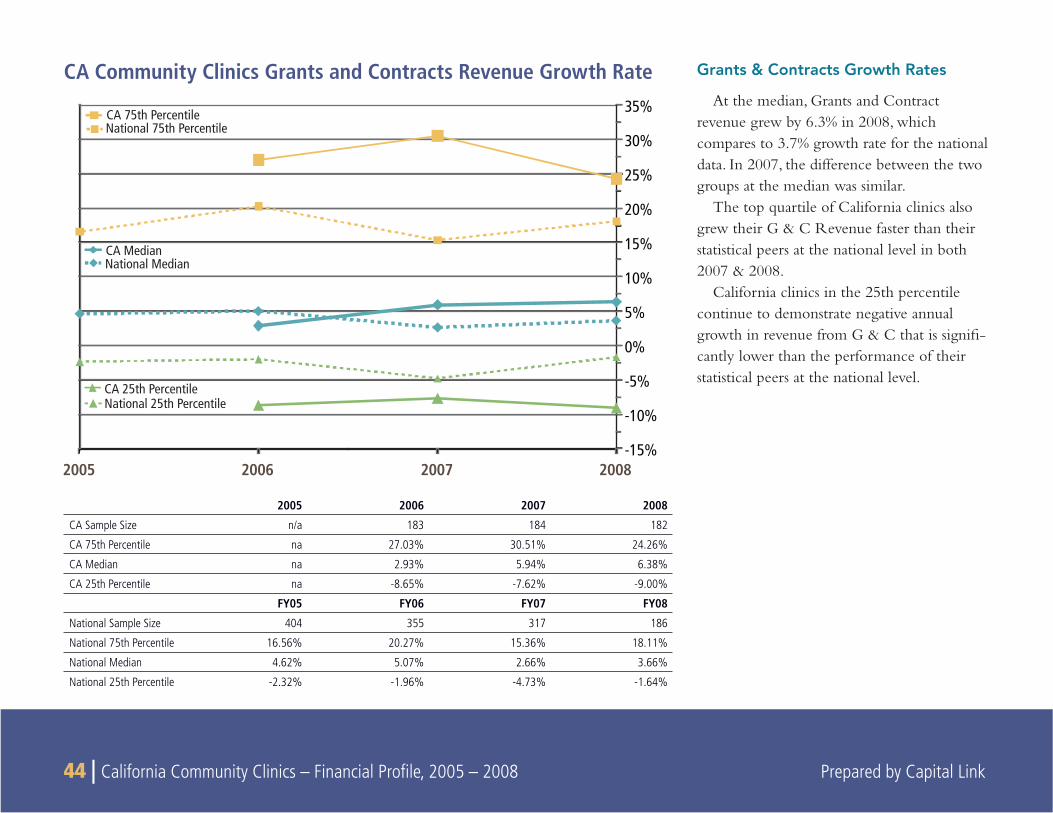
44 | California Community Clinics – Financial Profi le, 2005 – 2008 Prepared by Capital Link
2008200720062005-15%
-10%
-5%
0%
5%
10%
15%
20%
25%
30%
35%CA 75th PercentileNational 75th Percentile
CA MedianNational Median
CA 25th PercentileNational 25th Percentile
CA Community Clinics Grants and Contracts Revenue Growth Rate Grants & Contracts Growth Rates
At the median, Grants and Contract revenue grew by 6.3% in 2008, which compares to 3.7% growth rate for the national data. In 2007, the difference between the two groups at the median was similar.
The top quartile of California clinics also grew their G & C Revenue faster than their statistical peers at the national level in both 2007 & 2008.
California clinics in the 25th percentile continue to demonstrate negative annual growth in revenue from G & C that is signifi -cantly lower than the performance of their statistical peers at the national level.
2005 2006 2007 2008
CA Sample Size n/a 183 184 182
CA 75th Percentile na 27.03% 30.51% 24.26%
CA Median na 2.93% 5.94% 6.38%
CA 25th Percentile na -8.65% -7.62% -9.00%
FY05 FY06 FY07 FY08
National Sample Size 404 355 317 186
National 75th Percentile 16.56% 20.27% 15.36% 18.11%
National Median 4.62% 5.07% 2.66% 3.66%
National 25th Percentile -2.32% -1.96% -4.73% -1.64%
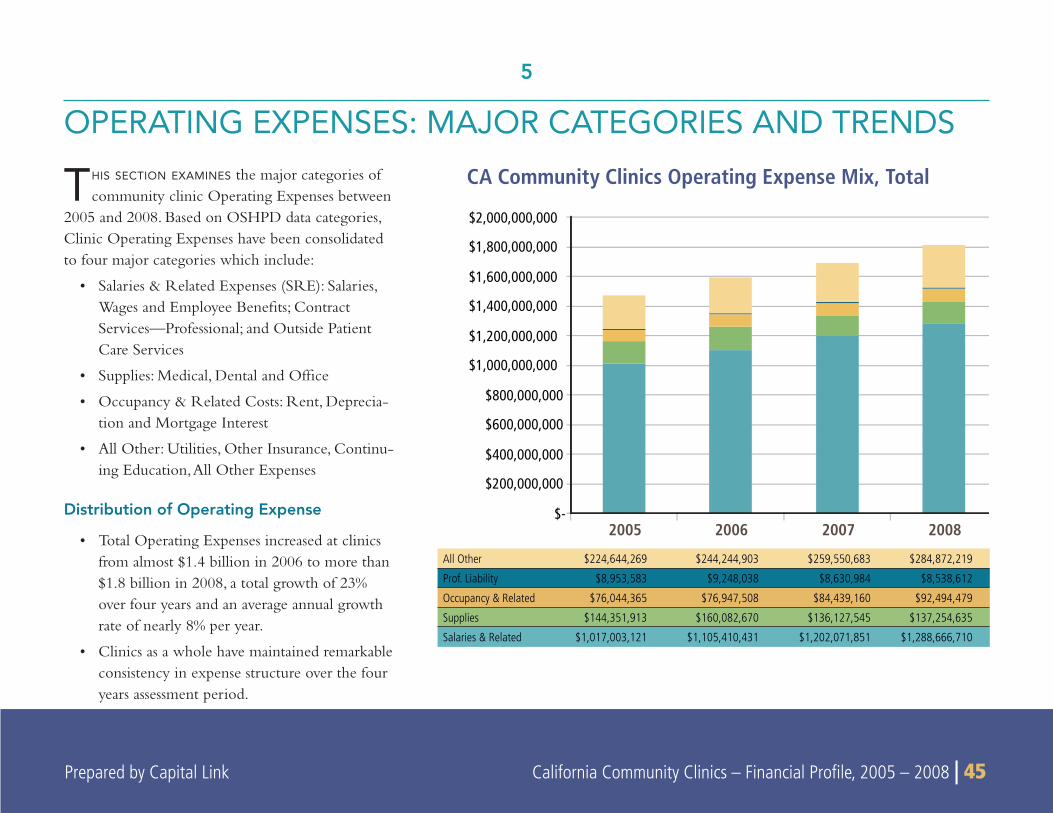
Prepared by Capital Link California Community Clinics – Financial Profi le, 2005 – 2008 | 45 Prepared by Capital Link California Community Clinics – Financial Profi le, 2005 – 2008 | 45
THIS SECTION EXAMINES the major categories of community clinic Operating Expenses between
2005 and 2008. Based on OSHPD data categories, Clinic Operating Expenses have been consolidated to four major categories which include:
Salaries & Related Expenses (SRE): Salaries, • Wages and Employee Benefi ts; Contract Services—Professional; and Outside Patient Care Services
Supplies: Medical, Dental and Offi ce•
Occupancy & Related Costs: Rent, Deprecia-• tion and Mortgage Interest
All Other: Utilities, Other Insurance, Continu-• ing Education, All Other Expenses
Distribution of Operating Expense
Total Operating Expenses increased at clinics • from almost $1.4 billion in 2006 to more than $1.8 billion in 2008, a total growth of 23% over four years and an average annual growth rate of nearly 8% per year.
Clinics as a whole have maintained remarkable • consistency in expense structure over the four years assessment period.
5
OPERATING EXPENSES: MAJOR CATEGORIES AND TRENDS
CA Community Clinics Operating Expense Mix, Total
2005 2006 2007 2008 $-
$200,000,000
$400,000,000
$600,000,000
$800,000,000
$1,000,000,000
$1,200,000,000
$1,400,000,000
$1,600,000,000
$1,800,000,000
$2,000,000,000
All Other $224,644,269 $244,244,903 $259,550,683 $284,872,219
Prof. Liability $8,953,583 $9,248,038 $8,630,984 $8,538,612
Occupancy & Related $76,044,365 $76,947,508 $84,439,160 $92,494,479
Supplies $144,351,913 $160,082,670 $136,127,545 $137,254,635
Salaries & Related $1,017,003,121 $1,105,410,431 $1,202,071,851 $1,288,666,710
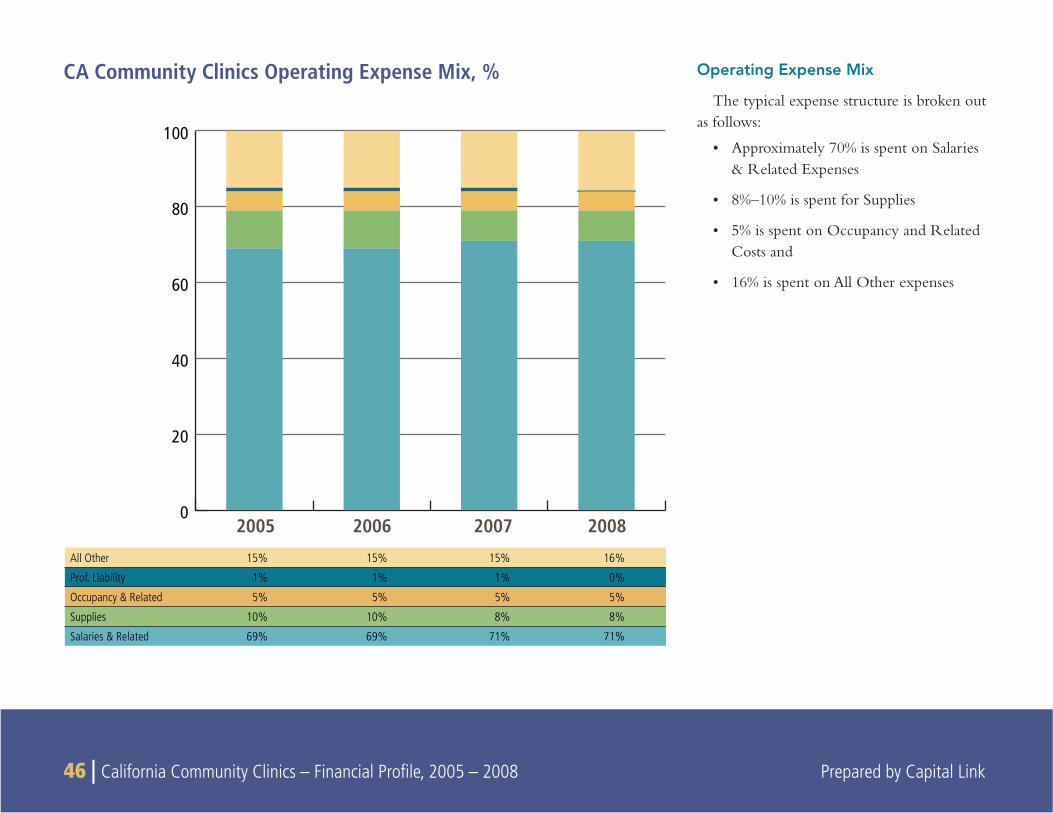
46 | California Community Clinics – Financial Profi le, 2005 – 2008 Prepared by Capital Link
Operating Expense Mix
The typical expense structure is broken out as follows:
Approximately 70% is spent on Salaries • & Related Expenses
8%–10% is spent for Supplies•
5% is spent on Occupancy and Related • Costs and
16% is spent on All Other expenses•
CA Community Clinics Operating Expense Mix, %
2005 2006 2007 20080
20
40
60
80
100
All Other 15% 15% 15% 16%
Prof. Liability 1% 1% 1% 0%
Occupancy & Related 5% 5% 5% 5%
Supplies 10% 10% 8% 8%
Salaries & Related 69% 69% 71% 71%
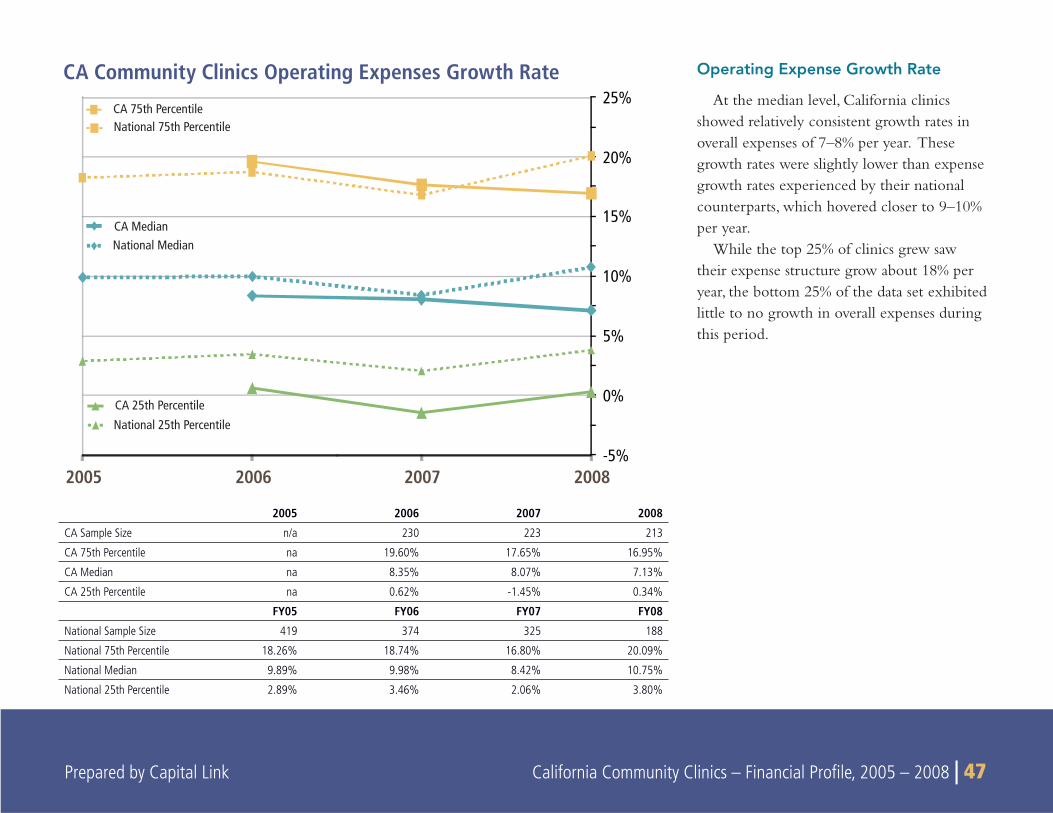
Prepared by Capital Link California Community Clinics – Financial Profi le, 2005 – 2008 | 47
Operating Expense Growth Rate
At the median level, California clinics showed relatively consistent growth rates in overall expenses of 7–8% per year. These growth rates were slightly lower than expense growth rates experienced by their national counterparts, which hovered closer to 9–10% per year.
While the top 25% of clinics grew saw their expense structure grow about 18% per year, the bottom 25% of the data set exhibited little to no growth in overall expenses during this period.
2008200720062005-5%
0%
5%
10%
15%
20%
25%CA 75th PercentileNational 75th Percentile
CA MedianNational Median
CA 25th PercentileNational 25th Percentile
CA Community Clinics Operating Expenses Growth Rate
2005 2006 2007 2008
CA Sample Size n/a 230 223 213
CA 75th Percentile na 19.60% 17.65% 16.95%
CA Median na 8.35% 8.07% 7.13%
CA 25th Percentile na 0.62% -1.45% 0.34%
FY05 FY06 FY07 FY08
National Sample Size 419 374 325 188
National 75th Percentile 18.26% 18.74% 16.80% 20.09%
National Median 9.89% 9.98% 8.42% 10.75%
National 25th Percentile 2.89% 3.46% 2.06% 3.80%
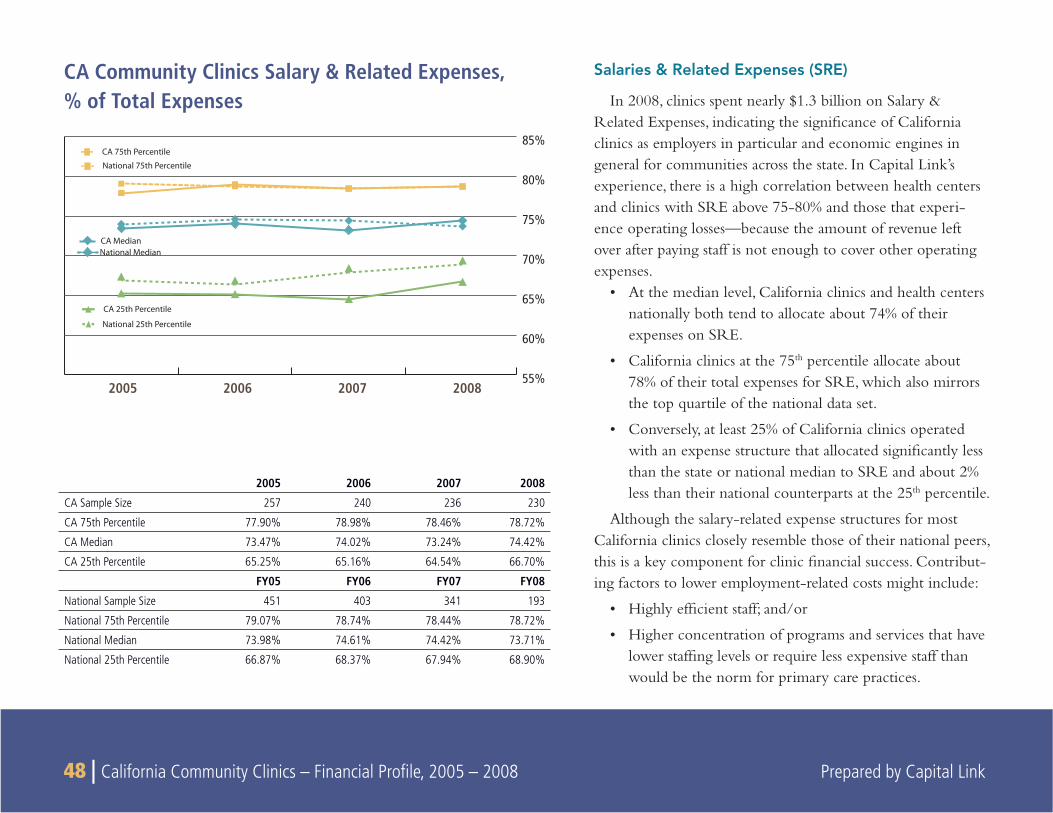
48 | California Community Clinics – Financial Profi le, 2005 – 2008 Prepared by Capital Link
Salaries & Related Expenses (SRE)
In 2008, clinics spent nearly $1.3 billion on Salary & Related Expenses, indicating the signifi cance of California clinics as employers in particular and economic engines in general for communities across the state. In Capital Link’s experience, there is a high correlation between health centers and clinics with SRE above 75-80% and those that experi-ence operating losses—because the amount of revenue left over after paying staff is not enough to cover other operating expenses.
At the median level, California clinics and health centers • nationally both tend to allocate about 74% of their expenses on SRE.
California clinics at the 75• th percentile allocate about 78% of their total expenses for SRE, which also mirrors the top quartile of the national data set.
Conversely, at least 25% of California clinics operated • with an expense structure that allocated signifi cantly less than the state or national median to SRE and about 2% less than their national counterparts at the 25th percentile.
Although the salary-related expense structures for most California clinics closely resemble those of their national peers, this is a key component for clinic fi nancial success. Contribut-ing factors to lower employment-related costs might include:
Highly effi cient staff; and/or•
Higher concentration of programs and services that have • lower staffi ng levels or require less expensive staff than would be the norm for primary care practices.
CA Community Clinics Salary & Related Expenses,% of Total Expenses
2005 2006 2007 2008
CA Sample Size 257 240 236 230
CA 75th Percentile 77.90% 78.98% 78.46% 78.72%
CA Median 73.47% 74.02% 73.24% 74.42%
CA 25th Percentile 65.25% 65.16% 64.54% 66.70%
FY05 FY06 FY07 FY08
National Sample Size 451 403 341 193
National 75th Percentile 79.07% 78.74% 78.44% 78.72%
National Median 73.98% 74.61% 74.42% 73.71%
National 25th Percentile 66.87% 68.37% 67.94% 68.90%
CA 75th PercentileNational 75th Percentile
CA Median
CA 25th Percentile
National 25th Percentile
55%
60%
65%
70%
75%
80%
85%
National Median
2005 2006 2007 2008
Prepared by Capital Link California Community Clinics – Financial Profi le, 2005 – 2008 | 49
SUMMARY
THIS SECTION examines in detail the dynamics of Patient Service Revenue by payor for California community clinics between 2005
and 2008. It covers the following topics:
Changes in the composition of Net Patient Service Revenue by • payor for the clinics
The relationship between Net Patient Service Revenue and • Encounters by payor
Adjustments & Write-offs by payor•
Encounters and Net Revenues and•
Payment Trends per Encounter by payor •
Gross Patient Service Revenue
Gross Patient Service Revenue represents the amount of clinic charges for patient services. Clinics set their charges for the various services they provide theoretically at rates that are high enough to allow them to at least cover their costs. All other things being equal, charges for a given set of patient services should be the same, regardless of payor.
Net Patient Service Revenue
Net Patient Service Revenue (NPSR) represents the amount of revenue that clinics actually collect after taking into account contrac-tual allowances (which are negotiated discounts with individual payors) and other adjustments, including patient deductibles, co-pays, sliding fee discounts, free care and bad debt.
Total clinic Net Patient Service Revenue grew from $950 million • in 2005 to over $1.14 billion in 2008, representing an average annual growth rate of 6.4% during the period.
Totaling almost $806 million in 2008, Medi-Cal predictably • dominated clinic NPSR as well, representing 71% of total clinic NPSR in that year. Representing a growing proportion of NPSR, it provides almost eight times the revenue of the next most important payor, Medicare.
Unlike GPSR, Net Patient Service Revenue per Encounter varies • markedly by payor type, ranging in 2008 from a high of $125.00 per encounter for a Medi-Cal Fee-for-Service visit to a low of $35 for a Self Pay Sliding Fee/Free Care visit for the median clinic.
6
DETAILED ANALYSIS OF PATIENT SERVICE REVENUE BY PAYOR
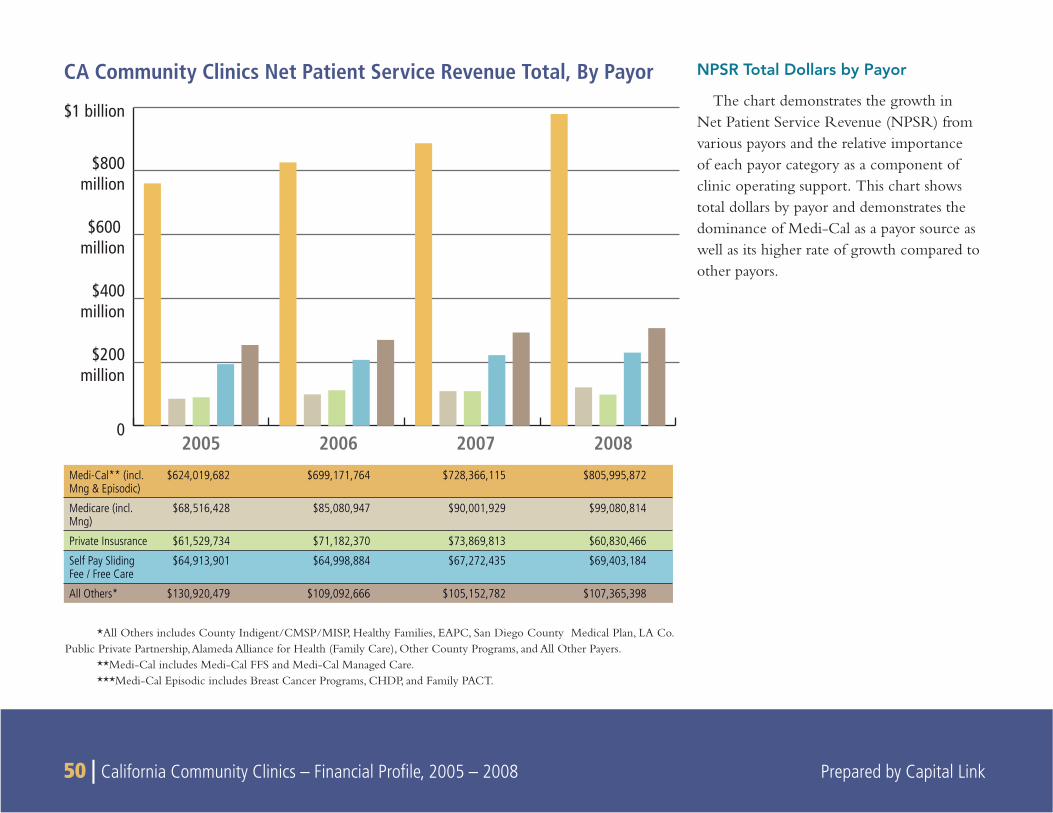
50 | California Community Clinics – Financial Profi le, 2005 – 2008 Prepared by Capital Link
NPSR Total Dollars by Payor
The chart demonstrates the growth in Net Patient Service Revenue (NPSR) from various payors and the relative importance of each payor category as a component of clinic operating support. This chart shows total dollars by payor and demonstrates the dominance of Medi-Cal as a payor source as well as its higher rate of growth compared to other payors.
CA Community Clinics Net Patient Service Revenue Total, By Payor
0
$200million
$400million
$600 million
$800million
$1 billion
2005 2006 2007 2008
Medi-Cal** (incl. Mng & Episodic)
$624,019,682 $699,171,764 $728,366,115 $805,995,872
Medicare (incl. Mng)
$68,516,428 $85,080,947 $90,001,929 $99,080,814
Private Insusrance $61,529,734 $71,182,370 $73,869,813 $60,830,466
Self Pay Sliding Fee / Free Care
$64,913,901 $64,998,884 $67,272,435 $69,403,184
All Others* $130,920,479 $109,092,666 $105,152,782 $107,365,398
*All Others includes County Indigent/CMSP/MISP, Healthy Families, EAPC, San Diego County Medical Plan, LA Co. Public Private Partnership, Alameda Alliance for Health (Family Care), Other County Programs, and All Other Payers.
**Medi-Cal includes Medi-Cal FFS and Medi-Cal Managed Care.***Medi-Cal Episodic includes Breast Cancer Programs, CHDP, and Family PACT.
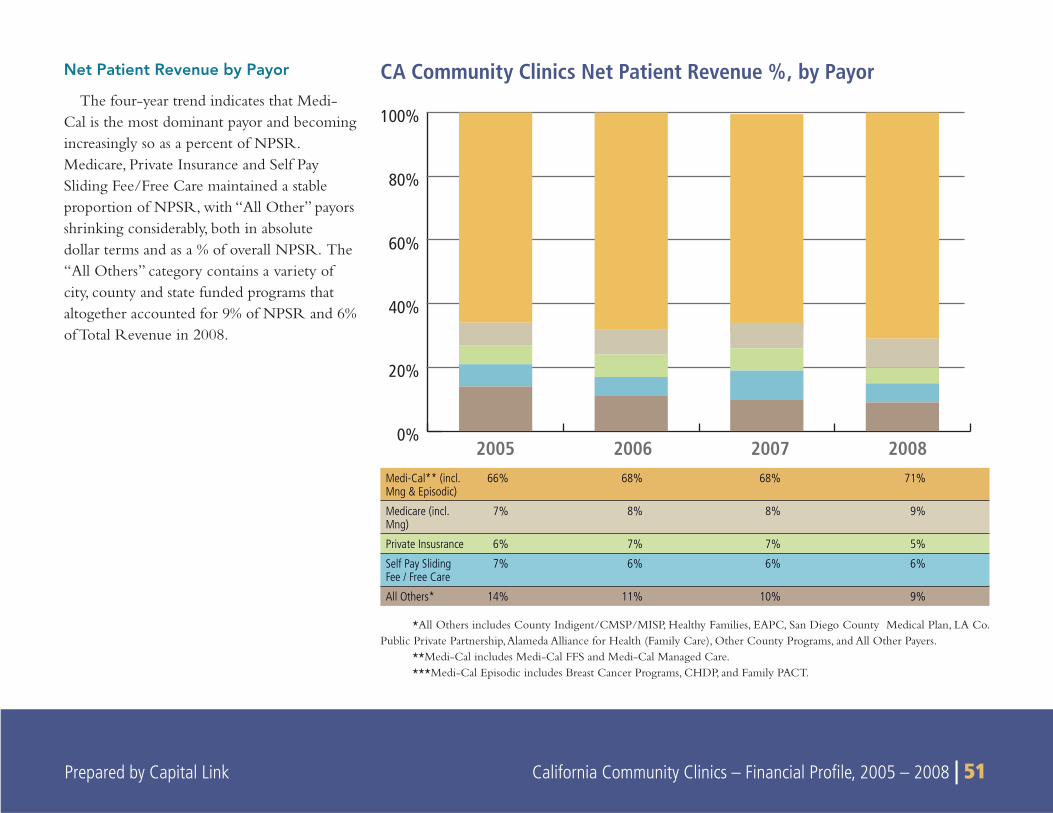
Prepared by Capital Link California Community Clinics – Financial Profi le, 2005 – 2008 | 51
Net Patient Revenue by Payor
The four-year trend indicates that Medi-Cal is the most dominant payor and becoming increasingly so as a percent of NPSR. Medicare, Private Insurance and Self Pay Sliding Fee/Free Care maintained a stable proportion of NPSR, with “All Other” payors shrinking considerably, both in absolute dollar terms and as a % of overall NPSR. The “All Others” category contains a variety of city, county and state funded programs that altogether accounted for 9% of NPSR and 6% of Total Revenue in 2008.
CA Community Clinics Net Patient Revenue %, by Payor
0%
20%
40%
60%
80%
100%
2005 2006 2007 2008Medi-Cal** (incl. Mng & Episodic)
66% 68% 68% 71%
Medicare (incl. Mng)
7% 8% 8% 9%
Private Insusrance 6% 7% 7% 5%
Self Pay Sliding Fee / Free Care
7% 6% 6% 6%
All Others* 14% 11% 10% 9%
*All Others includes County Indigent/CMSP/MISP, Healthy Families, EAPC, San Diego County Medical Plan, LA Co. Public Private Partnership, Alameda Alliance for Health (Family Care), Other County Programs, and All Other Payers.
**Medi-Cal includes Medi-Cal FFS and Medi-Cal Managed Care.***Medi-Cal Episodic includes Breast Cancer Programs, CHDP, and Family PACT.
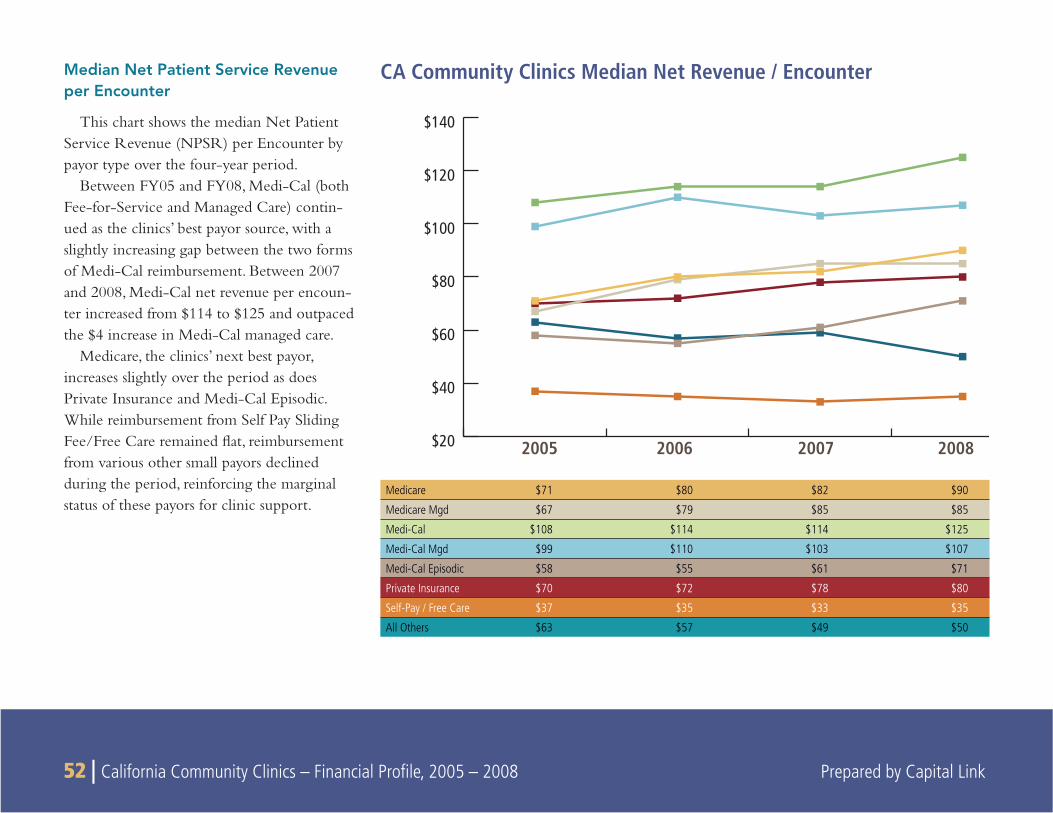
52 | California Community Clinics – Financial Profi le, 2005 – 2008 Prepared by Capital Link
Median Net Patient Service Revenue per Encounter
This chart shows the median Net Patient Service Revenue (NPSR) per Encounter by payor type over the four-year period.
Between FY05 and FY08, Medi-Cal (both Fee-for-Service and Managed Care) contin-ued as the clinics’ best payor source, with a slightly increasing gap between the two forms of Medi-Cal reimbursement. Between 2007 and 2008, Medi-Cal net revenue per encoun-ter increased from $114 to $125 and outpaced the $4 increase in Medi-Cal managed care.
Medicare, the clinics’ next best payor, increases slightly over the period as does Private Insurance and Medi-Cal Episodic. While reimbursement from Self Pay Sliding Fee/Free Care remained fl at, reimbursement from various other small payors declined during the period, reinforcing the marginal status of these payors for clinic support.
CA Community Clinics Median Net Revenue / Encounter
$20
$40
$60
$80
$100
$120
$140
2005 2006 2007 2008
Medicare $71 $80 $82 $90
Medicare Mgd $67 $79 $85 $85
Medi-Cal $108 $114 $114 $125
Medi-Cal Mgd $99 $110 $103 $107
Medi-Cal Episodic $58 $55 $61 $71
Private Insurance $70 $72 $78 $80
Self-Pay / Free Care $37 $35 $33 $35
All Others $63 $57 $49 $50
Prepared by Capital Link California Community Clinics – Financial Profi le, 2005 – 2008 | 53 Prepared by Capital Link California Community Clinics – Financial Profi le, 2005 – 2008 | 53
For the individual payors, we see a number of common trends, including the following:
NPSR per Encounter increased at roughly 5.1% per year on • average for Medi-Cal and 8.2% per year on average for Medicare traditional for the median clinic. These increases were higher than the average California medical infl ation rate over (5%), but were lower than the 7.2% average increase in California health insurance premiums over the same time period.19 This differen-tial partially illustrates the reality that although health insurance premiums are increasing, primary care providers (such as health clinics) are not necessarily seeing the same level of increases in payments that insurance companies are receiving in premium increases from the insurers’ members.
Reimbursement from Medi-Cal for Episodic Care Programs • showed overall improvement during the period. This reimburse-ment declined slightly in 2006 before increasing to $71 per Encounter in 2008.
Private Insurance reimbursement per Encounter increased 4.6% • per year on average for the median clinic. This rise was higher than the average increase in the California medical infl ation rate (5%) and 1.8 times lower than the average rate of health care premium infl ation in California over the period.
Self Pay Sliding Fee/Free Care revenue varied slightly but • remained fl at at $35 per encounter.
Net Revenue per Encounter for the median clinic for “All • Others” payors not only did not keep pace with California
medical infl ation, but either remained fl at or declined precipi-tously over the period. Reimbursement from “All Others” declined from $63 per Encounter in 2005 to $50 per encounter in 2008. Reporting for two programs within “All Others” start-ing in 2006 switched from NPSR to Grants and Contracts, resulting in the reported decline of NPSR revenue from “All Others” but not necessarily a decline in overall revenue.
Adjustments & Write-Offs
The difference between Gross and Net Patient Revenue is expressed as “Adjustments & Write-Offs.” The higher the Adjustments & Write-Offs, the less the clinic actually receives for services rendered. As a consequence, clinics have “good payors”—those who pay a higher percentage of gross charges—and “less good payors”—those for whom the clinic has to write off a relatively larger proportion of the charge.
In 2008, Medi-Cal and Medicare Managed Care had the lowest • amount of Adjustments & Write-Offs and were consequently the clinics’ best payors. It should be noted that there was a signifi cant difference in the adjustments and write-offs for Medicare Fee for Service (20%) and Medicare Managed Care (6%) in 2008.
Self Pay Sliding Fee/Free Care patients predictably had the • largest amount of Adjustments & Write-Offs, as most cannot afford to entirely cover the cost of their care.
From a practical perspective, Net Patient Service Revenue is • a more relevant category of measure and analysis than Gross Patient Service Revenue because it refl ects the reimbursement that clinics actually see.
19California HealthCare Foundation. “California Employer Health Benefi ts Survey”. December 2009, p.10.
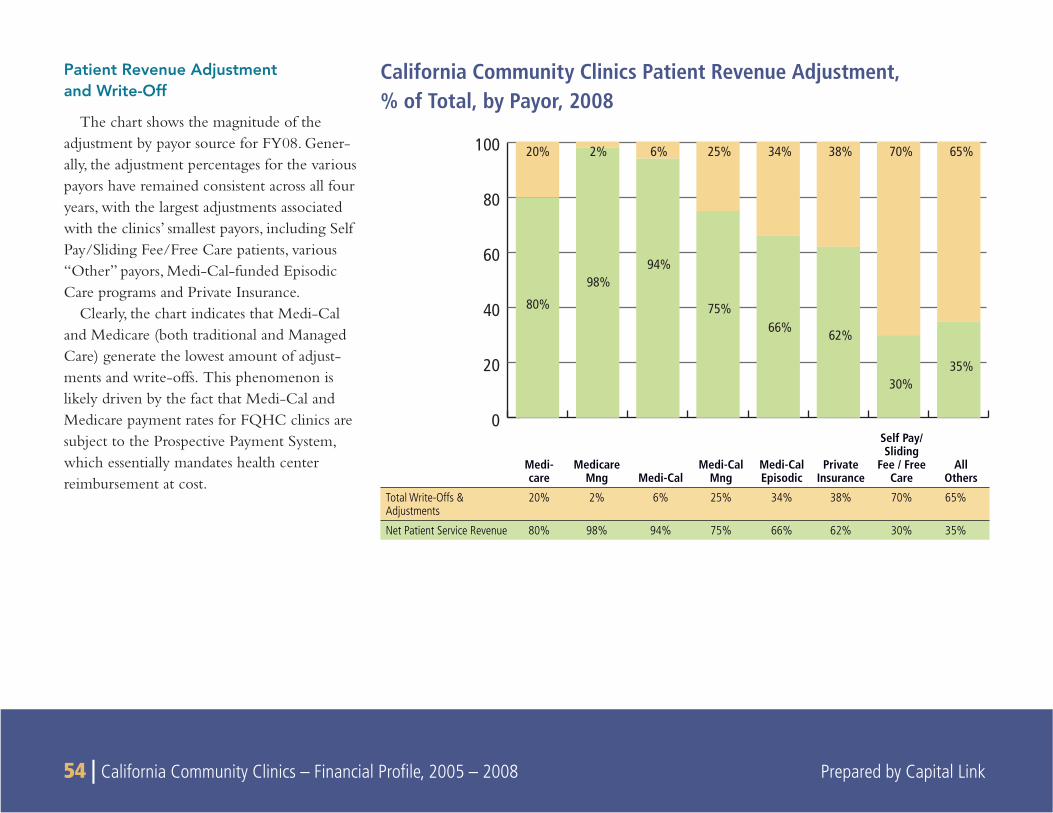
54 | California Community Clinics – Financial Profi le, 2005 – 2008 Prepared by Capital Link
Patient Revenue Adjustmentand Write-Off
The chart shows the magnitude of the adjustment by payor source for FY08. Gener-ally, the adjustment percentages for the various payors have remained consistent across all four years, with the largest adjustments associated with the clinics’ smallest payors, including Self Pay/Sliding Fee/Free Care patients, various “Other” payors, Medi-Cal-funded Episodic Care programs and Private Insurance.
Clearly, the chart indicates that Medi-Cal and Medicare (both traditional and Managed Care) generate the lowest amount of adjust-ments and write-offs. This phenomenon is likely driven by the fact that Medi-Cal and Medicare payment rates for FQHC clinics are subject to the Prospective Payment System, which essentially mandates health center reimbursement at cost.
California Community Clinics Patient Revenue Adjustment, % of Total, by Payor, 2008
0
20
40
60
80
100 20% 2% 6% 25% 34% 38% 70% 65%
80%
98%94%
75%66% 62%
30%35%
Medi-care
Medicare Mng Medi-Cal
Medi-Cal Mng
Medi-Cal Episodic
Private Insurance
Self Pay/ Sliding
Fee / Free Care
All Others
Total Write-Offs & Adjustments
20% 2% 6% 25% 34% 38% 70% 65%
Net Patient Service Revenue 80% 98% 94% 75% 66% 62% 30% 35%
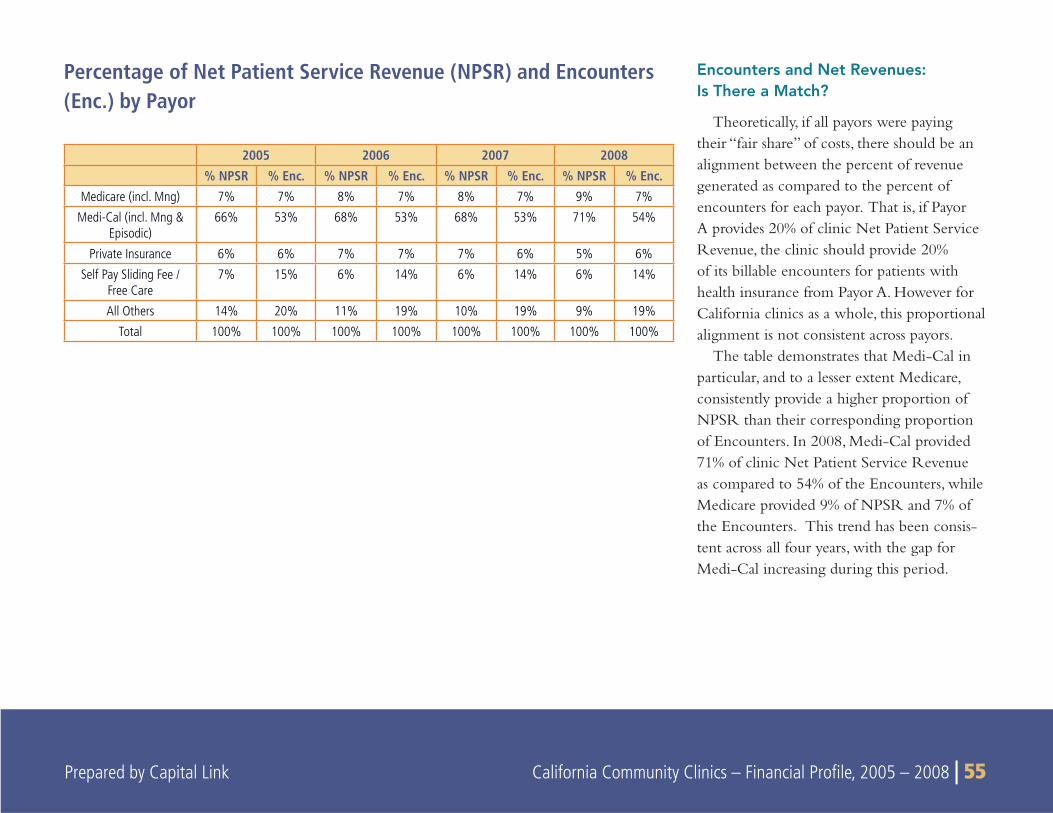
Prepared by Capital Link California Community Clinics – Financial Profi le, 2005 – 2008 | 55
Encounters and Net Revenues:Is There a Match?
Theoretically, if all payors were paying their “fair share” of costs, there should be an alignment between the percent of revenue generated as compared to the percent of encounters for each payor. That is, if Payor A provides 20% of clinic Net Patient Service Revenue, the clinic should provide 20% of its billable encounters for patients with health insurance from Payor A. However for California clinics as a whole, this proportional alignment is not consistent across payors.
The table demonstrates that Medi-Cal in particular, and to a lesser extent Medicare, consistently provide a higher proportion of NPSR than their corresponding proportion of Encounters. In 2008, Medi-Cal provided 71% of clinic Net Patient Service Revenue as compared to 54% of the Encounters, while Medicare provided 9% of NPSR and 7% of the Encounters. This trend has been consis-tent across all four years, with the gap for Medi-Cal increasing during this period.
Percentage of Net Patient Service Revenue (NPSR) and Encounters (Enc.) by Payor
2005 2006 2007 2008% NPSR % Enc. % NPSR % Enc. % NPSR % Enc. % NPSR % Enc.
Medicare (incl. Mng) 7% 7% 8% 7% 8% 7% 9% 7%
Medi-Cal (incl. Mng & Episodic)
66% 53% 68% 53% 68% 53% 71% 54%
Private Insurance 6% 6% 7% 7% 7% 6% 5% 6%
Self Pay Sliding Fee / Free Care
7% 15% 6% 14% 6% 14% 6% 14%
All Others 14% 20% 11% 19% 10% 19% 9% 19%
Total 100% 100% 100% 100% 100% 100% 100% 100%
56 | California Community Clinics – Financial Profi le, 2005 – 2008 Prepared by Capital Link
Private Insurance NPSR and Encounters match consistently • across the four years, with 5% – 7% of NPSR and Encounters in each year.
As we would expect, there is a signifi cant mismatch for Self Pay • Sliding Fee / Free Care patients, who are able to provide only 6% of net revenues, though they generate 14% of encounters.
The gap for “All Others” is similarly large,• with these payors providing 9 – 14% of net revenues but generating 19 – 20% of encounters.
It would appear from the data that Medi-Cal reimbursement • is effectively subsidizing the visits generated by other payors, particularly those in the “All Others” and Self Pay/Sliding Fee/Free Care categories. To a slight extent, Medicare is also provid-ing a small subsidy. For both Medi-Cal and Medicare, the payors provide a greater percentage of total revenue in relation to the
percentage of their encounters to the total. However, this result may be at least partially attributed to how revenue that supports visits from “All Others” is reported in OSHPD, i.e. some of these revenues may be reported as Net Patient Service Revenue while in other instances it may be reported as revenue supported by Grants and Contracts.
In any case, this analysis certainly does not imply that Medi-Cal is “overpaying” for care, though it may suggest that other payors may be paying too little. It may also be that revenue from “Other” payors is inconsistently reported by clinics to OSHPD, contributing to the apparent imbalance. It’s important to remember that Net Patient Service Revenue (of which Medi-Cal is a part) only covers about 2/3
of clinic costs with revenue from Grants and Contract sources fi lling in the rest. Together these sources allow approximately 75% of clinics to break even or operate with small positive margins, while the other 25% lose money on an operating basis.
20“All Others” includes the following OSHPD categories: County Indigent/CMSP/MISP, Healthy Families, EAPC, San Diego County Medical Plan, LA Co. Public Private Partnership, Alameda Alliance for Health (Family Care), Other County Programs, and All Other Payers.
Prepared by Capital Link California Community Clinics – Financial Profi le, 2005 – 2008 | 57
SUMMARY
THIS SECTION EXAMINES key fi nancial ratios and measures to assess the fi nancial health of the California comprehensive primary care
community clinic system between 2005 and 2008. While there are many types of ratios and measures that lenders and other funders use to assess fi nancial health (a number of which are evaluated elsewhere in this document), the following represent those fi nancial measures most commonly used.21
Operating Margin•
Bottom Line Margin•
Days Unrestricted Cash on Hand•
Days in Patient Accounts Receivable•
Days in All Accounts Receivable•
Leverage Ratio•
An evaluation of trends in these ratios and measures from 2005 through 2008 suggests that there has been some improvement in the California clinic system. Averages of Operating Margins, Days Cash on Hand, and Days in Accounts Receivables have shown improving trends for all the categories of community clinics. However, the California clinic system as a whole is still somewhat fi nancially vulnerable and continues to be stratifi ed in terms of fi nancial strength. While the data shows that approximately 25% of the clinics at any given time are in relatively healthy fi nancial shape, another 25% continue to be in danger of fi nancial failure. The remaining 50% in the middle tiers are improving and appear to be consolidating their fi nancial position, but still remain vulnerable to fi nancial downturns.
The following sections highlight the more notable fi nancial trends as determined by these measures.
7
KEY FINANCIAL RATIOS AND MEASURES
21All ratios and trends for California clinics in this chapter are calculated based on IRS Form 990 data, while national data was calculated based upon audited fi nancials.
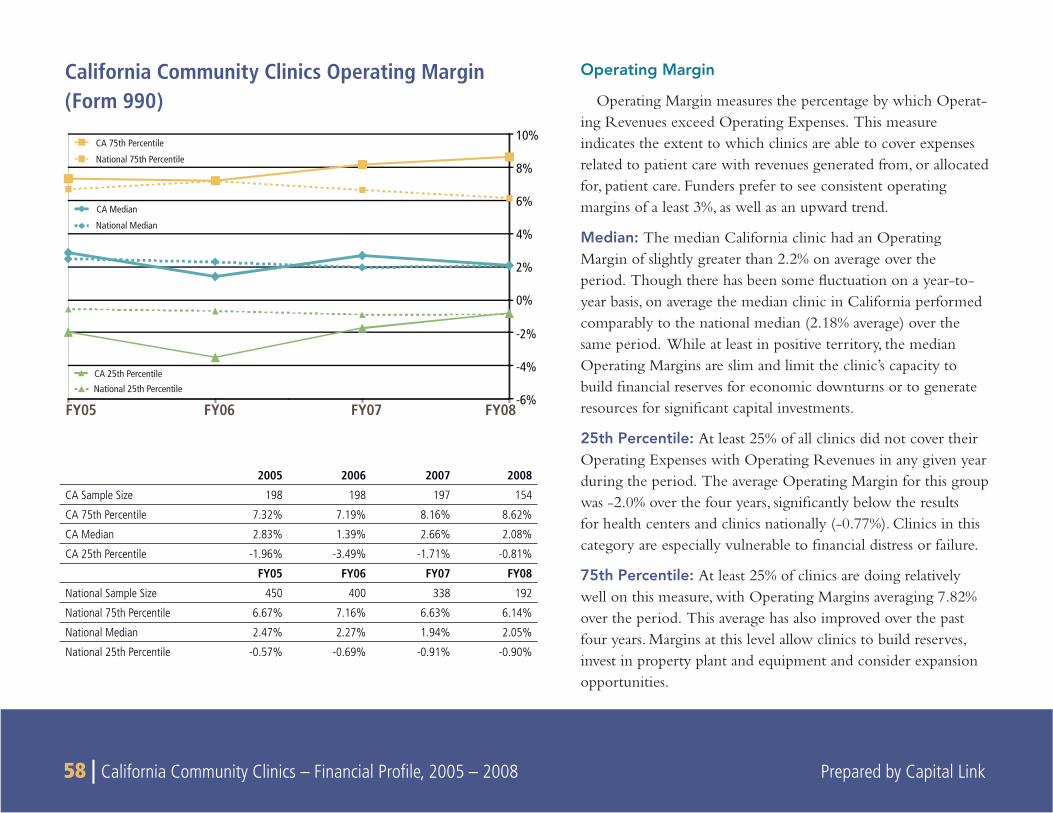
58 | California Community Clinics – Financial Profi le, 2005 – 2008 Prepared by Capital Link
Operating Margin
Operating Margin measures the percentage by which Operat-ing Revenues exceed Operating Expenses. This measure indicates the extent to which clinics are able to cover expenses related to patient care with revenues generated from, or allocated for, patient care. Funders prefer to see consistent operating margins of a least 3%, as well as an upward trend.
Median: The median California clinic had an Operating Margin of slightly greater than 2.2% on average over the period. Though there has been some fl uctuation on a year-to-year basis, on average the median clinic in California performed comparably to the national median (2.18% average) over the same period. While at least in positive territory, the median Operating Margins are slim and limit the clinic’s capacity to build fi nancial reserves for economic downturns or to generate resources for signifi cant capital investments.
25th Percentile: At least 25% of all clinics did not cover their Operating Expenses with Operating Revenues in any given year during the period. The average Operating Margin for this group was -2.0% over the four years, signifi cantly below the results for health centers and clinics nationally (-0.77%). Clinics in this category are especially vulnerable to fi nancial distress or failure.
75th Percentile: At least 25% of clinics are doing relatively well on this measure, with Operating Margins averaging 7.82% over the period. This average has also improved over the past four years. Margins at this level allow clinics to build reserves, invest in property plant and equipment and consider expansion opportunities.
California Community Clinics Operating Margin (Form 990)
2005 2006 2007 2008
CA Sample Size 198 198 197 154
CA 75th Percentile 7.32% 7.19% 8.16% 8.62%
CA Median 2.83% 1.39% 2.66% 2.08%
CA 25th Percentile -1.96% -3.49% -1.71% -0.81%
FY05 FY06 FY07 FY08
National Sample Size 450 400 338 192
National 75th Percentile 6.67% 7.16% 6.63% 6.14%
National Median 2.47% 2.27% 1.94% 2.05%
National 25th Percentile -0.57% -0.69% -0.91% -0.90%
FY08FY07FY06FY05-6%
-4%
-2%
0%
2%
4%
6%
8%
10%
CA 75th Percentile
National 75th Percentile
CA Median
National Median
CA 25th Percentile
National 25th Percentile
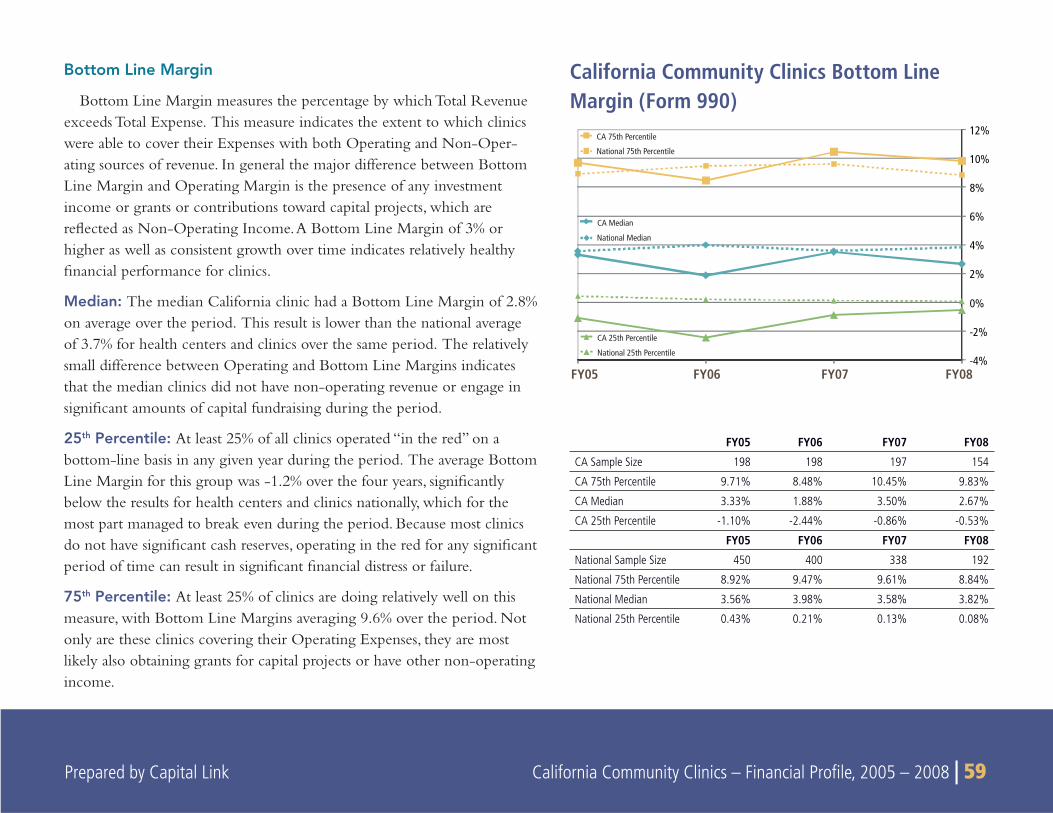
Prepared by Capital Link California Community Clinics – Financial Profi le, 2005 – 2008 | 59
FY08FY07FY06FY05-4%
-2%
0%
2%
4%
6%
8%
10%
12%
CA 75th Percentile
National 75th Percentile
CA Median
National Median
CA 25th Percentile
National 25th Percentile
Bottom Line Margin
Bottom Line Margin measures the percentage by which Total Revenue exceeds Total Expense. This measure indicates the extent to which clinics were able to cover their Expenses with both Operating and Non-Oper-ating sources of revenue. In general the major difference between Bottom Line Margin and Operating Margin is the presence of any investment income or grants or contributions toward capital projects, which are refl ected as Non-Operating Income. A Bottom Line Margin of 3% or higher as well as consistent growth over time indicates relatively healthy fi nancial performance for clinics.
Median: The median California clinic had a Bottom Line Margin of 2.8% on average over the period. This result is lower than the national average of 3.7% for health centers and clinics over the same period. The relatively small difference between Operating and Bottom Line Margins indicates that the median clinics did not have non-operating revenue or engage in signifi cant amounts of capital fundraising during the period.
25th Percentile: At least 25% of all clinics operated “in the red” on a bottom-line basis in any given year during the period. The average Bottom Line Margin for this group was -1.2% over the four years, signifi cantly below the results for health centers and clinics nationally, which for the most part managed to break even during the period. Because most clinics do not have signifi cant cash reserves, operating in the red for any signifi cant period of time can result in signifi cant fi nancial distress or failure.
75th Percentile: At least 25% of clinics are doing relatively well on this measure, with Bottom Line Margins averaging 9.6% over the period. Not only are these clinics covering their Operating Expenses, they are most likely also obtaining grants for capital projects or have other non-operating income.
California Community Clinics Bottom Line Margin (Form 990)
FY05 FY06 FY07 FY08
CA Sample Size 198 198 197 154
CA 75th Percentile 9.71% 8.48% 10.45% 9.83%
CA Median 3.33% 1.88% 3.50% 2.67%
CA 25th Percentile -1.10% -2.44% -0.86% -0.53%
FY05 FY06 FY07 FY08
National Sample Size 450 400 338 192
National 75th Percentile 8.92% 9.47% 9.61% 8.84%
National Median 3.56% 3.98% 3.58% 3.82%
National 25th Percentile 0.43% 0.21% 0.13% 0.08%
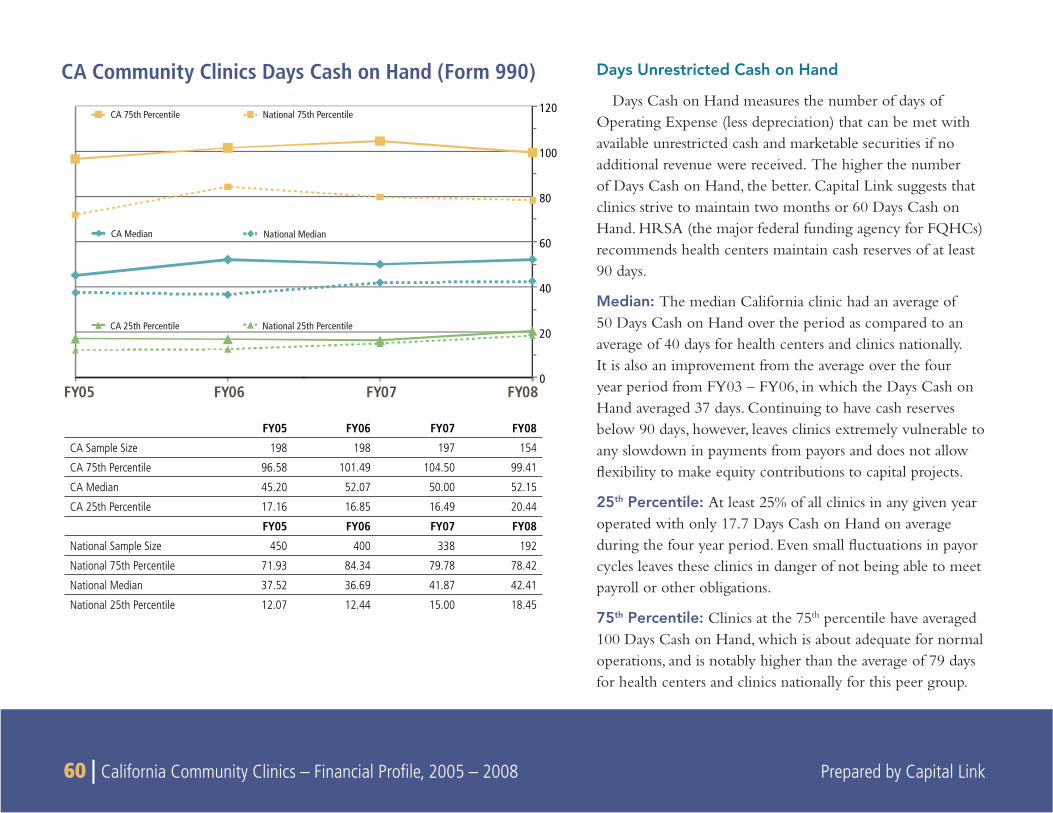
60 | California Community Clinics – Financial Profi le, 2005 – 2008 Prepared by Capital Link
Days Unrestricted Cash on Hand
Days Cash on Hand measures the number of days of Operating Expense (less depreciation) that can be met with available unrestricted cash and marketable securities if no additional revenue were received. The higher the number of Days Cash on Hand, the better. Capital Link suggests that clinics strive to maintain two months or 60 Days Cash on Hand. HRSA (the major federal funding agency for FQHCs) recommends health centers maintain cash reserves of at least 90 days.
Median: The median California clinic had an average of 50 Days Cash on Hand over the period as compared to an average of 40 days for health centers and clinics nationally. It is also an improvement from the average over the four year period from FY03 – FY06, in which the Days Cash on Hand averaged 37 days. Continuing to have cash reserves below 90 days, however, leaves clinics extremely vulnerable to any slowdown in payments from payors and does not allow fl exibility to make equity contributions to capital projects.
25th Percentile: At least 25% of all clinics in any given year operated with only 17.7 Days Cash on Hand on average during the four year period. Even small fl uctuations in payor cycles leaves these clinics in danger of not being able to meet payroll or other obligations.
75th Percentile: Clinics at the 75th percentile have averaged 100 Days Cash on Hand, which is about adequate for normal operations, and is notably higher than the average of 79 days for health centers and clinics nationally for this peer group.
CA Community Clinics Days Cash on Hand (Form 990)
FY05 FY06 FY07 FY08
CA Sample Size 198 198 197 154
CA 75th Percentile 96.58 101.49 104.50 99.41
CA Median 45.20 52.07 50.00 52.15
CA 25th Percentile 17.16 16.85 16.49 20.44
FY05 FY06 FY07 FY08
National Sample Size 450 400 338 192
National 75th Percentile 71.93 84.34 79.78 78.42
National Median 37.52 36.69 41.87 42.41
National 25th Percentile 12.07 12.44 15.00 18.45
FY08FY07FY06FY050
20
40
60
80
100
120
CA 75th Percentile National 75th Percentile
CA Median National Median
CA 25th Percentile National 25th Percentile
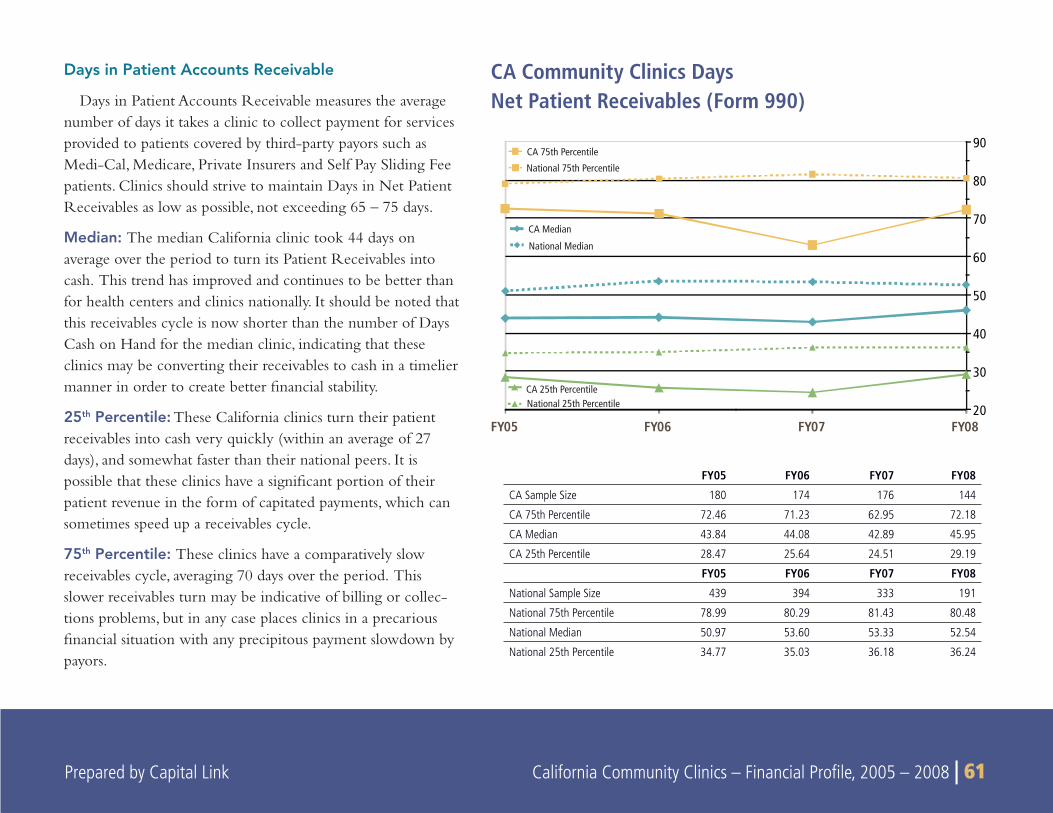
Prepared by Capital Link California Community Clinics – Financial Profi le, 2005 – 2008 | 61 Prepared by Capital Link California Community Clinics – Financial Profi le, 2005 – 2008 | 61
Days in Patient Accounts Receivable
Days in Patient Accounts Receivable measures the average number of days it takes a clinic to collect payment for services provided to patients covered by third-party payors such as Medi-Cal, Medicare, Private Insurers and Self Pay Sliding Fee patients. Clinics should strive to maintain Days in Net Patient Receivables as low as possible, not exceeding 65 – 75 days.
Median: The median California clinic took 44 days on average over the period to turn its Patient Receivables into cash. This trend has improved and continues to be better than for health centers and clinics nationally. It should be noted that this receivables cycle is now shorter than the number of Days Cash on Hand for the median clinic, indicating that these clinics may be converting their receivables to cash in a timelier manner in order to create better fi nancial stability.
25th Percentile: These California clinics turn their patient receivables into cash very quickly (within an average of 27 days), and somewhat faster than their national peers. It is possible that these clinics have a signifi cant portion of their patient revenue in the form of capitated payments, which can sometimes speed up a receivables cycle.
75th Percentile: These clinics have a comparatively slow receivables cycle, averaging 70 days over the period. This slower receivables turn may be indicative of billing or collec-tions problems, but in any case places clinics in a precarious fi nancial situation with any precipitous payment slowdown by payors.
CA Community Clinics Days Net Patient Receivables (Form 990)
FY05 FY06 FY07 FY08
CA Sample Size 180 174 176 144
CA 75th Percentile 72.46 71.23 62.95 72.18
CA Median 43.84 44.08 42.89 45.95
CA 25th Percentile 28.47 25.64 24.51 29.19
FY05 FY06 FY07 FY08
National Sample Size 439 394 333 191
National 75th Percentile 78.99 80.29 81.43 80.48
National Median 50.97 53.60 53.33 52.54
National 25th Percentile 34.77 35.03 36.18 36.24
FY08FY07FY06FY0520
30
40
50
60
70
80
90
CA 75th Percentile
National 75th Percentile
CA Median
National Median
CA 25th PercentileNational 25th Percentile
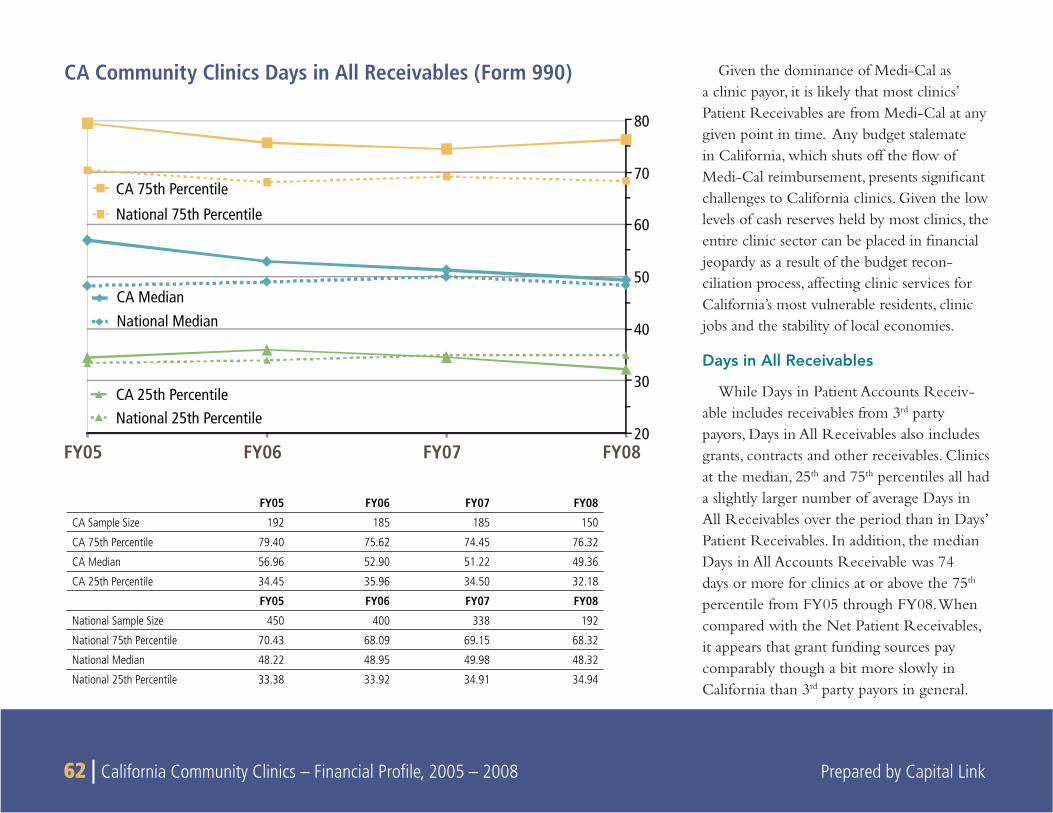
62 | California Community Clinics – Financial Profi le, 2005 – 2008 Prepared by Capital Link
Given the dominance of Medi-Cal as a clinic payor, it is likely that most clinics’ Patient Receivables are from Medi-Cal at any given point in time. Any budget stalemate in California, which shuts off the fl ow of Medi-Cal reimbursement, presents signifi cant challenges to California clinics. Given the low levels of cash reserves held by most clinics, the entire clinic sector can be placed in fi nancial jeopardy as a result of the budget recon-ciliation process, affecting clinic services for California’s most vulnerable residents, clinic jobs and the stability of local economies.
Days in All Receivables
While Days in Patient Accounts Receiv-able includes receivables from 3rd party payors, Days in All Receivables also includes grants, contracts and other receivables. Clinics at the median, 25th and 75th percentiles all had a slightly larger number of average Days in All Receivables over the period than in Days’ Patient Receivables. In addition, the median Days in All Accounts Receivable was 74 days or more for clinics at or above the 75th percentile from FY05 through FY08. When compared with the Net Patient Receivables, it appears that grant funding sources pay comparably though a bit more slowly in California than 3rd party payors in general.
CA Community Clinics Days in All Receivables (Form 990)
FY05 FY06 FY07 FY08
CA Sample Size 192 185 185 150
CA 75th Percentile 79.40 75.62 74.45 76.32
CA Median 56.96 52.90 51.22 49.36
CA 25th Percentile 34.45 35.96 34.50 32.18
FY05 FY06 FY07 FY08
National Sample Size 450 400 338 192
National 75th Percentile 70.43 68.09 69.15 68.32
National Median 48.22 48.95 49.98 48.32
National 25th Percentile 33.38 33.92 34.91 34.94
FY08FY07FY06FY0520
30
40
50
60
70
80
CA 75th Percentile
National 75th Percentile
CA 25th PercentileNational 25th Percentile
CA MedianNational Median
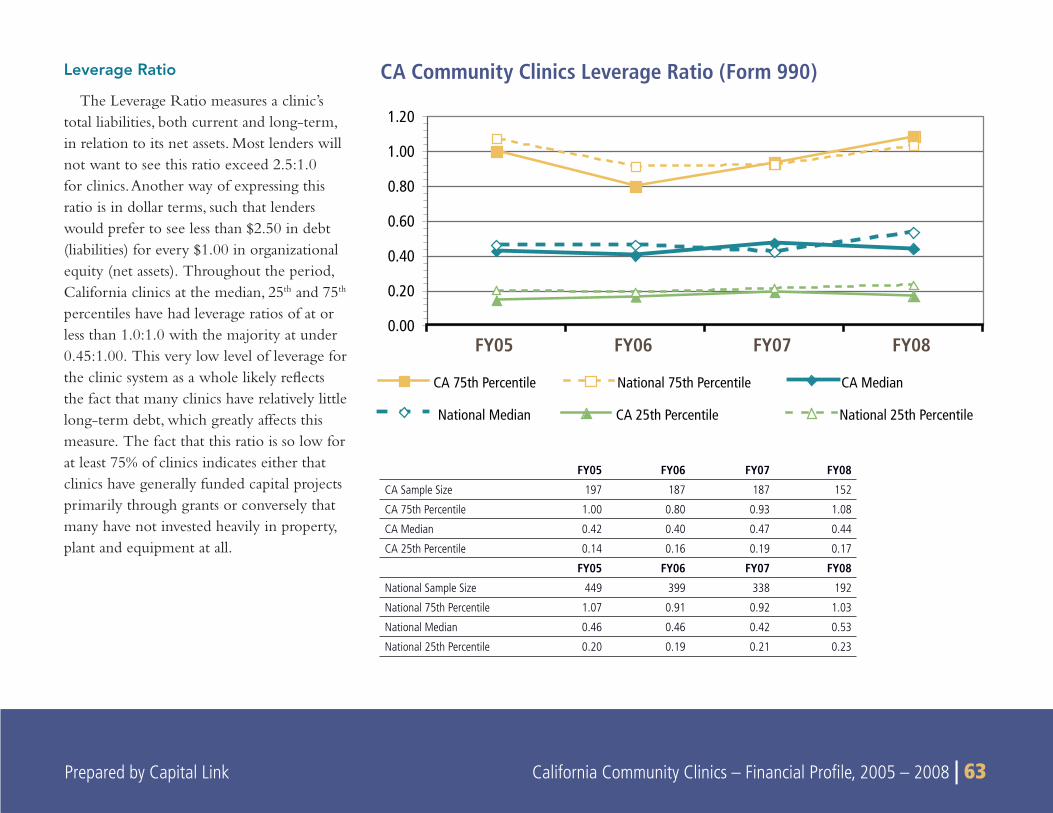
Prepared by Capital Link California Community Clinics – Financial Profi le, 2005 – 2008 | 63 Prepared by Capital Link California Community Clinics – Financial Profi le, 2005 – 2008 | 63
Leverage Ratio
The Leverage Ratio measures a clinic’s total liabilities, both current and long-term, in relation to its net assets. Most lenders will not want to see this ratio exceed 2.5:1.0 for clinics. Another way of expressing this ratio is in dollar terms, such that lenders would prefer to see less than $2.50 in debt (liabilities) for every $1.00 in organizational equity (net assets). Throughout the period, California clinics at the median, 25th and 75th percentiles have had leverage ratios of at or less than 1.0:1.0 with the majority at under 0.45:1.00. This very low level of leverage for the clinic system as a whole likely refl ects the fact that many clinics have relatively little long-term debt, which greatly affects this measure. The fact that this ratio is so low for at least 75% of clinics indicates either that clinics have generally funded capital projects primarily through grants or conversely that many have not invested heavily in property, plant and equipment at all.
CA Community Clinics Leverage Ratio (Form 990)
FY05 FY06 FY07 FY08
CA Sample Size 197 187 187 152
CA 75th Percentile 1.00 0.80 0.93 1.08
CA Median 0.42 0.40 0.47 0.44
CA 25th Percentile 0.14 0.16 0.19 0.17
FY05 FY06 FY07 FY08
National Sample Size 449 399 338 192
National 75th Percentile 1.07 0.91 0.92 1.03
National Median 0.46 0.46 0.42 0.53
National 25th Percentile 0.20 0.19 0.21 0.23
0.00
0.20
0.40
0.60
0.80
1.00
1.20
FY08FY07FY06FY05
CA 75th Percentile National 75th Percentile CA Median
National Median CA 25th Percentile National 25th Percentile
64 | California Community Clinics – Financial Profi le, 2005 – 2008 Prepared by Capital Link
California clinics maintained a very low median Leverage Ratio • over the entire period, with values ranging between 0.42 (FY05) and 0.47 (FY07).
The Leverage Ratio for California clinics was lower than • comparative national values at all levels (75th percentile, median, and 25th percentile) and in each year of the period, with the exception of the 75th percentile only in FY08.
Except with at the 75• th percentile in FY08, the Leverage Ratio for California clinics did not exceed 1.0 over the 4-year period in all percentiles.
While it is certainly true that a signifi cant portion of the clinic system may have been too fi nancially weak to qualify for loans for major capital projects during the four-year period under review, at least 25% of clinics were relatively strong fi nancially and even more would be able to demonstrate suffi cient cash fl ow capacity to support more long-term debt than they carry on their books. Clearly other factors besides debt capacity ultimately drive the low leverage positions of clinics across the state, some of which may include:
Reticence of banks and other lenders to make loans to clinics;•
The relative availability of grant dollars to support capital • projects;
Debt aversion on the part of clinic Boards and Management; • and/or
Lack of borrowing history and/or familiarity with existing loan • programs.
Prepared by Capital Link California Community Clinics – Financial Profi le, 2005 – 2008 | 65 Prepared by Capital Link California Community Clinics – Financial Profi le, 2005 – 2008 | 65
SUMMARY
This section assesses the fi nancial profi le of clinics by revenue level using data from both IRS Form 990 reports and OSHPD reports.
OSHPD reports only include fi nancial information and operating revenue relating to primary care services, whereas the IRS Form 990 data includes fi nancial information reported at the parent organiza-tion level, which may also include data from non-primary care clinic services.
The clinics were divided into four groups by total annual revenue size as follows:
Smallest: Under $2 million in annual revenuesSmall: Between $2 to $5 million in annual revenuesMedium: Between $5 and $15 million in annual revenueLarge: Over $15 million in annual revenue
Key Findings
Large clinics are more likely to experience greater revenue • stability.
There is a direct relationship between Net Patient Service • Revenue (NPSR) per encounter and clinic size. The larger the clinic, the more NPSR per encounter, resulting in stron-ger operating and bottom line margins for larger clinics in all quartiles.
In 2008, the median NPSR per Primary Care Provider for Large • clinics was nearly three times more than the median ratio for the Smallest clinics ($359,000 vs. $121,000).
Bottom line performance is more stratifi ed for smaller clinics. • The smaller the clinic, the more likely it is to experience variability in bottom line performance in both the positive and negative direction.
In general, the bottom 25% of clinics in each size category lose • money with the exception of Large clinics.
Within each group, the top 75% are very profi table on a bottom • line basis.
Large clinics are more reliant on NPSR. Large clinics (>$15 • million) earned 70% of their operating revenues from NPSR while clinics in the other three revenue categories earned between 52-55% of total operating revenues from NPSR.
The smaller the clinic, the greater the dependence on contribu-• tions and fundraising income. The Smallest clinics earned the largest share of Operating Revenues from contributions and fundraising (16%), while Large clinics earned the least share (5%). On the other hand, the total amount reported as Fundraising Income by Large clinics in 2008 ($48 million) was almost four times as much as the Smallest clinics ($12.5 million).
8
SUBGROUP ANALYSIS: COMPARISON BY CLINIC REVENUE SIZE
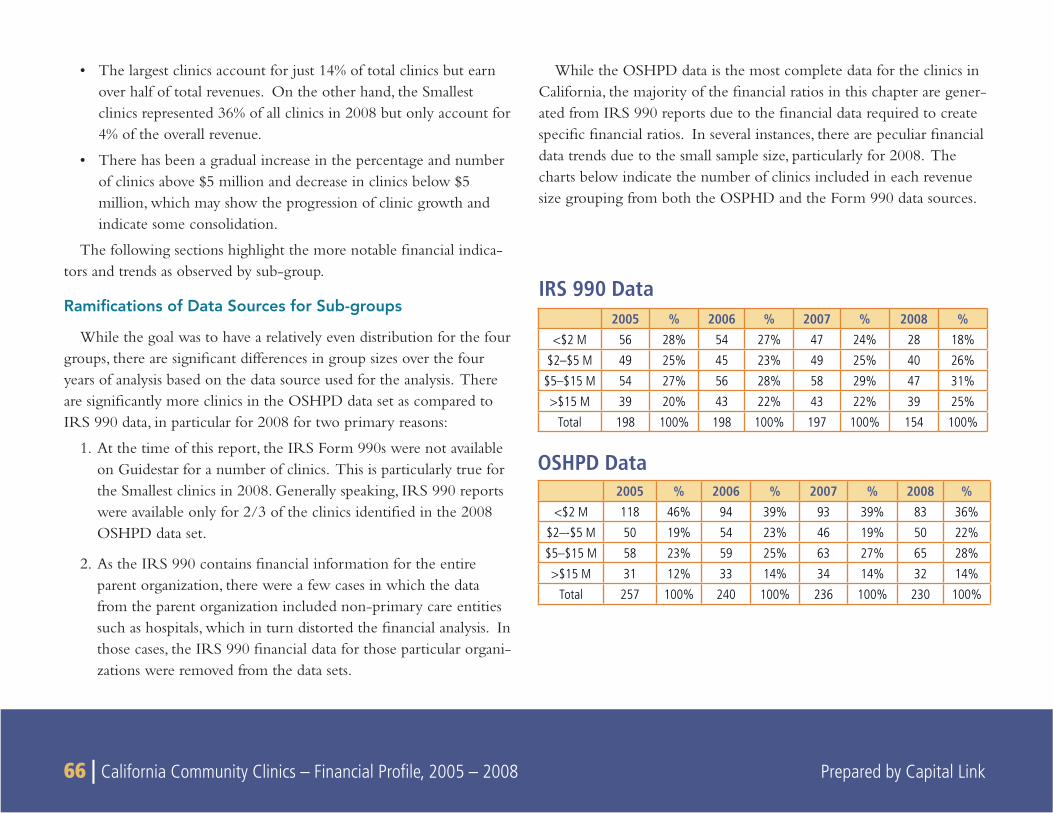
66 | California Community Clinics – Financial Profi le, 2005 – 2008 Prepared by Capital Link
The largest clinics account for just 14% of total clinics but earn • over half of total revenues. On the other hand, the Smallest clinics represented 36% of all clinics in 2008 but only account for 4% of the overall revenue.
There has been a gradual increase in the percentage and number • of clinics above $5 million and decrease in clinics below $5 million, which may show the progression of clinic growth and indicate some consolidation.
The following sections highlight the more notable fi nancial indica-tors and trends as observed by sub-group.
Ramifi cations of Data Sources for Sub-groups
While the goal was to have a relatively even distribution for the four groups, there are signifi cant differences in group sizes over the four years of analysis based on the data source used for the analysis. There are signifi cantly more clinics in the OSHPD data set as compared to IRS 990 data, in particular for 2008 for two primary reasons:
1. At the time of this report, the IRS Form 990s were not available on Guidestar for a number of clinics. This is particularly true for the Smallest clinics in 2008. Generally speaking, IRS 990 reports were available only for 2/3 of the clinics identifi ed in the 2008 OSHPD data set.
2. As the IRS 990 contains fi nancial information for the entire parent organization, there were a few cases in which the data from the parent organization included non-primary care entities such as hospitals, which in turn distorted the fi nancial analysis. In those cases, the IRS 990 fi nancial data for those particular organi-zations were removed from the data sets.
While the OSHPD data is the most complete data for the clinics in California, the majority of the fi nancial ratios in this chapter are gener-ated from IRS 990 reports due to the fi nancial data required to create specifi c fi nancial ratios. In several instances, there are peculiar fi nancial data trends due to the small sample size, particularly for 2008. The charts below indicate the number of clinics included in each revenue size grouping from both the OSPHD and the Form 990 data sources.
IRS 990 Data2005 % 2006 % 2007 % 2008 %
<$2 M 56 28% 54 27% 47 24% 28 18%
$2–$5 M 49 25% 45 23% 49 25% 40 26%
$5–$15 M 54 27% 56 28% 58 29% 47 31%
>$15 M 39 20% 43 22% 43 22% 39 25%
Total 198 100% 198 100% 197 100% 154 100%
OSHPD Data2005 % 2006 % 2007 % 2008 %
<$2 M 118 46% 94 39% 93 39% 83 36%
$2–-$5 M 50 19% 54 23% 46 19% 50 22%
$5–$15 M 58 23% 59 25% 63 27% 65 28%
>$15 M 31 12% 33 14% 34 14% 32 14%
Total 257 100% 240 100% 236 100% 230 100%
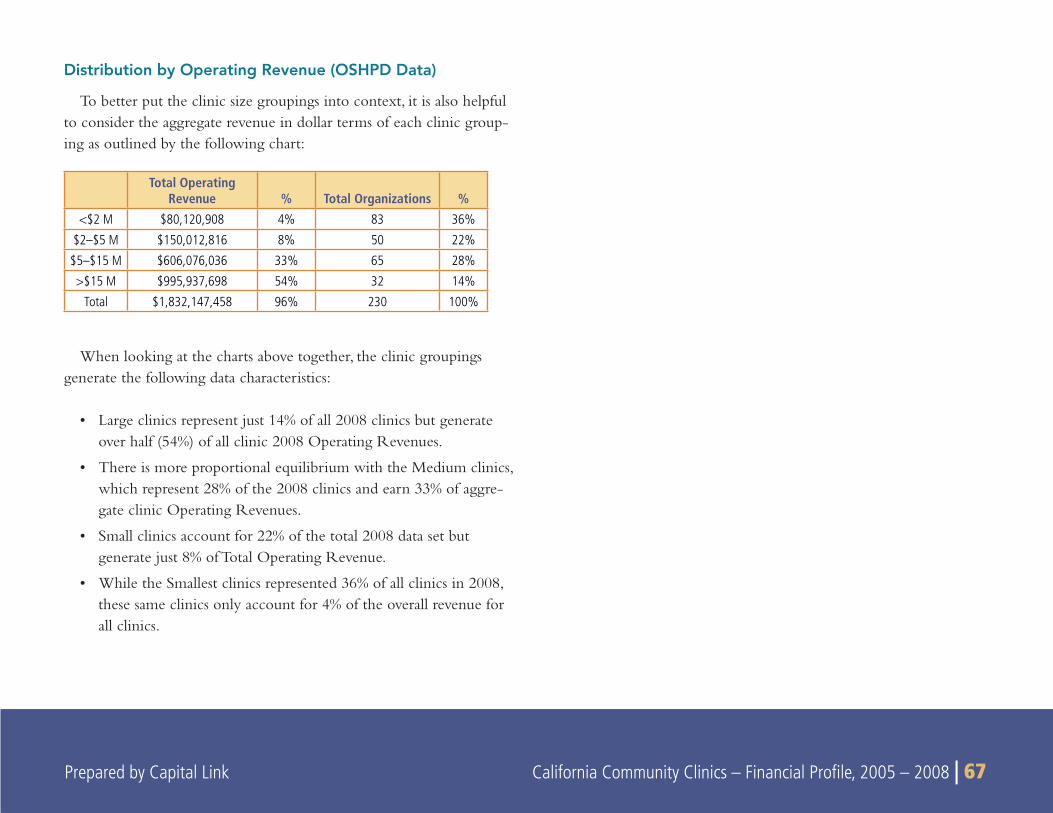
Prepared by Capital Link California Community Clinics – Financial Profi le, 2005 – 2008 | 67 Prepared by Capital Link California Community Clinics – Financial Profi le, 2005 – 2008 | 67
Distribution by Operating Revenue (OSHPD Data)
To better put the clinic size groupings into context, it is also helpful to consider the aggregate revenue in dollar terms of each clinic group-ing as outlined by the following chart:
When looking at the charts above together, the clinic groupings generate the following data characteristics:
Large clinics represent just 14% of all 2008 clinics but generate • over half (54%) of all clinic 2008 Operating Revenues.
There is more proportional equilibrium with the Medium clinics, • which represent 28% of the 2008 clinics and earn 33% of aggre-gate clinic Operating Revenues.
Small clinics account for 22% of the total 2008 data set but • generate just 8% of Total Operating Revenue.
While the Smallest clinics represented 36% of all clinics in 2008, • these same clinics only account for 4% of the overall revenue for all clinics.
Total Operating Revenue % Total Organizations %
<$2 M $80,120,908 4% 83 36%
$2–$5 M $150,012,816 8% 50 22%
$5–$15 M $606,076,036 33% 65 28%
>$15 M $995,937,698 54% 32 14%
Total $1,832,147,458 96% 230 100%
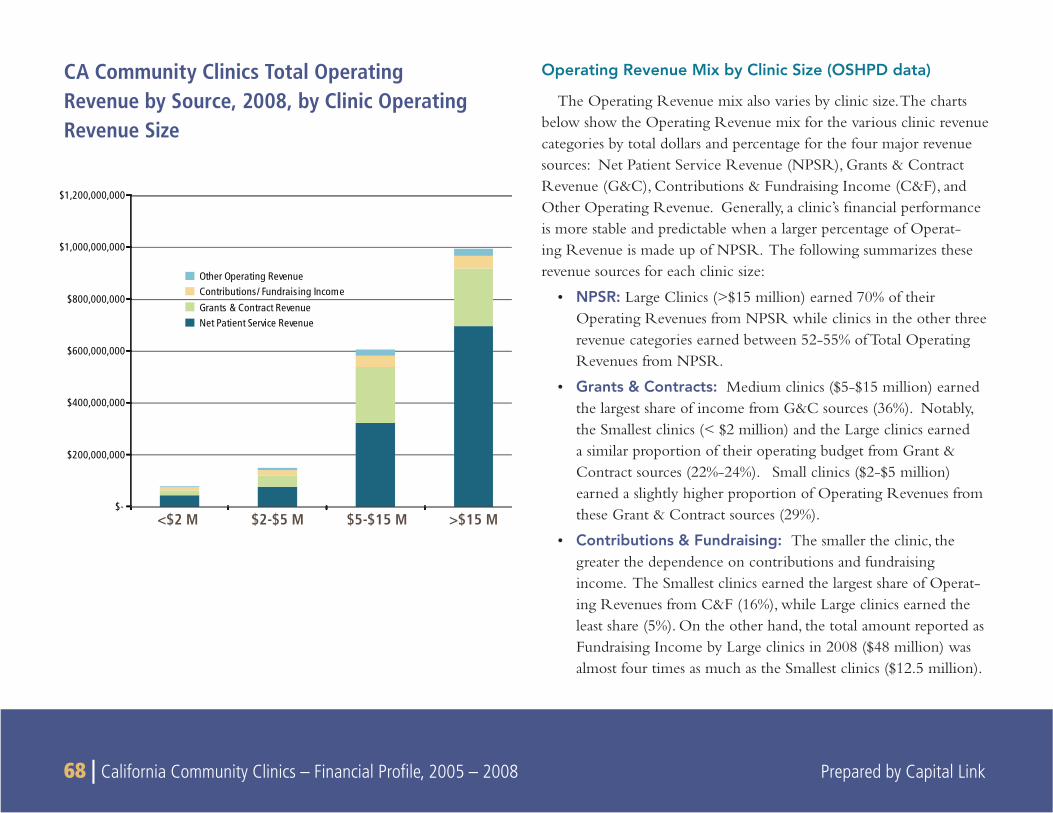
68 | California Community Clinics – Financial Profi le, 2005 – 2008 Prepared by Capital Link
Operating Revenue Mix by Clinic Size (OSHPD data)
The Operating Revenue mix also varies by clinic size. The charts below show the Operating Revenue mix for the various clinic revenue categories by total dollars and percentage for the four major revenue sources: Net Patient Service Revenue (NPSR), Grants & Contract Revenue (G&C), Contributions & Fundraising Income (C&F), and Other Operating Revenue. Generally, a clinic’s fi nancial performance is more stable and predictable when a larger percentage of Operat-ing Revenue is made up of NPSR. The following summarizes these revenue sources for each clinic size:
NPSR: • Large Clinics (>$15 million) earned 70% of their Operating Revenues from NPSR while clinics in the other three revenue categories earned between 52-55% of Total Operating Revenues from NPSR.
Grants & Contracts: • Medium clinics ($5-$15 million) earned the largest share of income from G&C sources (36%). Notably, the Smallest clinics (< $2 million) and the Large clinics earned a similar proportion of their operating budget from Grant & Contract sources (22%-24%). Small clinics ($2-$5 million) earned a slightly higher proportion of Operating Revenues from these Grant & Contract sources (29%).
Contributions & Fundraising: • The smaller the clinic, the greater the dependence on contributions and fundraising income. The Smallest clinics earned the largest share of Operat-ing Revenues from C&F (16%), while Large clinics earned the least share (5%). On the other hand, the total amount reported as Fundraising Income by Large clinics in 2008 ($48 million) was almost four times as much as the Smallest clinics ($12.5 million).
<$2 M $2-$5 M $5-$15 M >$15 M $-
$200,000,000
$400,000,000
$600,000,000
$800,000,000
$1,000,000,000
$1,200,000,000
Other Operating RevenueContributions/ Fundraising IncomeGrants & Contract RevenueNet Patient Service Revenue
CA Community Clinics Total OperatingRevenue by Source, 2008, by Clinic Operating Revenue Size
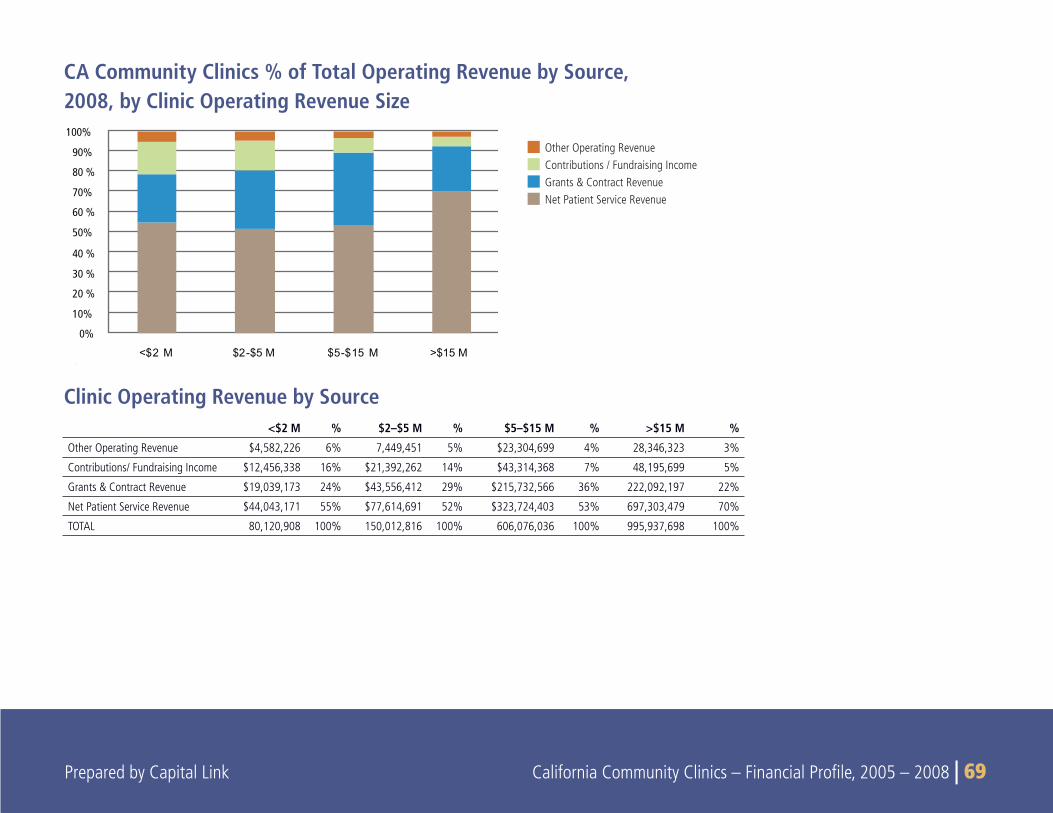
Prepared by Capital Link California Community Clinics – Financial Profi le, 2005 – 2008 | 69 Prepared by Capital Link California Community Clinics – Financial Profi le, 2005 – 2008 | 69
CA Community Clinics % of Total Operating Revenue by Source, 2008, by Clinic Operating Revenue Size
0%
10%
20 %
30 %
40 %
50%
60 %
70%
80 %
90%
100%
<$2 M $2-$5 M $5-$15 M >$15 M
<$2 M % $2–$5 M % $5–$15 M % >$15 M %
Other Operating Revenue $4,582,226 6% 7,449,451 5% $23,304,699 4% 28,346,323 3%
Contributions/ Fundraising Income $12,456,338 16% $21,392,262 14% $43,314,368 7% 48,195,699 5%
Grants & Contract Revenue $19,039,173 24% $43,556,412 29% $215,732,566 36% 222,092,197 22%
Net Patient Service Revenue $44,043,171 55% $77,614,691 52% $323,724,403 53% 697,303,479 70%
TOTAL 80,120,908 100% 150,012,816 100% 606,076,036 100% 995,937,698 100%
Clinic Operating Revenue by Source
Other Operating RevenueContributions / Fundraising IncomeGrants & Contract RevenueNet Patient Service Revenue
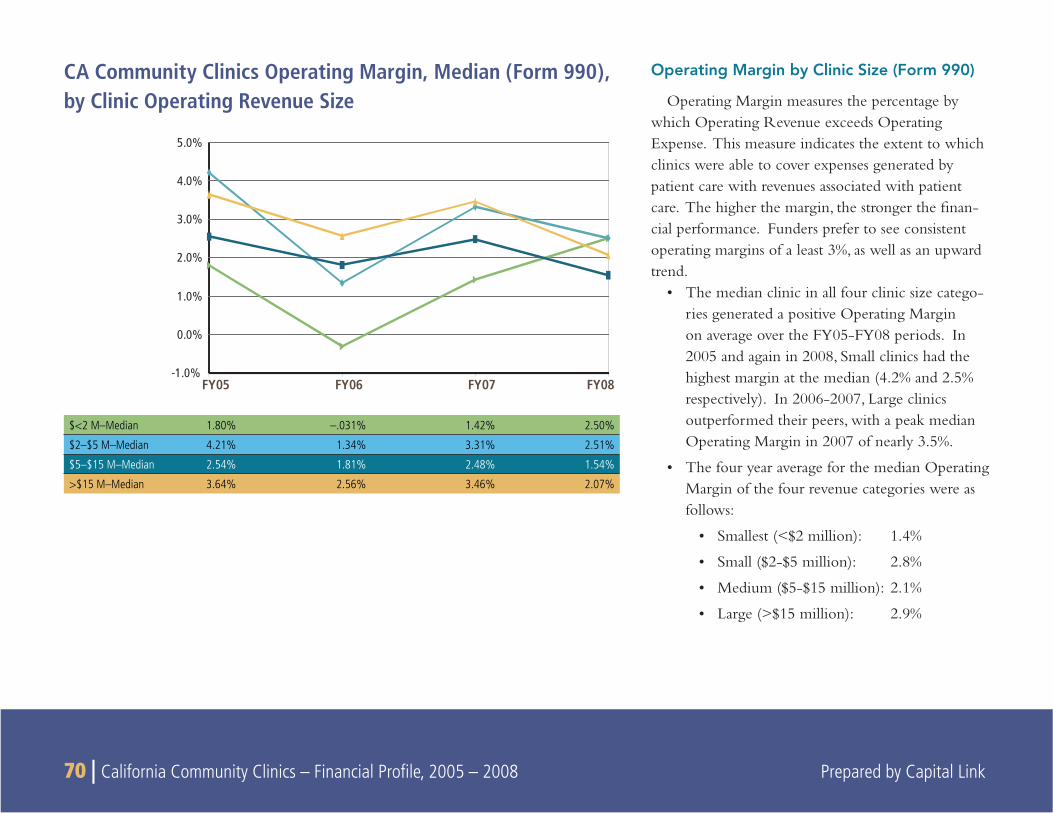
70 | California Community Clinics – Financial Profi le, 2005 – 2008 Prepared by Capital Link
FY05 FY06 FY07 FY08-1.0%
0.0%
1.0%
2.0%
3.0%
4.0%
5.0%
Operating Margin by Clinic Size (Form 990)
Operating Margin measures the percentage by which Operating Revenue exceeds Operating Expense. This measure indicates the extent to which clinics were able to cover expenses generated by patient care with revenues associated with patient care. The higher the margin, the stronger the fi nan-cial performance. Funders prefer to see consistent operating margins of a least 3%, as well as an upward trend.
The median clinic in all four clinic size catego-• ries generated a positive Operating Margin on average over the FY05-FY08 periods. In 2005 and again in 2008, Small clinics had the highest margin at the median (4.2% and 2.5% respectively). In 2006-2007, Large clinics outperformed their peers, with a peak median Operating Margin in 2007 of nearly 3.5%.
The four year average for the median Operating • Margin of the four revenue categories were as follows:
Smallest (<$2 million): 1.4%•
Small ($2-$5 million): 2.8%•
Medium ($5-$15 million): 2.1%•
Large (>$15 million): 2.9%•
CA Community Clinics Operating Margin, Median (Form 990),by Clinic Operating Revenue Size
$<2 M–Median 1.80% –.031% 1.42% 2.50%
$2–$5 M–Median 4.21% 1.34% 3.31% 2.51%
$5–$15 M–Median 2.54% 1.81% 2.48% 1.54%
>$15 M–Median 3.64% 2.56% 3.46% 2.07%
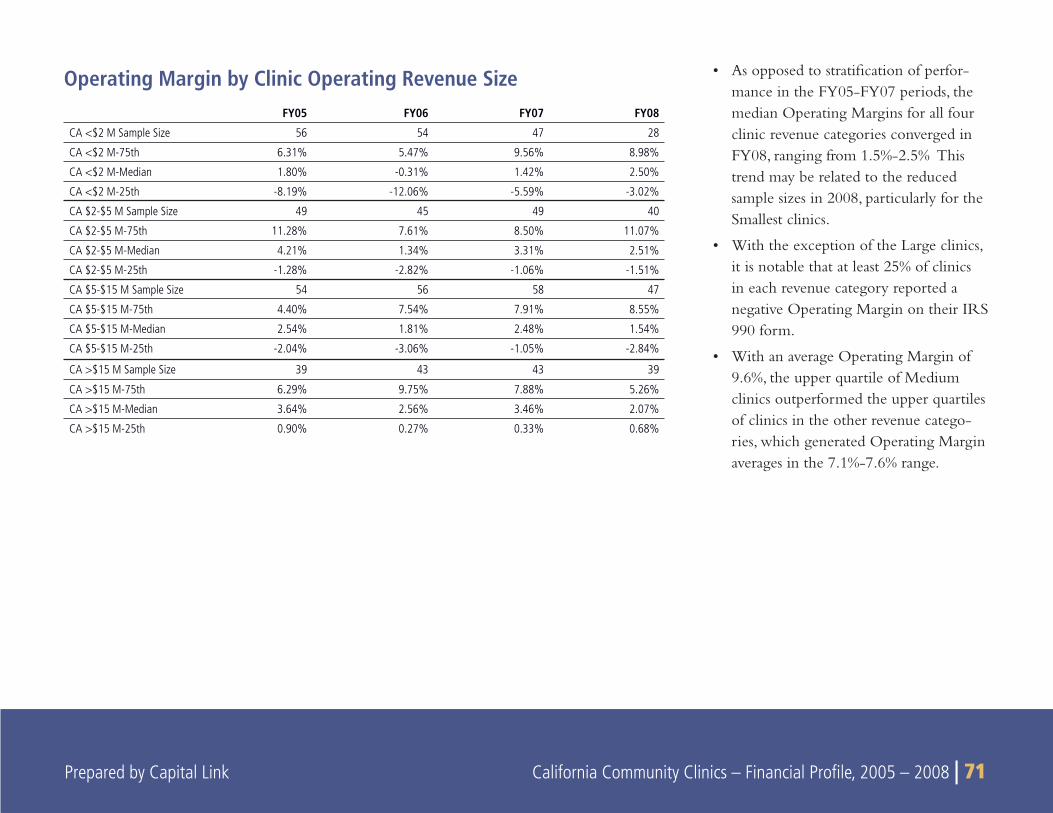
Prepared by Capital Link California Community Clinics – Financial Profi le, 2005 – 2008 | 71 Prepared by Capital Link California Community Clinics – Financial Profi le, 2005 – 2008 | 71
FY05 FY06 FY07 FY08
CA <$2 M Sample Size 56 54 47 28
CA <$2 M-75th 6.31% 5.47% 9.56% 8.98%
CA <$2 M-Median 1.80% -0.31% 1.42% 2.50%
CA <$2 M-25th -8.19% -12.06% -5.59% -3.02%
CA $2-$5 M Sample Size 49 45 49 40
CA $2-$5 M-75th 11.28% 7.61% 8.50% 11.07%
CA $2-$5 M-Median 4.21% 1.34% 3.31% 2.51%
CA $2-$5 M-25th -1.28% -2.82% -1.06% -1.51%
CA $5-$15 M Sample Size 54 56 58 47
CA $5-$15 M-75th 4.40% 7.54% 7.91% 8.55%
CA $5-$15 M-Median 2.54% 1.81% 2.48% 1.54%
CA $5-$15 M-25th -2.04% -3.06% -1.05% -2.84%
CA >$15 M Sample Size 39 43 43 39
CA >$15 M-75th 6.29% 9.75% 7.88% 5.26%
CA >$15 M-Median 3.64% 2.56% 3.46% 2.07%
CA >$15 M-25th 0.90% 0.27% 0.33% 0.68%
As opposed to stratifi cation of perfor-• mance in the FY05-FY07 periods, the median Operating Margins for all four clinic revenue categories converged in FY08, ranging from 1.5%-2.5% This trend may be related to the reduced sample sizes in 2008, particularly for the Smallest clinics.
With the exception of the Large clinics, • it is notable that at least 25% of clinics in each revenue category reported a negative Operating Margin on their IRS 990 form.
With an average Operating Margin of • 9.6%, the upper quartile of Medium clinics outperformed the upper quartiles of clinics in the other revenue catego-ries, which generated Operating Margin averages in the 7.1%-7.6% range.
Operating Margin by Clinic Operating Revenue Size
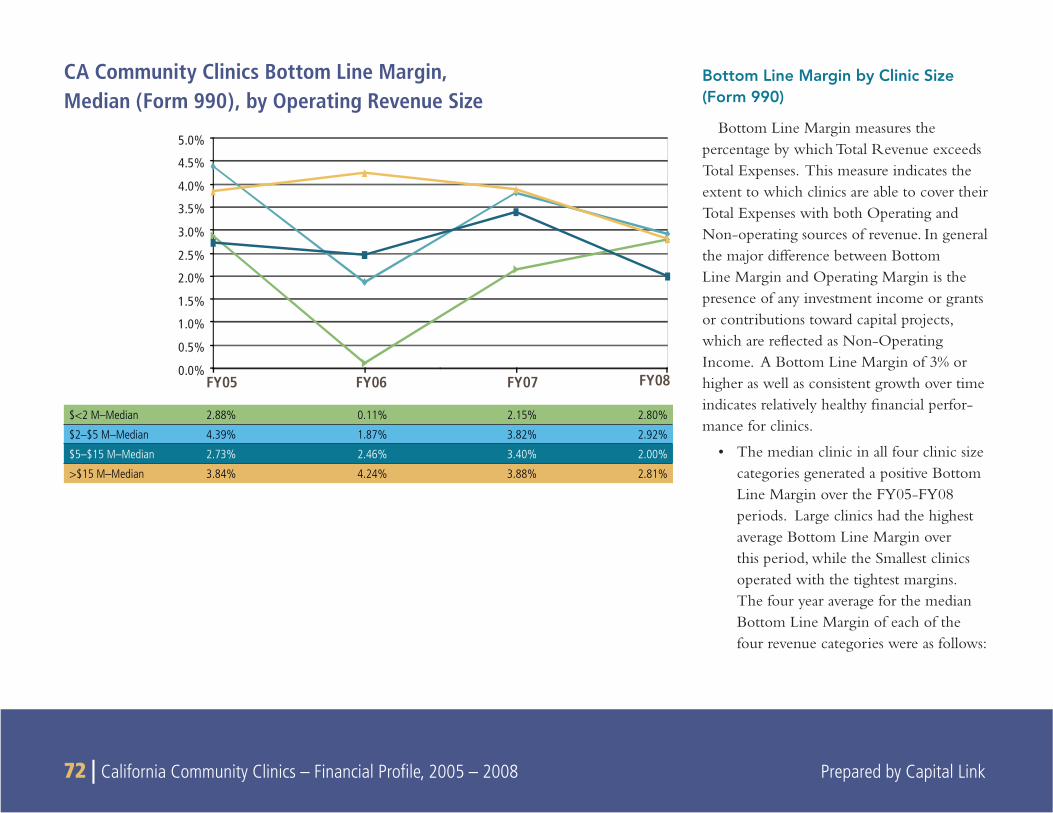
72 | California Community Clinics – Financial Profi le, 2005 – 2008 Prepared by Capital Link
Bottom Line Margin by Clinic Size (Form 990)
Bottom Line Margin measures the percentage by which Total Revenue exceeds Total Expenses. This measure indicates the extent to which clinics are able to cover their Total Expenses with both Operating and Non-operating sources of revenue. In general the major difference between Bottom Line Margin and Operating Margin is the presence of any investment income or grants or contributions toward capital projects, which are refl ected as Non-Operating Income. A Bottom Line Margin of 3% or higher as well as consistent growth over time indicates relatively healthy fi nancial perfor-mance for clinics.
The median clinic in all four clinic size • categories generated a positive Bottom Line Margin over the FY05-FY08 periods. Large clinics had the highest average Bottom Line Margin over this period, while the Smallest clinics operated with the tightest margins. The four year average for the median Bottom Line Margin of each of the four revenue categories were as follows:
CA Community Clinics Bottom Line Margin, Median (Form 990), by Operating Revenue Size
FY05 FY06 FY07 FY080.0%
0.5%
1.0%
1.5%
2.0%
2.5%
3.0%
3.5%
4.0%
4.5%
5.0%
$<2 M–Median 2.88% 0.11% 2.15% 2.80%
$2–$5 M–Median 4.39% 1.87% 3.82% 2.92%
$5–$15 M–Median 2.73% 2.46% 3.40% 2.00%
>$15 M–Median 3.84% 4.24% 3.88% 2.81%
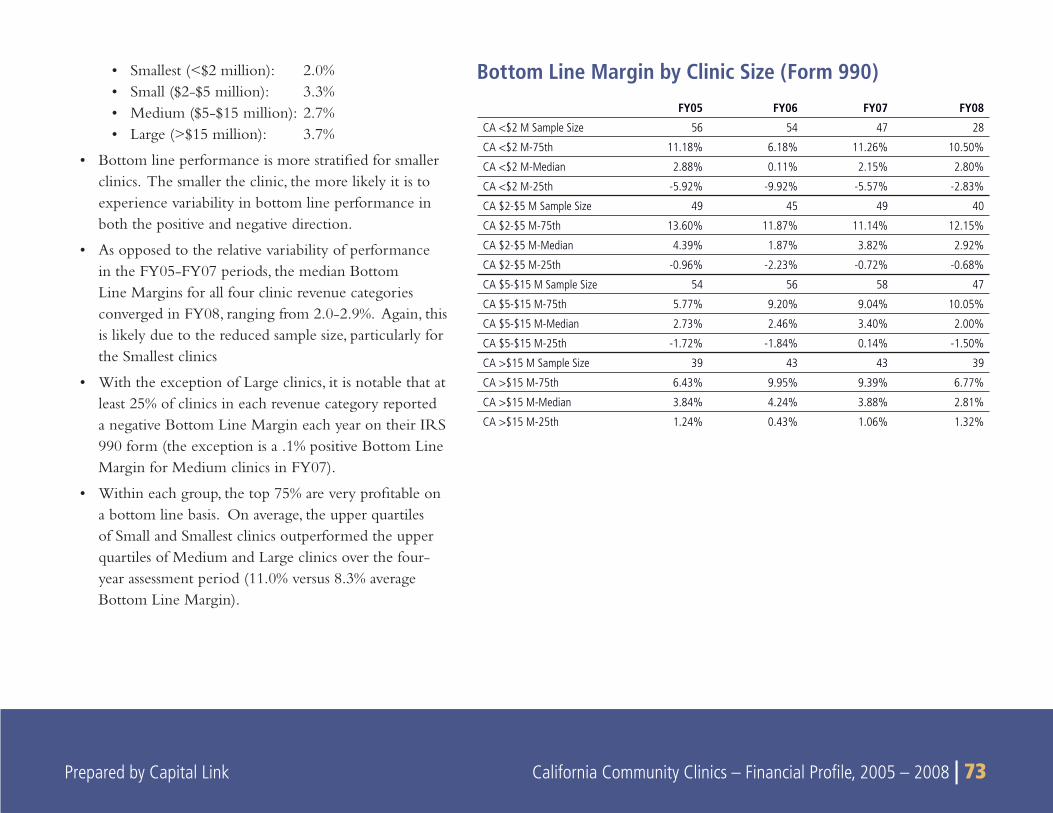
Prepared by Capital Link California Community Clinics – Financial Profi le, 2005 – 2008 | 73 Prepared by Capital Link California Community Clinics – Financial Profi le, 2005 – 2008 | 73
Smallest (<$2 million): 2.0%• Small ($2-$5 million): 3.3%• Medium ($5-$15 million): 2.7%• Large (>$15 million): 3.7%•
Bottom line performance is more stratifi ed for smaller • clinics. The smaller the clinic, the more likely it is to experience variability in bottom line performance in both the positive and negative direction.
As opposed to the relative variability of performance • in the FY05-FY07 periods, the median Bottom Line Margins for all four clinic revenue categories converged in FY08, ranging from 2.0-2.9%. Again, this is likely due to the reduced sample size, particularly for the Smallest clinics
With the exception of Large clinics, it is notable that at • least 25% of clinics in each revenue category reported a negative Bottom Line Margin each year on their IRS 990 form (the exception is a .1% positive Bottom Line Margin for Medium clinics in FY07).
Within each group, the top 75% are very profi table on • a bottom line basis. On average, the upper quartiles of Small and Smallest clinics outperformed the upper quartiles of Medium and Large clinics over the four-year assessment period (11.0% versus 8.3% average Bottom Line Margin).
FY05 FY06 FY07 FY08
CA <$2 M Sample Size 56 54 47 28
CA <$2 M-75th 11.18% 6.18% 11.26% 10.50%
CA <$2 M-Median 2.88% 0.11% 2.15% 2.80%
CA <$2 M-25th -5.92% -9.92% -5.57% -2.83%
CA $2-$5 M Sample Size 49 45 49 40
CA $2-$5 M-75th 13.60% 11.87% 11.14% 12.15%
CA $2-$5 M-Median 4.39% 1.87% 3.82% 2.92%
CA $2-$5 M-25th -0.96% -2.23% -0.72% -0.68%
CA $5-$15 M Sample Size 54 56 58 47
CA $5-$15 M-75th 5.77% 9.20% 9.04% 10.05%
CA $5-$15 M-Median 2.73% 2.46% 3.40% 2.00%
CA $5-$15 M-25th -1.72% -1.84% 0.14% -1.50%
CA >$15 M Sample Size 39 43 43 39
CA >$15 M-75th 6.43% 9.95% 9.39% 6.77%
CA >$15 M-Median 3.84% 4.24% 3.88% 2.81%
CA >$15 M-25th 1.24% 0.43% 1.06% 1.32%
Bottom Line Margin by Clinic Size (Form 990)
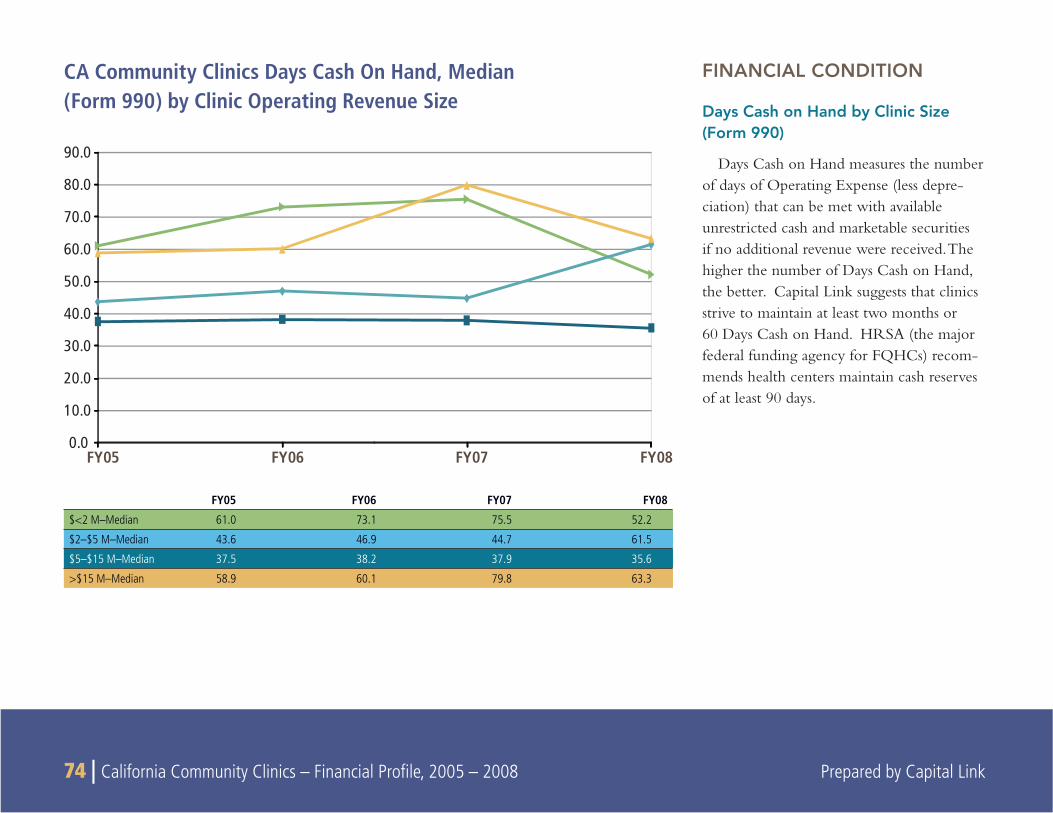
74 | California Community Clinics – Financial Profi le, 2005 – 2008 Prepared by Capital Link
CA Community Clinics Days Cash On Hand, Median (Form 990) by Clinic Operating Revenue Size
FINANCIAL CONDITION
Days Cash on Hand by Clinic Size (Form 990)
Days Cash on Hand measures the number of days of Operating Expense (less depre-ciation) that can be met with available unrestricted cash and marketable securities if no additional revenue were received. The higher the number of Days Cash on Hand, the better. Capital Link suggests that clinics strive to maintain at least two months or 60 Days Cash on Hand. HRSA (the major federal funding agency for FQHCs) recom-mends health centers maintain cash reserves of at least 90 days.
FY05 FY06 FY07 FY080.0
10.0
20.0
30.0
40.0
50.0
60.0
70.0
80.0
90.0
FY05 FY06 FY07 FY08
$<2 M–Median 61.0 73.1 75.5 52.2
$2–$5 M–Median 43.6 46.9 44.7 61.5
$5–$15 M–Median 37.5 38.2 37.9 35.6
>$15 M–Median 58.9 60.1 79.8 63.3
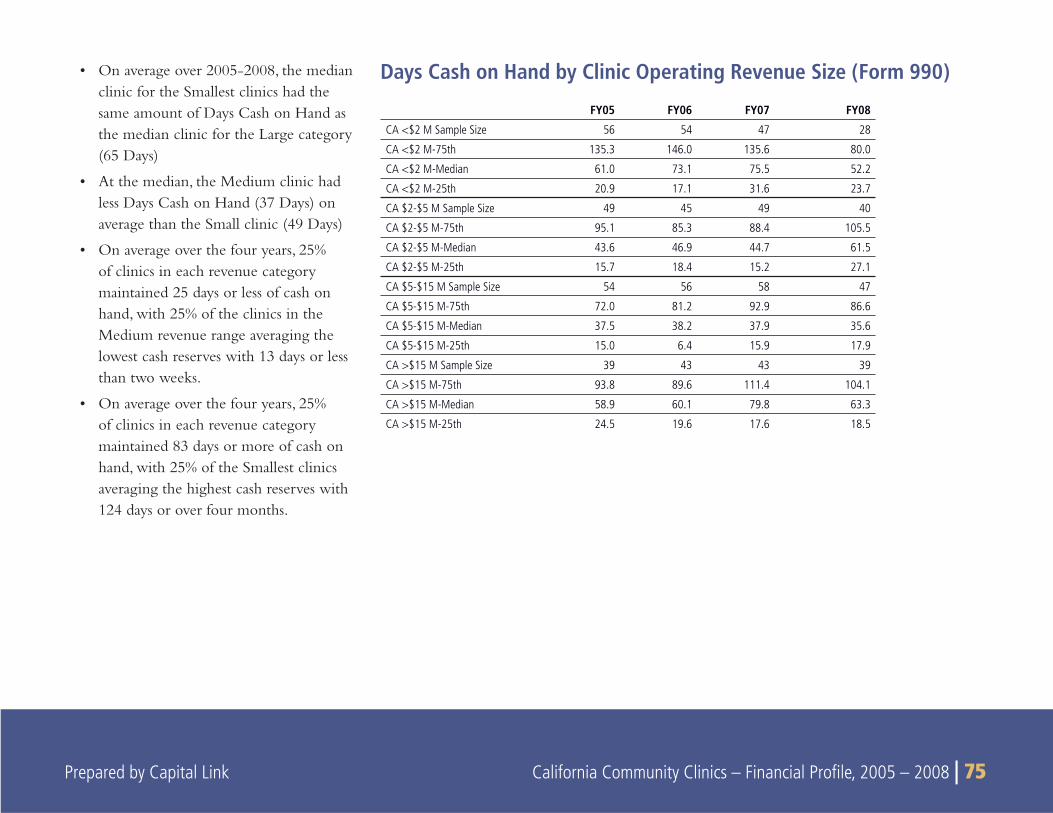
Prepared by Capital Link California Community Clinics – Financial Profi le, 2005 – 2008 | 75
FY05 FY06 FY07 FY08
CA <$2 M Sample Size 56 54 47 28
CA <$2 M-75th 135.3 146.0 135.6 80.0
CA <$2 M-Median 61.0 73.1 75.5 52.2
CA <$2 M-25th 20.9 17.1 31.6 23.7
CA $2-$5 M Sample Size 49 45 49 40
CA $2-$5 M-75th 95.1 85.3 88.4 105.5
CA $2-$5 M-Median 43.6 46.9 44.7 61.5
CA $2-$5 M-25th 15.7 18.4 15.2 27.1
CA $5-$15 M Sample Size 54 56 58 47
CA $5-$15 M-75th 72.0 81.2 92.9 86.6
CA $5-$15 M-Median 37.5 38.2 37.9 35.6
CA $5-$15 M-25th 15.0 6.4 15.9 17.9
CA >$15 M Sample Size 39 43 43 39
CA >$15 M-75th 93.8 89.6 111.4 104.1
CA >$15 M-Median 58.9 60.1 79.8 63.3
CA >$15 M-25th 24.5 19.6 17.6 18.5
On average over 2005-2008, the median • clinic for the Smallest clinics had the same amount of Days Cash on Hand as the median clinic for the Large category (65 Days)
At the median, the Medium clinic had • less Days Cash on Hand (37 Days) on average than the Small clinic (49 Days)
On average over the four years, 25% • of clinics in each revenue category maintained 25 days or less of cash on hand, with 25% of the clinics in the Medium revenue range averaging the lowest cash reserves with 13 days or less than two weeks.
On average over the four years, 25% • of clinics in each revenue category maintained 83 days or more of cash on hand, with 25% of the Smallest clinics averaging the highest cash reserves with 124 days or over four months.
Days Cash on Hand by Clinic Operating Revenue Size (Form 990)
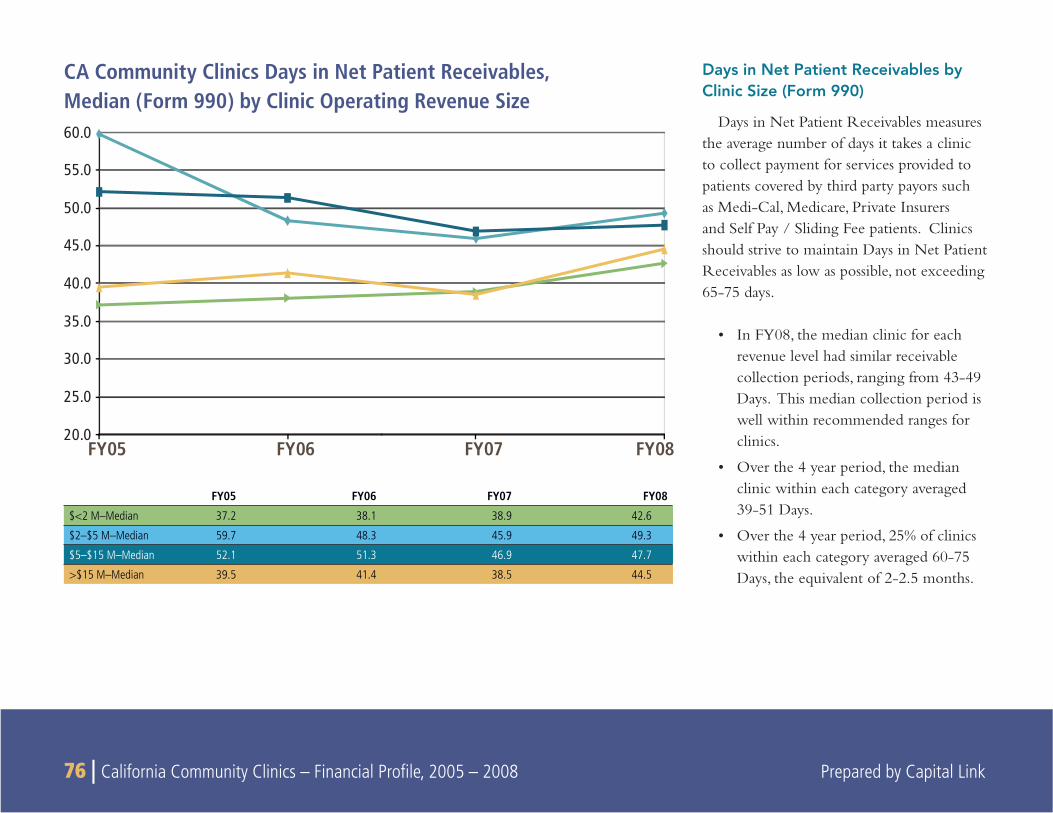
76 | California Community Clinics – Financial Profi le, 2005 – 2008 Prepared by Capital Link
FY05 FY06 FY07 FY0820.0
25.0
30.0
35.0
40.0
45.0
50.0
55.0
60.0
Days in Net Patient Receivables by Clinic Size (Form 990)
Days in Net Patient Receivables measures the average number of days it takes a clinic to collect payment for services provided to patients covered by third party payors such as Medi-Cal, Medicare, Private Insurers and Self Pay / Sliding Fee patients. Clinics should strive to maintain Days in Net Patient Receivables as low as possible, not exceeding 65-75 days.
In FY08, the median clinic for each • revenue level had similar receivable collection periods, ranging from 43-49 Days. This median collection period is well within recommended ranges for clinics.
Over the 4 year period, the median • clinic within each category averaged 39-51 Days.
Over the 4 year period, 25% of clinics • within each category averaged 60-75 Days, the equivalent of 2-2.5 months.
CA Community Clinics Days in Net Patient Receivables, Median (Form 990) by Clinic Operating Revenue Size
FY05 FY06 FY07 FY08
$<2 M–Median 37.2 38.1 38.9 42.6
$2–$5 M–Median 59.7 48.3 45.9 49.3
$5–$15 M–Median 52.1 51.3 46.9 47.7
>$15 M–Median 39.5 41.4 38.5 44.5
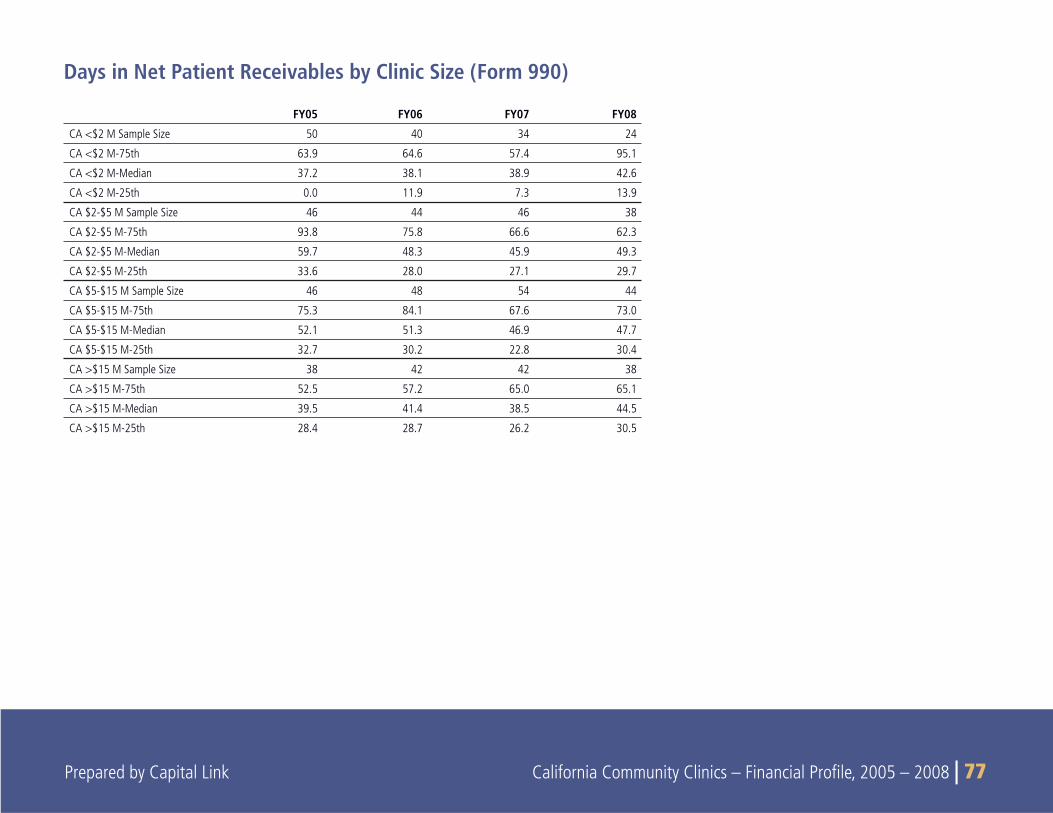
Prepared by Capital Link California Community Clinics – Financial Profi le, 2005 – 2008 | 77
FY05 FY06 FY07 FY08
CA <$2 M Sample Size 50 40 34 24
CA <$2 M-75th 63.9 64.6 57.4 95.1
CA <$2 M-Median 37.2 38.1 38.9 42.6
CA <$2 M-25th 0.0 11.9 7.3 13.9
CA $2-$5 M Sample Size 46 44 46 38
CA $2-$5 M-75th 93.8 75.8 66.6 62.3
CA $2-$5 M-Median 59.7 48.3 45.9 49.3
CA $2-$5 M-25th 33.6 28.0 27.1 29.7
CA $5-$15 M Sample Size 46 48 54 44
CA $5-$15 M-75th 75.3 84.1 67.6 73.0
CA $5-$15 M-Median 52.1 51.3 46.9 47.7
CA $5-$15 M-25th 32.7 30.2 22.8 30.4
CA >$15 M Sample Size 38 42 42 38
CA >$15 M-75th 52.5 57.2 65.0 65.1
CA >$15 M-Median 39.5 41.4 38.5 44.5
CA >$15 M-25th 28.4 28.7 26.2 30.5
Days in Net Patient Receivables by Clinic Size (Form 990)
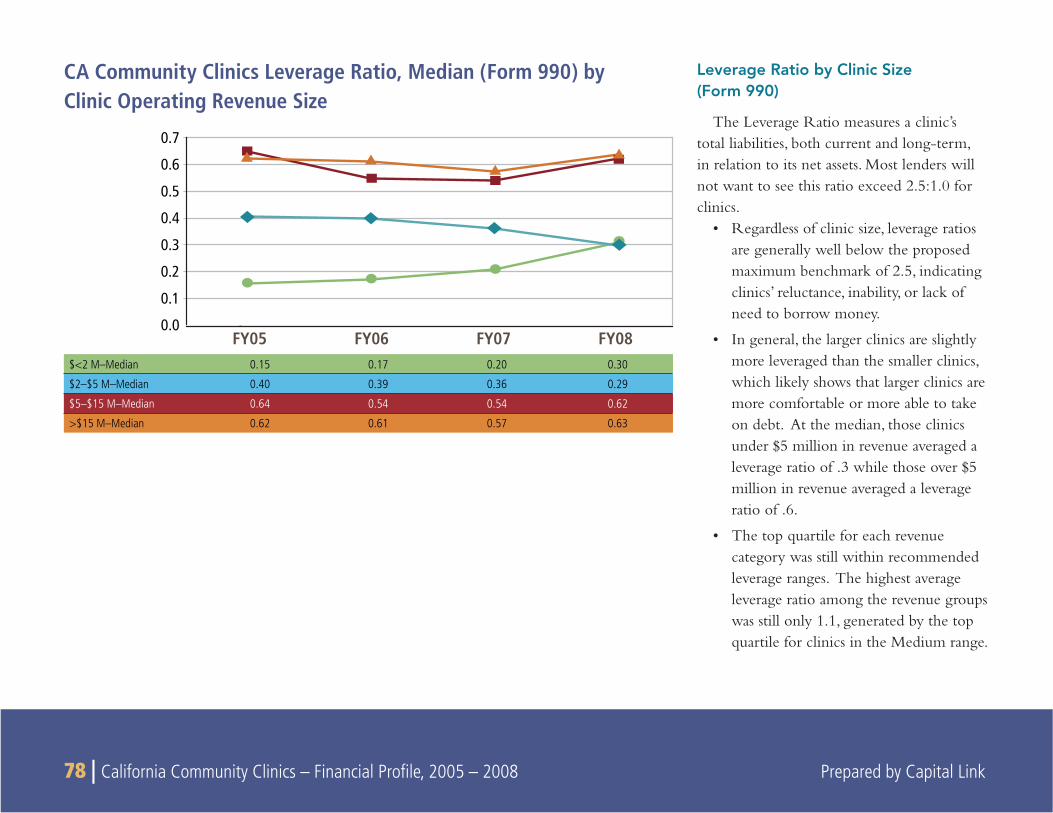
78 | California Community Clinics – Financial Profi le, 2005 – 2008 Prepared by Capital Link
CA Community Clinics Leverage Ratio, Median (Form 990) by Clinic Operating Revenue Size
Leverage Ratio by Clinic Size (Form 990)
The Leverage Ratio measures a clinic’s total liabilities, both current and long-term, in relation to its net assets. Most lenders will not want to see this ratio exceed 2.5:1.0 for clinics.
Regardless of clinic size, leverage ratios • are generally well below the proposed maximum benchmark of 2.5, indicating clinics’ reluctance, inability, or lack of need to borrow money.
In general, the larger clinics are slightly • more leveraged than the smaller clinics, which likely shows that larger clinics are more comfortable or more able to take on debt. At the median, those clinics under $5 million in revenue averaged a leverage ratio of .3 while those over $5 million in revenue averaged a leverage ratio of .6.
The top quartile for each revenue • category was still within recommended leverage ranges. The highest average leverage ratio among the revenue groups was still only 1.1, generated by the top quartile for clinics in the Medium range.
0.0
0.1
0.2
0.3
0.4
0.5
0.6
0.7
FY05 FY06 FY07 FY08$<2 M–Median 0.15 0.17 0.20 0.30
$2–$5 M–Median 0.40 0.39 0.36 0.29
$5–$15 M–Median 0.64 0.54 0.54 0.62
>$15 M–Median 0.62 0.61 0.57 0.63
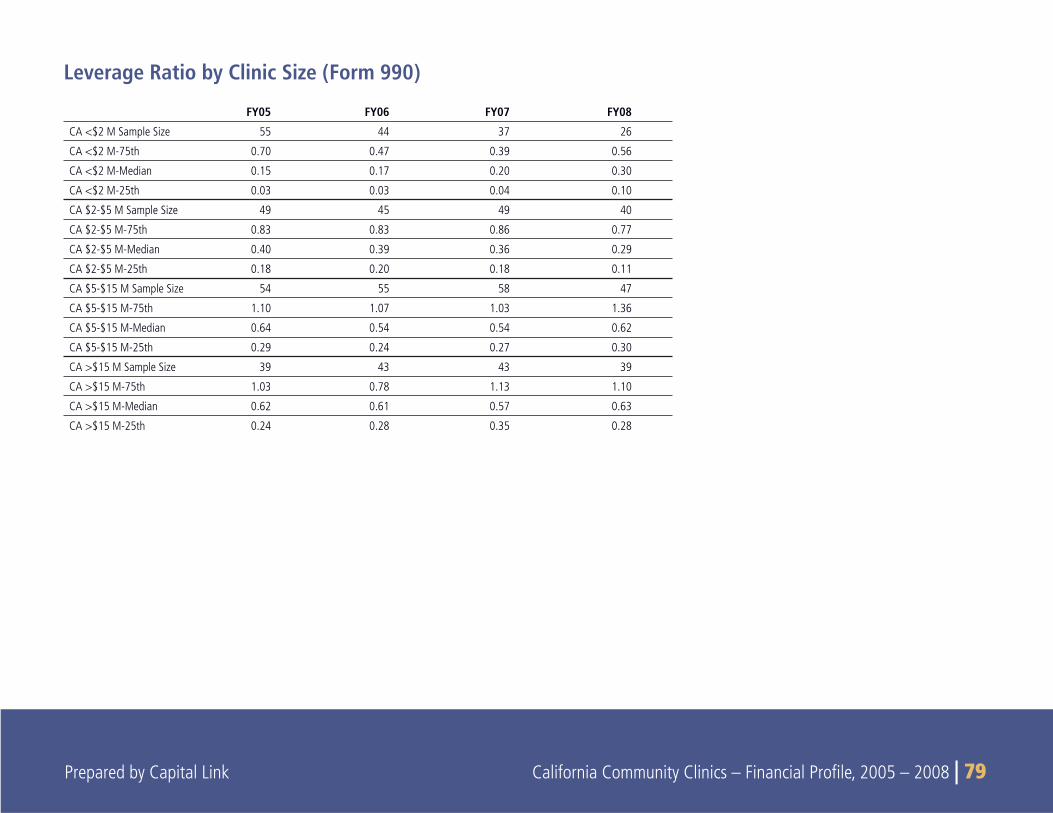
Prepared by Capital Link California Community Clinics – Financial Profi le, 2005 – 2008 | 79
FY05 FY06 FY07 FY08
CA <$2 M Sample Size 55 44 37 26
CA <$2 M-75th 0.70 0.47 0.39 0.56
CA <$2 M-Median 0.15 0.17 0.20 0.30
CA <$2 M-25th 0.03 0.03 0.04 0.10
CA $2-$5 M Sample Size 49 45 49 40
CA $2-$5 M-75th 0.83 0.83 0.86 0.77
CA $2-$5 M-Median 0.40 0.39 0.36 0.29
CA $2-$5 M-25th 0.18 0.20 0.18 0.11
CA $5-$15 M Sample Size 54 55 58 47
CA $5-$15 M-75th 1.10 1.07 1.03 1.36
CA $5-$15 M-Median 0.64 0.54 0.54 0.62
CA $5-$15 M-25th 0.29 0.24 0.27 0.30
CA >$15 M Sample Size 39 43 43 39
CA >$15 M-75th 1.03 0.78 1.13 1.10
CA >$15 M-Median 0.62 0.61 0.57 0.63
CA >$15 M-25th 0.24 0.28 0.35 0.28
Leverage Ratio by Clinic Size (Form 990)
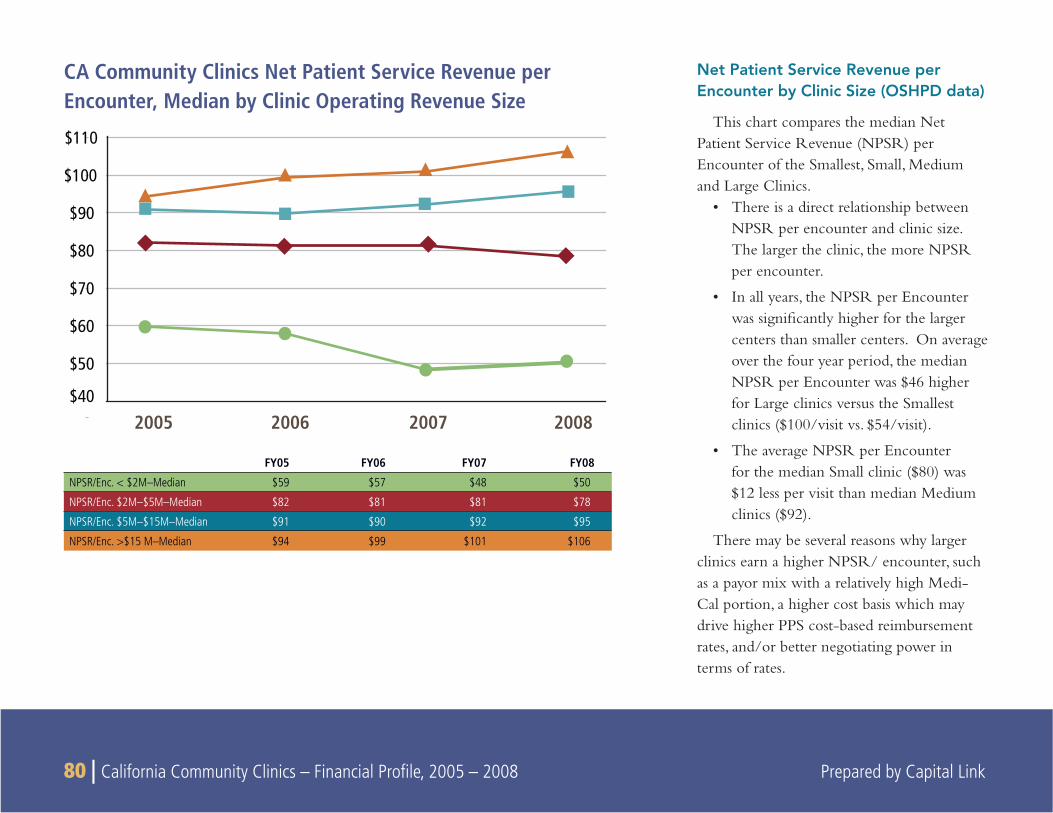
80 | California Community Clinics – Financial Profi le, 2005 – 2008 Prepared by Capital Link
Net Patient Service Revenue per Encounter by Clinic Size (OSHPD data)
This chart compares the median Net Patient Service Revenue (NPSR) per Encounter of the Smallest, Small, Medium and Large Clinics.
There is a direct relationship between • NPSR per encounter and clinic size. The larger the clinic, the more NPSR per encounter.
In all years, the NPSR per Encounter • was signifi cantly higher for the larger centers than smaller centers. On average over the four year period, the median NPSR per Encounter was $46 higher for Large clinics versus the Smallest clinics ($100/visit vs. $54/visit).
The average NPSR per Encounter • for the median Small clinic ($80) was $12 less per visit than median Medium clinics ($92).
There may be several reasons why larger clinics earn a higher NPSR/ encounter, such as a payor mix with a relatively high Medi-Cal portion, a higher cost basis which may drive higher PPS cost-based reimbursement rates, and/or better negotiating power in terms of rates.
CA Community Clinics Net Patient Service Revenue per Encounter, Median by Clinic Operating Revenue Size
$40
$50
$60
$70
$80
$90
$100
$110
2005 2006 2007 2008
FY05 FY06 FY07 FY08
NPSR/Enc. < $2M–Median $59 $57 $48 $50
NPSR/Enc. $2M–$5M–Median $82 $81 $81 $78
NPSR/Enc. $5M–$15M–Median $91 $90 $92 $95
NPSR/Enc. >$15 M–Median $94 $99 $101 $106
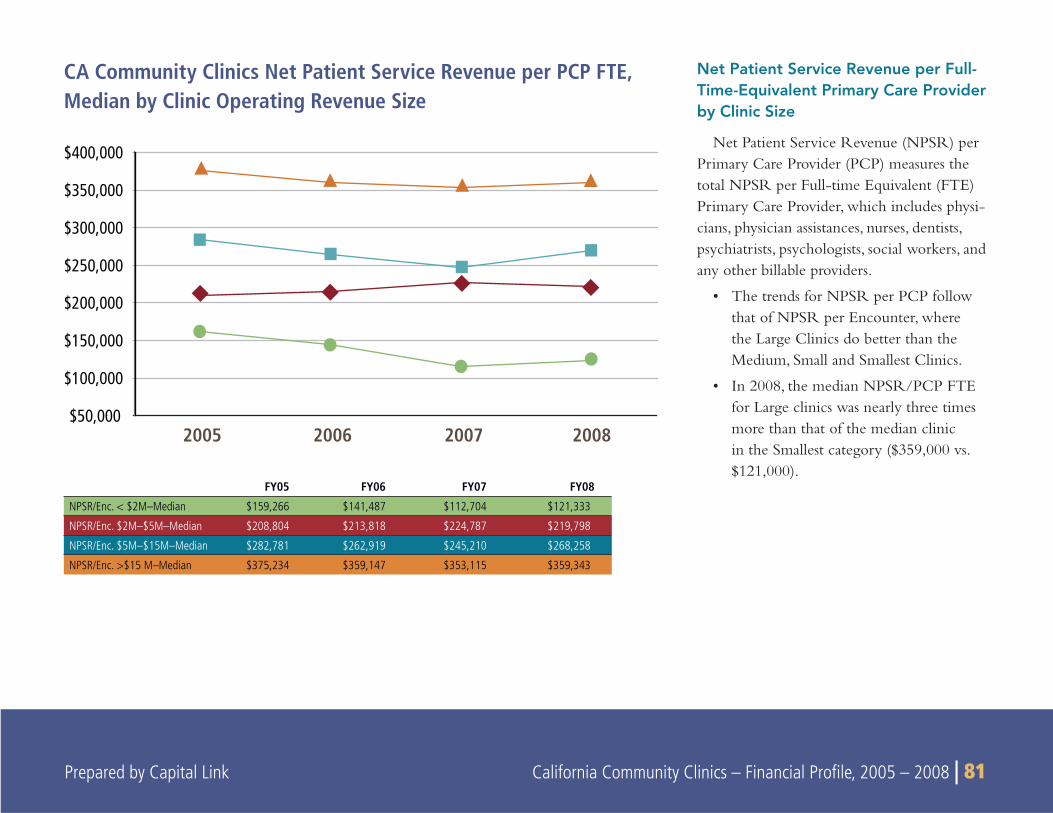
Prepared by Capital Link California Community Clinics – Financial Profi le, 2005 – 2008 | 81
$50,000
$100,000
$150,000
$200,000
$250,000
$300,000
$350,000
$400,000
2005 2006 2007 2008
CA Community Clinics Net Patient Service Revenue per PCP FTE, Median by Clinic Operating Revenue Size
Net Patient Service Revenue per Full-Time-Equivalent Primary Care Provider by Clinic Size
Net Patient Service Revenue (NPSR) per Primary Care Provider (PCP) measures the total NPSR per Full-time Equivalent (FTE) Primary Care Provider, which includes physi-cians, physician assistances, nurses, dentists, psychiatrists, psychologists, social workers, and any other billable providers.
The trends for NPSR per PCP follow • that of NPSR per Encounter, where the Large Clinics do better than the Medium, Small and Smallest Clinics.
In 2008, the median NPSR/PCP FTE • for Large clinics was nearly three times more than that of the median clinic in the Smallest category ($359,000 vs. $121,000).
FY05 FY06 FY07 FY08
NPSR/Enc. < $2M–Median $159,266 $141,487 $112,704 $121,333
NPSR/Enc. $2M–$5M–Median $208,804 $213,818 $224,787 $219,798
NPSR/Enc. $5M–$15M–Median $282,781 $262,919 $245,210 $268,258
NPSR/Enc. >$15 M–Median $375,234 $359,147 $353,115 $359,343
82 | California Community Clinics – Financial Profi le, 2005 – 2008 Prepared by Capital Link
9
SUBGROUP ANALYSIS: COMPARISON BY CLINIC TYPE
SUMMARY
This section compares the organizational trends and revenue profi les of the three clinic categories used for this report, including
FQHCs, FQHC Look-alikes, and the remaining clinics within the data set that are grouped in the “Neither” category.
Key Findings
Section 330 FQHCs are the predominant type of safety net clinic • in California, accounting for 81% of the total clinic revenue and treating 73% of all clinic patients in 2008.
Although FQHC Section 330s see a higher proportion of patients • under 100% of Poverty, they are more likely to experience strong revenue growth and greater fi nancial stability due to higher reimbursements per encounter from major government payors.
From 2005 to 2008, FQHC Section 330 clinics were the only • clinic type group that grew while sites for other types decreased. Sites may have converted to FQHC status due to the Health Center Growth Initiative.
Revenue mix is very similar for all clinic types. However, • Neither clinics derive 10% of Operating Revenue from Fundrais-ing and Contributions, while FQHCs and FQHC Look-alikes report 5-6% of Revenues from fundraising efforts.
Section 330 FQHCs also see a higher proportion of low-income • patients than the other clinic types. FQHCs reported that 68% of their patients had a family income below 100% of the Federal Poverty Level (FPL), and 85% of their patients were under 200% of the FPL. In contrast, FQHC Look-alikes and “Neither” clinics served a lower proportion of patients living at under 200% of FPL, reporting 79% and 78% respectively.
Neither and FQHCs Look-Alike clinics derive a much higher • percentage of NPSR from “All Other” which includes regional and county programs such as County Indigent/CMSP/MISP, Healthy Families, EAPC, San Diego County Medical Plan, LA Co. Public Private Partnership, Alameda Alliance for Health (Family Care), Other County Programs, and All Other Payers. All Others accounts for 19% and 12% of NPSR for FQHC Look-Alikes and Neither clinics compared to 8% for Section 330 FQHC clinics.
Neither clinics clearly see a higher proportion of young women • than either FQHCs and FQHC Look-alikes. Forty-two percent of all patient visits for Neither clinics are provided to women between the ages of 13 and 34, compared to 23% and 20% for Section 330 FQHCs and FQHC Look-Alike clinics respectively.
The NPSR payor mix for Neither clinics is fundamentally differ-• ent from that of FQHCs and FQHC Look-alikes in that 26% of
Prepared by Capital Link California Community Clinics – Financial Profi le, 2005 – 2008 | 83
their revenues and 20% of their visits are supported by Family PACT, a Medi-Cal funded program supporting family planning services. This concentration of Family PACT related services would largely explain the relatively high Medi-Cal reimburse-ment rates earned by Neither clinics and refl ects the higher concentration of female patients of child-bearing age for that clinic type.
FQHC Section 330 clinics see a much higher proportion of • patients under 100% of the FPL, in addition to seeing the highest proportion of Medicare and Medi-Cal FFS patients. However, the average revenue per clinic is 4-6 times higher for FQHC Section 330s as compared to other clinic types. The increased revenue is due to FQHC Section 330s receiving the highest reimbursements from the two major payors, Medicare and Medi-Cal. As a result, FQHCs are more profi table than Neither clinics with greater bottom line margins in all quartiles.
Neither clinics also support a larger percentage of Self Pay/Free • Care visits (19%), but also only generate 4% of their revenue
from these visits. Self Pay / Free Care visits account for a smaller proportion of overall visits for FQHCs (12%) and FQHC Look-alikes (7%) in addition to generating a more proportionate share of their revenues from these visits. The Neither clinics seem to be supporting a larger percentage of the uninsured as a portion of their general population, which would be explained by the inclu-sion of Free Clinics within this clinic type.
Performance for Neither clinics is also somewhat weaker than • that of Section 330 FQHCs and FQHC Look-alikes. Clinics in the bottom 25% generally lose money, but the lower quartile of Neither clinics generate signifi cantly higher losses than the other clinic types. Neither clinics also exhibit a dramatically decreasing trend line for this measure, as they were able to generate 74 Days Cash on Hand in FY05 and just 38 Days by FY08. Clinics in the other two groups increased their cash reserves from 2005 to 2008.
The following sections highlight notable fi nancial indicators and trends as observed by clinic-type.
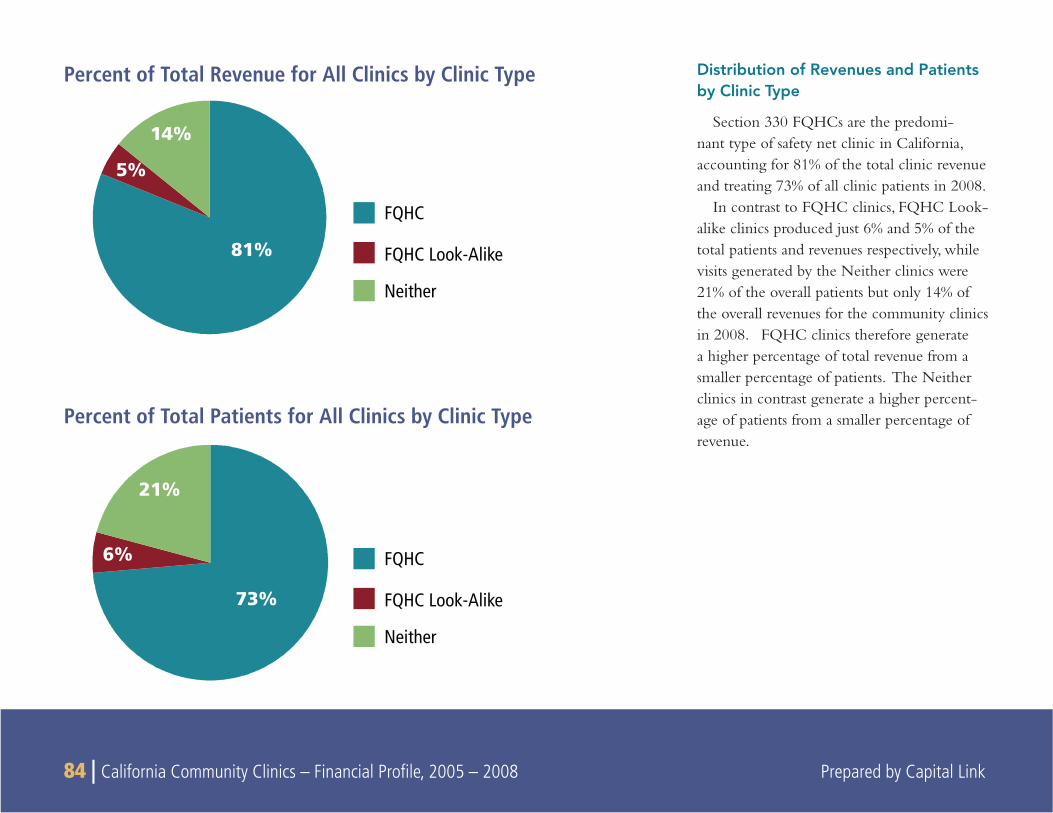
84 | California Community Clinics – Financial Profi le, 2005 – 2008 Prepared by Capital Link
81%
5%
14%
FQHC
FQHC Look-Alike
Neither
FQHC
FQHC Look-Alike
Neither
73%
6%
21%
Percent of Total Revenue for All Clinics by Clinic Type
Percent of Total Patients for All Clinics by Clinic Type
Distribution of Revenues and Patients by Clinic Type
Section 330 FQHCs are the predomi-nant type of safety net clinic in California, accounting for 81% of the total clinic revenue and treating 73% of all clinic patients in 2008.
In contrast to FQHC clinics, FQHC Look-alike clinics produced just 6% and 5% of the total patients and revenues respectively, while visits generated by the Neither clinics were 21% of the overall patients but only 14% of the overall revenues for the community clinics in 2008. FQHC clinics therefore generate a higher percentage of total revenue from a smaller percentage of patients. The Neither clinics in contrast generate a higher percent-age of patients from a smaller percentage of revenue.
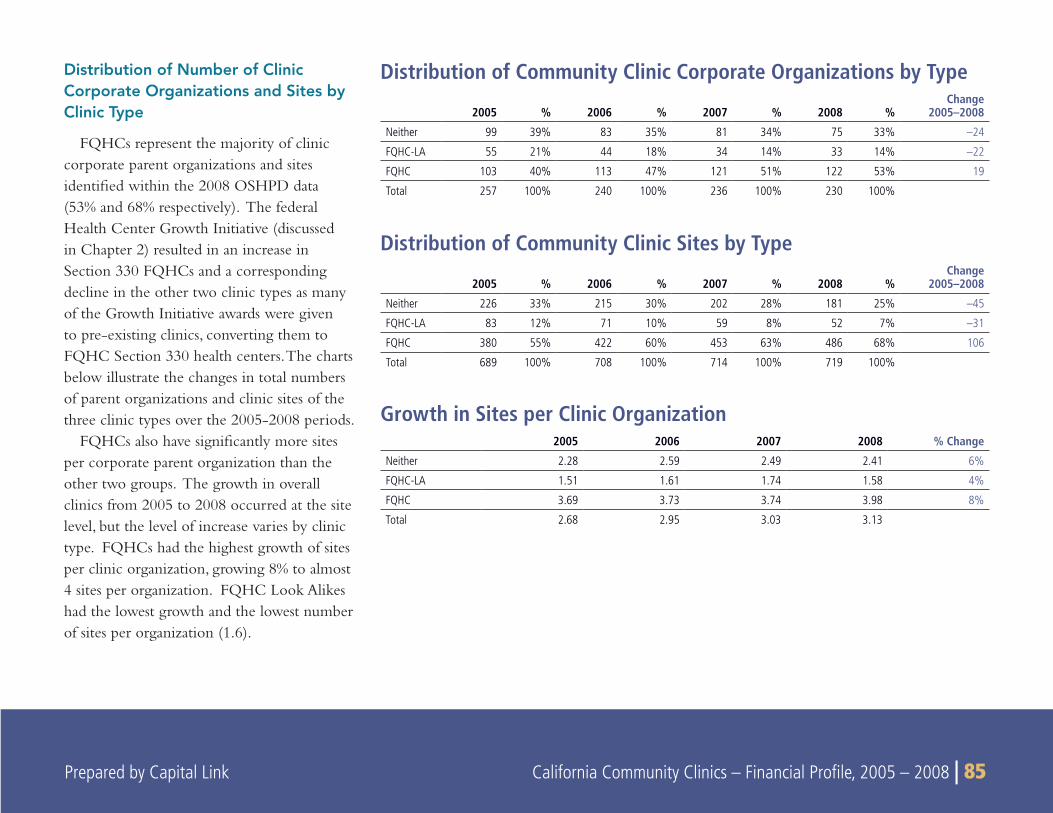
Prepared by Capital Link California Community Clinics – Financial Profile, 2005 – 2008 | 85
Distribution of Number of Clinic Corporate Organizations and Sites by Clinic Type
FQHCs represent the majority of clinic corporate parent organizations and sites identified within the 2008 OSHPD data (53% and 68% respectively). The federal Health Center Growth Initiative (discussed in Chapter 2) resulted in an increase in Section 330 FQHCs and a corresponding decline in the other two clinic types as many of the Growth Initiative awards were given to pre-existing clinics, converting them to FQHC Section 330 health centers. The charts below illustrate the changes in total numbers of parent organizations and clinic sites of the three clinic types over the 2005-2008 periods.
FQHCs also have significantly more sites per corporate parent organization than the other two groups. The growth in overall clinics from 2005 to 2008 occurred at the site level, but the level of increase varies by clinic type. FQHCs had the highest growth of sites per clinic organization, growing 8% to almost 4 sites per organization. FQHC Look Alikes had the lowest growth and the lowest number of sites per organization (1.6).
Distribution of Community Clinic Corporate Organizations by Type
2005 % 2006 % 2007 % 2008 %Change
2005–2008
Neither 99 39% 83 35% 81 34% 75 33% –24
FQHC-LA 55 21% 44 18% 34 14% 33 14% –22
FQHC 103 40% 113 47% 121 51% 122 53% 19
Total 257 100% 240 100% 236 100% 230 100%
Distribution of Community Clinic Sites by Type
2005 % 2006 % 2007 % 2008 %Change
2005–2008
Neither 226 33% 215 30% 202 28% 181 25% –45
FQHC-LA 83 12% 71 10% 59 8% 52 7% –31
FQHC 380 55% 422 60% 453 63% 486 68% 106
Total 689 100% 708 100% 714 100% 719 100%
Growth in Sites per Clinic Organization2005 2006 2007 2008 % Change
Neither 2.28 2.59 2.49 2.41 6%
FQHC-LA 1.51 1.61 1.74 1.58 4%
FQHC 3.69 3.73 3.74 3.98 8%
Total 2.68 2.95 3.03 3.13
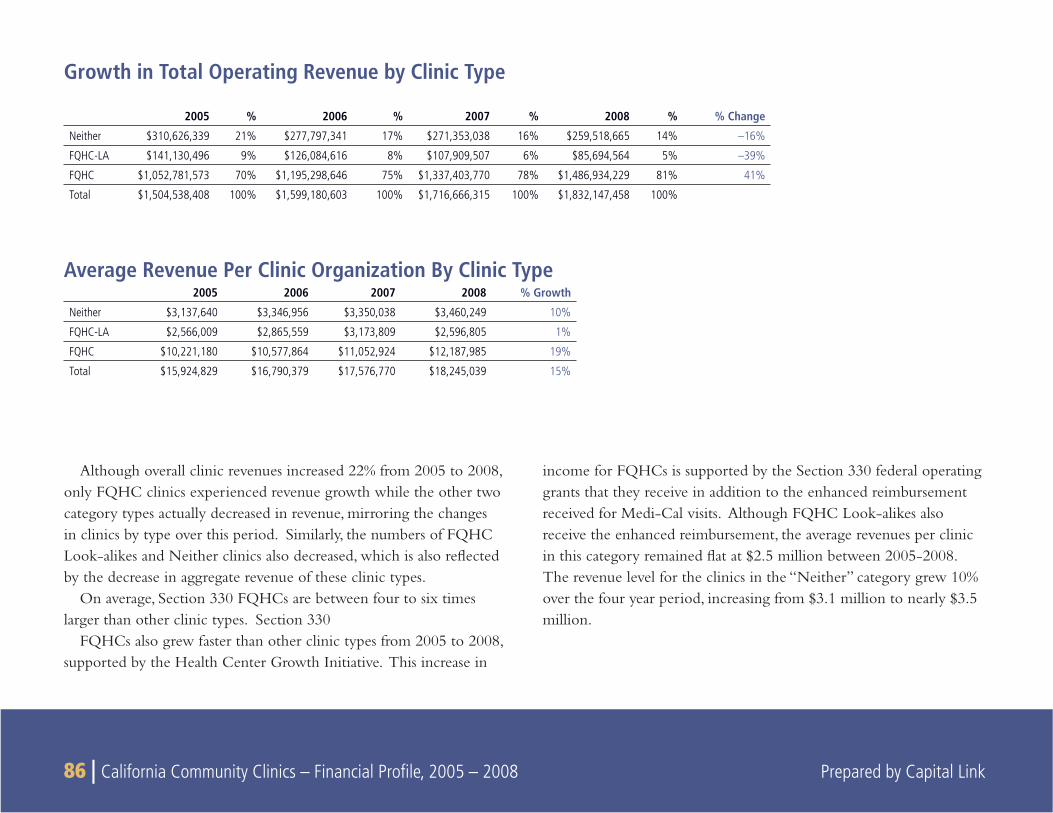
86 | California Community Clinics – Financial Profi le, 2005 – 2008 Prepared by Capital Link
Although overall clinic revenues increased 22% from 2005 to 2008, only FQHC clinics experienced revenue growth while the other two category types actually decreased in revenue, mirroring the changes in clinics by type over this period. Similarly, the numbers of FQHC Look-alikes and Neither clinics also decreased, which is also refl ected by the decrease in aggregate revenue of these clinic types.
On average, Section 330 FQHCs are between four to six times larger than other clinic types. Section 330
FQHCs also grew faster than other clinic types from 2005 to 2008, supported by the Health Center Growth Initiative. This increase in
income for FQHCs is supported by the Section 330 federal operating grants that they receive in addition to the enhanced reimbursement received for Medi-Cal visits. Although FQHC Look-alikes also receive the enhanced reimbursement, the average revenues per clinic in this category remained fl at at $2.5 million between 2005-2008. The revenue level for the clinics in the “Neither” category grew 10% over the four year period, increasing from $3.1 million to nearly $3.5 million.
Average Revenue Per Clinic Organization By Clinic Type2005 2006 2007 2008 % Growth
Neither $3,137,640 $3,346,956 $3,350,038 $3,460,249 10%
FQHC-LA $2,566,009 $2,865,559 $3,173,809 $2,596,805 1%
FQHC $10,221,180 $10,577,864 $11,052,924 $12,187,985 19%
Total $15,924,829 $16,790,379 $17,576,770 $18,245,039 15%
2005 % 2006 % 2007 % 2008 % % Change
Neither $310,626,339 21% $277,797,341 17% $271,353,038 16% $259,518,665 14% –16%
FQHC-LA $141,130,496 9% $126,084,616 8% $107,909,507 6% $85,694,564 5% –39%
FQHC $1,052,781,573 70% $1,195,298,646 75% $1,337,403,770 78% $1,486,934,229 81% 41%
Total $1,504,538,408 100% $1,599,180,603 100% $1,716,666,315 100% $1,832,147,458 100%
Growth in Total Operating Revenue by Clinic Type
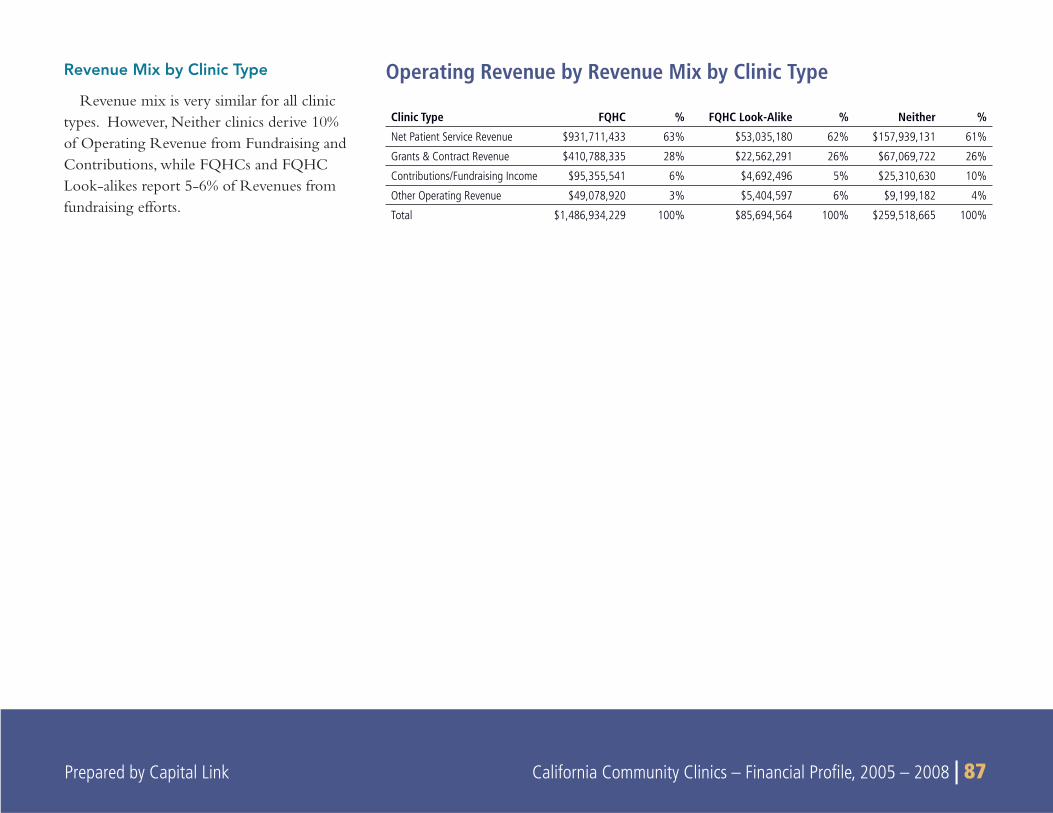
Prepared by Capital Link California Community Clinics – Financial Profi le, 2005 – 2008 | 87
Revenue Mix by Clinic Type
Revenue mix is very similar for all clinic types. However, Neither clinics derive 10% of Operating Revenue from Fundraising and Contributions, while FQHCs and FQHC Look-alikes report 5-6% of Revenues from fundraising efforts.
Clinic Type FQHC % FQHC Look-Alike % Neither %
Net Patient Service Revenue $931,711,433 63% $53,035,180 62% $157,939,131 61%
Grants & Contract Revenue $410,788,335 28% $22,562,291 26% $67,069,722 26%
Contributions/Fundraising Income $95,355,541 6% $4,692,496 5% $25,310,630 10%
Other Operating Revenue $49,078,920 3% $5,404,597 6% $9,199,182 4%
Total $1,486,934,229 100% $85,694,564 100% $259,518,665 100%
Operating Revenue by Revenue Mix by Clinic Type
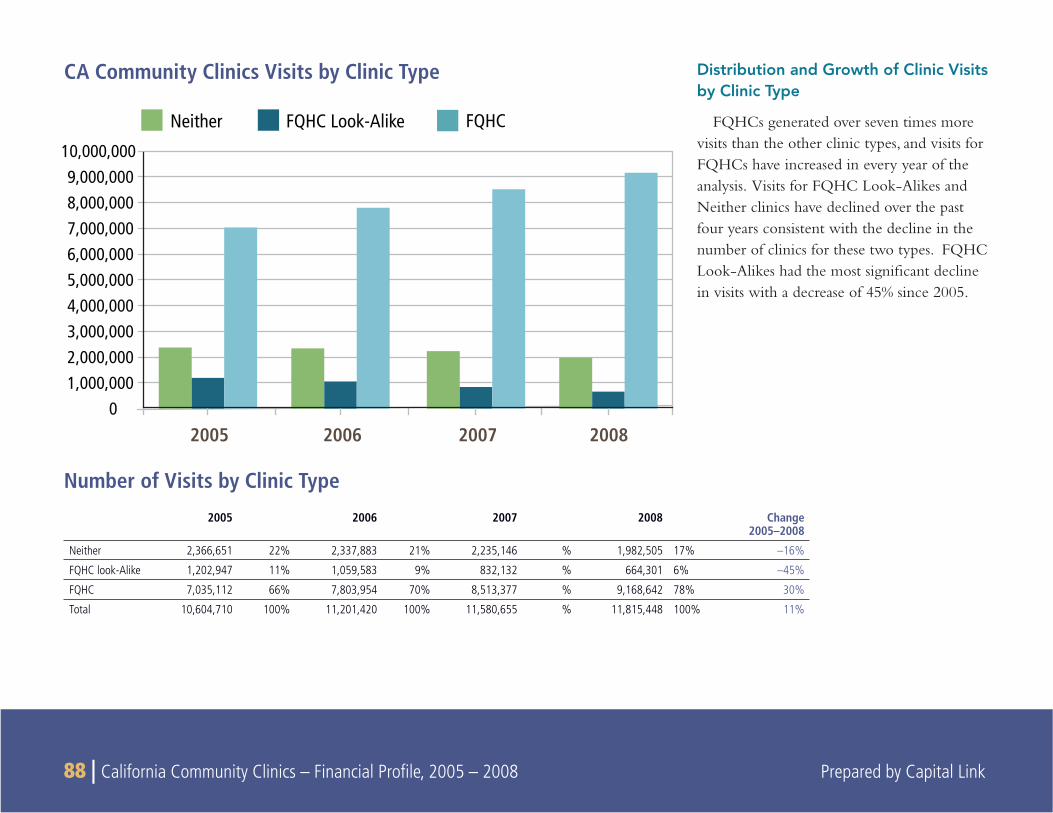
88 | California Community Clinics – Financial Profi le, 2005 – 2008 Prepared by Capital Link
Distribution and Growth of Clinic Visits by Clinic Type
FQHCs generated over seven times more visits than the other clinic types, and visits for FQHCs have increased in every year of the analysis. Visits for FQHC Look-Alikes and Neither clinics have declined over the past four years consistent with the decline in the number of clinics for these two types. FQHC Look-Alikes had the most signifi cant decline in visits with a decrease of 45% since 2005.
2005 2006 2007 2008 Change 2005–2008
Neither 2,366,651 22% 2,337,883 21% 2,235,146 % 1,982,505 17% –16%
FQHC look-Alike 1,202,947 11% 1,059,583 9% 832,132 % 664,301 6% –45%
FQHC 7,035,112 66% 7,803,954 70% 8,513,377 % 9,168,642 78% 30%
Total 10,604,710 100% 11,201,420 100% 11,580,655 % 11,815,448 100% 11%
Number of Visits by Clinic Type
CA Community Clinics Visits by Clinic Type
Neither FQHC Look-Alike FQHC
01,000,0002,000,0003,000,0004,000,0005,000,0006,000,0007,000,0008,000,0009,000,000
10,000,000
2005 2006 2007 2008
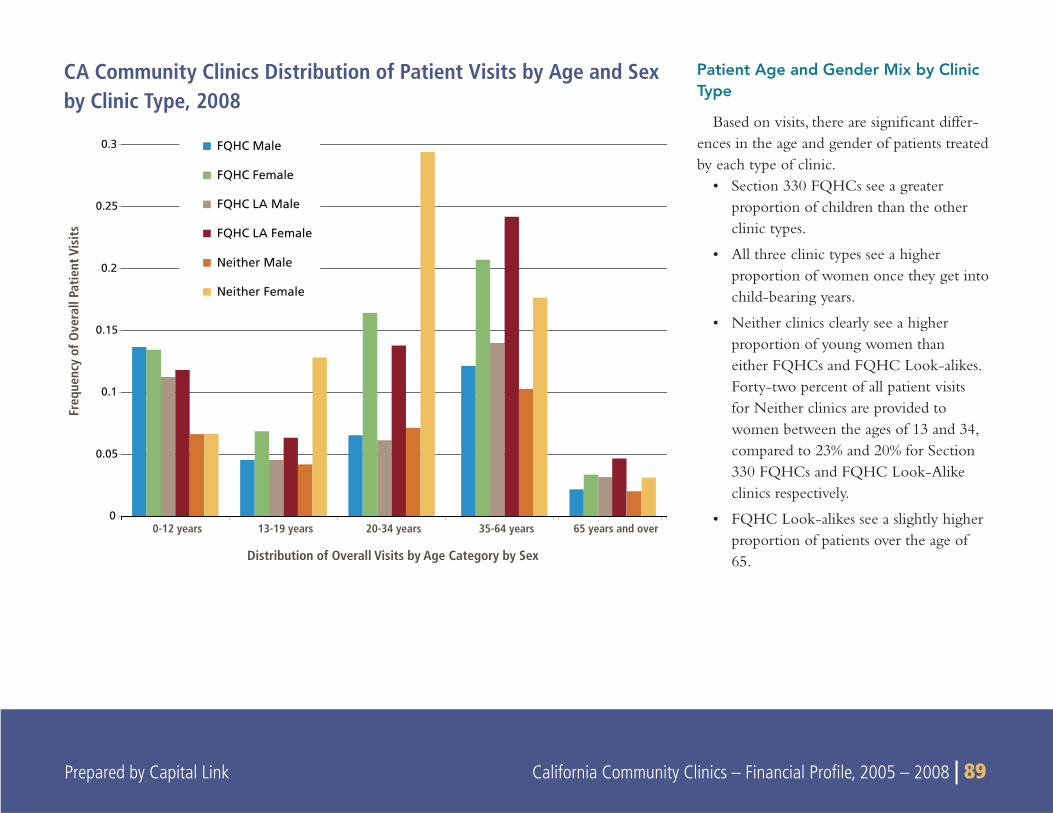
Prepared by Capital Link California Community Clinics – Financial Profi le, 2005 – 2008 | 89
Patient Age and Gender Mix by Clinic Type
Based on visits, there are signifi cant differ-ences in the age and gender of patients treated by each type of clinic.
Section 330 FQHCs see a greater • proportion of children than the other clinic types.
All three clinic types see a higher • proportion of women once they get into child-bearing years.
Neither clinics clearly see a higher • proportion of young women than either FQHCs and FQHC Look-alikes. Forty-two percent of all patient visits for Neither clinics are provided to women between the ages of 13 and 34, compared to 23% and 20% for Section 330 FQHCs and FQHC Look-Alike clinics respectively.
FQHC Look-alikes see a slightly higher • proportion of patients over the age of 65.
CA Community Clinics Distribution of Patient Visits by Age and Sex by Clinic Type, 2008
0
0.05
0.1
0.15
0.2
0.25
0.3
0-12 years 13-19 years 20-34 years 35-64 years 65 years and over
Distribution of Overall Visits by Age Category by Sex
Freq
uenc
y of
Ove
rall
Patie
nt V
isits
FQHC Male
FQHC Female
FQHC LA Male
FQHC LA Female
Neither Male
Neither Female
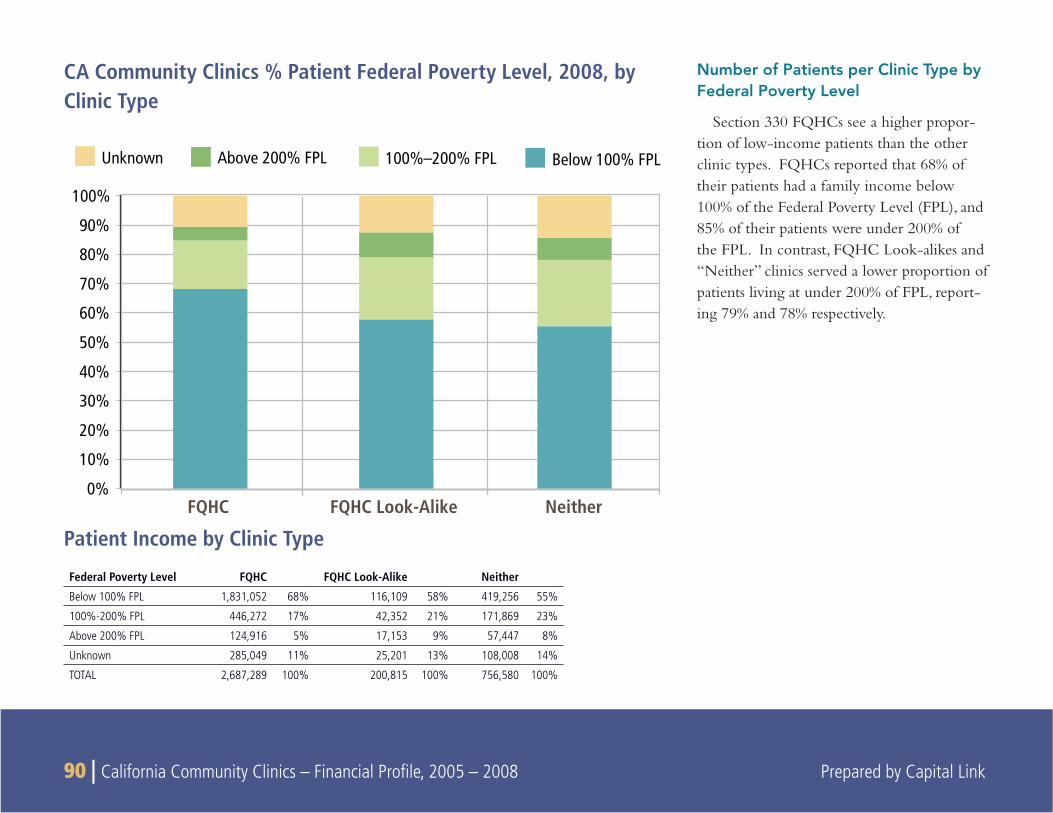
90 | California Community Clinics – Financial Profi le, 2005 – 2008 Prepared by Capital Link
Unknown Above 200% FPL 100%–200% FPL Below 100% FPL
0%
10%
20%
30%
40%
50%
60%
70%
80%
90%
100%
FQHC FQHC Look-Alike Neither
Number of Patients per Clinic Type by Federal Poverty Level
Section 330 FQHCs see a higher propor-tion of low-income patients than the other clinic types. FQHCs reported that 68% of their patients had a family income below 100% of the Federal Poverty Level (FPL), and 85% of their patients were under 200% of the FPL. In contrast, FQHC Look-alikes and “Neither” clinics served a lower proportion of patients living at under 200% of FPL, report-ing 79% and 78% respectively.
Federal Poverty Level FQHC FQHC Look-Alike Neither
Below 100% FPL 1,831,052 68% 116,109 58% 419,256 55%
100%-200% FPL 446,272 17% 42,352 21% 171,869 23%
Above 200% FPL 124,916 5% 17,153 9% 57,447 8%
Unknown 285,049 11% 25,201 13% 108,008 14%
TOTAL 2,687,289 100% 200,815 100% 756,580 100%
Patient Income by Clinic Type
CA Community Clinics % Patient Federal Poverty Level, 2008, by Clinic Type
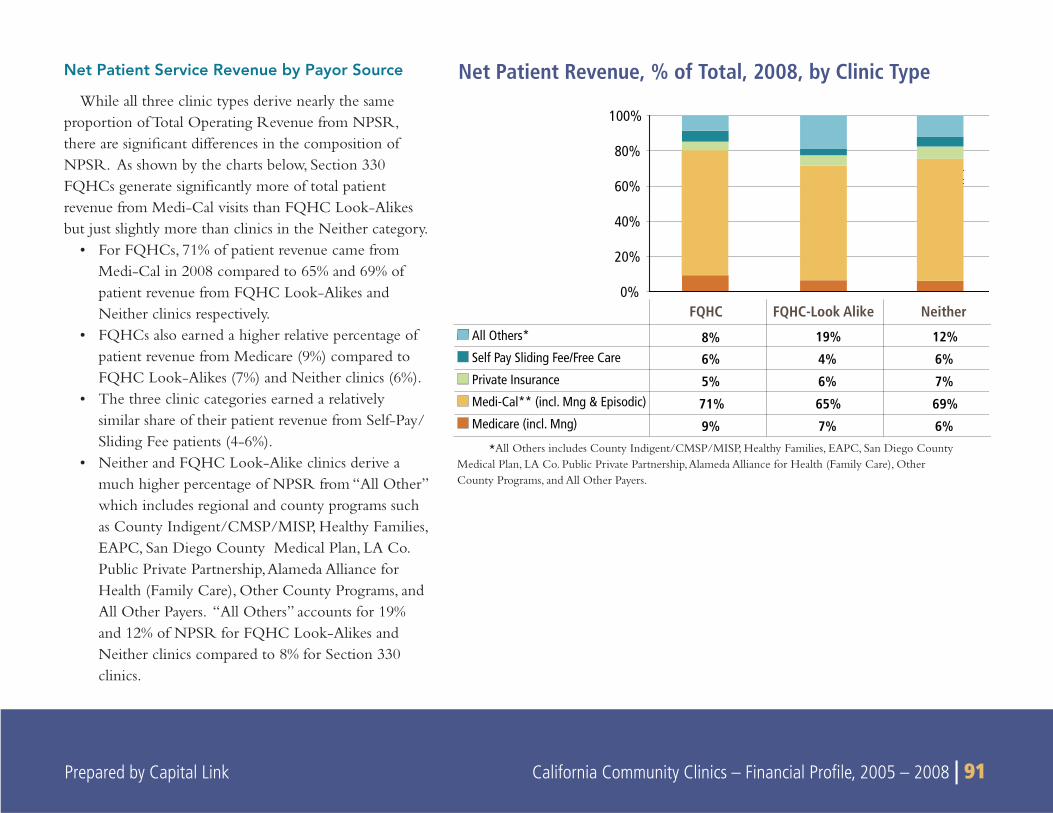
Prepared by Capital Link California Community Clinics – Financial Profi le, 2005 – 2008 | 91
Net Patient Service Revenue by Payor Source
While all three clinic types derive nearly the same proportion of Total Operating Revenue from NPSR, there are signifi cant differences in the composition of NPSR. As shown by the charts below, Section 330 FQHCs generate signifi cantly more of total patient revenue from Medi-Cal visits than FQHC Look-Alikes but just slightly more than clinics in the Neither category.
For FQHCs, 71% of patient revenue came from • Medi-Cal in 2008 compared to 65% and 69% of patient revenue from FQHC Look-Alikes and Neither clinics respectively.FQHCs also earned a higher relative percentage of • patient revenue from Medicare (9%) compared to FQHC Look-Alikes (7%) and Neither clinics (6%). The three clinic categories earned a relatively • similar share of their patient revenue from Self-Pay/Sliding Fee patients (4-6%).Neither and FQHC Look-Alike clinics derive a • much higher percentage of NPSR from “All Other” which includes regional and county programs such as County Indigent/CMSP/MISP, Healthy Families, EAPC, San Diego County Medical Plan, LA Co. Public Private Partnership, Alameda Alliance for Health (Family Care), Other County Programs, and All Other Payers. “All Others” accounts for 19% and 12% of NPSR for FQHC Look-Alikes and Neither clinics compared to 8% for Section 330 clinics.
*All Others includes County Indigent/CMSP/MISP, Healthy Families, EAPC, San Diego County Medical Plan, LA Co. Public Private Partnership, Alameda Alliance for Health (Family Care), Other County Programs, and All Other Payers.
0%
20%
40%
60%
80%
100%
8% 19% 12%
6% 4% 6%
5% 6% 7%
71% 65% 69%
9% 7% 6%
FQHC FQHC-Look Alike Neither
All Others*
Self Pay Sliding Fee/Free Care
Private Insurance
Medi-Cal** (incl. Mng & Episodic)
Medicare (incl. Mng)
Net Patient Revenue, % of Total, 2008, by Clinic Type
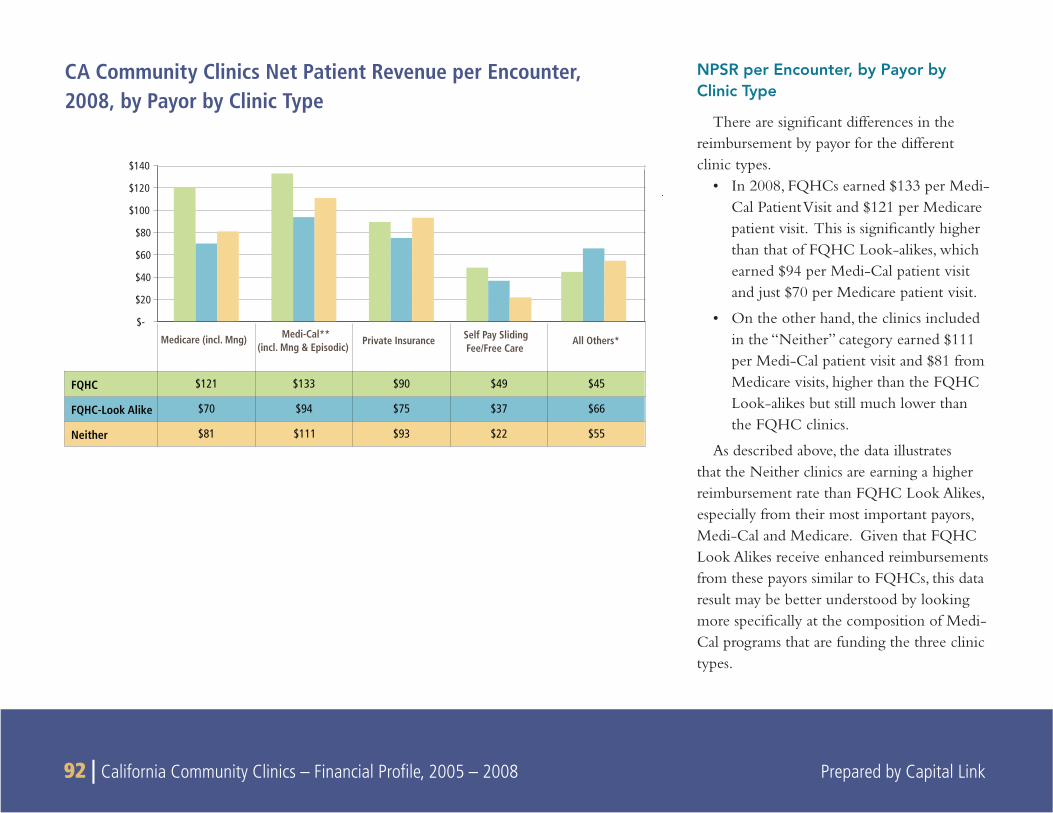
92 | California Community Clinics – Financial Profi le, 2005 – 2008 Prepared by Capital Link
NPSR per Encounter, by Payor by Clinic Type
There are signifi cant differences in the reimbursement by payor for the different clinic types.
In 2008, FQHCs earned $133 per Medi-• Cal Patient Visit and $121 per Medicare patient visit. This is signifi cantly higher than that of FQHC Look-alikes, which earned $94 per Medi-Cal patient visit and just $70 per Medicare patient visit.
On the other hand, the clinics included • in the “Neither” category earned $111 per Medi-Cal patient visit and $81 from Medicare visits, higher than the FQHC Look-alikes but still much lower than the FQHC clinics.
As described above, the data illustrates that the Neither clinics are earning a higher reimbursement rate than FQHC Look Alikes, especially from their most important payors, Medi-Cal and Medicare. Given that FQHC Look Alikes receive enhanced reimbursements from these payors similar to FQHCs, this data result may be better understood by looking more specifi cally at the composition of Medi-Cal programs that are funding the three clinic types.
CA Community Clinics Net Patient Revenue per Encounter, 2008, by Payor by Clinic Type
$-
$20
$40
$60
$80
$100
$120
$140
FQHC $121 $133 $90 $49 $45
FQHC-Look Alike $70 $94 $75 $37 $66
Neither $81 $111 $93 $22 $55
Medicare (incl. Mng) Medi-Cal** (incl. Mng & Episodic)
Private Insurance Self Pay Sliding Fee/Free Care
All Others*
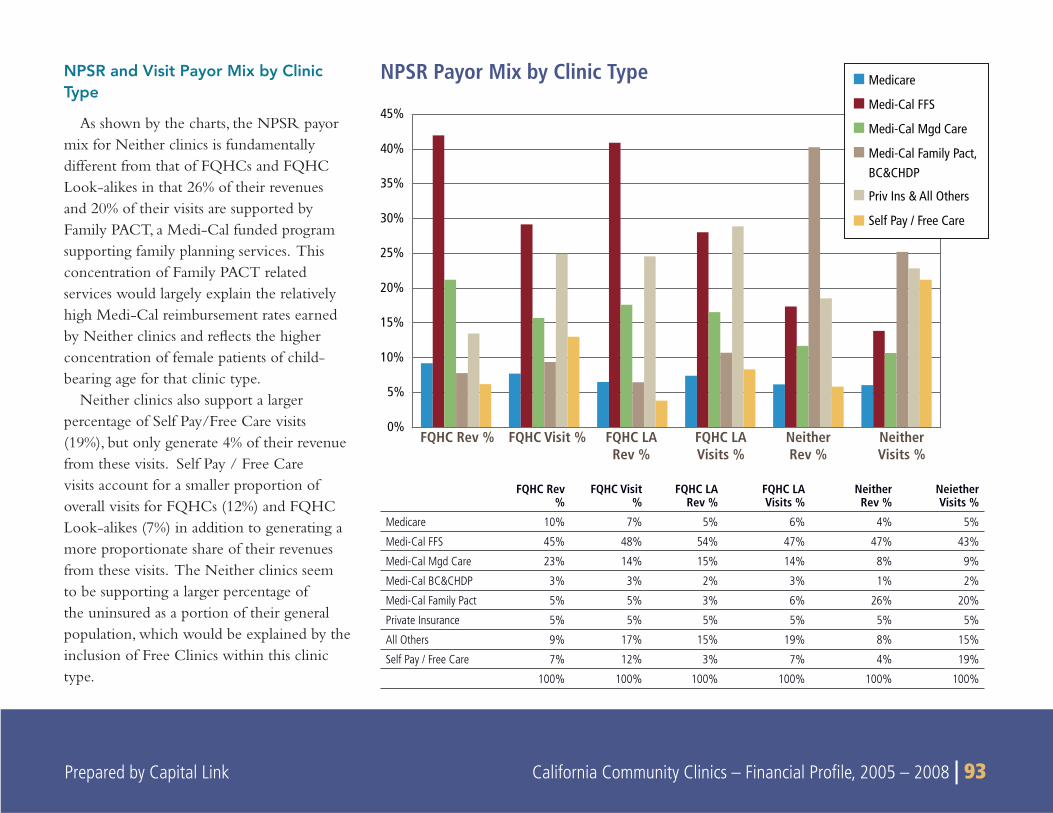
Prepared by Capital Link California Community Clinics – Financial Profi le, 2005 – 2008 | 93
0%
5%
10%
15%
20%
25%
30%
35%
40%
45%
FQHC Rev % FQHC Visit % FQHC LARev %
FQHC LAVisits %
NeitherRev %
NeitherVisits %
Medicare
Medi-Cal FFS
Medi-Cal Mgd Care
Medi-Cal Family Pact,BC&CHDP
Priv Ins & All Others
Self Pay / Free Care
NPSR and Visit Payor Mix by Clinic Type
As shown by the charts, the NPSR payor mix for Neither clinics is fundamentally different from that of FQHCs and FQHC Look-alikes in that 26% of their revenues and 20% of their visits are supported by Family PACT, a Medi-Cal funded program supporting family planning services. This concentration of Family PACT related services would largely explain the relatively high Medi-Cal reimbursement rates earned by Neither clinics and refl ects the higher concentration of female patients of child-bearing age for that clinic type.
Neither clinics also support a larger percentage of Self Pay/Free Care visits (19%), but only generate 4% of their revenue from these visits. Self Pay / Free Care visits account for a smaller proportion of overall visits for FQHCs (12%) and FQHC Look-alikes (7%) in addition to generating a more proportionate share of their revenues from these visits. The Neither clinics seem to be supporting a larger percentage of the uninsured as a portion of their general population, which would be explained by the inclusion of Free Clinics within this clinic type.
NPSR Payor Mix by Clinic Type
FQHC Rev %
FQHC Visit%
FQHC LA Rev %
FQHC LA Visits %
Neither Rev %
Neiether Visits %
Medicare 10% 7% 5% 6% 4% 5%
Medi-Cal FFS 45% 48% 54% 47% 47% 43%
Medi-Cal Mgd Care 23% 14% 15% 14% 8% 9%
Medi-Cal BC&CHDP 3% 3% 2% 3% 1% 2%
Medi-Cal Family Pact 5% 5% 3% 6% 26% 20%
Private Insurance 5% 5% 5% 5% 5% 5%
All Others 9% 17% 15% 19% 8% 15%
Self Pay / Free Care 7% 12% 3% 7% 4% 19%
100% 100% 100% 100% 100% 100%
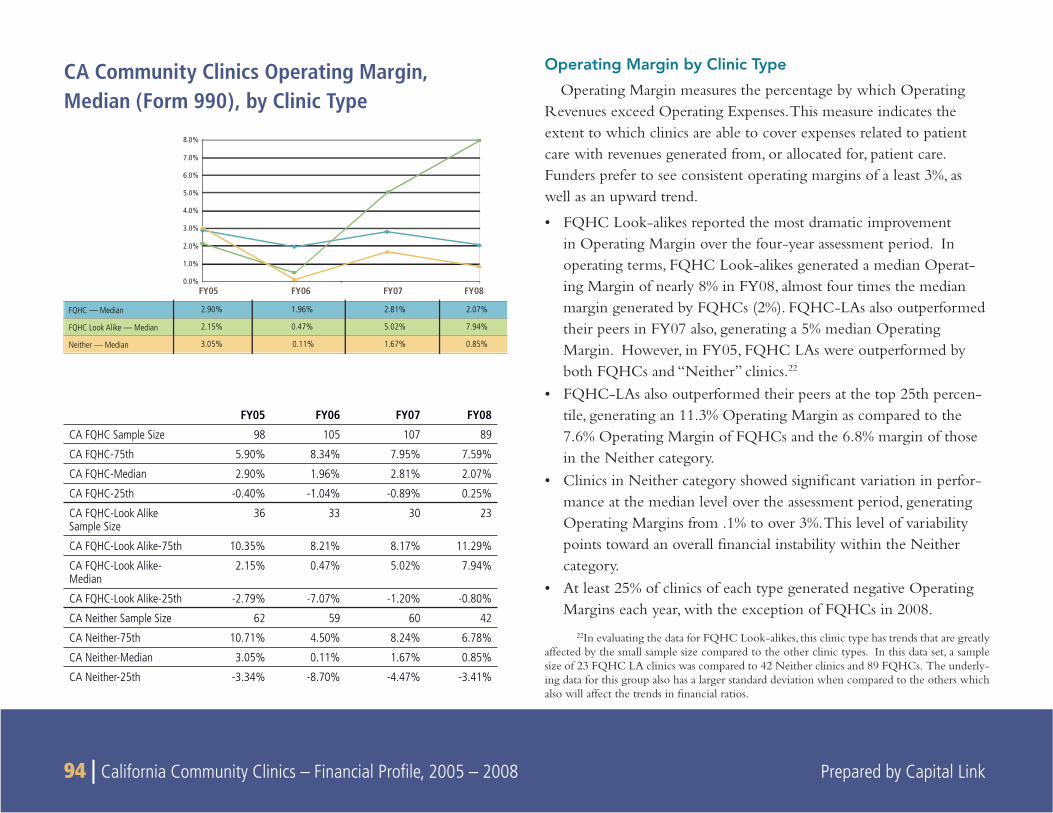
94 | California Community Clinics – Financial Profi le, 2005 – 2008 Prepared by Capital Link
Operating Margin by Clinic Type
Operating Margin measures the percentage by which Operating Revenues exceed Operating Expenses. This measure indicates the extent to which clinics are able to cover expenses related to patient care with revenues generated from, or allocated for, patient care. Funders prefer to see consistent operating margins of a least 3%, as well as an upward trend.
FQHC Look-alikes reported the most dramatic improvement • in Operating Margin over the four-year assessment period. In operating terms, FQHC Look-alikes generated a median Operat-ing Margin of nearly 8% in FY08, almost four times the median margin generated by FQHCs (2%). FQHC-LAs also outperformed their peers in FY07 also, generating a 5% median Operating Margin. However, in FY05, FQHC LAs were outperformed by both FQHCs and “Neither” clinics.22
FQHC-LAs also outperformed their peers at the top 25th percen-• tile, generating an 11.3% Operating Margin as compared to the 7.6% Operating Margin of FQHCs and the 6.8% margin of those in the Neither category.Clinics in Neither category showed signifi cant variation in perfor-• mance at the median level over the assessment period, generating Operating Margins from .1% to over 3%. This level of variability points toward an overall fi nancial instability within the Neither category. At least 25% of clinics of each type generated negative Operating • Margins each year, with the exception of FQHCs in 2008.
22In evaluating the data for FQHC Look-alikes, this clinic type has trends that are greatly affected by the small sample size compared to the other clinic types. In this data set, a sample size of 23 FQHC LA clinics was compared to 42 Neither clinics and 89 FQHCs. The underly-ing data for this group also has a larger standard deviation when compared to the others which also will affect the trends in fi nancial ratios.
CA Community Clinics Operating Margin, Median (Form 990), by Clinic Type
FY05 FY06 FY07 FY08
CA FQHC Sample Size 98 105 107 89
CA FQHC-75th 5.90% 8.34% 7.95% 7.59%
CA FQHC-Median 2.90% 1.96% 2.81% 2.07%
CA FQHC-25th -0.40% -1.04% -0.89% 0.25%
CA FQHC-Look Alike Sample Size
36 33 30 23
CA FQHC-Look Alike-75th 10.35% 8.21% 8.17% 11.29%
CA FQHC-Look Alike-Median
2.15% 0.47% 5.02% 7.94%
CA FQHC-Look Alike-25th -2.79% -7.07% -1.20% -0.80%
CA Neither Sample Size 62 59 60 42
CA Neither-75th 10.71% 4.50% 8.24% 6.78%
CA Neither-Median 3.05% 0.11% 1.67% 0.85%
CA Neither-25th -3.34% -8.70% -4.47% -3.41%
FQHC — Median 2.90% 1.96% 2.81% 2.07%
FQHC Look Alike — Median 2.15% 0.47% 5.02% 7.94%
Neither — Median 3.05% 0.11% 1.67% 0.85%
FY05 FY06 FY07 FY080.0%
1.0%
2.0%
3.0%
4.0%
5.0%
6.0%
7.0%
8.0%
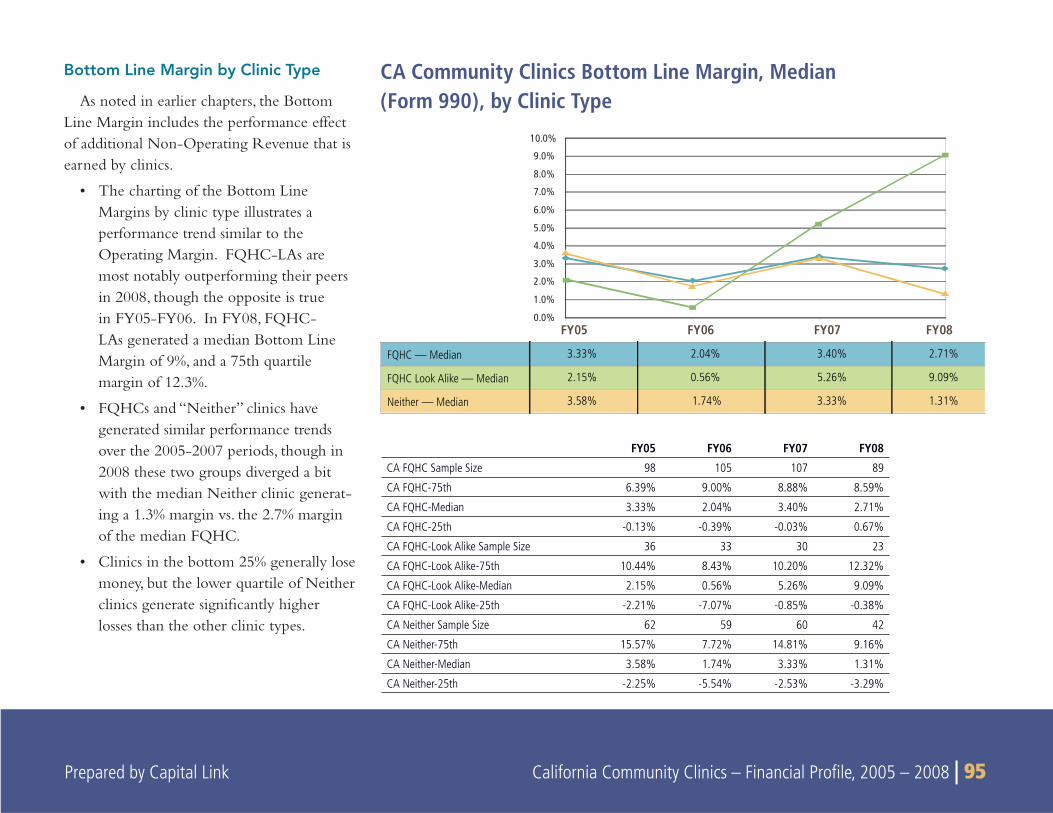
Prepared by Capital Link California Community Clinics – Financial Profi le, 2005 – 2008 | 95
Bottom Line Margin by Clinic Type
As noted in earlier chapters, the Bottom Line Margin includes the performance effect of additional Non-Operating Revenue that is earned by clinics.
The charting of the Bottom Line • Margins by clinic type illustrates a performance trend similar to the Operating Margin. FQHC-LAs are most notably outperforming their peers in 2008, though the opposite is true in FY05-FY06. In FY08, FQHC-LAs generated a median Bottom Line Margin of 9%, and a 75th quartile margin of 12.3%.
FQHCs and “Neither” clinics have • generated similar performance trends over the 2005-2007 periods, though in 2008 these two groups diverged a bit with the median Neither clinic generat-ing a 1.3% margin vs. the 2.7% margin of the median FQHC.
Clinics in the bottom 25% generally lose • money, but the lower quartile of Neither clinics generate signifi cantly higher losses than the other clinic types.
CA Community Clinics Bottom Line Margin, Median (Form 990), by Clinic Type
FY05 FY06 FY07 FY08
CA FQHC Sample Size 98 105 107 89
CA FQHC-75th 6.39% 9.00% 8.88% 8.59%
CA FQHC-Median 3.33% 2.04% 3.40% 2.71%
CA FQHC-25th -0.13% -0.39% -0.03% 0.67%
CA FQHC-Look Alike Sample Size 36 33 30 23
CA FQHC-Look Alike-75th 10.44% 8.43% 10.20% 12.32%
CA FQHC-Look Alike-Median 2.15% 0.56% 5.26% 9.09%
CA FQHC-Look Alike-25th -2.21% -7.07% -0.85% -0.38%
CA Neither Sample Size 62 59 60 42
CA Neither-75th 15.57% 7.72% 14.81% 9.16%
CA Neither-Median 3.58% 1.74% 3.33% 1.31%
CA Neither-25th -2.25% -5.54% -2.53% -3.29%
FQHC — Median 3.33% 2.04% 3.40% 2.71%
FQHC Look Alike — Median 2.15% 0.56% 5.26% 9.09%
Neither — Median 3.58% 1.74% 3.33% 1.31%
FY05 FY06 FY07 FY080.0%
1.0%
2.0%
3.0%
4.0%
5.0%
6.0%
7.0%
8.0%
9.0%
10.0%
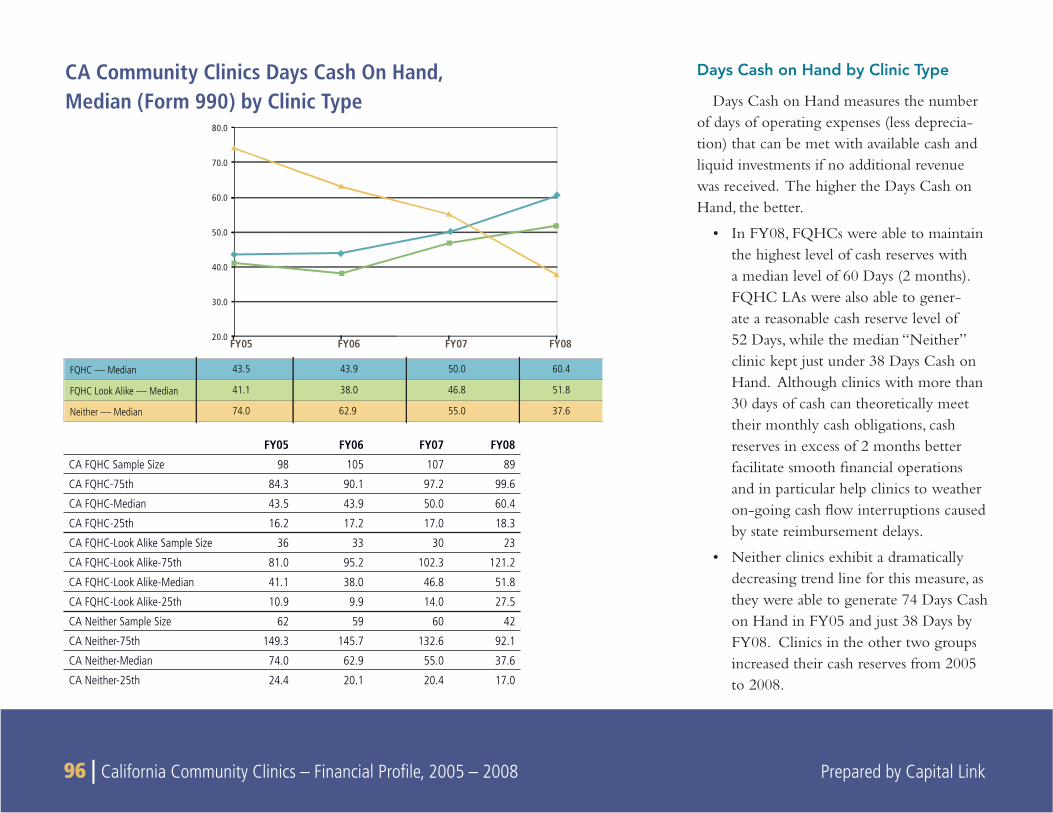
96 | California Community Clinics – Financial Profi le, 2005 – 2008 Prepared by Capital Link
Days Cash on Hand by Clinic Type
Days Cash on Hand measures the number of days of operating expenses (less deprecia-tion) that can be met with available cash and liquid investments if no additional revenue was received. The higher the Days Cash on Hand, the better.
In FY08, FQHCs were able to maintain • the highest level of cash reserves with a median level of 60 Days (2 months). FQHC LAs were also able to gener-ate a reasonable cash reserve level of 52 Days, while the median “Neither” clinic kept just under 38 Days Cash on Hand. Although clinics with more than 30 days of cash can theoretically meet their monthly cash obligations, cash reserves in excess of 2 months better facilitate smooth fi nancial operations and in particular help clinics to weather on-going cash fl ow interruptions caused by state reimbursement delays.
Neither clinics exhibit a dramatically • decreasing trend line for this measure, as they were able to generate 74 Days Cash on Hand in FY05 and just 38 Days by FY08. Clinics in the other two groups increased their cash reserves from 2005 to 2008.
CA Community Clinics Days Cash On Hand, Median (Form 990) by Clinic Type
FQHC — Median 43.5 43.9 50.0 60.4
FQHC Look Alike — Median 41.1 38.0 46.8 51.8
Neither — Median 74.0 62.9 55.0 37.6
FY05 FY06 FY07 FY0820.0
30.0
40.0
50.0
60.0
70.0
80.0
FY05 FY06 FY07 FY08
CA FQHC Sample Size 98 105 107 89
CA FQHC-75th 84.3 90.1 97.2 99.6
CA FQHC-Median 43.5 43.9 50.0 60.4
CA FQHC-25th 16.2 17.2 17.0 18.3
CA FQHC-Look Alike Sample Size 36 33 30 23
CA FQHC-Look Alike-75th 81.0 95.2 102.3 121.2
CA FQHC-Look Alike-Median 41.1 38.0 46.8 51.8
CA FQHC-Look Alike-25th 10.9 9.9 14.0 27.5
CA Neither Sample Size 62 59 60 42
CA Neither-75th 149.3 145.7 132.6 92.1
CA Neither-Median 74.0 62.9 55.0 37.6
CA Neither-25th 24.4 20.1 20.4 17.0
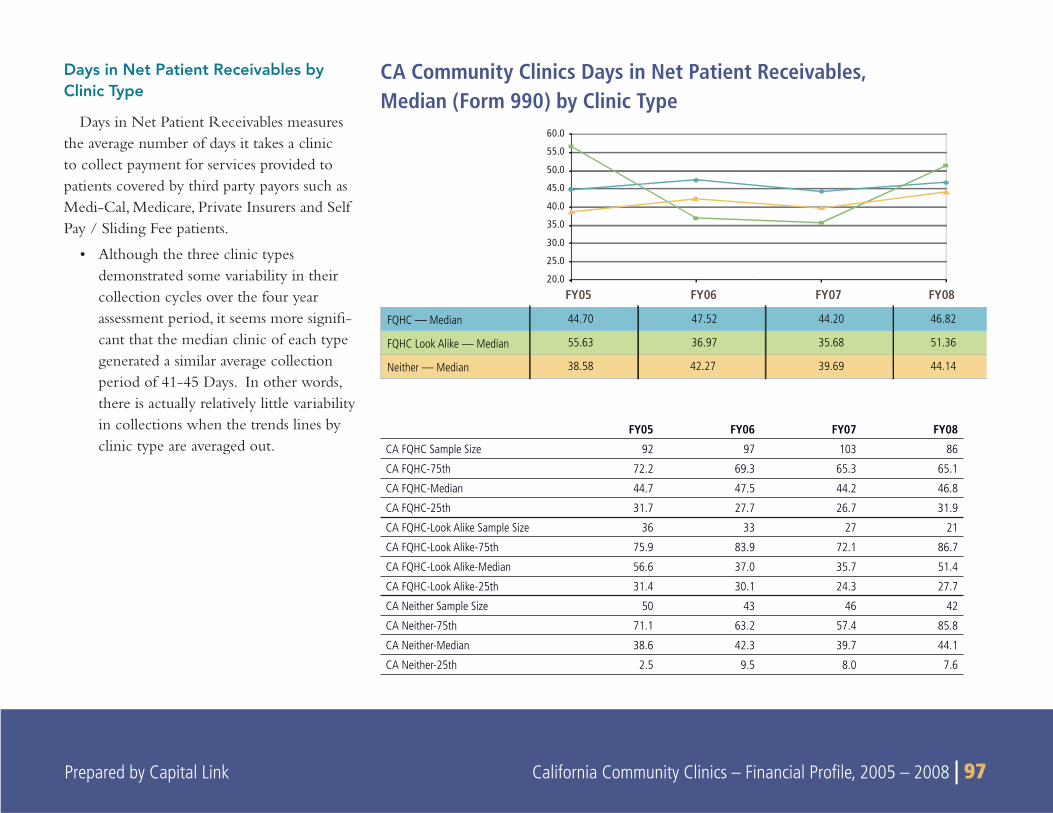
Prepared by Capital Link California Community Clinics – Financial Profi le, 2005 – 2008 | 97
Days in Net Patient Receivables by Clinic Type
Days in Net Patient Receivables measures the average number of days it takes a clinic to collect payment for services provided to patients covered by third party payors such as Medi-Cal, Medicare, Private Insurers and Self Pay / Sliding Fee patients.
Although the three clinic types • demonstrated some variability in their collection cycles over the four year assessment period, it seems more signifi -cant that the median clinic of each type generated a similar average collection period of 41-45 Days. In other words, there is actually relatively little variability in collections when the trends lines by clinic type are averaged out.
CA Community Clinics Days in Net Patient Receivables, Median (Form 990) by Clinic Type
FY05 FY06 FY07 FY08
CA FQHC Sample Size 92 97 103 86
CA FQHC-75th 72.2 69.3 65.3 65.1
CA FQHC-Median 44.7 47.5 44.2 46.8
CA FQHC-25th 31.7 27.7 26.7 31.9
CA FQHC-Look Alike Sample Size 36 33 27 21
CA FQHC-Look Alike-75th 75.9 83.9 72.1 86.7
CA FQHC-Look Alike-Median 56.6 37.0 35.7 51.4
CA FQHC-Look Alike-25th 31.4 30.1 24.3 27.7
CA Neither Sample Size 50 43 46 42
CA Neither-75th 71.1 63.2 57.4 85.8
CA Neither-Median 38.6 42.3 39.7 44.1
CA Neither-25th 2.5 9.5 8.0 7.6
FQHC — Median 44.70 47.52 44.20 46.82
FQHC Look Alike — Median 55.63 36.97 35.68 51.36
Neither — Median 38.58 42.27 39.69 44.14
FY05 FY06 FY07 FY0820.0
25.0
30.0
35.0
40.0
45.0
50.0
55.0
60.0
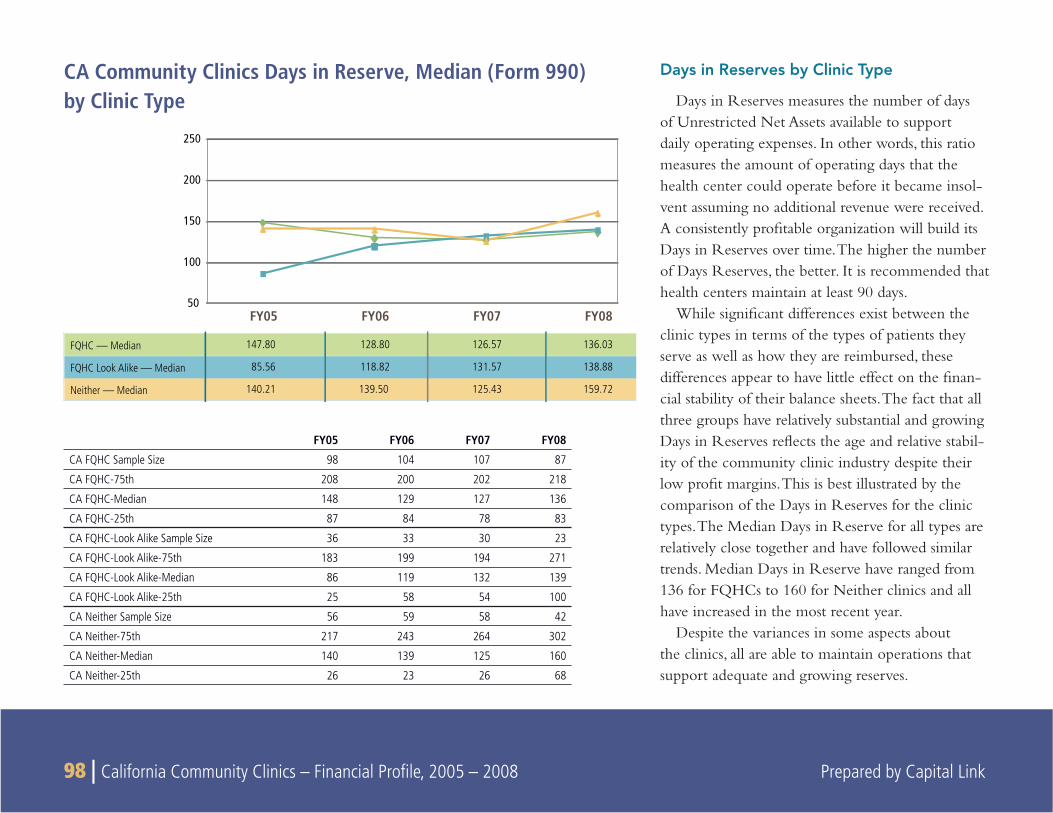
98 | California Community Clinics – Financial Profi le, 2005 – 2008 Prepared by Capital Link
Days in Reserves by Clinic Type
Days in Reserves measures the number of days of Unrestricted Net Assets available to support daily operating expenses. In other words, this ratio measures the amount of operating days that the health center could operate before it became insol-vent assuming no additional revenue were received. A consistently profi table organization will build its Days in Reserves over time. The higher the number of Days Reserves, the better. It is recommended that health centers maintain at least 90 days.
While signifi cant differences exist between the clinic types in terms of the types of patients they serve as well as how they are reimbursed, these differences appear to have little effect on the fi nan-cial stability of their balance sheets. The fact that all three groups have relatively substantial and growing Days in Reserves refl ects the age and relative stabil-ity of the community clinic industry despite their low profi t margins. This is best illustrated by the comparison of the Days in Reserves for the clinic types. The Median Days in Reserve for all types are relatively close together and have followed similar trends. Median Days in Reserve have ranged from 136 for FQHCs to 160 for Neither clinics and all have increased in the most recent year.
Despite the variances in some aspects about the clinics, all are able to maintain operations that support adequate and growing reserves.
FY05 FY06 FY07 FY08
CA FQHC Sample Size 98 104 107 87
CA FQHC-75th 208 200 202 218
CA FQHC-Median 148 129 127 136
CA FQHC-25th 87 84 78 83
CA FQHC-Look Alike Sample Size 36 33 30 23
CA FQHC-Look Alike-75th 183 199 194 271
CA FQHC-Look Alike-Median 86 119 132 139
CA FQHC-Look Alike-25th 25 58 54 100
CA Neither Sample Size 56 59 58 42
CA Neither-75th 217 243 264 302
CA Neither-Median 140 139 125 160
CA Neither-25th 26 23 26 68
FQHC — Median 147.80 128.80 126.57 136.03
FQHC Look Alike — Median 85.56 118.82 131.57 138.88
Neither — Median 140.21 139.50 125.43 159.72
50
100
150
200
250
FY05 FY06 FY07 FY08
CA Community Clinics Days in Reserve, Median (Form 990)by Clinic Type
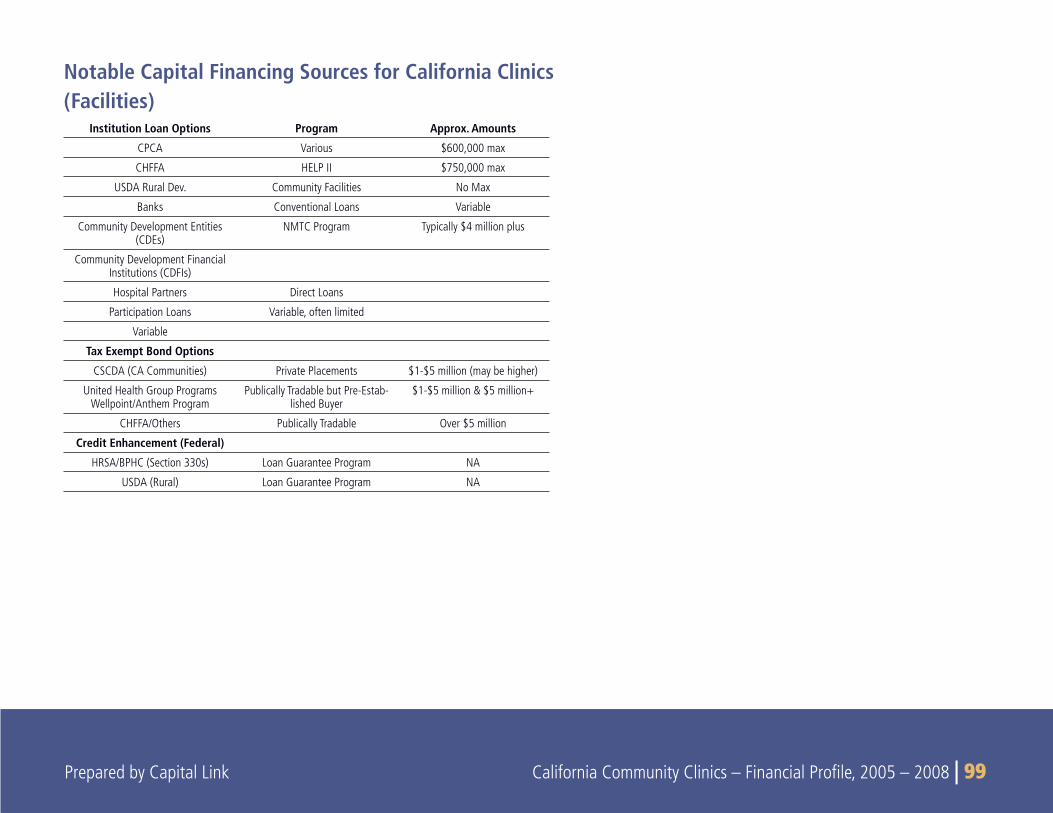
Prepared by Capital Link California Community Clinics – Financial Profi le, 2005 – 2008 | 99 Prepared by Capital Link California Community Clinics – Financial Profi le, 2005 – 2008 | 99
Notable Capital Financing Sources for California Clinics (Facilities)
Institution Loan Options Program Approx. Amounts
CPCA Various $600,000 max
CHFFA HELP II $750,000 max
USDA Rural Dev. Community Facilities No Max
Banks Conventional Loans Variable
Community Development Entities (CDEs)
NMTC Program Typically $4 million plus
Community Development Financial Institutions (CDFIs)
Hospital Partners Direct Loans
Participation Loans Variable, often limited
Variable
Tax Exempt Bond Options
CSCDA (CA Communities) Private Placements $1-$5 million (may be higher)
United Health Group Programs Wellpoint/Anthem Program
Publically Tradable but Pre-Estab-lished Buyer
$1-$5 million & $5 million+
CHFFA/Others Publically Tradable Over $5 million
Credit Enhancement (Federal)
HRSA/BPHC (Section 330s) Loan Guarantee Program NA
USDA (Rural) Loan Guarantee Program NA
100 | California Community Clinics – Financial Profi le, 2005 – 2008 Prepared by Capital Link
COMMUNITY CLINICS have traditionally encountered diffi culties in obtaining fi nancing for the building and equipment projects they
need in order to expand access to health care services in their commu-nities. This challenge to accessing credit is attributable to clinics’ heavy reliance on public payors and grant support, slim operating margins and meager cash reserves. In combination, these factors make clinics a “diffi cult credit” from a conventional lenders’ point of view. For similar reasons, clinics are typically “debt averse” organizations, wary of relying too much on borrowed funds to pursue their capital expansion agendas. As a result, community clinics have traditionally looked to outside sources of equity to fund the majority of their capital project budgets while using debt as a secondary source to meet their project funding gaps.
ACCESS TO PROJECT EQUITYProject “equity” may partially consist of internal cash, though more
typically it is comprised of external cash raised by capital campaigns, as well as from outside private and public grant sources. Internal cash reserves of community clinics are typically limited to cover basic operating requirements. At the same time, funds from external sources are always in high demand and in limited supply, requiring signifi cant time and effort to apply for and secure. As a result, community clinics often take many years to cobble together multiple sources of funding
for a single project. During this lengthy and complicated process, project costs invariably escalate, further exacerbating the challenge of raising the needed capital.
Clinics in California have been relatively fortunate compared to their peers in other states as there have been several sources of major capital grant funding in recent years that helped support facility expan-sion requirements. Three of the most signifi cant statewide capital programs in recent years that fully allocated available funds include:
The Cedillo-Alarcon Community Investment Act (2000): • This law authorized the California Health Facilities Financing Authority to provide grants for clinic capital projects. Altogether $52.3 million in grant funding was dispersed to clinics through the program.
The Community Clinic Grant Program funded by • Wellpoint/Anthem merger (2005): Through this program, $40.1 million in grant funding was provided to clinics to allow them to purchase new equipment, expand and/or refurbish exist-ing facilities and generate new construction.
The Community Clinics Initiative (2002-2007), a joint • effort of Tides and The California Endowment: The Major Capital Grant component of this $69 million program provided a total of $12.6 million in grants for clinic facility and equipment projects.
10
CLINICS AND CAPITAL ACCESS
Prepared by Capital Link California Community Clinics – Financial Profi le, 2005 – 2008 | 101 Prepared by Capital Link California Community Clinics – Financial Profi le, 2005 – 2008 | 101
These funding programs were primarily capitalized either directly or indirectly as a result of regulated set-asides created by mergers and acquisitions in the California health insurance industry. Capital dollars associated with these funding initiatives were awarded on a competi-tive basis and the programs ultimately ran their course. These funding sources, which in the aggregate totaled $105 million, played an criti-cal role in allowing clinics to grow as rapidly as they have in recent years. The fact that none of these programs is currently active makes it that much more challenging for clinics to continue to expand infra-structure, particularly over the near term as credit requirements are remain stringent and debt fi nancing generally less available, in particu-lar for non-traditional borrowers such as community health clinics.
ACCESS TO CONVENTIONAL FUNDINGAs clinics become increasingly more sophisticated in their fi nan-
cial management capacity, they are more apt to look to borrowing opportunities to meet their short term fi nancial needs as well as to make the capital investments necessary to make them viable long-term providers of primary care services. Nevertheless, it is important to clarify the credit factors that may prohibit clinics from accessing loans from traditional lenders who determine them to be high risk. In general, banks undergo a rigorous credit review process before approv-ing a loan proposal. Standard bank underwriting will tend to focus on fi ve primary credit criteria to evaluate the credit worthiness of a borrower. These fi ve areas typically include an analysis of clinic cash fl ow capacity, collateral considerations, management capacity, credit history, and market issues, including competition and customer base.
Although all of these credit assessment areas are important, the cash fl ow obstacle often represents the biggest hurdle for clinics in the
attempt to gain fi nancing. Credit proposals are typically evaluated on the fi nancial plan that shows that the borrower can afford to make the loan payments based on the cash fl ow that it expects to generate from its monthly operations. Generally speaking, lending institutions will want to see that the clinic can generate a cash fl ow that is more than suffi cient to cover operational needs in addition to the required loan payment. This approach gives the lender some comfort that the clinic can meet its loan payments despite minor variations in monthly cash fl ow. The challenge for community clinics is that cash fl ow is typically very tight, often with insuffi cient surpluses to meet these types of credit requirements.
In addition to tight margins, community clinics have the additional burden of being a subset of nonprofi t borrowers with whom many conventional lenders have little familiarity. Clearly, if the bank is not already familiar with the individual clinic and/or the unique characteristics of this sector of the healthcare industry and its revenue streams, it becomes even more challenging for it to gain a comfort level with the tight and uneven cash fl ow of most centers. More specifi cally, a banker may not completely understand the nonprofi t structure, the longer account collection cycles, the dependency on grant revenue, or how to collateralize government receivables. Also, most community clinics do not have large balance sheets with substan-tial investments, like many hospitals.
Despite these obstacles, community clinics have been able to successfully partner with lending institutions to meet their fi nancing needs. It is important to remember that community clinics already have signifi cant depository relationships with banks, and these can often be leveraged into a credit relationship as well. Clinics can also benefi t from working with the community development depart-
102 | California Community Clinics – Financial Profi le, 2005 – 2008 Prepared by Capital Link
ment of the bank rather than the commercial lending section. This avenue may allow the bank to recognize opportunities for meeting community development obligations and public relations opportuni-ties. Ultimately however, the bank will still require a comprehensive fi nancial plan that incorporates the proposed fi nancing. It remains incumbent on the community clinic to convince the bank that the plan makes good fi nancial sense and that it is reasonable to believe that the community clinic can meet the objectives of the plan.
Many clinics have successfully established revolving lines of credit with local banks. These credit lines are designed to meet short-term borrowing needs caused by fl uctuations in the operating cash fl ow cycle. For example, if a clinic needs to make payroll at the end of the week, but does not have enough cash due to a delay in receiv-ing a Medi-Cal payment (such has happened due to approval delays of the state budget), then a line of credit would be an appropriate credit tool to overcome this timing challenge. In this case, funds could be borrowed from the line of credit in order to make payroll, and the operating loan can be paid down upon receipt of the Medi-Cal funds. Lines of credit are designed to be fl exible, in that they are structured to be drawn upon as needed. The actual outstanding loan balance typically fl uctuates up and down throughout the life of the loan according to the community clinic’s need to use outside cash to fi nance its operations. On the other hand, lenders will want to monitor usage as much as possible to ensure that funds borrowed on the line are used to fund short-term gaps in the working capital (cash fl ow) cycle, and not used to fi nance capital investments or other long-term obligations.
In addition to operating needs, clinics also require support for their capital expansion projects. Community clinics are constantly struggling
with inadequate equipment and facility infrastructure with which to respond to the growing demand for their primary care services. Fortunately, even limited cash reserves can allow the clinic to leverage outside long-term fi nancing for large projects, assuming that clinic operations generate the cash fl ow necessary to repay the loan.
OTHER CAPITAL PROJECT FUNDINGIn addition to conventional sources (banks), community clinics have
several capital fi nancing options available to them that can offer long-term debt at below market rates. The more notable of these sources include the following:
Tax-Exempt Bonds
Financially strong community clinics have increasingly taken advantage of the many fi nancial benefi ts offered by tax-exempt bond structures. At the same time, the transaction costs associated with closing this type of fi nancing structure can be quite signifi cant and can discourage many clinics despite the low long-term interest rates made available by this fi nancing strategy. Fortunately, various programmatic approaches for accessing tax-exempt debt are available to California clinics that are structured to at least partially offset the high fees involved with this fi nancing instrument. These program opportunities include:
Private Placement Tax-Exempt Debt:• Privately purchased tax-exempt bond issues are procedurally less complex than public offerings, resulting in closing costs that are signifi cantly less expensive and a fi nancing timeline that is shorter than the public sale approach. Cost savings are most directly related to the fact that privately placed deals are underwritten by
Prepared by Capital Link California Community Clinics – Financial Profi le, 2005 – 2008 | 103 Prepared by Capital Link California Community Clinics – Financial Profi le, 2005 – 2008 | 103
the buyer, and therefore do not require general credit enhance-ment in the form of a bank letter of credit or bond insurance which results in a signifi cant savings both in terms of time and up-front costs. However, loan interest rates are typically higher than rates than can be obtained by taking the deal to the open market. Private placement tax-exempt fi nancing is generally an attractive option for clinic deals under $5 million.
Pooled Bond Structures: • With the “pooled” approach to funding, clinics with relatively smaller funding needs can gain access to tax-exempt municipal markets and can benefi t from economies of scale inherent in a shared fi nancing structure. California Health Facilities Financ-ing Authority (CHFFA) has a pooled bond program, though in general these types of fi nancings are relatively infrequent due to the challenges of closing multiple clinic fi nancings simultane-ously. In addition to CHFFA, RBC Capital Management—in conjunction with the Association of Bay Area Governments—has established a statewide non-profi t fi nancing program that is structured as a pooled tax-exempt bond issue.
Cal-Mortgage Program (State of California):• Cal-Mortgage is a Division of the Offi ce of Statewide Health Planning and Development and administers the California Health Facility Construction Loan Insurance Program. This program provides credit enhancement for eligible health care facilities when they borrow money for capital project needs. Modeled after federal home mortgage insurance programs, Cal-Mortgage insured loans are guaranteed by the “full faith and credit” of the State of California. This guarantee permits borrowers to obtain lower interest rates, similar to the rates
received by the State of California. Loans may be insured to fi nance new construction or renovation, and are also available for the fi nancing of equipment needed to operate a health facil-ity. The Cal Mortgage Program is best suited for fi nancing needs in excess of $3–$5 million.
WellPoint/Anthem & United Health Group• Investment Programs:These investment programs were the result of two separate mergers in the California health insurance industry. As part of the negotiations with the state regulatory authorities, these companies agreed to direct a portion of their overall investment portfolio into the California safety net. The result has been that several community clinic capital projects have been fi nanced in recent years with tax-exempt bonds insured by Cal Mortgage and purchased by these companies. In order to secure clinic participation in these programs, both companies have taken a slight discount on their investment rates of return, resulting in a below-market cost of capital to the borrowing clinics, indirectly helping to offset the high transaction costs of a tax-exempt issue. In 2008, UnitedHealth Group created a sub-program of this community investment initiative called the Capital Access Small Issuance Program. This program uses existing grant funds set aside for the California safety net to directly subsidize the majority of the costs of issuance for eligible bond deals, includ-ing those of community clinics. Given the strong interest from providers, in 2009 UnitedHealth Group increased the size of the sub-program from $30 million to $60.
In addition to these programmatic approaches to tax-exempt fi nancing as mentioned above, there are other notable programs avail-
104 | California Community Clinics – Financial Profi le, 2005 – 2008 Prepared by Capital Link
able to community clinics that offer capital fi nancing at below-market rates. These include:
CPCA• : CPCA offers community clinics fi ve year loans up to a maximum of $600,000, with fi xed rates close to 3%. However, this program has limited capitalization, and new loan funds only become available as prior loans are repaid.
HELP II Program• : This loan program is offered by the State of California through CHFFA. Loan capital is available at 3% fi xed for up to 15 years. However, the loan limit is $750,000, making this a limited resource for clinics involved in a facility expansion project. Additionally, the program is currently limited to clinics that have gross annual revenues of less than $30 million per year, though an exception to the revenue limit is made for rural clinics. Since the program’s inception in 1988, the Authority has loaned more than $60 million to small and rural health facilities.
USDA Community Facilities Direct Loan Program• : Open to clinics in communities with populations of less than 20,000, this USDA program provides long-term, fi xed-rate fi nancing at very low rates and is an signfi cant source of capital fi nancing for clinics in areas that qualify.
New Markets Tax Credits
In 2000, Congress passed legislation creating a new investment tax credit called New Markets Tax Credits (NMTC), designed to stimulate investment in low-income communities. The $23 billion program is administered by the Community Development Financial Institution (CDFI) Fund under the US Department of the Treasury and represents the largest federal investment initiative into low-income communities
in nearly 20 years. The NMTC program offers tax credits to investors who choose to invest capital in an economically distressed area over a 7-year period. As of 2009, the Fund has made 396 awards totaling $21 billion in allocation authority.
For non-profi t health clinics, this program has resulted in an infl ux of capital that has resulted in fi xed-rate and/or below market inter-est rate loans. Additionally, the tax credits can be leveraged such that additional equity is made available to eligible clinics, often increasing the fi nancial feasibility of a proposed expansion project. Community clinics capital projects are ideally suited for NMTC funded programs as they are typically located in low-income communities and typically seek long-term fi nancing for capital projects. The NMTC program has its drawbacks—among them a limited supply of tax credits and a cumbersome process riddled with strict eligibility requirements and multiple tax credit suppliers. Another issue is that there is no guarantee that the program will continue to be reauthorized in future years. However President Obama’s Fiscal 2011 Budget, released on February 1, 2010, does propose to extend the NTMC program through 2011 with $5 billion in annual allocation authority
Other California Programs
California community clinics do have a variety of other fi nanc-ing alternatives available to them, including borrowing from banks, Community Development Financial Institutions (CDFIs), and private sources (ex. Catholic Healthcare West, California Communities Foundation), though each comes with its own limitation, whether it be loan size, terms, or local eligibility requirements.
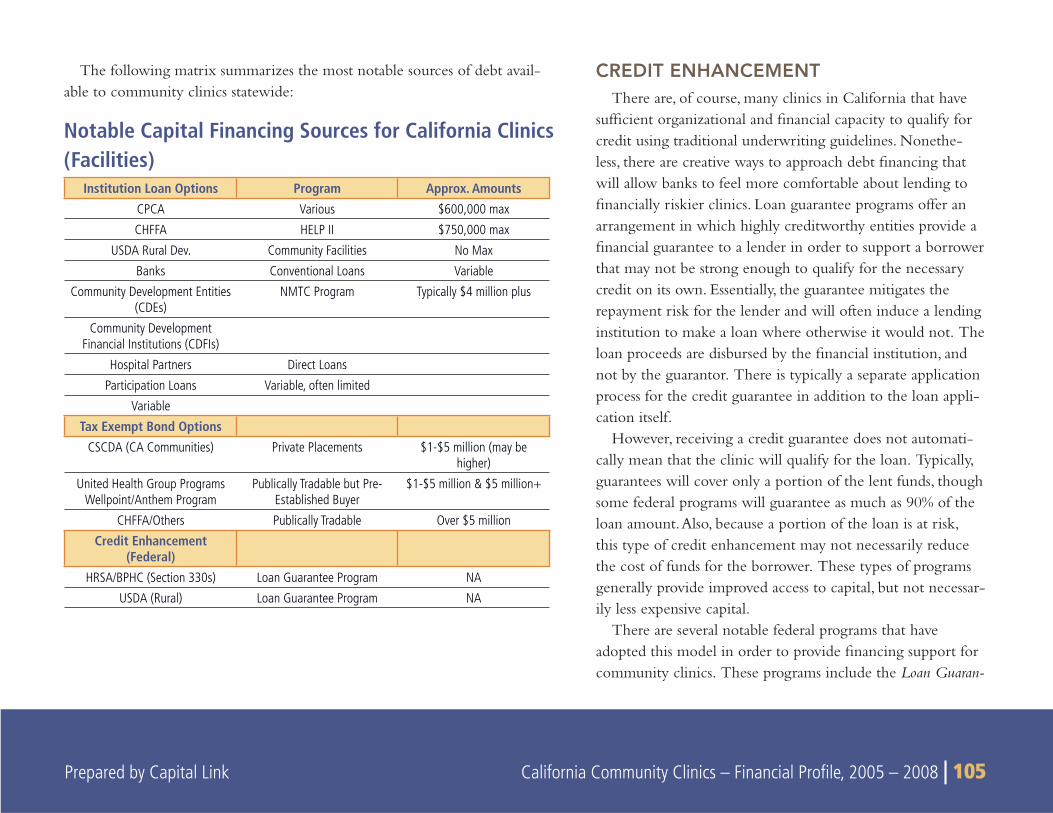
Prepared by Capital Link California Community Clinics – Financial Profi le, 2005 – 2008 | 105
CREDIT ENHANCEMENTThere are, of course, many clinics in California that have
suffi cient organizational and fi nancial capacity to qualify for credit using traditional underwriting guidelines. Nonethe-less, there are creative ways to approach debt fi nancing that will allow banks to feel more comfortable about lending to fi nancially riskier clinics. Loan guarantee programs offer an arrangement in which highly creditworthy entities provide a fi nancial guarantee to a lender in order to support a borrower that may not be strong enough to qualify for the necessary credit on its own. Essentially, the guarantee mitigates the repayment risk for the lender and will often induce a lending institution to make a loan where otherwise it would not. The loan proceeds are disbursed by the fi nancial institution, and not by the guarantor. There is typically a separate application process for the credit guarantee in addition to the loan appli-cation itself.
However, receiving a credit guarantee does not automati-cally mean that the clinic will qualify for the loan. Typically, guarantees will cover only a portion of the lent funds, though some federal programs will guarantee as much as 90% of the loan amount. Also, because a portion of the loan is at risk, this type of credit enhancement may not necessarily reduce the cost of funds for the borrower. These types of programs generally provide improved access to capital, but not necessar-ily less expensive capital.
There are several notable federal programs that have adopted this model in order to provide fi nancing support for community clinics. These programs include the Loan Guaran-
Notable Capital Financing Sources for California Clinics (Facilities)
Institution Loan Options Program Approx. AmountsCPCA Various $600,000 max
CHFFA HELP II $750,000 max
USDA Rural Dev. Community Facilities No Max
Banks Conventional Loans Variable
Community Development Entities (CDEs)
NMTC Program Typically $4 million plus
Community Development Financial Institutions (CDFIs)
Hospital Partners Direct Loans
Participation Loans Variable, often limited
Variable
Tax Exempt Bond OptionsCSCDA (CA Communities) Private Placements $1-$5 million (may be
higher)
United Health Group Programs Wellpoint/Anthem Program
Publically Tradable but Pre-Established Buyer
$1-$5 million & $5 million+
CHFFA/Others Publically Tradable Over $5 million
Credit Enhancement (Federal)
HRSA/BPHC (Section 330s) Loan Guarantee Program NA
USDA (Rural) Loan Guarantee Program NA
The following matrix summarizes the most notable sources of debt avail-able to community clinics statewide:
106 | California Community Clinics – Financial Profi le, 2005 – 2008 Prepared by Capital Link
tee Program for Health Center Facility Projects administered by the Bureau of Primary Health Care (for Section 330 health centers) and the Community Facilities Guaranteed Loan Program administered by USDA Rural Development (for clinics in communities of less than 20,000 people). Numerous health centers and clinics across the country and in California have taken advantage of these federal credit enhancements over the years.
Local hospitals may also serve as an effective strategic partner for the fi nancing needs of community clinics, potentially providing loan guarantees or fi nancial support suffi cient to allow the community clinic to obtain a loan. Local foundations or other institutional supporters of a clinic might also have an appetite to guarantee a loan for a clinic capital project in lieu of making a direct grant contribution.
THE ECONOMIC CRISIS AND CLINIC ACCESS TO CAPITAL
Though the national economic picture has demonstrated some initial signs of a recovery as of late 2009, the overall economy remains weak and conventional credit markets in particular remain tight. While the impact on health center and clinic access is still unfolding, it is clear that clinics face signifi cant challenges in raising capital for their current projects. In California, the effect may be compounded for the following reasons:
According to the Center for Responsible Lending, • foreclosure starts in California have increased 692% from 2006-2009, while total foreclosures in the state are projected to reach nearly 1.9 million over the 2009-2012 period.23. In the 3rd quarter of 2009, California had a foreclosure rate of one fi ling for every 53 households, ranking second in the country.24 In addition to the
devastating impact these foreclosures will have on the affected households, they will also cause a “spillover” effect by depress-ing the value of nearby homes—most owned by families who are paying their mortgages on time. According to the National Association of Realtors, almost half of all current home sales are foreclosures or “short sales” of properties sold at substan-tial discount. This has resulted in lower property values for homeowners and a reduced tax base for communities.
The economic downturn has led to • signifi cant job losses. California’s rate of unemployment stood at 12.3% as of Novem-ber 2009, which is 4 percentage points higher than the 8.3% unemployment rate of November 2008. Additionally, the rate of unemployment in California remains higher than the national unemployment rate of 10.0% as of November 2009. 25 Increased unemployment has corresponded with the loss of health insur-ance and as well as overall growth in the low-income populations in the state, adding to Medi-Cal rolls and to patients seeking care at clinics—even as the Medi-Cal budget continues to be threat-ened with drastic cuts due to the state budget woes.
Even very large and fi nancially secure companies continue to experience diffi culty in accessing the capital markets in the current economic climate; community health clinics, with their non-profi t structure and relatively weaker fi nancial profi les, will likely struggle even more in securing fi nancial partners to support their need for growth.
23Center for Responsible Lending. http://www.responsiblelending.org/mortgage-lend-ing/tools-resources/factsheets/california.html
24http://www.realtytrac.com/foreclosure/foreclosure-rates.html25Bureau of Labor Statistics, http://www.bls.gov/news.release/pdf/laus.pdf
Prepared by Capital Link California Community Clinics – Financial Profi le, 2005 – 2008 | 107 Prepared by Capital Link California Community Clinics – Financial Profi le, 2005 – 2008 | 107
STATE POLICY AND FISCAL ENVIRONMENTAs of early 2010, California remains deeply mired in the worst
economic and unemployment crisis since the Great Depression. According to the UCLA Center for Health Policy Research, nearly 2 million Californians lost their health insurance during 2008 and 2009 — years characterized by a deep recession and mass layoffs — bringing the total number of uninsured in the state to more than 8 million. This estimate represents a 28% increase in the number of uninsured since 2007, when 6.4 million Californians lacked insur-ance. Today, nearly one-quarter of all adult Californians lack health insurance.26
At the same time that demand for clinic services is growing, the state is once again faced with a $20+ billion budget defi cit that it will attempt to reconcile through combinations of program cuts, payment delays, and possible tax increases. It is likely that the reach of clinic programs and services will once again be dramatically affected by the budget balancing process.
The fi nal budget agreement that took effect in July 2009 included major cuts to programs that represent a signifi cant portion of the revenue base of community clinics. Medi-Cal Optional Benefi ts,
which include dental benefi ts for adults and all General Fund dollars for Traditional Clinic Programs, like the Expanded Access to Primary Care Program, were eliminated.27 In addition to dental services, other adult benefi t programs that Medi-Cal no longer would fund included speech therapy, podiatry, audiology, chiropractic services, acupuncture, optometric and optician series, and psychology services.
Since the Governor signed the budget in July 2009 which cut $2 billion from the health care system, the implementation of some program cutbacks have been partially averted through various actions, including lawsuits. The on-going funding delays and uncertainty have nevertheless resulted signifi cant fi scal and programmatic challenges for clinics as well as for the communities that they serve. According to Health Access California, some of these impacts include:28
Almost three million low-income adults lost ten important • benefi ts, such as dental care, vision care, speech therapy, and psychological services – in the last six months, over 450,000 Californians in poverty have either had to forego or pay for dental care and another 240,000 have lost coverage for prescrip-tions eyeglasses;
About 93,000 children waited uninsured for Healthy Families •
11
STATE AND FEDERAL POLICY AND FISCAL ENVIRONMENT
26UCLA Center for Health Policy Research: Number of Uninsured Jumped to More Than Eight Million from 2007 to 2009. Lavarreda, Brown, Cabezas, Roby. March 201027California Primary Care Association. California 2009-2010 Budget Impacts on Community Clinics & Health Centers, , January 201028Health Access California: The Damage Already Done: A Report on the 2009 Health Care Budget Cuts Six Months In; www.health-access.org
108 | California Community Clinics – Financial Profi le, 2005 – 2008 Prepared by Capital Link
coverage until the cut was averted by non-government donations and higher cost sharing for 269,000 children on the program;
At least fi ve community clinics in the state have already been • forced to shut down and hundreds of workers have been laid off, plus another 10 clinics are on the brink of closure;
Thousands of HIV/AIDS patients have been denied access to • needed services and affordable medications they rely on;
About 300,000 low-income women no longer have access to • life-saving breast cancer screenings;
Over 300,000 school children have missed an educational oppor-• tunity to learn proper dental care and positive life-long oral health habits;
Programs focusing on prevention and prenatal care have been • forced to signifi cantly scale back or are closing altogether; and
Six domestic violence shelters were temporarily closed while the • Legislature passed a bill to fi nd ways to keep shelters open, and even afterwards, most have been forced to reduce services.
On January 8, 2010, Governor Schwarzenegger proposed a fi scal year 2010-11 budget that closes a $19.9 billion defi cit (which includes a $6.6 billion shortfall from the current 2009-10 fi scal year). The proposal specifi cally cuts $2.9 billion from the Health and Human Services General Fund Expenditures, plus an additional $3.5 billion in health and human service cuts if federal funding is not provided.
The Governor’s FY 2010-11 budget proposes signifi cant cuts to and elimination of health care programs if federal funds are not forthcom-ing. That is, if the state does not receive $6.9 billion in federal funds as part of the base budget, the proposal calls for a trigger of an additional $4.5 billion of cuts. Of those “triggered” cuts, $3.5 billion are in health
and human services, which would, among other program reductions:
Eliminate coverage and benefi ts for millions in Medi-Cal ($532 • million), including:
Reduce Medi-Cal eligibility to the minimum allowed • under current federal law (about 72% of the federal poverty level for most adults and 133% of the federal poverty level for children and pregnant women). For example, this would reduce income eligibility for low-income parents from $18,310 for a family of three to around $13,000. While this cut would not be allowed under the stimulus package until January 1, 2011, it would eliminate coverage for 250,000 Californians in the fi rst six months, 450,000 adults in the year after that, and hundreds of thousands more adults in future years.
Eliminate many Medi-Cal programs (including the Family • PACT program for family planning services, the CHDP Gateway for transitional children’s coverage, Breast and Cervical Cancer Treatment Program, and the Medically Indigent long-term care program); and
Eliminate most remaining benefi ts not required by federal • law (including medical supplies like diabetic test strips, prosthetic limbs, orthotics, wheelchairs and other durable medical equipment, hearing aids and other benefi ts).
Eliminate the Healthy Families Program, affecting all 874,762 • children currently enrolled ($126 million);
Eliminate various health services programs, (including Access for • Infants and Mothers, MRMIP’s high-risk pools for those denied coverage for pre-existing conditions, Every Women Counts
Prepared by Capital Link California Community Clinics – Financial Profi le, 2005 – 2008 | 109 Prepared by Capital Link California Community Clinics – Financial Profi le, 2005 – 2008 | 109
cancer screening, Asthma Control Program, and Expanded Access to Care Program), funded by Proposition 99 (tobacco tax) funds, subject to voter approval ($115 million);
Eliminate current services funded by Proposition 63 (Mental • Health Services Act) to redirect the $847 million to fund existing mental health services.29
How the fi nal negotiations will play out remains unclear, and Democrats have said they will wait for Schwarzenegger’s May revisions to the budget before they consider moving forward with any substan-tial cuts to health care and social services.
On February 1, 2010, President Obama released a budget plan that would provide $1.5 billion in additional funding for Medi-Cal, California’s Medicaid program. The funding for California comes from the $25 billion allotted for state Medicaid programs under the president’s budget plan. The additional state Medicaid funds are an extension of a program from the 2009 economic stimulus package.30 The president’s $1.5 billion allotment for California represents only a portion of the $6.9 billion in federal assistance that state offi cials are seeking to help close the state’s budget defi cit, as described above. Obama’s budget also would not implement the governor’s request for a permanent change in federal Medicaid reimbursement formulas. Schwarzenegger’s administration has said such a change would gener-ate an additional $1.8 billion for California.30
FEDERAL POLICY AFFECTING HEALTH CENTERSCommunity Health Centers have experienced unprecedented
growth in the last decade, largely fueled by increases in federal appropriations.
Section 330 Program Reauthorization
In 2008, President Bush signed the Health Care Safety Net Act of 2008, which reauthorized the Community Health Center program through 2012 and authorizes annual funding increases for Section 330 grants. Currently funded at $2.2 billion annually, the reauthori-zation provides for annual increases in health center appropriations through 2012, resulting in an annual funding level of $3.3 billion in FY12. These amounts are targeted to enable health centers to reach 30 million patients by 2015. While Congress will still need to appropriate funds in each year, the stated authorization level refl ects Congress’ general intent to continue to expand this program in the years to come. President Obama proposed a substantial increase for Community Health Centers in his FY11 budget, which would provide an additional $310 million for health centers for an FY11 total of $2.5 billion.
American Recovery and Reinvestment Act
On February 17, 2009, President Obama signed into law a massive economic stimulus measure entitled the American Recovery and
29Health Access California: A First Look at the 2010-11 Health Care Budget Proposal, January 8, 2010. 30Los Angeles Times. What Obama’s budget plan may mean for California. Richard Simon, Feb. 1, 2010
110 | California Community Clinics – Financial Profi le, 2005 – 2008 Prepared by Capital Link
Reinvestment Act, or “ARRA” for short. The new law, which contained more than $787 billion in spending and tax cuts, contains several major initiatives related to community health centers, totaling well over $2 billion. In addition to funds for workforce investments and operations, the legislation specifi cally set aside $1.5 billion for construction, renovation, or information technology projects for Section 330 health centers. To date, California has been awarded more than $238 million or slightly less than 13% of the overall total. This amount is just over California’s 12.2% share of the overall national population. This funding also included $340 million in Increased Demand for Services (IDS) grants which were awarded by formula based on each center’s patients and the number of uninsured they serve. Because California centers serve so many patients, many of whom are uninsured, they received more than $48 million (14%) of these awards. Going forward, President Obama has proposed in his FY11 budget that these awards be added permanently to each health centers annual base grant. If enacted, this will provide disproportionate benefi ts to California health centers for years to come.
Health Care Reform
Elected with the promise of undertaking health care reform, President Obama began 2009 with broad majorities in the House and the Senate eager to begin work on health legislation. Congress ambitiously began crafting legislation designed to dramatically reform the health insurance industry and the health delivery system overall. In March, 2010, Congress fi nally passed HR 3590, the Patient Protec-tion and Affordable Care Act as well as HR 4872, reconciliation legislation that made additional changes to health policy. Although the legislation contains a wide variety of provisions, investment in primary
care and health centers have been a key component of the effort. The new law established a Community Health Centers Trust Fund which specifi cally provides $11 billion over the next fi ve years for Federally Qualifi ed Health Centers (FQHCs)--in addition to their existing budgets. Of that amount, $1.5 billion was designated for construction and renovation funding. The legislation also raised Medicaid eligibil-ity to 133% of Federal Poverty Limits for all adults effective in 2014. The bill also enhanced clinic’s reimbursement in the private insurance market, requiring that all insurance plans operating through state-based exchanges contract with FQHCs and pay Federally Qualifi ed Health Centers cost-based reimbursement according to Medicaid PPS reimbursement rates. Combined, these changes should dramatically improve the fi nancial footing of many California clinics once the law takes full effect in 2014.
The $11 billion Community Health Centers Trust Fund created through healthcare reform dramatically expands the existing annual $2.2 billion federally-funded community health center program. As a result of these changes, the FQHC program is expected to continue expanding, but at a faster pace. In addition, reimbursement for Section 330 FQHCs will be more secure. In California, health reform should mean that the pace of conversion of clinics to FQHC Section 330 clinic status and the creation of new Section 330 FQHCs will happen at a faster pace. However, health reform does not cover undocu-mented illegal immigrants, which could affect the viability of clinics that provide care for that population.
Prepared by Capital Link California Community Clinics – Financial Profi le, 2005 – 2008 | 111 Prepared by Capital Link California Community Clinics – Financial Profi le, 2005 – 2008 | 111
THE ANALYSIS AND RESULTS contained in this report are based on two major data sources:
The Offi ce of Statewide Health Planning and Development • (OSHPD), and
Internal Revenue Service (IRS) Form 990 data•
The Offi ce of Statewide Health Planning and Development (OSHPD) collects data and distributes information on health and healthcare in California. All licensed clinics in California are required to submit an annual report to OSHPD that includes fi nancial, utiliza-tion, and patient demographic information. The reporting period covers one calendar year (January to December).
Licensed primary care clinics include the following types of organizations:
Federally Qualifi ed Health Centers (FQHCs)•
FQHC Look-Alikes•
Free-standing nonprofi t Rural Health Clinics (RHCs) •
Indian Health Clinics licensed by OSHPD, some of which may • be FQHCs
Free clinics and •
Family planning clinics and other types of nonprofi t community • clinics serving specifi c populations.
CLINIC LISTSThe complete databases of all clinic sites reporting to OSHPD for
2005, 2006, 2007 and 2008 were downloaded from OSHPD’s website in an Excel spreadsheet format.
In collaboration with the Advisory Group (AG) convened by CHCF for this project, Capital Link developed a set of screens and criteria which were applied to all reporting clinics in each year The goal of the screening process was to identify, at an organizational level, clinics which qualify as comprehensive primary care providers, to be included in the study. Clinics which did not meet the criteria were screened out.
The screens were applied as follows:All reporting clinic sites:
a. Total Encounters, as listed in Section 5, Line 45, are greater than zero. This screened out all the sites which fi led a report but were not operational in a particular year.
While organizations with multiple sites report to OSHPD based on individual sites, the analysis and results presented in this report are based on aggregated organizational level data. All remaining clinic sites were rolled up into their respective parent corporations. Subsequent screens were applied to the consolidated parent/organization level data.
b. Include all FQHCs and FQHC Look-Alikes, as entered in Section 2 Line 2.
APPENDIX A
METHODOLOGY
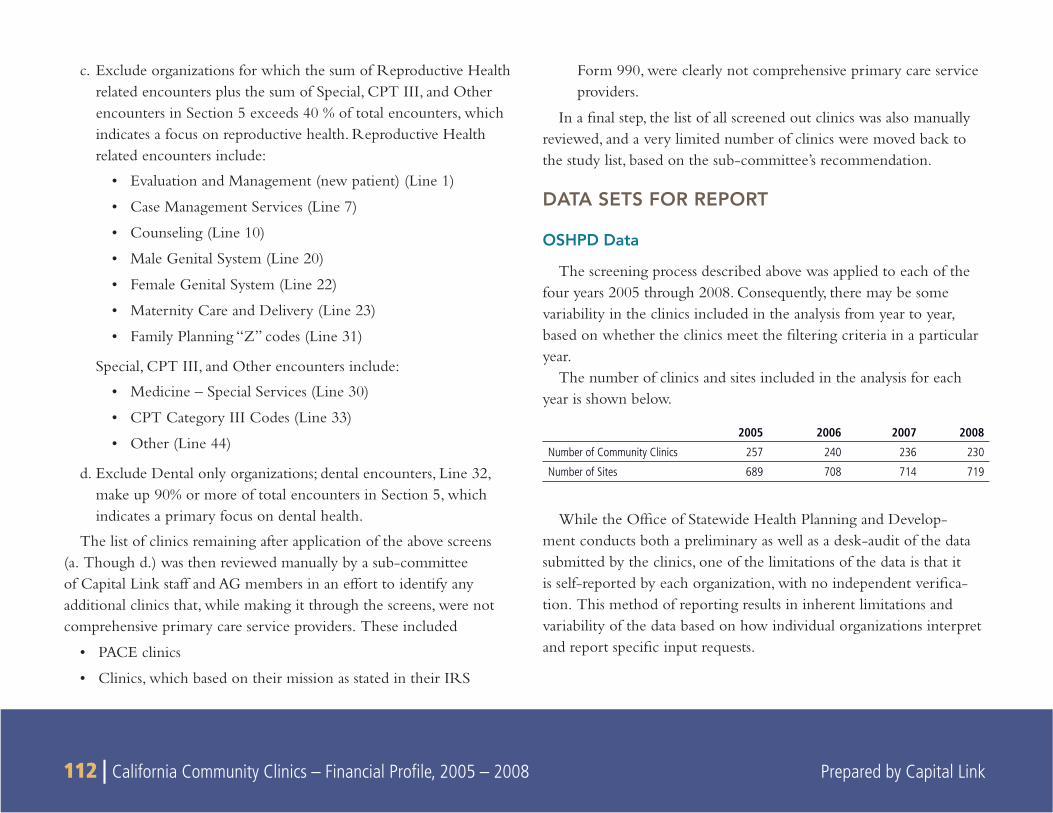
112 | California Community Clinics – Financial Profi le, 2005 – 2008 Prepared by Capital Link
c. Exclude organizations for which the sum of Reproductive Health related encounters plus the sum of Special, CPT III, and Other encounters in Section 5 exceeds 40 % of total encounters, which indicates a focus on reproductive health. Reproductive Health related encounters include:
Evaluation and Management (new patient) (Line 1)•
Case Management Services (Line 7)•
Counseling (Line 10)•
Male Genital System (Line 20)•
Female Genital System (Line 22)•
Maternity Care and Delivery (Line 23)•
Family Planning “Z” codes (Line 31)•
Special, CPT III, and Other encounters include:
Medicine – Special Services (Line 30) •
CPT Category III Codes (Line 33) •
Other (Line 44) •
d. Exclude Dental only organizations; dental encounters, Line 32, make up 90% or more of total encounters in Section 5, which indicates a primary focus on dental health.
The list of clinics remaining after application of the above screens (a. Though d.) was then reviewed manually by a sub-committee of Capital Link staff and AG members in an effort to identify any additional clinics that, while making it through the screens, were not comprehensive primary care service providers. These included
PACE clinics•
Clinics, which based on their mission as stated in their IRS •
Form 990, were clearly not comprehensive primary care service providers.
In a fi nal step, the list of all screened out clinics was also manually reviewed, and a very limited number of clinics were moved back to the study list, based on the sub-committee’s recommendation.
DATA SETS FOR REPORT
OSHPD Data
The screening process described above was applied to each of the four years 2005 through 2008. Consequently, there may be some variability in the clinics included in the analysis from year to year, based on whether the clinics meet the fi ltering criteria in a particular year.
The number of clinics and sites included in the analysis for each year is shown below.
2005 2006 2007 2008
Number of Community Clinics 257 240 236 230
Number of Sites 689 708 714 719
While the Offi ce of Statewide Health Planning and Develop-ment conducts both a preliminary as well as a desk-audit of the data submitted by the clinics, one of the limitations of the data is that it is self-reported by each organization, with no independent verifi ca-tion. This method of reporting results in inherent limitations and variability of the data based on how individual organizations interpret and report specifi c input requests.
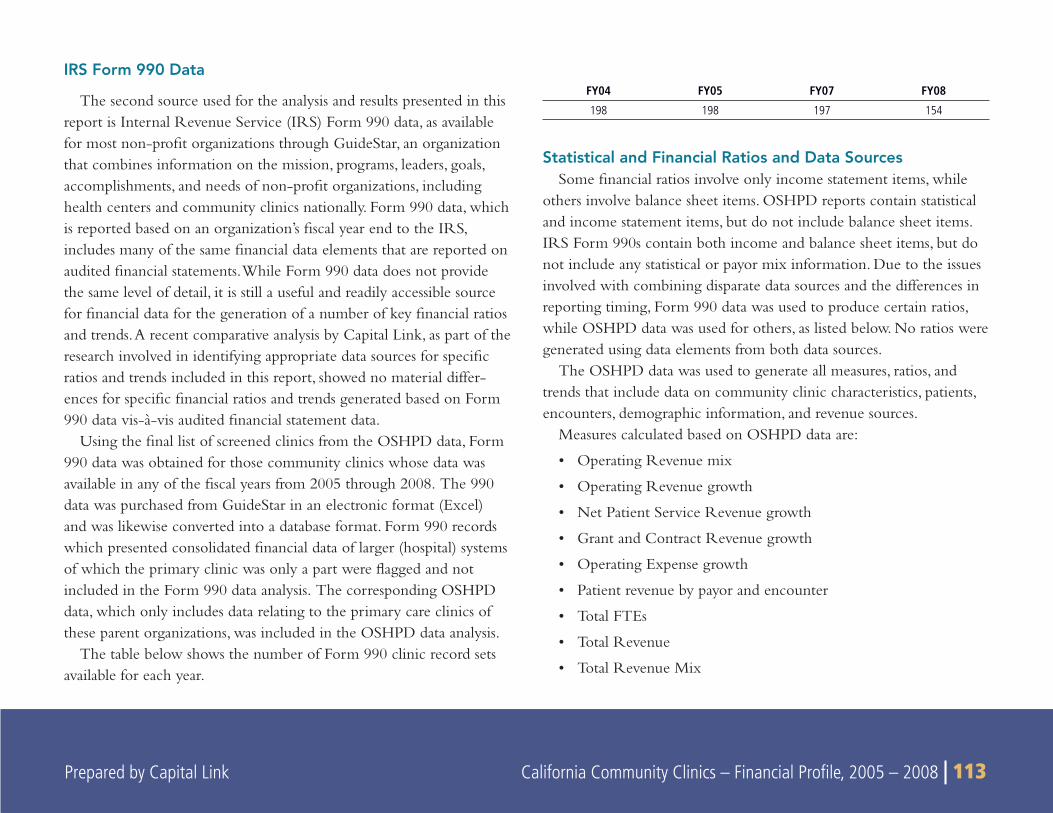
Prepared by Capital Link California Community Clinics – Financial Profi le, 2005 – 2008 | 113 Prepared by Capital Link California Community Clinics – Financial Profi le, 2005 – 2008 | 113
IRS Form 990 Data
The second source used for the analysis and results presented in this report is Internal Revenue Service (IRS) Form 990 data, as available for most non-profi t organizations through GuideStar, an organization that combines information on the mission, programs, leaders, goals, accomplishments, and needs of non-profi t organizations, including health centers and community clinics nationally. Form 990 data, which is reported based on an organization’s fi scal year end to the IRS, includes many of the same fi nancial data elements that are reported on audited fi nancial statements. While Form 990 data does not provide the same level of detail, it is still a useful and readily accessible source for fi nancial data for the generation of a number of key fi nancial ratios and trends. A recent comparative analysis by Capital Link, as part of the research involved in identifying appropriate data sources for specifi c ratios and trends included in this report, showed no material differ-ences for specifi c fi nancial ratios and trends generated based on Form 990 data vis-à-vis audited fi nancial statement data.
Using the fi nal list of screened clinics from the OSHPD data, Form 990 data was obtained for those community clinics whose data was available in any of the fi scal years from 2005 through 2008. The 990 data was purchased from GuideStar in an electronic format (Excel) and was likewise converted into a database format. Form 990 records which presented consolidated fi nancial data of larger (hospital) systems of which the primary clinic was only a part were fl agged and not included in the Form 990 data analysis. The corresponding OSHPD data, which only includes data relating to the primary care clinics of these parent organizations, was included in the OSHPD data analysis.
The table below shows the number of Form 990 clinic record sets available for each year.
FY04 FY05 FY07 FY08
198 198 197 154
Statistical and Financial Ratios and Data SourcesSome fi nancial ratios involve only income statement items, while
others involve balance sheet items. OSHPD reports contain statistical and income statement items, but do not include balance sheet items. IRS Form 990s contain both income and balance sheet items, but do not include any statistical or payor mix information. Due to the issues involved with combining disparate data sources and the differences in reporting timing, Form 990 data was used to produce certain ratios, while OSHPD data was used for others, as listed below. No ratios were generated using data elements from both data sources.
The OSHPD data was used to generate all measures, ratios, and trends that include data on community clinic characteristics, patients, encounters, demographic information, and revenue sources.
Measures calculated based on OSHPD data are:
Operating Revenue mix•
Operating Revenue growth•
Net Patient Service Revenue growth•
Grant and Contract Revenue growth•
Operating Expense growth•
Patient revenue by payor and encounter•
Total FTEs•
Total Revenue•
Total Revenue Mix•
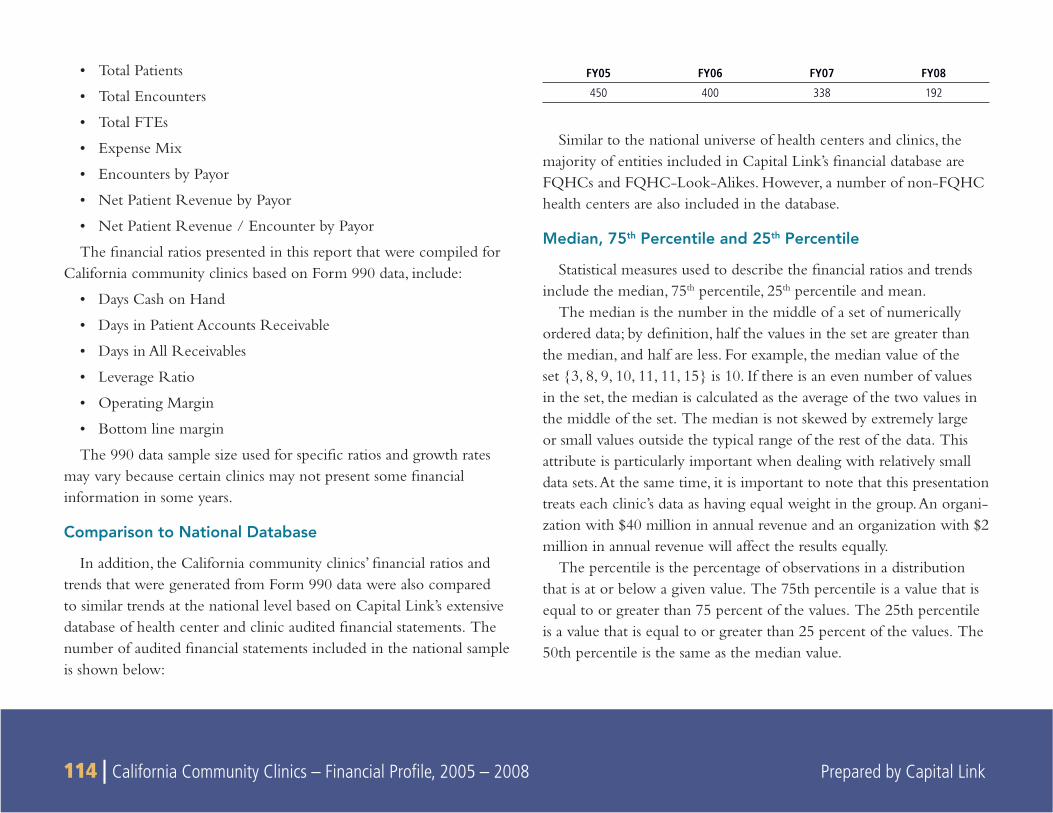
114 | California Community Clinics – Financial Profi le, 2005 – 2008 Prepared by Capital Link
Total Patients•
Total Encounters•
Total FTEs•
Expense Mix•
Encounters by Payor•
Net Patient Revenue by Payor•
Net Patient Revenue / Encounter by Payor•
The fi nancial ratios presented in this report that were compiled for California community clinics based on Form 990 data, include:
Days Cash on Hand•
Days in Patient Accounts Receivable•
Days in All Receivables•
Leverage Ratio•
Operating Margin•
Bottom line margin •
The 990 data sample size used for specifi c ratios and growth rates may vary because certain clinics may not present some fi nancial information in some years.
Comparison to National Database
In addition, the California community clinics’ fi nancial ratios and trends that were generated from Form 990 data were also compared to similar trends at the national level based on Capital Link’s extensive database of health center and clinic audited fi nancial statements. The number of audited fi nancial statements included in the national sample is shown below:
FY05 FY06 FY07 FY08
450 400 338 192
Similar to the national universe of health centers and clinics, the majority of entities included in Capital Link’s fi nancial database are FQHCs and FQHC-Look-Alikes. However, a number of non-FQHC health centers are also included in the database.
Median, 75th Percentile and 25th Percentile
Statistical measures used to describe the fi nancial ratios and trends include the median, 75th percentile, 25th percentile and mean.
The median is the number in the middle of a set of numerically ordered data; by defi nition, half the values in the set are greater than the median, and half are less. For example, the median value of the set {3, 8, 9, 10, 11, 11, 15} is 10. If there is an even number of values in the set, the median is calculated as the average of the two values in the middle of the set. The median is not skewed by extremely large or small values outside the typical range of the rest of the data. This attribute is particularly important when dealing with relatively small data sets. At the same time, it is important to note that this presentation treats each clinic’s data as having equal weight in the group. An organi-zation with $40 million in annual revenue and an organization with $2 million in annual revenue will affect the results equally.
The percentile is the percentage of observations in a distribution that is at or below a given value. The 75th percentile is a value that is equal to or greater than 75 percent of the values. The 25th percentile is a value that is equal to or greater than 25 percent of the values. The 50th percentile is the same as the median value.
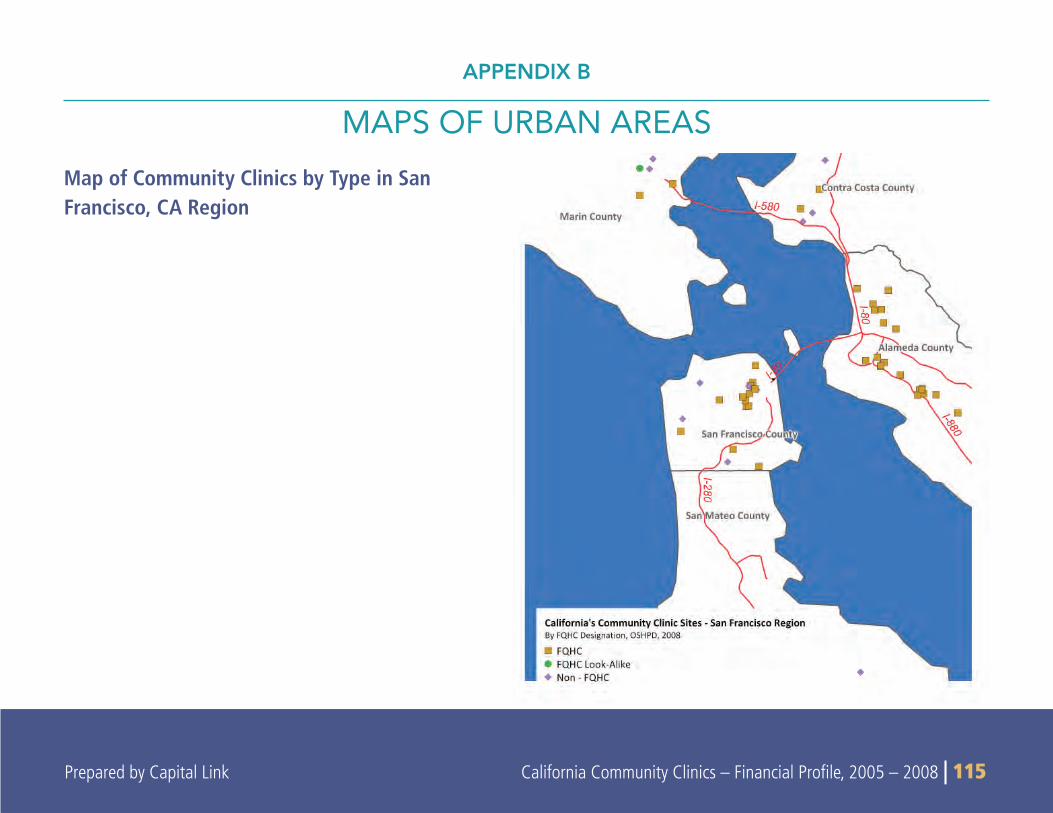
Prepared by Capital Link California Community Clinics – Financial Profi le, 2005 – 2008 | 115 Prepared by Capital Link California Community Clinics – Financial Profi le, 2005 – 2008 | 115
Map of Community Clinics by Type in San Francisco, CA Region
APPENDIX B
MAPS OF URBAN AREAS
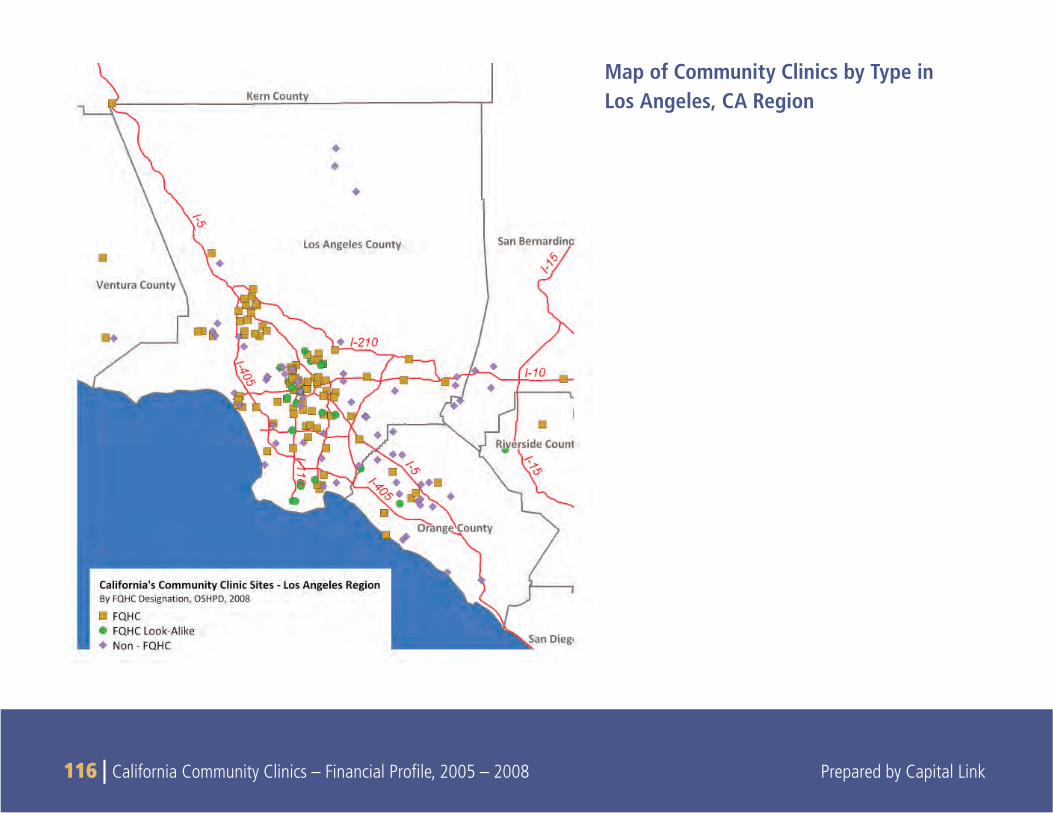
116 | California Community Clinics – Financial Profi le, 2005 – 2008 Prepared by Capital Link
Map of Community Clinics by Type in Los Angeles, CA Region
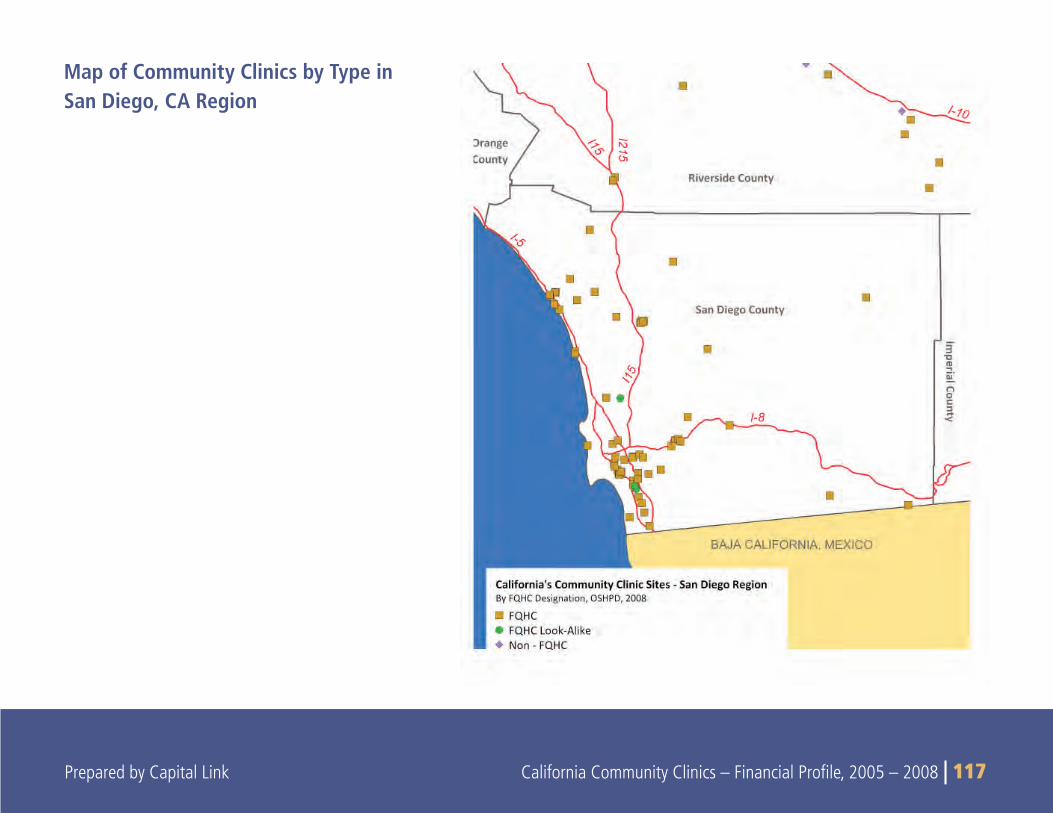
Prepared by Capital Link California Community Clinics – Financial Profi le, 2005 – 2008 | 117 Prepared by Capital Link California Community Clinics – Financial Profi le, 2005 – 2008 | 117
Map of Community Clinics by Type in San Diego, CA Region