Embed Size (px)
Citation preview
California Employer Health Benefits Survey
November 2006
©2006 California HealthCare Foundation 2
Employer Health Benefits
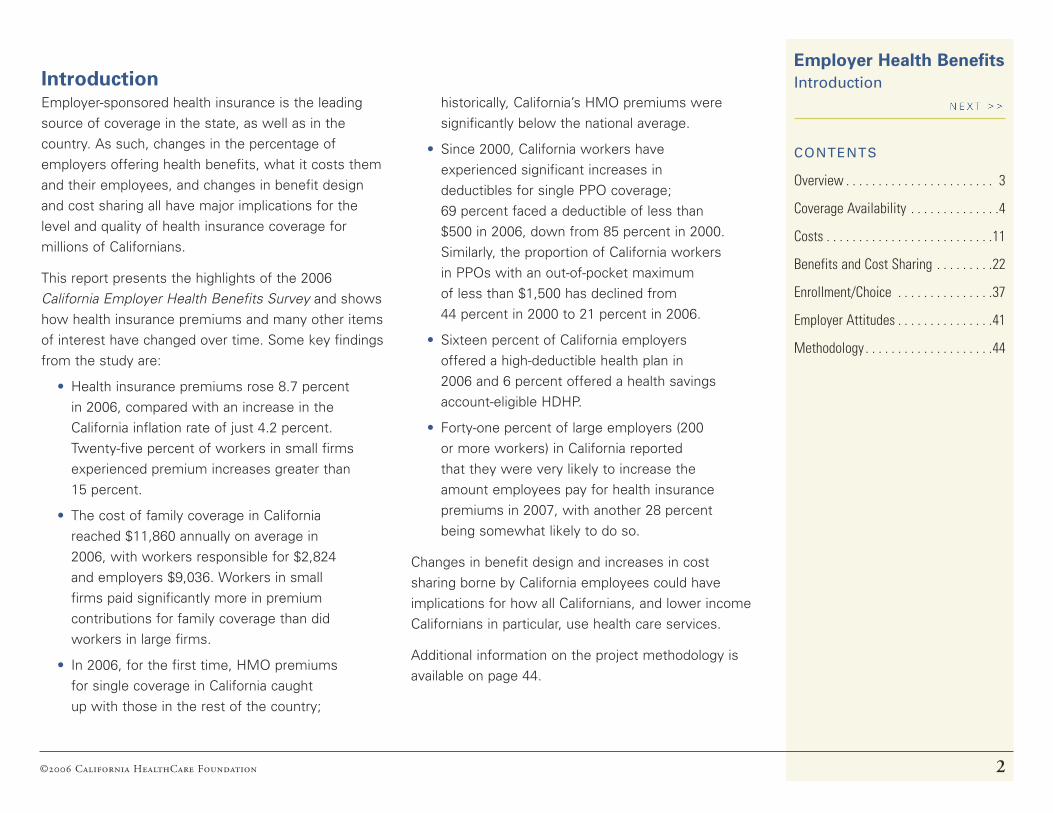
Employer-sponsored health insurance is the leading source of coverage in the state, as well as in the country. As such, changes in the percentage of employers offering health benefits, what it costs them and their employees, and changes in benefit design and cost sharing all have major implications for the level and quality of health insurance coverage for millions of Californians.
This report presents the highlights of the 2006 California Employer Health Benefits Survey and shows how health insurance premiums and many other items of interest have changed over time. Some key findings from the study are:
• Health insurance premiums rose 8.7 percent in 2006, compared with an increase in the California inflation rate of just 4.2 percent. Twenty-five percent of workers in small firms experienced premium increases greater than 15 percent.
• The cost of family coverage in California reached $11,860 annually on average in 2006, with workers responsible for $2,824 and employers $9,036. Workers in small firms paid significantly more in premium contributions for family coverage than did workers in large firms.
• In 2006, for the first time, HMO premiums for single coverage in California caught up with those in the rest of the country;
historically, California’s HMO premiums were significantly below the national average.
• Since 2000, California workers have experienced significant increases in deductibles for single PPO coverage; 69 percent faced a deductible of less than $500 in 2006, down from 85 percent in 2000. Similarly, the proportion of California workers in PPOs with an out-of-pocket maximum of less than $1,500 has declined from 44 percent in 2000 to 21 percent in 2006.
• Sixteen percent of California employers offered a high-deductible health plan in 2006 and 6 percent offered a health savings account-eligible HDHP.
• Forty-one percent of large employers (200 or more workers) in California reported that they were very likely to increase the amount employees pay for health insurance premiums in 2007, with another 28 percent being somewhat likely to do so.
Changes in benefit design and increases in cost sharing borne by California employees could have implications for how all Californians, and lower income Californians in particular, use health care services.
Additional information on the project methodology is available on page 44.
Introduction
CONTENTS
Overview . . . . . . . . . . . . . . . . . . . . . . . 3
Coverage Availability . . . . . . . . . . . . . .4
Costs . . . . . . . . . . . . . . . . . . . . . . . . . .11
Benefits and Cost Sharing . . . . . . . . .22
Enrollment/Choice . . . . . . . . . . . . . . .37
Employer Attitudes . . . . . . . . . . . . . . .41
Methodology . . . . . . . . . . . . . . . . . . . .44
Introduction
©2006 California HealthCare Foundation 3
Employer Health Benefits
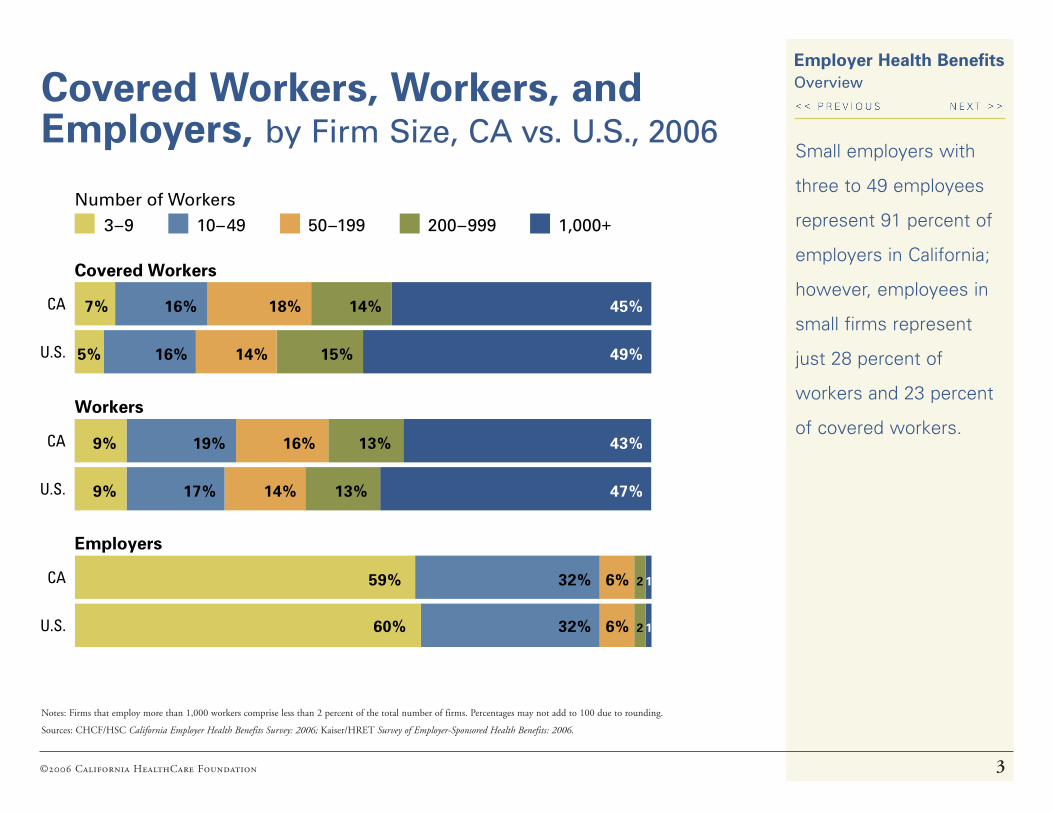
Notes: Firms that employ more than 1,000 workers comprise less than 2 percent of the total number of firms. Percentages may not add to 100 due to rounding.
Sources: CHCF/HSC California Employer Health Benefits Survey: 2006; Kaiser/HRET Survey of Employer-Sponsored Health Benefits: 2006.
Covered Workers, Workers, and Employers, by Firm Size, CA vs. U.S., 2006
Small employers with
three to 49 employees
represent 91 percent of
employers in California;
however, employees in
small firms represent
just 28 percent of
workers and 23 percent
of covered workers.
U.S.
CA
Covered Workers
3–9
Number of Workers
10–49 50–199 200–999 1,000+
7% 16% 18% 14% 45%
5% 16% 14% 15% 49%
U.S.
CA 9% 19% 16% 13% 43%
9% 17% 14% 13% 47%
Workers
U.S.
CA 59% 32% 6% 2 1
60% 32% 6% 2 1
Employers
Overview

©2006 California HealthCare Foundation 4
Employer Health Benefits Coverage AvailabilityEmployers Offering Coverage,
California vs. U.S., 2001 to 2006*A higher percentage of
California employers
offered coverage in
2006 than nationally.
*Tests found no statistically different estimates from the previous year.
Sources: CHCF/HSC California Employer Health Benefits Survey: 2005–2006; CHCF/HRET California Employer Health Benefits Survey: 2004; Kaiser/HRET California Employer Health Benefits Survey: 2001–2003; Kaiser/HRET Survey of Employer-Sponsored Health Benefits: 2001–2006.
0%
20%
40%
60%
80%
100%
200620052004200320022001
CA
U.S.68% 66% 66% 63%
60% 61%
70% 71% 70% 67% 67%
71%
©2006 California HealthCare Foundation 5
Employer Health Benefits Coverage AvailabilityEmployers Offering Coverage,
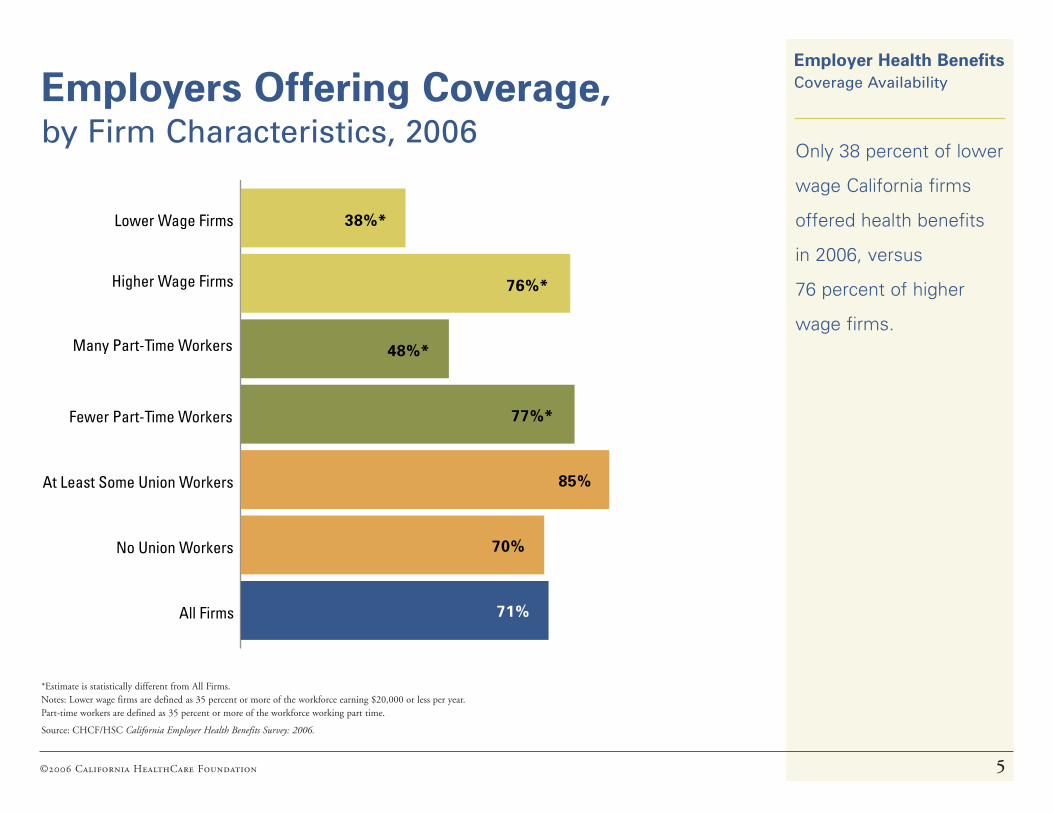
by Firm Characteristics, 2006Only 38 percent of lower
wage California firms
offered health benefits
in 2006, versus
76 percent of higher
wage firms.
All Firms
No Union Workers
At Least Some Union Workers
Fewer Part-Time Workers
Many Part-Time Workers
Higher Wage Firms
Lower Wage Firms 38%*
76%*
48%*
77%*
85%
70%
71%
*Estimate is statistically different from All Firms. Notes: Lower wage firms are defined as 35 percent or more of the workforce earning $20,000 or less per year. Part-time workers are defined as 35 percent or more of the workforce working part time.
Source: CHCF/HSC California Employer Health Benefits Survey: 2006.
©2006 California HealthCare Foundation 6
Employer Health Benefits Coverage AvailabilityEmployers Offering Coverage,
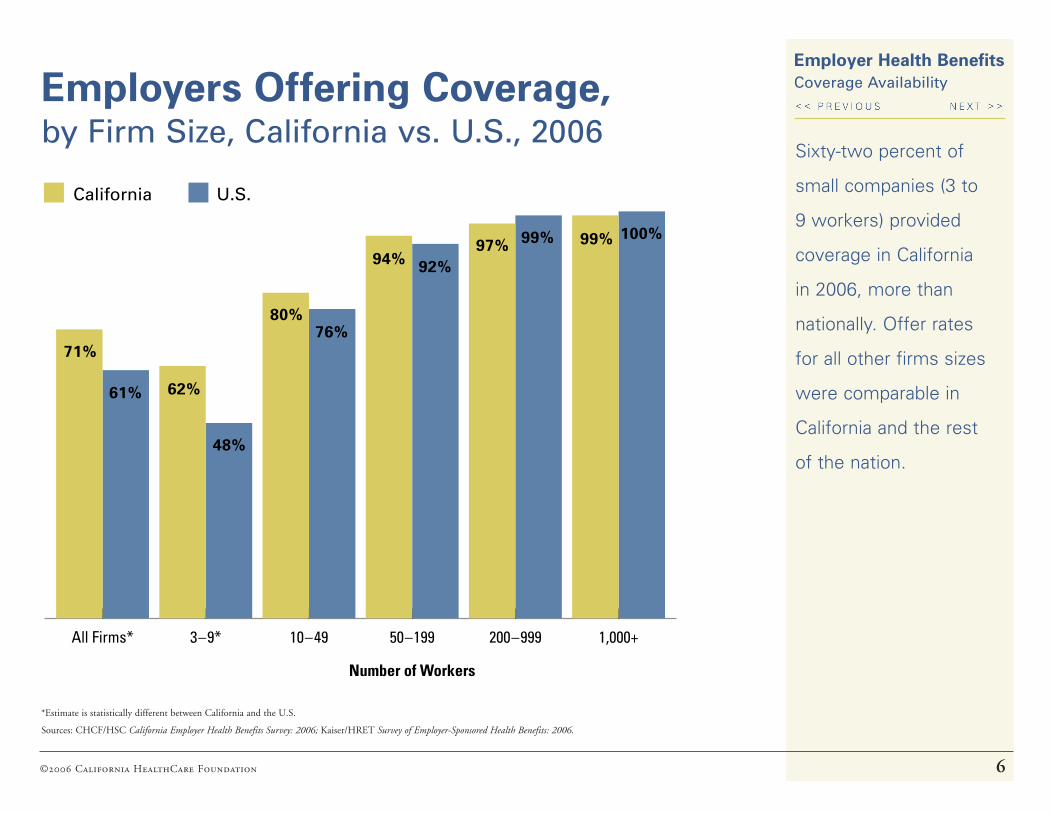
by Firm Size, California vs. U.S., 2006Sixty-two percent of
small companies (3 to
9 workers) provided
coverage in California
in 2006, more than
nationally. Offer rates
for all other firms sizes
were comparable in
California and the rest
of the nation.
*Estimate is statistically different between California and the U.S.
Sources: CHCF/HSC California Employer Health Benefits Survey: 2006; Kaiser/HRET Survey of Employer-Sponsored Health Benefits: 2006.
1,000+200–99950–19910–493–9*All Firms*
62%
48%
94% 92%97% 99% 99% 100%
80%76%
71%
61%
California U.S.
Number of Workers

©2006 California HealthCare Foundation 7
Employer Health Benefits Coverage AvailabilityEmployers Offering Dental Coverage,
by Firm Size, 2000 to 2006More than nine in
ten large employers
(200 or more workers) in
California offered dental
benefits, compared
with just 57 percent
of small employers
(3 to 199 workers.)
*Estimate is statistically different from previous year shown within firm size.
Source: CHCF/HSC California Employer Health Benefits Survey: 2006; Kaiser/HRET California Employer Health Benefits Survey: 2000, 2003.
All FirmsLarge Firms(200+ Workers)
Small Firms(3–199 Workers)
2000 2003 2006
48%49%
57%
50%51%
58%
91%*
84%
91%
©2006 California HealthCare Foundation 8
Employer Health Benefits Coverage AvailabilityFirms Reporting “Very Important”
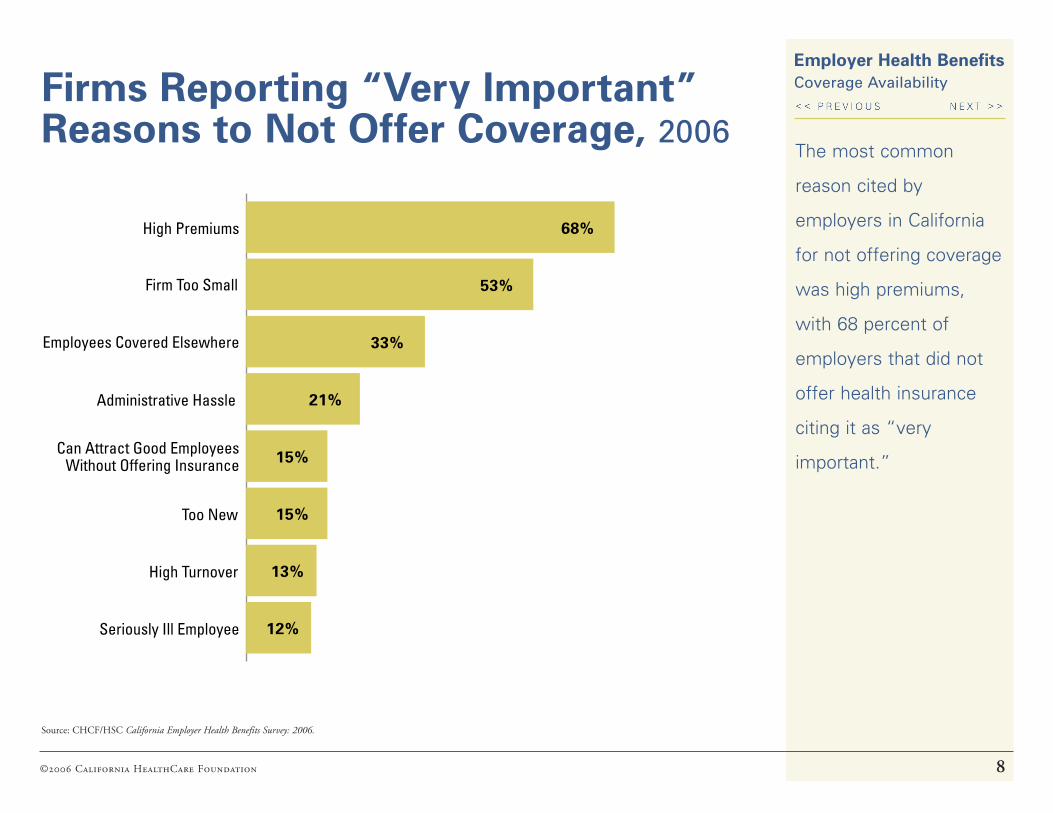
Reasons to Not Offer Coverage, 2006The most common
reason cited by
employers in California
for not offering coverage
was high premiums,
with 68 percent of
employers that did not
offer health insurance
citing it as “very
important.”
Source: CHCF/HSC California Employer Health Benefits Survey: 2006.
Seriously Ill Employee
High Turnover
Too New
Can Attract Good Employees Without Offering Insurance
Administrative Hassle
Employees Covered Elsewhere
Firm Too Small
High Premiums 68%
53%
33%
21%
15%
15%
13%
12%
©2006 California HealthCare Foundation 9
Employer Health Benefits Coverage AvailabilityEmployee Eligibility, Take-Up Rates,
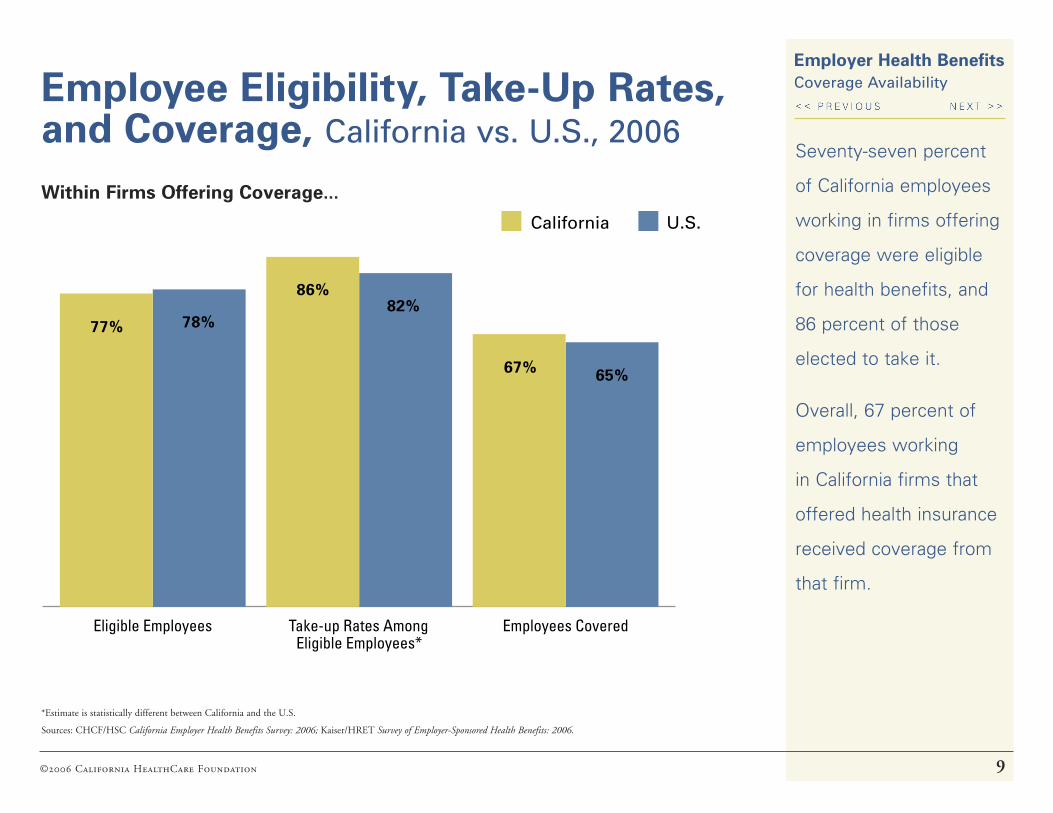
and Coverage, California vs. U.S., 2006Seventy-seven percent
of California employees
working in firms offering
coverage were eligible
for health benefits, and
86 percent of those
elected to take it.
Overall, 67 percent of
employees working
in California firms that
offered health insurance
received coverage from
that firm.
*Estimate is statistically different between California and the U.S.
Sources: CHCF/HSC California Employer Health Benefits Survey: 2006; Kaiser/HRET Survey of Employer-Sponsored Health Benefits: 2006.
Within Firms Offering Coverage...
Employees CoveredTake-up Rates AmongEligible Employees*
Eligible Employees
86%82%
65%67%
77% 78%
California U.S.
©2006 California HealthCare Foundation 10
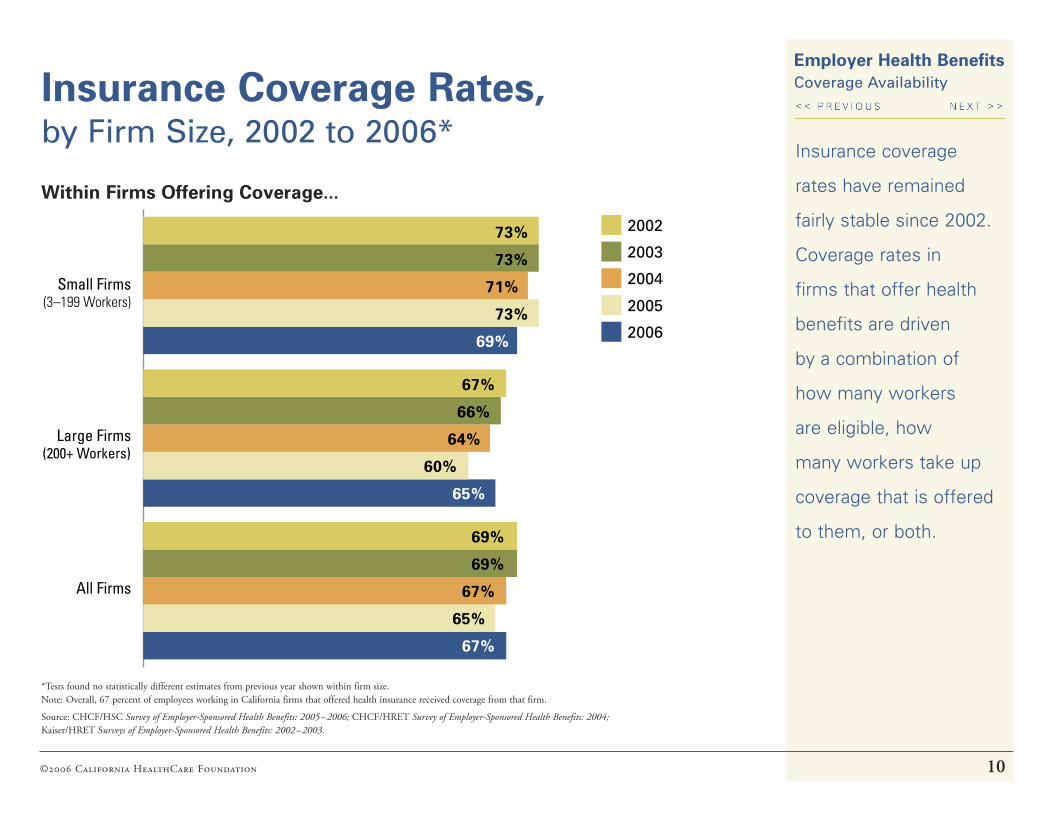
Employer Health Benefits Coverage AvailabilityInsurance Coverage Rates,
by Firm Size, 2002 to 2006*Insurance coverage
rates have remained
fairly stable since 2002.
Coverage rates in
firms that offer health
benefits are driven
by a combination of
how many workers
are eligible, how
many workers take up
coverage that is offered
to them, or both.
*Tests found no statistically different estimates from previous year shown within firm size. Note: Overall, 67 percent of employees working in California firms that offered health insurance received coverage from that firm.
Source: CHCF/HSC Survey of Employer-Sponsored Health Benefits: 2005–2006; CHCF/HRET Survey of Employer-Sponsored Health Benefits: 2004; Kaiser/HRET Surveys of Employer-Sponsored Health Benefits: 2002–2003.
Within Firms Offering Coverage...
All Firms
Large Firms(200+ Workers)
Small Firms(3–199 Workers)
73%
73%
71%
73%
69%
67%
66%
64%
60%
65%
69%
69%
67%
65%
67%
2002
2003
2004
2005
2006

©2006 California HealthCare Foundation 11
Employer Health Benefits CostsIncrease in Premiums Compared to
Inflation, California vs. U.S., 2000 to 2006Premium increases
in California in 2006
(8.7 percent) were
more than twice the
California inflation rate
of 4.2 percent, and
higher than the national
increase rate of
7.7 percent.
*Estimates are statistically different between California and the U.S.
Sources: CHCF/HSC California Employer Health Benefits Survey: 2005–2006; CHCF/HRET California Employer Health Benefits Survey: 2004; Kaiser/HRET California Employer Health Benefits Survey: 2000–2003; California Division of Labor Statistics and Research, Consumer Price Index, California Average of Annual Inflation (April to April) 2000–2005.
0%
4%
8%
12%
16%
2006*200520042003*200220012000*
2.8%
4.3%
2.8%2.7%
1.7%
3.9%4.2%
Premium Increases
Overall California Inflation
CA
U.S.
CA
U.S.
6.7% 10.0% 13.4% 15.8% 11.4% 8.2% 8.7%
8.2% 10.9% 12.9% 13.9% 11.2% 9.2% 7.7%
©2006 California HealthCare Foundation 12
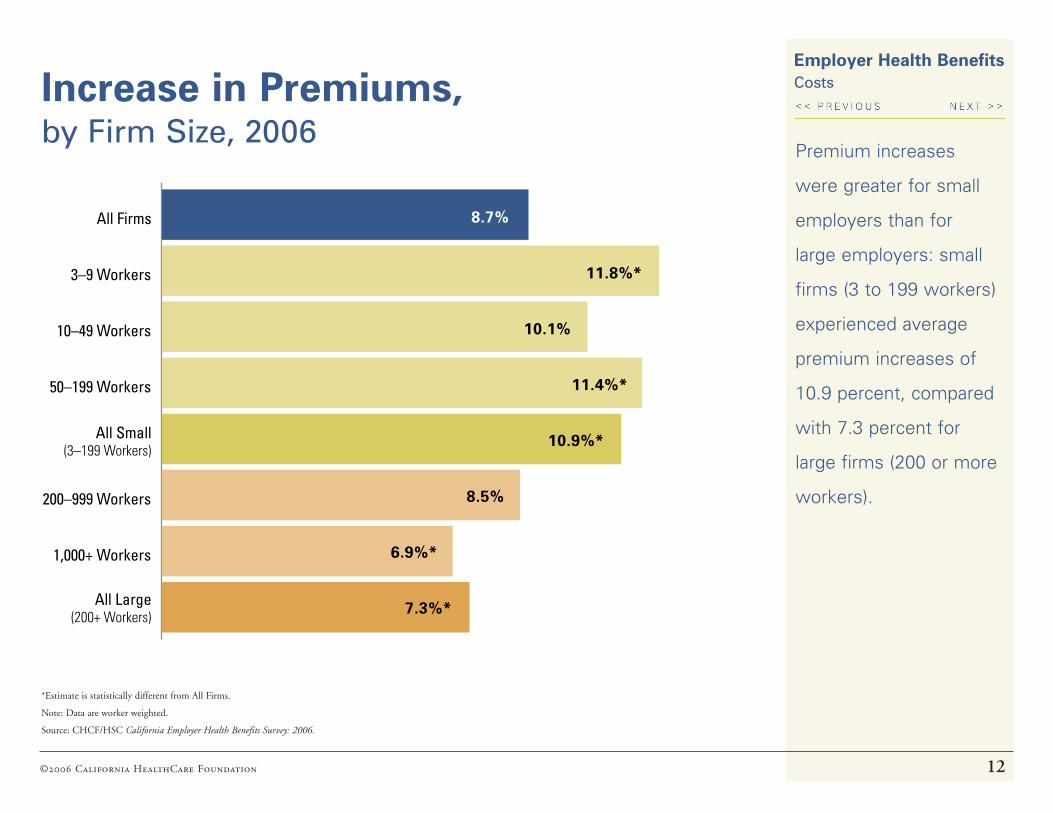
Employer Health Benefits CostsIncrease in Premiums,
by Firm Size, 2006Premium increases
were greater for small
employers than for
large employers: small
firms (3 to 199 workers)
experienced average
premium increases of
10.9 percent, compared
with 7.3 percent for
large firms (200 or more
workers).
*Estimate is statistically different from All Firms.
Note: Data are worker weighted.
Source: CHCF/HSC California Employer Health Benefits Survey: 2006.
All Large (200+ Workers)
1,000+ Workers
200–999 Workers
All Small(3–199 Workers)
50–199 Workers
10–49 Workers
3–9 Workers
All Firms 8.7%
11.8%*
10.1%
11.4%*
10.9%*
8.5%
6.9%*
7.3%*
©2006 California HealthCare Foundation 13
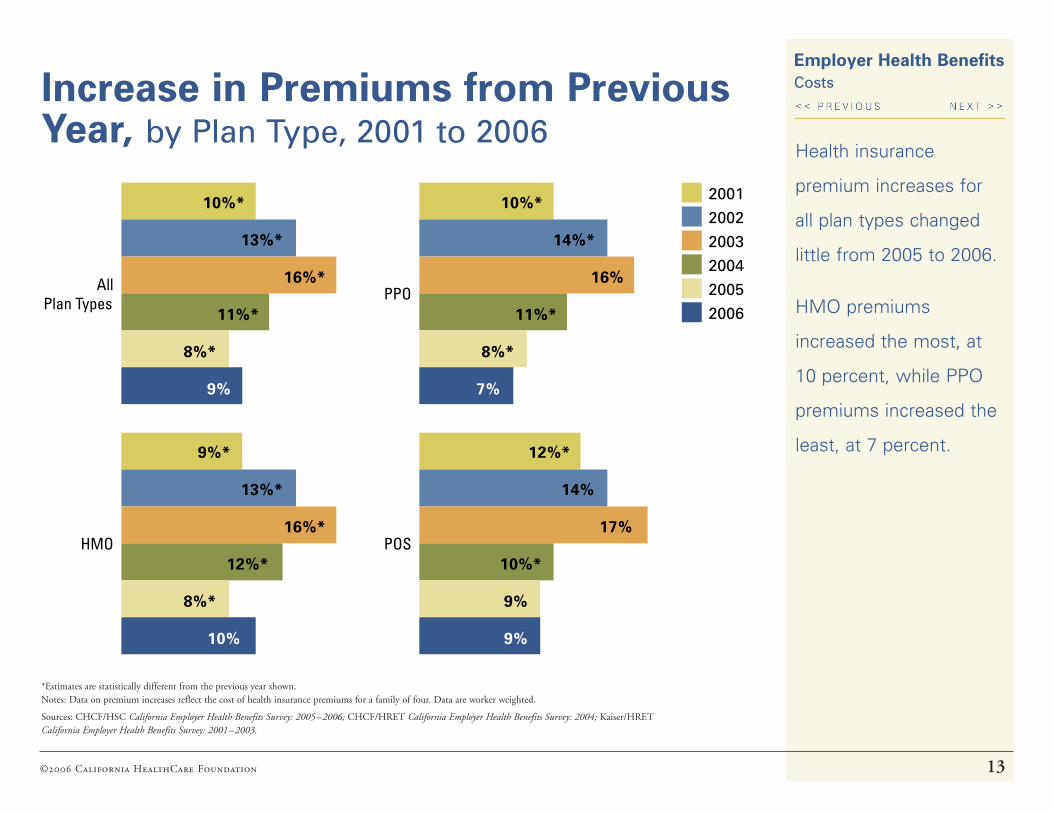
Employer Health Benefits CostsIncrease in Premiums from Previous
Year, by Plan Type, 2001 to 2006
*Estimates are statistically different from the previous year shown. Notes: Data on premium increases reflect the cost of health insurance premiums for a family of four. Data are worker weighted.
Sources: CHCF/HSC California Employer Health Benefits Survey: 2005–2006; CHCF/HRET California Employer Health Benefits Survey: 2004; Kaiser/HRET California Employer Health Benefits Survey: 2001–2003.
Health insurance
premium increases for
all plan types changed
little from 2005 to 2006.
HMO premiums
increased the most, at
10 percent, while PPO
premiums increased the
least, at 7 percent.
All Plan Types
HMO
PPO
POS
10%*
13%*
16%*
11%*
8%*
9%
9%*
13%*
16%*
12%*
8%*
10%
10%*
14%*
16%
11%*
8%*
7%
12%*
14%
17%
10%*
9%
9%
2001
2002
2003
2004
2005
2006

©2006 California HealthCare Foundation 14
Employer Health Benefits CostsPremium Increase Percentage,
by Firm Size, 2006
*Distribution is statistically different from All Firms.
Source: CHCF/HSC California Employer Health Benefits Survey: 2006
The majority of workers
were employed in firms
that had a premium
increase less than or
equal to 10 percent.
Small firms were much
more likely to experience
large premium increases;
25 percent of small firm
employees worked in
companies that had
a premium increase
greater than 15 percent,
compared with only
5 percent of employees
working for large firms.
All Small Firms* (3–199 Workers)
All Large Firms* (200+ Workers)
All Firms 32% 33% 23% 8% 5%
35% 38% 22% 4%1
26% 25% 24% 14% 11%
<_ 5% 5.1–10% 10.1–15% 15.1–20% > 20%
©2006 California HealthCare Foundation 15
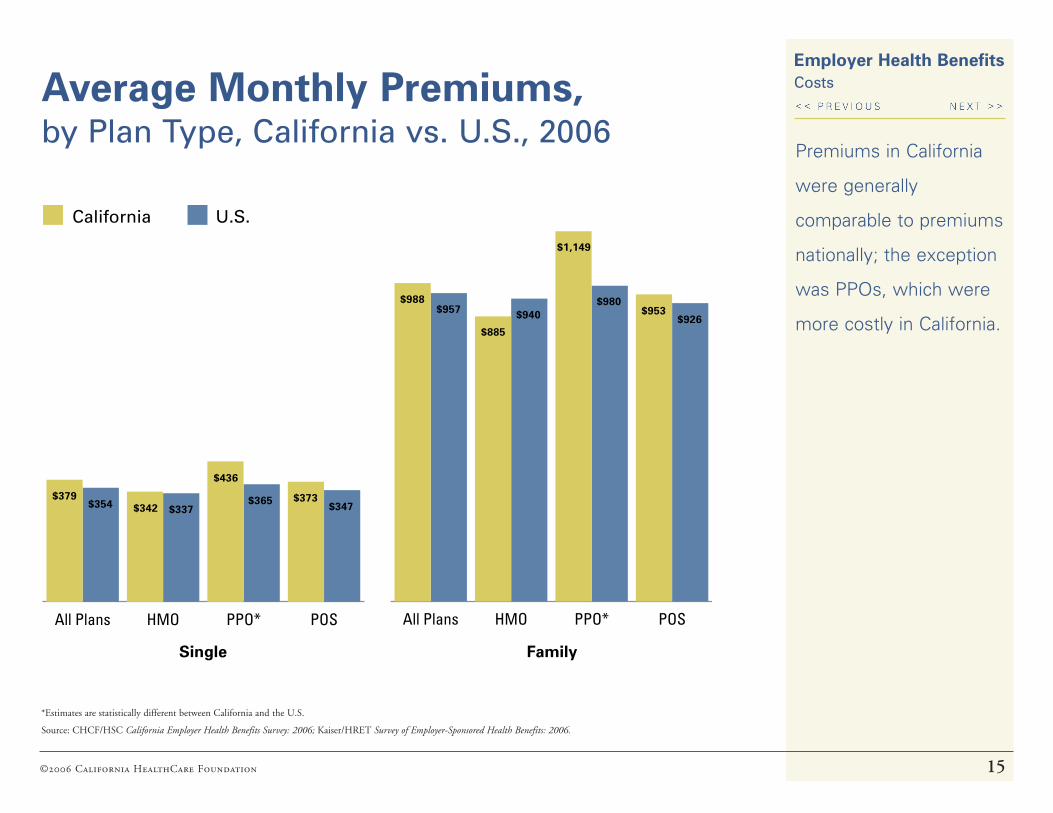
Employer Health Benefits CostsAverage Monthly Premiums,
by Plan Type, California vs. U.S., 2006Premiums in California
were generally
comparable to premiums
nationally; the exception
was PPOs, which were
more costly in California.
*Estimates are statistically different between California and the U.S.
Source: CHCF/HSC California Employer Health Benefits Survey: 2006; Kaiser/HRET Survey of Employer-Sponsored Health Benefits: 2006.
POSPPO*HMOAll Plans POSPPO*HMOAll Plans
$885
$940
$1,149
$980$953
$926
$988$957
$436
$365 $373$347
$379$354 $342 $337
Single Family
California U.S.
©2006 California HealthCare Foundation 16
Employer Health Benefits CostsAverage Monthly HMO Premiums,
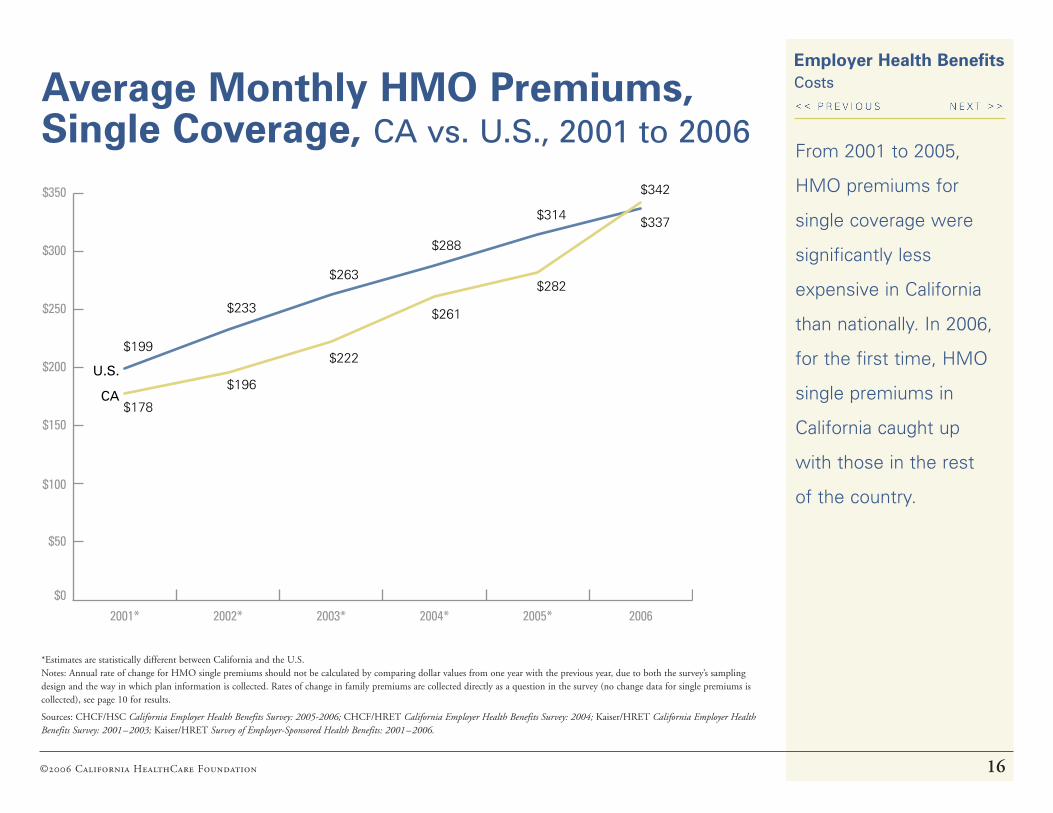
Single Coverage, CA vs. U.S., 2001 to 2006From 2001 to 2005,
HMO premiums for
single coverage were
significantly less
expensive in California
than nationally. In 2006,
for the first time, HMO
single premiums in
California caught up
with those in the rest
of the country.
*Estimates are statistically different between California and the U.S. Notes: Annual rate of change for HMO single premiums should not be calculated by comparing dollar values from one year with the previous year, due to both the survey’s sampling design and the way in which plan information is collected. Rates of change in family premiums are collected directly as a question in the survey (no change data for single premiums is collected), see page 10 for results.
Sources: CHCF/HSC California Employer Health Benefits Survey: 2005-2006; CHCF/HRET California Employer Health Benefits Survey: 2004; Kaiser/HRET California Employer Health Benefits Survey: 2001–2003; Kaiser/HRET Survey of Employer-Sponsored Health Benefits: 2001–2006.
$0
$50
$100
$150
$200
$250
$300
$350
20062005*2004*2003*2002*2001*
U.S.
CA
$199
$233
$263
$288
$314
$342
$178
$196
$222
$261
$282
$337
©2006 California HealthCare Foundation 17
Employer Health Benefits CostsAverage Annual Worker and
Employer Contributions, California vs. U.S., 2006
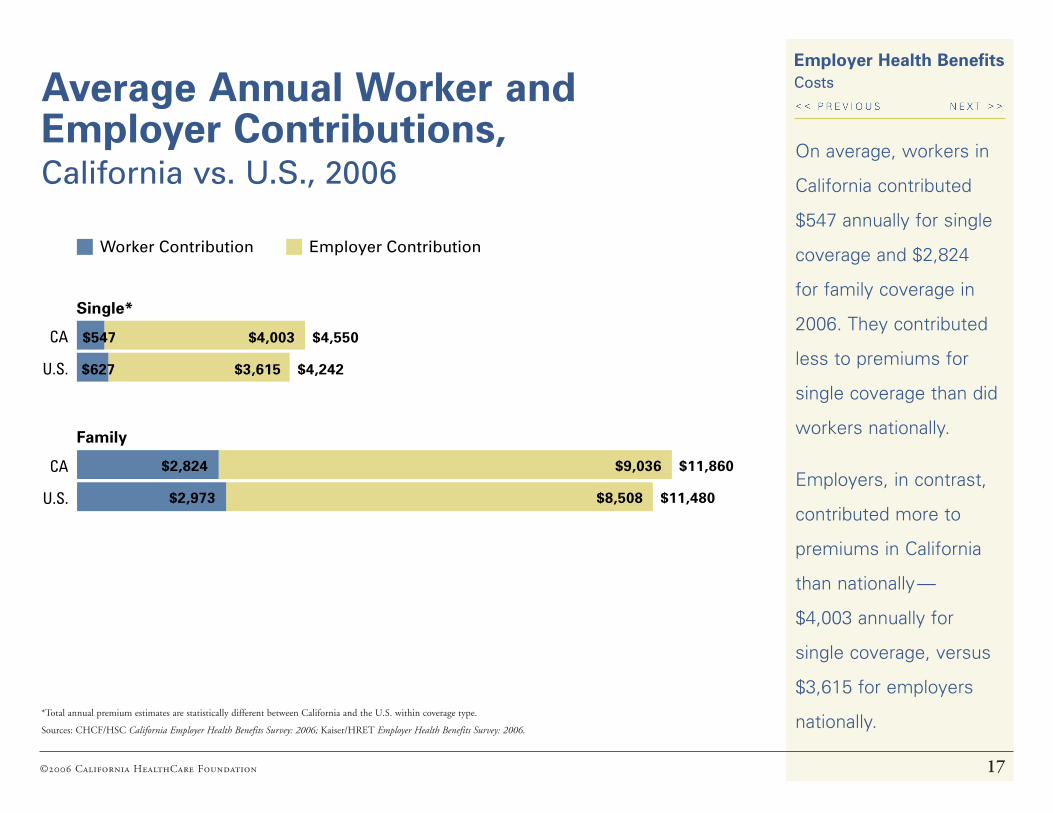
On average, workers in
California contributed
$547 annually for single
coverage and $2,824
for family coverage in
2006. They contributed
less to premiums for
single coverage than did
workers nationally.
Employers, in contrast,
contributed more to
premiums in California
than nationally —
$4,003 annually for
single coverage, versus
$3,615 for employers
nationally.*Total annual premium estimates are statistically different between California and the U.S. within coverage type.
Sources: CHCF/HSC California Employer Health Benefits Survey: 2006; Kaiser/HRET Employer Health Benefits Survey: 2006.
U.S.
CA
Single*
Worker Contribution Employer Contribution
U.S.
CA
Family
$547 $4,003 $4,550
$627 $3,615 $4,242
$2,824 $9,036 $11,860
$2,973 $8,508 $11,480
©2006 California HealthCare Foundation 18
Employer Health Benefits CostsShare of Premiums Paid by Workers,
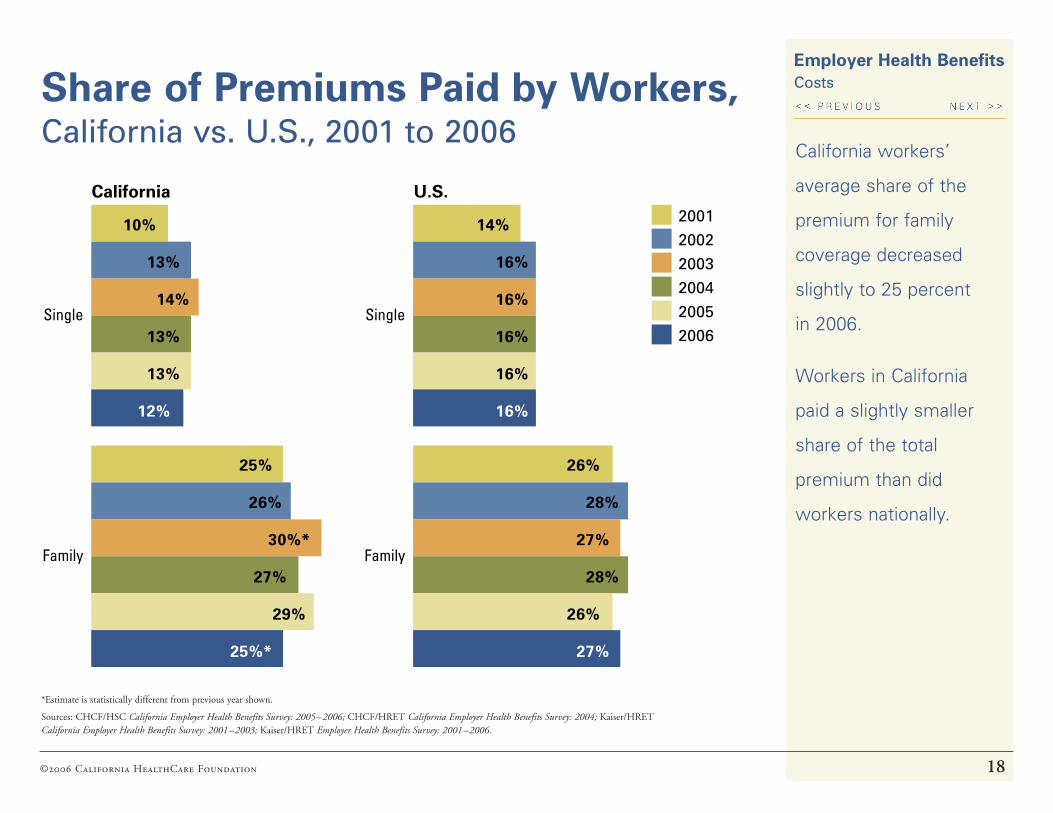
California vs. U.S., 2001 to 2006California workers’
average share of the
premium for family
coverage decreased
slightly to 25 percent
in 2006.
Workers in California
paid a slightly smaller
share of the total
premium than did
workers nationally.
*Estimate is statistically different from previous year shown.
Sources: CHCF/HSC California Employer Health Benefits Survey: 2005–2006; CHCF/HRET California Employer Health Benefits Survey: 2004; Kaiser/HRET California Employer Health Benefits Survey: 2001–2003; Kaiser/HRET Employer Health Benefits Survey: 2001–2006.
Single
Family
2001
2002
2003
2004
2005
2006Single
Family
10%
13%
14%
13%
13%
12%
25%
26%
30%*
27%
29%
25%*
14%
16%
16%
16%
16%
16%
26%
28%
27%
28%
26%
27%
California U.S.
©2006 California HealthCare Foundation 19
Employer Health Benefits CostsWorker Contribution to Monthly
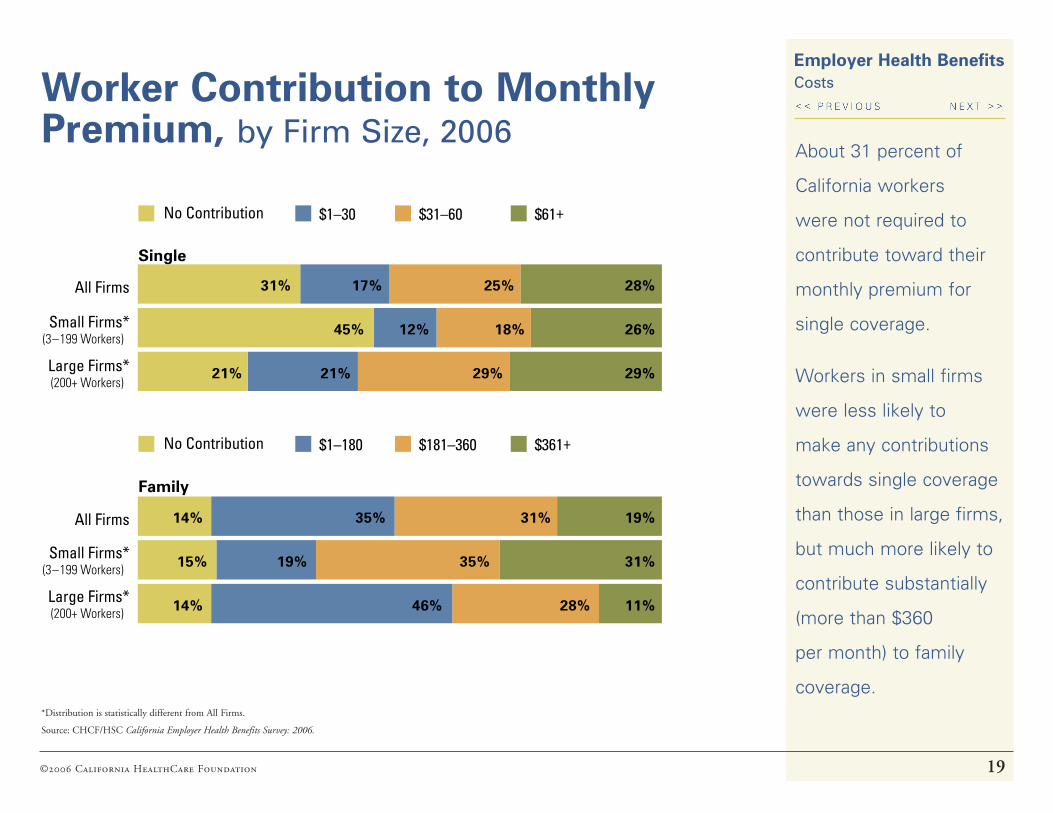
Premium, by Firm Size, 2006About 31 percent of
California workers
were not required to
contribute toward their
monthly premium for
single coverage.
Workers in small firms
were less likely to
make any contributions
towards single coverage
than those in large firms,
but much more likely to
contribute substantially
(more than $360
per month) to family
coverage.*Distribution is statistically different from All Firms.
Source: CHCF/HSC California Employer Health Benefits Survey: 2006.
Large Firms*(200+ Workers)
Small Firms*(3–199 Workers)
All Firms
Single
No Contribution $1–30 $31–60 $61+
No Contribution $1–180 $181–360 $361+
31% 17% 25% 28%
45% 12% 18% 26%
21% 21% 29% 29%
Large Firms*(200+ Workers)
Small Firms*(3–199 Workers)
All Firms 14% 35% 31% 19%
15% 19% 35% 31%
14% 46% 28% 11%
Family

©2006 California HealthCare Foundation 20
Employer Health Benefits CostsEmployer Share of Premium,
by Firm Size, 2006The majority of California
employees worked in
firms that contributed
between 75 and 99
percent of the single
premium. Small firms
were far more likely to
pay the full premium
for single coverage
(45 percent) than were
large firms (21 percent).
*Distribution is statistically different from All Firms.
Source: CHCF/HSC California Employer Health Benefits Survey: 2006.
Large Firms*(200+ Workers)
Small Firms*(3–199 Workers)
All Firms
Single
0–49% 50–74% 75–99% 100%
2 12% 55% 30%
4% 14% 38% 45%
1 11% 67% 21%
Large Firms*(200+ Workers)
Small Firms*(3–199 Workers)
All Firms 15% 28% 43% 15%
27% 35% 23% 15%
6% 23% 56% 14%
Family
©2006 California HealthCare Foundation 21
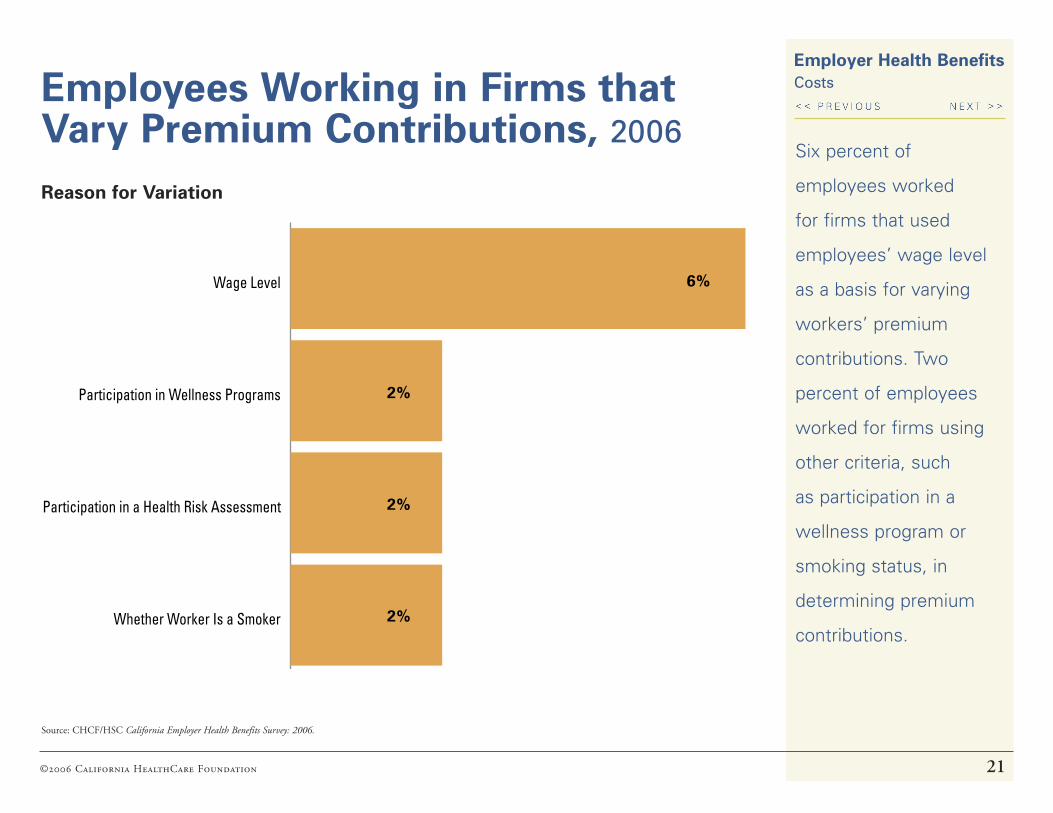
Employer Health Benefits CostsEmployees Working in Firms that
Vary Premium Contributions, 2006Six percent of
employees worked
for firms that used
employees’ wage level
as a basis for varying
workers’ premium
contributions. Two
percent of employees
worked for firms using
other criteria, such
as participation in a
wellness program or
smoking status, in
determining premium
contributions.
Source: CHCF/HSC California Employer Health Benefits Survey: 2006.
Whether Worker Is a Smoker
Participation in a Health Risk Assessment
Participation in Wellness Programs
Wage Level 6%
2%
2%
2%
Reason for Variation
©2006 California HealthCare Foundation 22
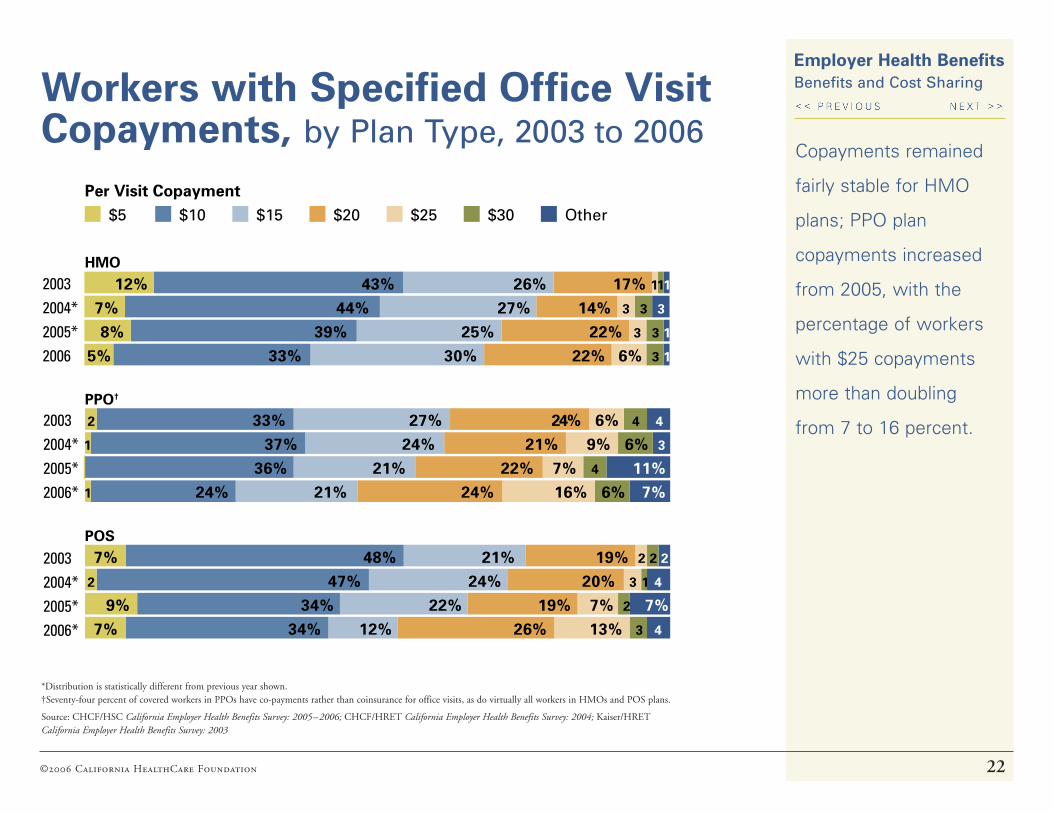
Employer Health Benefits Benefits and Cost SharingWorkers with Specified Office Visit
Copayments, by Plan Type, 2003 to 2006Copayments remained
fairly stable for HMO
plans; PPO plan
copayments increased
from 2005, with the
percentage of workers
with $25 copayments
more than doubling
from 7 to 16 percent.
*Distribution is statistically different from previous year shown. †Seventy-four percent of covered workers in PPOs have co-payments rather than coinsurance for office visits, as do virtually all workers in HMOs and POS plans.
Source: CHCF/HSC California Employer Health Benefits Survey: 2005–2006; CHCF/HRET California Employer Health Benefits Survey: 2004; Kaiser/HRET California Employer Health Benefits Survey: 2003
20062005*2004*2003
HMO
$5 $10 $15 $20 $25 $30 Other
Per Visit Copayment
12% 43% 26% 17% 111
7% 44% 27% 14% 3 3 3
8% 39% 25% 22% 3 3 1 5% 33% 30% 22% 6% 3 1
2006*2005*2004*2003
PPO†
2 33% 27% 24% 6% 4 4
1 37% 24% 21% 9% 6% 336% 21% 22% 7% 4 11%
1 24% 21% 24% 16% 6% 7%
2006*2005*2004*2003
POS7% 48% 21% 19% 2 2 2
2 47% 24% 20% 3 1 4
9% 34% 22% 19% 7% 2 7%7% 34% 12% 26% 13% 3 4
©2006 California HealthCare Foundation 23
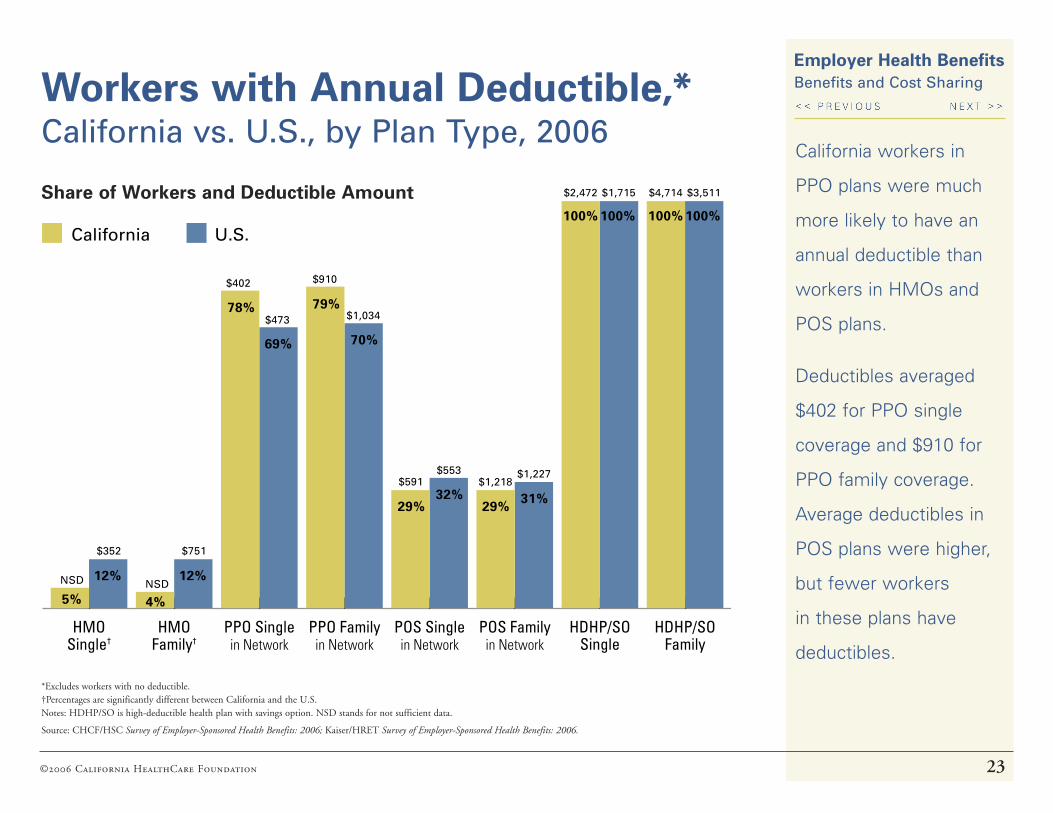
Employer Health Benefits Benefits and Cost SharingWorkers with Annual Deductible,*
California vs. U.S., by Plan Type, 2006
*Excludes workers with no deductible. †Percentages are significantly different between California and the U.S. Notes: HDHP/SO is high-deductible health plan with savings option. NSD stands for not sufficient data.
Source: CHCF/HSC Survey of Employer-Sponsored Health Benefits: 2006; Kaiser/HRET Survey of Employer-Sponsored Health Benefits: 2006.
California workers in
PPO plans were much
more likely to have an
annual deductible than
workers in HMOs and
POS plans.
Deductibles averaged
$402 for PPO single
coverage and $910 for
PPO family coverage.
Average deductibles in
POS plans were higher,
but fewer workers
in these plans have
deductibles.HDHP/SO
FamilyHDHP/SO
SinglePOS Family
in NetworkPOS Singlein Network
PPO Familyin Network
PPO Singlein Network
HMOFamily†
HMOSingle†
4%
12%
31%29%
100% 100% 100% 100%
78%
69%
79%
70%
29%32%
5%
12%
California U.S.
NSD
$751
$402
$473 $1,034
$910
$591$553
$1,218$1,227
$2,472 $1,715 $4,714 $3,511
NSD
$352
Share of Workers and Deductible Amount

©2006 California HealthCare Foundation 24
Employer Health Benefits
Deductible for Single Coverage,* by Plan Type, 2006
Benefits and Cost Sharing
Among employees
who faced a deductible,
two-thirds have an
annual deductible of
less than $500 for
single coverage,
while 16 percent
had a deductible of
$1,000 or more.
*Excludes workers with no deductible. †Distribution is statistically different from All Plans. Notes: HDHP/SO is high-deductible health plan with savings option. NSD stands for not sufficient data.
Source: CHCF/HSC California Employer Health Benefits Survey: 2006.
HDHP/SO†
POS
PPO
HMO
All Plans 66% 18% 12% 4%
NSD
69% 21% 8% 2
50% 29% 18% 3
23% 77%
< $500 $500–999 $1,000–1,999 $2,000+
Percentage of Workers with Specified Deductible Ranges
©2006 California HealthCare Foundation 25
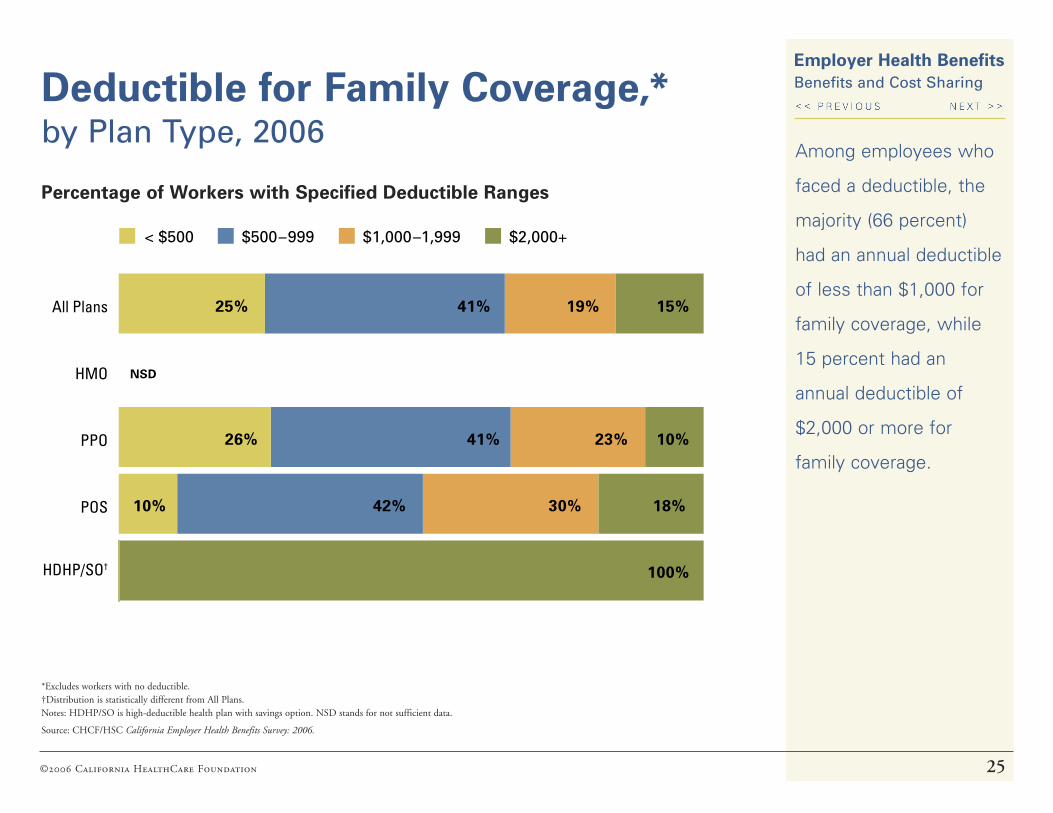
Deductible for Family Coverage,* by Plan Type, 2006
Among employees who
faced a deductible, the
majority (66 percent)
had an annual deductible
of less than $1,000 for
family coverage, while
15 percent had an
annual deductible of
$2,000 or more for
family coverage.
Employer Health Benefits Benefits and Cost Sharing
*Excludes workers with no deductible. †Distribution is statistically different from All Plans. Notes: HDHP/SO is high-deductible health plan with savings option. NSD stands for not sufficient data.
Source: CHCF/HSC California Employer Health Benefits Survey: 2006.
Percentage of Workers with Specified Deductible Ranges
HDHP/SO†
POS
PPO
HMO
All Plans 25% 41% 19% 15%
NSD
26% 41% 23% 10%
10% 42% 30% 18%
100%
< $500 $500–999 $1,000–1,999 $2,000+
©2006 California HealthCare Foundation 26
Employer Health Benefits Benefits and Cost SharingDeductible for Single PPO Coverage,*
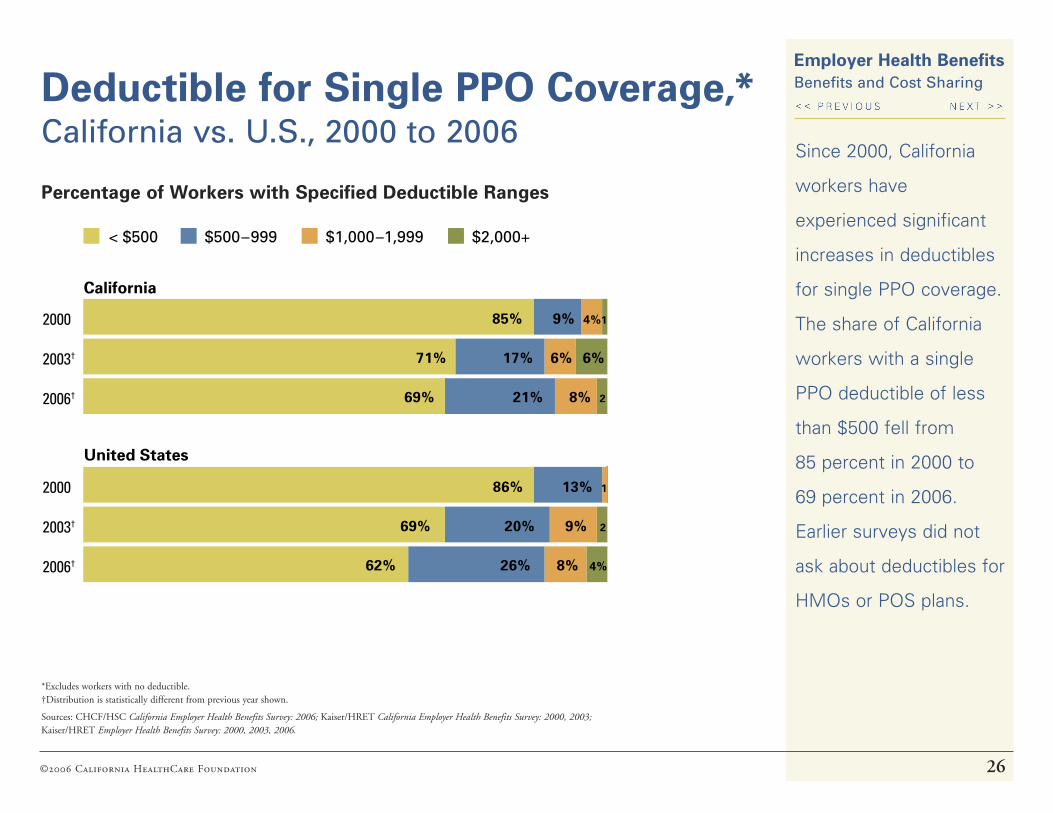
California vs. U.S., 2000 to 2006Since 2000, California
workers have
experienced significant
increases in deductibles
for single PPO coverage.
The share of California
workers with a single
PPO deductible of less
than $500 fell from
85 percent in 2000 to
69 percent in 2006.
Earlier surveys did not
ask about deductibles for
HMOs or POS plans.
*Excludes workers with no deductible. †Distribution is statistically different from previous year shown.
Sources: CHCF/HSC California Employer Health Benefits Survey: 2006; Kaiser/HRET California Employer Health Benefits Survey: 2000, 2003; Kaiser/HRET Employer Health Benefits Survey: 2000, 2003, 2006.
2006†
2003†
2000
California
85% 9% 4%1
71% 17% 6% 6%
69% 21% 8% 2
2006†
2003†
2000 86% 13% 1
69% 20% 9% 2
62% 26% 8% 4%
United States
< $500 $500–999 $1,000–1,999 $2,000+
Percentage of Workers with Specified Deductible Ranges
©2006 California HealthCare Foundation 27
Employer Health Benefits
Annual Out-of-Pocket Limits, Single Coverage, 2006
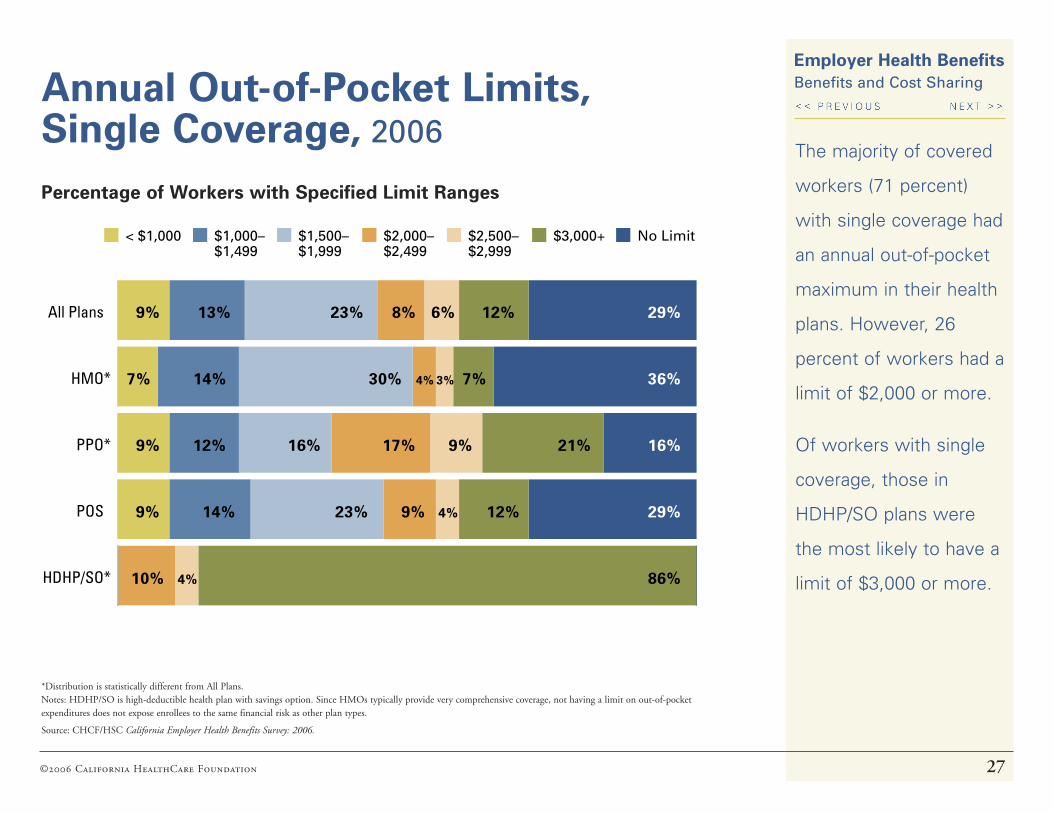
The majority of covered
workers (71 percent)
with single coverage had
an annual out-of-pocket
maximum in their health
plans. However, 26
percent of workers had a
limit of $2,000 or more.
Of workers with single
coverage, those in
HDHP/SO plans were
the most likely to have a
limit of $3,000 or more.
*Distribution is statistically different from All Plans. Notes: HDHP/SO is high-deductible health plan with savings option. Since HMOs typically provide very comprehensive coverage, not having a limit on out-of-pocket expenditures does not expose enrollees to the same financial risk as other plan types.
Source: CHCF/HSC California Employer Health Benefits Survey: 2006.
Benefits and Cost Sharing
Percentage of Workers with Specified Limit Ranges
HDHP/SO*
POS
PPO*
HMO*
All Plans
< $1,000 $1,000–$1,499
$1,500–$1,999
$2,000–$2,499
$2,500–$2,999
$3,000+ No Limit
9% 13% 23% 8% 6% 12% 29%
7% 14% 30% 4% 3% 7% 36%
9% 12% 16% 17% 9% 21% 16%
9% 14% 23% 9% 4% 12% 29%
10% 4% 86%

©2006 California HealthCare Foundation 28
Employer Health Benefits Benefits and Cost SharingAnnual Out-of-Pocket Limits,
Family Coverage, 2006The vast majority of
covered workers
(69 percent) with family
coverage had an annual
out-of-pocket maximum
in their health plans.
Twenty-eight percent
of workers with family
coverage, however,
had a maximum of
$4,000 or more.
*Distribution is statistically different from All Plans.
Note: Since HMOs typically provide very comprehensive coverage, not having a limit on out-of-pocket expenditures does not expose enrollees to the same financial risk as it could in other plan types.
Source: CHCF/HSC California Employer Health Benefits Survey: 2006.
Percentage of Workers with Specified Limit Ranges
HDHP/SO*
POS
PPO*
HMO*
All Plans
< $2,000 $2,000–$2,999
$3,000–$3,999
$4,000–$4,999
$5,000–$5,999
$6,000+ No Limit
12% 9% 20% 12% 5% 11% 31%
9% 7% 27% 10% 4% 3% 40%
13% 13% 15% 14% 7% 23% 15%
14% 8% 22% 18% 3% 7% 29%
12% 20% 68%
©2006 California HealthCare Foundation 29
Employer Health Benefits Benefits and Cost SharingAnnual Out-of-Pocket Limits, Single
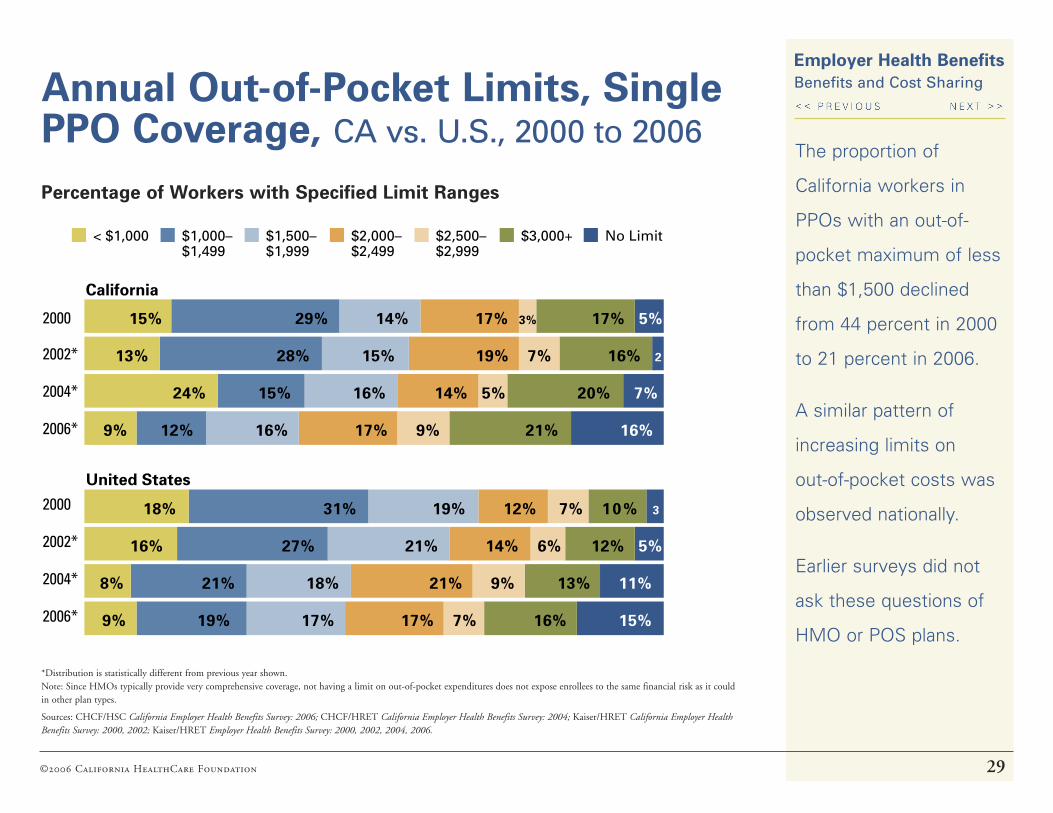
PPO Coverage, CA vs. U.S., 2000 to 2006The proportion of
California workers in
PPOs with an out-of-
pocket maximum of less
than $1,500 declined
from 44 percent in 2000
to 21 percent in 2006.
A similar pattern of
increasing limits on
out-of-pocket costs was
observed nationally.
Earlier surveys did not
ask these questions of
HMO or POS plans.
2006*
2004*
2002*
2000 15% 29% 14% 17% 3% 17% 5%
13% 28% 15% 19% 7% 16% 2
24% 15% 16% 14% 5% 20% 7%
9% 12% 16% 17% 9% 21% 16%
2006*
2004*
2002*
2000 18% 31% 19% 12% 7% 10% 3
16% 27% 21% 14% 6% 12% 5%
8% 21% 18% 21% 9% 13% 11%
9% 19% 17% 17% 7% 16% 15%
California
United States
< $1,000 $1,000–$1,499
$1,500–$1,999
$2,000–$2,499
$2,500–$2,999
$3,000+ No Limit
*Distribution is statistically different from previous year shown. Note: Since HMOs typically provide very comprehensive coverage, not having a limit on out-of-pocket expenditures does not expose enrollees to the same financial risk as it could in other plan types.
Sources: CHCF/HSC California Employer Health Benefits Survey: 2006; CHCF/HRET California Employer Health Benefits Survey: 2004; Kaiser/HRET California Employer Health Benefits Survey: 2000, 2002; Kaiser/HRET Employer Health Benefits Survey: 2000, 2002, 2004, 2006.
Percentage of Workers with Specified Limit Ranges

©2006 California HealthCare Foundation 30
Employer Health Benefits Benefits and Cost SharingCovered Workers with Select
Hospital Cost-Sharing Types, by Plan Type, 2006
Many covered workers
faced a separate
copayment, coinsurance,
or both for each hospital
admission, in addition to
any annual deductible.
The most common
was a copayment per
admission (41 percent
of covered workers),
followed by coinsurance
(9 percent).
*Estimate is statistically different from All Plans.
Note: HDHP/SO is high-deductible health plan with savings option.
Source: CHCF/HSC California Employer Health Benefits Survey: 2006.
PLAN TYPE
COPAYMENT/DEDUCTIBLE
PER ADMISSION COINSURANCE BOTHCHARGE PER DAY
HMO 48% < 1%* < 1% 3%
PPO 34% 24%* 3% < 1%
POS 34% 12% 1% 4%
HDHP/SO 8%* 34%* 0% 0%
All Plans 41% 9% 1% 2%
Across All Plans:Average Deductible/ Copay: $237Average Coinsurance: 15%
©2006 California HealthCare Foundation 31
Employer Health Benefits Benefits and Cost SharingCovered Workers with Cost Sharing
for an Emergency Room Visit, by Plan Type, 2006
*Estimate is statistically different from All Plans.
Note: HDHP/SO is high-deductible health plan with savings option.
Source: CHCF/HSC California Employer Health Benefits Survey: 2006.
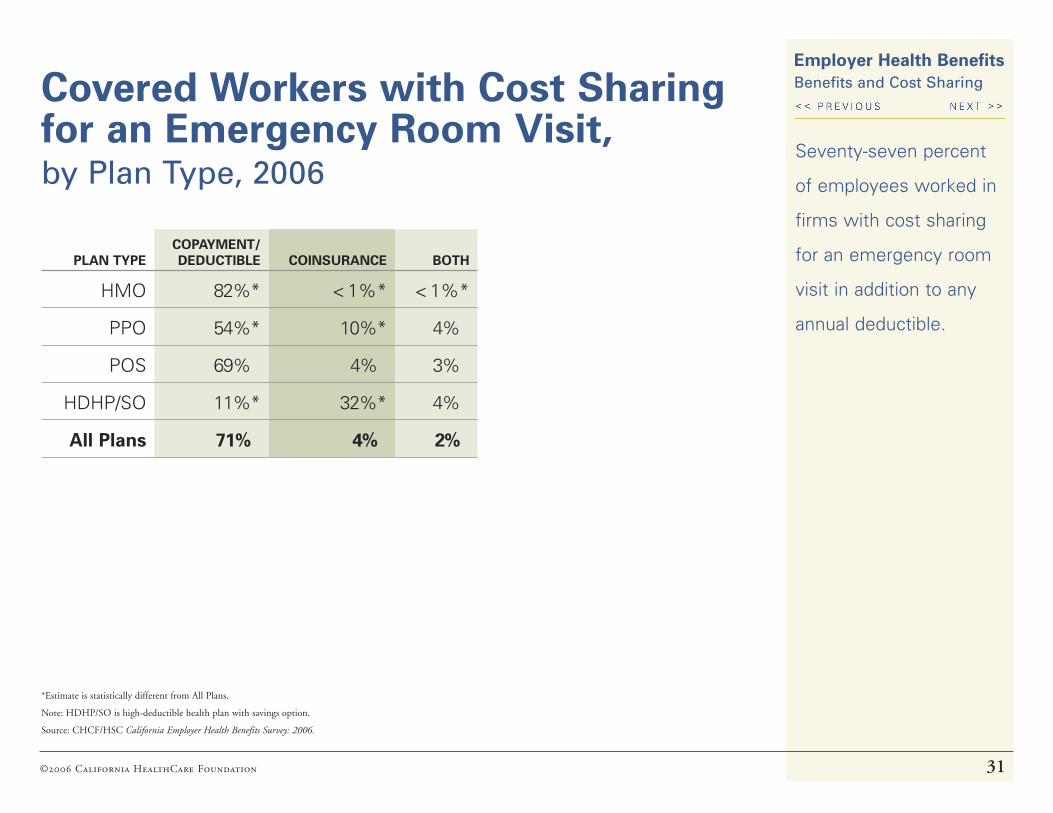
Seventy-seven percent
of employees worked in
firms with cost sharing
for an emergency room
visit in addition to any
annual deductible.
PLAN TYPECOPAYMENT/DEDUCTIBLE COINSURANCE BOTH
HMO 82%* < 1%* < 1%*
PPO 54%* 10%* 4%
POS 69% 4% 3%
HDHP/SO 11%* 32%* 4%
All Plans 71% 4% 2%

©2006 California HealthCare Foundation 32
Employer Health Benefits Benefits and Cost SharingWorkers Facing Cost-Sharing
Formulas for Prescription Drugs, 2003 to 2006
Fifty-seven percent
of covered workers in
California in 2006 were
enrolled in a health plan
that used a three or four
tier cost sharing formula.
Nationally, in contrast,
74 percent of workers
were enrolled in a plan
that used a three or four
tier cost-sharing formula.
*Distribution is statistically different from previous year shown.
Sources: CHCF/HSC California Employer Health Benefits Survey: 2005–2006; CHCF/HRET California Employer Health Benefits Survey: 2004; Kaiser/HRET California Employer Health Benefits Survey: 2003; Kaiser/HRET Employer Health Benefits Survey: 2003–2006.
2006*2005*20042003
California
Cost sharing the same regardless of drug type
Cost-Sharing Formula
Two Tier: One payment for generic drugs and one for name brandThree Tier: One payment for generic drugs, another for preferred drugs,
and a third for non-preferred drugsFour Tier: Three tier plus a fourth tier for lifestyle or other specified drugsOther
20% 38% 42% 111% 34% 46% 1 7%
13% 41% 44% 2 10% 30% 56% 12
20062005*20042003
United States13% 23% 63% 2
10% 20% 65% 3 1
8% 15% 70% 4% 2
8% 16% 69% 5% 2
©2006 California HealthCare Foundation 33
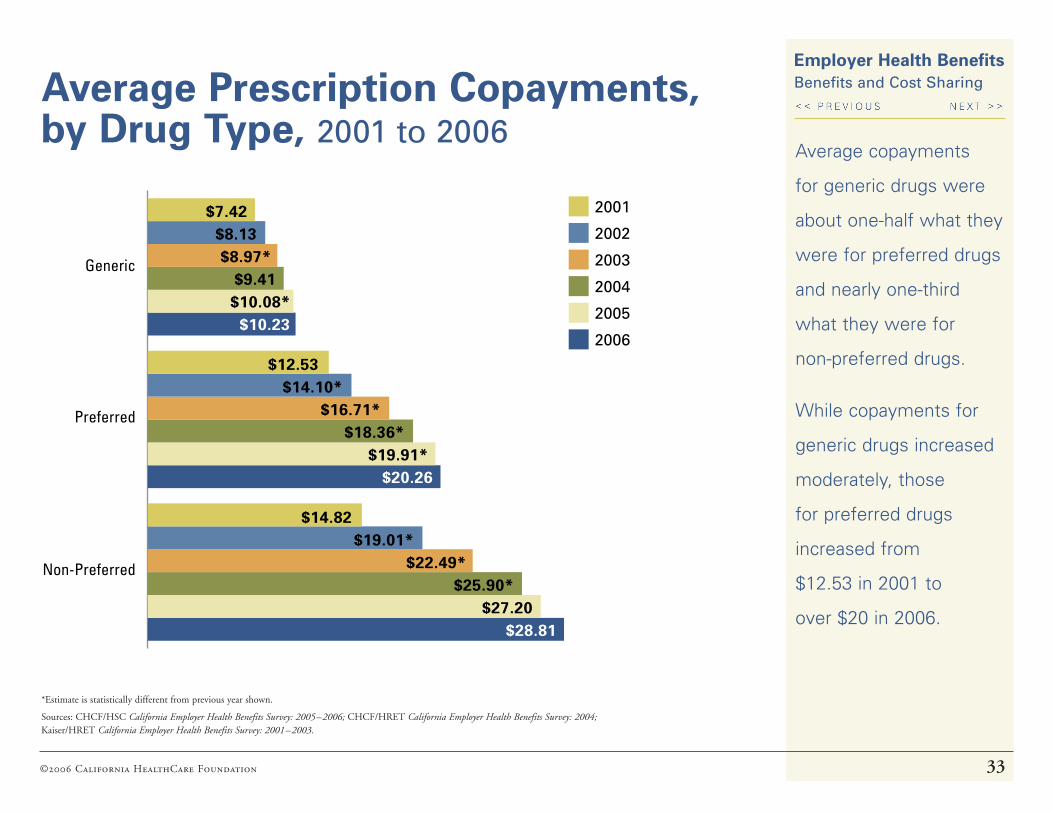
Employer Health Benefits Benefits and Cost SharingAverage Prescription Copayments,
by Drug Type, 2001 to 2006Average copayments
for generic drugs were
about one-half what they
were for preferred drugs
and nearly one-third
what they were for
non-preferred drugs.
While copayments for
generic drugs increased
moderately, those
for preferred drugs
increased from
$12.53 in 2001 to
over $20 in 2006.
*Estimate is statistically different from previous year shown.
Sources: CHCF/HSC California Employer Health Benefits Survey: 2005–2006; CHCF/HRET California Employer Health Benefits Survey: 2004; Kaiser/HRET California Employer Health Benefits Survey: 2001–2003.
Non-Preferred
Preferred
Generic
$7.42 $8.13 $8.97*
$9.41 $10.08*
$10.23
$12.53 $14.10*
$16.71* $18.36*
$19.91* $20.26
$14.82 $19.01*
$22.49* $25.90*
$27.20 $28.81
2001
2002
2003
2004
2005
2006
©2006 California HealthCare Foundation 34
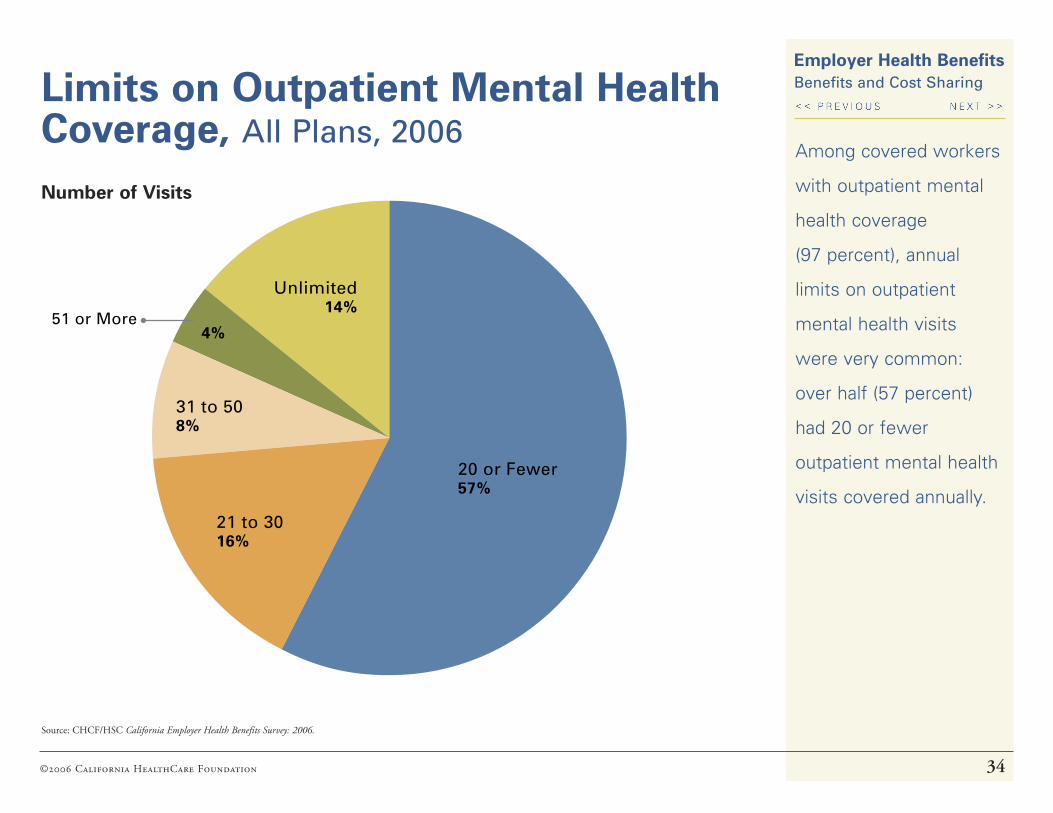
Employer Health Benefits Benefits and Cost SharingLimits on Outpatient Mental Health
Coverage, All Plans, 2006Among covered workers
with outpatient mental
health coverage
(97 percent), annual
limits on outpatient
mental health visits
were very common:
over half (57 percent)
had 20 or fewer
outpatient mental health
visits covered annually.
Source: CHCF/HSC California Employer Health Benefits Survey: 2006.
31 to 508%
51 or More4%
20 or Fewer57%
Unlimited14%
21 to 3016%
Number of Visits
©2006 California HealthCare Foundation 35
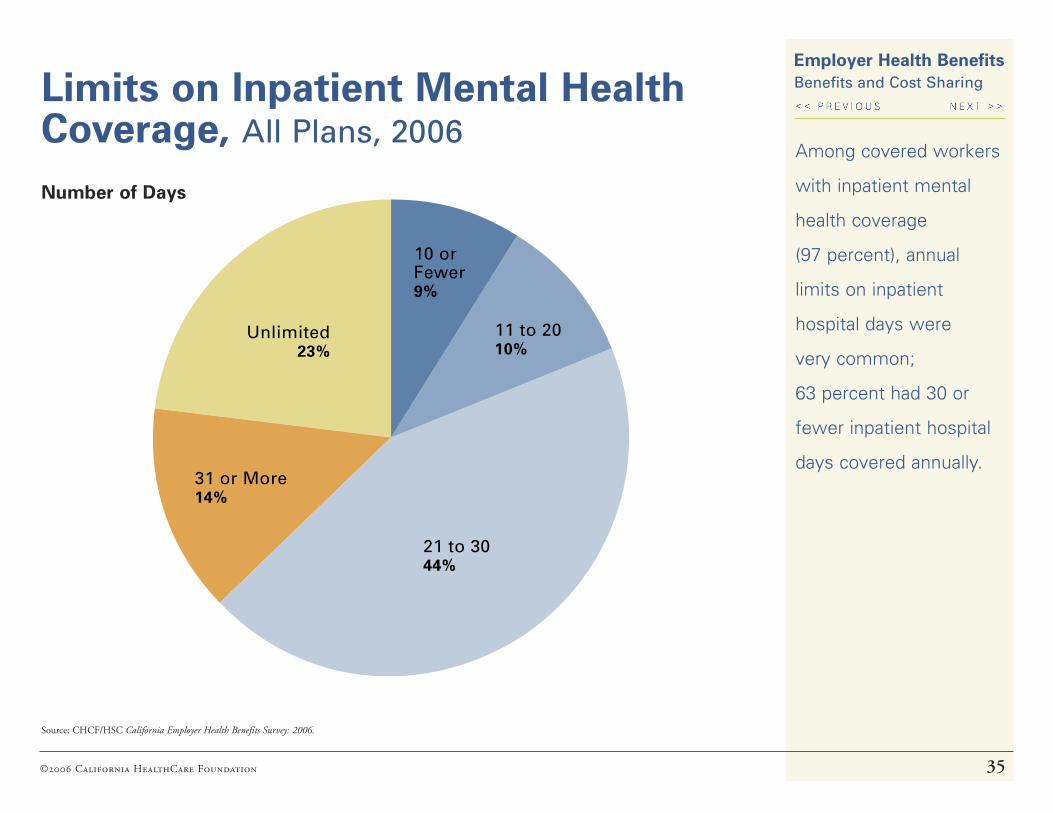
Employer Health Benefits Benefits and Cost SharingLimits on Inpatient Mental Health
Coverage, All Plans, 2006Among covered workers
with inpatient mental
health coverage
(97 percent), annual
limits on inpatient
hospital days were
very common;
63 percent had 30 or
fewer inpatient hospital
days covered annually.
Source: CHCF/HSC California Employer Health Benefits Survey: 2006.
21 to 3044%
10 or Fewer 9%
11 to 2010%
Unlimited23%
31 or More14%
Number of Days

©2006 California HealthCare Foundation 36
Employer Health Benefits
*Estimate is statistically different from all other firms.
Source: CHCF/HSC Survey of Employer-Sponsored Health Benefits, 2006.
In 2006, 29 percent
of firms had a disease
management program
as part of their largest
health plan. Large firms
were significantly more
likely than small firms to
include such a program.
Benefits and Cost SharingFirms Whose Largest Plan Includes a Disease Management Program, 2006
FIRM SIZEPLAN INCLUDES A
DISEASE MANAGEMENT PROGRAM
All Small Firms (3–199 Workers)
28%*
3–9 Workers 29%
10–49 Workers 25%
50–199 Workers 35%
All Large Firms (200+ Workers)
50%*
200–999 Workers 43%*
1,000+ Workers 62%*
All Firms 29%
©2006 California HealthCare Foundation 37
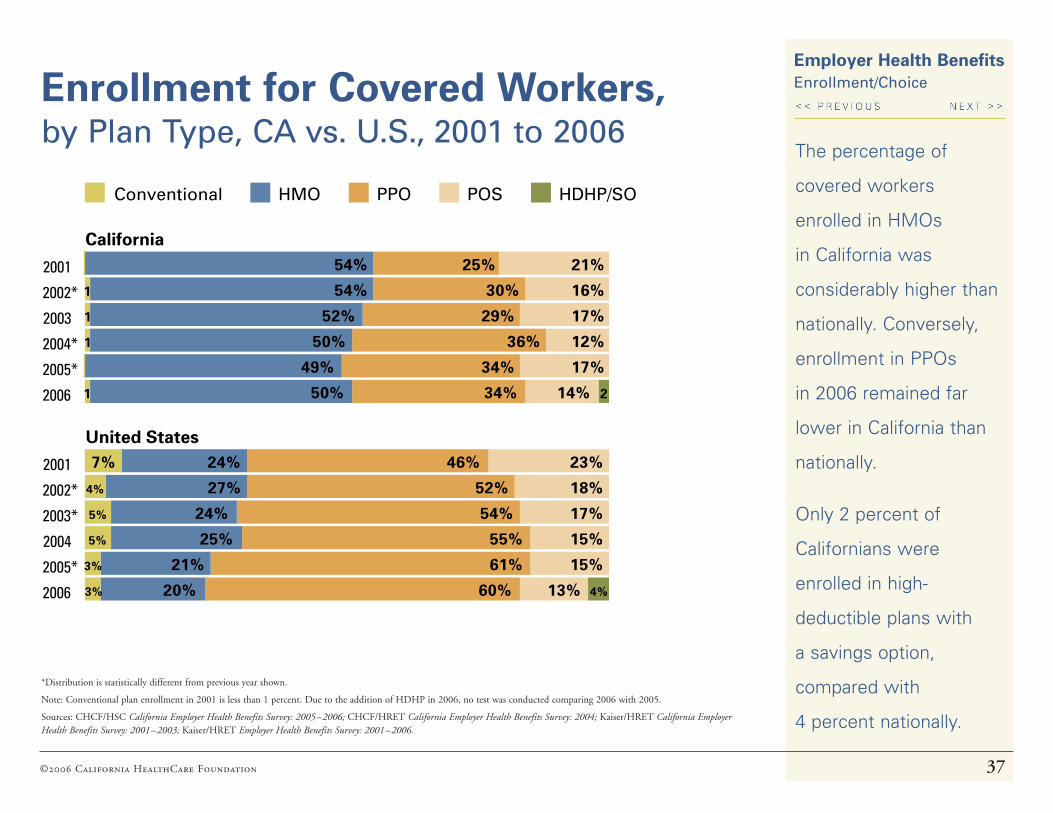
Employer Health Benefits Enrollment/ChoiceEnrollment for Covered Workers,
by Plan Type, CA vs. U.S., 2001 to 2006The percentage of
covered workers
enrolled in HMOs
in California was
considerably higher than
nationally. Conversely,
enrollment in PPOs
in 2006 remained far
lower in California than
nationally.
Only 2 percent of
Californians were
enrolled in high-
deductible plans with
a savings option,
compared with
4 percent nationally.
*Distribution is statistically different from previous year shown.
Note: Conventional plan enrollment in 2001 is less than 1 percent. Due to the addition of HDHP in 2006, no test was conducted comparing 2006 with 2005.
Sources: CHCF/HSC California Employer Health Benefits Survey: 2005–2006; CHCF/HRET California Employer Health Benefits Survey: 2004; Kaiser/HRET California Employer Health Benefits Survey: 2001–2003; Kaiser/HRET Employer Health Benefits Survey: 2001–2006.
2006
2005*
2004*
2003
2002*
2001
California
Conventional HMO PPO POS HDHP/SO
54% 25% 21%
1 54% 30% 16%
1 52% 29% 17%
1 50% 36% 12%
49% 34% 17%
1 50% 34% 14% 2
2006
2005*
2004
2003*
2002*
2001
United States 7% 24% 46% 23%
4% 27% 52% 18%
5% 24% 54% 17%
5% 25% 55% 15%
3% 21% 61% 15%
3% 20% 60% 13% 4%
©2006 California HealthCare Foundation 38
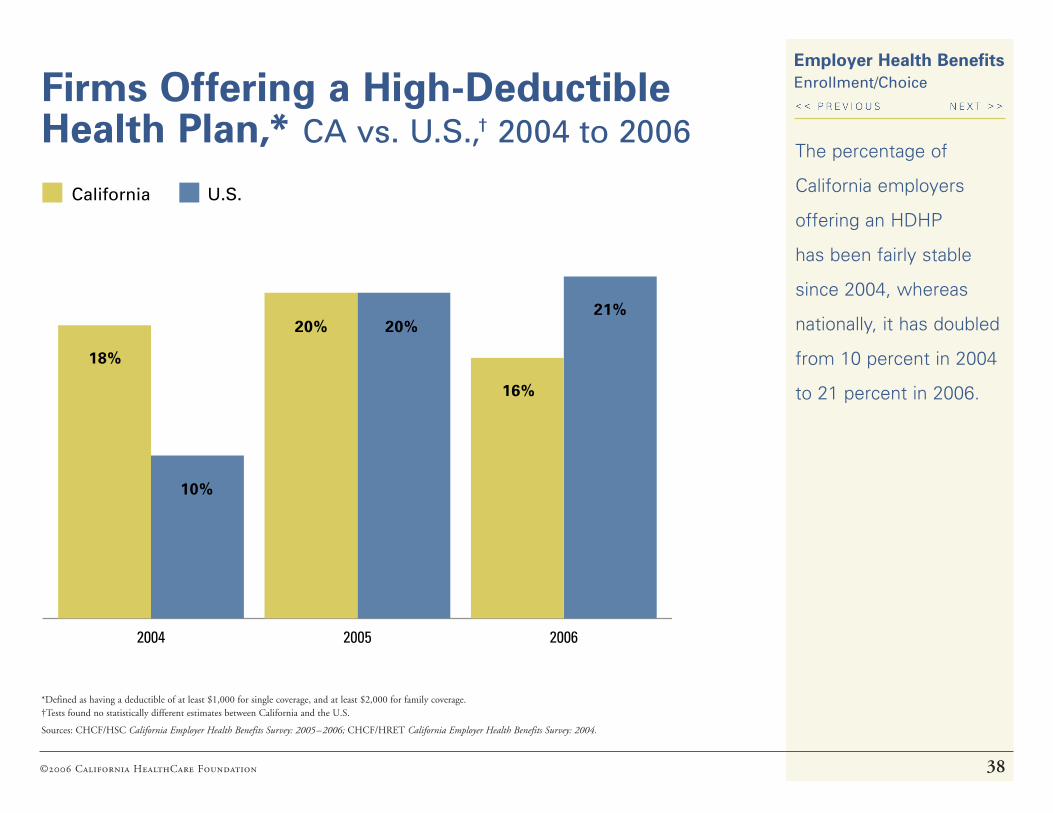
Employer Health Benefits Enrollment/ChoiceFirms Offering a High-Deductible
Health Plan,* CA vs. U.S.,† 2004 to 2006
*Defined as having a deductible of at least $1,000 for single coverage, and at least $2,000 for family coverage. †Tests found no statistically different estimates between California and the U.S.
Sources: CHCF/HSC California Employer Health Benefits Survey: 2005–2006; CHCF/HRET California Employer Health Benefits Survey: 2004.
The percentage of
California employers
offering an HDHP
has been fairly stable
since 2004, whereas
nationally, it has doubled
from 10 percent in 2004
to 21 percent in 2006.
200620052004
20% 20%21%
16%
18%
10%
California U.S.
©2006 California HealthCare Foundation 39
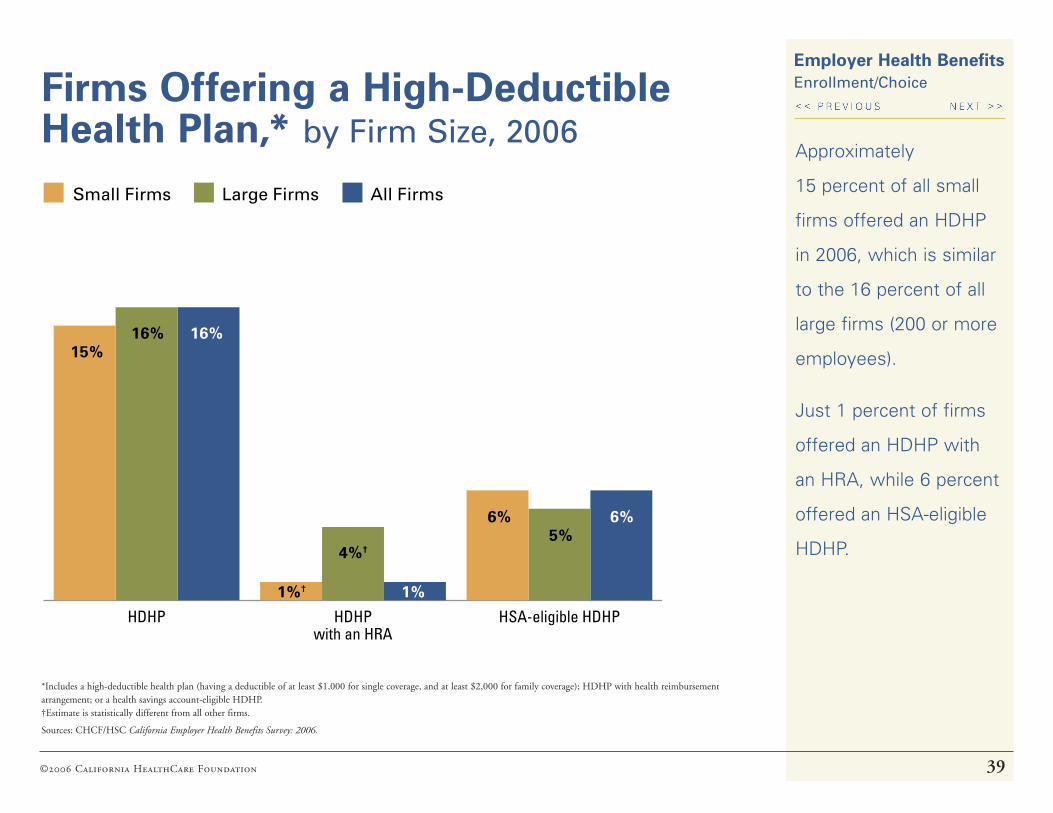
Employer Health Benefits Enrollment/ChoiceFirms Offering a High-Deductible
Health Plan,* by Firm Size, 2006Approximately
15 percent of all small
firms offered an HDHP
in 2006, which is similar
to the 16 percent of all
large firms (200 or more
employees).
Just 1 percent of firms
offered an HDHP with
an HRA, while 6 percent
offered an HSA-eligible
HDHP.
*Includes a high-deductible health plan (having a deductible of at least $1,000 for single coverage, and at least $2,000 for family coverage); HDHP with health reimbursement arrangement; or a health savings account-eligible HDHP. †Estimate is statistically different from all other firms.
Sources: CHCF/HSC California Employer Health Benefits Survey: 2006.
HSA-eligible HDHPHDHPwith an HRA
HDHP
Small Firms Large Firms All Firms
1%† 1%
6% 6%
15%16%16%
4%†5%
©2006 California HealthCare Foundation 40
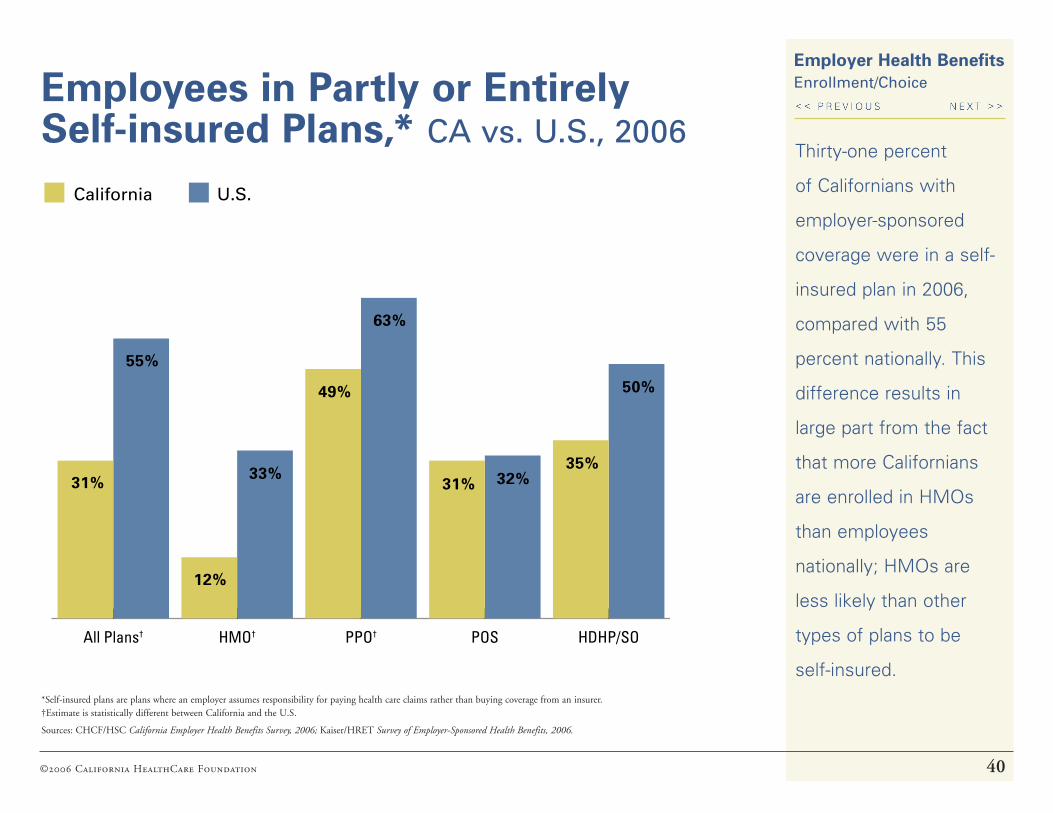
Employer Health Benefits Enrollment/ChoiceEmployees in Partly or Entirely
Self-insured Plans,* CA vs. U.S., 2006Thirty-one percent
of Californians with
employer-sponsored
coverage were in a self-
insured plan in 2006,
compared with 55
percent nationally. This
difference results in
large part from the fact
that more Californians
are enrolled in HMOs
than employees
nationally; HMOs are
less likely than other
types of plans to be
self-insured.*Self-insured plans are plans where an employer assumes responsibility for paying health care claims rather than buying coverage from an insurer. †Estimate is statistically different between California and the U.S.
Sources: CHCF/HSC California Employer Health Benefits Survey, 2006; Kaiser/HRET Survey of Employer-Sponsored Health Benefits, 2006.
HDHP/SOPOSPPO†HMO†All Plans†
12%
33%31% 32%
35%
50%49%
63%
31%
55%
California U.S.
©2006 California HealthCare Foundation 41
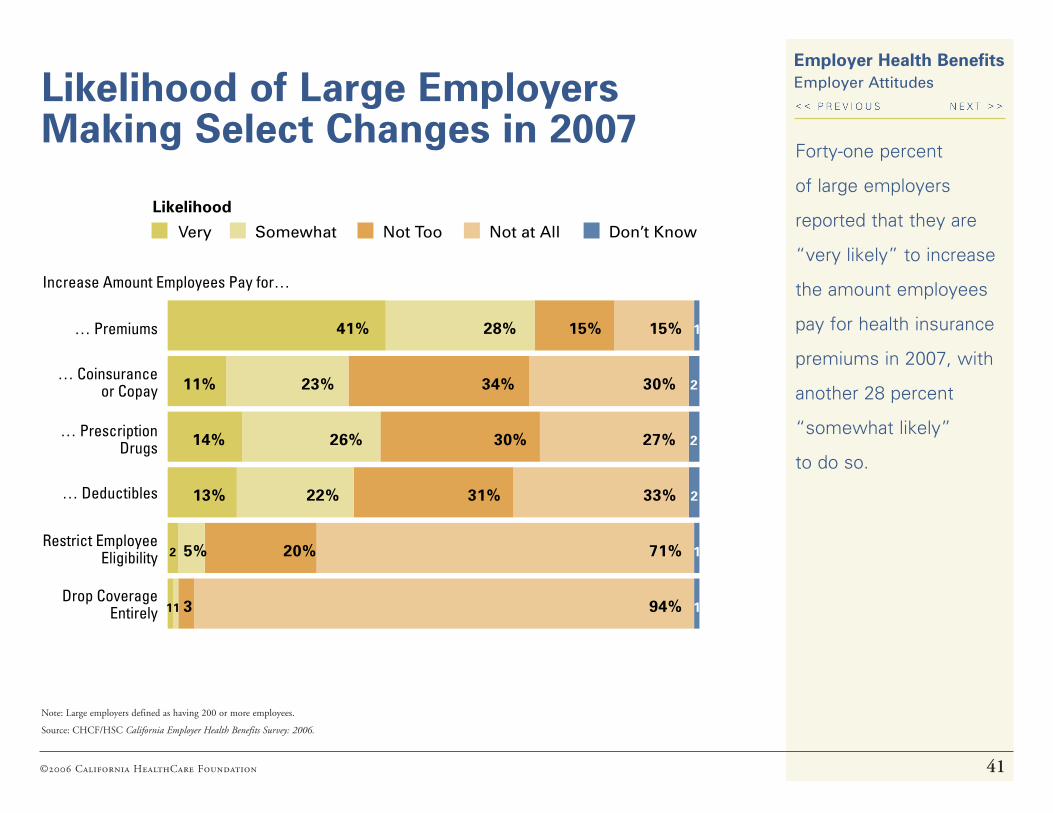
Employer Health Benefits Employer Attitudes
Forty-one percent
of large employers
reported that they are
“very likely” to increase
the amount employees
pay for health insurance
premiums in 2007, with
another 28 percent
“somewhat likely”
to do so.
Likelihood of Large Employers Making Select Changes in 2007
Note: Large employers defined as having 200 or more employees.
Source: CHCF/HSC California Employer Health Benefits Survey: 2006.
Drop Coverage Entirely
Restrict Employee Eligibility
… Deductibles
… Prescription Drugs
… Coinsurance or Copay
… Premiums 41% 28% 15% 15% 1
11% 23% 34% 30% 2
14% 26% 30% 27% 2
13% 22% 31% 33% 2
2 5% 20% 71% 1
11 3 94% 1
Very Somewhat Not Too Not at All Don’t Know
Increase Amount Employees Pay for…
Likelihood
©2006 California HealthCare Foundation 42
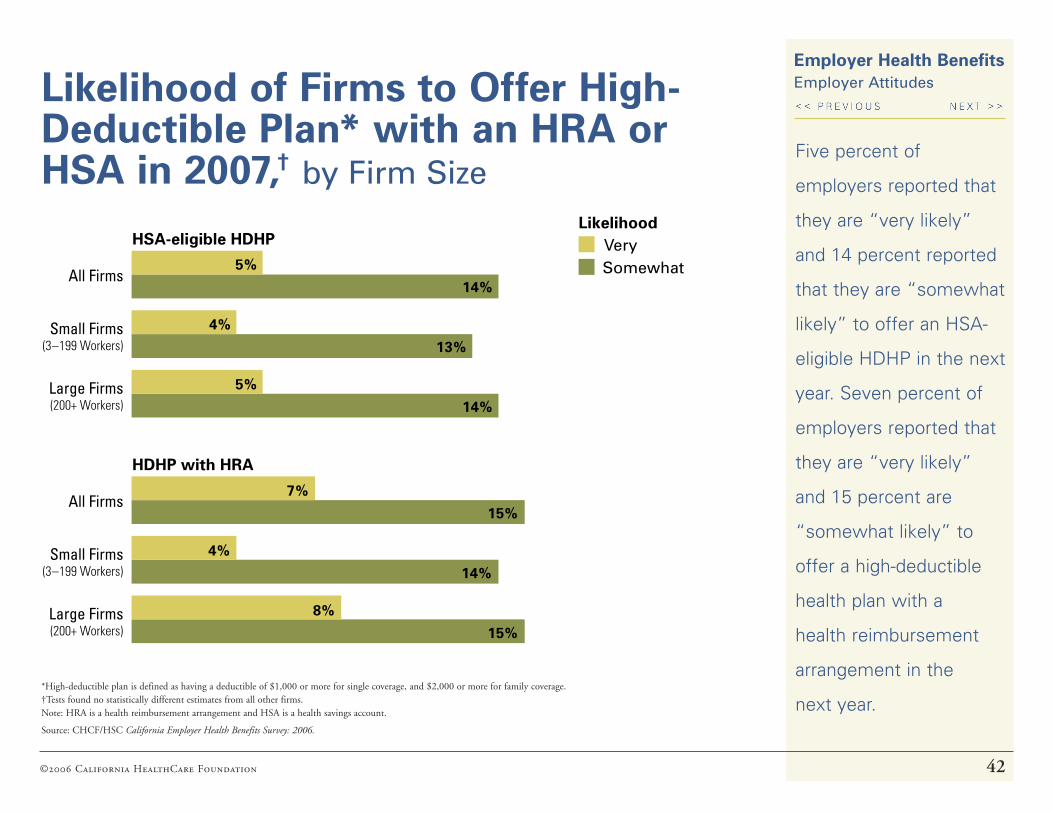
Employer Health Benefits Employer AttitudesLikelihood of Firms to Offer High-
Deductible Plan* with an HRA or HSA in 2007,† by Firm Size
*High-deductible plan is defined as having a deductible of $1,000 or more for single coverage, and $2,000 or more for family coverage. †Tests found no statistically different estimates from all other firms. Note: HRA is a health reimbursement arrangement and HSA is a health savings account.
Source: CHCF/HSC California Employer Health Benefits Survey: 2006.
Five percent of
employers reported that
they are “very likely”
and 14 percent reported
that they are “somewhat
likely” to offer an HSA-
eligible HDHP in the next
year. Seven percent of
employers reported that
they are “very likely”
and 15 percent are
“somewhat likely” to
offer a high-deductible
health plan with a
health reimbursement
arrangement in the
next year.
Large Firms(200+ Workers)
Small Firms(3–199 Workers)
All Firms
Large Firms(200+ Workers)
Small Firms(3–199 Workers)
All Firms
HSA-eligible HDHP VerySomewhat5%
14%
4%
13%
5%
14%
7%
15%
4%
14%
8%
15%
HDHP with HRA
Likelihood
©2006 California HealthCare Foundation 43
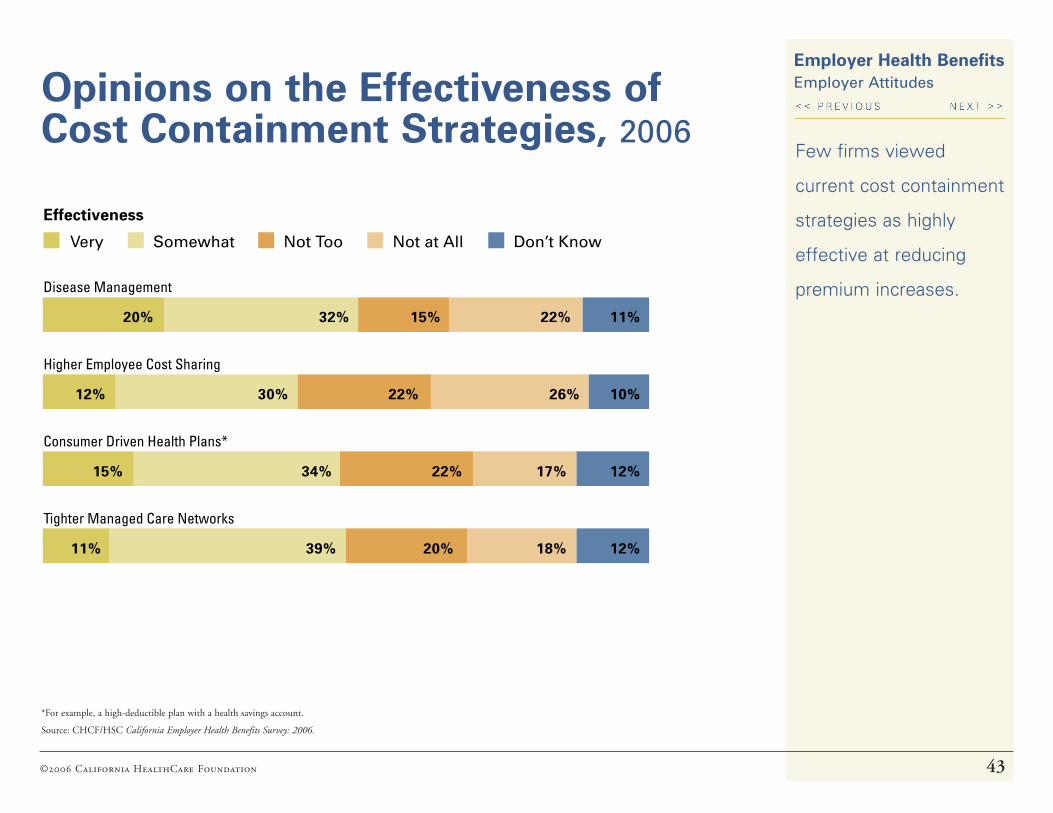
Employer Health Benefits Employer AttitudesOpinions on the Effectiveness of
Cost Containment Strategies, 2006Few firms viewed
current cost containment
strategies as highly
effective at reducing
premium increases.
*For example, a high-deductible plan with a health savings account.
Source: CHCF/HSC California Employer Health Benefits Survey: 2006.
20% 32% 15% 22% 11%
12% 30% 22% 26% 10%
15% 34% 22% 17% 12%
11% 39% 20% 18% 12%
Very Somewhat Not Too Not at All Don’t Know
Effectiveness
Disease Management
Higher Employee Cost Sharing
Consumer Driven Health Plans*
Tighter Managed Care Networks
©2006 California HealthCare Foundation 44
Employer Health Benefits
FOR MORE INFORMATION
California HealthCare Foundation
476 9th Street
Oakland, CA 94607
510.238.1040
www.chcf.org
Click to complete our survey at www.chcf.org/feedback and enter Report Code #1127. Thank you.
GIVE US YOUR FEEDBACK
Was the information provided in this report of value? Are there additional kinds of information or data you would like to see included in future reports of this type? Is there other research in this subject area you would like to see? We would like to know.
Center for Studying Health System Change
600 Maryland Ave. SW, Suite 550
Washington DC 20024
202.484.5261
www.hschange.org
AppendixMethodologyThe California Employer Health Benefits Survey is a joint product of the California HealthCare Foundation (CHCF) and The Center for Studying Health System Change (HSC). The survey was designed and analyzed by researchers at HSC, and administered by National Research LLC (NR). The findings are based on a random sample of 802 interviews with employee benefit managers in private firms in California. NR conducted interviews from April to July 2006. As with prior years, the sample of firms was drawn from the Dun & Bradstreet list of private employers with three or more workers. The margin of error for responses among all employers is +/– 3.4 percent; for responses among employers with 3 to 199 workers is +/– 4.5 percent; and among employers with 200 or more workers is +/– 5.5 percent. Some exhibits do not sum to 100 percent due to rounding effects.
This survey instrument is based on a national employer survey conducted annually by the Kaiser Family Foundation and HRET. The U.S. results in this study are drawn from that survey and are available on Kaiser’s Web site at www.kff.org. Prior to 1999, the national survey was conducted by KPMG Peat Marwick LLP. This survey asked questions about the following types of health plans: health maintenance organizations (HMO), preferred
provider organizations (PPO), point-of-service (POS) plans, and high-deductible health plans with a savings option (HDHP/SO). Conventional (fee-for-service) plans are generally excluded from the plan type analyses because they comprise such a small share of the California market.
Many variables with missing information were identified as needing complete information within the database. To control for item non-response bias, missing values within these variables were imputed using either a distributional approach (continuous variables) or a hot-deck approach (categorical variables). Calculation of the weights follows a common approach. First, the basic weight is determined, followed by a survey non-response adjustment. Next, the weights are trimmed in order to reduce the influence of weight outliers. Finally, a post-stratification adjustment is applied.
All statistical tests in this chart pack compare either changes over time, a plan specific estimate with an overall estimate, subcategories versus all other firms (e.g., firms with 3 to 9 workers vs all other firms), or California with the United States. Tests include t-tests and chi-square tests and significance was determined at p < 0.05 level. Due to the complex nature of the design, standard errors are calculated in SUDAAN.
AN IMPORTANT NOTE ABOUT THE METHODOLOGY: Rates of change for worker or employer contributions to premiums and other variables should not be calculated by comparing dollar values in this report to data reported in past CHCF or KFF publications, due to both the survey’s sampling design and the way in which plan information is collected. Rates of change in premiums are collected directly as a question in the survey. Because the survey does not collect information on the rate of change in other variables, this information is not reported and should not be calculated by comparing results to data from previous surveys.
In prior years, the sample of employers was post stratified using frequency distributions from Dun & Bradstreet. Concerns about the volatility of counts in recent years led Kaiser/HRET to use the Statistics of U.S. Businesses conducted by the U.S. Census as the basis for the post-stratification adjustment in 2003. Due to this change, Kaiser/HRET recalculated the weights for survey years 1999-2002 and modified estimates published in the survey where appropriate. The majority of these new estimates are not statistically different from the old estimates. However, please note that the survey data published in this chart pack may vary slightly from reports published in 2003 and earlier.