Embed Size (px)
Citation preview
California Energy Commission
New Motor Vehicle Board9th Industry RoundtableSacramento, California
March 21, 2012
Tim OlsonSenior Transportation AdvisorCalifornia Energy Commission
[email protected] / 916-654-4528
California Energy Commission
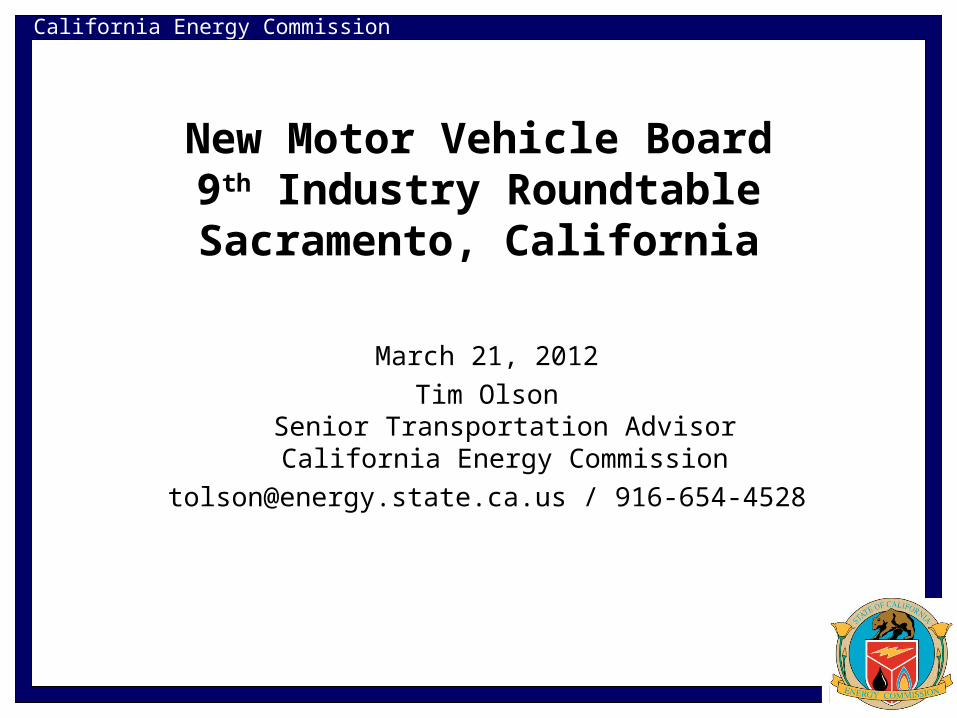
California Crude Oil Imports
0
50
100
150
200
250
300
350
400
450
500
550
600
650
700
750
1982 1984 1986 1988 1990 1992 1994 1996 1998 2000 2002 2004 2006 2008
Mil
lio
ns
of
Bar
rels
Per
Yea
r
Foreign Alaska California
California Energy Commission
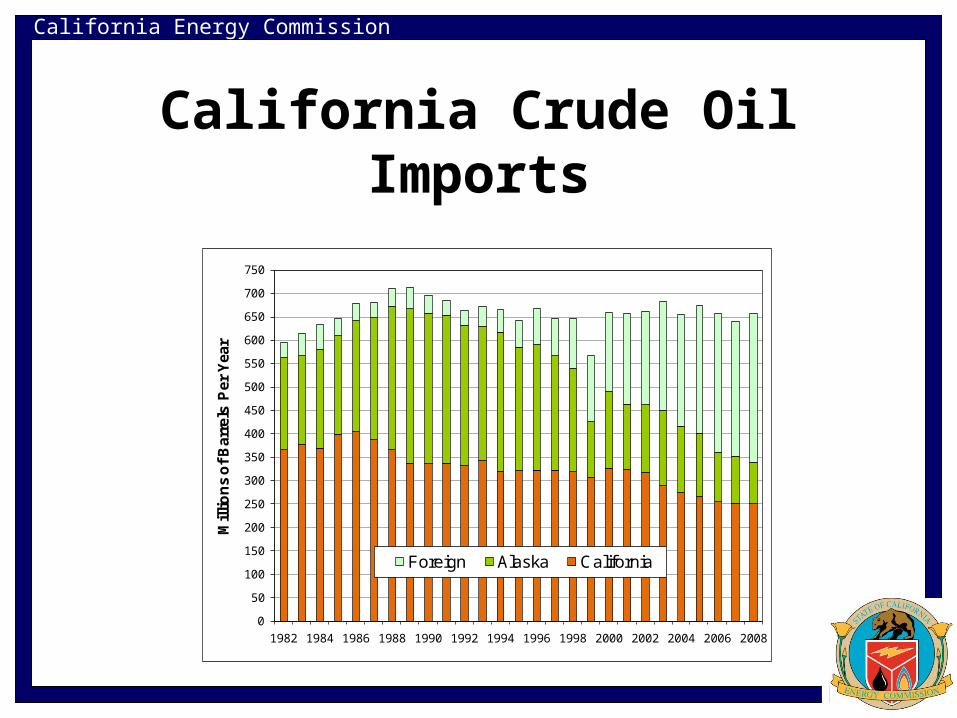
California Fuel Demand
California Energy Commission
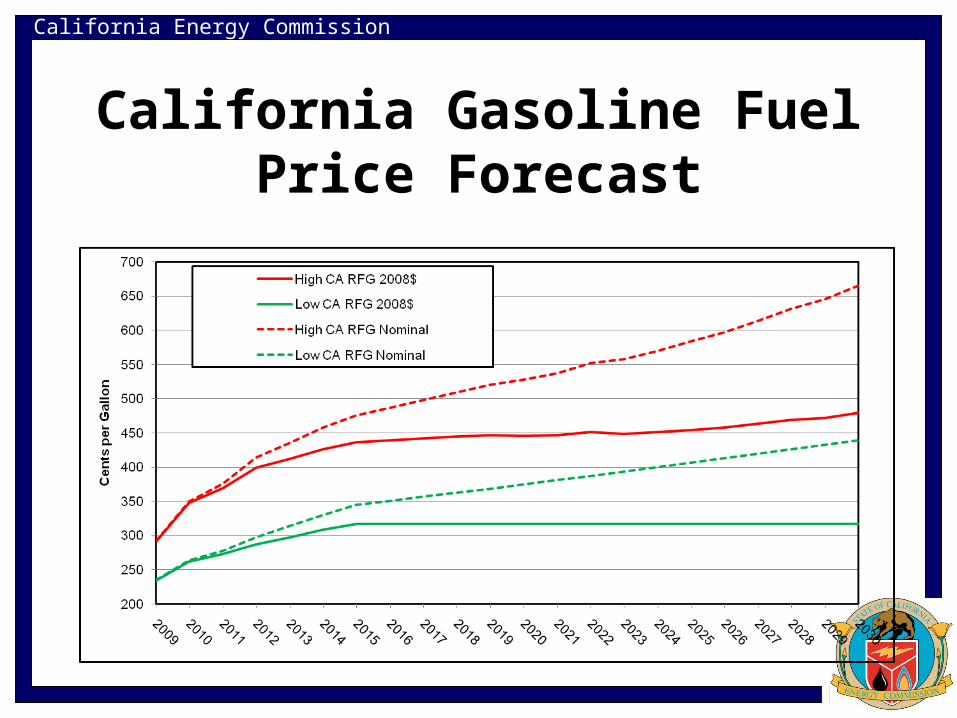
California Gasoline Fuel Price Forecast
California Energy Commission
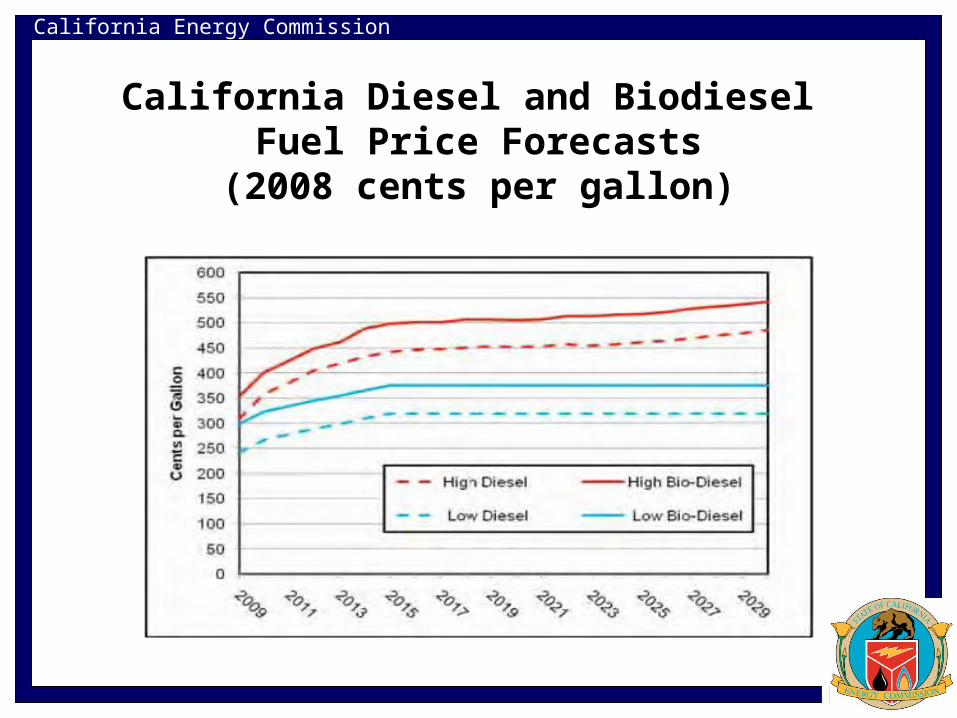
California Diesel and Biodiesel Fuel Price Forecasts
(2008 cents per gallon)
California Energy Commission
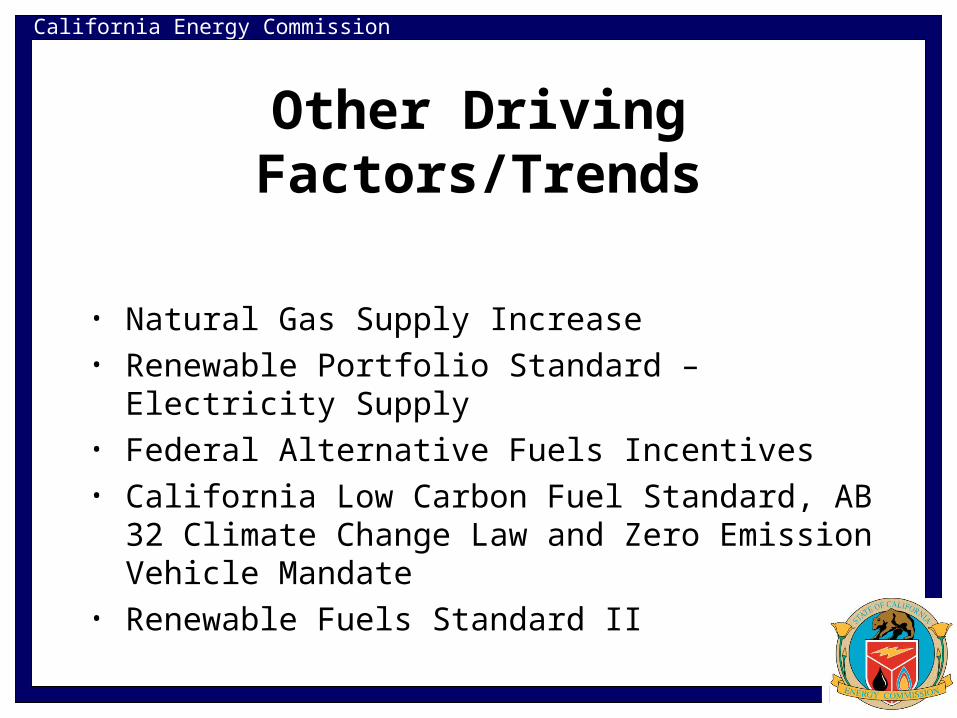
Other Driving Factors/Trends
• Natural Gas Supply Increase• Renewable Portfolio Standard – Electricity Supply• Federal Alternative Fuels Incentives• California Low Carbon Fuel Standard, AB 32 Climate
Change Law and Zero Emission Vehicle Mandate• Renewable Fuels Standard II
California Energy Commission
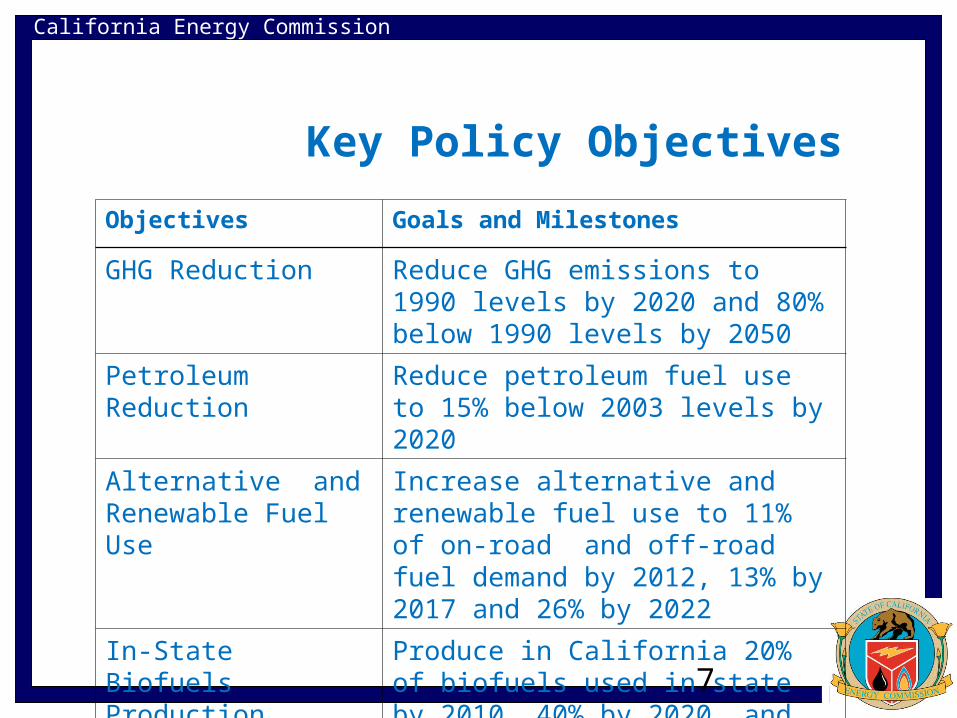
Key Policy Objectives
Objectives Goals and Milestones
GHG Reduction Reduce GHG emissions to 1990 levels by 2020 and 80% below 1990 levels by 2050
Petroleum Reduction Reduce petroleum fuel use to 15% below 2003 levels by 2020
Alternative and Renewable Fuel Use
Increase alternative and renewable fuel use to 11% of on-road and off-road fuel demand by 2012, 13% by 2017 and 26% by 2022
In-State Biofuels Production
Produce in California 20% of biofuels used in state by 2010, 40% by 2020, and 75% by 2050
7
California Energy Commission
California Energy Commission
9
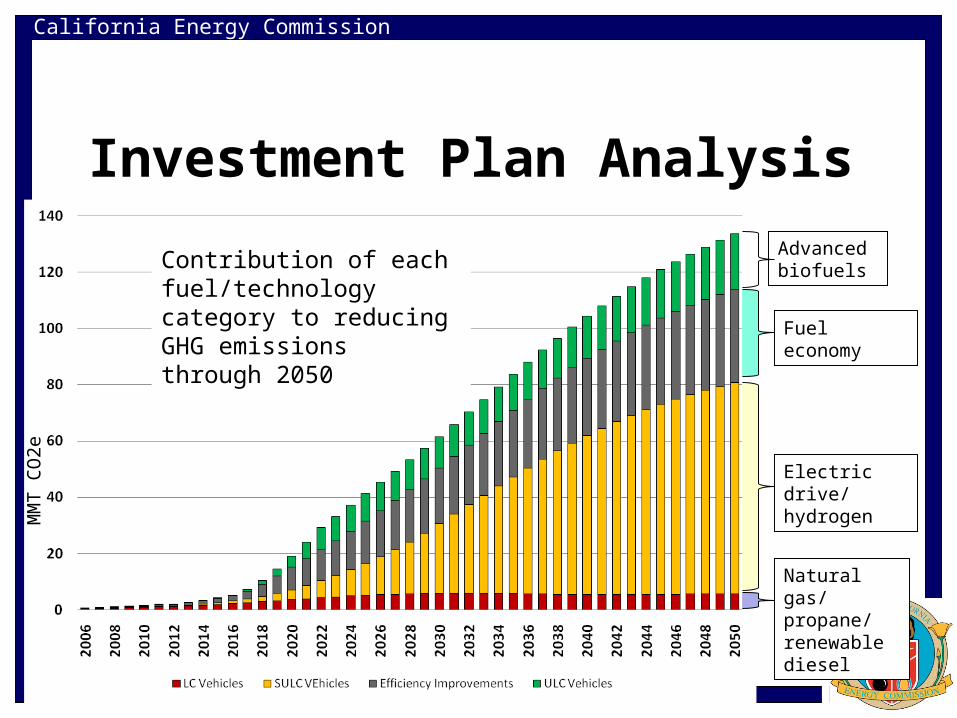
California Energy Commission
Investment Plan Analysis
10
Electric drive/ hydrogen
Advanced biofuels
Natural gas/ propane/renewablediesel
Fuel economy
Contribution of each fuel/technology category to reducing GHG emissions through 2050
MM
T C
O2e
California Energy Commission
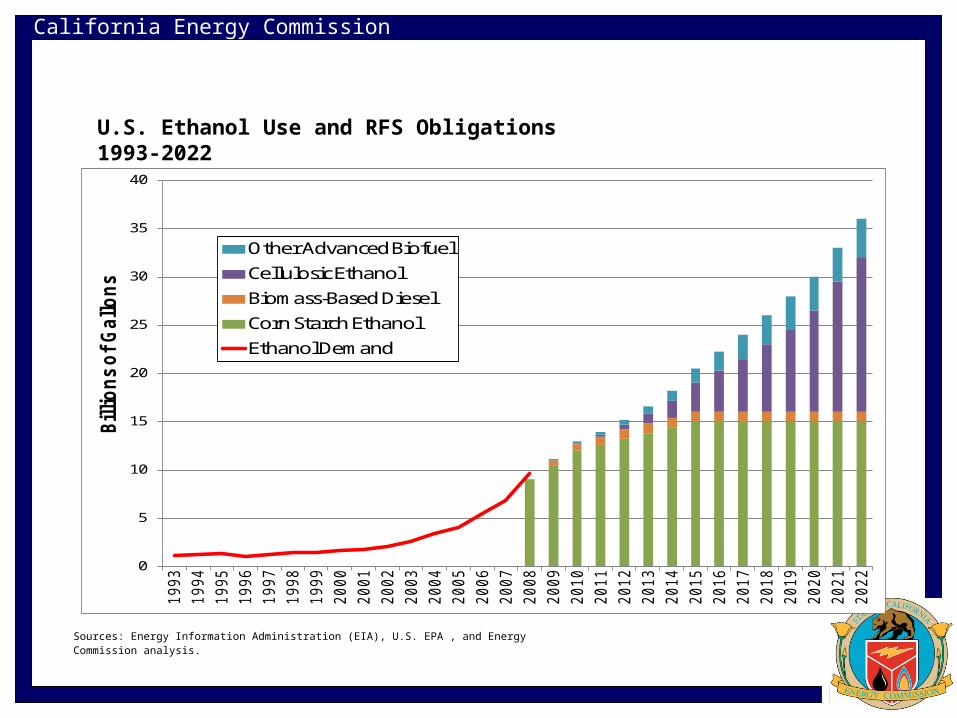
0
5
10
15
20
25
30
35
401
99
3
19
94
19
95
19
96
19
97
19
98
19
99
20
00
20
01
20
02
20
03
20
04
20
05
20
06
20
07
20
08
20
09
20
10
20
11
20
12
20
13
20
14
20
15
20
16
20
17
20
18
20
19
20
20
20
21
20
22
Bil
lio
ns
of
Ga
llo
ns
Other Advanced Biofuel
Cellulosic Ethanol
Biomass-Based Diesel
Corn Starch Ethanol
Ethanol Demand
Sources: Energy Information Administration (EIA), U.S. EPA , and Energy Commission analysis.
U.S. Ethanol Use and RFS Obligations 1993-2022
California Energy Commission
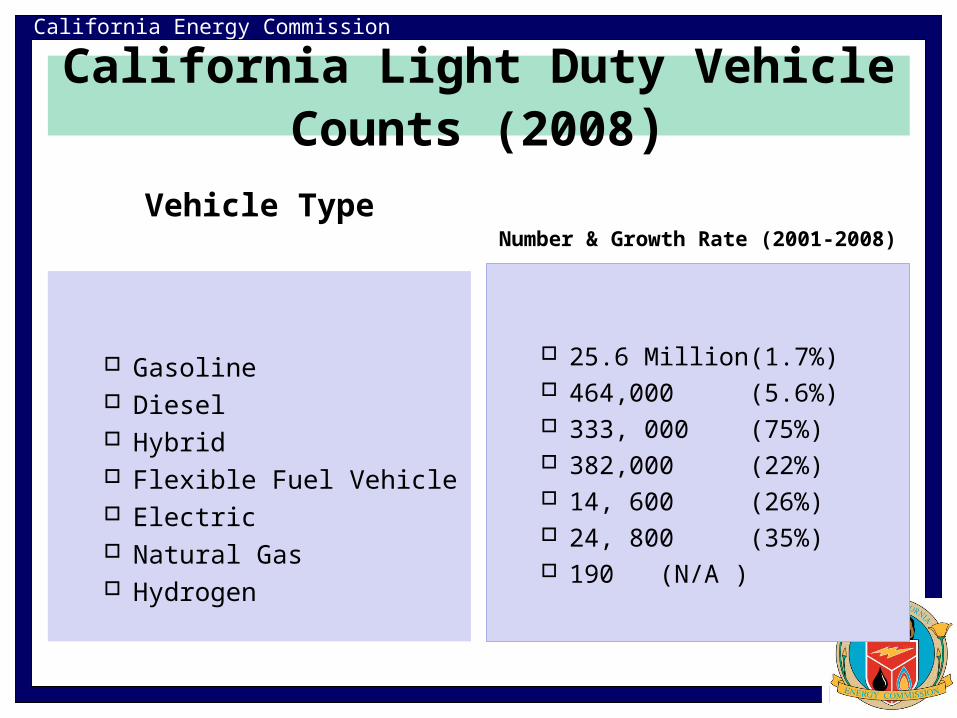
California Light Duty Vehicle Counts (2008)
Vehicle Type
Gasoline Diesel Hybrid Flexible Fuel Vehicle Electric Natural Gas Hydrogen
Number & Growth Rate (2001-2008)
25.6 Million (1.7%) 464,000
(5.6%) 333, 000 (75%) 382,000 (22%) 14, 600 (26%) 24, 800 (35%) 190 (N/A )
California Energy Commission
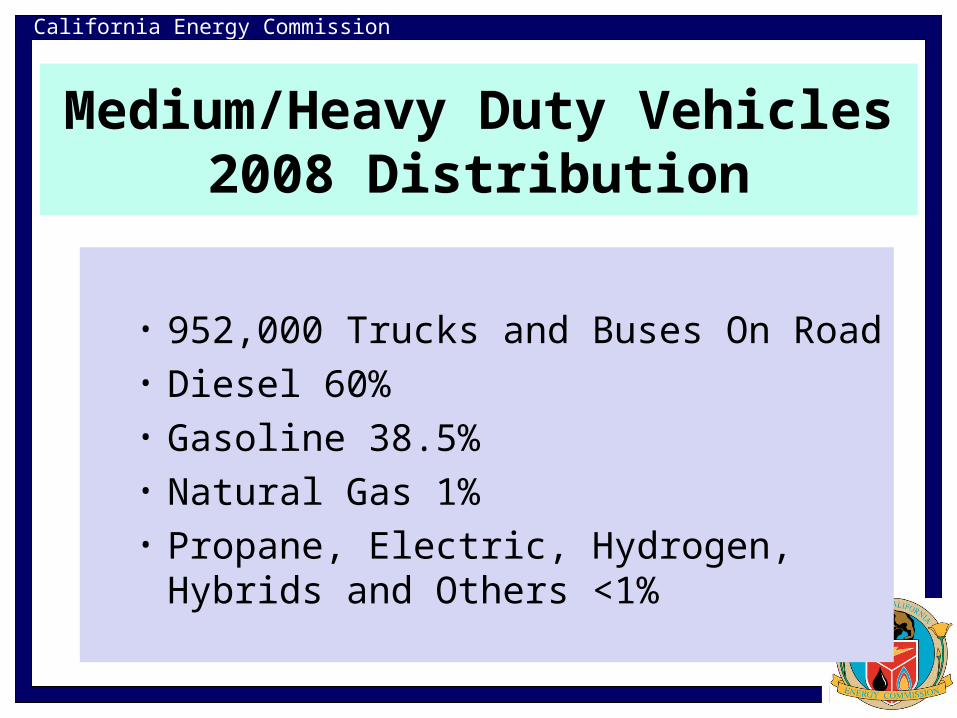
Medium/Heavy Duty Vehicles2008 Distribution
• 952,000 Trucks and Buses On Road• Diesel 60%• Gasoline 38.5%• Natural Gas 1%• Propane, Electric, Hydrogen, Hybrids and
Others <1%
California Energy Commission
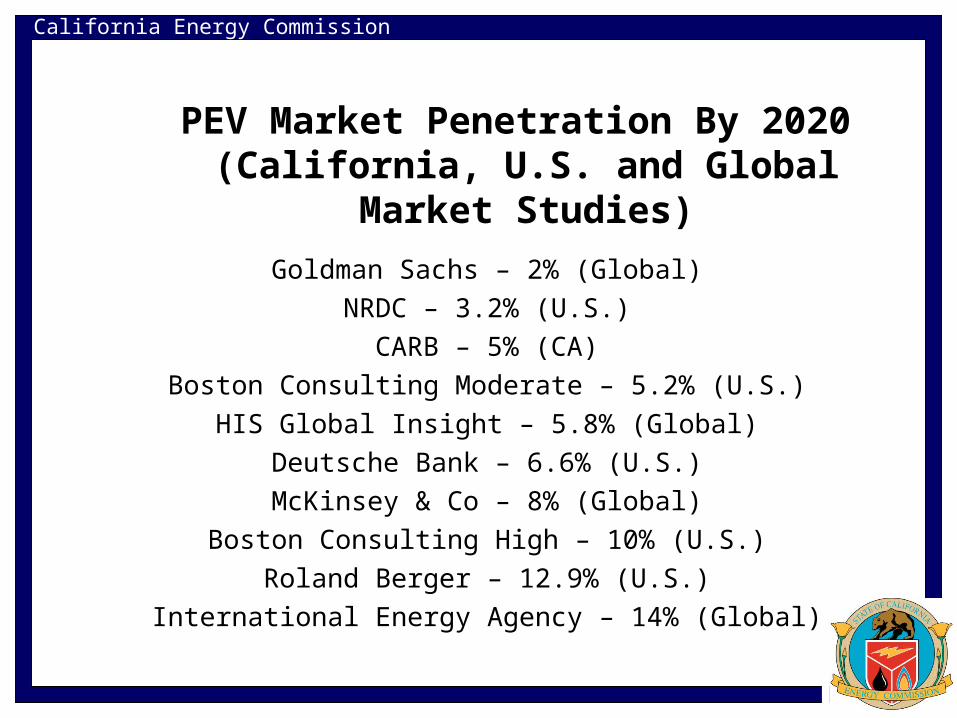
PEV Market Penetration By 2020 (California, U.S. and Global Market Studies)
Goldman Sachs – 2% (Global)
NRDC – 3.2% (U.S.)
CARB – 5% (CA)
Boston Consulting Moderate – 5.2% (U.S.)
HIS Global Insight – 5.8% (Global)
Deutsche Bank – 6.6% (U.S.)
McKinsey & Co – 8% (Global)
Boston Consulting High – 10% (U.S.)
Roland Berger – 12.9% (U.S.)
International Energy Agency – 14% (Global)
California Energy Commission
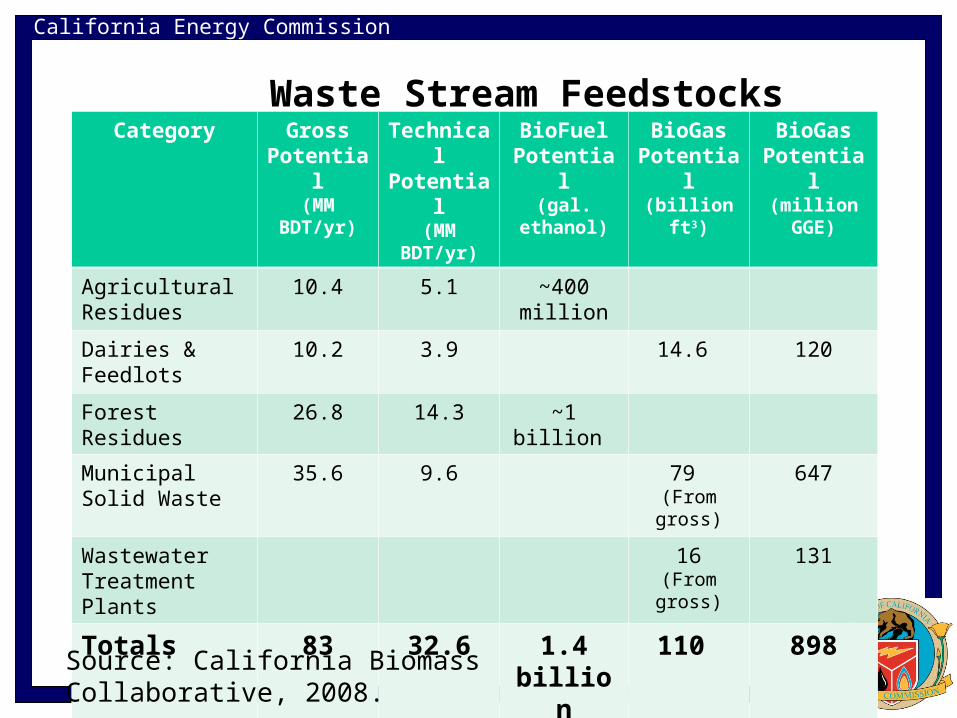
Waste Stream FeedstocksCategory Gross
Potential(MM
BDT/yr)
Technical Potential
(MM BDT/yr)
BioFuel Potential
(gal. ethanol)
BioGas Potential(billion ft3)
BioGas Potential
(million GGE)
Agricultural Residues
10.4 5.1 ~400 million
Dairies & Feedlots
10.2 3.9 14.6 120
Forest Residues 26.8 14.3 ~1 billion
Municipal Solid Waste
35.6 9.6 79 (From gross)
647
Wastewater Treatment Plants
16(From gross)
131
Totals 83 32.6 1.4 billion
110 898
Source: California Biomass Collaborative, 2008.
California Energy Commission
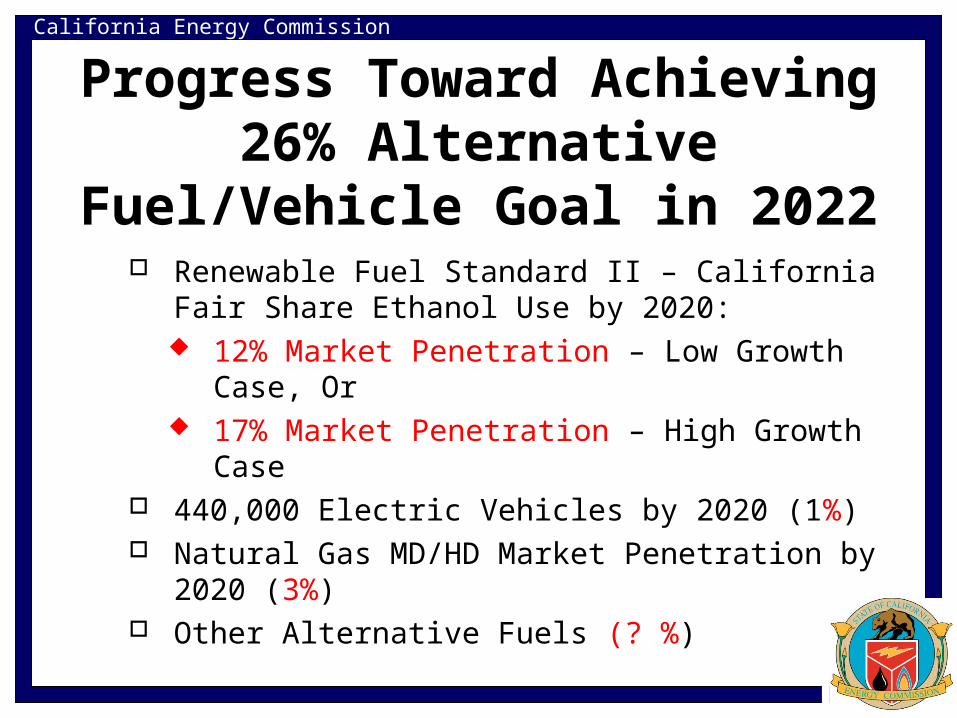
Progress Toward Achieving 26% Alternative Fuel/Vehicle Goal in 2022
Renewable Fuel Standard II – California Fair Share Ethanol Use by 2020: 12% Market Penetration – Low Growth Case,
Or 17% Market Penetration – High Growth Case
440,000 Electric Vehicles by 2020 (1%) Natural Gas MD/HD Market Penetration by 2020
(3%) Other Alternative Fuels (? %)
California Energy Commission
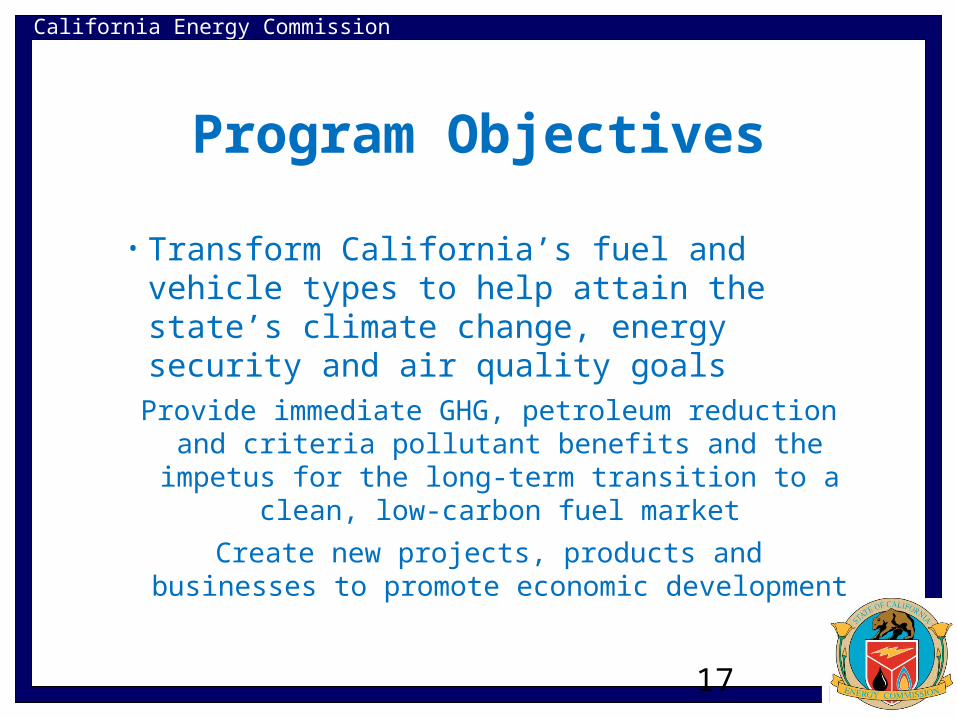
Program Objectives
• Transform California’s fuel and vehicle types to help attain the state’s climate change, energy security and air quality goalsProvide immediate GHG, petroleum reduction and
criteria pollutant benefits and the impetus for the long-term transition to a clean, low-carbon fuel
market
Create new projects, products and businesses to promote economic development
17
California Energy Commission
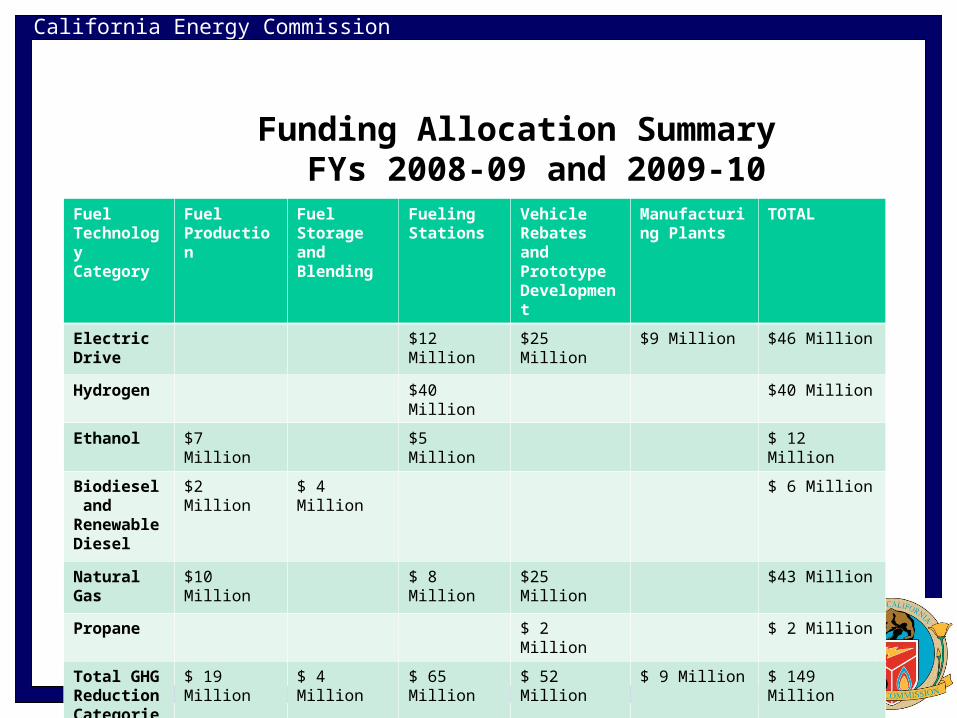
Funding Allocation Summary FYs 2008-09 and 2009-10
Fuel TechnologyCategory
Fuel Production
Fuel Storage and Blending
Fueling Stations
Vehicle Rebates and Prototype Development
Manufacturing Plants
TOTAL
Electric Drive
$12 Million $25 Million $9 Million $46 Million
Hydrogen $40 Million $40 Million
Ethanol $7 Million $5 Million $ 12 Million
Biodiesel and Renewable Diesel
$2 Million $ 4 Million $ 6 Million
Natural Gas $10 Million $ 8 Million $25 Million $43 Million
Propane $ 2 Million $ 2 Million
Total GHG Reduction Categories
$ 19 Million $ 4 Million $ 65 Million $ 52 Million $ 9 Million $ 149 Million
TOTAL with $27 Million for NON GHG Categories $176 Million
California Energy Commission
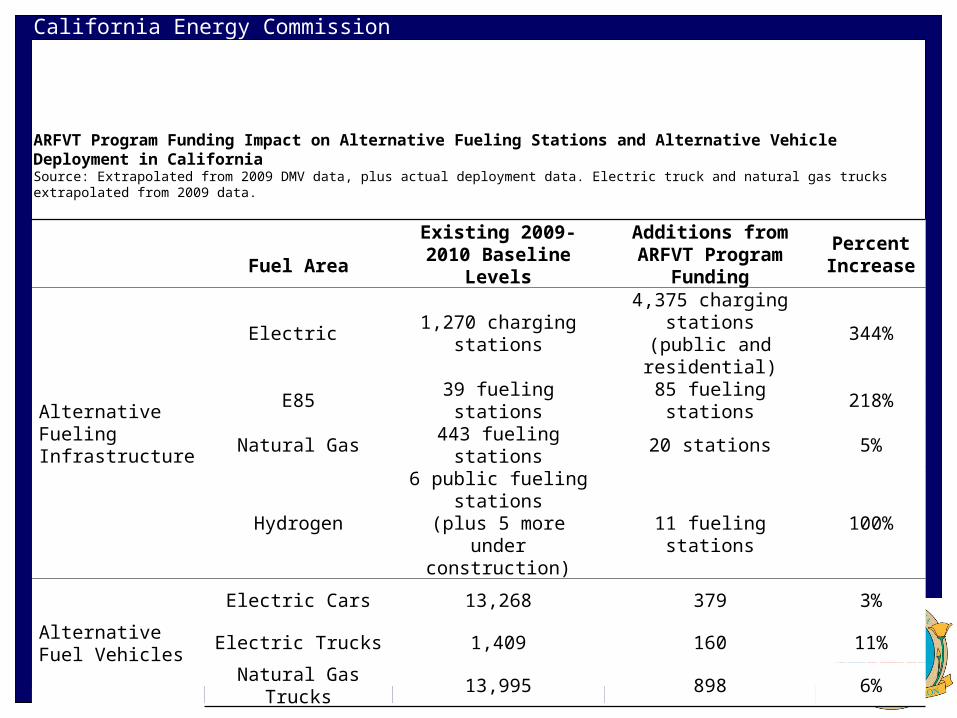
19
Fuel AreaExisting 2009-2010
Baseline Levels
Additions from ARFVT Program
Funding
Percent Increase
Alternative Fueling Infrastructure
Electric 1,270 charging stations4,375 charging stations(public and residential)
344%
E85 39 fueling stations 85 fueling stations 218%
Natural Gas 443 fueling stations 20 stations 5%
Hydrogen6 public fueling stations
(plus 5 more under construction)
11 fueling stations100%
Alternative Fuel Vehicles
Electric Cars 13,268 379 3%
Electric Trucks 1,409 160 11%
Natural Gas Trucks 13,995 898 6%
ARFVT Program Funding Impact on Alternative Fueling Stations and Alternative Vehicle Deployment in California Source: Extrapolated from 2009 DMV data, plus actual deployment data. Electric truck and natural gas trucks extrapolated from 2009 data.

California Energy Commission
20
Low Case High Case
Petroleum Fuel Displaced Per Year by 2020 375 Million Gallons 1.18 Billion Gallons
GHG Emission Reduction Per Year by 20202.5 Million Metric
Tonnes9.3 Million Metric
Tonnes
Criteria Air Pollution Reduction Per Year by 202010,855 Metric
Tonnes24,371 Metric
Tonnes
Non-ARFVT Program Funding Leveraged $375.5 Million
Short-Term and Long-Term Jobs Created by Projects Funded by ARFVT Program
5,394
Summary of Anticipated Benefits for Fuels and Vehicles Supported by the ARFVT Program
California Energy Commission
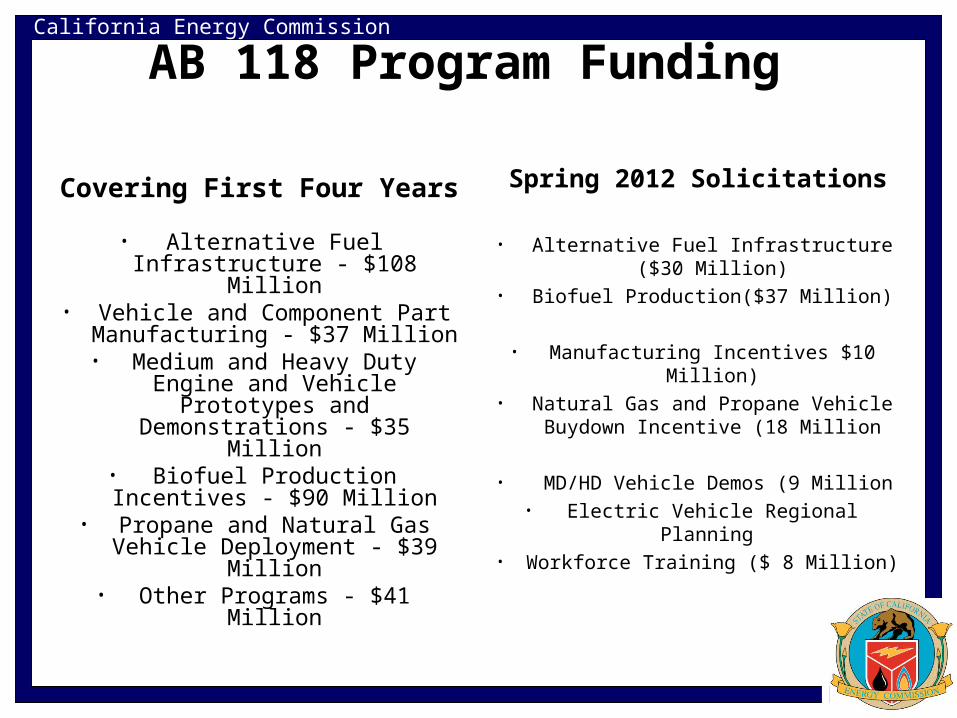
AB 118 Program Funding
Covering First Four Years
• Alternative Fuel Infrastructure - $108 Million
• Vehicle and Component Part Manufacturing - $37 Million
• Medium and Heavy Duty Engine and Vehicle Prototypes
and Demonstrations - $35 Million
• Biofuel Production Incentives - $90 Million
• Propane and Natural Gas Vehicle Deployment - $39
Million• Other Programs - $41 Million
Spring 2012 Solicitations
• Alternative Fuel Infrastructure ($30 Million)
• Biofuel Production($37 Million)
• Manufacturing Incentives $10 Million)
• Natural Gas and Propane Vehicle Buydown Incentive (18 Million
• MD/HD Vehicle Demos (9 Million• Electric Vehicle Regional Planning
• Workforce Training ($ 8 Million)
California Energy Commission
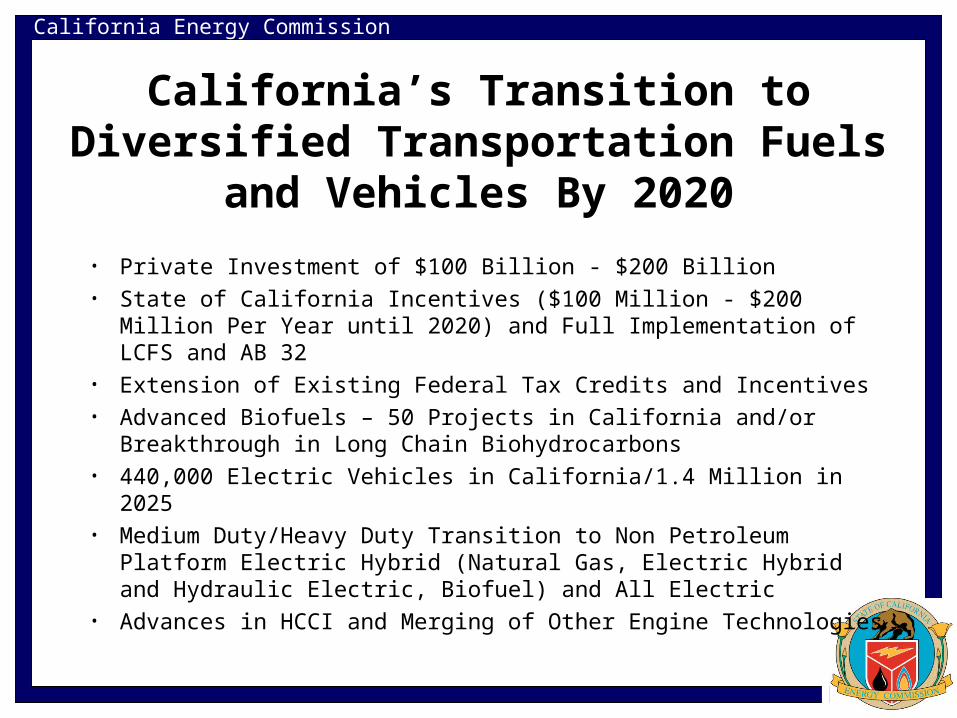
California’s Transition to Diversified Transportation Fuels and Vehicles By 2020
• Private Investment of $100 Billion - $200 Billion• State of California Incentives ($100 Million - $200 Million Per
Year until 2020) and Full Implementation of LCFS and AB 32• Extension of Existing Federal Tax Credits and Incentives• Advanced Biofuels – 50 Projects in California and/or
Breakthrough in Long Chain Biohydrocarbons• 440,000 Electric Vehicles in California/1.4 Million in 2025 • Medium Duty/Heavy Duty Transition to Non Petroleum Platform
Electric Hybrid (Natural Gas, Electric Hybrid and Hydraulic Electric, Biofuel) and All Electric
• Advances in HCCI and Merging of Other Engine Technologies
California Energy Commission
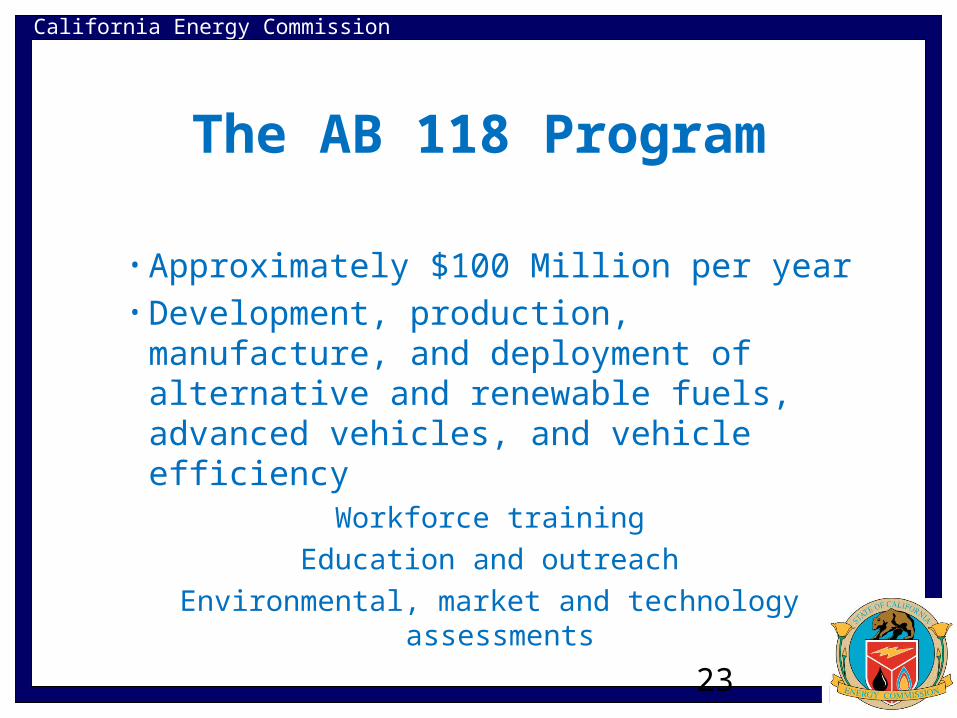
The AB 118 Program
• Approximately $100 Million per year• Development, production, manufacture,
and deployment of alternative and renewable fuels, advanced vehicles, and vehicle efficiency
Workforce training
Education and outreach
Environmental, market and technology assessments
23