Embed Size (px)
Citation preview
Maternity Care in California: Delivering the DataJUNE 2016
©2016 CALIFORNIA HEALTH CARE FOUNDATION 2
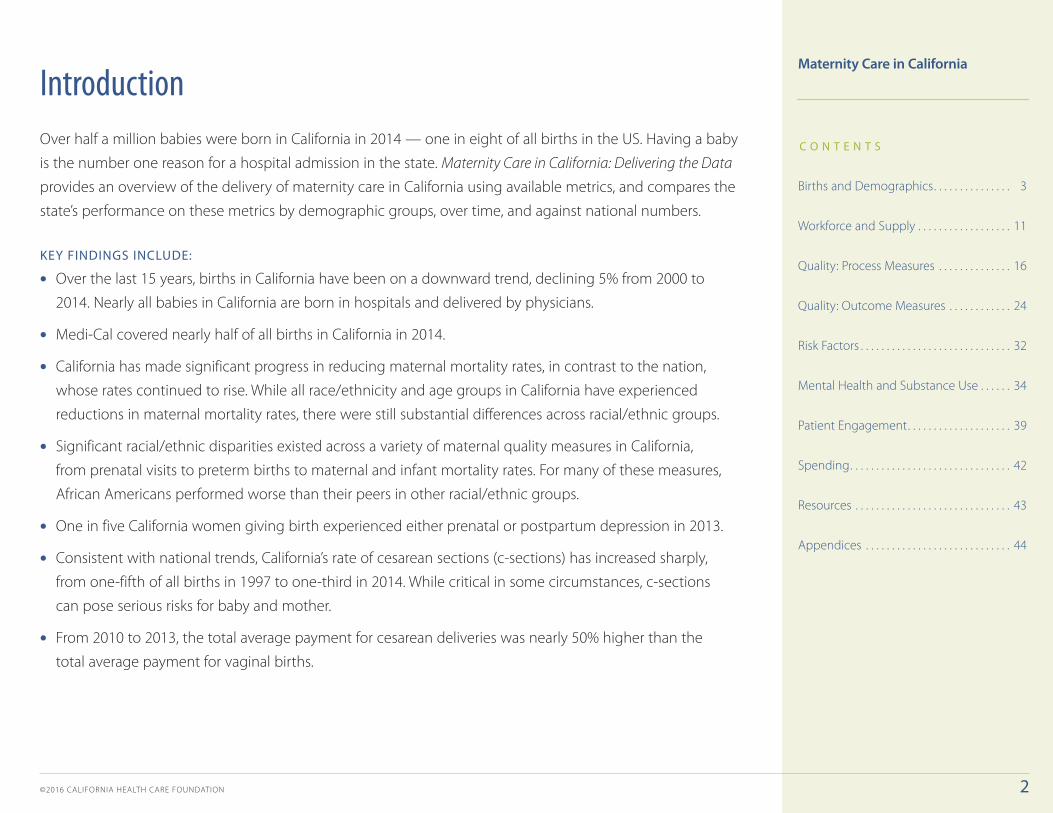
Over half a million babies were born in California in 2014 — one in eight of all births in the US. Having a baby
is the number one reason for a hospital admission in the state. Maternity Care in California: Delivering the Data
provides an overview of the delivery of maternity care in California using available metrics, and compares the
state’s performance on these metrics by demographic groups, over time, and against national numbers.
KEY FINDINGS INCLUDE:
• Over the last 15 years, births in California have been on a downward trend, declining 5% from 2000 to
2014. Nearly all babies in California are born in hospitals and delivered by physicians.
• Medi-Cal covered nearly half of all births in California in 2014.
• California has made significant progress in reducing maternal mortality rates, in contrast to the nation,
whose rates continued to rise. While all race/ethnicity and age groups in California have experienced
reductions in maternal mortality rates, there were still substantial differences across racial/ethnic groups.
• Significant racial/ethnic disparities existed across a variety of maternal quality measures in California,
from prenatal visits to preterm births to maternal and infant mortality rates. For many of these measures,
African Americans performed worse than their peers in other racial/ethnic groups.
• One in five California women giving birth experienced either prenatal or postpartum depression in 2013.
• Consistent with national trends, California’s rate of cesarean sections (c-sections) has increased sharply,
from one-fifth of all births in 1997 to one-third in 2014. While critical in some circumstances, c-sections
can pose serious risks for baby and mother.
• From 2010 to 2013, the total average payment for cesarean deliveries was nearly 50% higher than the
total average payment for vaginal births.
Maternity Care in California
C O N T E N T S
Births and Demographics . . . . . . . . . . . . . . . 3
Workforce and Supply . . . . . . . . . . . . . . . . . . 11
Quality: Process Measures . . . . . . . . . . . . . . 16
Quality: Outcome Measures . . . . . . . . . . . . 24
Risk Factors . . . . . . . . . . . . . . . . . . . . . . . . . . . . . 32
Mental Health and Substance Use . . . . . . 34
Patient Engagement . . . . . . . . . . . . . . . . . . . . 39
Spending . . . . . . . . . . . . . . . . . . . . . . . . . . . . . . . 42
Resources . . . . . . . . . . . . . . . . . . . . . . . . . . . . . . 43
Appendices . . . . . . . . . . . . . . . . . . . . . . . . . . . . 44
Introduction

©2016 CALIFORNIA HEALTH CARE FOUNDATION 3
0
100,000
200,000
300,000
400,000
500,000
600,000
201420132012201120102009200820072006200520042003200220012000
502,973531,285
2014 BIRTHS, UNITED STATESTOTAL: 4 million
All Other States87%
CA13%
Maternity Care in California
NUMBER OF BIRTHS
Note: Births by place of residence.
Sources: “CA-Vital Statistics Query,” California Department of Public Health (CDPH), accessed January 6, 2016, informaticsportal.cdph.ca.gov; “Birth Records: Number of Live Births by Mother’s Age and Race/Ethnicity, California, 2010-2014,” CDPH; “VitalStats,” Centers for Disease Control and Prevention, accessed February 29, 2016, www.cdc.gov.
Since 2007, total births in
California have been on a
downward trend, from a high of
566,000 in 2007 to a 15-year low
of 494,000 in 2013. The number
of births in the state increased to
503,000 in 2014, which was the
most births of any state in the US.
That year, nearly one in eight births
in the nation were in California.
Births Trend California, 2000 to 2014
Births and Demographics

©2016 CALIFORNIA HEALTH CARE FOUNDATION 4
In Hospital99%
Out of Hospital1%
OUT-OF-HOSPITAL BIRTHSBY LOCATION TOTAL: 5,056
Other
Clinic /Doctor’s O�ce
Freestanding Birth Center
Home
72%
19%
<1%
9%
Maternity Care in California
N=502,879
Births, by Location California, 2014
In 2014, nearly all births in
California occurred in a hospital.
Of births that did not occur in a
hospital, the vast majority
occurred at home.
Notes: Location of birth was not stated for 29 births. N on this page is slightly different from pages 3 and 5 due to the use of different data sources.
Source: “VitalStats,” Centers for Disease Control and Prevention, accessed December 14, 2015, www.cdc.gov.
Births and Demographics
©2016 CALIFORNIA HEALTH CARE FOUNDATION 5
Native American
Paci�c Islander
Two or More Races
African American
Asian
White
Latina
237,326
138,417
74,880
25,230
11,579
2,017
1,765
MOTHER’S COUNTRY OF ORIGIN
US Born62%
ForeignBorn38%
Maternity Care in California
N=502,973
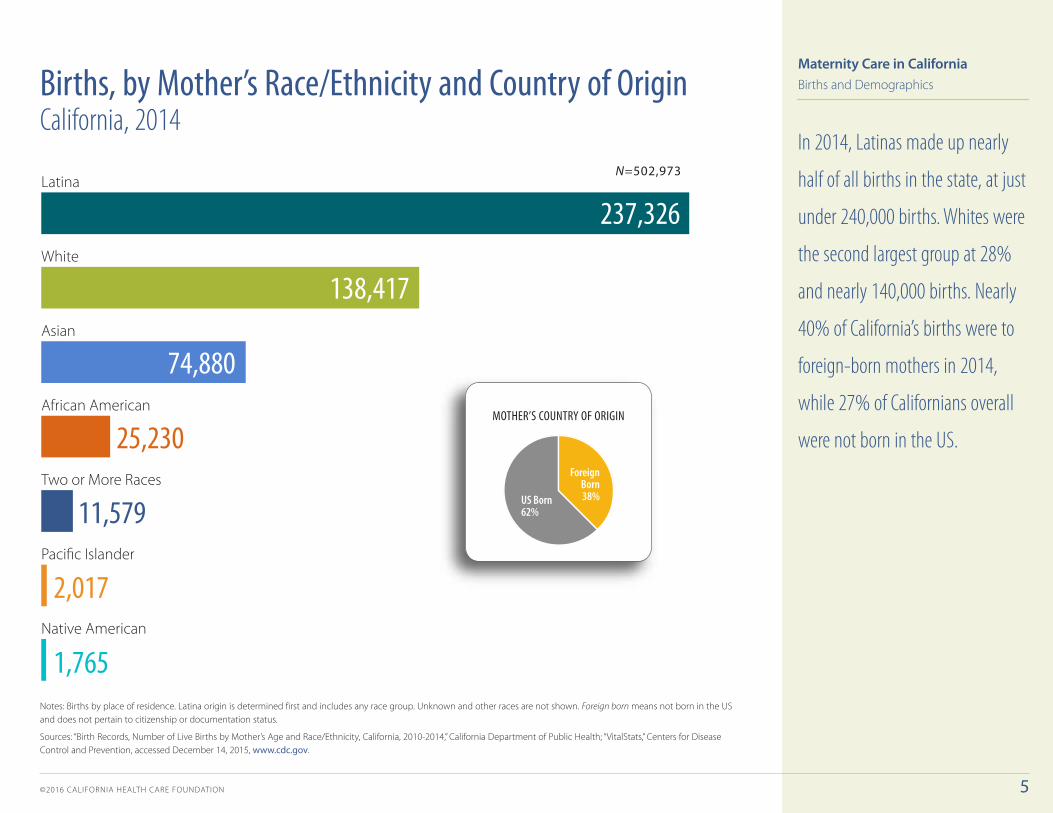
In 2014, Latinas made up nearly
half of all births in the state, at just
under 240,000 births. Whites were
the second largest group at 28%
and nearly 140,000 births. Nearly
40% of California’s births were to
foreign-born mothers in 2014,
while 27% of Californians overall
were not born in the US.
Notes: Births by place of residence. Latina origin is determined first and includes any race group. Unknown and other races are not shown. Foreign born means not born in the US and does not pertain to citizenship or documentation status.
Sources: “Birth Records, Number of Live Births by Mother’s Age and Race/Ethnicity, California, 2010-2014,” California Department of Public Health; “VitalStats,” Centers for Disease Control and Prevention, accessed December 14, 2015, www.cdc.gov.
Births, by Mother’s Race/Ethnicity and Country of Origin California, 2014
Births and Demographics
©2016 CALIFORNIA HEALTH CARE FOUNDATION 6
0.000000
16.666667
33.333333
50.000000
66.666667
83.333333
100.000000
20142000
� 40 and older� 35 to 39� 30 to 34� 25 to 29� 20 to 24� Under 20
3%
13%
24%
26%
23%
11%
4%
16%
29%
26%
19%
5%
Maternity Care in California
Note: Segments may not sum to 100% due to rounding.
Source: “VitalStats,” Centers for Disease Control and Prevention, accessed February 29, 2016, www.cdc.gov.
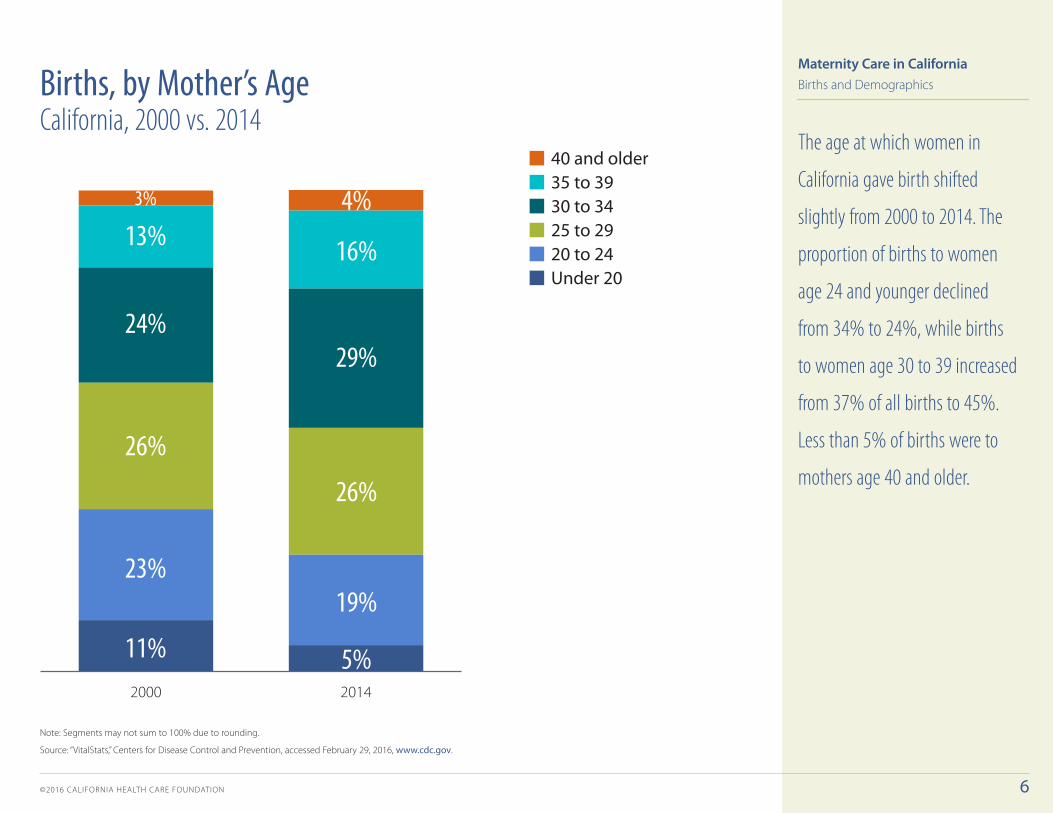
The age at which women in
California gave birth shifted
slightly from 2000 to 2014. The
proportion of births to women
age 24 and younger declined
from 34% to 24%, while births
to women age 30 to 39 increased
from 37% of all births to 45%.
Less than 5% of births were to
mothers age 40 and older.
Births, by Mother’s Age California, 2000 vs. 2014
Births and Demographics

©2016 CALIFORNIA HEALTH CARE FOUNDATION 7
0-100%FPL43%
101-200%FPL19%
>200% FPL38%
0-100%FPL25%
101-200%FPL22%
>200% FPL53%
BirthsFemale Population
Maternity Care in California
While only 25% of the female
population in California were at or
below the federal poverty level,
this group represented 43% of
women giving birth. Thirty-eight
percent of births in California
were to mothers with household
incomes above 200% FPL.
Notes: Female population is mothers age 15 to 45. The federal poverty level (FPL) for a family of four in 2012 was $23,050.
Sources: Maternal and Infant Health Assessment Snapshot, California Department of Public Health, Maternal, Child and Adolescent Health Program, 2015; www.cdph.ca.gov; “AskCHIS,” University of California Los Angeles, ask.chis.ucla.edu.
Female Population and Births, by Household Income California, 2012
Births and Demographics

©2016 CALIFORNIA HEALTH CARE FOUNDATION 8
Private48% Medi-Cal
45%
4%3%
Other
Self-Pay
Maternity Care in California
In 2014, 45% of in-hospital
births were to mothers on
Medi-Cal, compared to 48% to
mothers with private insurance.
These rates have not changed
significantly since 2011
(not shown).
Notes: In-hospital births at 251 hospitals that offer maternity services. In California, 99% of all births occur in a hospital.
Source: Special data request, California Maternal Quality Care Collaborative, 2016.
Births, by Mother’s Insurance California, 2014
Births and Demographics

©2016 CALIFORNIA HEALTH CARE FOUNDATION 9
0.000000
16.666700
33.333401
50.000101
66.666801
83.333502
All PayersNon Medi-CalMedi-Cal
� University of California� Kaiser� District� City/County� Investor� Nonpro�t
– 2%– 3%
– 2%– 3%
– 1%
9%
10%
18%
60%
26%
6%
12%
52%
15%
7%5%
14%
56%
Maternity Care in California
Notes: In-hospital births at 251 hospitals that offer maternity services. Nonprofit hospitals include church-related hospitals. Investor hospitals are for profit. Kaiser Permanente hospitals are also nonprofit. All payers includes uninsured patients. Segments may not sum to 100% due to rounding.
Source: Special data request, California Maternal Quality Care Collaborative, 2016.
The majority of all births in
California, including births to
women covered by Medi-Cal,
occurred in nonprofit hospitals.
Nonprofit, investor, city/county,
and district hospitals had a
greater share of Medi-Cal births
than non-Medi-Cal births. Kaiser,
in contrast, delivered a quarter of
all non-Medi-Cal births, but only
3% of Medi-Cal births.
Births, Medi-Cal vs. Non Medi-Cal, by Hospital Type California, 2014
Births and Demographics

©2016 CALIFORNIA HEALTH CARE FOUNDATION 10
Undocumented29%
Families51%
PregnancyPathway
16%
All Other (1%)
Adoption/Foster Care (<1%)
Blind/Disabled (2%)
Medically Indigent(child and minor consent, 2%)
UNDOCUMENTED BIRTHS, BY REGION
Northern and Sierra
Sacramento Area
San Diego Area
Central Coast
Orange County
Inland Empire
San Joaquin Valley
Greater Bay Area
Los Angeles County35%
14%
13%
10%
10%
9%
5%
3%
1%
Maternity Care in California
In 2011, nearly one-third of
Medi-Cal births were to
undocumented mothers. More
than one-third of all births to
undocumented mothers were
in Los Angeles County.
Notes: In-hospital births only, where 99% of births occur in California. Pregnancy Pathway is restricted scope — that is, limited to pregnancy-related and postpartum services for women who are not undocumented and whose family income is 200% FPL or below. Families refers to Section 1931(b) of the Social Security Act which ensures that families with children, who are in financial need will get access to Medi-Cal. This eligibility category combines the eligibility criteria from several other programs including food stamps, AFDC, and CalWORKs. Percentages may not sum to 100% due to rounding. See Appendix A for a regional county map.
Source: 2011 Medi-Cal Births Statistics, California Department of Health Care Services, 2014, www.dhcs.ca.gov (PDF).
Medi-Cal Births, by Aid Category California, 2011
Births and Demographics

©2016 CALIFORNIA HEALTH CARE FOUNDATION 11
0
20
40
60
80
100
Foreign BornUS BornLatinaAsianWhiteAfricanAmerican
All Races/Ethnicities
68%
32%
32%
68%
16%
84%
55%
45%
43%
57%
38%
62%
44%
56%
■ Fee-for-Service ■ Managed Care
Maternity Care in California
In 2011, over 60% of Medi-Cal
births were covered through the
fee-for-service system. About two
in three Latina mothers and four
in five foreign-born mothers in
Medi-Cal participated in the fee-
for-service system. Undocumented
mothers are eligible only for
restricted-scope benefits and
cannot participate in Medi-Cal’s
managed care programs. These
mothers represented 73,000, or
47%, of Medi-Cal FFS births in
2011 (not shown).
Notes: In-hospital births only, where 99% of births occur in California. Foreign born means not born in the US and does not pertain to citizenship or documentation status.
Source: 2011 Medi-Cal Births Statistics, California Department of Health Care Services, 2014, www.dhcs.ca.gov (PDF).
Medi-Cal Births, Fee-for-Service vs. Managed Care by Race/Ethnicity and Country of Origin, California, 2011
Workforce and Supply

©2016 CALIFORNIA HEALTH CARE FOUNDATION 12
0
20
40
60
80
100
201420040
20
40
60
80
100
20142004
� Other� Other Midwife� Certi�ed Nurse Midwife� Doctor of Osteopathic Medicine (DO)� Doctor of Medicine (MD)
California United States
8%
89%
9%5%
85%
– 3%
8%5%
87%
8%7%
84%
—1% <1%
– 1% —1% <1%
– 1%
Maternity Care in California
Ninety percent of births in both
California and the US were
attended by physicians, primarily
MDs (versus DOs). From 2004 to
2014, the percentage of births
attended by midwives in
California increased slightly.
Midwives, the vast majority
of whom were certified nurse
midwives, attended nearly one in
ten California births in 2014.
Notes: Attendant is the individual who is present and responsible for the delivery. For example, if a nurse midwife delivers an infant under the supervision of an obstetrician who is present in the delivery room, the obstetrician should be reported as the attendant; however, if the obstetrician is not present, the midwife is the attendant. Evidence suggests that the number of live births attended by certified nurse midwives (CNM) is understated, largely due to difficulty in correctly identifying the attendant when more than one provider is present. Segments may not sum to 100% due to rounding.
Source: “VitalStats,” Centers for Disease Control and Prevention, accessed January 20, 2016, www.cdc.gov.
Births, by Attendant California vs. United States, 2004 and 2014
Workforce and Supply

©2016 CALIFORNIA HEALTH CARE FOUNDATION 13
8.9 CA AVERAGE
San Joaquin Valley
Inland Empire
Central Coast
San Diego Area
Los Angeles County
Sacramento Area
Orange County
Greater Bay Area
14.0
11.8
10.1
9.1
8.4
7.8
4.8
4.8
Maternity Care in California
In 2015, 4,500 obstetricians/
gynecologists (ob/gyns) were
licensed in California, not all of
whom were active in patient
care. The supply of licensed ob/
gyns varied across the state. The
American Congress of Obstetricians
and Gynecologists is concerned
about an emerging shortage of
these providers, as the workforce
is aging and the female population
is growing.
*Supply of obstetricians/gynecologists (ob/gyns) based on licensed doctors of medicine (MDs) as of August 2015. Births are based on 2014 data.
Notes: San Benito County data are not included in Central Coast region. Northern and Sierra region data are not shown due to 2014 births in these counties not being available in VitalStats system. See Appendix A for a regional county map.
Sources: Medical Board of California’s Physician Survey, “CHHS Open Data Portal,” California Health and Human Services Agency, accessed January 7, 2016, chhs.data.ca.gov; “VitalStats,” Centers for Disease Control and Prevention, accessed February 18, 2016, www.cdc.gov.
Obstetricians/Gynecologists per 1,000 Births, by Region California, 2015*
Workforce and Supply

©2016 CALIFORNIA HEALTH CARE FOUNDATION 14
2.1 CA AVERAGE
San Joaquin Valley
Inland Empire
Los Angeles County
Orange County
Sacramento Area
Central Coast
San Diego Area
Greater Bay Area
Northern and Sierra
4.4
3.9
3.1
3.0
2.0
1.7
1.3
1.1
0.9
Maternity Care in California
In 2013, 1,050 certified nurse
midwives (CNMs) practiced in
California, primarily attending
births in hospitals. A 2010 survey
found that more than 20% of
CNMs in California were not
working as CNMs. The supply
of CNMs varied widely across
California, from a low of 0.9 CNMs
per 1,000 births in San Joaquin
Valley to a high of 4.4 per 1,000
births in the Northern and
Sierra region.
Notes: Certified nurse midwives (CNMs) are advanced practice nurses trained to provide midwifery care, including perinatal, well-woman, and newborn care. See Appendix A for a regional county map.
Sources: Area Health Resources Files (AHRF), Department of Health and Human Services, 2015, ahrf.hrsa.gov; “CA-Vital Statistics Query,” California Department of Public Health, accessed February 26, 2016, cdph.ca.gov; Survey of Nurse Practitioners and Certified Nurse Midwives, 2010, California Board of Registered Nursing, December 2011, www.rn.ca.gov.
Certified Nurse Midwives per 100,000 Births, by Region California, 2013
Workforce and Supply
©2016 CALIFORNIA HEALTH CARE FOUNDATION 15
2007 2014 % CHANGE
Licensed Midwives 179 361 101.7%
Clients served
• As primary caregiver at onset of care 2,277 5,386 136.5%
• With collaborative care available by licensed physician and surgeon
704 2,763 292.5%
• Under supervision of licensed physician and surgeon
159 161 1.3%
Planned out-of-hospital births
• At onset of labor 1,687 3,397 101.4%
• Completed in out-of-hospital setting 1,438 2,833 97.0%
Maternity Care in California
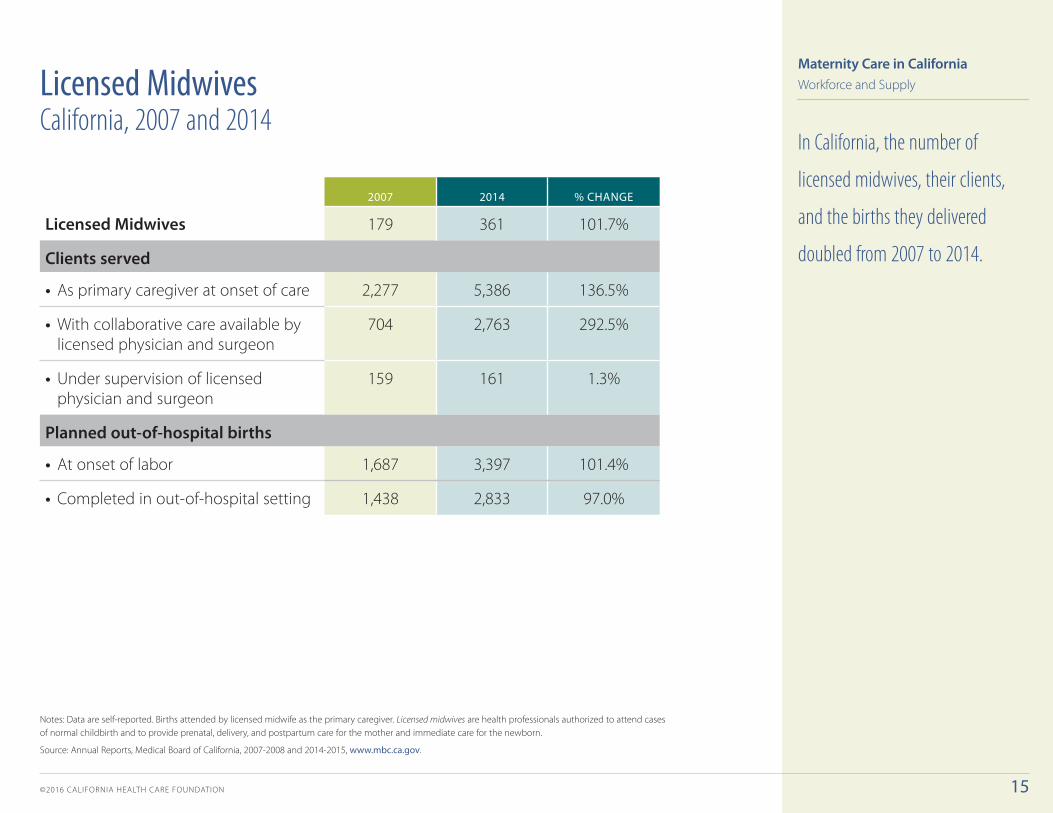
In California, the number of
licensed midwives, their clients,
and the births they delivered
doubled from 2007 to 2014.
Notes: Data are self-reported. Births attended by licensed midwife as the primary caregiver. Licensed midwives are health professionals authorized to attend cases of normal childbirth and to provide prenatal, delivery, and postpartum care for the mother and immediate care for the newborn.
Source: Annual Reports, Medical Board of California, 2007-2008 and 2014-2015, www.mbc.ca.gov.
Licensed Midwives California, 2007 and 2014
Workforce and Supply

©2016 CALIFORNIA HEALTH CARE FOUNDATION 16
HEALTHY PEOPLE 2020 TARGET: 78%
All Races/Ethnicities
African AmericanLatinaTwo or More Races
Asian/Paci�c Islander
White
85%76%
82%86%
80%81%
Maternity Care in California
Prenatal care has been shown to
improve pregnancy outcomes,
particularly by increasing
birthweight and decreasing risk
of delivery before 37 weeks.
Initiating prenatal care in the first
trimester is considered a marker
of high quality care. In California,
the likelihood of pregnant women
initiating prenatal care during
the first months varied by race/
ethnicity, from 76% of African
American mothers to 86% of
white mothers.
Notes: Births by place of residence. Latina origin is determined first and includes any race group. The US government’s Healthy People 2020 establishes science-based 10-year national objectives for improving the health of all Americans, www.healthypeople.gov.
Source: Author calculation based on data from “CA-Vital Statistics Query,” California Department of Public Health, accessed February 25, 2016, cdph.ca.gov.
PERCENTAGE OF LIVE BIRTHS
Initiated Prenatal Care in First Trimester, by Race/Ethnicity California, 2013
Quality: Process Measures
©2016 CALIFORNIA HEALTH CARE FOUNDATION 17
0%
5%
10%
15%
20%
25%
30%
35%
2014 2012 2010 2008 2006 2004 2002 2000 1998
21.0%
20.6%
32.7%32.2%
CaliforniaUnited States
Maternity Care in California
PERCENTAGE OF LIVE BIRTHS
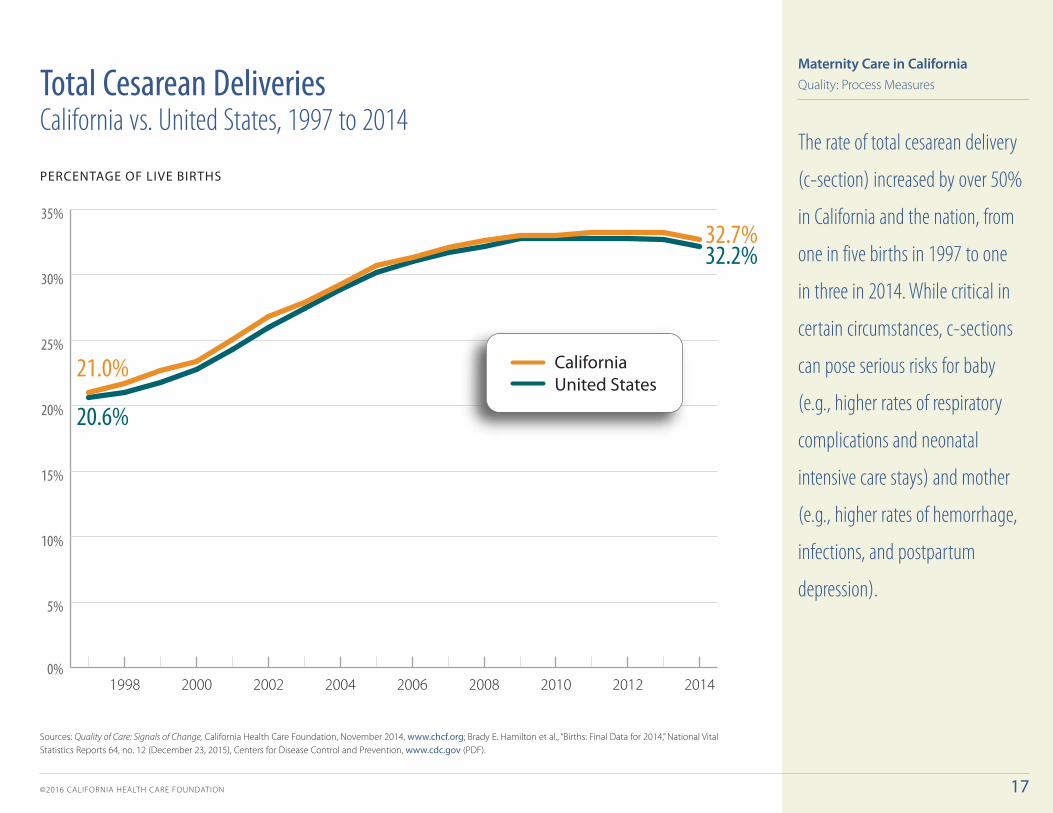
The rate of total cesarean delivery
(c-section) increased by over 50%
in California and the nation, from
one in five births in 1997 to one
in three in 2014. While critical in
certain circumstances, c-sections
can pose serious risks for baby
(e.g., higher rates of respiratory
complications and neonatal
intensive care stays) and mother
(e.g., higher rates of hemorrhage,
infections, and postpartum
depression).
Sources: Quality of Care: Signals of Change, California Health Care Foundation, November 2014, www.chcf.org; Brady E. Hamilton et al., “Births: Final Data for 2014,” National Vital Statistics Reports 64, no. 12 (December 23, 2015), Centers for Disease Control and Prevention, www.cdc.gov (PDF).
Total Cesarean Deliveries California vs. United States, 1997 to 2014
Quality: Process Measures
©2016 CALIFORNIA HEALTH CARE FOUNDATION 18
0%
5%
10%
15%
20%
25%
30%
35%
40%
45%
50%
55%
60%
65%
70%
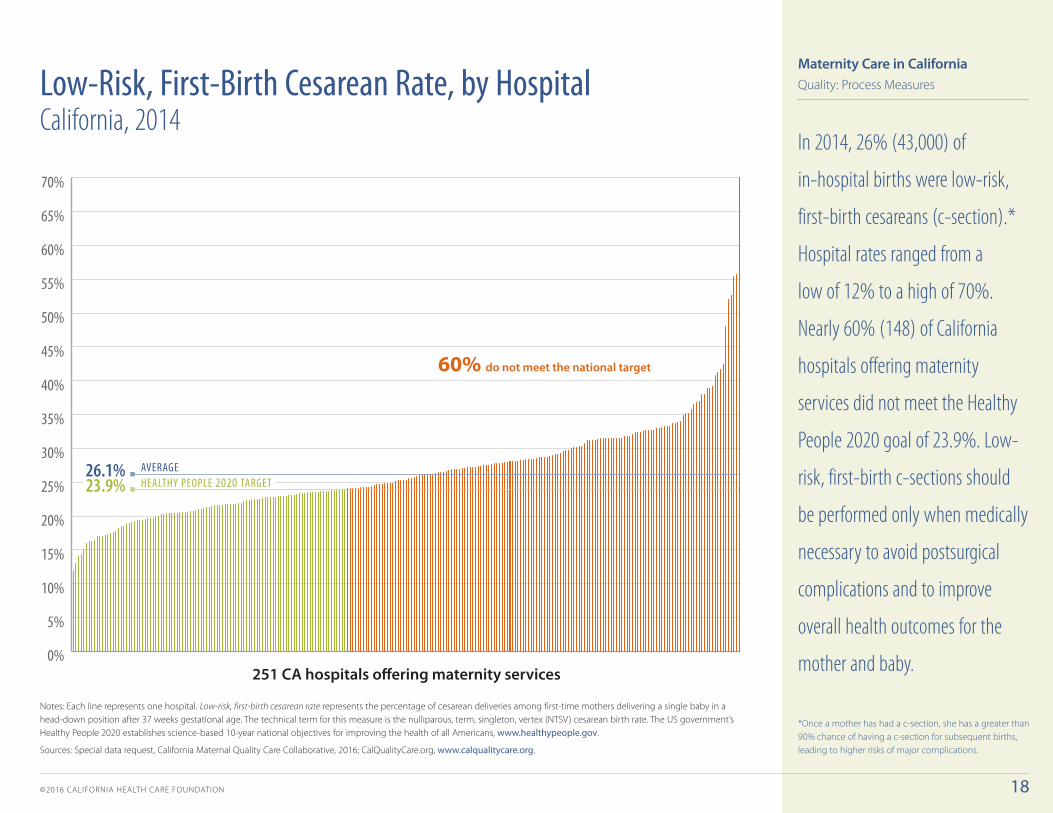
26.1%23.9%
AVERAGEHEALTHY PEOPLE 2020 TARGET
251 CA hospitals o�ering maternity services
60% do not meet the national target
Maternity Care in California
*Once a mother has had a c-section, she has a greater than 90% chance of having a c-section for subsequent births, leading to higher risks of major complications.
In 2014, 26% (43,000) of
in-hospital births were low-risk,
first-birth cesareans (c-section).*
Hospital rates ranged from a
low of 12% to a high of 70%.
Nearly 60% (148) of California
hospitals offering maternity
services did not meet the Healthy
People 2020 goal of 23.9%. Low-
risk, first-birth c-sections should
be performed only when medically
necessary to avoid postsurgical
complications and to improve
overall health outcomes for the
mother and baby.
Notes: Each line represents one hospital. Low-risk, first-birth cesarean rate represents the percentage of cesarean deliveries among first-time mothers delivering a single baby in a head-down position after 37 weeks gestational age. The technical term for this measure is the nulliparous, term, singleton, vertex (NTSV) cesarean birth rate. The US government’s Healthy People 2020 establishes science-based 10-year national objectives for improving the health of all Americans, www.healthypeople.gov.
Sources: Special data request, California Maternal Quality Care Collaborative, 2016; CalQualityCare.org, www.calqualitycare.org.
Low-Risk, First-Birth Cesarean Rate, by Hospital California, 2014
Quality: Process Measures

©2016 CALIFORNIA HEALTH CARE FOUNDATION 19
0%
5%
10%
15%
20%
25%
30%
35%
40%
45%
AVERAGE: 10.6%
251 CA hospitals o�ering maternity services
Maternity Care in California
In 2014, only 9,000 women,
or 11%, who previously had a
cesarean delivery (c-section) gave
birth vaginally. Maternity experts
agree that for many women,
vaginal births after cesarean
deliveries (VBACs) are safe and
often preferable, because with
each c-section, the risk of serious
complications for both mother
and baby increases.
Notes: Each line represents one hospital. Vaginal birth after cesarean (VBAC) rate measures the number of women having a vaginal delivery among all women with a prior c-section.
Sources: Special data request, California Maternal Quality Care Collaborative, 2016; CalQualityCare.org, www.calqualitycare.org.
Vaginal Birth After Cesarean Rate, by Hospital California, 2014
Quality: Process Measures

©2016 CALIFORNIA HEALTH CARE FOUNDATION 20
Ten % or MoreFive to Nine %Three to Four %One to Two %Zero %
12%
29%
19%
7%
33%
Percentage of EEDs
Maternity Care in California
PERCENTAGE OF ALL HOSPITALS
Notes: Deliveries were 1 to 3 weeks early when a scheduled delivery was not medically necessary. Data from April 1, 2014, to March 31, 2015 from 232 hospitals that submitted sufficient data to have their scores reported.
Sources: Centers for Medicare & Medicaid Services, accessed January 5, 2015, data.medicare.gov; Brittany Patterson, “Early Elective Deliveries Down in California, Still More Work to be Done,” KQED News, October 3, 2014, ww2.kqed.org.
Early elective deliveries (EEDs)
can result in serious complications
for the baby, such as respiratory
problems and insufficient brain
development. California’s average
for EEDs was 3% in 2014, which
is a dramatic improvement from
2010 when 14.7% of births in
the state were scheduled before
39 weeks (not shown). In 2014,
four in five California hospitals
performed better than the
Leapfrog Group goal of 5% or
fewer early elective deliveries.
Early Elective Deliveries California, 2014
Quality: Process Measures
©2016 CALIFORNIA HEALTH CARE FOUNDATION 21
0%
5%
10%
15%
20%
25%
30%
35%
40%
45%
50%
55%
60%
65%
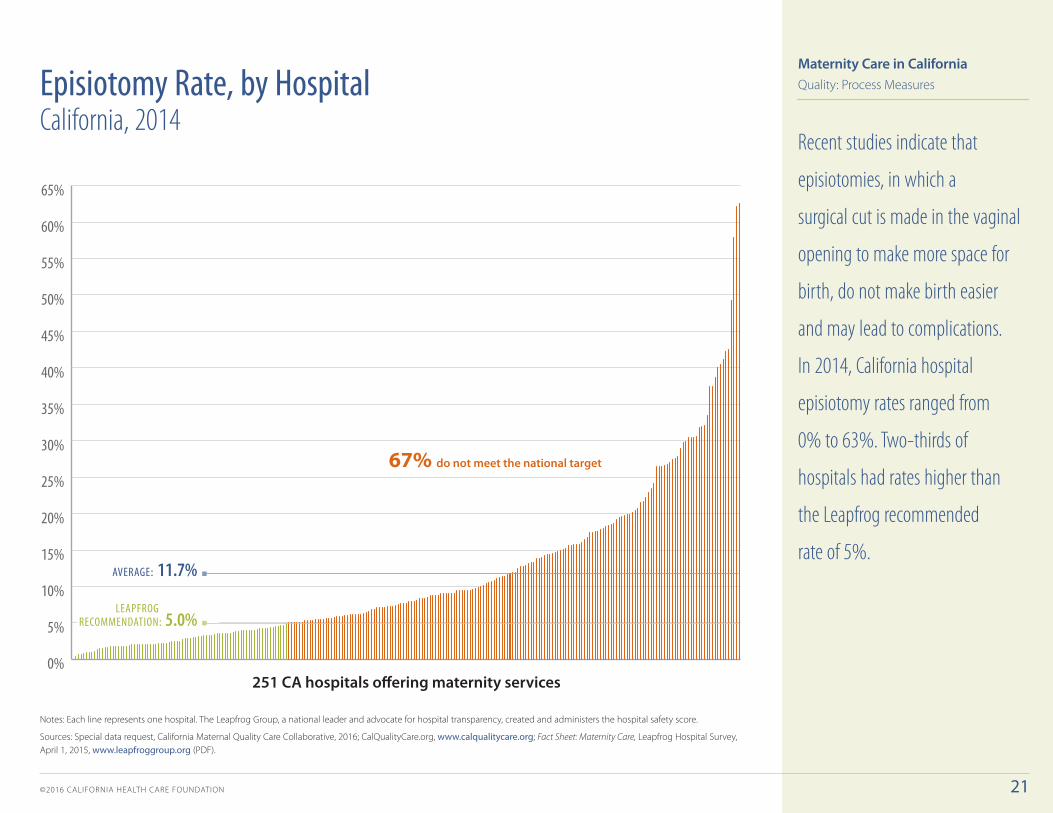
AVERAGE: 11.7%
LEAPFROG RECOMMENDATION: 5.0%
251 CA hospitals o�ering maternity services
67% do not meet the national target
Maternity Care in California
Recent studies indicate that
episiotomies, in which a
surgical cut is made in the vaginal
opening to make more space for
birth, do not make birth easier
and may lead to complications.
In 2014, California hospital
episiotomy rates ranged from
0% to 63%. Two-thirds of
hospitals had rates higher than
the Leapfrog recommended
rate of 5%.
Notes: Each line represents one hospital. The Leapfrog Group, a national leader and advocate for hospital transparency, created and administers the hospital safety score.
Sources: Special data request, California Maternal Quality Care Collaborative, 2016; CalQualityCare.org, www.calqualitycare.org; Fact Sheet: Maternity Care, Leapfrog Hospital Survey, April 1, 2015, www.leapfroggroup.org (PDF).
Episiotomy Rate, by Hospital California, 2014
Quality: Process Measures
©2016 CALIFORNIA HEALTH CARE FOUNDATION 22
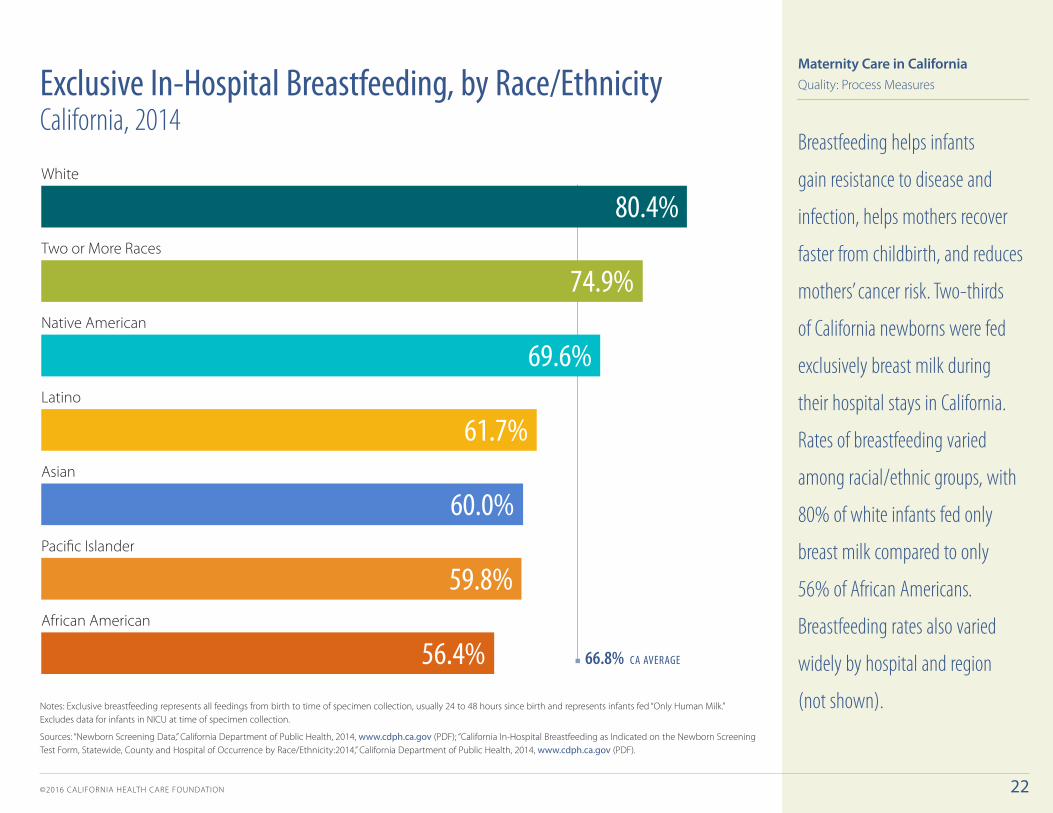
66.8% CA AVERAGE
African American
Paci�c Islander
Asian
Latino
Native American
Two or More Races
White
80.4%
74.9%
69.6%
61.7%
60.0%
59.8%
56.4%
Maternity Care in California
Notes: Exclusive breastfeeding represents all feedings from birth to time of specimen collection, usually 24 to 48 hours since birth and represents infants fed “Only Human Milk.” Excludes data for infants in NICU at time of specimen collection.
Sources: “Newborn Screening Data,” California Department of Public Health, 2014, www.cdph.ca.gov (PDF); “California In-Hospital Breastfeeding as Indicated on the Newborn Screening Test Form, Statewide, County and Hospital of Occurrence by Race/Ethnicity:2014,” California Department of Public Health, 2014, www.cdph.ca.gov (PDF).
Breastfeeding helps infants
gain resistance to disease and
infection, helps mothers recover
faster from childbirth, and reduces
mothers’ cancer risk. Two-thirds
of California newborns were fed
exclusively breast milk during
their hospital stays in California.
Rates of breastfeeding varied
among racial/ethnic groups, with
80% of white infants fed only
breast milk compared to only
56% of African Americans.
Breastfeeding rates also varied
widely by hospital and region
(not shown).
Exclusive In-Hospital Breastfeeding, by Race/Ethnicity California, 2014
Quality: Process Measures
©2016 CALIFORNIA HEALTH CARE FOUNDATION 23
Mom or infant neededbut could not a�ord postpartum care
Had a postpartum medical visit
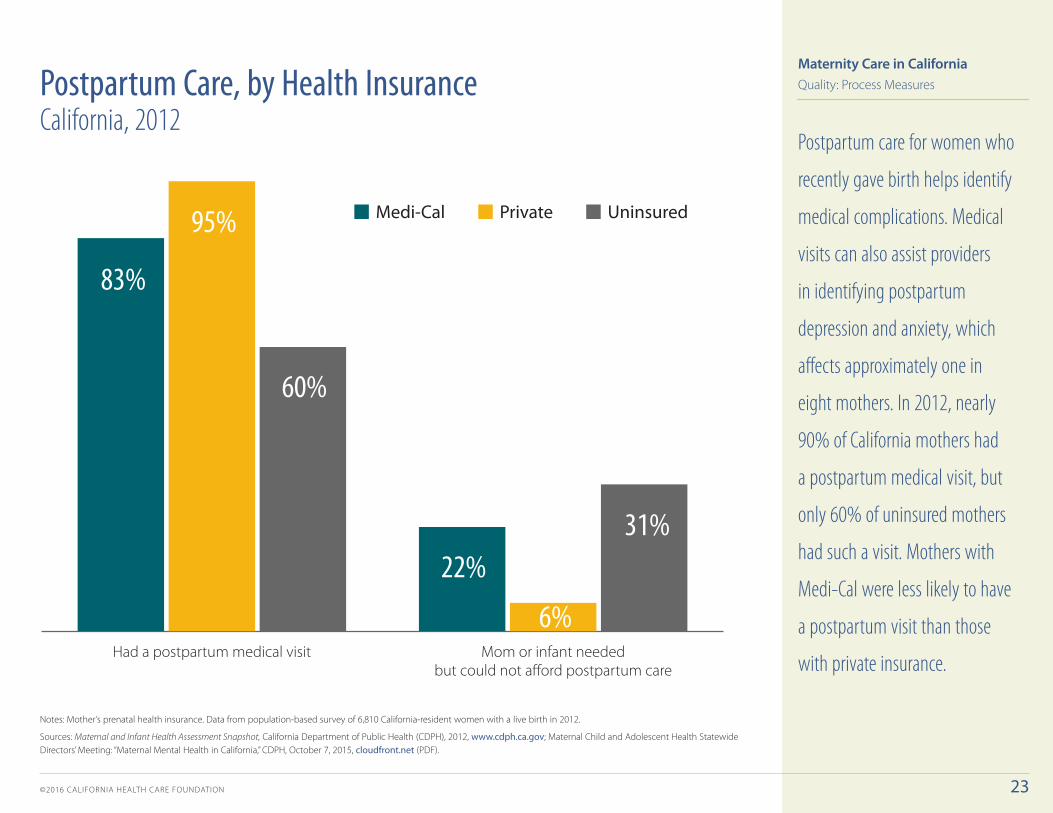
95%
83%
22%
6%
60%
31%
� Medi-Cal � Private � Uninsured
Maternity Care in California
Postpartum care for women who
recently gave birth helps identify
medical complications. Medical
visits can also assist providers
in identifying postpartum
depression and anxiety, which
affects approximately one in
eight mothers. In 2012, nearly
90% of California mothers had
a postpartum medical visit, but
only 60% of uninsured mothers
had such a visit. Mothers with
Medi-Cal were less likely to have
a postpartum visit than those
with private insurance.
Notes: Mother’s prenatal health insurance. Data from population-based survey of 6,810 California-resident women with a live birth in 2012.
Sources: Maternal and Infant Health Assessment Snapshot, California Department of Public Health (CDPH), 2012, www.cdph.ca.gov; Maternal Child and Adolescent Health Statewide Directors’ Meeting: “Maternal Mental Health in California,” CDPH, October 7, 2015, cloudfront.net (PDF).
Postpartum Care, by Health Insurance California, 2012
Quality: Process Measures

©2016 CALIFORNIA HEALTH CARE FOUNDATION 24
6.7%8.0%
1.1%1.4%
8.3%9.6%
1.3%1.6%
Very Preterm
Preterm
Very Low Birthweight
Low Birthweight
11.5%7.2%
6.3% 5.8%
12.1%7.7%
8.3% 7.5%
2.6%1.0% 1.1%
0.9%
2.9%1.0%
1.3% 1.0%
� African American� Asian/Paci�c Islander� Latino� White CA AVERAGE US AVERAGE
Maternity Care in California
BIRTH RATES
Low birthweight babies and
those born preterm are at
increased risk for lifelong
health problems or even dying
before they reach one year.
California’s rates of low birthweight
births and preterm births were
better than the US average. In both
cases, however, African Americans
fared the worst, with significantly
higher rates than other racial/
ethnic groups.
Notes: Low birthweight is less than 2,500 grams. Very low birthweight is less than 1,500 grams. Preterm is less than 37 completed weeks of gestation. Very preterm is less than 32 completed weeks of gestation. Latina origin is determined first and includes any race group.
Sources: User Guide to the 2014 Natality Public Use File, Centers for Disease Control and Prevention (CDC), 2015; “CDC Wonder,” CDC, accessed March 17, 2016, wonder.cdc.gov.
Childbirth-Related Quality Measures, by Race/Ethnicity California, 2014
Quality: Outcome Measures

©2016 CALIFORNIA HEALTH CARE FOUNDATION 25
Alameda
AlpineAmador
Butte
Calaveras
Colusa
Contra Costa
DelNorte
El Dorado
Fresno
Glenn
Humboldt
Imperial
Inyo
Kern
Kings
Lake
Lassen
Los Angeles
Madera
Marin
Mariposa
Mendocino
Merced
Modoc
Mono
Monterey
Napa
Nevada
Orange
Placer
Plumas
Riverside
Sacra-mento
SanBenito
San Bernardino
San Diego
SanJoaquin
San Luis Obispo
San Mateo
San Francisco
Santa Barbara
Santa Clara
Santa Cruz
Shasta
Sierra
Siskiyou
Solano
Sonoma
Stanislaus
Sutter
Tehama
Trinity
Tulare
Tuolumne
Ventura
Yolo
Yuba
Preterm Birth Rates (by quartiles)
� 5.5 to 7.8� 7.9 to 8.5*� 8.5* to 9.5� 9.6 to 13.7
CA Average: 8.8
Maternity Care in California
Babies who are born preterm
are at high risk of dying in infancy
and of having lifelong health
issues, including breathing
problems, vision problems,
cerebral palsy, and intellectual
delays. Preterm birth rates varied
widely across California.
*Due to rounding, categories may appear to overlap.
Notes: Preterm is less than 37 completed weeks of gestation. Includes California resident live births with valid gestational age range 17 to 47 weeks. Rates are not shown for counties with fewer than ten preterm births.
Sources: “Preterm Birth Rates by County of Residence,” California Department of Public Health, www.cdph.ca.gov (PDF); “Preterm Birth,” Centers for Disease Control and Prevention, www.cdc.gov/reproductivehealth/maternalinfanthealth/pretermbirth.htm.
Preterm Birth Rates, by County California, 2013
Quality: Outcome Measures
©2016 CALIFORNIA HEALTH CARE FOUNDATION 26
0
5
10
15
20
25
20132012201120102009200820072006200520042003200220012000
10.9
9.8
22.0
7.3
CaliforniaUnited States
Maternity Care in California
*The US government’s Healthy People 2020 establishes science-based 10-year national objectives for improving the health of all Americans, www.healthypeople.gov.
MATERNAL DEATHS PER 100,000 LIVE BIRTHS
Notes: Maternal mortality refers to deaths 42 days or less postpartum. The National Center for Health Statistics has not published official US maternal mortality rates since 2007; the 2008-2013 rates were calculated by CDPH through the CDC Wonder online database.
Source: Maternal Mortality Rates, California Department of Public Health, 2013, www.cdph.ca.gov (PDF).
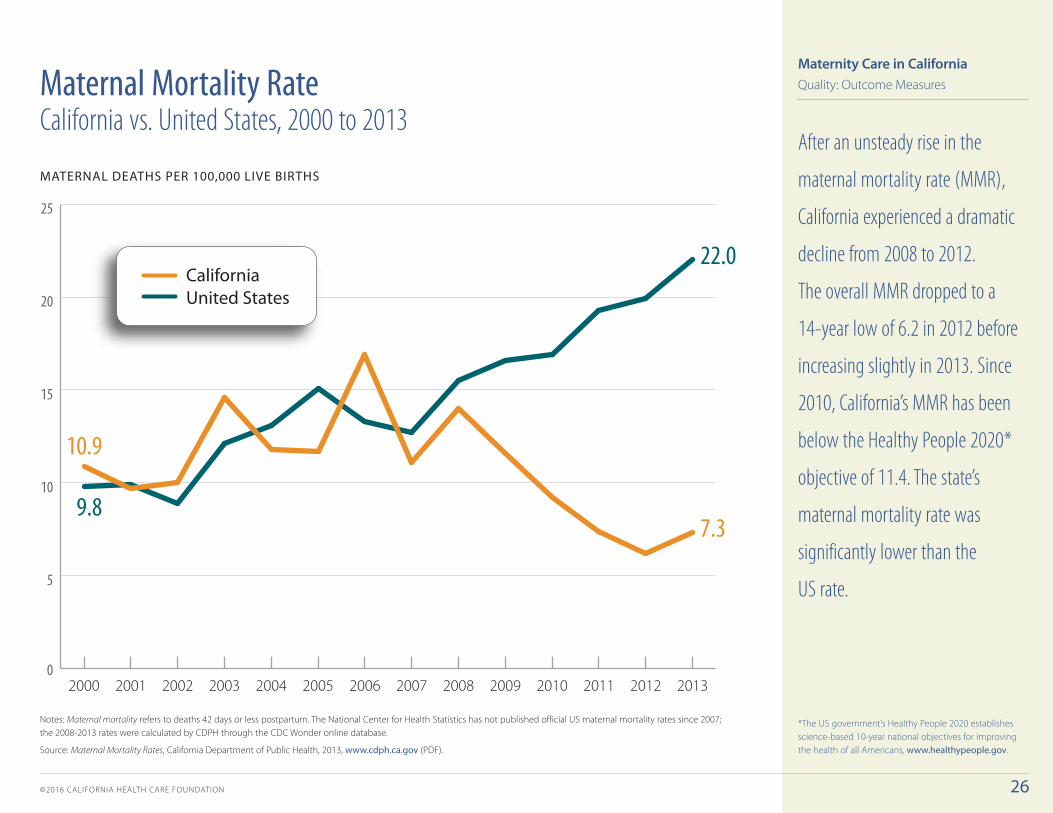
After an unsteady rise in the
maternal mortality rate (MMR),
California experienced a dramatic
decline from 2008 to 2012.
The overall MMR dropped to a
14-year low of 6.2 in 2012 before
increasing slightly in 2013. Since
2010, California’s MMR has been
below the Healthy People 2020*
objective of 11.4. The state’s
maternal mortality rate was
significantly lower than the
US rate.
Maternal Mortality Rate California vs. United States, 2000 to 2013
Quality: Outcome Measures

©2016 CALIFORNIA HEALTH CARE FOUNDATION 27
0
5
10
15
20
25
30
35
40
45
50
55
60
65
70
2011-132010-122009-112008-102007-092006-082005-072004-062003-052002-042001-032000-02
42.8
15.410.1
8.27.6
22.4
10.26.95.34.3
20 to 2425 to 2930 to 3435 to 3940 to 54
Maternity Care in California
MATERNAL DEATHS PER 100,000 LIVE BIRTHS
Compared to 2000, maternal
mortality rates (MMR) were lower
for all groups in California in 2013.
The drop was greatest for mothers
age 40 to 54, whose mortality
rate peaked at 64.3 deaths per
100,000 live births in 2005-2007
and has since declined to 22.4 in
2011-2013. Mothers in this age
group, who represented only 4%
of mothers, still had an MMR that
was more than twice that of any
other age group.
Notes: Maternal mortality refers to deaths 42 days or less postpartum. Three-year moving average is used.
Source: Maternal Mortality Rates, California Department of Public Health, 2013, www.cdph.ca.gov (PDF).
Maternal Mortality, by Age California, 2000 to 2013, Selected Years
Quality: Outcome Measures
©2016 CALIFORNIA HEALTH CARE FOUNDATION 28
0
5
10
15
20
25
30
35
40
45
50
55
60
2011-132010-122009-112008-102007-092006-082005-072004-062003-052002-042001-032000-02
29.0
9.59.28.5
26.4
7.87.04.9
African AmericanAsian/Paci�c IslanderLatinaWhite
Maternity Care in California
MATERNAL DEATHS PER 100,000 LIVE BIRTHS
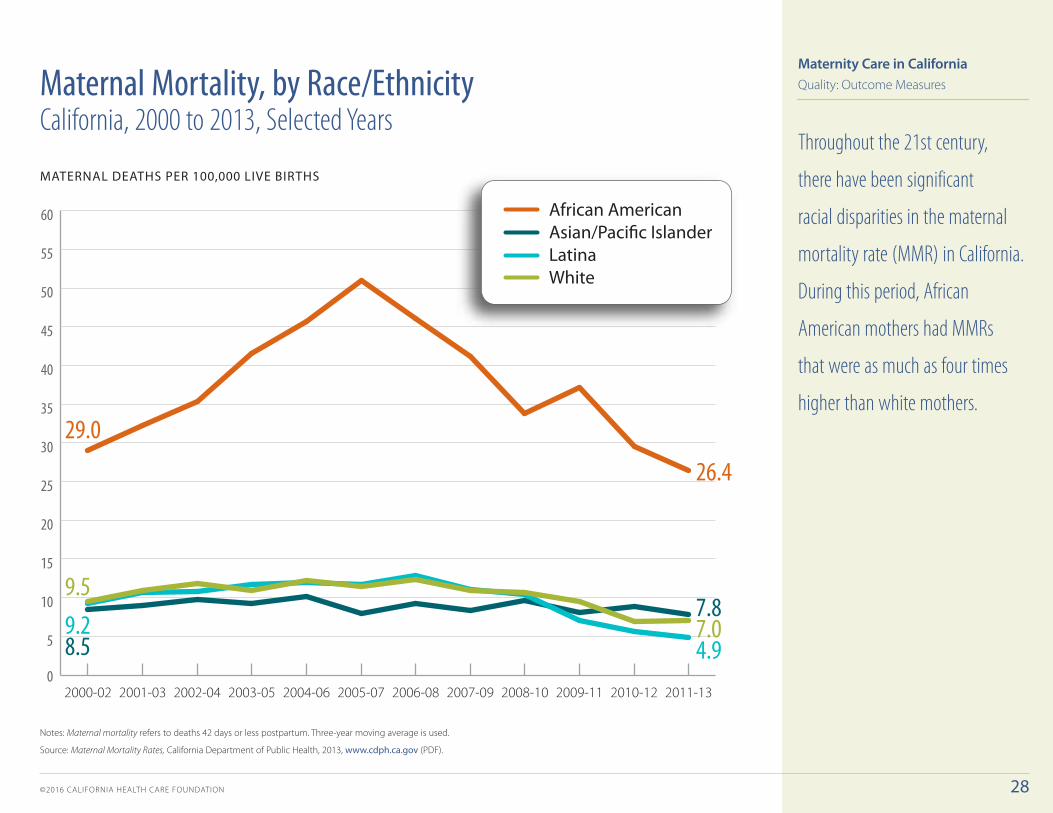
Throughout the 21st century,
there have been significant
racial disparities in the maternal
mortality rate (MMR) in California.
During this period, African
American mothers had MMRs
that were as much as four times
higher than white mothers.
Notes: Maternal mortality refers to deaths 42 days or less postpartum. Three-year moving average is used.
Source: Maternal Mortality Rates, California Department of Public Health, 2013, www.cdph.ca.gov (PDF).
Maternal Mortality, by Race/Ethnicity California, 2000 to 2013, Selected Years
Quality: Outcome Measures
©2016 CALIFORNIA HEALTH CARE FOUNDATION 29
0.0
0.5
1.0
1.5
2.0
2.5
3.0
3.5
4.0
4.5
20132012201120102009200820072006200520042003200220012000
3.7
1.7
3.3
1.4
NeonatalPostneonatal
Maternity Care in California
INFANT DEATHS PER 1,000 LIVE BIRTHS
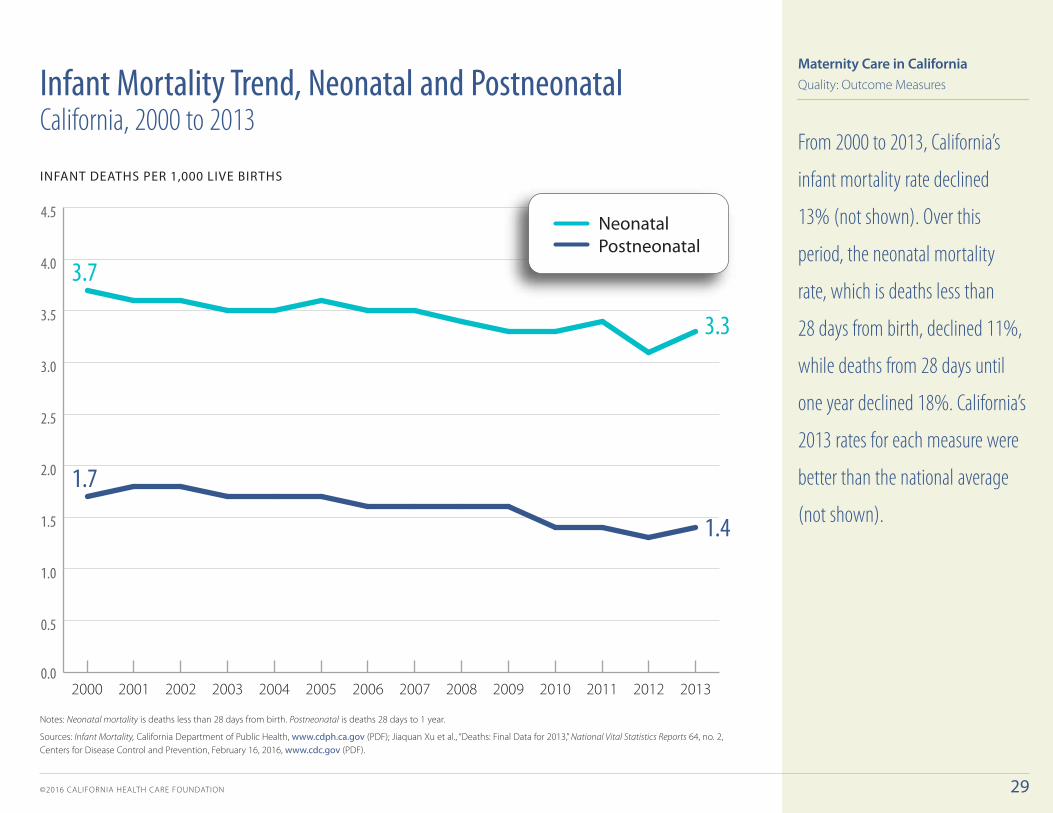
From 2000 to 2013, California’s
infant mortality rate declined
13% (not shown). Over this
period, the neonatal mortality
rate, which is deaths less than
28 days from birth, declined 11%,
while deaths from 28 days until
one year declined 18%. California’s
2013 rates for each measure were
better than the national average
(not shown).
Notes: Neonatal mortality is deaths less than 28 days from birth. Postneonatal is deaths 28 days to 1 year.
Sources: Infant Mortality, California Department of Public Health, www.cdph.ca.gov (PDF); Jiaquan Xu et al., “Deaths: Final Data for 2013,” National Vital Statistics Reports 64, no. 2, Centers for Disease Control and Prevention, February 16, 2016, www.cdc.gov (PDF).
Infant Mortality Trend, Neonatal and Postneonatal California, 2000 to 2013
Quality: Outcome Measures
©2016 CALIFORNIA HEALTH CARE FOUNDATION 30
Alameda
AlpineAmador
Butte
Calaveras
Colusa
Contra Costa
DelNorte
El Dorado
Fresno
Glenn
Humboldt
Imperial
Inyo
Kern
Kings
Lake
Lassen
Los Angeles
Madera
Marin
Mariposa
Mendocino
Merced
Modoc
Mono
Monterey
Napa
Nevada
Orange
Placer
Plumas
Riverside
Sacra-mento
SanBenito
San Bernardino
San Diego
SanJoaquin
San Luis Obispo
San Mateo
San Francisco
Santa Barbara
Santa Clara
Santa Cruz
Shasta
Sierra
Siskiyou
Solano
Sonoma
Stanislaus
Sutter
Tehama
Trinity
Tulare
Tuolumne
Ventura
Yolo
Yuba
Infant Deaths per 1,000 Live Births� 2.2 to 3.8� 4.1 to 4.7� 4.9 to 5.9� 6.1 to 8.7
CA Average: 4.7
Maternity Care in California
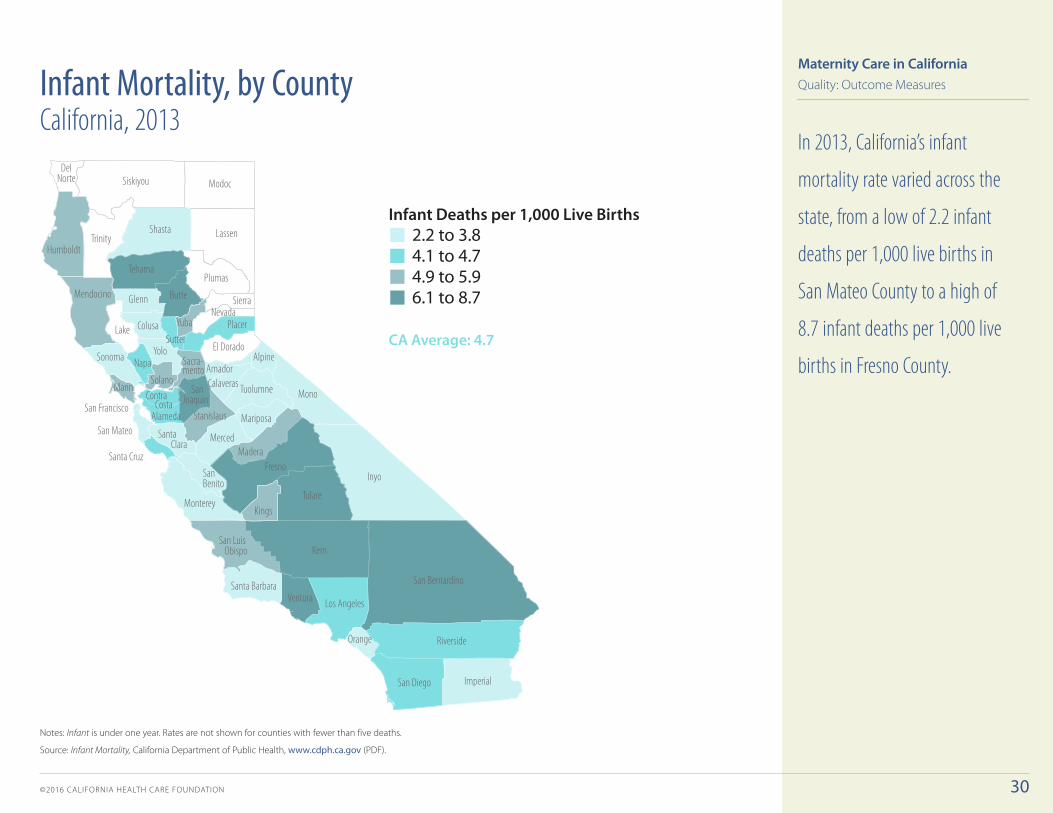
In 2013, California’s infant
mortality rate varied across the
state, from a low of 2.2 infant
deaths per 1,000 live births in
San Mateo County to a high of
8.7 infant deaths per 1,000 live
births in Fresno County.
Notes: Infant is under one year. Rates are not shown for counties with fewer than five deaths.
Source: Infant Mortality, California Department of Public Health, www.cdph.ca.gov (PDF).
Infant Mortality, by County California, 2013
Quality: Outcome Measures
©2016 CALIFORNIA HEALTH CARE FOUNDATION 31
All Races/Ethnicities
Two or MoreRaces
African AmericanLatinoWhiteAsian/Paci�c Islander
2.5
10.6
5.1 4.7
11.9
3.9
176 533 1,212 275 133 2,348
N U M B E R O F D E A T H S
Maternity Care in California
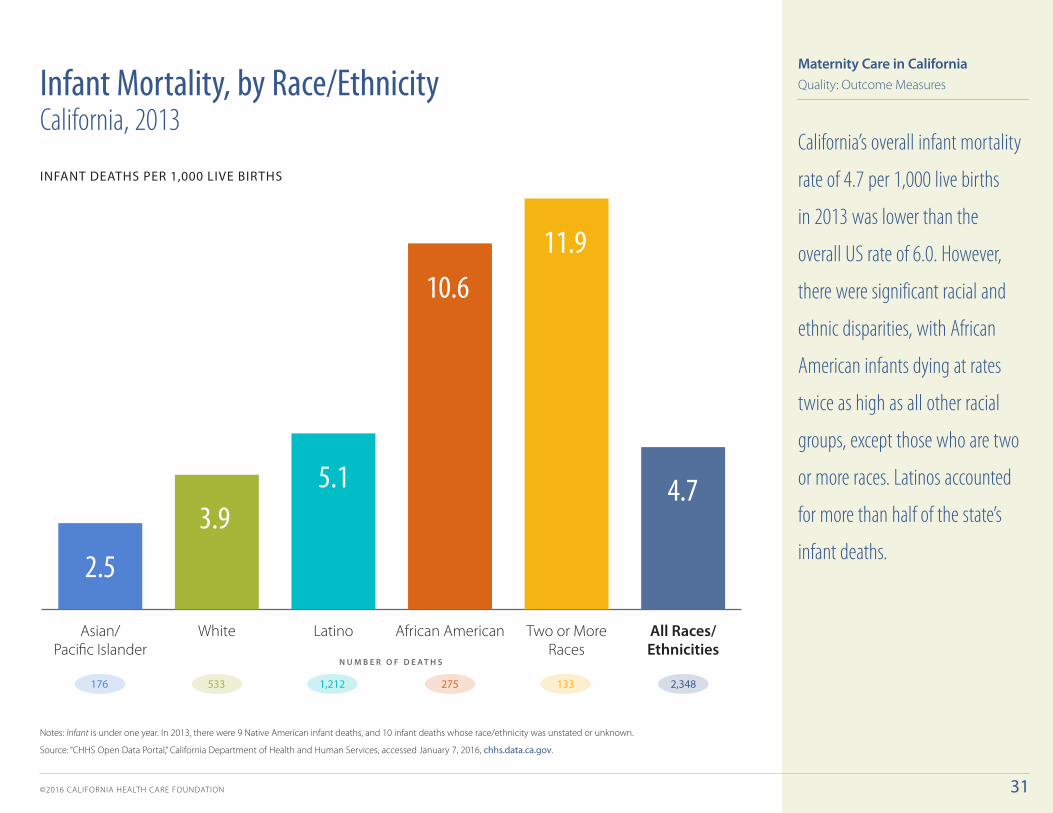
California’s overall infant mortality
rate of 4.7 per 1,000 live births
in 2013 was lower than the
overall US rate of 6.0. However,
there were significant racial and
ethnic disparities, with African
American infants dying at rates
twice as high as all other racial
groups, except those who are two
or more races. Latinos accounted
for more than half of the state’s
infant deaths.
Notes: Infant is under one year. In 2013, there were 9 Native American infant deaths, and 10 infant deaths whose race/ethnicity was unstated or unknown.
Source: “CHHS Open Data Portal,” California Department of Health and Human Services, accessed January 7, 2016, chhs.data.ca.gov.
Infant Mortality, by Race/Ethnicity California, 2013
INFANT DEATHS PER 1,000 LIVE BIRTHS
Quality: Outcome Measures
©2016 CALIFORNIA HEALTH CARE FOUNDATION 32
3.7%
9.4%
8.2%
Hypertension
Gestational Diabetes
Asthma
8.1%2.4%
2.9% 4.9%
13.6%6.2%
8.0% 8.4%
6.7% 14.2%
9.6% 6.8%
� African American� Asian/Paci�c Islander� Latina� White AVERAGE
Maternity Care in California
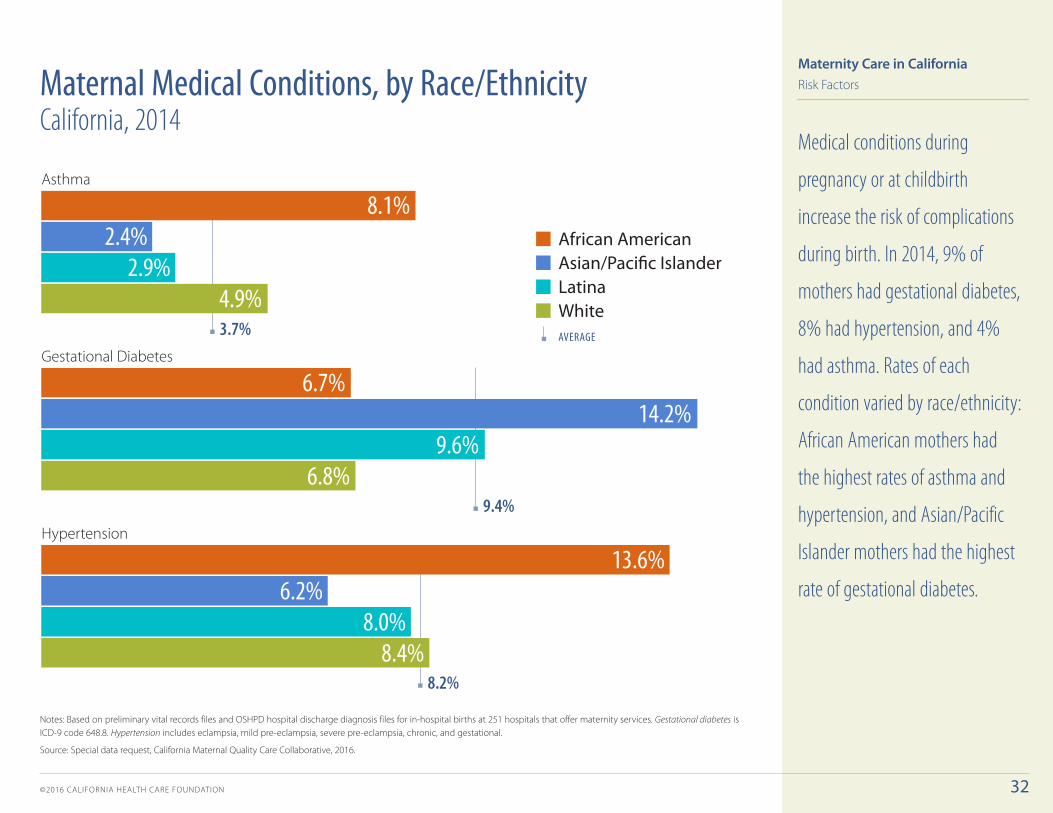
Medical conditions during
pregnancy or at childbirth
increase the risk of complications
during birth. In 2014, 9% of
mothers had gestational diabetes,
8% had hypertension, and 4%
had asthma. Rates of each
condition varied by race/ethnicity:
African American mothers had
the highest rates of asthma and
hypertension, and Asian/Pacific
Islander mothers had the highest
rate of gestational diabetes.
Notes: Based on preliminary vital records files and OSHPD hospital discharge diagnosis files for in-hospital births at 251 hospitals that offer maternity services. Gestational diabetes is ICD-9 code 648.8. Hypertension includes eclampsia, mild pre-eclampsia, severe pre-eclampsia, chronic, and gestational.
Source: Special data request, California Maternal Quality Care Collaborative, 2016.
Maternal Medical Conditions, by Race/Ethnicity California, 2014
Risk Factors

©2016 CALIFORNIA HEALTH CARE FOUNDATION 33
All Races/Ethnicities
Asian/Paci�c Islander
WhiteAfrican AmericanLatina
7.2%
25.0%
24.5%
4.5%
24.9%
28.6%
3.2%
15.4%
20.6%8.0%
16.6%
3.7%
19.5%
24.1%
■ Morbidly Obese■ Obese■ Overweight
– 0.8%
Maternity Care in California
Being overweight increases the
risk of complications during
pregnancy. In 2014, about one
in four California mothers was
obese or morbidly obese prior
to pregnancy, and an additional
one in four was overweight. Over
half of African American and
Latina mothers were overweight,
obese, or morbidly obese prior
to pregnancy compared to under
40% of white mothers.
Notes: In-hospital births at 251 hospitals that offer maternity services. Overweight and obesity are based on body mass index (BMI), from weight information reported by the mother on the birth certificate. Women with a pre-pregnancy BMI of 25.0 to 29.9 are classified as overweight; those with a BMI of 30 to 39.9 are classified as obese; those with BMI of 40 or greater are classified as morbidly obese. Accepted weight ranges are 50 to 400 pounds. African American, Asian/Pacific Islander, and white are non-Latina.
Sources: Special data request, California Maternal Quality Care Collaborative, 2016; “Healthy Weight, Healthy Pregnancy,” CDC, www.cdc.gov.
Maternal Pre-Pregnancy Overweight and Obesity by Race/Ethnicity, California, 2014
Risk Factors

©2016 CALIFORNIA HEALTH CARE FOUNDATION 34
Prenatal and PostpartumPostpartumPrenatalPrenatal or Postpartum
14.9%
20.5%
12.8%
7.2%
MATERNAL DEPRESSIVE SYMPTOMS, PRENATAL OR POSTPARTUM, BY RACE
CA AVERAGE
20.5%
White
Asian/Paci�c Islander
Latina
African American
27.6%
23.9%
15.9%
15.3%
Maternity Care in California
In 2013, one in five California
women who gave birth had either
prenatal or postpartum depressive
symptoms.
Rates of prenatal and postpartum
depressive symptoms varied by
the mother’s race/ethnicity. In
2013, about one in four African
American and Latina mothers
reported depressive symptoms. In
contrast, about one in six Asian/
Pacific Islander and white mothers
reported these symptoms.
Note: Data from population-based survey of California-resident women with a live birth in 2013. Data are weighted to represent all women with a live birth in California.
Source: Maternal Child and Adolescent Health Statewide Directors’ Meeting: “Maternal Mental Health in California,” California Department of Public Health, October 7, 2015, cloudfront.net.
Maternal Depressive Symptoms, Prenatal and/or Postpartum, California, 2013
Mental Health and Substance Use
©2016 CALIFORNIA HEALTH CARE FOUNDATION 35
CA AVERAGE
11.6%
CA AVERAGE
2.5%
Asian/Paci�c IslanderLatinaWhiteAfrican American
19.8%
7.3%*8.8%
1.3%
17.3%
4.4%
6.5%
1.1%*
� Before Pregnancy � During Pregnancy
Maternity Care in California
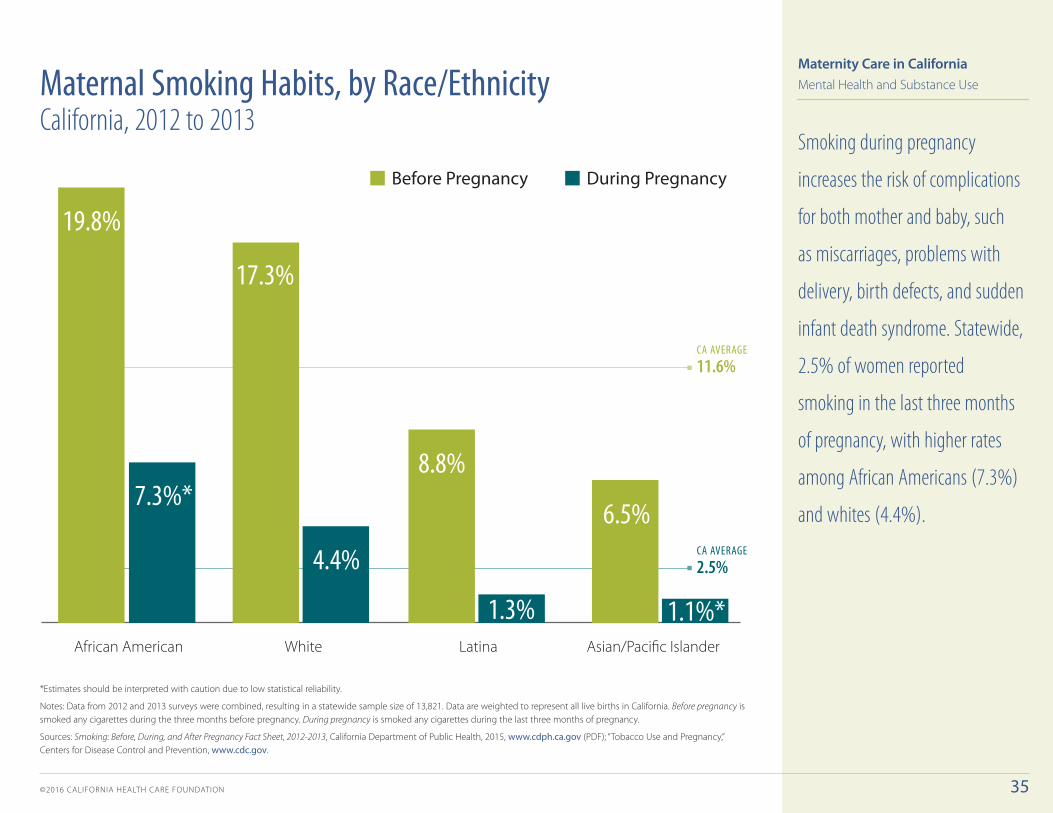
Smoking during pregnancy
increases the risk of complications
for both mother and baby, such
as miscarriages, problems with
delivery, birth defects, and sudden
infant death syndrome. Statewide,
2.5% of women reported
smoking in the last three months
of pregnancy, with higher rates
among African Americans (7.3%)
and whites (4.4%).
*Estimates should be interpreted with caution due to low statistical reliability.
Notes: Data from 2012 and 2013 surveys were combined, resulting in a statewide sample size of 13,821. Data are weighted to represent all live births in California. Before pregnancy is smoked any cigarettes during the three months before pregnancy. During pregnancy is smoked any cigarettes during the last three months of pregnancy.
Sources: Smoking: Before, During, and After Pregnancy Fact Sheet, 2012-2013, California Department of Public Health, 2015, www.cdph.ca.gov (PDF); “Tobacco Use and Pregnancy,” Centers for Disease Control and Prevention, www.cdc.gov.
Maternal Smoking Habits, by Race/Ethnicity California, 2012 to 2013
Mental Health and Substance Use

©2016 CALIFORNIA HEALTH CARE FOUNDATION 36
CA AVERAGE
20.9%
Asian/Paci�c IslanderLatinaAfrican AmericanWhite
11.7%
27.2%
15.7%
32.7%
Maternity Care in California
ANY ALCOHOL USE DURING 1ST OR 3RD TRIMESTER
Notes: Data from population-based survey of 6,810 California-resident women with a live birth in 2012. Data are weighted to represent all women with a live birth in California.
Source: Maternal and Infant Health Assessment Snapshot, California Department of Public Health, 2012, www.cdph.ca.gov.
Drinking alcohol during pregnancy
can cause miscarriage, stillbirth,
and fetal alcohol spectrum
disorder, which involves a range
of physical, behavioral, and
intellectual disabilities. One in
five California mothers reported
drinking alcohol during the first
or third trimester, with nearly
one in three white mothers
reporting alcohol use during
this time. The lower limit for
safely consuming alcohol during
pregnancy is not known.
Maternal Alcohol Use, by Race/Ethnicity California, 2012
Mental Health and Substance Use

©2016 CALIFORNIA HEALTH CARE FOUNDATION 37
0.5% CA AVERAGE 1.9% CA AVERAGE
0.000 0.875 1.750 2.625 3.500 4.375 5.250 6.125
Asian/Paci�c Islander
Latina
African American
Two or More Races
White
Native American
7.6%4.2%
4.9%0.6%
4.3%1.7%
4.6%1.1%
1.0%0.5%
0.8%0.1%
� Medi-Cal Births� Non-Medi-Cal Births
Maternity Care in California
Only a small portion of California
mothers were dependent on
drugs, including alcohol; however,
there were significant differences
in substance use rates by payer
and by race/ethnicity. Overall
substance use was nearly four
times higher among mothers on
Medi-Cal than among mothers not
on Medi-Cal in 2011. Substance
use was highest among Native
American mothers on Medi-Cal.
However, some studies have
documented bias in the reporting
of substance use based on race
and socioeconomic status.Note: Substance use is identified by Clinical Classifications Software (CCS) codes 660 and 661 and is defined as a state of dependence on any drug, including alcohol.
Source: 2011 Medi-Cal Births Statistics, California Department of Health Care Services, 2014, www.dhcs.ca.gov (PDF) Ira J. Chasnfoff, M.D., et al. “The Prevalence of Illicit-Drug or Alcohol Use During Pregnancy and Discrepancies in Mandatory Reporting in Pinellas County, Florida,” The New England Journal of Medicine, 322, No. 17, (April 26, 1990): 1202-1206.
Maternal Substance Use, by Payer Group and Race/Ethnicity California, 2011
Mental Health and Substance Use

©2016 CALIFORNIA HEALTH CARE FOUNDATION 38
All Races/EthnicitiesN=2,763
Asian/Paci�c Islandern=69
Latinon=909
Whiten=1,036
African Americann=264
0.9
7.7
3.9
5.6
10.0MOTHER’S COUNTRY OF ORIGIN
US Born76%
ForeignBorn24%
Maternity Care in California
From 2008 to 2012, there was
a 75% increase (not shown)
in California babies born with
neonatal abstinence syndrome
(NAS), a condition that results
from a baby’s exposure to
drugs, most often opioids, in
the womb. Newborns with NAS
can suffer from seizures and
other complications and require
hospitalization. In 2014, African
American and white infants had
higher rates of NAS than Latino
and Asian/Pacific Islander infants.
Notes: In-hospital births at 251 hospitals that offer maternity services. Neonatal abstinence syndrome based on ICD-9 codes 779.5 and 760.72. Not included: Other (rate: 18.1, n = 485).
Sources: Maternal and Child Health Services Title V Block Grant, California, September 22, 2015 Draft, California Department of Public Health, www.cdph.ca.gov (PDF); Special data request, California Maternal Quality Care Collaborative, 2016.
RATE PER 1,000 DELIVERIES
Infants Born with Neonatal Abstinence Syndrome by Race/Ethnicity, California, 2014
Mental Health and Substance Use

©2016 CALIFORNIA HEALTH CARE FOUNDATION 39
Repeat CesareanFirst CesareanEpidural AnalgesiaLabor Induction
8%
25%
7%
28%
19%
13%
28%
22%
Mothers who… � Did not have intervention � Had intervention
Maternity Care in California
Relatively little data exists on
mothers’ perceptions of their
birth experiences. A 2012
national survey found that
many mothers reported
experiencing pressure from a
health professional to have an
intervention during childbirth.
Of mothers who had the
intervention, one in four felt
pressured to induce labor or
have a first cesarean, and one
in five felt pressured to have
a repeat cesarean.
Notes: Nationally weighted data from an online survey conducted in 2012. Survey was completed by 2,400 mothers between age 18 and 45 who had given birth to single babies between July 2011 and June 2012.
Source: E. R. Declercq et al., Listening to Mothers III: Pregnancy and Birth (New York: Childbirth Connection, May 2013), transform.childbirthconnection.org (PDF).
Did you feel pressure from any health professional to have …?
Mothers’ Experience of Pressure to Have Birth Intervention United States, 2012
Patient Engagement

©2016 CALIFORNIA HEALTH CARE FOUNDATION 40
A Lot43%
Some35%
A Little20%
3%
Discussed Reasons forRepeat Cesarean
Discussed Reasons AgainstRepeat Cesarean
Not at All
A Lot20%
Some18%
A Little23%
Not at All40%
Maternity Care in California
How much did you and your maternity care provider talk about the reasons you might want to schedule another cesarean?
Mothers who previously had a
cesarean (c-section) reported that
discussions with their providers
tended to focus more on reasons
for rather than against a repeat
cesarean. Nearly 80% reported that
the provider focused a lot or some
of the conversation on reasons for
having a repeat c-section, while
more than 60% reported little or
no discussion of reasons against
having the intervention.
Notes: Nationally weighted data from an online survey conducted in 2012. Survey was completed by 2,400 mothers between age 18 and 45 who had given birth to single babies between July 2011 and June 2012.
Source: E. R. Declercq et al., Listening to Mothers III: Pregnancy and Birth (New York: Childbirth Connection, May 2013), transform.childbirthconnection.org (PDF).
Provider Discussions About Repeat Cesarean United States, 2012
Patient Engagement
©2016 CALIFORNIA HEALTH CARE FOUNDATION 41
Not SureAgree StronglyAgree SomewhatDisagree SomewhatDisagree Strongly
8%
14%
18%15%
12%
18%15%
24%
38% 37%� Increases the chances of serious problems with the placenta in any future pregnancies� Lowers the chance that a baby will have breathing problems at the time of birth
Maternity Care in California
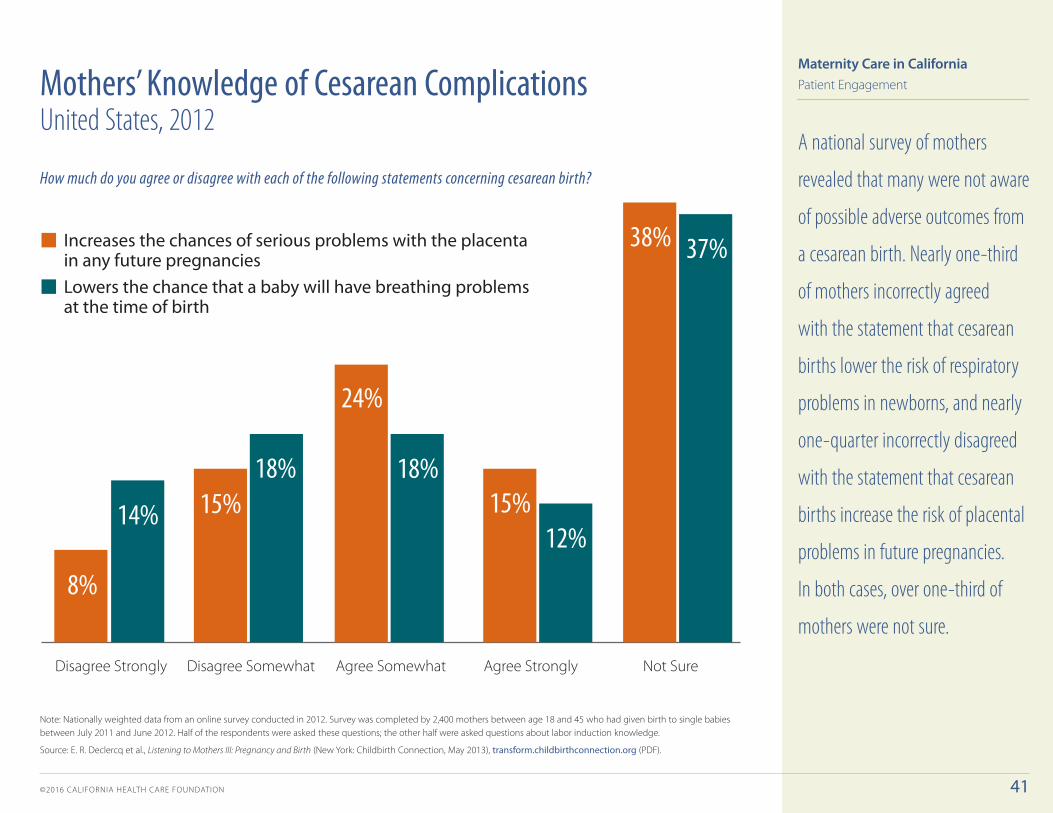
A national survey of mothers
revealed that many were not aware
of possible adverse outcomes from
a cesarean birth. Nearly one-third
of mothers incorrectly agreed
with the statement that cesarean
births lower the risk of respiratory
problems in newborns, and nearly
one-quarter incorrectly disagreed
with the statement that cesarean
births increase the risk of placental
problems in future pregnancies.
In both cases, over one-third of
mothers were not sure.
Note: Nationally weighted data from an online survey conducted in 2012. Survey was completed by 2,400 mothers between age 18 and 45 who had given birth to single babies between July 2011 and June 2012. Half of the respondents were asked these questions; the other half were asked questions about labor induction knowledge.
Source: E. R. Declercq et al., Listening to Mothers III: Pregnancy and Birth (New York: Childbirth Connection, May 2013), transform.childbirthconnection.org (PDF).
How much do you agree or disagree with each of the following statements concerning cesarean birth?
Mothers’ Knowledge of Cesarean Complications United States, 2012
Patient Engagement
©2016 CALIFORNIA HEALTH CARE FOUNDATION 42
CESAREAN BIRTHS VAGINAL BIRTHS
TOTAL PAYMENT PATIENT PAYMENT TOTAL PAYMENT PATIENT PAYMENT
Central San Joaquin $14,309 $1,176 $11,082 $716
Eastern Counties $14,444 $472 $12,415 $526
Inland Empire $16,270 $1,806 $11,292 $1,324
L.A. County East $17,567 $1,877 $12,978 $1,422
Orange County $18,597 $2,205 $13,956 $1,812
L.A. County West $21,510 $2,218 $14,528 $1,757
Central Coast $21,554 $2,315 $14,201 $1,691
San Diego County $22,717 $2,001 $14,618 $1,620
San Joaquin Valley $22,833 $1,054 $15,381 $881
Northern Counties $26,237 $2,529 $15,637 $1,855
Santa Clara County $26,553 $1,847 $17,491 $1,514
Sacramento Valley $28,828 $152 $17,937 $98
North Bay Area $29,632 $362 $18,000 $293
Contra Costa County $31,162 $984 $18,704 $736
San Francisco County $31,568 $1,519 $19,788 $1,383
Alameda County $32,399 $1,351 $19,075 $1,060
Monterey Coast $33,336 $3,048 $19,774 $2,518
San Mateo County $35,725 $1,155 $20,884 $928
CA Average $22,188 $1,781 $15,162 $1,329
Maternity Care in California
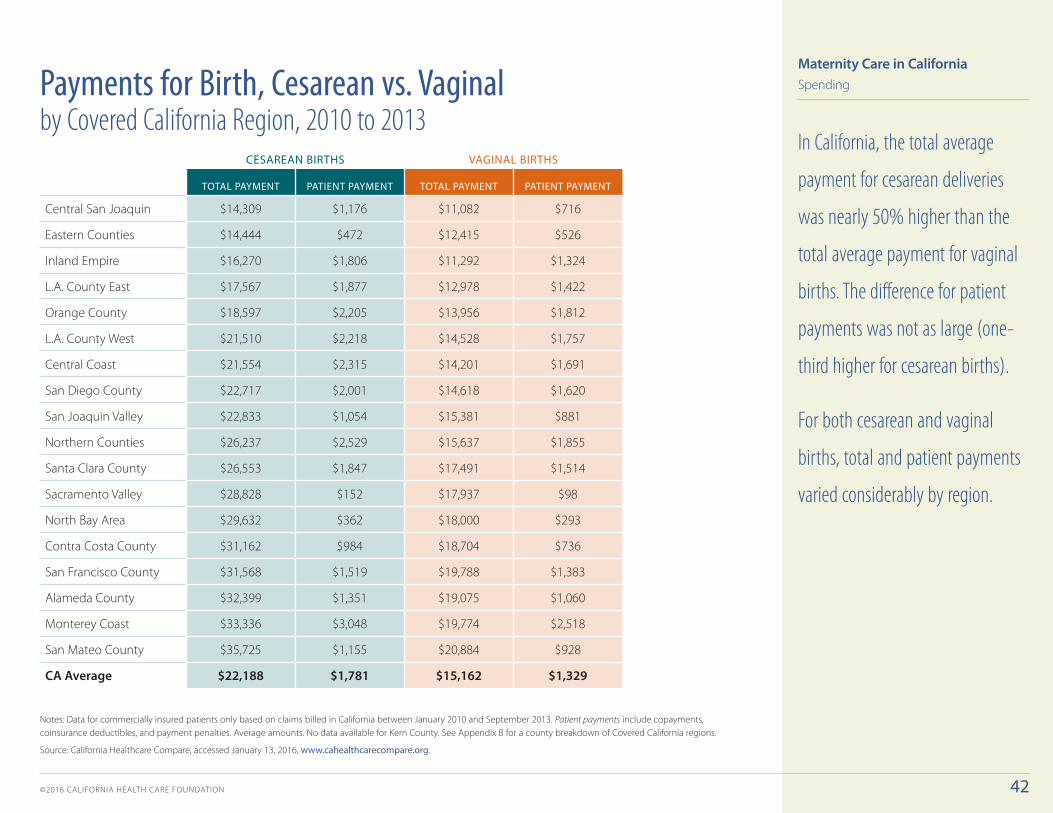
In California, the total average
payment for cesarean deliveries
was nearly 50% higher than the
total average payment for vaginal
births. The difference for patient
payments was not as large (one-
third higher for cesarean births).
For both cesarean and vaginal
births, total and patient payments
varied considerably by region.
Notes: Data for commercially insured patients only based on claims billed in California between January 2010 and September 2013. Patient payments include copayments, coinsurance deductibles, and payment penalties. Average amounts. No data available for Kern County. See Appendix B for a county breakdown of Covered California regions.
Source: California Healthcare Compare, accessed January 13, 2016, www.cahealthcarecompare.org.
Payments for Birth, Cesarean vs. Vaginal by Covered California Region, 2010 to 2013
Spending

©2016 CALIFORNIA HEALTH CARE FOUNDATION 43
F O R M O R E I N F O R M AT I O N
California Health Care Foundation
1438 Webster Street, Suite 400
Oakland, CA 94612
510.238.1040
www.chcf.org
California Department of Health Care Services Annual Medi-Cal Birth Reports
www.dhcs.ca.gov
California Department of Public Health CA-Vital Statistics Query
informaticsportal.cdph.ca.gov
California Department of Public Health, Maternal, Child and Adolescent Health Program Data and reports on maternal mortality, infant mortality, and other childbirth-related quality
indicators, as well as annual survey on mother and infant health
www.cdph.ca.gov
California Healthcare Compare Data on payments for births by California region
www.cahealthcarecompare.org
California Maternal Quality Care Collaborative Resources and toolkits designed to improve quality of maternal care in California; also hosts
California Maternal Data Center
www.cmqcc.org
Centers for Disease Control and Prevention VitalStats
www.cdc.gov/nchs/vitalstats.htm
Childbirth Connection Listening to Mothers surveys
transform.childbirthconnection.org/reports/listeningtomothers
Medical Board of California Annual reports which include surveys of licensed midwives, and physician surveys
www.mbc.ca.gov
Maternity Care in California
A B O U T T H I S S E R I E S
The California Health Care Almanac is an online
clearinghouse for data and analysis examining
the state’s health care system. It focuses on issues
of quality, affordability, insurance coverage and
the uninsured, and the financial health of the
system with the goal of supporting thoughtful
planning and effective decisionmaking. Learn
more at www.chcf.org/almanac.
AU T H O R
Jen Joynt, health care consultant
AC K N O W L E D G M E N T S
The California Maternal Quality Care Collaborative
contributed invaluable guidance and data for
this report.
Resources

©2016 CALIFORNIA HEALTH CARE FOUNDATION 44
Maternity Care in California
CENTRALCOAST
SAN JOAQUINVALLEY
ORANGE COUNTY
LOS ANGELES COUNTY
GREATERBAY AREA
SACRAMENTOAREA
NORTHERNAND SIERRA
NORTHERNAND SIERRA
INLANDEMPIRE
SAN DIEGO AREA
REGION COUNTIES
Central Coast Monterey, San Benito, San Luis Obispo, Santa Barbara, Santa Cruz, Ventura
Greater Bay Area Alameda, Contra Costa, Marin, Napa, San Francisco, San Mateo, Santa Clara, Solano, Sonoma
Inland Empire Riverside, San Bernardino
Los Angeles County Los Angeles
Northern and Sierra Alpine, Amador, Butte, Calaveras, Colusa, Del Norte, Glenn, Humboldt, Inyo, Lake, Lassen, Mariposa, Mendocino, Modoc, Mono, Nevada, Plumas, Shasta, Sierra, Siskiyou, Sutter, Tehama, Trinity, Tuolumne, Yuba
Orange County Orange
Sacramento Area El Dorado, Placer, Sacramento, Yolo
San Diego Area Imperial, San Diego
San Joaquin Valley Fresno, Kern, Kings, Madera, Merced, San Joaquin, Stanislaus, Tulare
Appendix A: California Counties Included in Regions

©2016 CALIFORNIA HEALTH CARE FOUNDATION 45
Maternity Care in California
Notes: These modified regions apply to page 42 only. Other regional slides use the regional designations from Appendix A.
Appendix B: Counties Included in Covered California Regions
REGION COUNTIES
Alameda County Alameda
Central Coast San Luis Obispo, Santa Barbara, Ventura
Central San Joaquin Fresno, Kings, Madera
Contra Costa County Contra Costa
Eastern Counties Imperial, Inyo, Mono
Inland Empire Riverside, San Bernardino
Kern County Kern
L.A. County East L.A. County East
L.A. County West L.A. County West
Monterey Coast Monterey, San Benito, Santa Cruz
North Bay Area Marin, Napa, Solano, Sonoma
REGION COUNTIES
Northern Counties Alpine, Amador, Butte, Calaveras, Colusa, Del Norte, Glenn, Humboldt, Lake, Lassen, Mendocino, Modoc, Nevada, Plumas, Shasta, Sierra, Siskiyou, Sutter, Tehama, Trinity, Tuolumne, Yuba
Orange County Orange
Sacramento Valley El Dorado, Placer, Sacramento, Yolo
San Diego County San Diego
San Francisco County San Francisco
San Joaquin Valley Mariposa, Merced, San Joaquin, Stanislaus, Tulare
San Mateo County San Mateo
Santa Clara County Santa Clara

©2016 CALIFORNIA HEALTH CARE FOUNDATION 46
BRIEF DESCRIPTION EDUCATION REQUIRED LICENSING ORGANIZATION
Certified Lactation Counselor* Provider of education and counseling to support breastfeeding. CLC training course completion and pass certification exam
None
Certified Nurse Midwife (CNM)
Advanced practice nurses educated to provide midwifery care, including perinatal, well-woman, and newborn care. CNMs primarily attend births in hospitals.
Master’s degree in nursing with specialty in nurse-midwifery.
California Board of Registered Nursing
Clinical Psychologist Clinician trained to diagnose and treat a range of mental health disorders and generally providing psychotherapy.
Ph.D. or Psy.D. in Psychology plus one year internship. Additional continuing education in perinatal mental health is available, but not required.
California Board of Psychology
Doula Provider of physical, emotional, and informational labor support to mother before, during, and after birth.
No special requirements None
International Board Certified Lactation Consultant*
Support specialist in the clinical management of human lactation and breastfeeding.
Must pass certification exam None
Labor and Delivery Nurse Registered nurse providing direct patient care in obstetrics and labor, and/or delivery and reproductive care.
Associate degree, bachelor of science in nursing, or entry-level master’s program in nursing
California Board of Registered Nursing
Licensed Marriage Family Therapist / Licensed Professional Clinical Counselor / Licensed Clinical Social Worker
A clinician who provides counseling or therapy services to groups or individuals to address wellness, personal growth and pathology.
Master’s degree. Additional continuing education in perinatal mental health is available, but not required.
California Board of Behavioral Sciences
Licensed Midwife† (also designated as Certified Professional Midwife)
Health care professional authorized to attend cases of normal childbirth and provide prenatal, delivery, and postpartum care for the mother and immediate care for the newborn. Typically attend births out of hospital.
Three-year postsecondary education program in an accredited midwifery school‡
Medical Board of California
Obstetrician/Gynecologist Doctor of medicine or doctor of osteopathic medicine specially trained to provide medical and surgical care to women, including providing pregnancy care.
Medical school plus four-year residency in obstetrics and gynecology
Medical Board of California or Osteopathic Medical Board of California
Psychiatrist Doctor of medicine specially trained to provide psychiatric care to adults using medications and/or psychotherapy.
Medical degree plus four years postdoctoral training in adult psychiatry. Additional fellowship training in reproductive psychiatry is available in some parts of the US, but is not required.
Medical Board of California
Maternity Care in California
*Lactation Consultants and Counselors are certifed by the International Board of Lactation Consultant Examiners and the Academy of Lactation Policy and Practice, respectively. †Unlicensed midwives also likely practicing in California. Little information exists on their typical background. ‡School approved by the Medical Board of California (MBC). Prior to January 1, 2015, midwives could also be licensed through a challenge mechanism whereby an applicant obtains credit for previous midwifery education and clinical experience.
Notes: This list is based on CHCF correspondence with 2020 Mom, Maternal Mental Health NOW, and Emily C. Dossett, M.D. (Keck School of Medicine, LAC+USC), June 2016. It captures only the most common maternal mental health providers.
Sources: Medical Board of California; California Board of Registered Nurses; DONA International; International Board of Lactation Consultant Examiners; The Academy of Lactation Policy and Practice.
Appendix C: Maternity Care Workforce Overview