Embed Size (px)
Citation preview

California Public Employees’ Retirement System Actuarial Office
P.O. Box 942701 Sacramento, CA 94229-2701 TTY: (916) 795-3240 (888) 225-7377 phone • (916) 795-2744 fax www.calpers.ca.gov
October 2011 SAFETY POLICE PLAN OF THE CITY OF ANAHEIM (EMPLOYER # 303) Annual Valuation Report as of June 30, 2010
Dear Employer, As an attachment to this letter, you will find a copy of the June 30, 2010 actuarial valuation report of your pension plan. This report contains important actuarial information about your pension plan at CalPERS. Your CalPERS staff actuary is available to discuss the report with you. Changes Since the Prior Year’s Valuation A temporary modification to our method of determining the actuarial value of assets and amortizing gains and losses was implemented for the valuations as of June 30, 2009 through June 30, 2011. The effect of those modifications continue in this valuation. There may also be changes specific to your plan such as contract amendments and funding changes. Further descriptions of general changes are included in the “Highlights and Executive Summary” section and in Appendix A, “Statement of Actuarial Data, Methods and Assumptions.” The effect of the changes on your rate is included in the “Reconciliation of Required Employer Contributions.” Future Contribution Rates The exhibit below displays the required employer contribution rate and Superfunded status for 2012/2013 along with estimates of the contribution rate for 2013/2014 and 2014/2015 and the probable Superfunded status for 2013/2014. The estimated rate for 2013/2014 is based solely on a projection of the investment return for fiscal 2010/2011, namely 20.0%. The estimated rate for 2014/2015 uses the valuation assumption of 7.75% as the investment return for fiscal 2011/2012. See Appendix D, “Investment Return Sensitivity Analysis”, for rate projections under a variety of investment return scenarios. Please disregard any projections that we may have provided to you in the past.
Fiscal Year Employer Contribution Rate Superfunded?
2012/2013 30.860% NO 2013/2014 31.2% (projected) NO 2014/2015 31.6% (projected) N/A
Member contributions (whether paid by the employer or the employee) are in addition to the above rates.
The estimates for 2013/2014 and 2014/2015 also assume that there are no future amendments and no liability gains or losses (such as larger than expected pay increases, more retirements than expected, etc.). This is a very important assumption because these gains and losses do occur and can have a significant impact on your contribution rate. Even for the largest plans, such gains and losses often cause a change in the employer’s contribution rate of one or two percent and may be even larger in some less common instances. These gains and losses cannot be predicted in advance so the projected employer contribution rates are just estimates. Your actual rate for 2013/2014 will be provided in next year’s report.

SAFETY POLICE PLAN OF THE CITY OF ANAHEIM (EMPLOYER # 303) October 2011 Page 2
We are very busy preparing actuarial valuations for other public agencies and expect to complete all such valuations by the end of October. We understand that you might have a number of questions about these results. While we are very interested in discussing these results with your agency, in the interest of allowing us to give every public agency their result, we ask that, if at all possible, you wait until after October 31 to contact us with questions. If you have questions, please call (888) CalPERS (225-7377).
Sincerely,
ALAN MILLIGAN, MAAA, FCA, FSA, FCIA Chief Actuary

ACTUARIAL VALUATION as of June 30, 2010
for the SAFETY POLICE PLAN
of the CITY OF ANAHEIM
(EMPLOYER # 303)
REQUIRED CONTRIBUTIONS
FOR FISCAL YEAR July 1, 2012 – June 30, 2013


TABLE OF CONTENTS
ACTUARIAL CERTIFICATION 1
HIGHLIGHTS AND EXECUTIVE SUMMARY
Purpose of the Report 5 Required Contributions 5 Funded Status 5 Cost and Volatility 6 Changes Since the Prior Valuation 7
SUMMARY OF LIABILITIES AND RATES
Development of Accrued and Unfunded Liabilities 11 (Gain) / Loss Analysis 12 Schedule of Amortization Bases 13 Reconciliation of Required Employer Contributions 14 Employer Contribution Rate History 15 Funding History 15
SUMMARY OF ASSETS
Reconciliation of the Market Value of Assets 19 Development of the Actuarial Value of Assets 19 Asset Allocation 20 CalPERS History of Investment Returns 21
SUMMARY OF PARTICIPANT DATA
Summary of Valuation Data 25 Active Members 26 Transferred and Terminated Members 27 Retired Members and Beneficiaries 28
APPENDIX A
Statement of Actuarial Data, Methods and Assumptions
APPENDIX B
Summary of Major Benefit Options Description of Principal Plan Provisions
APPENDIX C
GASB Statement No. 27
APPENDIX D
Investment Return Sensitivity Analysis
APPENDIX E
Glossary of Actuarial Terms
FIN PROCESS CONTROL ID (CY) 357324 FIN PROCESS CONTROL ID (PY) 341030 REPORT ID 65591


CALPERS ACTUARIAL VALUATION - June 30, 2010 SAFETY POLICE PLAN OF THE CITY OF ANAHEIM EMPLOYER NUMBER 303
Page 1
ACTUARIAL CERTIFICATION
To the best of our knowledge, this report is complete and accurate and contains sufficient information to disclose, fully and fairly, the funded condition of the SAFETY POLICE PLAN OF THE CITY OF ANAHEIM. This valuation is based on the member and financial data as of June 30, 2010 provided by the various CalPERS databases and the benefits under this plan with CalPERS as of the date this report was produced. It is our opinion that the valuation has been performed in accordance with generally accepted actuarial principles, in accordance with standards of practice prescribed by the Actuarial Standards Board, and that the assumptions and methods are internally consistent and reasonable for this plan, as prescribed by the CalPERS Board of Administration according to provisions set forth in the California Public Employees’ Retirement Law. The undersigned listed are actuaries for CalPERS. Both are members of the American Academy of Actuaries and the Society of Actuaries and meet the Qualification Standards of the American Academy of Actuaries to render the actuarial opinion contained herein.
RICHARD SANTOS, CFA, ASA, MAAA Senior Pension Actuary, CalPERS Plan Actuary
ALAN MILLIGAN, MAAA, FCA, FSA, FCIA
Chief Actuary


HIGHLIGHTS AND EXECUTIVE SUMMARY
PURPOSE OF THE REPORT
REQUIRED CONTRIBUTIONS
FUNDED STATUS
COST AND VOLATILITY
CHANGES SINCE THE PRIOR VALUATION


CALPERS ACTUARIAL VALUATION - June 30, 2010 SAFETY POLICE PLAN OF THE CITY OF ANAHEIM EMPLOYER NUMBER 303
Page 5
Purpose of the Report
This report presents the results of the June 30, 2010 actuarial valuation of the SAFETY POLICE PLAN OF THE CITY OF ANAHEIM of the California Public Employees’ Retirement System (CalPERS). The valuation was prepared by the Plan Actuary in order to: set forth the actuarial assets and accrued liabilities of this plan as of June 30, 2010; certify that the actuarially required employer contribution rate of this plan for the fiscal year July 1,
2012 through June 30, 2013 is 30.860%; provide actuarial information as of June 30, 2010 to the CalPERS Board of Administration and other
interested parties; and provide pension information as of June 30, 2010 to be used in financial reports subject to Governmental
Accounting Standards Board (GASB) Statement Number 27 for a Single Employer Defined Benefit Pension Plan.
The use of this report for any other purposes may be inappropriate. In particular, this report does not contain information applicable to termination or alternative benefit costs. The employer should contact their actuary before disseminating any portion of this report for any reason that is not explicitly described above.
Required Contributions
Fiscal Year Fiscal Year
2011/2012 2012/2013
Required Employer Contributions
Employer Contribution Required (in Projected Dollars)
Payment for Normal Cost $ 9,842,463 $ 9,806,242
Payment on the Amortization Bases 5,669,747 5,689,621
Total (not less than zero) $ 15,512,210 $ 15,495,863
Annual Lump Sum Prepayment Option* $ 14,943,937 $ 14,928,189
Employer Contribution Required (Percentage of Payroll)
Payment for Normal Cost 19.430% 19.529%
Payment on the Amortization Bases 11.193% 11.331%
Total (not less than zero) 30.623% 30.860%
Funded Status
June 30, 2009 June 30, 2010
Present Value of Projected Benefits $ 607,363,562 $ 626,430,649
Entry Age Normal Accrued Liability $ 496,422,604 $ 519,062,115
Actuarial Value of Assets (AVA) 411,137,205 432,262,370
Unfunded Liability (AVA) $ 85,285,399 $ 86,799,745
Market Value of Assets (MVA) $ 300,534,232 $ 339,672,985
Unfunded Liability (MVA) 195,888,372 179,389,130
Funded Status (MVA) 60.5% 65.4%
Superfunded Status No No
*
Payment must be received by CalPERS before the first payroll of the new fiscal year and after June 30.

CALPERS ACTUARIAL VALUATION - June 30, 2010 SAFETY POLICE PLAN OF THE CITY OF ANAHEIM EMPLOYER NUMBER 303
Page 6
Cost and Volatility
Actuarial Cost Estimates in General What will this pension plan cost? Unfortunately, there is no simple answer. There are two major reasons for the complexity of the answer. First, all actuarial calculations, including the ones in this report, are based on a number of assumptions about the future. These assumptions can be divided into two categories.
Demographic assumptions include the percentage of employees that will terminate, die, become disabled, and retire in each future year.
Economic assumptions include future salary increases for each active employee, and the assumption with the greatest impact, future asset returns at CalPERS for each year into the future until the last dollar is paid to current members of your plan.
While CalPERS has set these assumptions to reflect our best estimate of the real future of your plan, it must be understood that these assumptions are very long term predictors and will surely not be realized in any one year. For example, while the asset earnings at CalPERS have averaged more than the assumed return
of 7.75% for the past twenty year period ending June 30, 2011, returns for each fiscal year ranged from -24% to +20.7% Second, the very nature of actuarial funding produces the answer to the question of plan cost as the sum of two separate pieces.
The Normal Cost (i.e., the future annual premiums in the absence of surplus or unfunded liability) expressed as a percentage of total active payroll.
The Past Service Cost or Accrued Liability (i.e., the current value of the benefit for all credited past service of current members) which is expressed as a lump sum dollar amount.
The cost is the sum of a percent of future pay and a lump sum dollar amount (the sum of an apple and an orange if you will). To communicate the total cost, either the Normal Cost (i.e., future percent of payroll) must be converted to a lump sum dollar amount (in which case the total cost is the present value of benefits), or the Past Service Cost (i.e., the lump sum) must be converted to a percent of payroll (in which case the total cost is expressed as the employer’s rate, part of which is permanent and part temporary). Converting the Past Service Cost lump sum to a percent of payroll requires a specific amortization period,
and the employer rate will vary depending on the amortization period chosen. Rate Volatility As is stated above, the actuarial calculations supplied in this communication are based on a number of assumptions about very long term demographic and economic behavior. Unless these assumptions (terminations, deaths, disabilities, retirements, salary growth, and investment return) are exactly realized each year, there will be differences on a year to year basis. The year-to-year differences between actual experience and the assumptions are called actuarial gains and losses and serve to lower or raise the employer’s rates from one year to the next. Therefore, the rates will inevitably fluctuate, especially due to the ups and downs of investment returns. Plans that have higher asset to payroll ratios produce more volatile employer rates due to investment return. On the following page we have shown your volatility index, a measure of the plan’s potential future rate volatility. It should be noted that this ratio increases over time but generally tends to stabilize as the plan matures.

CALPERS ACTUARIAL VALUATION - June 30, 2010 SAFETY POLICE PLAN OF THE CITY OF ANAHEIM EMPLOYER NUMBER 303
Page 7
Rate Volatility As of June 30, 2010
Market Value of Assets without Receivables $ 338,956,661
Payroll 45,619,701
Volatility Index 7.4
Changes since the Prior Valuation
Actuarial Assumptions There were no changes made to the actuarial assumptions since the prior year’s actuarial valuation. The only exception would be changes necessary to reflect a benefit amendment. Actuarial Methods A method change was adopted by the CalPERS Board in June 2009. We are in the second year of a 3-year temporary change to the asset smoothing method and the amortization of gains and losses in order to phase in the impact of the -24% investment loss experienced by CalPERS in fiscal year 2008-2009. The following changes were adopted:
Increase the corridor limits for the actuarial value of assets from 80%-120% of market value to 60%-140% of market value on June 30, 2009
Reduce the corridor limits for the actuarial value of assets to 70%-130% of market value on June 30, 2010
Return to the 80%-120% of market value corridor limits for the actuarial value of assets on
June 30, 2011 and thereafter Isolate and amortize all gains and losses during fiscal year 2008-2009, 2009-2010 and 2010-
2011 over fixed and declining 30 year periods (as opposed to the current rolling 30 year amortization)
A complete description of all methods is in Appendix A. The detailed calculation of the actuarial value of assets is shown in the “Development of the Actuarial Value of Assets.”
Benefits The standard actuarial practice at CalPERS is to recognize mandated legislative benefit changes in the first annual valuation whose valuation date follows the effective date of the legislation. Voluntary benefit changes by plan amendment are generally included in the first valuation that is prepared after the amendment becomes effective even if the valuation date is prior to the effective date of the amendment.
This valuation generally reflects plan changes by amendments effective before the date of the report. Please refer to Appendix B for a summary of the plan provisions used in the valuation. The effect of any mandated benefit changes or plan amendments on the unfunded liability is shown in the “(Gain)/Loss Analysis” and the effect on your employer contribution rate is shown in the “Reconciliation of Required Employer Contributions”. It should be noted that no change in liability or rate is shown for any plan changes which were already included in the prior year’s valuation.


SUMMARY OF LIABILITIES AND RATES
DEVELOPMENT OF ACCRUED AND UNFUNDED LIABILITIES
(GAIN) / LOSS ANALYSIS
SCHEDULE OF AMORTIZATION BASES
RECONCILIATION OF REQUIRED EMPLOYER CONTRIBUTIONS
EMPLOYER CONTRIBUTION RATE HISTORY
FUNDING HISTORY


CALPERS ACTUARIAL VALUATION - June 30, 2010 SAFETY POLICE PLAN OF THE CITY OF ANAHEIM EMPLOYER NUMBER 303
Page 11
Development of Accrued and Unfunded Liabilities
1. Present Value of Projected Benefits
a) Active Members $ 314,584,970
b) Transferred Members 4,288,181
c) Terminated Members 2,712,606
d) Members and Beneficiaries Receiving Payments 304,844,892
e) Total $ 626,430,649
2. Present Value of Future Employer Normal Costs $ 72,918,692
3. Present Value of Future Employee Contributions $ 34,449,842
4. Entry Age Normal Accrued Liability
a) Active Members [(1a) - (2) - (3)] $ 207,216,436
b) Transferred Members (1b) 4,288,181
c) Terminated Members (1c) 2,712,606
d) Members and Beneficiaries Receiving Payments (1d) 304,844,892
e) Total $ 519,062,115
5. Actuarial Value of Assets $ 432,262,370
6. Unfunded Accrued Liability [(4e) – (5)] $ 86,799,745

CALPERS ACTUARIAL VALUATION - June 30, 2010 SAFETY POLICE PLAN OF THE CITY OF ANAHEIM EMPLOYER NUMBER 303
Page 12
(Gain)/Loss Analysis 6/30/09 – 6/30/10
To calculate the cost requirements of the plan, assumptions are made about future events that affect the amount and timing of benefits to be paid and assets to be accumulated. Each year actual experience is compared to the expected experience based on the actuarial assumptions. This results in actuarial gains or losses, as shown below. A Total (Gain)/Loss for the Year* 1. Unfunded Accrued Liability (UAL) as of 6/30/09 $ 85,285,399 2. Expected Payment on the UAL during 2009/2010 3,296,743 3. Interest through 6/30/10 [.0775 x (A1) - ((1.0775)½ - 1) x (A2)] 6,484,253 4. Expected UAL before all other changes [(A1) - (A2) + (A3)] 88,472,909 5. Change due to plan changes 0 6. Change due to assumption change 0 7. Expected UAL after all other changes [(A4) + (A5) + (A6)] 88,472,909
8. Actual UAL as of 6/30/10 86,799,745
9. Total (Gain)/Loss for 2009/2010 [(A8) - (A7)] $ (1,673,164) B Contribution (Gain)/Loss for the Year 1. Expected Contribution (Employer and Employee) $ 16,805,883 2. Interest on Expected Contributions 639,077 3. Actual Contributions 18,073,386 4. Interest on Actual Contributions 687,276 5. Expected Contributions with Interest [(B1) + (B2)] 17,444,960 6. Actual Contributions with Interest [(B3) + (B4)] 18,760,662
7. Contribution (Gain)/Loss [(B5) - (B6)] $ (1,315,702) C Asset (Gain)/Loss for the Year 1. Actuarial Value of Assets as of 6/30/09 Including Receivables $ 411,137,205 2. Receivables as of 6/30/09 801,918 3. Actuarial Value of Assets as of 6/30/09 410,335,287
4. Contributions Received 18,073,386 5. Benefits and Refunds Paid (21,889,243) 6. Transfers/Misc. Adjustments (15,160) 7. Expected Int. [.0775 x (C3) + ((1.0775)½ - 1) x ((C4) + (C5) + (C6))] 31,655,303 8. Expected Assets as of 6/30/10 [(C3) + (C4) + (C5) + (C6) + (C7)] 438,159,573 9. Receivables as of 6/30/10 716,324 10. Expected Assets Including Receivables 438,875,897 11. Actual Actuarial Value of Assets as of 6/30/10 432,262,370
12. Asset (Gain)/Loss [(C10) - (C11)] $ 6,613,527 D Liability (Gain)/Loss for the Year 1. Total (Gain)/Loss (A9) $ (1,673,164) 2. Contribution (Gain)/Loss (B7) (1,315,702) 3. Asset (Gain)/Loss (C12) 6,613,527
4. Liability (Gain)/Loss [(D1) - (D2) - (D3)] $ (6,970,989) Development of the (Gain)/Loss Balance as of 6/30/10** 1. (Gain)/Loss Balance as of 6/30/09 $ 71,504,985 2. Payment Made on the Balance during 2009/2010 3,967,054 3. Interest through 6/30/10 [.0775 x (1) - ((1.0775)1/2 - 1) x (2)] 5,390,781
4. Scheduled (Gain)/Loss Balance as of 6/30/10 [(1) - (2) + (3)] $ 72,928,712
* The Total (Gain)/Loss for 2009/2010 is being amortized over a fixed and declining 30-year period and is shown as “Special (Gain)/Loss” in the “Schedule of Amortization Bases” on the following page. ** This (Gain)/Loss represents the 6/30/10 balance of the accumulation of (gains)/losses through 6/30/08 and is amortized using a rolling 30-year period. Gains and losses incurred after 6/30/2011 will again accumulate to this base.

CALPERS ACTUARIAL VALUATION - June 30, 2010 SAFETY POLICE PLAN OF THE CITY OF ANAHEIM
EMPLOYER NUMBER 303
Page 13
Schedule of Amortization Bases
There is a two year lag between the Valuation Date and the Contribution Fiscal Year. The assets, liabilities and funded status of the plan are measured as of the valuation date (June 30, 2010). The employer contribution rate determined by the valuation is for the fiscal year beginning two years after the valuation date (fiscal year 2012/2013). This two year lag is necessary due to the amount of time needed to extract and test the membership and financial data, and due to the need to provide public agencies with their employer contribution rates well in advance of the start of the fiscal year. The Unfunded Liability is used to determine the employer contribution and therefore must be rolled forward two years from the valuation date to the first day of the fiscal year for which the contribution is being determined. The Unfunded Liability is rolled forward each year by subtracting the expected Payment on the Unfunded Liability for the fiscal year and adjusting for interest. The Expected Payment on the Unfunded Liability for a fiscal year is equal to the Expected Employer Contribution for the fiscal year minus the Expected Normal Cost for the year. The Employer Contribution Rate for the first fiscal year is determined by the actuarial valuation two years ago and the rate for the second year is from the actuarial valuation one year ago. The Normal Cost Rate for each of the two fiscal years is assumed to be the same as the rate determined by the current valuation. All expected dollar amounts are determined by multiplying the rate by the expected payroll for the applicable fiscal year, based on payroll as of the valuation date.
Amounts for Fiscal 2012/2013
Reason for Base Date
Established
Amorti-zation Period
Balance 6/30/10
Expected Payment
2010/2011 Balance 6/30/11
Expected Payment
2011/2012 Balance 6/30/12
Scheduled Payment for 2012–2013
Payment as
Percent-age of Payroll
FS 30-YEAR AMORTIZATION 06/30/08 28 $(4,545,366) $(272,954) $(4,614,298) $(281,825) $(4,679,364) $(290,984) (0.579%)
(GAIN)/LOSS 06/30/08 30 $72,928,712 $4,379,440 $74,034,710 $4,445,857 $75,157,481 $4,513,280 8.988%
ASSUMPTION CHANGE 06/30/09 19 $9,320,329 $(684,408) $10,753,088 $812,193 $10,743,374 $838,589 1.670%
SPECIAL (GAIN)/LOSS 06/30/09 29 $10,513,694 $0 $11,328,506 $680,288 $11,500,308 $702,397 1.399%
SPECIAL (GAIN)/LOSS 06/30/10 30 $(1,673,162) $0 $(1,802,832) $0 $(1,942,552) $(116,652) (0.232%)
PAYMENT (GAIN)/LOSS 06/30/10 30 $255,538 $(132,451) $412,829 $(261,149) $715,903 $42,991 0.086%
TOTAL $86,799,745 $3,289,627 $90,112,003 $5,395,364 $91,495,150 $5,689,621 11.331%
The special (gain)/loss bases were established using the temporary modification recognized in the 2009, 2010 and 2011 annual valuations. Unlike the gain/loss occurring in previous and subsequent years, the gain/loss recognized in the 2009, 2010, and 2011 annual valuations will be amortized over fixed and declining 30 year periods so that these annual gain/losses will be fully paid off in 30 years.

CALPERS ACTUARIAL VALUATION - June 30, 2010 SAFETY POLICE PLAN OF THE CITY OF ANAHEIM EMPLOYER NUMBER 303
Page 14
Reconciliation of Required Employer Contributions
Percentage
of Projected
Payroll
Estimated $ Based on Projected
Payroll
1. Contribution for 7/1/11 – 6/30/12 (from prior year annual report) 30.623% $ 15,512,210
2. Effect of changes since the prior year annual valuation
a) Effect of unexpected changes in demographics and financial results 0.237% 119,087
b) Effect of plan changes 0.000% 0
c) Effect of changes in Assumptions 0.000% 0
d) Effect of change in payroll - (135,434)
e) Effect of elimination of amortization base 0.000% 0
f) Effect of changes due to Fresh Start 0.000% 0
g) Net effect of the changes above [Sum of (a) through (f)] 0.237% (16,347)
3. Contribution for 7/1/12 – 6/30/13 [(1)+(2g)] 30.860% 15,495,863
The contribution actually paid (item 1) may be different if a prepayment of unfunded actuarial liability is made or a plan change became effective after the prior year’s actuarial valuation was performed.

CALPERS ACTUARIAL VALUATION - June 30, 2010 SAFETY POLICE PLAN OF THE CITY OF ANAHEIM EMPLOYER NUMBER 303
Page 15
Employer Contribution Rate History
The table below provides a recent history of the employer contribution rates for your plan, as determined by the annual actuarial valuation. It does not account for prepayments or benefit changes made in the middle of the year.
Required By Valuation
Fiscal Year
Employer Normal Cost Unfunded Rate
Total Employer Contribution Rate
2008 - 2009 15.495% 8.735% 24.230%
2009 - 2010 17.952% 8.416% 26.368%
2010 - 2011 18.041% 8.472% 26.513%
2011 - 2012 19.430% 11.193% 30.623%
2012 - 2013 19.529% 11.331% 30.860%
Funding History
The Funding History below shows the recent history of the actuarial accrued liability, the market value of assets, the actuarial value of assets, funded ratios and the annual covered payroll. The Actuarial Value of Assets is used to establish funding requirements and the funded ratio on this basis represents the progress toward fully funding future benefits for current plan participants. The funded ratio based on the Market Value of Assets is an indicator of the short-term solvency of the plan.
funding_history Valuation
Date
Accrued Liability
Actuarial Value of
Assets (AVA)
Market Value of
Assets (MVA)
Funded Ratio
AVA MVA
Annual Covered Payroll
06/30/06 $ 392,350,281 $ 336,967,042 $ 358,053,072 85.9% 91.3% $ 35,806,541
06/30/07 425,138,505 366,663,174 426,005,130 86.2% 100.2% 40,322,739
06/30/08 457,588,313 392,205,533 400,946,587 85.7% 87.6% 44,223,550
06/30/09 496,422,604 411,137,205 300,534,232 82.8% 60.5% 46,021,500
06/30/10 519,062,115 432,262,370 339,672,985 83.3% 65.4% 45,619,701


SUMMARY OF ASSETS
RECONCILIATION OF THE MARKET VALUE OF ASSETS
DEVELOPMENT OF THE ACTUARIAL VALUE OF ASSETS
ASSET ALLOCATION
CALPERS HISTORY OF INVESTMENT RETURNS


CALPERS ACTUARIAL VALUATION - June 30, 2010 SAFETY POLICE PLAN OF THE CITY OF ANAHEIM EMPLOYER NUMBER 303
Page 19
Reconciliation of the Market Value of Assets
1. Market Value of Assets as of 6/30/09 Including Receivables $ 300,534,232
2. Receivables for Service Buybacks as of 6/30/09 801,918
3. Market Value of Assets as of 6/30/09 299,732,314
4. Employer Contributions 12,206,252
5. Employee Contributions 5,867,134
6. Benefit Payments to Retirees and Beneficiaries (21,749,447)
7. Refunds (139,796)
8. Lump Sum Payments 0
9. Transfers and Miscellaneous Adjustments (15,160)
10. Investment Return 43,055,363
11. Market Value of Assets as of 6/30/10 $ 338,956,661
12. Receivables for Service Buybacks as of 6/30/10 716,324
13. Market Value of Assets as of 6/30/10 Including Receivables $ 339,672,985
Development of the Actuarial Value of Assets
1. Actuarial Value of Assets as of 6/30/09 Used For Rate Setting Purposes $ 411,137,205
2. Receivables for Service Buybacks as of 6/30/09 801,918
3. Actuarial Value of Assets as of 6/30/09 410,335,287
4. Employer Contributions 12,206,252
5. Employee Contributions 5,867,134
6. Benefit Payments to Retirees and Beneficiaries (21,749,447)
7. Refunds (139,796)
8. Lump Sum Payments 0
9. Transfers and Miscellaneous Adjustments (15,160)
10. Expected Investment Income at 7.75%
31,655,303
11. Expected Actuarial Value of Assets $ 438,159,573
12. Market Value of Assets as of 6/30/10 $ 338,956,661
13. Preliminary Actuarial Value of Assets [(11) + ((12) – (11)) / 15] 431,546,046
14. Maximum Actuarial Value of Assets (130% of (12)) 440,643,659
15. Minimum Actuarial Value of Assets (70% of (12)) 237,269,663
16. Actuarial Value of Assets {Lesser of [(14), Greater of ((13), (15))]} 431,546,046
17. Actuarial Value to Market Value Ratio 127.3%
18. Receivables for Service Buybacks as of 6/30/10 716,324
19. Actuarial Value of Assets as of 6/30/10 Used for Rate Setting Purposes $ 432,262,370
CALPERS ACTUARIAL VALUATION - June 30, 2010 SAFETY POLICE PLAN OF THE CITY OF ANAHEIM EMPLOYER NUMBER 303
Page 20
Asset Allocation
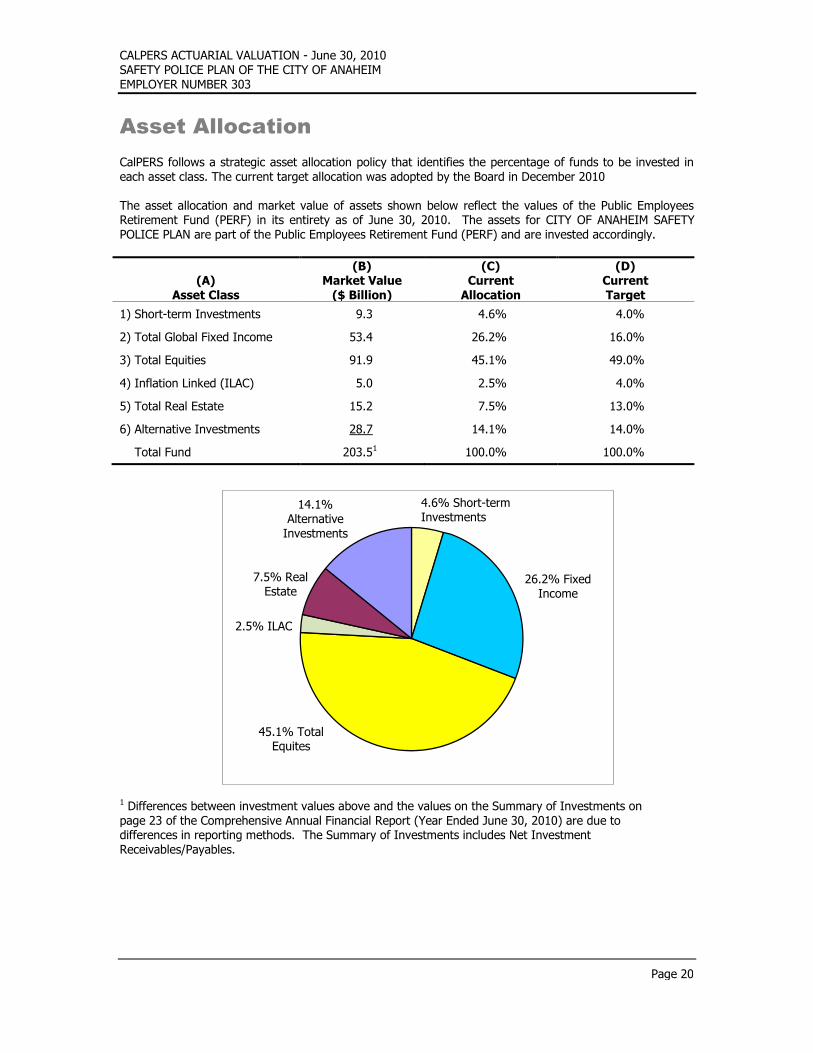
CalPERS follows a strategic asset allocation policy that identifies the percentage of funds to be invested in each asset class. The current target allocation was adopted by the Board in December 2010 The asset allocation and market value of assets shown below reflect the values of the Public Employees Retirement Fund (PERF) in its entirety as of June 30, 2010. The assets for CITY OF ANAHEIM SAFETY POLICE PLAN are part of the Public Employees Retirement Fund (PERF) and are invested accordingly.
(A) Asset Class
(B) Market Value
($ Billion)
(C) Current
Allocation
(D) Current Target
1) Short-term Investments 9.3 4.6% 4.0%
2) Total Global Fixed Income 53.4 26.2% 16.0%
3) Total Equities 91.9 45.1% 49.0%
4) Inflation Linked (ILAC) 5.0 2.5% 4.0%
5) Total Real Estate 15.2 7.5% 13.0%
6) Alternative Investments 28.7 14.1% 14.0%
Total Fund 203.51 100.0% 100.0%
1 Differences between investment values above and the values on the Summary of Investments on page 23 of the Comprehensive Annual Financial Report (Year Ended June 30, 2010) are due to differences in reporting methods. The Summary of Investments includes Net Investment Receivables/Payables.
26.2% Fixed Income
45.1% Total Equites
14.1% Alternative
Investments
7.5% Real Estate
2.5% ILAC
4.6% Short-term Investments

CALPERS ACTUARIAL VALUATION - June 30, 2010 SAFETY POLICE PLAN OF THE CITY OF ANAHEIM EMPLOYER NUMBER 303
Page 21
CalPERS 20-Year History of Investment Returns
The following is a chart with historical annual returns of the Public Employees Retirement Fund for each fiscal year ending on June 30. Beginning with June 30, 2002 the figures are reported as gross of fees.


SUMMARY OF PARTICIPANT DATA
SUMMARY OF VALUATION DATA
ACTIVE MEMBERS
TRANSFERRED AND TERMINATED MEMBERS
RETIRED MEMBERS AND BENEFICIARIES

CALPERS ACTUARIAL VALUATION - June 30, 2010 SAFETY POLICE PLAN OF THE CITY OF ANAHEIM EMPLOYER NUMBER 303
Page 25
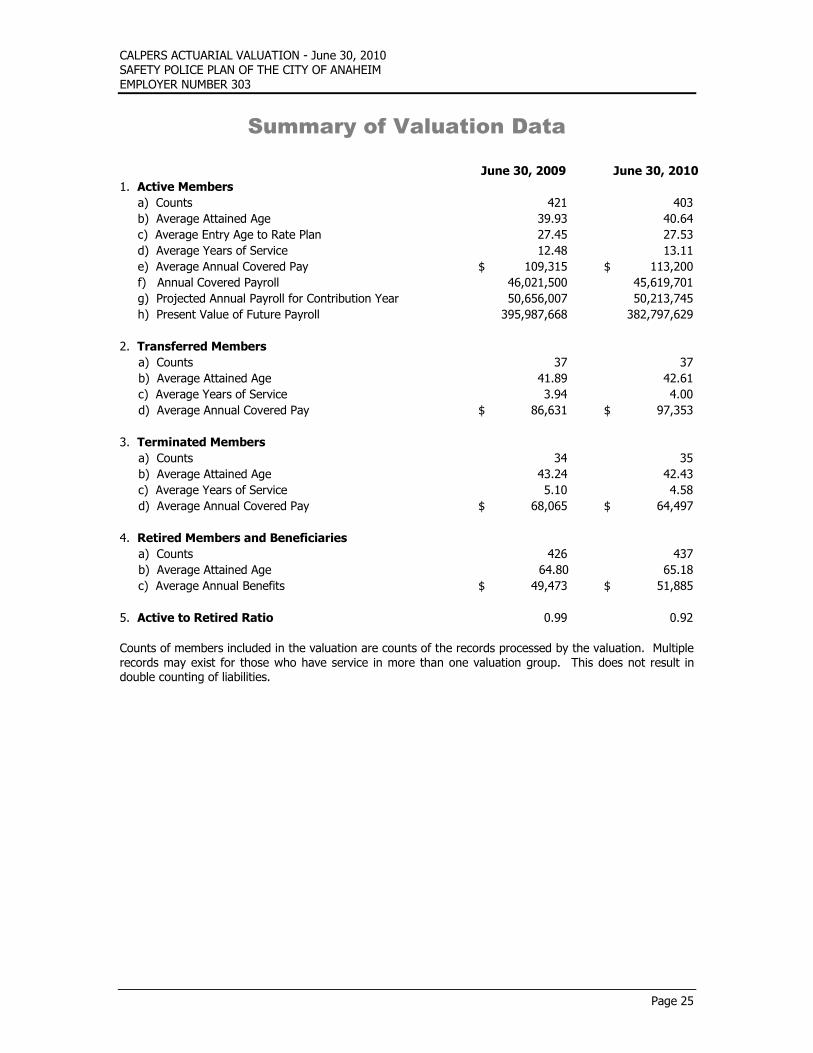
Summary of Valuation Data
June 30, 2009 June 30, 2010
1. Active Members
a) Counts 421 403
b) Average Attained Age
39.93 40.64
c) Average Entry Age to Rate Plan 27.45 27.53
d) Average Years of Service 12.48 13.11
e) Average Annual Covered Pay $ 109,315 $ 113,200
f) Annual Covered Payroll 46,021,500 45,619,701
g) Projected Annual Payroll for Contribution Year 50,656,007 50,213,745
h) Present Value of Future Payroll 395,987,668 382,797,629
2. Transferred Members
a) Counts 37 37
b) Average Attained Age 41.89 42.61
c) Average Years of Service 3.94 4.00
d) Average Annual Covered Pay $ 86,631 $ 97,353
3. Terminated Members
a) Counts 34 35
b) Average Attained Age 43.24 42.43
c) Average Years of Service 5.10 4.58
d) Average Annual Covered Pay $ 68,065 $ 64,497
4. Retired Members and Beneficiaries
a) Counts 426 437
b) Average Attained Age 64.80 65.18
c) Average Annual Benefits $ 49,473 $ 51,885
5. Active to Retired Ratio 0.99 0.92
Counts of members included in the valuation are counts of the records processed by the valuation. Multiple records may exist for those who have service in more than one valuation group. This does not result in double counting of liabilities.

CALPERS ACTUARIAL VALUATION - June 30, 2010 SAFETY POLICE PLAN OF THE CITY OF ANAHEIM EMPLOYER NUMBER 303
Page 26
Active Members
Counts of members included in the valuation are counts of the records processed by the valuation. Multiple records may exist for those who have service in more than one valuation group. This does not result in double counting of liabilities
Distribution of Active Members by Age and Service
Years of Service at Valuation Date
Attained Age 0-4 5-9 10-14 15-19 20-25 25+ Total
15-24 5 0 0 0 0 0 5
25-29 24 11 0 0 0 0 35
30-34 22 30 13 0 0 0 65
35-39 16 28 26 22 0 0 92
40-44 7 12 26 34 6 0 85
45-49 0 1 13 25 21 3 63
50-54 1 1 5 9 16 16 48
55-59 0 0 1 1 0 6 8
60-64 0 1 0 0 0 1 2
65 and over 0 0 0 0 0 0 0
All Ages 75 84 84 91 43 26 403
Distribution of Average Annual Salaries by Age and Service
Years of Service at Valuation Date
Attained Age 0-4 5-9 10-14 15-19 20-25 25+ Average
15-24 $75,605 $0 $0 $0 $0 $0 $75,605
25-29 93,051 102,871 0 0 0 0 96,137
30-34 99,805 109,415 113,195 0 0 0 106,919
35-39 106,175 104,373 111,680 116,094 0 0 109,554
40-44 108,879 109,277 112,808 122,516 119,155 0 116,317
45-49 0 107,243 114,260 119,008 122,855 111,327 118,758
50-54 105,331 126,350 90,891 125,509 130,216 139,177 127,625
55-59 0 0 82,081 114,140 0 130,204 122,180
60-64 0 242,694 0 0 0 133,318 188,006
65 and over 0 0 0 0 0 0 0
All Ages $98,310 $108,620 $111,073 $120,204 $125,078 $133,667 $113,200

CALPERS ACTUARIAL VALUATION - June 30, 2010 SAFETY POLICE PLAN OF THE CITY OF ANAHEIM EMPLOYER NUMBER 303
Page 27
Transferred and Terminated Members
Distribution of Transfers to Other CalPERS Plans by Age and Service
Years of Service at Valuation Date
Attained Age 0-4 5-9 10-14 15-19 20-25 25+ Total
Average Salary
15-24 0 0 0 0 0 0 0 $0
25-29 5 0 0 0 0 0 5 75,718
30-34 1 1 0 0 0 0 2 79,323
35-39 10 0 0 0 0 0 10 95,993
40-44 5 1 1 0 0 0 7 98,664
45-49 2 2 1 0 0 0 5 94,726
50-54 3 0 0 0 0 0 3 94,819
55-59 0 0 1 0 1 0 2 97,863
60-64 1 0 0 0 0 0 1 112,132
65 and over 1 0 1 0 0 0 2 174,151
All Ages 28 4 4 0 1 0 37 97,353
Distribution of Terminated Participants with Funds on Deposit by Age and Service
Years of Service at Valuation Date
Attained Age 0-4 5-9 10-14 15-19 20-25 25+ Total
Average Salary
15-24 0 0 0 0 0 0 0 $0
25-29 3 1 0 0 0 0 4 70,401
30-34 4 0 0 0 0 0 4 61,696
35-39 2 1 0 0 0 0 3 51,286
40-44 6 4 1 0 0 0 11 72,464
45-49 3 3 2 1 0 0 9 58,661
50-54 0 1 0 0 0 0 1 70,121
55-59 0 2 0 0 0 0 2 71,910
60-64 0 0 0 0 0 0 0 0
65 and over 1 0 0 0 0 0 1 36,151
All Ages 19 12 3 1 0 0 35 64,497

CALPERS ACTUARIAL VALUATION - June 30, 2010 SAFETY POLICE PLAN OF THE CITY OF ANAHEIM EMPLOYER NUMBER 303
Page 28
Retired Members and Beneficiaries
Distribution of Retirees and Beneficiaries by Age and Retirement Type*
Attained Age
Service Retirement
Non-Industrial Disability
Industrial Disability
Non-Industrial
Death Industrial
Death
Death After
Retirement Total
Under 30 0 0 0 0 0 0 0
30-34 0 0 0 0 0 0 0
35-39 0 0 0 0 0 0 0
40-44 0 0 0 0 0 0 0
45-49 0 0 2 0 1 2 5
50-54 36 0 7 0 0 2 45
55-59 82 0 8 0 1 1 92
60-64 66 1 11 1 0 5 84
65-69 58 0 14 2 0 11 85
70-74 33 2 13 0 0 13 61
75-79 22 1 9 1 0 6 39
80-84 9 0 3 0 0 6 18
85 and Over 3 0 1 0 0 3 7
All Ages 309 4 68 4 2 49 436
Distribution of Average Annual Amounts for Retirees and Beneficiaries by Age
and Retirement Type*
Attained Age
Service Retirement
Non-Industrial Disability
Industrial Disability
Non-Industrial
Death Industrial
Death
Death After
Retirement Average
Under 30 $0 $0 $0 $0 $0 $0 $0
30-34 0 0 0 0 0 0 0
35-39 0 0 0 0 0 0 0
40-44 0 0 0 0 0 0 0
45-49 0 0 22,008 0 59,490 52,675 41,771
50-54 86,099 0 36,706 0 0 6,377 74,872
55-59 73,178 0 29,475 0 32,189 14,689 68,297
60-64 60,747 19,309 26,088 80,560 0 29,146 54,070
65-69 47,681 0 31,429 34,445 0 40,610 43,778
70-74 48,472 11,776 37,600 0 0 28,745 40,748
75-79 40,575 19,340 29,827 21,784 0 18,424 33,660
80-84 31,981 0 29,631 0 0 24,985 29,258
85 and Over 45,109 0 23,298 0 0 14,345 28,809
All Ages $60,810 $15,550 $31,370 $42,808 $45,840 $28,621 $51,952

CALPERS ACTUARIAL VALUATION - June 30, 2010 SAFETY POLICE PLAN OF THE CITY OF ANAHEIM EMPLOYER NUMBER 303
Page 29
Retired Members and Beneficiaries (continued)
Distribution of Retirees and Beneficiaries by Years Retired and Retirement Type*
Years Retired
Service Retirement
Non-Industrial Disability
Industrial Disability
Non-Industrial
Death Industrial
Death
Death After
Retirement Total
Under 5 Yrs 81 0 5 0 0 24 110
5-9 107 0 7 0 0 8 122
10-14 52 1 4 1 0 7 65
15-19 36 0 7 2 0 3 48
20-24 15 0 5 0 2 0 22
25-29 14 1 12 1 0 2 30
30 and Over 4 2 28 0 0 5 39
All Years 309 4 68 4 2 49 436
Distribution of Average Annual Amounts for Retirees and Beneficiaries by Years Retired and Retirement Type*
Years Retired
Service Retirement
Non-Industrial Disability
Industrial Disability
Non-Industrial
Death Industrial
Death
Death After
Retirement Average
Under 5 Yrs $71,535 $0 $30,555 $0 $0 $36,926 $62,122
5-9 70,914 0 44,841 0 0 28,676 66,648
10-14 49,297 19,309 56,598 80,560 0 20,267 46,639
15-19 44,398 0 33,326 34,445 0 14,073 40,473
20-24 47,467 0 39,186 0 45,840 0 45,437
25-29 27,780 16,286 24,352 21,784 0 20,048 25,310
30 and Over 36,387 13,303 25,667 0 0 12,520 24,447
All Years $60,810 $15,550 $31,370 $42,808 $45,840 $28,621 $51,952
* Counts of members do not include alternate payees receiving benefits while the member is still working. Therefore, the total counts may not match information on page 25 of the report. Multiple records may exist for those who have service in more than one coverage group. This does not result in double counting of liabilities.


APPENDICES
APPENDIX A - STATEMENT OF ACTUARIAL DATA, METHODS AND
ASSUMPTIONS
APPENDIX B - SUMMARY OF PRINCIPAL PLAN PROVISIONS
APPENDIX C - GASB STATEMENT NO. 27
APPENDIX D – INVESTMENT RETURN SENSITIVITY ANALYSIS
APPENDIX E – GLOSSARY OF ACTUARIAL TERMS


APPENDIX A
STATEMENT OF ACTUARIAL DATA, METHODS AND ASSUMPTIONS


CALPERS ACTUARIAL VALUATION – June 30, 2010 APPENDIX A STATEMENT OF ACTUARIAL METHODS AND ASSUMPTIONS
A-1
Actuarial Data
As stated in the Actuarial Certification, the data which serves as the basis of this valuation has been obtained from the various CalPERS databases. We have reviewed the valuation data and believe that it is reasonable and appropriate in aggregate. We are unaware of any potential data issues that would have a material effect on the results of this valuation, except that data does not always contain the latest salary information for former members now in reciprocal systems and does not recognize the potential for unusually large salary deviation in certain cases such as elected officials. Therefore, salary information in these cases may not be accurate. These situations are relatively infrequent, however, and when they do occur, they generally do not have a material impact on the employer contribution rates.
Actuarial Methods
Funding Method
The actuarial funding method used for the Retirement Program is the Entry Age Normal Cost Method. Under this method, projected benefits are determined for all members and the associated liabilities are spread in a manner that produces level annual cost as a percent of pay in each year from the age of hire (entry age) to the assumed retirement age. The cost allocated to the current fiscal year is called the normal cost. The actuarial accrued liability for active members is then calculated as the portion of the total cost of the plan allocated to prior years. The actuarial accrued liability for members currently receiving benefits, for active members beyond the assumed retirement age, and for members entitled to deferred benefits, is equal to the present value of the benefits expected to be paid. No normal costs are applicable for these participants. The excess of the total actuarial accrued liability over the actuarial value of plan assets is called the unfunded actuarial accrued liability. Funding requirements are determined by adding the normal cost and an amortization of the unfunded liability as a level percentage of assumed future payrolls. All changes in liability due to plan amendments, changes in actuarial assumptions, or changes in actuarial methodology are amortized separately over a 20-year period. All gains or losses are tracked and amortized over a rolling 30-year period with the exception of special gains and losses in fiscal years 2008-2009, 2009-2010 and 2010-2011. Each of these years’ gains or losses will be isolated and amortized over fixed and declining 30 year periods (as opposed to the current rolling 30 year amortization). If a plan’s accrued liability exceeds the actuarial value of assets, the annual contribution with respect to the total unfunded liability may not be less than the amount produced by a 30-year amortization of the unfunded liability. Additional contributions will be required for any plan or pool if their cash flows hamper adequate funding progress by preventing the expected funded status on a market value of assets basis of the plan to either:
Increase by at least 15% by June 30, 2043; or Reach a level of 75% funded by June 30, 2043
The necessary additional contribution will be obtained by changing the amortization period of the gains and losses prior to 2009 to a period which will result in the satisfaction of the above criteria. CalPERS actuaries
will reassess the criteria above when performing each future valuation to determine whether or not additional contributions are necessary. An exception to the funding rules above is used whenever the application of such rules results in inconsistencies. In these cases a “fresh start” approach is used. This simply means that the current unfunded actuarial liability is projected and amortized over a set number of years. As mentioned above, if the annual contribution on the total unfunded liability was less than the amount produced by a 30-year amortization of the unfunded liability, the plan actuary would implement a 30-year fresh start. However, in the case of a 30-year fresh start, just the unfunded liability not already in the (gain)/loss base (which already is amortized over 30 years) will go into the new fresh start base. In addition, a fresh start is needed in the following situations:

CALPERS ACTUARIAL VALUATION – June 30, 2010 APPENDIX A STATEMENT OF ACTUARIAL METHODS AND ASSUMPTIONS
A-2
1) when a positive payment would be required on a negative unfunded actuarial liability (or
conversely a negative payment on a positive unfunded actuarial liability); or
2) when there are excess assets, rather than an unfunded liability. In this situation a 30-year fresh start is used, unless a longer fresh start is needed to avoid a negative total rate.
It should be noted that the actuary may choose to use a fresh start under other circumstances. In all cases, the fresh start period is set by the actuary at what he deems appropriate, and will not be less than five years nor greater than 30 years. Asset Valuation Method In order to dampen the effect of short term market value fluctuations on employer contribution rates, the following asset smoothing technique is used. First an Expected Value of Assets is computed by bringing forward the prior year’s Actuarial Value of Assets and the contributions received and benefits paid during the year at the assumed actuarial rate of return. The Actuarial Value of Assets is then computed as the Expected Value of Assets plus one-fifteenth of the difference between the actual Market Value of Assets and
the Expected Value of Assets as of the valuation date. However in no case will the Actuarial Value of Assets be less than 80% or greater than 120% of the actual Market Value of Assets. In June 2009, the CalPERS Board adopted changes to the asset smoothing method in order to phase in over a three year period the impact of the -24% investment loss experienced by CalPERS in fiscal year 2008-2009. The following changes were adopted:
Increase the corridor limits for the actuarial value of assets from 80%-120% of market value to 60%-140% of market value on June 30, 2009
Reduce the corridor limits for the actuarial value of assets to 70%-130% of market value on June 30, 2010
Return to the 80%-120% of market value corridor limits for the actuarial value of assets on June 30, 2011 and thereafter
Miscellaneous
Superfunded Status If a rate plan is superfunded (actuarial value of assets exceeds the present value of benefits), as of the most recently completed annual valuation, the employer may cover their employees’ member contributions (both taxed and tax-deferred) using their employer assets during the fiscal year for which this valuation applies. This would entail transferring assets within the Public Employees’ Retirement Fund (PERF) from the employer account to the member accumulated contribution accounts. This change was implemented effective January 1, 1999 pursuant to Chapter 231 (Assembly Bill 2099) which added Government Code Section 20816. Superfunded status applies only to individual plans, not risk pools. For rate plans within a risk pool, actuarial value of assets is the sum of the rate plan’s side fund plus the rate plan’s pro-rata share of non-side fund assets.
Internal Revenue Code Section 415 The limitations on benefits imposed by Internal Revenue Code Section 415 were not taken into account in this valuation. The effect of these limitations has been deemed immaterial on the overall results. Internal Revenue Code Section 401(a)(17) The limitations on compensation imposed by Internal Revenue Code Section 401(a)(17) were taken into account in this valuation. Each year the impact of any changes in this compensation limitation since the prior valuation is included and amortized as part of the actuarial gain or loss base.

CALPERS ACTUARIAL VALUATION – June 30, 2010 APPENDIX A STATEMENT OF ACTUARIAL METHODS AND ASSUMPTIONS
A-3
Actuarial Assumptions
Economic Assumptions
Investment Return 7.75% compounded annually (net of expenses). This assumption is used for all plans.
Salary Growth Annual increases vary by category, entry age, and duration of service. Sample assumed increases are shown below.
Public Agency Miscellaneous
Duration of Service Entry Age 20 Entry Age 30 Entry Age 40
0 0.1445 0.1265 0.1005
1 0.1215 0.1075 0.0875
2 0.1035 0.0935 0.0775
3 0.0905 0.0825 0.0695
4 0.0805 0.0735 0.0635
5 0.0725 0.0675 0.0585
10 0.0505 0.0485 0.0435
15 0.0455 0.0435 0.0385
20 0.0415 0.0395 0.0355
25 0.0385 0.0385 0.0355
30 0.0385 0.0385 0.0355
Public Agency Fire
Duration of Service Entry Age 20 Entry Age 30 Entry Age 40
0 0.1075 0.1075 0.1045
1 0.0975 0.0965 0.0875
2 0.0895 0.0855 0.0725
3 0.0825 0.0775 0.0625
4 0.0765 0.0705 0.0535
5 0.0715 0.0645 0.0475
10 0.0535 0.0485 0.0375
15 0.0435 0.0415 0.0365
20 0.0395 0.0385 0.0355
25 0.0375 0.0375 0.0355
30 0.0375 0.0375 0.0355
Public Agency Police
Duration of Service Entry Age 20 Entry Age 30 Entry Age 40
0 0.1115 0.1115 0.1115
1 0.0955 0.0955 0.0955
2 0.0835 0.0835 0.0805
3 0.0745 0.0725 0.0665
4 0.0675 0.0635 0.0575
5 0.0615 0.0575 0.0505
10 0.0475 0.0445 0.0365
15 0.0435 0.0415 0.0355
20 0.0395 0.0385 0.0355
25 0.0375 0.0365 0.0355
30 0.0375 0.0365 0.0355

CALPERS ACTUARIAL VALUATION – June 30, 2010 APPENDIX A STATEMENT OF ACTUARIAL METHODS AND ASSUMPTIONS
A-4
Public Agency County Peace Officers
Duration of Service Entry Age 20 Entry Age 30 Entry Age 40
0 0.1315 0.1315 0.1315
1 0.1115 0.1085 0.1055
2 0.0965 0.0915 0.0865
3 0.0845 0.0795 0.0735
4 0.0755 0.0695 0.0635
5 0.0685 0.0625 0.0555
10 0.0485 0.0445 0.0405
15 0.0435 0.0405 0.0385 20 0.0395 0.0385 0.0365
25 0.0375 0.0365 0.0355
30 0.0375 0.0365 0.0355
The Miscellaneous salary scale is used for Local Prosecutors. The Police salary scale is used for Other Safety, Local Sheriff, and School Police.
Overall Payroll Growth
3.25% compounded annually (used in projecting the payroll over which the unfunded liability is amortized). This assumption is used for all plans.
Inflation 3.00% compounded annually. This assumption is used for all plans.
Non-valued Potential Additional Liabilities The potential liability loss for a cost-of-living increase exceeding the 3% inflation assumption, and any potential liability loss from future member service purchases are not reflected in the valuation.
Miscellaneous Loading Factors
Credit for Unused Sick Leave Final Average Salary is increased by 1% for those plans with the provision providing Credit for Unused Sick Leave.
Conversion of Employer Paid Member Contributions (EPMC) Final Average Salary is increased by the Employee Contribution Rate for those plans with the provision providing for the Conversion of Employer Paid Member Contributions (EPMC) during the final compensation period.
Norris Decision (Best Factors) Employees hired prior to July 1, 1982 have projected benefit amounts increased in order to reflect the use of “Best Factors” in the calculation of optional benefit forms. This is due to a 1983 Supreme Court decision, known as the Norris decision, which required males and females to be treated equally in the determination of benefit amounts. Consequently, anyone already employed at that time is given the best possible conversion factor when optional benefits are determined. No loading is necessary for employees hired after July 1, 1982.

CALPERS ACTUARIAL VALUATION – June 30, 2010 APPENDIX A STATEMENT OF ACTUARIAL METHODS AND ASSUMPTIONS
A-5
Demographic Assumptions
Pre-Retirement Mortality Non-Industrial Death Rates vary by age and gender. Industrial Death rates vary by age. See sample rates in table below. The non-industrial death rates are used for all plans. The industrial death rates are used for Safety Plans (except for Local Prosecutor safety members where the corresponding Miscellaneous Plan does not have the Industrial Death Benefit).
Non-Industrial Death Industrial Death (Not Job-Related) (Job-Related)
Age Male Female Male and Female
20 0.00047 0.00016 0.00003 25 0.00050 0.00026 0.00007 30 0.00053 0.00036 0.00010 35 0.00067 0.00046 0.00012 40 0.00087 0.00065 0.00013 45 0.00120 0.00093 0.00014 50 0.00176 0.00126 0.00015 55 0.00260 0.00176 0.00016 60 0.00395 0.00266 0.00017 65 0.00608 0.00419 0.00018 70 0.00914 0.00649 0.00019 75 0.01220 0.00878 0.00020 80 0.01527 0.01108 0.00021
Miscellaneous Plans usually have Industrial Death rates set to zero unless the agency has specifically contracted for Industrial Death benefits. If so, each Non-Industrial Death rate shown above will be split into two components: 99% will become the Non-Industrial Death rate and 1% will become the Industrial Death rate.
Post-Retirement Mortality Rates vary by age, type of retirement and gender. See sample rates in table below. These rates are used for all plans.
Healthy Recipients
Non-Industrially Disabled Industrially Disabled (Not Job-Related) (Job-Related)
Age Male Female Male Female Male Female
50 0.00239 0.00125 0.01632 0.01245 0.00443 0.00356 55 0.00474 0.00243 0.01936 0.01580 0.00563 0.00546 60 0.00720 0.00431 0.02293 0.01628 0.00777 0.00798 65 0.01069 0.00775 0.03174 0.01969 0.01388 0.01184 70 0.01675 0.01244 0.03870 0.03019 0.02236 0.01716 75 0.03080 0.02071 0.06001 0.03915 0.03585 0.02665 80 0.05270 0.03749 0.08388 0.05555 0.06926 0.04528 85 0.09775 0.07005 0.14035 0.09577 0.11799 0.08017 90 0.16747 0.12404 0.21554 0.14949 0.16575 0.13775 95 0.25659 0.21556 0.31025 0.23055 0.26108 0.23331 100 0.34551 0.31876 0.45905 0.37662 0.40918 0.35165
105 0.58527 0.56093 0.67923 0.61523 0.64127 0.60135 110 1.00000 1.00000 1.00000 1.00000 1.00000 1.00000

CALPERS ACTUARIAL VALUATION – June 30, 2010 APPENDIX A STATEMENT OF ACTUARIAL METHODS AND ASSUMPTIONS
A-6
Marital Status
For active members, a percentage married upon retirement is assumed according to the following table.
Member Category Percent Married
Miscellaneous Member 85% Local Police 90% Local Fire 90% Other Local Safety 90% School Police 90%
Age of Spouse
It is assumed that female spouses are 3 years younger than male spouses. This assumption is used for all plans.
Terminated Members It is assumed that terminated members refund immediately if non-vested. Terminated members who are vested are assumed to follow the same service retirement pattern as active members but with a load to reflect the expected higher rates of retirement, especially at lower ages. The following table shows the load factors that are applied to the service retirement assumption for active members to obtain the service retirement pattern for separated vested members:
Age Load Factor
50 450% 51 250%
52 through 56 200% 57 through 60 150% 61 through 64 125% 65 and above 100% (no change)
Termination with Refund
Rates vary by entry age and service for Miscellaneous Plans. Rates vary by service for Safety Plans. See sample rates in tables below.
Public Agency Miscellaneous
Duration of
Service Entry Age 20 Entry Age 25 Entry Age 30 Entry Age 35 Entry Age 40 Entry Age 45
0 0.1742 0.1674 0.1606 0.1537 0.1468 0.1400
1 0.1545 0.1477 0.1409 0.1339 0.1271 0.1203
2 0.1348 0.1280 0.1212 0.1142 0.1074 0.1006
3 0.1151 0.1083 0.1015 0.0945 0.0877 0.0809
4 0.0954 0.0886 0.0818 0.0748 0.0680 0.0612
5 0.0212 0.0193 0.0174 0.0155 0.0136 0.0116
10 0.0138 0.0121 0.0104 0.0088 0.0071 0.0055
15 0.0060 0.0051 0.0042 0.0032 0.0023 0.0014
20 0.0037 0.0029 0.0021 0.0013 0.0005 0.0001
25 0.0017 0.0011 0.0005 0.0001 0.0001 0.0001
30 0.0005 0.0001 0.0001 0.0001 0.0001 0.0001
35 0.0001 0.0001 0.0001 0.0001 0.0001 0.0001

CALPERS ACTUARIAL VALUATION – June 30, 2010 APPENDIX A STATEMENT OF ACTUARIAL METHODS AND ASSUMPTIONS
A-7
Public Agency Safety
Duration of Service Fire Police County Peace Officer
0 0.0710 0.1013 0.0997
1 0.0554 0.0636 0.0782
2 0.0398 0.0271 0.0566
3 0.0242 0.0258 0.0437
4 0.0218 0.0245 0.0414
5 0.0029 0.0086 0.0145
10 0.0009 0.0053 0.0089
15 0.0006 0.0027 0.0045
20 0.0005 0.0017 0.0020
25 0.0003 0.0012 0.0009
30 0.0003 0.0009 0.0006
35 0.0003 0.0009 0.0006
The Police Termination and Refund rates are used for Public Agency Local Prosecutors, Other Safety, Local Sheriff, and School Police.
Termination with Vested Benefits
Rates vary by entry age and service for Miscellaneous Plans. Rates vary by service for Safety Plans. See sample rates in tables below.
Public Agency Miscellaneous
Duration of Service Entry Age 20 Entry Age 25 Entry Age 30 Entry Age 35 Entry Age 40
5 0.0656 0.0597 0.0537 0.0477 0.0418
10 0.0530 0.0466 0.0403 0.0339 0.0000
15 0.0443 0.0373 0.0305 0.0000 0.0000
20 0.0333 0.0261 0.0000 0.0000 0.0000
25 0.0212 0.0000 0.0000 0.0000 0.0000
30 0.0000 0.0000 0.0000 0.0000 0.0000
35 0.0000 0.0000 0.0000 0.0000 0.0000
Public Agency Safety
Duration of
Service Fire Police
County Peace
Officer
5 0.0162 0.0163 0.0265
10 0.0061 0.0126 0.0204
15 0.0058 0.0082 0.0130
20 0.0053 0.0065 0.0074
25 0.0047 0.0058 0.0043
30 0.0045 0.0056 0.0030
35 0.0000 0.0000 0.0000
When a member is eligible to retire, the termination with vested benefits probability is set to zero.
After termination with vested benefits, a miscellaneous member is assumed to retire at age 59 and a safety member at age 54.
The Police Termination with vested benefits rates are used for Public Agency Local Prosecutors, Other Safety, Local Sheriff, and School Police.

CALPERS ACTUARIAL VALUATION – June 30, 2010 APPENDIX A STATEMENT OF ACTUARIAL METHODS AND ASSUMPTIONS
A-8
Non-Industrial (Not Job-Related) Disability
Rates vary by age and gender for Miscellaneous Plans.
Rates vary by age and category for Safety Plans.
Miscellaneous Fire Police County Peace Officer
Age Male Female Male and Female Male and Female Male and Female
20 0.0001 0.0001 0.0001 0.0001 0.0001
25 0.0001 0.0001 0.0001 0.0001 0.0001
30 0.0002 0.0002 0.0001 0.0002 0.0001
35 0.0006 0.0009 0.0001 0.0003 0.0004
40 0.0015 0.0016 0.0001 0.0004 0.0007
45 0.0025 0.0024 0.0002 0.0005 0.0013
50 0.0033 0.0031 0.0005 0.0008 0.0018
55 0.0037 0.0031 0.0010 0.0013 0.0010
60 0.0038 0.0025 0.0015 0.0020 0.0006
The Miscellaneous Non-Industrial Disability rates are used for Local Prosecutors. The Police Non-Industrial Disability rates are used for Other Safety, Local Sheriff, and School
Police.
Industrial (Job-Related) Disability Rates vary by age and category.
Age Fire Police County Peace Officer
20 0.0002 0.0007 0.0003
25 0.0012 0.0032 0.0015
30 0.0025 0.0064 0.0031
35 0.0037 0.0097 0.0046
40 0.0049 0.0129 0.0063
45 0.0061 0.0161 0.0078
50 0.0074 0.0192 0.0101
55 0.0721 0.0668 0.0173
60 0.0721 0.0668 0.0173
The Police Industrial Disability rates are used for Local Sheriff and Other Safety. Fifty Percent of the Police Industrial Disability rates are used for School Police. One Percent of the Police Industrial Disability rates are used for Local Prosecutors. Normally, rates are zero for Miscellaneous Plans unless the agency has specifically contracted
for Industrial Disability benefits. If so, each miscellaneous non-industrial disability rate will be split into two components: 50% will become the Non-Industrial Disability rate and 50% will become the Industrial Disability rate.
Service Retirement
Retirement rate vary by age, service, and formula, except for the safety ½ @ 55 and 2% @ 55 formulas, where retirement rates vary by age only.

CALPERS ACTUARIAL VALUATION – June 30, 2010 APPENDIX A STATEMENT OF ACTUARIAL METHODS AND ASSUMPTIONS
A-9
Public Agency Miscellaneous 1.5% @ 65
Duration of Service
Age 5 Years 10 Years 15 Years 20 Years 25 Years 30 Years
50 0.008 0.011 0.013 0.015 0.017 0.019
51 0.007 0.010 0.012 0.013 0.015 0.017
52 0.010 0.014 0.017 0.019 0.021 0.024
53 0.008 0.012 0.015 0.017 0.019 0.022
54 0.012 0.016 0.019 0.022 0.025 0.028
55 0.018 0.025 0.031 0.035 0.038 0.043
56 0.015 0.021 0.025 0.029 0.032 0.036
57 0.020 0.028 0.033 0.038 0.043 0.048
58 0.024 0.033 0.040 0.046 0.052 0.058
59 0.028 0.039 0.048 0.054 0.060 0.067
60 0.049 0.069 0.083 0.094 0.105 0.118
61 0.062 0.087 0.106 0.120 0.133 0.150
62 0.104 0.146 0.177 0.200 0.223 0.251
63 0.099 0.139 0.169 0.191 0.213 0.239
64 0.097 0.136 0.165 0.186 0.209 0.233
65 0.140 0.197 0.240 0.271 0.302 0.339
66 0.092 0.130 0.157 0.177 0.198 0.222
67 0.129 0.181 0.220 0.249 0.277 0.311
68 0.092 0.129 0.156 0.177 0.197 0.221
69 0.092 0.130 0.158 0.178 0.199 0.224
70 0.103 0.144 0.175 0.198 0.221 0.248
Public Agency Miscellaneous 2% @ 60
Duration of Service
Age 5 Years 10 Years 15 Years 20 Years 25 Years 30 Years
50 0.011 0.015 0.018 0.021 0.023 0.026
51 0.009 0.013 0.016 0.018 0.020 0.023
52 0.013 0.018 0.022 0.025 0.028 0.031
53 0.011 0.016 0.019 0.022 0.025 0.028
54 0.015 0.021 0.025 0.028 0.032 0.036
55 0.023 0.032 0.039 0.044 0.049 0.055
56 0.019 0.027 0.032 0.037 0.041 0.046
57 0.025 0.035 0.042 0.048 0.054 0.060
58 0.030 0.042 0.051 0.058 0.065 0.073
59 0.035 0.049 0.060 0.068 0.076 0.085
60 0.062 0.087 0.105 0.119 0.133 0.149
61 0.079 0.110 0.134 0.152 0.169 0.190
62 0.132 0.186 0.225 0.255 0.284 0.319
63 0.126 0.178 0.216 0.244 0.272 0.305
64 0.122 0.171 0.207 0.234 0.262 0.293
65 0.173 0.243 0.296 0.334 0.373 0.418
66 0.114 0.160 0.194 0.219 0.245 0.274
67 0.159 0.223 0.271 0.307 0.342 0.384
68 0.113 0.159 0.193 0.218 0.243 0.273
69 0.114 0.161 0.195 0.220 0.246 0.276
70 0.127 0.178 0.216 0.244 0.273 0.306

CALPERS ACTUARIAL VALUATION – June 30, 2010 APPENDIX A STATEMENT OF ACTUARIAL METHODS AND ASSUMPTIONS
A-10
Public Agency Miscellaneous 2% @ 55
Duration of Service
Age 5 Years 10 Years 15 Years 20 Years 25 Years 30 Years
50 0.015 0.020 0.024 0.029 0.033 0.039
51 0.013 0.016 0.020 0.024 0.027 0.033
52 0.014 0.018 0.022 0.027 0.030 0.036
53 0.017 0.022 0.027 0.032 0.037 0.043
54 0.027 0.034 0.041 0.049 0.056 0.067
55 0.050 0.064 0.078 0.094 0.107 0.127
56 0.045 0.057 0.069 0.083 0.095 0.113
57 0.048 0.061 0.074 0.090 0.102 0.122
58 0.052 0.066 0.080 0.097 0.110 0.131
59 0.060 0.076 0.092 0.111 0.127 0.151
60 0.072 0.092 0.112 0.134 0.153 0.182
61 0.089 0.113 0.137 0.165 0.188 0.224
62 0.128 0.162 0.197 0.237 0.270 0.322
63 0.129 0.164 0.199 0.239 0.273 0.325
64 0.116 0.148 0.180 0.216 0.247 0.294
65 0.174 0.221 0.269 0.323 0.369 0.439
66 0.135 0.171 0.208 0.250 0.285 0.340
67 0.133 0.169 0.206 0.247 0.282 0.336
68 0.118 0.150 0.182 0.219 0.250 0.297
69 0.116 0.147 0.179 0.215 0.246 0.293
70 0.138 0.176 0.214 0.257 0.293 0.349
Public Agency Miscellaneous 2.5% @ 55
Duration of Service
Age 5 Years 10 Years 15 Years 20 Years 25 Years 30 Years
50 0.026 0.033 0.040 0.048 0.055 0.062
51 0.021 0.026 0.032 0.038 0.043 0.049
52 0.021 0.026 0.032 0.038 0.043 0.049
53 0.026 0.033 0.040 0.048 0.055 0.062
54 0.043 0.054 0.066 0.078 0.089 0.101
55 0.088 0.112 0.136 0.160 0.184 0.208
56 0.055 0.070 0.085 0.100 0.115 0.130
57 0.061 0.077 0.094 0.110 0.127 0.143
58 0.072 0.091 0.111 0.130 0.150 0.169
59 0.083 0.105 0.128 0.150 0.173 0.195
60 0.088 0.112 0.136 0.160 0.184 0.208
61 0.083 0.105 0.128 0.150 0.173 0.195
62 0.121 0.154 0.187 0.220 0.253 0.286
63 0.105 0.133 0.162 0.190 0.219 0.247
64 0.105 0.133 0.162 0.190 0.219 0.247
65 0.143 0.182 0.221 0.260 0.299 0.338
66 0.105 0.133 0.162 0.190 0.219 0.247
67 0.105 0.133 0.162 0.190 0.219 0.247
68 0.105 0.133 0.162 0.190 0.219 0.247
69 0.105 0.133 0.162 0.190 0.219 0.247
70 0.125 0.160 0.194 0.228 0.262 0.296

CALPERS ACTUARIAL VALUATION – June 30, 2010 APPENDIX A STATEMENT OF ACTUARIAL METHODS AND ASSUMPTIONS
A-11
Public Agency Miscellaneous 2.7% @ 55
Duration of Service
Age 5 Years 10 Years 15 Years 20 Years 25 Years 30 Years
50 0.028 0.035 0.043 0.050 0.058 0.065
51 0.022 0.028 0.034 0.040 0.046 0.052
52 0.022 0.028 0.034 0.040 0.046 0.052
53 0.028 0.035 0.043 0.050 0.058 0.065
54 0.044 0.056 0.068 0.080 0.092 0.104
55 0.091 0.116 0.140 0.165 0.190 0.215
56 0.061 0.077 0.094 0.110 0.127 0.143
57 0.063 0.081 0.098 0.115 0.132 0.150
58 0.074 0.095 0.115 0.135 0.155 0.176
59 0.083 0.105 0.128 0.150 0.173 0.195
60 0.088 0.112 0.136 0.160 0.184 0.208
61 0.085 0.109 0.132 0.155 0.178 0.202
62 0.124 0.158 0.191 0.225 0.259 0.293
63 0.107 0.137 0.166 0.195 0.224 0.254
64 0.107 0.137 0.166 0.195 0.224 0.254
65 0.146 0.186 0.225 0.265 0.305 0.345
66 0.107 0.137 0.166 0.195 0.224 0.254
67 0.107 0.137 0.166 0.195 0.224 0.254
68 0.107 0.137 0.166 0.195 0.224 0.254
69 0.107 0.137 0.166 0.195 0.224 0.254
70 0.129 0.164 0.199 0.234 0.269 0.304
Public Agency Miscellaneous 3% @ 60
Duration of Service
Age 5 Years 10 Years 15 Years 20 Years 25 Years 30 Years
50 0.026 0.033 0.040 0.048 0.055 0.062
51 0.021 0.026 0.032 0.038 0.043 0.049
52 0.019 0.025 0.030 0.035 0.040 0.046
53 0.025 0.032 0.038 0.045 0.052 0.059
54 0.039 0.049 0.060 0.070 0.081 0.091
55 0.083 0.105 0.128 0.150 0.173 0.195
56 0.055 0.070 0.085 0.100 0.115 0.130
57 0.061 0.077 0.094 0.110 0.127 0.143
58 0.072 0.091 0.111 0.130 0.150 0.169
59 0.080 0.102 0.123 0.145 0.167 0.189
60 0.094 0.119 0.145 0.170 0.196 0.221
61 0.088 0.112 0.136 0.160 0.184 0.208
62 0.127 0.161 0.196 0.230 0.265 0.299
63 0.110 0.140 0.170 0.200 0.230 0.260
64 0.110 0.140 0.170 0.200 0.230 0.260
65 0.149 0.189 0.230 0.270 0.311 0.351
66 0.110 0.140 0.170 0.200 0.230 0.260
67 0.110 0.140 0.170 0.200 0.230 0.260
68 0.110 0.140 0.170 0.200 0.230 0.260
69 0.110 0.140 0.170 0.200 0.230 0.260
70 0.132 0.168 0.204 0.240 0.276 0.312

CALPERS ACTUARIAL VALUATION – June 30, 2010 APPENDIX A STATEMENT OF ACTUARIAL METHODS AND ASSUMPTIONS
A-12
Public Agency Fire ½ @ 55 and 2% @ 55
Age 50 51 52 53 54 55
Rate 0.01588 0.00000 0.03442 0.01990 0.04132 0.07513
Age 56 57 58 59 60
Rate 0.11079 0.00000 0.09499 0.04409 1.00000
Public Agency Police ½ @ 55 and 2% @ 55
Age 50 51 52 53 54 55
Rate 0.02552 0.00000 0.01637 0.02717 0.00949 0.16674
Age 56 57 58 59 60
Rate 0.06921 0.05113 0.07241 0.07043 1.00000
Public Agency Police 2%@ 50
Duration of Service
Age 5 Years 10 Years 15 Years 20 Years 25 Years 30 Years
50 0.014 0.014 0.014 0.014 0.025 0.045
51 0.012 0.012 0.012 0.012 0.023 0.040
52 0.026 0.026 0.026 0.026 0.048 0.086
53 0.052 0.052 0.052 0.052 0.096 0.171
54 0.070 0.070 0.070 0.070 0.128 0.227
55 0.090 0.090 0.090 0.090 0.165 0.293
56 0.064 0.064 0.064 0.064 0.117 0.208
57 0.071 0.071 0.071 0.071 0.130 0.232
58 0.063 0.063 0.063 0.063 0.115 0.205
59 0.140 0.140 0.140 0.140 0.174 0.254
60 0.140 0.140 0.140 0.140 0.172 0.251
61 0.140 0.140 0.140 0.140 0.172 0.251
62 0.140 0.140 0.140 0.140 0.172 0.251
63 0.140 0.140 0.140 0.140 0.172 0.251
64 0.140 0.140 0.140 0.140 0.172 0.251
65 1.000 1.000 1.000 1.000 1.000 1.000
These rates also apply to Local Prosecutors, Local Sheriff, School Police, and Other Safety.

CALPERS ACTUARIAL VALUATION – June 30, 2010 APPENDIX A STATEMENT OF ACTUARIAL METHODS AND ASSUMPTIONS
A-13
Public Agency Fire 2%@50
Duration of Service
Age 5 Years 10 Years 15 Years 20 Years 25 Years 30 Years
50 0.007 0.007 0.007 0.007 0.010 0.015
51 0.008 0.008 0.008 0.008 0.013 0.019
52 0.017 0.017 0.017 0.017 0.027 0.040
53 0.047 0.047 0.047 0.047 0.072 0.107
54 0.064 0.064 0.064 0.064 0.098 0.147
55 0.087 0.087 0.087 0.087 0.134 0.200
56 0.078 0.078 0.078 0.078 0.120 0.180
57 0.090 0.090 0.090 0.090 0.139 0.208
58 0.079 0.079 0.079 0.079 0.122 0.182
59 0.073 0.073 0.073 0.073 0.112 0.168
60 0.114 0.114 0.114 0.114 0.175 0.262
61 0.114 0.114 0.114 0.114 0.175 0.262
62 0.114 0.114 0.114 0.114 0.175 0.262
63 0.114 0.114 0.114 0.114 0.175 0.262
64 0.114 0.114 0.114 0.114 0.175 0.262
65 1.000 1.000 1.000 1.000 1.000 1.000
Public Agency Police 3%@ 55
Duration of Service
Age 5 Years 10 Years 15 Years 20 Years 25 Years 30 Years
50 0.019 0.019 0.019 0.019 0.040 0.060
51 0.024 0.024 0.024 0.024 0.049 0.074
52 0.024 0.024 0.024 0.024 0.051 0.077
53 0.059 0.059 0.059 0.059 0.121 0.183
54 0.069 0.069 0.069 0.069 0.142 0.215
55 0.116 0.116 0.116 0.116 0.240 0.363
56 0.076 0.076 0.076 0.076 0.156 0.236
57 0.058 0.058 0.058 0.058 0.120 0.181
58 0.076 0.076 0.076 0.076 0.157 0.237
59 0.094 0.094 0.094 0.094 0.193 0.292
60 0.141 0.141 0.141 0.141 0.290 0.438
61 0.094 0.094 0.094 0.094 0.193 0.292
62 0.118 0.118 0.118 0.118 0.241 0.365
63 0.094 0.094 0.094 0.094 0.193 0.292
64 0.094 0.094 0.094 0.094 0.193 0.292
65 1.000 1.000 1.000 1.000 1.000 1.000
These rates also apply to Local Prosecutors, Local Sheriff, School Police, and Other Safety.

CALPERS ACTUARIAL VALUATION – June 30, 2010 APPENDIX A STATEMENT OF ACTUARIAL METHODS AND ASSUMPTIONS
A-14
Public Agency Fire 3%@55
Duration of Service
Age 5 Years 10 Years 15 Years 20 Years 25 Years 30 Years
50 0.012 0.012 0.012 0.018 0.028 0.033
51 0.008 0.008 0.008 0.012 0.019 0.022
52 0.018 0.018 0.018 0.027 0.042 0.050
53 0.043 0.043 0.043 0.062 0.098 0.114
54 0.057 0.057 0.057 0.083 0.131 0.152
55 0.092 0.092 0.092 0.134 0.211 0.246
56 0.081 0.081 0.081 0.118 0.187 0.218
57 0.100 0.100 0.100 0.146 0.230 0.268
58 0.081 0.081 0.081 0.119 0.187 0.219
59 0.078 0.078 0.078 0.113 0.178 0.208
60 0.117 0.117 0.117 0.170 0.267 0.312
61 0.078 0.078 0.078 0.113 0.178 0.208
62 0.098 0.098 0.098 0.141 0.223 0.260
63 0.078 0.078 0.078 0.113 0.178 0.208
64 0.078 0.078 0.078 0.113 0.178 0.208
65 1.000 1.000 1.000 1.000 1.000 1.000
Public Agency Police 3%@ 50
Duration of Service
Age 5 Years 10 Years 15 Years 20 Years 25 Years 30 Years
50 0.070 0.070 0.070 0.131 0.193 0.249
51 0.050 0.050 0.050 0.095 0.139 0.180
52 0.061 0.061 0.061 0.116 0.171 0.220
53 0.069 0.069 0.069 0.130 0.192 0.247
54 0.071 0.071 0.071 0.134 0.197 0.255
55 0.090 0.090 0.090 0.170 0.250 0.322
56 0.069 0.069 0.069 0.130 0.191 0.247
57 0.080 0.080 0.080 0.152 0.223 0.288
58 0.087 0.087 0.087 0.164 0.242 0.312
59 0.090 0.090 0.090 0.170 0.251 0.323
60 0.135 0.135 0.135 0.255 0.377 0.485
61 0.090 0.090 0.090 0.170 0.251 0.323
62 0.113 0.113 0.113 0.213 0.314 0.404
63 0.090 0.090 0.090 0.170 0.251 0.323
64 0.090 0.090 0.090 0.170 0.251 0.323
65 1.000 1.000 1.000 1.000 1.000 1.000
These rates also apply to Local Prosecutors, Local Sheriff, School Police, and Other Safety.

CALPERS ACTUARIAL VALUATION – June 30, 2010 APPENDIX A STATEMENT OF ACTUARIAL METHODS AND ASSUMPTIONS
A-15
Public Agency Fire 3%@50
Duration of Service
Age 5 Years 10 Years 15 Years 20 Years 25 Years 30 Years
50 0.034 0.034 0.034 0.048 0.068 0.080
51 0.046 0.046 0.046 0.065 0.092 0.109
52 0.069 0.069 0.069 0.097 0.138 0.163
53 0.084 0.084 0.084 0.117 0.166 0.197
54 0.103 0.103 0.103 0.143 0.204 0.241
55 0.127 0.127 0.127 0.177 0.252 0.298
56 0.121 0.121 0.121 0.169 0.241 0.285
57 0.101 0.101 0.101 0.141 0.201 0.238
58 0.118 0.118 0.118 0.165 0.235 0.279
59 0.100 0.100 0.100 0.140 0.199 0.236
60 0.150 0.150 0.150 0.210 0.299 0.354
61 0.100 0.100 0.100 0.140 0.199 0.236
62 0.125 0.125 0.125 0.175 0.249 0.295
63 0.100 0.100 0.100 0.140 0.199 0.236
64 0.100 0.100 0.100 0.140 0.199 0.236
65 1.000 1.000 1.000 1.000 1.000 1.000


APPENDIX B
SUMMARY OF MAJOR BENEFIT OPTIONS
DESCRIPTIONS OF PRINCIPAL PLAN PROVISIONS


CALPERS ACTUARIAL VALUATION – June 30, 2010 APPENDIX B SAFETY POLICE PLAN OF THE CITY OF ANAHEIM EMPLOYER NUMBER 303
Summary of Major Benefit Options
Shown below is a summary of the major optional benefits for which your agency has contracted. A description of principal standard and optional plan provisions is in the following section of this Appendix.
Coverage Group
75001 75101
Benefit Provision
Benefit Formula 3.0% @ 50 3.0% @ 50
Social Security Coverage No No Full/Modified Full Full
Final Average Compensation Period 12 mos. 12 mos. Sick Leave Credit Yes Yes Non-Industrial Disability Standard Standard Industrial Disability Yes Yes Pre-Retirement Death Benefits
Optional Settlement 2W Yes Yes 1959 Survivor Benefit Level Level 4 Level 4 Special Yes Yes Alternate (firefighters) No No
Post-Retirement Death Benefits
Lump Sum $5000 $5000 Survivor Allowance (PRSA) Yes Yes
COLA 2% 2%
Employee Contributions
Contractual Employer Paid No No Contractual Employee Cost Sharing 0% 0%
B-1

CALPERS ACTUARIAL VALUATION – June 30, 2010 APPENDIX B SAFETY POLICE PLAN OF THE CITY OF ANAHEIM EMPLOYER NUMBER 303
Summary of Major Benefit Options
Shown below is a summary of the major optional benefits for which your agency has contracted. A description of principal standard and optional plan provisions is in the following section of this Appendix.
Coverage Group
Benefit Provision Benefit Formula
Social Security Coverage Full/Modified
Final Average Compensation Period Sick Leave Credit Non-Industrial Disability Industrial Disability Pre-Retirement Death Benefits
Optional Settlement 2W 1959 Survivor Benefit Level Special Alternate (firefighters)
Post-Retirement Death Benefits
Lump Sum Survivor Allowance (PRSA)
COLA
Employee Contributions
Contractual employer paid Contractual Employee Cost sharing B-2

CALPERS ACTUARIAL VALUATION – June 30, 2010 APPENDIX B SAFETY POLICE PLAN OF THE CITY OF ANAHEIM EMPLOYER NUMBER 303
B-3
DESCRIPTION OF PRINCIPAL PLAN PROVISIONS
The following is a description of the principal plan provisions used in calculating costs and liabilities. We have indicated whether a plan provision is standard or optional. Standard benefits are applicable to all members while optional benefits vary among employers. Optional benefits that apply to a single period of time, such as Golden Handshakes, have not been included. Many of the statements in this summary are general in nature, and are intended to provide an easily understood summary of the complex Public Employees’ Retirement Law. The law itself governs in all situations.
Service Retirement
Eligibility A CalPERS member becomes eligible for Service Retirement upon attainment of age 50 with at least 5 years of credited service (total service across all CalPERS employers, and with certain other Retirement Systems with which CalPERS has reciprocity agreements). For employees hired into a plan with the 1.5% at 65 formula, eligibility for service retirement is age 55 with at least 5 years of service.
Benefit The Service Retirement benefit is a monthly allowance equal to the product of the benefit factor, years of service, and final compensation. The benefit factor depends on the benefit formula specified in your agency’s contract. The table below shows
the factors for each of the available formulas. Factors vary by the member’s age at retirement. Listed are the factors for retirement at whole year ages:
Miscellaneous Plan Formulas
Retirement Age 1.5% at 65 2% at 60 2% at 55 2.5% at 55 2.7% at 55 3% at 60
50 0.5000% 1.092% 1.426% 2.0% 2.0% 2.0%
51 0.5667% 1.156% 1.522% 2.1% 2.14% 2.1%
52 0.6334% 1.224% 1.628% 2.2% 2.28% 2.2%
53 0.7000% 1.296% 1.742% 2.3% 2.42% 2.3%
54 0.7667% 1.376% 1.866% 2.4% 2.56% 2.4%
55 0.8334% 1.460% 2.0% 2.5% 2.7% 2.5%
56 0.9000% 1.552% 2.052% 2.5% 2.7% 2.6%
57 0.9667% 1.650% 2.104% 2.5% 2.7% 2.7%
58 1.0334% 1.758% 2.156% 2.5% 2.7% 2.8%
59 1.1000% 1.874% 2.210% 2.5% 2.7% 2.9%
60 1.1667% 2.0% 2.262% 2.5% 2.7% 3.0%
61 1.2334% 2.134% 2.314% 2.5% 2.7% 3.0%
62 1.3000% 2.272% 2.366% 2.5% 2.7% 3.0%
63 1.3667% 2.272% 2.366% 2.5% 2.7% 3.0%
64 1.4334% 2.272% 2.366% 2.5% 2.7% 3.0%
65 & Up 1.5000% 2.418% 2.418% 2.5% 2.7% 3.0%

CALPERS ACTUARIAL VALUATION – June 30, 2010 APPENDIX B SAFETY POLICE PLAN OF THE CITY OF ANAHEIM EMPLOYER NUMBER 303
B-4
Safety Plan Formulas
Retirement Age
½ at 55 * 2% at 55 2% at 50 3% at 55 3% at 50
50 1.783% 1.426% 2.0% 2.40% 3.0%
51 1.903% 1.522% 2.14% 2.52% 3.0%
52 2.035% 1.628% 2.28% 2.64% 3.0%
53 2.178% 1.742% 2.42% 2.76% 3.0%
54 2.333% 1.866% 2.56% 2.88% 3.0%
55 & Up 2.5% 2.0% 2.7% 3.0% 3.0%
* For this formula, the benefit factor also varies by entry age. The factors shown are for members with an entry age of 35 or greater. If entry age is less than 35, then the age 55 benefit factor is 50% divided by the difference between age 55 and entry age. The benefit factor for ages prior to age 55 is the same proportion of the age 55 benefit factor as in the above table. The years of service is the amount credited by CalPERS to a member while he or she is employed in this group
(or for other periods that are recognized under the employer’s contract with CalPERS). For a member who has earned service with multiple CalPERS employers, the benefit from each employer is calculated separately according to each employer’s contract, and then added together for the total allowance. An agency may contract for an optional benefit where any unused sick leave accumulated at the time of retirement will be converted to credited service at a rate of 0.004 years of service for each day of sick leave.
The final compensation is the monthly average of the member’s highest 36 or 12 consecutive months’ full-time
equivalent monthly pay (no matter which CalPERS employer paid this compensation). The standard benefit is 36 months. Employers have the option of providing a final compensation equal to the highest 12 consecutive months. Final compensation must be defined by the highest 36 consecutive months’ pay under the 1.5% at 65
formula.
Employees must be covered by Social Security with the 1.5% at 65 formula. Social Security is optional for all other benefit formulas. For employees covered by Social Security, the Modified formula is the standard benefit. Under this type of formula, the final compensation is offset by $133.33 (or by one third if the final compensation is less than $400). Employers may contract for the Full benefit with Social Security that will eliminate the offset applicable to the final compensation. For employees not covered by Social Security, the Full benefit is paid with no offsets. Auxiliary organizations of the CSUC system may elect reduced contribution rates, in which case the offset is $317 if members are not covered by Social Security or $513 if members are covered by Social Security.
The Miscellaneous Service Retirement benefit is not capped. The Safety Service Retirement benefit is capped at
90% of final compensation.
Vested Deferred Retirement
Eligibility for Deferred Status A CalPERS member becomes eligible for a deferred vested retirement benefit when he or she leaves employment, keeps his or her contribution account balance on deposit with CalPERS, and has earned at least 5 years of credited service (total service across all CalPERS employers, and with certain other Retirement Systems with which CalPERS has reciprocity agreements). Eligibility to Start Receiving Benefits The CalPERS member becomes eligible to receive the deferred retirement benefit upon satisfying the eligibility requirements for Deferred Status and upon attainment of age 50 (55 for employees hired into a 1.5% @ 65 plan).

CALPERS ACTUARIAL VALUATION – June 30, 2010 APPENDIX B SAFETY POLICE PLAN OF THE CITY OF ANAHEIM EMPLOYER NUMBER 303
B-5
Benefit The vested deferred retirement benefit is the same as the Service Retirement benefit, where the benefit factor is based on the member’s age at allowance commencement. For members who have earned service with multiple CalPERS employers, the benefit from each employer is calculated separately according to each employer’s contract, and then added together for the total allowance.
Non-Industrial (Non-Job Related) Disability Retirement
Eligibility A CalPERS member is eligible for Non-Industrial Disability Retirement if he or she becomes disabled and has at least 5 years of credited service (total service across all CalPERS employers, and with certain other Retirement Systems with which CalPERS has reciprocity agreements). There is no special age requirement. Disabled means the member is unable to perform his or her job because of an illness or injury which is expected to be permanent or to last indefinitely. The illness or injury does not have to be job related. A CalPERS member must be actively employed by
any CalPERS employer at the time of disability in order to be eligible for this benefit. Standard Benefit The standard Non-Industrial Disability Retirement benefit is a monthly allowance equal to 1.8% of final compensation, multiplied by service, which is determined as follows: service is CalPERS credited service, for members with less than 10 years of service or greater than 18.518 years
of service; or service is CalPERS credited service plus the additional number of years that the member would have worked
until age 60, for members with at least 10 years but not more than 18.518 years of service. The maximum benefit in this case is 33 1/3% of Final Compensation.
Improved Benefit Employers have the option of providing the improved Non-Industrial Disability Retirement benefit. This benefit provides a monthly allowance equal to 30% of final compensation for the first 5 years of service, plus 1% for each additional year of service to a maximum of 50% of final compensation. Members who are eligible for a larger service retirement benefit may choose to receive that benefit in lieu of a disability benefit. Members eligible to retire, and who have attained the normal retirement age determined by their service retirement benefit formula, will receive the same dollar amount for disability retirement as that payable for service retirement. For members who have earned service with multiple CalPERS employers, the benefit attributed to each employer is the total disability allowance multiplied by the ratio of service with a particular employer to the total CalPERS service.
Industrial (Job Related) Disability Retirement
All safety members have this benefit. For miscellaneous members, employers have the option of providing this benefit. An employer may choose to provide the Increased benefit option or the Improved benefit option.
Eligibility An employee is eligible for Industrial Disability Retirement if he or she becomes disabled while working, where disabled means the member is unable to perform the duties of the job because of a work-related illness or injury which is expected to be permanent or to last indefinitely. A CalPERS member who has left active employment within this group is not eligible for this benefit, except to the extent described below. Standard Benefit The standard Industrial Disability Retirement benefit is a monthly allowance equal to 50% of final compensation.

CALPERS ACTUARIAL VALUATION – June 30, 2010 APPENDIX B SAFETY POLICE PLAN OF THE CITY OF ANAHEIM EMPLOYER NUMBER 303
B-6
Increased Benefit (75% of Final Compensation) The increased Industrial Disability Retirement benefit is a monthly allowance equal to 75% of final compensation for total disability. Improved Benefit (50% to 90% of Final Compensation) The improved Industrial Disability Retirement benefit is a monthly allowance equal to the Workman’s Compensation Appeals Board permanent disability rate percentage (if 50% or greater, with a maximum of 90%) times the final compensation. For a CalPERS member not actively employed in this group who became disabled while employed by some other CalPERS employer, the benefit is a return of accumulated member contributions with respect to employment in this group. With the standard or increased benefit, a member may also choose to receive the annuitization of the accumulated member contributions. If a member is eligible for Service Retirement and if the Service Retirement benefit is more than the Industrial Disability Retirement benefit, the member may choose to receive the larger benefit.
Post-Retirement Death Benefit
Standard Lump Sum Payment Upon the death of a retiree, a one-time lump sum payment of $500 will be made to the retiree’s designated survivor(s), or to the retiree’s estate.
Improved Lump Sum Payment Employers have the option of providing an improved lump sum death benefit of $600, $2,000, $3,000, $4,000 or $5,000.
Form of Payment for Retirement Allowance
Standard Form of Payment Generally, the retirement allowance is paid to the retiree in the form of an annuity for as long as he or she is alive. The retiree may choose to provide for a portion of his or her allowance to be paid to any designated beneficiary after the retiree’s death. CalPERS provides for a variety of such benefit options, which the retiree pays for by taking a reduction in his or her retirement allowance. Such reduction takes into account the amount to be provided to the beneficiary and the probable duration of payments (based on the ages of the member and beneficiary) made subsequent to the member’s death.
Improved Form of Payment (Post Retirement Survivor Allowance) Employers have the option to contract for the post retirement survivor allowance.
For retirement allowances with respect to service subject to the modified formula, 25% of the retirement allowance will automatically be continued to certain statutory beneficiaries upon the death of the retiree, without a reduction in the retiree’s allowance. For retirement allowances with respect to service subject to the full or supplemental formula, 50% of the retirement allowance will automatically be continued to certain statutory beneficiaries upon the death of the retiree, without a reduction in the retiree’s allowance. This additional benefit is often referred to as post retirement survivor allowance (PRSA) or simply as survivor continuance.
In other words, 25% or 50% of the allowance, the continuance portion, is paid to the retiree for as long as he or she is alive, and that same amount is continued to the retiree’s spouse (or if no eligible spouse, to unmarried children until they attain age 18; or, if no eligible children, to a qualifying dependent parent) for the rest of his or her lifetime. This benefit will not be discontinued in the event the spouse remarries.

CALPERS ACTUARIAL VALUATION – June 30, 2010 APPENDIX B SAFETY POLICE PLAN OF THE CITY OF ANAHEIM EMPLOYER NUMBER 303
B-7
The remaining 75% or 50% of the retirement allowance, which may be referred to as the option portion of the benefit, is paid to the retiree as an annuity for as long as he or she is alive. Or, the retiree may choose to provide for some of this option portion to be paid to any designated beneficiary after the retiree’s death. Benefit options applicable to the option portion are the same as those offered with the standard form. The reduction is calculated in the same manner but is applied only to the option portion.
Pre-Retirement Death Benefits
Basic Death Benefit
This is a standard benefit. Eligibility An employee’s beneficiary (or estate) may receive the Basic Death benefit if the member dies while actively employed. A CalPERS member must be actively employed with the CalPERS employer providing this benefit to be eligible for this benefit. A member’s survivor who is eligible for any other pre-retirement death benefit may choose to receive that death benefit instead of this Basic Death benefit. Benefit The Basic Death Benefit is a lump sum in the amount of the member’s accumulated contributions, where interest is currently credited at 7.75% per year, plus a lump sum in the amount of one month's salary for each completed year of current service, up to a maximum of six months' salary. For purposes of this benefit, one month's salary is defined as the member's average monthly full-time rate of compensation during the 12 months preceding death.
1957 Survivor Benefit
This is a standard benefit. Eligibility An employee’s eligible survivor(s) may receive the 1957 Survivor benefit if the member dies while actively employed, has attained at least age 50, and has at least 5 years of credited service (total service across all CalPERS employers and with certain other Retirement Systems with which CalPERS has reciprocity agreements). A CalPERS member must be actively employed with the CalPERS employer providing this benefit to be eligible for this benefit. An eligible survivor means the surviving spouse to whom the member was married at least one year before death or, if there is no eligible spouse, to the member's unmarried children under age 18. A member’s survivor who is eligible for any other pre-retirement death benefit may choose to receive that death benefit instead of this 1957 Survivor benefit. Benefit The 1957 Survivor benefit is a monthly allowance equal to one-half of the unmodified Service Retirement benefit that the member would have been entitled to receive if the member had retired on the date of his or her death. If the benefit is payable to the spouse, the benefit is discontinued upon the death of the spouse. If the benefit is payable
to a dependent child, the benefit will be discontinued upon death or attainment of age 18, unless the child is disabled. The total amount paid will be at least equal to the Basic Death benefit.
Optional Settlement 2W Death Benefit
This is an optional benefit. Eligibility An employee’s eligible survivor may receive the Optional Settlement 2W Death benefit if the member dies while actively employed, has attained at least age 50, and has at least 5 years of credited service (total service across all

CALPERS ACTUARIAL VALUATION – June 30, 2010 APPENDIX B SAFETY POLICE PLAN OF THE CITY OF ANAHEIM EMPLOYER NUMBER 303
B-8
CalPERS employers and with certain other Retirement Systems with which CalPERS has reciprocity agreements). A CalPERS member who is no longer actively employed with any CalPERS employer is not eligible for this benefit. An eligible survivor means the surviving spouse to whom the member was married at least one year before death. A member’s survivor who is eligible for any other pre-retirement death benefit may choose to receive that death benefit instead of this Optional Settlement 2W Death benefit.
Benefit The Optional Settlement 2W Death benefit is a monthly allowance equal to the Service Retirement benefit that the member would have received had the member retired on the date of his or her death and elected Optional Settlement 2W. (A retiree who elects Optional Settlement 2W receives an allowance that has been reduced so that it will continue to be paid after his or her death to a surviving beneficiary.) The allowance is payable as long as the surviving spouse lives, at which time it is continued to any unmarried children under age 18, if applicable. The total amount paid will be at least equal to the Basic Death Benefit.
Special Death Benefit
This is a standard benefit for safety members. An employer may elect to provide this benefit for miscellaneous members. Eligibility An employee’s eligible survivor(s) may receive the Special Death benefit if the member dies while actively employed and the death is job-related. A CalPERS member who is no longer actively employed with any CalPERS employer is not eligible for this benefit. An eligible survivor means the surviving spouse to whom the member was married prior to the onset of the injury or illness that resulted in death. If there is no eligible spouse, an eligible survivor means the member's unmarried children under age 22. An eligible survivor who chooses to receive this benefit will not receive any other death benefit.
Benefit The Special Death benefit is a monthly allowance equal to 50% of final compensation, and will be increased
whenever the compensation paid to active employees is increased but ceasing to increase when the member would have attained age 50. The allowance is payable to the surviving spouse until death at which time the allowance is continued to any unmarried children under age 22. There is a guarantee that the total amount paid will at least equal the Basic Death Benefit.
If the member’s death is the result of an accident or injury caused by external violence or physical force incurred in the performance of the member’s duty, and there are eligible surviving children (eligible means unmarried children under age 22) in addition to an eligible spouse, then an additional monthly allowance is paid equal to the following:
if 1 eligible child: 12.5% of final compensation if 2 eligible children: 20.0% of final compensation if 3 or more eligible children: 25.0% of final compensation
Alternate Death Benefit for Local Fire Members
This is an optional benefit available only to local fire members. Eligibility An employee’s eligible survivor(s) may receive the Alternate Death benefit in lieu of the Basic Death Benefit or the 1957 Survivor Benefit if the member dies while actively employed and has at least 20 years of total CalPERS service. A CalPERS member who is no longer actively employed with any CalPERS employer is not eligible for this benefit. An eligible survivor means the surviving spouse to whom the member was married prior to the onset of the injury or illness that resulted in death. If there is no eligible spouse, an eligible survivor means the member's unmarried children under age 18.

CALPERS ACTUARIAL VALUATION – June 30, 2010 APPENDIX B SAFETY POLICE PLAN OF THE CITY OF ANAHEIM EMPLOYER NUMBER 303
B-9
Benefit The Alternate Death benefit is a monthly allowance equal to the Service Retirement benefit that the member would have received had the member retired on the date of his or her death and elected Optional Settlement 2W. (A retiree who elects Optional Settlement 2W receives an allowance that has been reduced so that it will continue to be paid after his or her death to a surviving beneficiary.) If the member has not yet attained age 50, the benefit is equal to that which would be payable if the member had retired at age 50, based on service credited at the time of death. The allowance is payable as long as the surviving spouse lives, at which time it is continued to any unmarried children under age 18, if applicable. The total amount paid will be at least equal to the Basic Death Benefit.
Cost-of-Living Adjustments (COLA)
Standard Benefit Beginning the second calendar year after the year of retirement, retirement and survivor allowances will be annually adjusted on a compound basis by 2%.
Improved Benefit Employers have the option of providing an improved cost-of-living adjustment of 3%, 4% or 5%. An improved COLA is not available in conjunction with the 1.5% at 65 formula.
The cumulative adjustment may not be greater than the cumulative change in the Consumer Price Index since the date of retirement.
Purchasing Power Protection Allowance (PPPA)
Retirement and survivor allowances are protected against inflation by PPPA. PPPA benefits are cost-of-living adjustments that are intended to maintain an individual’s allowance at 80% of the initial allowance at retirement adjusted for inflation since retirement. The PPPA benefit will be coordinated with other cost-of-living adjustments provided under the plan.
Employee Contributions
Each employee contributes toward his or her retirement based upon the retirement formula. The standard employee contribution is as described below.
The percent contributed below the monthly compensation breakpoint is 0%. The monthly compensation breakpoint is $0 for full and supplemental formula members and $133.33 for
employees covered by the modified formula. The percent contributed above the monthly compensation breakpoint depends upon the benefit formula, as
shown in the table below.
Benefit Formula Percent Contributed above the Breakpoint
Miscellaneous, 1.5% at 65 2%
Miscellaneous, 2% at 60 7%
Miscellaneous, 2% at 55 7%
Miscellaneous, 2.5% at 55 8%
Miscellaneous, 2.7% at 55 8%
Miscellaneous, 3% at 60 8%
Safety, 1/2 at 55 Varies by entry age
Safety, 2% at 55 7%
Safety, 2% at 50 9%
Safety, 3% at 55 9%
Safety, 3% at 50 9%

CALPERS ACTUARIAL VALUATION – June 30, 2010 APPENDIX B SAFETY POLICE PLAN OF THE CITY OF ANAHEIM EMPLOYER NUMBER 303
B-10
The employer may choose to “pick-up” these contributions for the employees (Employer Paid Member Contributions or EPMC). An employer may also include Employee Cost Sharing in the contract, where employees contribute an additional percentage of compensation based on any optional benefit for which a contract amendment was made on or after January 1, 1979. Auxiliary organizations of the CSUC system may elect reduced contribution rates, in which case the offset is $317
and the contribution rate is 6% if members are not covered by Social Security. If members are covered by Social Security the offset is $513 and the contribution rate is 5%.
Refund of Employee Contributions
If the member’s service with the employer ends, and if the member does not satisfy the eligibility conditions for any of the retirement benefits above, the member may elect to receive a refund of his or her employee contributions,
which are credited annually with 6% interest.
1959 Survivor Benefit
This is a pre-retirement death benefit available only to members not covered by Social Security. Any agency joining CalPERS subsequent to 1993 was required to provide this benefit if the members were not covered by Social Security. The benefit is optional for agencies joining CalPERS prior to 1994. Levels 1, 2 and 3 are now closed. Any new agency or any agency wishing to add this benefit or increase the current level must choose the 4th or Indexed Level. This benefit is not included in the results presented in this valuation. More information on this benefit is available on the CalPERS website at www.calpers.ca.gov.

APPENDIX C
GASB STATEMENT NO. 27


CALPERS ACTUARIAL VALUATION – June 30, 2010 APPENDIX C GASB STATEMENT NO. 27
C-1
SAFETY POLICE PLAN of the CITY OF ANAHEIM
Information for Compliance with GASB Statement
No. 27
Under GASB 27, an employer reports an annual pension cost (APC) equal to the annual required contribution (ARC) plus an adjustment for the cumulative difference between the APC and the employer’s actual plan contributions for the year. The cumulative difference is called the net pension obligation (NPO). The ARC for the period July 1, 2012 to June 30, 2013 has been determined by an actuarial valuation of the plan as of June 30, 2010. The contribution rate for the indicated period is 30.860% of payroll. In order to calculate the dollar value of the ARC for inclusion in financial statements prepared as of June 30, 2013, this contribution rate, as modified by any amendments for the year, would be multiplied by the payroll of covered employees that was actually paid during the period July 1, 2012 to June 30, 2013. The employer and the employer’s auditor are responsible for determining the NPO and the APC. Note: If an agency elects the Annual Lump Sum Prepayment Option, the ARC for the period July 1, 2012 through
June 30, 2013 is $14,928,189. If any amendments are enacted during the year the ARC will include the increase in the employer contribution due to amendment multiplied by the payroll from the effective date of the amendment. A summary of principal assumptions and methods used to determine the ARC is shown below. Retirement Program Valuation Date June 30, 2010
Actuarial Cost Method Entry Age Normal Cost Method Amortization Method Level Percent of Payroll
Average Remaining Period 30 Years as of the Valuation Date Asset Valuation Method 15 Year Smoothed Market
Actuarial Assumptions Investment Rate of Return 7.75% (net of administrative expenses)
Projected Salary Increases 3.55% to 13.15% depending on Age, Service, and type of employment Inflation 3.00% Payroll Growth 3.25% Individual Salary Growth A merit scale varying by duration of employment coupled with an assumed
annual inflation growth of 3.00% and an annual production growth of 0.25%.
Initial unfunded liabilities are amortized over a closed period that depends on the plan’s date of entry into CalPERS. Subsequent plan amendments are amortized as a level percentage of pay over a closed 20-year period. Gains and losses that occur in the operation of the plan are amortized over a 30 year rolling period, which results in an amortization of about 6% of unamortized gains and losses each year. If the plan’s accrued liability exceeds the actuarial value of plan assets, then the amortization payment on the total unfunded liability may not be lower than the payment calculated over a 30 year amortization period. More complete information on assumptions and methods is provided in Appendix A of this report. Appendix B contains a description of benefits included in the valuation. The Schedule of Funding Progress below shows the recent history of the actuarial accrued liability, actuarial value of assets, their relationship and the relationship of the unfunded actuarial accrued liability to payroll.
Valuation
Date
Accrued
Liability
(a)
Actuarial Value
of Assets (AVA)
(b)
Unfunded
Liability (UL)
(a)-(b)
Funded Ratios Annual
Covered Payroll
(c)
UL As a
% of Payroll
[(a)-(b)]/(c) (AVA)
(b)/(a) Market Value
06/30/06 $ 392,350,281 $ 336,967,042 $ 55,383,239 85.9% 91.3% $ 35,806,541 154.7%
06/30/07 425,138,505 366,663,174 58,475,331 86.2% 100.2% 40,322,739 145.0%
06/30/08 457,588,313 392,205,533 65,382,780 85.7% 87.6% 44,223,550 147.8%
06/30/09 496,422,604 411,137,205 85,285,399 82.8% 60.5% 46,021,500 185.3%
06/30/10 519,062,115 432,262,370 86,799,745 83.3% 65.4% 45,619,701 190.3%


APPENDIX D
INVESTMENT RETURN SENSITIVITY ANALYSIS


CALPERS ACTUARIAL VALUATION – June 30, 2010 APPENDIX D INVESTMENT RETURN SENSITIVITY ANALYSIS
D-1
Investment Return Sensitivity Analysis
In July 2011, the investment return for fiscal year 2010-2011 was estimated to be 20.7%. Note that this return is before administrative expenses and also does not reflect final investment return information for real estate and private equities. The final return information for these two asset classes is expected to be available later in October. Our estimated preliminary 20.0% return for the 2010-2011 fiscal year is good news as it will help reduce the impact of the -24% return in 2008-2009 and the impact of the three year phase in adopted by the Board in June 2009. For purposes of projecting future employer rates, we are assuming a 20% investment return for fiscal year 2010-2011. The investment return realized during a fiscal year first affects the contribution rate for the fiscal year 2 years later. Specifically, the investment return for 2010-2011 will first be reflected in the June 30, 2011 actuarial valuation that will be used to set the 2013-2014 employer contribution rates, the 2011-2012 investment return will first be reflected in the June 30, 2012 actuarial valuation that will be used to set the 2014-2015 employer contribution rates and so forth.
Based on a 20% investment return for fiscal year 2010-2011 and assuming that all other actuarial assumptions will be realized and that no further changes to assumptions, contributions, benefits, or funding will occur between now and the beginning of the fiscal year 2013-2014, the effect on the 2013-2014 Employer Rate is as follows:
Estimated 2013-2014 Employer Rate Estimated Increase in Employer Rate between 2012-2013 and 2013-2014
31.2% 0.4%
As part of this report, a sensitivity analysis was performed to determine the effects of various investment returns during fiscal years 2011-2012, 2012-2013 and 2013-2014 on the 2014-2015, 2015-2016 and 2016-2017 employer rates. Once again, the projected rate increases assume that all other actuarial assumptions will be realized and that no further changes to assumptions, contributions, benefits, or funding will occur. Five different investment return scenarios were selected.
The first scenario is what one would expect if the markets were to give us a 5th percentile return from July
1, 2011 through June 30, 2014. The 5th percentile return corresponds to a -3.64% return for each of the 2011-2012, 2012-2013 and 2013-2014 fiscal years.
The second scenario is what one would expect if the markets were to give us a 25th percentile return from July 1, 2011 through June 30, 2014. The 25th percentile return corresponds to a 2.93% return for each of the 2011-2012, 2012-2013 and 2013-2014 fiscal years.
The third scenario assumed the return for 2011-2012, 2012-2013, 2013-2014 would be our assumed 7.75% investment return which represents about a 49th percentile event.
The fourth scenario is what one would expect if the markets were to give us a 75th percentile return from July 1, 2011 through June 30, 2014. The 75th percentile return corresponds to a 12.25% return for each of the 2011-2012, 2012-2013 and 2013-2014 fiscal years.
Finally, the last scenario is what one would expect if the markets were to give us a 95th percentile return from July 1, 2011 through June 30, 2014. The 95th percentile return corresponds to a 19.02% return for each of the 2011-2012, 2012-2013 and 2013-2014 fiscal years.
The table below shows the estimated projected contribution rates and the estimated increases for your plan under the five different scenarios.
2011-2014 Investment Return
Scenario
Estimated Employer Rate Estimated Increase in
Employer Rate between 2013-2014
and 2016-2017 2014-2015 2015-2016 2016-2017
-3.64% (5th percentile) 34.7% 41.2% 47.0% 15.8%
2.93% (25th percentile) 31.8% 33.5% 36.3% 5.1%
7.75% 31.6% 31.9% 32.3% 1.1%
12.25%(75th percentile) 31.4% 31.5% 31.3% 0.1%
19.02%(95th percentile) 31.2% 30.7% 29.8% -1.4%


APPENDIX E
GLOSSARY OF ACTUARIAL TERMS


CALPERS ACTUARIAL VALUATION – June 30, 2010 APPENDIX E GLOSSARY OF ACTUARIAL TERMS
E-1
Glossary of Actuarial Terms
Accrued Liability (also called Actuarial Accrued Liability or Entry Age Normal Accrued Liability) The total dollars needed as of the valuation date to fund all benefits earned in the past for current members.
Actuarial Assumptions
Assumptions made about certain events that will affect pension costs. Assumptions generally can be broken down into two categories: demographic and economic. Demographic assumptions include such things as mortality, disability and retirement rates. Economic assumptions include investment return, salary growth and inflation.
Actuarial Methods
Procedures employed by actuaries to achieve certain goals of a pension plan. These may include things such as funding method, setting the length of time to fund the past service liability and determining the
actuarial value of assets.
Actuarial Valuation The determination, as of a valuation date, of the normal cost, actuarial accrued liability, actuarial value of assets and related actuarial present values for a pension plan. These valuations are performed annually or when an employer is contemplating a change to their plan provisions.
Actuarial Value of Assets The actuarial value of assets used for funding purposes is obtained through an asset smoothing technique where investment gains and losses are partially recognized in the year they are incurred, with the remainder recognized in subsequent years.
This method helps to dampen large fluctuations in the employer contribution rate.
Amortization Bases
Separate payment schedules for different portions of the unfunded liability. The total unfunded liability of a risk pool or non-pooled plan can be segregated by "cause", creating “bases” and each such base will be separately amortized and paid for over a specific period of time. This can be likened to a home mortgage that has 24 years of remaining payments and a second on that mortgage that has 10 years left. Each base or each mortgage note has its own terms (payment period, principal, etc.) Generally in an actuarial valuation, the separate bases consist of changes in unfunded liability due to amendments, actuarial assumption changes, actuarial methodology changes, and gains and losses. Payment periods are determined by Board policy and vary based on the cause of the change.
Amortization Period
The number of years required to pay off an amortization base. Annual Required Contributions (ARC)
The employer's periodic required annual contributions to a defined benefit pension plan as set forth in GASB Statement No. 27, calculated in accordance with the plan assumptions. The ARC is determined by multiplying the employer contribution rate by the payroll reported to CalPERS for the applicable fiscal year.
However, if this contribution is fully prepaid in a lump sum, then the dollar value of the ARC is equal to the Lump Sum Prepayment.
Entry Age
The earliest age at which a plan member begins to accrue benefits under a defined benefit pension plan or risk pool. In most cases, this is age of the member on their date of hire.
Entry Age Normal Cost Method
An actuarial cost method designed to fund a member's total plan benefit over the course of his or her career. This method is designed to yield a rate expressed as a level percentage of payroll.
CALPERS ACTUARIAL VALUATION – June 30, 2010 APPENDIX E GLOSSARY OF ACTUARIAL TERMS
E-2
(The assumed retirement age less the entry age is the amount of time required to fund a member’s total
benefit. Generally, the older a member on the date of hire, the greater the entry age normal cost. This is mainly because there is less time to earn investment income to fund the future benefits.)
Fresh Start
A fresh start is the single amortization base created when multiple amortization bases are collapsed into one base and amortized over a new funding period.
Funded Status A measure of how well funded a plan is. Or equivalently, how "on track" a plan is with respect to assets vs. accrued liabilities. A ratio greater than 100% means the plan or risk pool has more assets than liabilities and a ratio less than 100% means liabilities are greater than assets. A funded ratio based on the Actuarial Value of Assets indicates the progress toward fully funding the plan using the actuarial cost methods and assumptions. A funded ratio based on the Market Value of Assets indicates the short-term solvency of the plan.
GASB 27
Statement No. 27 of the Governmental Accounting Standards Board. The accounting standard governing a state or local governmental employer’s accounting for pensions.
Lump Sum Contribution A payment made by the employer to reduce or eliminate the unfunded liability.
Normal Cost The annual cost of service accrual for the upcoming fiscal year for active employees. The normal cost should be viewed as the long term contribution rate.
Pension Actuary A person who is responsible for the calculations necessary to properly fund a pension plan. Prepayment Contribution
A payment made by the employer to reduce or eliminate the year’s required employer contribution. Present Value of Benefits
The total dollars needed as of the valuation date to fund all benefits earned in the past or expected to be earned in the future for current members.
Rolling Amortization Period An amortization period that remains the same each year, rather than declining. Superfunded
A condition existing when the actuarial value of assets exceeds the present value of benefits. When this condition exists on a given valuation date for a given plan, employee contributions for the rate year covered by that valuation may be waived.
Unfunded Liability or Unfunded Accrued Liability (UAL)
A plan with an actuarial value of assets below the accrued liability is said to have an unfunded liability and must temporarily increase contributions to get back on schedule.