Embed Size (px)
Citation preview

CA
LIF
OR
NIA
RE
SO
UR
CE
S C
OR
PO
RA
TIO
N 2
014
AN
NU
AL
RE
PO
RT
Corporate Headquarters10889 Wilshire Boulevard
Los Angeles, California 90024
(888) 848-4754
Northern Operations10800 Stockdale Highway
Bakersfi eld, California 93311
(661) 412-5000
Southern Operations111 W. Ocean Boulevard, Suite 800
Long Beach, California 90802
(562) 624-3400
crc.com
ENERGY FOR CALIFORNIA BY CALIFORNIANS Ca l i fo r n i a Reso u rces Co r p o ra t i o n 20 1 4 A n n u a l Re p o r t

(a) On November 30, 2014, the spin-off date from Occidental Petroleum Corporation, 381.4 million shares of our common stock were distributed, of which approximately 18.5% was retained by Occidental. Additional shares were distributed in December to substitute for Occidental stock awards. For comparative purposes, and to provide a more meaningful calculation of weighted-average shares outstanding, we have assumed these amounts to be outstanding for each period prior to the spin-off.
All statements, other than statements of historical fact, included in this report that address activities, events or developments that California Resources Corporation (the “Company” or “CRC”) believes will or may occur in the future are forward-looking statements. The words “believe,” “expect,” “may,” “estimate,” “will,” “anticipate,” “plan,” “intend,” “should,” “would,” “could,” or other similar expressions are intended to identify forward-looking statements, which are generally not historical in nature. Forward-looking statements specifi cally include the Company’s expectations based on its plans, strategies, objectives and anticipated fi nancial and operating results, including as to the Company’s drilling program, production, hedging activities, capital expenditure levels and other guidance included in this report. Such statements are subject to a number of assumptions, risks and uncertainties, many of which are beyond the control of the Company, which may cause actual results to differ materially from those implied or expressed by the forward-looking statements. These include, but are not limited to, commodity pricing; vulnerability to economic downturns and adverse developments due to our debt; insuffi ciency of our operating cash fl ow to fund planned capital investments; inability to implement our capital investment program profi tably or at all; compliance with regulations or changes in regulations and the ability to obtain government permits and approvals; risks of drilling; tax law changes; competition for and costs of oilfi eld equipment, services, qualifi ed personnel and acquisitions; the subjective nature of estimates of proved reserves and related future net cash fl ows; inability to drill identifi ed locations when planned or at all; restrictions on our ability to obtain, use, manage or dispose of water; inability to operate in the United States outside of California; concerns about climate change and air quality issues; risks related to our acquisition activities; catastrophic events for which we may be uninsured or underinsured; cyber attacks; operational issues that restrict market access; and uncertainties related to the anticipated effects of restructuring or reorganizing our business. Any forward-looking statement speaks only as of the date on which such statement is made and the Company undertakes no obligation to correct or update any forward-looking statement, except as required by applicable law.
Financial Highlights
Revenues
Income / (Loss) Before Income Taxes
Net Income / (Loss)
Core Income
EPS – Basic and Diluted(a)
Core EPS – Basic and Diluted(a)
Net Cash Provided by Operating Activities
Capital Investments
Proceeds from Debt
Cash Dividends to Occidental
Net Cash (Used) Provided by Other Financing Activities
Total Assets
Long-Term Debt
Equity/Net Investment
Weighted Average Shares Outstanding(a)
Year-End Shares
Operational Highlights
Production:
Crude Oil (MBbl/d)
NGLs (MBbl/d)
Natural Gas (MMcf/d)
Total (MBoe/d)
Average Realized Prices:
Crude ($/Bbl)
NGLs ($/Bbl)
Natural Gas ($/Mcf)
Reserves:
Crude Oil (MMBbl)
NGLs (MMBbl)
Natural Gas (Bcf)
Total (MBoe/d)
Reserve Replacement from Capital Program
PV-10
Acreage (in thousands):
Net Developed
Net Undeveloped
Total
Closing Share Price
2014
$ 4,173
$ (2,421)
$ (1,434)
$ 650
$ (3.75)
$ 1.67
$ 2,371
$ (2,020)
$ 6,360
$ (6,000)
$ (45)
$ 12,497
$ 6,360
$ 2,611
381.9
385.6
99
19
246
159
$ 92.30
$ 47.84
$ 4.39
551
85
790
768
203%
$16.1 billion
716
1,691
2,407
$ 5.51
2013
$ 4,284
$ 1,447
$ 869
$ 869
$ 2.24
$ 2.24
$ 2,476
$ (1,669)
—
—
$ (763)
$ 14,297
—
$ 9,989
—
—
90
20
260
154
$ 104.16
$ 50.43
$ 3.73
532
71
844
744
159%
$14.0 billion
701
1,604
2,305
2012
$ 4,073
$ 1,181
$ 699
$ 675
$ 1.80
$ 1.74
$ 2,223
$ (2,331)
—
—
$ 532
$ 13,764
—
$ 9,860
—
—
88
17
256
148
$ 104.02
$ 52.76
$ 2.94
497
61
934
714
183%
$13.8 billion
466
1,646
2,112
FINANCIAL & OPERATING
Dollar amounts in millions, except per-share amounts as of and for the years ended December 31,
ial Highlights
Before Income Taxes
FINANCIAL & OPE
Capital Investments
Proceeds from Debt
Cash Dividends to Occidental
Net Cash (Used) Provided by Other Financing Activities
Total Assets
Long-Term Debt
Equity/Net Inv
eighted Ave
E d Sh
tional Highlights
Production:
Crude Oil (MBbl/d)
NGLs (MBbl/d)
Natural Gas (MMcf/d)
Total (MBoe/d)
Average R
Crude ($
NGLs ($/
Natural Ga
Reserves:
Crude Oil (MMBbl)
NGLs (MMBbl)
Natural Gas (Bcf)
tal (MBoe/d)
eplacement from Capital Progra
(a) On November 30, 2014, the spin-off date from Occidental Petroleum Corporation, 381.4 million shares of our common stock were distributprovide a more meaningful calculation of weighted-average shares outstanding, we have assumed these amounts to be outstanding for each
All statements, other than statements of historical fact, included in this report that address activities, events or developments that Californi“anticipate,” “plan,” “intend,” “should,” “would,” “could,” or other similar expressions are intended to identify forward-looking statements, wand operating results, including as to the Company’s drilling program, production, hedging activities, capital expenditure levels and other guactual results to differ materially from those implied or expressed by the forward-looking statements. These include, but are not limited to, cto implement our capital investment program profi tably or at all; compliance with regulations or changes in regulations and the ability to obnature of estimates of proved reserves and related future net cash fl ows; inability to drill identifi ed locations when planned or at all; restrictrelated to our acquisition activities; catastrophic events for which we may be uninsured or underinsured; cyber attacks; operational issues twhich such statement is made and the Company undertakes no obligation to correct or update any forward-looking statement, except as req
Acreage (in thousands):
Net Developed
Net Undeveloped
Total
Closing Share Price
HIGHLIGHTSHIGHLIGHTS
1
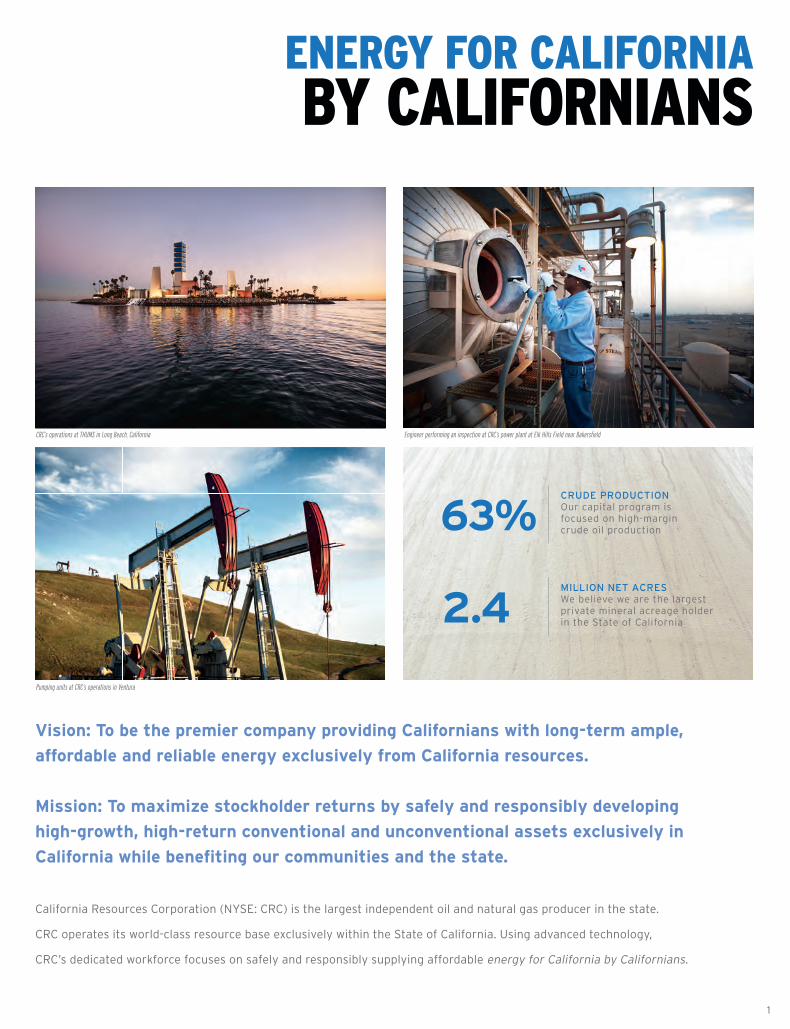
Vision: To be the premier company providing Californians with long-term ample,
affordable and reliable energy exclusively from California resources.
Mission: To maximize stockholder returns by safely and responsibly developing
high-growth, high-return conventional and unconventional assets exclusively in
California while benefi ting our communities and the state.
California Resources Corporation (NYSE: CRC) is the largest independent oil and natural gas producer in the state.
CRC operates its world-class resource base exclusively within the State of California. Using advanced technology,
CRC’s dedicated workforce focuses on safely and responsibly supplying affordable energy for California by Californians.
63%CRUDE PRODUCTIONOur capital program is focused on high-margin crude oil production
2.4MILLION NET ACRES We believe we are the largest private mineral acreage holder in the State of California
EnERGY FOR CAlIFORnIABY CAlIFORnIAnS
CRC’s operations at THUMS in Long Beach, California
Pumping units at CRC’s operations in Ventura
Engineer performing an inspection at CRC’s power plant at Elk Hills Field near Bakersfi eld

2Plant operators at CRC’s cryogenic gas processing plant at Elk Hills Field near Bakersfield, California

3
Dear Stockholder,
I welcome you as an inaugural stockholder
of California Resources Corporation (CRC),
a company built on a solid foundation of
high-quality assets, with an especially promising
future as a newly independent oil and natural
gas company.
We begin with a clear focus — to maximize
stockholder returns by safely and responsibly
developing conventional and unconventional
assets exclusively in California while serving as
responsible stewards and valued neighbors in
the communities where we operate.
We bring three competitive strengths to our
mission — world-class assets, operational and
fi nancial fl exibility, and an experienced board of
directors and management team committed to
increasing your share value. To capitalize on these
strengths, we are implementing a value-driven
capital-investment strategy focused on sustaining
economic production and enhancing our net
asset value, with the objective of living within our
annual cash fl ows and de-levering over time.
As you are likely aware, oil and natural gas
markets have entered into a cyclical downturn,
driven largely by global supply and demand
fundamentals. These factors confront CRC with
the challenges of a lower price environment,
but also present us with the opportunity to
demonstrate our competitive advantages through
the lower end of the commodity price cycle.
We benefi t from operational control of almost
all of our fi elds and our diversifi ed, fl exible
portfolio of assets. We have suffi cient liquidity
for our capital program and a strong asset
base to operate within our cash fl ows, and we
have a management team in place with deep
experience in all phases of the energy industry
cycle. We are closely monitoring market
conditions and have already implemented
decisive measures to adapt to this new price
environment. As a result, we believe CRC is
well positioned to emerge from the current
commodity price downturn with a solid base.
Let me provide a more in-depth summary
of our core strengths: a world-class asset
base, operational and fi nancial fl exibility
and our experienced board of directors and
management team.
A MESSAGE TO OuR
STOCKhOlDERS

4
The California Opportunity
California Resources Corporation was
launched as the largest independent oil
and natural gas producer in the state.
We are able to achieve that level of
production partly because we enjoy the
largest privately held mineral acreage
position in the state with operations in
all four of California’s major oil and gas
basins: the San Joaquin, Los Angeles,
Ventura and Sacramento basins.
California is a tremendous oil province
and has fi ve fi elds that rank in the top 12
for production in the contiguous lower 48
states. We operate 137 oil and natural gas
fi elds — nearly half the fi elds in the state
— with an average recovery factor to date
of 22 percent of an estimated 40 billion
barrels of original oil in place.1 Most of
our production comes from Kern County,
which is the largest oil-producing county
in the continental United States. Overall,
CRC has 2.4 million net mineral acres in
California — larger than the combined
areas of California’s 80 biggest cities
including Los Angeles, San Diego, San
Jose and Bakersfi eld — with approximately
60 percent of that acreage held in fee.
We plan to drive long-term stockholder
value by applying modern technology
to develop this vast resource base and
increase production. We have signifi cant
conventional opportunities to pursue,
and we intend to develop our fi elds
through their life cycles by increasing
recovery factors as we transition from
primary production to secondary
recovery with waterfl oods and in some
cases steamfl oods and other enhanced
recovery methods. In addition to our
wealth of conventional assets, we
have signifi cant unconventional assets
and acreage that we can develop for
future growth. Our diverse portfolio of
long-lived assets also positions us to
conserve natural resources, including
water, habitat and energy, by maximizing
the recovery from existing fi elds using
existing infrastructure.
A Deep, Experienced
Management Team
While CRC is a new company, we benefi t
from Occidental Petroleum Corporation’s
long and rich operating experience
in California. We have formed strong
leadership and technical teams with
proven management and geologic
and engineering expertise to develop
our prolifi c fi elds. Many of CRC’s key
personnel, from the corporate offi ce to
our production facilities, helped build our
current position in California and have
extensive experience operating our assets.
This team also has decades of experience
working successfully with our regulators
and our communities to develop these
resources with exemplary safety and
environmental performance. Our
employees are energized about our new
company and devoted to implementing
our development projects to sustain
production, drive overall effi ciencies
and uphold our company’s core values.
In particular, I commend our workforce
for achieving record safety performance
in 2014 and remaining focused on our
mission during a year of organizational
and market changes. We are proud of
CRC’s heritage and very excited about
what we can accomplish together.
A Disciplined Strategy
with Financial and
Operational Flexibility
To grow our net asset value, our
long-term strategic plan is to reinvest
substantially all of our operating cash
fl ows after debt service in our oil-
focused, high-return assets including
lower-risk conventional projects and
select unconventional opportunities.
CRC’s strategy delivered crude oil
production growth of 12 percent in
2014, and we replaced 203 percent2
of our 2014 production through our
capital program. Even while we focus
on oil, we remain the state’s leading
producer of natural gas, and our Elk Hills
power plant has the capacity to supply
electricity to more than 500,000 homes.
California Resources Corporation began
trading publicly under the NYSE ticker
“CRC” on December 1, 2014, after we
offi cially spun off from Occidental.
As part of the recapitalization for our
spin-off, CRC assumed certain debt
obligations. These include $5 billion in
1. We use certain terms in this report, such as oil in place, that Securities and Exchange Commission (SEC) guidelines strictly prohibit us from using in our SEC fi lings. These terms represent our internal estimates of volumes of oil and gas that are potentially recoverable through exploratory drilling or additional drilling or recovery techniques and are not intended to correspond to probable or possible reserves as defi ned by SEC regulations. By their nature these estimates are more speculative than proved, probable or possible reserves and subject to greater risk they will not be realized.
2. The reserves replacement ratio is calculated for a specifi ed period using the applicable proved oil-equivalent additions divided by oil-equivalent production. 76% of the additions are proved undeveloped. There is no guarantee that historical sources of reserves additions will continue as many factors fully or partially outside management’s control, including the underlying geology, commodity prices and availability of capital, affect reserves additions. Management uses this measure to gauge results of its capital allocation. The measure is limited in that reserves may be added and produced based on costs incurred in separate periods and other oil and gas producers may use different replacement ratios affecting comparability.

5
notes, a $1 billion pre-payable term loan,
with the first payment due in 2016, and a
$2 billion bank line of credit, or revolver,
which provides substantial available
capacity for working capital needs.
We have already implemented significant
measures to adapt to the recent drop
in oil and gas prices and are evaluating
different ways to de-lever our balance
sheet, including using our cash flow
for both debt reduction and capital
investment in the near term.
CRC’s rigorous capital allocation process
applies our Value Creation Index (VCI)
to prioritize development projects.
Recognizing the long-lived nature of
our fields, our VCI measures the net
present value of the expected pre-tax
cash flows of a project over the life of the
project against the present value of the
investment. To develop our investment
plans for 2015, we applied our VCI
and evaluated each project’s ability to
generate a VCI greater than 1.3, meaning
that 30 cents of expected value is created
above every dollar invested.
Contributing to California
Our board, management team and
employees share three core values —
Character, Responsibility and Commitment
— that define how we conduct business
and interact with our stockholders,
creditors, workforce, partners, regulators
and communities. As we work to create
and deliver value to our stockholders,
we are also committed to contributing to
California — because we are the pure-play
California energy company.
California has suffered from a chronic
energy deficit. California imports
approximately 90 percent of its natural
gas supply, 60 percent of its crude oil
needs and approximately 25 percent of
its electricity. Nearly half of the oil used
in the state is imported by supertankers
from foreign countries like Saudi Arabia,
Ecuador and Iraq. As a significant
energy player and an economic engine
in the state, we are doing our part to
increase energy security, create well-
paying jobs and provide royalties and
tax revenues to the state. In 2014,
we produced 118,000 barrels per day
of crude oil and natural gas liquids
(NGLs), 246 million cubic feet per
day of natural gas and 462 gross
megawatts of electricity per hour.
The drought is a critical issue in
California. Through significant
investments in water
conservation and recycling,
we recycled approximately
79 percent of our produced
water to meet our
operational needs
in 2014. In addition,
our steamflood
operations
supplied a
record
2 billion
gallons of
water for
agricultural use in 2014. As a result,
our company is a net water supplier
to agriculture in the state, providing a
greater volume for irrigation than the
amount of fresh water we purchase for
our statewide operations.
In summary, we have an extraordinary and
resilient resource base that can weather
the volatility of the commodity cycle. As
your management team, we will be good
stewards of your CRC investment by
utilizing our VCI metric to maximize the
value of our resource base and reward
stockholders over the long term. We are
proud to be one of the top independent oil
and gas companies in the United States,
producing secure and affordable energy
for California by Californians. We hope you
are as excited about the future as we are.
Regards,
Todd A. Stevens, President & CEO
6
Dear Stockholder,
California Resources Corporation’s spin-off
from Occidental Petroleum Corporation was
structured to create an industry-leading,
pure-play exploration and production company
focused exclusively on California, one of the most
prolifi c global hydrocarbon provinces. Cash fl ow
generated from operations in California will be
reinvested in California, where we have a world-
class resource base with vast untapped potential.
Over the long-term, we believe this potential
will drive the creation of substantial value for
stockholders and contribute meaningfully to
California’s economy, environment and energy
supply, and will reduce the state’s chronic
energy defi cit.
As many of our investors know, prior to the
spin-off, our California assets generated
signifi cant free cash fl ow that was returned to
Occidental to fund its dividend and investment
needs. As a stand-alone company, we can now
fully deploy our cash fl ows, after debt service
and reduction, into capital investment.
Your board believes you have an excellent
management team with deep experience in
place to develop these assets. And we have
committed the company to core values that
will help ensure we conduct business safely
and responsibly.
We are constructive partners with our
communities and our state. And we are fi rmly
committed to solid corporate governance and
take seriously our responsibilities as your
board of directors.
I strongly believe that CRC has assembled a
board that is not only committed to increasing
stockholder value, but is comprised of individuals
who have a track record of doing so. Each board
member brings distinct expertise to furthering
our objective of increasing stockholder value.
Our goal was to assemble an exemplary
board for CRC that had deep knowledge and
breadth of experience not only in the oil and
gas industry, but also in the areas of fi nance,
audit, governance and management of a large
company in California. We have accomplished
this, and you as the stockholder will be
rewarded with their oversight, based on their
talents and expertise.
CRC has a ten-member board with eight
directors qualifying as independent directors.
CRC also has the good fortune to have Harold
Korell serve as our lead independent director.
Harold brings over four decades of experience
in the energy business to this important role.
CRC also has the requisite three committees:
nominating and corporate governance, audit
and compensation, along with a health, safety
and environmental committee.
I am honored and privileged to serve with a
board of this caliber and am confi dent that
CRC’s strategy and opportunity set will provide
a powerful combination to deliver superior
performance to our investors.
Regards,
William E. “Bill” Albrecht, Executive Chairman
A MESSAGE FROM
ThE ChAIRMAn

7Field operator at CRC’s operations at THUMS in Long Beach, California

8
2014 was a year of signifi cant
accomplishment for California Resources
Corporation, as we completed our
spin-off from Occidental Petroleum
Corporation and began executing our
focused capital strategy. CRC is now the
largest independent oil and natural gas
producer in the state.
To prepare for the spin-off, CRC
gathered information and built fi nancial
processes and other support systems
in a very short period of time to
operate successfully as a stand-alone
independent company. CRC issued
$5 billion of public debt in three
tranches and negotiated an unsecured
bank facility consisting of a pre-payable
$1 billion term loan and a $2 billion
revolver. This activity culminated in
a $6 billion payment to Occidental
structured as part of the spin-off. At
year-end, CRC had a total of $6.4 billion
of outstanding long-term debt.
Refl ecting our seamless transition to
independence, CRC generated core3
income of $650 million ($1.67 per
diluted share) for the 12 months of
2014, compared with $869 million
($2.24 per diluted share) for 2013.
We had operational cash fl ow of
$2.4 billion, allowing us to fund our
capital investments from our cash fl ow.
Our 2014 daily oil and gas production
volumes averaged a record 159,000
barrels of oil equivalent (BOE),
compared with 154,000 BOE in 2013.
This increase was largely driven by
our focus on long-term value creation
through investments in our conventional
assets such as water and steamfl ood
operations. Realized crude oil prices
decreased 11 percent to $92.30 per
barrel for the 12 months of 2014,
compared with $104.16 per barrel for
2013. Natural gas liquid (NGL) prices
decreased 5 percent to $47.84 per
barrel for 2014, from $50.43 per barrel
for 2013. Natural gas prices increased
18 percent in the 12 months of 2014 to
$4.39 per thousand cubic feet (Mcf),
compared with $3.73 per Mcf for 2013.
Across all of our California operations,
we drilled 1,048 wells in 2014, of which
73 were focused on primary production,
259 were in waterfl ood fi elds, 532 were
in our steamfl oods and 184 wells were in
unconventional reservoirs. We invested
$1.3 billion in drilling and completion
capital in 2014. Our 2014 total capital
program of $2.1 billion also included
investments in infrastructure upgrades,
facilities, workovers and exploration.
Our capital program added 118 million
BOE of proved reserves in 2014,
representing a 203 percent organic
reserve replacement ratio. In addition,
we invested $300 million in 2014 for the
aquisition of properties with 6 million
BOE of proved reserves, unproved
properties and mineral interests.
San Joaquin Basin
We drilled 847 wells in the San Joaquin
Basin in 2014; these consisted of
722 producers and 125 injector wells.
We invested almost $900 million on
2014 RESulTS SuMMARY
3. Core results refl ect certain unusual and infrequent charges disclosed in the Form 10-K.

9
drilling and completions in our
San Joaquin Basin operations, with
an additional $100 million investment
to acquire producing properties and
mineral interests and $105 million
for exploration. We produced 64,000
barrels per day (Bbl/d) of crude oil,
180 million cubic feet per day (MMcf/d)
of natural gas and 18,000 Bbl/d of
NGLs in this region. Reserves stood at
525 million BOE at year-end 2014 with
12,600 net drilling locations.
Los Angeles Basin
In our Los Angeles Basin operations,
where we have mainly waterfl oods, we
drilled 177 wells including 123 producers
and 54 injectors. The capital invested for
this drilling activity was $340 million.
We produced 29,000 Bbl/d of crude
oil, and 1 MMcf/d of natural gas in this
region. The year-end reserves were
166 million BOE in the Los Angeles Basin
with 1,900 net drilling locations.
Ventura Basin
In the Ventura Basin, we invested
$43 million to drill and complete
21 wells. We also acquired producing
properties and mineral acreage in
the West Montalvo Field in the fourth
quarter for $200 million. We produced
6,000 Bbl/d of crude oil, 11 MMcf/d of
natural gas and 1,000 Bbl/d of NGLs in
this region. Our year-end reserves in
the basin were 58 million BOE with
1,800 net drilling locations.
Sacramento Basin
We drilled three deep gas wells in the
Sacramento Basin in 2014 representing
$7 million of investment. We produced
54 MMcf/d in the basin. Our year-end
reserves were 19 million BOE with 900
net drilling locations for this region.
Exploration
Success
In our exploration
program, we had
notable successes in
our conventional
reservoir drilling from
proven play trends
offsetting the Pleito
Ranch Field in the
San Joaquin Basin
and the Bardsdale Field in the
Ventura Basin.
We continue to develop our
understanding and knowledge of the
signifi cant prospective resources in
the exploration of shale reservoirs. In
2014, we completed signifi cant log, core
and seismic data acquisition projects
targeting the Kreyenhagen exploration
shale reservoir around the Kettleman
North Dome and Middle Dome fi elds.
Proactive Stewardship
of Capital
We have successfully launched CRC as
a strong independent company in 2014
with a world-class resource base and
a capital allocation strategy focused
on enhancing stockholder value.
We took immediate steps to address
the steep decline in commodity prices.
In December 2014, our fi rst month as
an independent company, we reduced
our rig count from 27 rigs in late
November to six rigs at year-end.
We could act quickly because of our
nearly 100 percent operational control
of our fi elds. Our rapid adjustment of
our activity levels will enhance our
economics as we move through this
trough in the commodity cycle.
At the same time, we are optimizing
our diverse portfolio to accelerate
drilling and development projects
as market conditions improve.
We produced 29,000 Bbl/d of crude
oil, and 1 MMcf/d of natural gas in this
region. The year-end reserves were
166 million BOE in the Los Angeles Basin
and the Bardsdale Field in the
Ventura Basin.
We continue to develop our
understanding and knowledge of the
signifi cant prospective resources in
the exploration of shale reservoirs. In
2014, we completed signifi cant log, core
and seismic data acquisition projects
targeting the Kreyenhagen exploration
shale reservoir around the Kettleman
the West Montalvo Field in the fourth
quarter for $200 million. We produced
6,000 Bbl/d of crude oil, 11 MMcf/d of
natural gas and 1,000 Bbl/d of NGLs in
this region. Our year-end reserves in
Proactive Stewardship
of Capital
We have successfully launched CRC as
a strong independent company in 2014
with a world-class resource base and
We drilled three deep gas wells in the
Sacramento Basin in 2014 representing
$7 million of investment. We produced
54 MMcf/d in the basin. Our year-end
reserves were 19 million BOE with 900
net drilling locations for this region.
a capital allocation strategy focused
on enhancing stockholder value.
We took immediate steps to address
the steep decline in commodity prices.
In December 2014, our fi rst month as
an independent company, we reduced
November to six rigs at year-end.
We could act quickly because of our
nearly 100 percent operational control
9
notable successes in
our conventional
reservoir drilling from
proven play trends
offsetting the Pleito
Ranch Field in the
San Joaquin Basin
of our fi elds. Our rapid adjustment of
our activity levels will enhance our
economics as we move through this
trough in the commodity cycle.
At the same time, we are optimizing
our diverse portfolio to accelerate
drilling and development projects
as market conditions improve.

10
William E. AlbrechtExecutive Chairman of the Board,
California Resources Corporation
Todd A. StevensPresident, Chief Executive Offi cer and
Director, California Resources Corporation
Justin A. Gannon1 , 3
Former Regional Managing Partner,
Grant Thornton LLP
Harold M. Korell 2, 3 Lead Independent Director;
Former Chairman of the Board,
Southwestern Energy Company
Robert V. Sinnott 2
President, Chief Executive Offi cer
and Chief Investment Offi cer,
Kayne Anderson Capital Advisors, L.P.
Richard W. Moncrief 1 , 4
President and Chairman of the Board,
Moncrief Oil International, Inc.
Timothy J. Sloan3, 4
Senior Executive Vice President,
Wholesale Banking, Wells Fargo
& Company
Ronald L. Havner, Jr.1 , 4
Chairman of the Board, President and
Chief Executive Offi cer, Public Storage
Catherine A. Kehr 1 , 3, *Former Senior Vice President and
Director of Capital Research Company,
The Capital Group Companies
Avedick B. Poladian 2, 4
Executive Vice President and Chief
Operating Offi cer, Lowe Enterprises, Inc.
1 Audit Committee
2 Nominating and Governance Committee
3 Compensation Committee
4 Health, Safety and Environmental Committee
* Member of the Board as of March 15, 2015

11
BOARD OF
DIRECTORS

12
nO.1California Resources
Corporation (CRC) is the
largest independent oil
and natural gas producer
in the state.
CRCCRC has operations at the
Elk Hills Field in Kern County,
the Wilmington Field in
Long Beach and fields in the
Los Angeles, San Joaquin,
Ventura and Sacramento basins.
2bilIn 2014, CRC supplied
more than 2 billion gallons
of water for agriculture
through our steamflood
operations. As a result,
CRC provided more water
for irrigation than the amount
of fresh water we purchased
for our statewide operations.
2.4CRC is the largest private
net mineral acreage holder in
California with about 2.4 million
net acres, larger than the
combined areas of California’s
80 biggest cities, including
Los Angeles, San Diego,
San Jose and Bakersfield.
203%In 2014, CRC replaced 203
percent of its production from
its capital program. At year-
end, CRC’s properties held an
estimated 768 million barrels of
oil equivalent in proved reserves.
540At Elk Hills, CRC operates
efficient gas processing facilities
with a combined capacity of
540 million cubic feet of gas
per day, including the largest
cryogenic gas plant in California.
leader in safetyIn 2014, CRC’s dedicated
California workforce
achieved their best-
ever combined safety
performance. The 2014
Injury and Illness Incidence
Rate (IIR) of 0.46 was 86
percent better than the 2013
average IIR of 3.3 for the
private sector in the U.S.
159mCRC’s operations produced
159,000 barrels of oil
equivalent per day in 2014.
nO.1Kern County is the leading
county in oil production in
the lower 48 states.
of12CRC operates in 4 of the
12 largest fields in the
continental United States.
CAlIFORnIA RESOuRCES CORpORATIOn
SnApShOT

CRC 2014
FORM 10-K

UNITED STATES SECURITIES AND EXCHANGE COMMISSIONWashington, D.C. 20549
Form 10-K
� ANNUAL REPORT PURSUANT TO SECTION 13 OR 15(d) OF THE SECURITIES EXCHANGE ACT OF 1934For the fiscal year ended December 31, 2014
� TRANSITION REPORT PURSUANT TO SECTION 13 OR 15(d) OF THE SECURITIES EXCHANGE ACT OF 1934For the transition period from to
Commission File Number 001-36478
California Resources Corporation(Exact name of registrant as specified in its charter)
Delaware 46-5670947(State or other jurisdiction of (I.R.S. Employerincorporation or organization) Identification No.)
10889 Wilshire Blvd. 90024Los Angeles, California (Zip Code)
(Address of principal executive offices)(888) 848-4754
(Registrant’s telephone number, including area code)
Securities registered pursuant to Section 12(b) of the Act:
Title of Each Class Name of Each Exchange on Which RegisteredCommon Stock New York Stock Exchange
Securities registered pursuant to Section 12(g) of the Act: None
Indicate by check mark if the registrant is a well-known seasoned issuer, as defined in Rule 405 of the SecuritiesAct. Yes � No �
Indicate by check mark if the registrant is not required to file reports pursuant to Section 13 or Section 15(d) ofthe Act: Yes � No �
Indicate by check mark whether the registrant (1) has filed all reports required to be filed by Section 13 or 15(d)of the Securities Exchange Act of 1934 during the preceding 12 months (or for such shorter period that the registrantwas required to file such reports), and (2) has been subject to such filing requirements for the past 90 days. Yes �No �
Indicate by check mark whether the registrant has submitted electronically and posted on its corporate Web site,if any, every Interactive Date File required to be submitted and posted pursuant to Rule 405 of Regulation S-T duringthe preceding 12 months (or such shorter period as the registrant was required to submit and post files). Yes � No �
Indicate by check mark if disclosure of delinquent filers pursuant to Item 405 of Regulation S-K is not containedherein, and will not be contained, to the best of registrant’s knowledge, in definitive proxy or information statementsincorporated by reference in Part III of this Form 10-K or any amendment to this Form 10-K. �
Indicate by check mark whether the registrant is a large accelerated filer, an accelerated filer, a non-acceleratedfiler, or a smaller reporting company. See the definitions of ‘‘large accelerated filer,’’ ‘‘accelerated filer’’ and ‘‘smallerreporting company’’ in Rule 12b-2 of the Exchange Act.
Large Accelerated Filer � Accelerated Filer �Non-Accelerated Filer � Smaller Reporting Company �
Indicate by check mark whether the registrant is a shell company (as defined in Rule 12b-2 of the Act) Yes � No �
As of June 30, 2014, there was no public market for the registrant’s common stock.
At January 31, 2015, there were 385,639,582 shares of Common Stock outstanding.
DOCUMENTS INCORPORATED BY REFERENCE
Portions of the registrant’s definitive proxy statement to be filed with the Securities and Exchange Commissionin connection with the registrant’s 2015 Annual Meeting of Stockholders, are incorporated by reference into Part III ofthis Form 10-K.
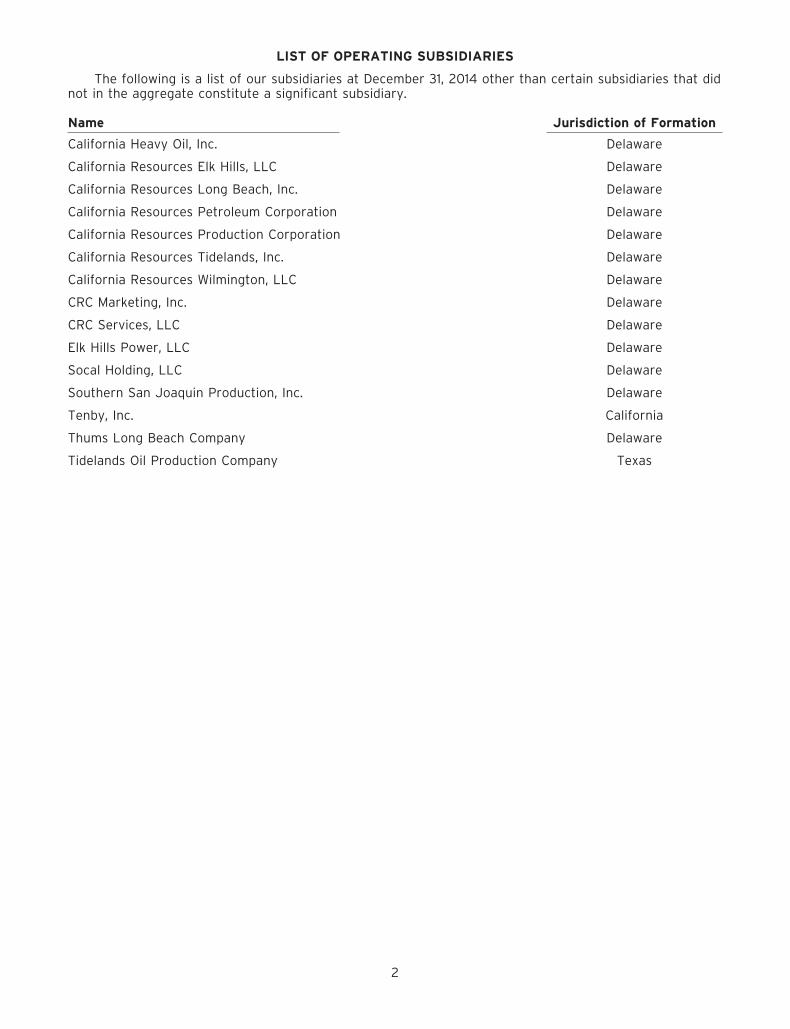
LIST OF OPERATING SUBSIDIARIES
The following is a list of our subsidiaries at December 31, 2014 other than certain subsidiaries that didnot in the aggregate constitute a significant subsidiary.
Name Jurisdiction of Formation
California Heavy Oil, Inc. Delaware
California Resources Elk Hills, LLC Delaware
California Resources Long Beach, Inc. Delaware
California Resources Petroleum Corporation Delaware
California Resources Production Corporation Delaware
California Resources Tidelands, Inc. Delaware
California Resources Wilmington, LLC Delaware
CRC Marketing, Inc. Delaware
CRC Services, LLC Delaware
Elk Hills Power, LLC Delaware
Socal Holding, LLC Delaware
Southern San Joaquin Production, Inc. Delaware
Tenby, Inc. California
Thums Long Beach Company Delaware
Tidelands Oil Production Company Texas
2

TABLE OF CONTENTS
Page
Part IItems 1 Business . . . . . . . . . . . . . . . . . . . . . . . . . . . . . . . . . . . . . . . . . . . . . . . . . . . . . . . . . . . . . . . . 5
General . . . . . . . . . . . . . . . . . . . . . . . . . . . . . . . . . . . . . . . . . . . . . . . . . . . . . . . . . . . . . . . . 5Business Operations . . . . . . . . . . . . . . . . . . . . . . . . . . . . . . . . . . . . . . . . . . . . . . . . . . . . . . 5Our Business Strategy . . . . . . . . . . . . . . . . . . . . . . . . . . . . . . . . . . . . . . . . . . . . . . . . . . . . . 7Our Competitive Strengths . . . . . . . . . . . . . . . . . . . . . . . . . . . . . . . . . . . . . . . . . . . . . . . . . . 8Portfolio Management and 2015 Capital Budget . . . . . . . . . . . . . . . . . . . . . . . . . . . . . . . . . . . 9Reserves and Production Information . . . . . . . . . . . . . . . . . . . . . . . . . . . . . . . . . . . . . . . . . . 10Marketing Arrangements . . . . . . . . . . . . . . . . . . . . . . . . . . . . . . . . . . . . . . . . . . . . . . . . . . . 10Regulation in the Oil and Natural Gas Industry . . . . . . . . . . . . . . . . . . . . . . . . . . . . . . . . . . . 11Employees . . . . . . . . . . . . . . . . . . . . . . . . . . . . . . . . . . . . . . . . . . . . . . . . . . . . . . . . . . . . . 15Available Information . . . . . . . . . . . . . . . . . . . . . . . . . . . . . . . . . . . . . . . . . . . . . . . . . . . . . . 15
Item 1A Risk Factors . . . . . . . . . . . . . . . . . . . . . . . . . . . . . . . . . . . . . . . . . . . . . . . . . . . . . . . . . . . . . . 15Item 1B Unresolved Staff Comments . . . . . . . . . . . . . . . . . . . . . . . . . . . . . . . . . . . . . . . . . . . . . . . . . . 26Item 2 Properties . . . . . . . . . . . . . . . . . . . . . . . . . . . . . . . . . . . . . . . . . . . . . . . . . . . . . . . . . . . . . . . 27
Our Operations . . . . . . . . . . . . . . . . . . . . . . . . . . . . . . . . . . . . . . . . . . . . . . . . . . . . . . . . . . 27Our Reserves and Production Information . . . . . . . . . . . . . . . . . . . . . . . . . . . . . . . . . . . . . . . 31Determination of Identified Drilling Locations . . . . . . . . . . . . . . . . . . . . . . . . . . . . . . . . . . . . 36Production, Price and Cost History . . . . . . . . . . . . . . . . . . . . . . . . . . . . . . . . . . . . . . . . . . . . 38Productive Wells . . . . . . . . . . . . . . . . . . . . . . . . . . . . . . . . . . . . . . . . . . . . . . . . . . . . . . . . . 40Acreage . . . . . . . . . . . . . . . . . . . . . . . . . . . . . . . . . . . . . . . . . . . . . . . . . . . . . . . . . . . . . . . 41Participation in Exploratory and Development Wells Being Drilled and Drilling Activity . . . . . . . 41Delivery Commitments . . . . . . . . . . . . . . . . . . . . . . . . . . . . . . . . . . . . . . . . . . . . . . . . . . . . . 42Our Infrastructure . . . . . . . . . . . . . . . . . . . . . . . . . . . . . . . . . . . . . . . . . . . . . . . . . . . . . . . . 42
Item 3 Legal Proceedings . . . . . . . . . . . . . . . . . . . . . . . . . . . . . . . . . . . . . . . . . . . . . . . . . . . . . . . . . 43Item 4 Mine Safety Disclosures . . . . . . . . . . . . . . . . . . . . . . . . . . . . . . . . . . . . . . . . . . . . . . . . . . . . . 43
Executive Officers . . . . . . . . . . . . . . . . . . . . . . . . . . . . . . . . . . . . . . . . . . . . . . . . . . . . . . . . . 44
Part IIItem 5 Market for Registrant’s Common Equity, Related Stockholder Matters and Issuer Purchases of
Equity Securities . . . . . . . . . . . . . . . . . . . . . . . . . . . . . . . . . . . . . . . . . . . . . . . . . . . . . . . . . . 45Item 6 Selected Financial Data . . . . . . . . . . . . . . . . . . . . . . . . . . . . . . . . . . . . . . . . . . . . . . . . . . . . . . 47Item 7 Management’s Discussion and Analysis of Financial Condition and Results of Operations (MD&A) 48
The Separation and Spin-off . . . . . . . . . . . . . . . . . . . . . . . . . . . . . . . . . . . . . . . . . . . . . . . . . 48Basis of Presentation and Certain Factors Affecting Comparability . . . . . . . . . . . . . . . . . . . . . 48Business Environment and Industry Outlook . . . . . . . . . . . . . . . . . . . . . . . . . . . . . . . . . . . . . 48Seasonality . . . . . . . . . . . . . . . . . . . . . . . . . . . . . . . . . . . . . . . . . . . . . . . . . . . . . . . . . . . . . 50Taxes . . . . . . . . . . . . . . . . . . . . . . . . . . . . . . . . . . . . . . . . . . . . . . . . . . . . . . . . . . . . . . . . . 50Operations . . . . . . . . . . . . . . . . . . . . . . . . . . . . . . . . . . . . . . . . . . . . . . . . . . . . . . . . . . . . . 50Results . . . . . . . . . . . . . . . . . . . . . . . . . . . . . . . . . . . . . . . . . . . . . . . . . . . . . . . . . . . . . . . . 51Balance Sheet Analysis . . . . . . . . . . . . . . . . . . . . . . . . . . . . . . . . . . . . . . . . . . . . . . . . . . . . 53Statement of Operations Analysis . . . . . . . . . . . . . . . . . . . . . . . . . . . . . . . . . . . . . . . . . . . . . 54Liquidity and Capital Resources . . . . . . . . . . . . . . . . . . . . . . . . . . . . . . . . . . . . . . . . . . . . . . 56Cash Flow Analysis . . . . . . . . . . . . . . . . . . . . . . . . . . . . . . . . . . . . . . . . . . . . . . . . . . . . . . . 58Acquisitions . . . . . . . . . . . . . . . . . . . . . . . . . . . . . . . . . . . . . . . . . . . . . . . . . . . . . . . . . . . . 592014 Capital Program and 2015 Capital Budget . . . . . . . . . . . . . . . . . . . . . . . . . . . . . . . . . . . 59Off-Balance-Sheet Arrangements . . . . . . . . . . . . . . . . . . . . . . . . . . . . . . . . . . . . . . . . . . . . . 60Lawsuits, Claims, Contingencies and Commitments . . . . . . . . . . . . . . . . . . . . . . . . . . . . . . . . 61Critical Accounting Policies and Estimates . . . . . . . . . . . . . . . . . . . . . . . . . . . . . . . . . . . . . . 61Significant Accounting and Disclosure Changes . . . . . . . . . . . . . . . . . . . . . . . . . . . . . . . . . . . 63
Item 7A Quantitative and Qualitative Disclosures About Market Risk . . . . . . . . . . . . . . . . . . . . . . . . . . . 63Forward-Looking Statements . . . . . . . . . . . . . . . . . . . . . . . . . . . . . . . . . . . . . . . . . . . . . . . . . . 65
Item 8 Financial Statements and Supplementary Data . . . . . . . . . . . . . . . . . . . . . . . . . . . . . . . . . . . . . 67Report of Independent Registered Public Accounting Firm on Consolidated and CombinedFinancial Statements . . . . . . . . . . . . . . . . . . . . . . . . . . . . . . . . . . . . . . . . . . . . . . . . . . . . . . 67Consolidated and Combined Balance Sheets . . . . . . . . . . . . . . . . . . . . . . . . . . . . . . . . . . . . . 68Consolidated and Combined Statements of Operations . . . . . . . . . . . . . . . . . . . . . . . . . . . . . . 69Consolidated and Combined Statements of Comprehensive Income . . . . . . . . . . . . . . . . . . . . . 70Consolidated and Combined Statements of Equity . . . . . . . . . . . . . . . . . . . . . . . . . . . . . . . . . 70Consolidated and Combined Statements of Cash Flows . . . . . . . . . . . . . . . . . . . . . . . . . . . . . 71Notes to Consolidated and Combined Financial Statements . . . . . . . . . . . . . . . . . . . . . . . . . . 72Quarterly Financial Data (Unaudited) . . . . . . . . . . . . . . . . . . . . . . . . . . . . . . . . . . . . . . . . . . 94Supplemental Oil and Gas Information (Unaudited) . . . . . . . . . . . . . . . . . . . . . . . . . . . . . . . . 95
3

Page
Item 9 Changes in and Disagreements with Accountants on Accounting and Financial Disclosure . . . . . . 106Item 9A Controls and Procedures . . . . . . . . . . . . . . . . . . . . . . . . . . . . . . . . . . . . . . . . . . . . . . . . . . . . . 106Item 9B Other Information . . . . . . . . . . . . . . . . . . . . . . . . . . . . . . . . . . . . . . . . . . . . . . . . . . . . . . . . . . 106
Part IIIItem 10 Directors, Executive Officers and Corporate Governance . . . . . . . . . . . . . . . . . . . . . . . . . . . . . . 106Item 11 Executive Compensation . . . . . . . . . . . . . . . . . . . . . . . . . . . . . . . . . . . . . . . . . . . . . . . . . . . . . 107Item 12 Security Ownership of Certain Beneficial Owners and Management and Related Stockholder
Matters . . . . . . . . . . . . . . . . . . . . . . . . . . . . . . . . . . . . . . . . . . . . . . . . . . . . . . . . . . . . . . . . . 107Item 13 Certain Relationships and Related Transactions and Director Independence . . . . . . . . . . . . . . . . 107Item 14 Principal Accountant Fees and Services . . . . . . . . . . . . . . . . . . . . . . . . . . . . . . . . . . . . . . . . . . 107
Part IVItem 15 Exhibits and Financial Statement Schedules . . . . . . . . . . . . . . . . . . . . . . . . . . . . . . . . . . . . . . . 108
4

PART I
Item 1 BUSINESS
In this report, except when the context otherwise requires or where otherwise indicated, (1) allreferences to ‘‘CRC,’’ the ‘‘Company,’’ ‘‘we,’’ ‘‘us’’ and ‘‘our’’ refer to California Resources Corporation andits subsidiaries or the California business, (2) all references to the ‘‘California business’’ refer toOccidental’s California oil and gas exploration and production operations and related assets, liabilities andobligations, which we assumed in connection with the spin-off from Occidental on November 30, 2014 (the‘‘Spin-off’’), and (3) all references to ‘‘Occidental’’ refer to Occidental Petroleum Corporation, our formerparent, and its subsidiaries.
General
We are an independent oil and natural gas exploration and production company operating propertiesexclusively within the State of California. We were incorporated in Delaware as a wholly-owned subsidiaryof Occidental on April 23, 2014 and remained a wholly-owned subsidiary of Occidental until the Spin-off.On November 30, 2014, Occidental distributed shares of our common stock on a pro rata basis toOccidental stockholders and we became an independent, publicly traded company, referred to in thisannual report as the Spin-off. Occidental retained approximately 18.5% of our outstanding shares ofcommon stock which it has stated it intends to divest within 18 months of the Spin-off.
Business Operations
Our business is focused on conventional and unconventional assets, exclusively in California, whichcan generate positive cash flow throughout the oil and natural gas price cycle and have the capacity toprovide significant production and cash flow growth in a higher price environment. We are the largest oiland gas producer in California on a gross operated basis and we believe we have established the largestprivately-held mineral acreage position in the state, consisting of approximately 2.4 million net acresspanning the state’s four major oil and gas basins. We produced on average approximately 159 MBoe/dnet for the year ended December 31, 2014. As of December 31, 2014, we had net proved reserves of 768MMBoe, with approximately 72% proved developed. Oil represented 72% of our proved reserves. Ouraggregate PV-10 value was $16.1 billion. For an explanation of the non-GAAP financial measure PV-10 anda reconciliation of PV-10 to Standardized Measure, the most directly comparable GAAP financial measure,see ‘‘Reserves and Production Information’’ below. Our current drilling inventory comprises a diversifiedportfolio of oil and natural gas locations, which allows us to target drilling projects that are economicallyviable even in a low commodity price environment.
We develop our capital investment programs by prioritizing life of project returns to grow our netasset value over the long term, and balancing the short- and long-term growth potential of each of ourassets. We use a Value Creation Index (‘‘VCI’’) for project selection and capital allocation in our portfolio.The VCI for each project is calculated by dividing the present value of the project’s expected pre-tax cashflow before capital over its life by the present value of the investment, using a 10% discount rate.Projects are expected to meet a VCI of 1.3, meaning that 30% of expected value is created above everydollar invested. The diversity of our portfolio allows us to identify attractive investment opportunities in avariety of operating and commodity price environments. We regularly monitor internal performance andexternal factors and adjust our capital investment program with the objective of creating the most valuefrom our portfolio of drilling opportunities. We intend to fund our capital investment program byreinvesting substantially all of our operating cash flow in our capital program, while considering anypotential deleveraging opportunities.
Approximately 56% of our 2014 production was generated by our world-class Elk Hills andWilmington fields. The remaining 44% was generated through a combination of conventional primary,steamflood and waterflood projects as well as unconventional projects. We grew our total production 5%on a compounded annual basis, from an average of 138 MBoe/d in 2011 to 159 MBoe/d for the year endedDecember 31, 2014, while the proportionate share of oil production for the same period grew from 58% to63%. The growth of our oil production during this period was approximately 8% compounded annually.We expect the percentage of our oil production to continue to increase over time and favorably impactour overall margins as we anticipate directing virtually all of our capital investments toward oil-weightedopportunities in 2015 and beyond to the extent the oil-to-gas price relationship remains favorable. Forexample, our steamflood projects provide some of the highest returns in our portfolio when the oil-to-gasprice ratio exceeds five to one. As of December 31, 2014, the ratio was approximately 23 to one.
5

The following table summarizes certain information concerning our acreage, wells and drillingactivities (as of December 31, 2014, acres and dollars in millions, unless otherwise stated):
2015 2015Gross Average Projected ProjectedIdentified Drilling
Acreage Producing Working Gross DevelopmentAcreage Locations(1)
Held in Wells, Interest Development DrillingGross Net Fee (%) gross (%) Gross Net Wells (2) Capital (3)
San Joaquin Basin 1.9 1.6 58% 6,379 91% 14,450 12,600 265 96Los Angeles Basin(4) <0.1 <0.1 49% 1,476 93% 2,000 1,900 25 54Ventura Basin 0.3 0.3 67% 757 89% 2,350 1,800 — —Sacramento Basin 0.7 0.5 34% 719 80% 1,000 900 — —
Total 2.9 2.4 53% 9,331 89% 19,800 17,200 290 150
(1) Our total identified drilling locations include approximately 2,400 gross (2,300 net) locations associated with provedundeveloped reserves as of December 31, 2014 and 2,500 gross (2,400 net) injection well locations associated with ourwaterflood and steamflood projects. Our total identified drilling locations exclude 6,400 gross (5,300 net) prospectiveresource drilling locations. Please see ‘‘—Our Reserves and Production Information’’ for more information regarding theprocesses and criteria through which we identified our drilling locations. Of our total identified drilling locations, webelieve approximately 75% are attributable to acreage owned or held by production.
(2) Includes 55 injection wells expected to be drilled in connection with our steamflood and waterflood projects.(3) Includes drilling and completion expenditures of $16 million associated with injection wells. Our total 2015 capital budget
of $440 million also includes investments in support equipment, seismic, workovers and exploration.(4) We currently hold approximately 40,400 gross (34,400 net) acres in the Los Angeles basin. Our Los Angeles basin
operations are concentrated with pad drilling.
During 2014, we operated an average of 26 drilling rigs across the state with the majority located inthe San Joaquin and Los Angeles basins. We drilled 1,048 development wells with 847 wells in the SanJoaquin basin, 177 in the Los Angeles basin, 21 in the Ventura basin and 3 in the Sacramento basin. Wealso drilled 9 exploration wells in the San Joaquin basin, 4 in the Ventura basin and 1 in the Sacramentobasin.
As market conditions changed in the fourth quarter of 2014, we reduced our investment and drillingpace and exited the year with an active count of six drilling rigs. We currently have three active rigs withtwo drilling in the San Joaquin basin (targeting steamflood activities), one in the Los Angeles basin(targeting waterflood activities), and none in the Ventura and Sacramento basins. We have also reducedour workover rig count to focus on projects that meet our investment criteria in the current environment.With significant operating control of our properties, we have the ability to adjust our drilling and workoverrig count in 2015 based on commodity prices and are monitoring market conditions to increase ordecrease our program accordingly.
Our large acreage position contains numerous development and growth opportunities due to itsvaried geologic characteristics and multiple stacked pay reservoirs which, in many cases, are thousands offeet thick. We have a large portfolio of lower-risk, high-growth-potential conventional opportunities ineach of our major oil and gas basins with approximately 72% of our proved reserves associated withconventional opportunities. Conventional reservoirs are capable of natural flow using primary, steamfloodand waterflood recovery methods. In 2014, we targeted our capital investments primarily towardconventional development projects, including an increasing number of lower-risk steamflood recoveryprojects, that we expect will contribute significantly to near-term production and cash flow. We also havea significant portfolio of unconventional growth opportunities in lower permeability reservoirs whichtypically utilize established well stimulation techniques. We have approximately 4,800 identified drillinglocations targeting unconventional reservoirs primarily in the San Joaquin basin. Over the last few years,we have continued to focus on higher-value unconventional production by exploiting seven discretestacked pay horizons within the Monterey formation, primarily within the upper Monterey. We are seekingto duplicate our results there in the Kreyenhagen and Moreno formations which have similar geologicalattributes. Over the longer term, as project economics increase, we intend to pursue developmentopportunities in the lower Monterey shale, which contains a variety of reservoir lithologies, but has anextremely limited production history compared to the upper Monterey.
Over the past decade, we have also built a 3D seismic library that covers over 4,250 square miles,representing approximately 90% of the 3D seismic data available in California. We have developedunique, proprietary stratigraphic and structural models of the subsurface geology and hydrocarbonpotential in each of the four basins in which we operate. In recent years we have tested and successfully
6
implemented various exploration, drilling, completion and enhanced recovery technologies to increaserecoveries, growth and returns from our portfolio.
Our Business Strategy
We plan to drive long-term shareholder value by applying modern technology to develop our resourcebase and increase production. We have significant conventional opportunities to pursue, which we developthrough their life-cycles to increase recovery factors by transitioning them from primary production tosteamfloods, waterfloods and other enhanced recovery mechanisms. In the current price environment weare prioritizing oil projects that provide long-term stable cash flows with low production declines and highreturns, such as steamfloods. The principal elements of our long-term business strategy include thefollowing:
• Focus on high-margin crude oil projects to generate sufficient cash flows to internally fundour capital budget. We expect the percentage of our oil production to continue to increaseover time and favorably impact our overall margins as we anticipate directing virtually all of ourcapital investments towards oil-weighted opportunities in 2015 and beyond to the extent theoil-to-gas price relationship remains favorable. Approximately 90% of our drilling inventory isassociated with oil-rich projects. We intend to focus on increasing cost efficiencies anddeveloping profitable opportunities in our portfolio in order to maintain self-funding throughoutthe commodity price cycle. We intend to reinvest substantially all of our operating cash flow inour capital investment program, while considering any potential deleveraging opportunities.
• Increase the share of conventional projects in our production mix to achieve lower declinesand lower base maintenance capital requirements. Our portfolio of assets includes a largenumber of steamflood and waterflood projects that have much lower decline rates than manyunconventional projects, while producing sufficient cash flow to self fund continued development.In the current commodity price environment, we intend to focus a greater portion of our capitalinvestments in such projects, which we expect will result in lower decline rates in our production.Over time, we expect that this strategy will reduce the maintenance capital required to keep baseproduction essentially flat. We have significant additional lower-risk conventional opportunitieswith over 15,000 identified drilling locations, 57% of which are associated with Improved OilRecovery (‘‘IOR’’) and Enhanced Oil Recovery (‘‘EOR’’) projects. The remaining 43% areassociated with primary recovery methods, many of which we expect will develop into IOR andEOR projects in the future.
• Continue to develop high-growth unconventional drilling opportunities. Over the longer termand in a higher oil-price environment, we expect significant production growth to come fromunconventional reservoirs such as tight sandstones and shales. We would expect to generatesufficient cash flow from our conventional projects to fund numerous unconventionalopportunities in our portfolio. We hold mineral interests in approximately 1.3 million net acreswith unconventional potential and have identified 4,800 drilling locations on this acreage. As aresult of our increased focus on these reservoirs over the past few years, a significant portion ofour production now comes from unconventional assets. While we have not yet developedsufficient information to reliably predict success rates across our entire portfolio, our continuedinvestment in unconventional projects is allowing us to better understand performance of thesereservoirs in addition to improving our overall cycle time from project identification todevelopment. As a result of our increased understanding of these reservoirs, we believe we willbe able to direct our capital more precisely to higher value projects, allowing us to strategicallyincrease our investment levels in unconventional drilling over time.
• Aggressively apply proven modern technologies to enhance production growth. Over the lastseveral decades, the oil and gas industry has focused significantly less effort on utilizing moderndevelopment and exploration processes and technologies in California relative to other prolificU.S. basins. We believe this is largely due to other oil companies’ limited capital investments inCalifornia, concentration on shallow zone thermal projects, or investments in other assets withintheir global portfolios. As an independent company focused exclusively on California, we intendto make significant use of proven modern technologies in drilling and completing wells, which weexpect will substantially increase both our cost efficiency and production growth over time. Wehave developed an extensive 3D seismic library covering over 4,250 square miles in all four ofour basins, representing approximately 90% of the 3D seismic data available for California, andhave tested and successfully implemented various exploration, drilling, completion, IOR and EORtechnologies in the state.
7

• Proactive and collaborative approach to safety, environmental protection, and communityrelations. We are committed to developing our assets in a manner that safeguards people andprotects the environment. For example, we seek to proactively engage with regulatory agencies,communities, other stakeholders and our workforce to pursue mutually beneficial outcomes. As aCalifornia company, helping our state meet its water needs during the drought is a key strategicfocus. Through our investments in water conservation and in recycling of produced water fromoil and gas reservoirs, we are a net water supplier to agriculture. In 2014, our steamfloodoperations supplied a record 2 billion gallons of water to California’s agriculture industry,providing more water for irrigation than the fresh water we purchased for our operationsstatewide. We continue to implement measures to further decrease our purchased fresh water,and are designing projects to expand the beneficial use of our produced water over the next fewyears.
• Continued focus on our successful exploration program. As market conditions warrant, weintend to significantly increase our investment in exploration, focusing on both unconventionaland conventional opportunities, primarily in areas that we believe can be quickly developed, suchas those adjacent to our existing properties. In addition, we plan to explore and test newunconventional resource areas, which, if successful, could result in significant longer-termproduction growth.
Our Competitive Strengths
We believe we are well-positioned to successfully execute our business strategies because of thefollowing competitive strengths:
• Flexible asset base that works in different commodity price environments and preservesfuture value and growth potential. Our near 100% operational control of 137 fields in Californiaprovides us flexibility to adapt our investments to various market environments through ourability to select drilling locations, the timing of our development and the drilling and completiontechniques we use. Our large and diverse acreage position, approximately 60% of which we holdin fee, allows us to choose among multiple recovery mechanisms, including primary conventional,steamflood, waterflood and unconventional and to develop various products, including oil, naturalgas and natural gas liquids (‘‘NGLs’’). Approximately 90% of our drilling inventory is associatedwith oil-rich projects, primarily located in the San Joaquin, Los Angeles and Ventura basins, andthe remaining inventory is associated with natural gas properties in the Sacramento, San Joaquinand Ventura basins. The variety of recovery mechanisms and product types available to us,together with our operating control, allows us to allocate capital in a manner designed tooptimize cash flow over a wide range of commodity price environments and target drillingprojects that are economically viable through commodity price cycles. The low base decline ofour conventional assets allows our future cash flows to build as commodity pricing permitscapital investments to resume at higher levels to achieve significant production growth ratesover the longer term.
• Favorable margins driven by California’s deficit energy market. We sell all of our crude oilinto the California refining markets at prices we believe are among the most favorable in theUnited States. California imports over 60% of its oil and approximately 90% of its natural gas. Avast majority of the oil is imported via supertanker, with a minor amount arriving by rail. As aresult, California refiners have typically purchased crude oil at international waterborne-basedprices that have exceeded West Texas Intermediate (‘‘WTI’’) based prices for comparable gradesin recent years. We believe that the limited crude transportation infrastructure from other partsof the country to California will contribute to higher realizations. In addition, we own the feeminerals on approximately 60% of our net acreage position. The returns on developed mineralfee acreage are greatly enhanced because we do not pay royalties and other lease payments.
• Largest acreage position in a world-class oil and natural gas province. We believe we are thelargest private oil and natural gas mineral acreage holder in California, with interests inapproximately 2.4 million net acres. California is one of the most prolific oil and natural gasproducing regions in the world and is the third largest oil producing state in the nation. It hasfive of the 12 largest fields in the lower 48 states based on proved reserves as of 2009, and ourportfolio includes interests in four of these fields. California is also the nation’s largest stateeconomy, and the world’s seventh largest, with significant energy demands that exceed localsupply. Our large acreage position with a diverse development portfolio enables us to pursue theappropriate production strategy for the relevant commodity price environment without the need
8

to acquire new acreage. For example, in a high natural gas price environment we can rapidlyincrease our investments in the Sacramento basin to generate significant production growth. Ourlarge acreage position also allows us to quickly deploy the knowledge we gain in our existingoperations, together with our seismic data, in other areas within our portfolio.
• Significant growth potential from opportunity rich drilling portfolio. Our drilling inventory atDecember 31, 2014 consisted of approximately 19,800 identified well locations, including 15,000gross (12,700 net) conventional drilling locations and approximately 4,800 gross (4,400 net)unconventional drilling locations. We have a large inventory of conventional developmentopportunities that we expect will provide stable lower-risk, near-term production with attractivereturns. We believe we can also achieve significant long-term production growth through thedevelopment of unconventional reservoirs.
• Proven operational management and technical teams with extensive experience operating inCalifornia. Our experienced operational management team and technical staff have a proventrack record of applying modern technologies and operating methods to develop our assets. Themembers of our operational management and technical teams have an average of over 26 years’experience in the oil and natural gas industry, with an average of 17 years focused on Californiaoil and gas operations.
Portfolio Management and 2015 Capital Budget
We develop our capital investment programs by prioritizing life of project returns to grow our netasset value over the long term, while balancing the short- and long-term growth potential of each of ourassets. We use the VCI metric for project selection and capital allocation across our portfolio ofopportunities. The VCI for each project is calculated by dividing the present value of the project’s pre-taxcash flow before capital over its life by the present value of the investment, using a 10% discount rate.Projects are expected to meet a VCI of 1.3, meaning that 30% of expected value is created above everydollar invested.
In light of current commodity prices, our focus on creating value and our commitment to internallyfund our capital budget with operating cash flows, we have significantly reduced our capital investmentbudget for 2015 to $440 million, as compared to $2.1 billion in 2014. We have focused a substantialmajority of our 2015 budget on our mature steamfloods, waterfloods and capital workovers, which havemuch lower decline rates than many unconventional projects. We will also continue to pursue and fundour most attractive unconventional projects.
Our 2015 capital investment budget targets investments in the San Joaquin, Los Angeles and Venturabasins, and is expected to be directed almost entirely towards oil-weighted production consistent with2014. Of the total 2015 capital budget, approximately $150 million is expected to be allocated to drillingwells, $50 million to workovers, $130 million to additional steam-generation capacity and compressionexpansion, $15 million to exploration and the rest to 3D seismic, maintenance capital, occupational health,safety and environmental projects and other items. The table below sets forth the expected allocation ofour 2015 capital budget by recovery mechanism.
Total 2015Capital
InvestmentsBudget
(in millions)Conventional:
Primary recovery $ 40Waterfloods 175Steamfloods 155
Total conventional 370
Unconventional 35Exploration 15Corporate and other 20
Total $ 440
9

In addition, during this period of lower activity levels, we will deploy our resources to refine moderntechniques that will enhance the value and growth potential of other parts of our portfolio that will not befunded in 2015 and will continue to build our inventory of available projects. This will position us torapidly take advantage of improved market conditions when prices reach more favorable levels.
Reserves and Production Information
The table below summarizes our proved reserves and average production as of and for the yearended December 31, 2014 in each of California’s four major oil and gas basins:
Average Net DailyProduction for the
Proved Reserves as of December 31, 2014 Year EndedDecember 31,Proved R/P2014Oil NGLs Natural Total Developed Ratio
(MMBbl) (MMBbl) Gas (Bcf) (MMBoe) Oil (%) (%) (MBoe/d) Oil (%) (Years)(1)
San Joaquin Basin 340 82 621 525 65% 70% 112 57% 12.8Los Angeles Basin 163 — 16 166 99% 76% 29 100% 15.7Ventura Basin 48 3 37 58 83% 72% 9 69% 17.7Sacramento Basin — — 116 19 — 94% 9 —% 5.8
Total operations 551 85 790 768 72% 72% 159 63% 13.2
Note:MMBbl refers to millions of barrels; Bcf refers to billion cubic feet of natural gas; MMBoe refers to million barrels of oilequivalent; and MBoe/d refers to thousands of barrels of oil equivalent per day.
(1) Calculated as total proved reserves as of December 31, 2014 divided by annualized Average Net Daily Production for theyear ended December 31, 2014.
Marketing Arrangements
We market our crude oil, natural gas, NGLs and electricity in accordance with standard energyindustry practices.
Crude Oil. Substantially all of our crude oil production is connected to California markets via ourcrude oil gathering pipelines which are used almost entirely for our production. We generally do nottransport, refine or process the crude oil we produce and do not have any long-term crude oiltransportation arrangements in place. California is heavily reliant on imported sources of energy, withover 60% of oil consumed during 2014 imported from outside the state, mostly from foreign locations.We sell all of our crude oil into the California refining markets, which we believe are among the mostfavorable in the U.S. Since California imports a significant percentage of its crude oil requirements,California refiners typically purchase crude oil at international waterborne-based prices that haveexceeded WTI-based prices for comparable grades in recent years. Currently, we do not have any crudeoil sales contracts with a term extending past 2015.
Given the recent volatile and deteriorating oil price environment, as well as our leverage, we began ahedging program shortly after the Spin-off to protect our down-side price risk and preserve our ability toexecute our capital program. In December 2014, we purchased put options with a $50 per barrel Brentstrike price, measured monthly. This initial program covers almost all of our oil production for the first sixmonths of 2015. More recently, we put into place additional hedging instruments to protect the pricing foralmost two-thirds of our expected third quarter 2015 oil production. For this program we chose acombination of Brent-based collars (between $55 and $72) for 30,000 barrels per day for July throughSeptember as well as put options at $50 per barrel Brent for 40,000 barrels per day in the same period.In addition, we sold a $75 per barrel call for 30,000 barrels per day of oil production in March throughJune of 2015. Going forward as an independent company, we will continue to be strategic andopportunistic in implementing any hedging program. Our objective is to protect against the cyclical natureof commodity prices to provide a level of certainty around our margins and cash flows necessary toimplement our investment program.
Natural Gas. Because California imports approximately 90% of the natural gas consumed in thestate, we do not have any significant interstate natural gas transportation commitments. We do haveintrastate transportation capacity contracts where necessary to access markets. These contracts arerequired to facilitate deliveries. We sell virtually all of our natural gas production under individuallynegotiated contracts using market-based pricing on a monthly or shorter basis.
10

NGLs. We process substantially all of our NGLs through our processing plants, which facilitatesaccess to third party delivery points near the Elk Hills field. We currently have pipeline capacity contractsto transport 10,000 barrels per day of NGLs to market and will add another 10,000 barrels per day ofcapacity beginning in the second quarter of 2015. We sell virtually all of our NGLs to third parties usingindex-based pricing. Our NGLs are generally sold pursuant to one-year contracts that are renewedannually.
Electricity. While part of the electricity output of our generation facilities is provided to our ElkHills production facilities to reduce field operating costs, and increase operational reliability, we sell asignificant portion into the California market. We offer excess electricity daily into the Californiaelectricity market that is sold based on market pricing and other requirements.
Our Principal Customers
We sell our crude oil, natural gas and NGLs production to marketers, California refineries and otherpurchasers that have access to transportation and storage facilities. Our marketing of crude oil, naturalgas and NGLs can be affected by factors that are beyond our control, and which cannot be accuratelypredicted.
For the years ended December 31, 2014, 2013 and 2012, ConocoPhillips/Phillips 66 Company andTesoro Refining & Marketing Company LLC each accounted for more than 10% of our revenue.Collectively, they accounted for 45%, 42% and 46% in each of those years, respectively.
Title to Properties
As is customary in the oil and natural gas industry, we initially conduct a high level review of the titleto our properties at the time of acquisition. Prior to the commencement of drilling operations on thoseproperties, we conduct a more thorough title examination and perform curative work with respect tosignificant defects. We generally will not commence drilling operations on a property until we have curedknown title defects that are material to the project. Individual properties may be subject to burdens thatwe believe do not materially interfere with the use or affect the value of our properties. Burdens onproperties may include customary royalty interests, liens incident to operating agreements and forcurrent taxes, obligations or duties under applicable laws, development obligations, or net profitsinterests, among others.
Competition
We have many competitors, some of which are larger and better funded, may be willing to acceptgreater risks or have special competencies. See ‘‘Risk Factors.’’
Regulation of the Oil and Natural Gas Industry
Our operations are subject to complex and stringent federal, state, local and other laws andregulations relating to the exploration and development of our properties, the production, transportation,and sale of our products, and the services we provide.
Regulation of Exploration and Production
California has regulations governing:
• the conservation of oil and natural gas, including provisions for the unitization or pooling of oiland natural gas properties;
• oil and natural gas production, including well spacing or density, on private and state lands;• methods of drilling, constructing and completing wells;• well stimulation techniques such as hydraulic fracturing and acid matrix stimulation;• design, construction, operation and maintenance of facilities, such as natural gas processing
plants, power plants, compressors and pipelines;• improved or enhanced recovery techniques such as fluid injection for waterflooding or
steamflooding;• sourcing and disposal of water used in the drilling, completion, stimulation and enhanced
recovery processes;• posting of bonds or other financial assurance to drill or operate wells and facilities;• imposition of taxes and fees with respect to our properties and operations; and• occupational health, safety and environmental matters and the transportation and sale of our
products as described below.
11

The Division of Oil, Gas, and Geothermal Resources (‘‘DOGGR’’) of the Department of Conservation isthe State’s primary regulator of the oil and natural gas industry on private and state lands, withadditional oversight from the State Lands Commission’s administration of state surface and mineralinterests. The federal Bureau of Land Management of the U.S. Department of the Interior exercises similarjurisdiction on federal lands in California. In addition, specific aspects of our operations, such asoccupational health, safety, air or water quality, labor, marketing and taxation, are regulated by otherfederal, state or local agencies. Collectively, the effect of these regulations is to limit the amount of oiland natural gas that we can produce from our wells and to limit the number of wells or the locations atwhich we can drill to levels below those that would otherwise be possible.
For example, in 2013, California adopted Senate Bill 4 (‘‘SB 4’’), which mandated further regulation ofcertain well stimulation techniques, including hydraulic fracturing and acid matrix stimulation. Amongother things, SB 4 requires:
• new permitting of defined well stimulation treatments;• prior notification to proximate property owners or lessees of proposed stimulation treatments,
and pre- and post-stimulation groundwater sampling as requested by the owner or lessee;• monitoring of groundwater quality in areas where well stimulation treatments occur, or
concurrence that monitoring is not warranted due to a lack of protected water as defined bySB 4;
• public disclosure of stimulation data, including data that may be considered proprietary or tradesecret; and
• state agencies to prepare an environmental impact report and scientific studies regarding wellstimulation.
The initial implementation of interim well stimulation regulations under SB 4 in 2014 delayed certainoperations, and the State’s implementation of final SB 4 regulations and associated studies and reportsmay increase costs and cause additional delays.
Finally, the Safe Drinking Water Act and comparable state laws regulate the injection of producedwater, steam or carbon dioxide into underground reservoirs for enhanced oil recovery or disposal. If theexisting underground injection program is changed then our ability to inject produced water may becurtailed and our development and production activities may be negatively affected.
In addition, certain local governments have proposed or adopted ordinances that purport within theirjurisdictions to regulate drilling activities in general, or stimulation and completion activities in particular,or to ban such activities outright. None of the adopted local ordinances is expected to materially impactour current or expected future operations. If new or more stringent federal, state, or local restrictions areadopted in areas where we operate, we could incur potentially significant added costs, experience delaysor curtailment of our exploration or production activities and potentially be precluded from drilling wells.Our competitors in the California oil and natural gas industry are generally subject to the same laws andregulations that affect our operations.
Regulation of Health, Safety and Environmental Matters
Numerous federal, state, local, and other laws and regulations that govern health and safety, therelease or discharge of materials, land use or environmental protection may restrict the use of ourproperties and operations, increase costs or lower demand for or restrict the use of our products andservices. Applicable federal health, safety and environmental laws include, but are not limited to, theOccupational Safety and Health Act, Clean Air Act, Clean Water Act, Safe Drinking Water Act, Oil PollutionAct, Natural Gas Pipeline Safety Act, Pipeline Safety Improvement Act, Pipeline Safety, RegulatoryCertainty, and Job Creation Act, National Environmental Policy Act, Endangered Species Act, MigratoryBird Treaty Act, Comprehensive Environmental Response, Compensation, and Liability Act, ResourceConservation and Recovery Act and National Environmental Policy Act. California imposes additional lawsthat are analogous to, and often more stringent than, such federal laws. These laws and regulations:
• require various permits and approvals before drilling, workovers, production, underground fluidinjection, or solid and hazardous waste disposal commences, or before facilities are constructedor put into operation;
12

• require the installation of sophisticated safety and pollution control equipment to prevent orreduce releases or discharges of regulated materials to air, land, surface water or ground water;
• restrict the use, types or sources of water, energy, land surface, habitat or other naturalresources, require conservation measures, and impose energy efficiency or renewable energystandards;
• restrict the types, quantities, and concentrations of regulated materials, including, withoutlimitation, oil, natural gas, produced water or wastes, that can be released or discharged into theenvironment in connection with drilling, production, processing, power generation ortransportation activities;
• limit or prohibit operations on lands lying within coastal, wilderness, wetlands, groundwaterrecharge, endangered species habitat, and other protected areas;
• establish standards for the closure, abandonment, cleanup or restoration of former operations,such as plugging of abandoned wells and decommissioning of facilities;
• impose substantial liabilities for unauthorized releases or discharges of regulated materials intothe environment with respect to our current or former properties and operations and otherlocations where such materials or wastes generated by us or our predecessors were released ordischarged;
• require comprehensive environmental analyses, recordkeeping and reports with respect tooperations affecting federal, state and private lands or leases;
• impose taxes or fees with respect to the foregoing matters;• may expose us to litigation by governmental authorities, special interest groups and other
claimants; and• may restrict the rate of oil, NGLs, natural gas and electricity production below the rate that
would otherwise be possible.
Federal, state and local agencies may assert overlapping authority to regulate in these areas. Inaddition, certain of these laws and regulations may apply retroactively and may impose strict or joint andseveral liability on us for events or conditions over which we and our predecessors had no control,without regard to fault, legality of the original activities, or ownership or control by third parties.
Federal, state and local governments frequently revise health, safety and environmental laws andregulations, and any changes that result in delays or more stringent permitting, materials handling,engineering, disposal, cleanup and restoration requirements for the oil and gas industry could have asignificant impact on our capital investments and operating costs. Failure to comply with existing or newlaws and regulations may result in the assessment of administrative, civil, and/or criminal fines andpenalties and liability for non-compliance, costs of corrective action, installation of pollution controlequipment, cleanup and restoration, compensation for personal injury, property damage or other losses,and the imposition of injunctive or declaratory relief that may delay, modify or prevent development,construction or operations. Releases or discharges may occur in the course of our operations and mayresult in significant costs and liabilities, including governmental or third-party claims for personal injury ordamage to property or natural resources.
Regulation of Climate Change and Greenhouse Gas (‘‘GHG’’) Emissions
A number of international, federal, state, and regional efforts seek to prevent or mitigate the effectsof climate change or to track or reduce GHG emissions associated with industrial activity, includingoperations of the oil and natural gas production sector and those who use our products as a source ofenergy. The U.S. Environmental Protection Agency has adopted regulations to restrict GHG emissionsfrom certain mobile sources, require certain operations, including onshore and offshore oil and naturalgas production facilities, to monitor and report GHG emissions on an annual basis, and incorporatemeasures to reduce GHG emissions in permits for certain facilities.
In 2006, California adopted Assembly Bill 32 (‘‘AB 32’’), which established a statewide‘‘cap-and-trade’’ program for GHG emissions. Under the program, which commenced in 2012, the CaliforniaAir Resources Board (‘‘CARB’’) set a statewide maximum limit on total GHG emissions, and this capdeclines annually through 2020. CARB requires us, and other businesses in the oil and natural gasproduction sector, to report GHG emissions. We are required to obtain allowances or qualifying offsetcredits for each metric ton of GHGs emitted from our operations and from the sale of certain products tocustomers for use in California. The state grants a portion of the allowance, but we must make up anyshortfall by purchasing additional allowances from either the state or a third party. The availability ofallowances will decline over time, and the cost to acquire such allowances may increase. The
13

cap-and-trade program currently expires in 2020. A California Senate bill in 2014 proposed to extend theprogram to 2050. Although that bill was not adopted, similar legislation may be proposed in the future.
In 2015, the California cap-and-trade program began to cover emissions from the sale of propane andliquid transportation fuels for use in the state. Producers or marketers of propane and refiners of liquidtransportation fuels will be responsible for retiring allowances equivalent to the metric tons of carbondioxide estimated to be produced from the combustion of the propane and transportation fuels theymarket for use in California. Under AB 32, CARB has also imposed a ‘‘low carbon fuel’’ standard, whichrequires refiners to reduce the carbon content of transportation fuels they market in California by 10% by2020. In January 2015, California’s Governor proposed goals for 2030 to derive 50% of California’selectricity from renewable sources, to reduce petroleum use in cars and trucks by 50% from currentlevels, and to double the energy efficiency of buildings in the state, and legislation has been proposed toimplement these goals. These programs and policies, as well as federal and California subsidies and taxincentives for the development and construction of alternative energy-fueled power generation andtransportation, may reduce demand for our products and services or require further controls on, ormodifications to, our operations.
If we are unable to recover or pass through a significant portion of our costs related to complyingwith climate change regulations, these regulations could materially affect our operations and financialcondition. To the extent financial markets view climate change and GHG emissions as a financial risk, thiscould negatively impact our cost of, and access to, capital. Future legislation or regulations adopted toaddress climate change could also make our products more or less desirable than competing sources ofenergy.
Regulation of Transportation and Sale of Our Products
Our sales prices of oil, NGLs and natural gas are set by the market and are not presently regulated.Interstate transportation rates for oil, NGLs and other products are regulated by the Federal EnergyRegulatory Commission (‘‘FERC’’). Our sales price for these products is affected by transportation costs.The FERC has established an indexing system for such transportation, which allows pipelines to take anannual inflation-based rate increase. We are not able to predict what effect, if any, these regulations willhave on us, but, other factors being equal, the regulations may, over time, tend to increase transportationcosts, which may affect our margins for oil and NGLs. Federal law currently restricts the export ofdomestically produced oil, with certain exceptions, such as for a limited quantity of California heavy crudeoil. If these restrictions were lifted, we may be able to sell our oil production in additional markets, whichmay increase prices we realize.
Market Manipulation and Market Transparency Regulations
Under the Energy Policy Act of 2005, the FERC possesses regulatory oversight over natural gasmarkets to prevent market manipulation. The Federal Trade Commission has similar regulatory oversightof oil markets to prevent market manipulation. The Commodity Futures Trading Commission (‘‘CFTC’’) alsoholds authority over the physical and futures energy commodities market pursuant to the CommodityExchange Act. We are required to observe these laws and related regulations when we engage in physicalpurchases and sales of oil, NGLs and natural gas and when we engage in hedging activity. These agencieshold substantial enforcement authority, including the ability to assess civil penalties of up to $1 million perday per violation, to order disgorgement of profits and to recommend criminal penalties. We could also besubject to related third-party damage claims for violation of these laws brought by, among others, sellers,royalty owners and taxing authorities. In addition, the FERC has issued market transparency rules fornatural gas that affect some of our operations and impose reporting and other obligations on us.
Natural Gas Gathering Regulations
Section 1(b) of the federal Natural Gas Act exempts natural gas gathering facilities from thejurisdiction of the FERC. We own certain natural gas pipelines that we believe meet the traditional teststhat FERC has used to establish a pipeline’s status as a gatherer not subject to FERC jurisdiction. Thedistinction between FERC-regulated transmission facilities and federally unregulated gathering facilities is,however, the subject of ongoing litigation, and is otherwise subject to potential change.
In addition to the federal and state laws described above under the heading ‘‘Business—Regulation ofHealth, Safety and Environmental Matters,’’ our natural gas gathering operations are subject to statestatutes designed to prohibit discrimination favoring producers or sources of supply. The regulations may
14

restrict those with whom we contract to gather natural gas. In addition, our natural gas gatheringoperations could become subject to more stringent application of state or federal regulation of rates andservices, though we do not believe any such action would affect us materially differently than ourcompetitors.
Regulation of Power Sales and Transmission
The FERC regulates the sale of electricity at wholesale and the transmission of electricity under theFederal Power Act. The FERC’s jurisdiction includes, among other things, authority over the rates, chargesand other terms for the sale of electricity at wholesale by public utilities and for transmission services. Inmost cases, the FERC does not set rates for the sale of electricity at wholesale by generating companies(such as our subsidiary) that qualify for market-based rate authority, which allows companies to negotiatemarket rates. In order to be eligible for market-based rate authority, and to maintain exemptions fromcertain FERC regulations, our subsidiary has been granted market-based rate authorization from theFERC.
Employees
As of December 31, 2014, we had approximately 1,990 employees. Our future success will dependpartially on our ability to attract, retain and motivate qualified personnel. Approximately 80 of ouremployees are represented by labor unions. We have not experienced any strikes or work stoppages byour employees in the past 35 years or longer. We also utilize the services of independent contractors toperform drilling, well work, operations, construction and other services, including construction contractorswhose workforce is often represented by labor unions.
Effective January 1, 2015, we adopted the California Resources Corporation 2014 Employee StockPurchase Plan (the ‘‘ESPP’’). The ESPP will provide our employees the ability to purchase shares of ourcommon stock at a price equal to 85% of the closing price of a share of our common stock as of the firstor last day of each offering period (a fiscal quarter), whichever amount is less. As of January 1, 2015,about 45% of our employees have elected to participate in the plan.
Available Information
We make the following information available free of charge on our website at www.crc.com:
• Forms 10-K, 10-Q, 8-K and amendments to these forms as soon as reasonably practicable afterthey are electronically filed with, or furnished to, the Securities and Exchange Commission (SEC);
• Other SEC filings including Forms 3, 4, 5 and 10; and• Corporate governance information, including our corporate governance guidelines, board-
committee charters and code of business conduct (see Part III, Item 10, of this report for furtherinformation).
Information contained on our website is not part of this report.
ITEM 1A RISK FACTORS
RISK FACTORS
We are subject to certain risks and hazards due to the nature of the business activities we conduct.The risks discussed below, any of which could materially and adversely affect our business, financialcondition, cash flows and results of operations, are not the only risks we face. We may experienceadditional risks and uncertainties not currently known to us or, as a result of developments occurring inthe future, conditions that we currently deem to be immaterial may ultimately materially and adverselyaffect our business, financial condition, cash flows and results of operations.
Risks Related to Our Business
Commodity pricing can fluctuate widely and strongly affects our results of operations, financialcondition, cash flow and ability to grow.
Our financial results, financial condition, cash flow and rate of growth correlate closely to the priceswe obtain for our products. Recently, global energy commodity prices have declined significantly. Forexample, Brent crude prices have declined from over $115 per barrel in June 2014 to below $47 per barrelin January 2015. In a declining price environment we may incur costs to terminate drilling rig contracts,
15

and may be required to write-down property values, such as we did in recent months. Product prices canfluctuate widely and are affected by a variety of factors, including changes in consumption patterns,global and local (particularly for natural gas) economic conditions, the actions of OPEC and other oil andnatural gas producing countries, inventory levels, actual or threatened production disruptions, currencyexchange rates, worldwide drilling and exploration activities, the effects of conservation, weather,geophysical and technical limitations, refining and processing disruptions, transportation bottlenecks andother matters affecting the supply and demand dynamics of oil, natural gas and NGLs, and the effect ofchanges in market perceptions. These and other factors make it impossible to predict realized pricesreliably. In addition, any significant increase in transportation infrastructure that increases theimportation of crude oil to California from other parts of the country could negatively impact the price wereceive for our crude oil.
Any sustained periods of low prices for oil and natural gas may materially and adversely affect ourfinancial position, the quantities of natural gas and oil reserves that we can economically produce, ourcash flow available for capital investments and our ability to access funds under our revolving creditfacility and through the capital markets.
We have significant indebtedness and may incur more debt. Higher levels of indebtedness could makeus more vulnerable to economic downturns and adverse developments in our business.
As of December 31, 2014, we had $6.36 billion of consolidated indebtedness, comprising $5.0 billion ofsenior notes, $1.0 billion of borrowings outstanding under our term loan facility and $360 million ofborrowings outstanding under our revolving credit facility, and we had the ability to incur $1.64 billion ofadditional borrowings under our revolving credit facility, which has effectively been reduced under thefirst amendment to our credit facilities discussed in ‘‘Management’s Discussion and Analysis of FinancialCondition and Results of Operations—Liquidity and Capital Resources’’. As of December 31, 2014, we hadletters of credit in an aggregate amount of approximately $25 million that were issued to supportordinary course marketing, regulatory and other matters. In addition, the indenture relating to the notesand the credit facilities (as defined in ‘‘Management’s Discussion and Analysis of Financial Condition andResults of Operation-Liquidity and Capital Resources-Credit Facilities’’) permits us to incur certain definedobligations, unrestricted by debt incurrence or lien covenants, or that do not constitute indebtedness (asdefined in ‘‘Management’s Discussion and Analysis of Financial Condition and Results of Operation-Liquidity and Capital Resources-Credit Facilities’’).
Indebtedness outstanding under our credit facilities bears interest at a variable rate, therefore a risein interest rates will generate greater interest expense if and to the extent we do not purchase interestrate hedges.
Our level of indebtedness will have several important effects on our future operations, including,without limitation:
• increasing our vulnerability to adverse changes in our business and to general economic andindustry conditions, and putting us at a disadvantage against other competitors that have lowerfixed obligations and more cash flow to devote to their businesses;
• limiting our ability to obtain additional financing for working capital, capital investments, generalcorporate and other purposes; and
• limiting our flexibility in operating our business and preventing us from engaging in certaintransactions that might otherwise be beneficial to us.
Our ability to meet our debt obligations and other expenses will depend on our future performance,which will be affected by financial, business, economic, regulatory and other factors. If our cash flow isnot sufficient to service our debt, we may be required to refinance debt, sell assets or sell additionalequity on terms that may be unattractive if it may be done at all. Further, our failure to comply with thefinancial and other restrictive covenants relating to our indebtedness could result in a default under thatindebtedness. Any of these factors could result in a material adverse effect on our business, financialcondition, results of operations, cash flow and ability to satisfy our obligations under the notes.
16
Our business requires substantial capital investments. We may be unable to fund these investmentsthrough operating cash flow or obtain any needed additional capital on satisfactory terms or at all,which could lead to a decline in our oil and gas reserves or production. Our capital investmentprogram is also susceptible to risks that could materially affect its implementation.
The oil and gas industry is capital intensive. We make and expect to continue to make substantialcapital investments for the development and exploration of oil and gas reserves. We have developed amulti-year capital investment program to execute our strategy. We invested approximately $2.1 billion ofcapital on development and exploration activities during the year ended December 31, 2014, funded by ouroperating cash flow of $2.4 billion. Under our 2015 capital budget, we plan to invest approximately$420 million for development and exploration activities.
Our ability to deploy capital as planned depends on a number of variables, including: (i) commodityprices and sales point disruptions; (ii) regulatory and third-party approvals; (iii) our ability to timely drillwells due to technical factors and contract terms; (iv) the availability of capital, equipment, services andpersonnel; and (v) drilling and completion costs and results. Because of these and other potentialvariables, we may be unable to deploy capital in the manner planned and actual development activitiesmay materially differ from those presently anticipated.
We intend to finance our future capital investments, other than any significant acquisitions, primarilythrough cash flow from operations and, if necessary, through borrowings under our Revolving CreditFacility or the issuance of debt or equity securities. We may not generate sufficient cash flow to fund ourgrowth plans or to generate acceptable returns. Additional financing may not be available on acceptableterms or at all if there is not market demand or if our lenders refuse to exercise their discretion toexpand our existing credit. In the event additional capital is needed and unavailable, we may curtaildrilling, development and other activities or be forced to sell assets on an unfavorable basis.
Our business is highly regulated and governmental authorities can delay or deny permits andapprovals or change legal requirements governing our operations, including hydraulic fracturing andother well stimulation, enhanced production techniques and fluid disposal, that could increase costs,restrict operations and delay our implementation of, or cause us to change, our business strategy.
Our operations are subject to complex and stringent federal, state, local and other laws andregulations relating to the exploration and development of our properties, the production, transportationand sale of our products, and the services we provide. See ‘‘Business-Regulation of the Oil and NaturalGas Industry’’ for a description of the laws and regulations that affect our business. To operate incompliance with these laws and regulations, we must obtain and maintain permits, approvals andcertificates from federal, state and local governmental authorities. Failure to comply with these laws andregulations may result in the assessment of administrative, civil and/or criminal fines and penalties andliability for non-compliance, costs of corrective action, cleanup or restoration, compensation for personalinjury, property damage or other losses, and the imposition of injunctive or declaratory relief restrictingor limiting our operations. Under certain environmental laws and regulations, we could be subject to strictor joint and several liability for the removal or remediation of contamination, including on properties overwhich we and our predecessors had no control, without regard to fault, legality of the original activities,or ownership or control by third parties.
Costs of compliance may increase or operational delays or restrictions may occur as existing lawsand regulations are revised or reinterpreted, or as new laws and regulations become applicable to ouroperations. Certain government agencies have adopted or proposed new or more stringent requirementsfor permitting, well construction, public disclosure or environmental review of, or restrictions on, certainoil and gas operations, including drilling, well stimulation, enhanced production techniques or fluiddisposal. Such new requirements or restrictions or resulting litigation could result in potentially significantadded costs to comply, delay or curtail our exploration, development, or production activities, andpreclude us from drilling or stimulating wells, which could impair our expected production growth over thelonger term. For example, in 2013, California adopted SB 4, which mandated further regulation of certainwell stimulation techniques, including hydraulic fracturing.
The implementation of interim well stimulation regulations under SB 4 in 2014 delayed certainoperations, and California’s implementation of final SB 4 regulations and associated studies and reportsmay increase costs and cause additional delays. In addition, certain local governments have proposed oradopted ordinances that purport, within their jurisdictions, to regulate certain drilling activities in general,or well stimulation or completion activities in particular, including hydraulic fracturing, or to ban suchactivities outright.
17

Part of our strategy involves exploratory drilling, including drilling in new or emerging plays. Ourdrilling results are uncertain, and the value of our undeveloped acreage may decline if drilling isunsuccessful.
Exploration is inherently risky and its results are unpredictable. The results of our exploratory drillingin new or emerging plays are more uncertain than drilling results in areas that are developed and haveestablished production, and we may increase the proportion of our drilling in new or emerging plays overtime. We may not find commercial amounts of oil or natural gas, in which case the value of ourundeveloped acreage may decline and could be impaired.
One of our important assets is our acreage in the Monterey shale play in the San Joaquin, LosAngeles and Ventura basins. The geology of the Monterey shale is highly complex and not uniform due tolocalized and varied faulting and changes in structure and rock characteristics. As a result, it differs fromother shale plays that can be developed in part on the basis of their uniformity. Instead, individualMonterey shale drilling sites may need to be more fully understood and may require a more precisedevelopment approach, which could affect our ability, the timing or the cost to develop this asset.
Tax law changes may adversely affect our operations.
In California, there have been proposals for tax increases for the past several years including aseverance tax as high as 12.5% on oil, natural gas and NGLs production in California. Although theproposals have not become law, well-funded campaigns by various interest groups could lead to future oiland gas severance taxes. The imposition of such a tax could severely reduce our profit margins and cashflow and could ultimately result in lower oil and natural gas production, which may reduce our capitalinvestments and growth plans.
In addition, President Obama’s budget proposal for fiscal year 2016 recommended the elimination ofcertain federal income tax preferences currently available to oil and gas exploration and productioncompanies all of which could harm us. These changes include (i) the repeal of the percentage depletionallowance for oil and gas properties, (ii) the elimination of expensing intangible drilling costs, (iii) anincrease in the amortization period from two years to seven years for geophysical costs paid or incurredby independent producers in connection with the exploration for, or development of, oil or natural gasand (iv) repeal of the ability to claim the domestic manufacturing deduction against income derived fromthe sale or exchange of oil, natural gas or primary products produced in the United States.
Drilling for and producing oil and natural gas are high-risk activities with many uncertainties.
Unless we conduct successful development and exploration activities or acquire properties containingproved reserves, our proved reserves will decline as those reserves are produced. Our decisions toexplore, develop, purchase or otherwise exploit prospects or properties will depend in part on theevaluation of geophysical, geologic, engineering, production and other technical data, the analysis ofwhich is often inconclusive or subject to varying interpretations. Our cost of drilling, completing,equipping and operating wells is also often uncertain. Overruns in budgeted investments are a commonrisk that can make a particular project uneconomical or less economical than forecast. We bear the risksof equipment failures, accidents, environmental hazards, adverse weather conditions, permitting orconstruction delays, title disputes, surface access disputes, disappointing drilling results or reservoirperformance, including response to IOR or EOR efforts, and other associated risks.
We operate in a highly competitive environment for oilfield equipment, services, qualified personneland acquisitions.
We compete for services to profitably develop our assets, to find or acquire additional reserves andto attract and retain qualified personnel. We have many competitors, some of which: (i) are larger andbetter funded; (ii) may be willing to accept greater risks or (iii) have special competencies. Historically,there have been periodic shortages of drilling and workover rigs, pipe and other oilfield equipment asdemand for rigs and equipment has increased along with the number of wells being drilled. The demandfor qualified and experienced geologists, geophysicists and engineers, and for field and other personnel todrill wells, conduct field operations and construct and maintain facilities, can fluctuate significantly, oftenin correlation with commodity prices, causing periodic shortages which may increase costs for suchservices. Finally, competition for reserves can make it more difficult to find attractive investmentopportunities or require delay of reserve replacement efforts.
18

Estimates of proved reserves and related future net cash flows are not precise. The actual quantitiesof our proved reserves and future net cash flows may prove to be lower than estimated.
Many uncertainties exist in estimating quantities of proved reserves and related future net cashflows. Our estimates are based on various assumptions, which may ultimately prove to be inaccurate.
The reserves information included in this report represents estimates prepared by internal engineers.The procedures and methods used to estimate our reserves by these internal engineers were reviewed byindependent petroleum consultants; however, no audit of estimated reserve volumes was conducted bythese consultants. Reserves estimation is a partially subjective process of estimating accumulations of oiland natural gas. Estimates of economically recoverable oil and gas reserves and of future net cash flowsdepend upon a number of variables and assumptions, including:
• historical production from the area compared with production from similar areas;• the quality, quantity and interpretation of available relevant data;• commodity prices;• production and operating costs;• ad valorem, excise and income taxes;• development costs;• the effects of government regulations; and• future workover and remedial costs.
Misunderstanding of the variables, inaccurate assumptions, changed circumstances or newinformation could require us to make significant negative reserve revisions.
We currently expect improved recovery, extensions and discoveries to be our main sources forreserve additions, but factors such as geology, government regulations and permits and the effectivenessof development plans are partially or fully outside management’s control and could cause unforeseenresults.
Our producing properties are located exclusively in California, making us vulnerable to risksassociated with having operations concentrated in this geographic area.
Our operations are geographically concentrated exclusively in California. Because of this geographicconcentration, the success and profitability of our operations may be disproportionately exposed to theeffect of regional events. These include, among others, fluctuations in the prices of crude oil and naturalgas produced from wells in the region, changes in state or regional laws and regulations affecting ouroperations, and other regional supply and demand factors, including gathering, pipeline and railtransportation capacity constraints, available rigs, equipment, oil field services, supplies, labor andinfrastructure capacity. The concentration of our operations in California also increases exposure tounexpected events that may occur in this region such as natural disasters, industrial accidents or labordifficulties. Any one of these events has the potential to cause producing wells to be shut-in, delayoperations and growth plans, decrease cash flows, increase operating and capital costs and preventdevelopment of lease inventory before expiration. Any of the risks described above could have a materialadverse effect on our financial condition, results of operations and cash flows.
Restrictions on our ability to obtain, use, manage or dispose of water may have an adverse effect onour operations.
Water is an essential component of our operations. Approximately 90% of the fluids we produce arebrackish waters, unsuitable for agricultural use, that need to be managed, recycled or disposed. We treatand re-use this water for a substantial portion of our needs related to activities such as steamflooding,waterflooding, pressure management, well completion and stimulation, including hydraulic fracturing, andwe provide water for agricultural use in certain areas. We also use supplied water from various local andregional sources. Some of our fields are more dependent on supplied water to support operations likesteam injection. Due to severe drought in California, some local and regional water districts and the stategovernment are implementing policies or regulations that restrict water usage and increase the cost ofwater.
Existing regulations restrict our ability and increase our cost to manage and dispose of wastewater.The federal Clean Water Act and Safe Drinking Water Act and similar state laws impose restrictions andstrict controls on the discharge of produced waters and waste and the subsurface injection of fluids. Wemust obtain permits or waivers for certain discharges and for construction activities that may affect
19
regulated water resources. In addition, certain government agencies have investigated and continue tostudy whether fluid injection can induce ground movement or seismicity. Our enhanced productionoperations or fluid disposal could give rise to litigation over claims related to alleged damage to theenvironment or private or public property. The laws, regulations, policies and attendant liabilities relatingto water use, wastewater disposal and fluid injection could increase our costs and negatively affect ourdevelopment and production activities.
Our Area of Mutual Interest (‘‘AMI’’) Agreement may limit our ability to operate outside of California.
In connection with the Spin-off, we entered into an AMI Agreement, which provides Occidental withthe right to acquire a 51% interest in, and rights with respect to, certain oil and gas properties we acquirein the United States, other than in the State of California, for five years following the completion of theSpin-off. If we were to change our current strategy of focusing exclusively on opportunities in California,the AMI Agreement could adversely affect our ability to pursue opportunities outside of California duringthe five years following the Spin-off.
We may not drill our identified sites at the times we scheduled or at all and sites we decide to drillmay not yield crude oil or natural gas in economically producible quantities.
We have specifically identified locations for scheduled drilling over the next several years. Thesedrilling locations represent a significant part of our long-term growth strategy. Our ability to profitablydrill and develop these locations depends on a number of variables, including crude oil and natural gasprices, the availability of capital, costs, drilling results, regulatory approvals, available transportationcapacity and other factors. If future drilling results in these projects do not establish sufficient reserves toachieve an economic return, we may curtail drilling or development of these projects. We view the riskprofile for our exploration drilling locations and our prospective resource drilling locations as being higherthan for our other drilling locations due to relatively less available geologic and production data anddrilling history, in particular with respect to our prospective resource locations, which are in unprovengeologic plays. We make assumptions about the consistency and accuracy of data when we identify theselocations that may prove inaccurate. We cannot guarantee that these prospective drilling locations or anyother drilling locations we have identified will ever be drilled or if we will be able to produce crude oil ornatural gas from these drilling locations. In addition, some of our leases could expire if we do notestablish production in the leased acreage. The combined net acreage covered by leases expiring in thenext three years represents 23% of our total net undeveloped acreage at December 31, 2014. Our actualdrilling activities may materially differ from those presently identified.
The enactment of derivatives legislation, and the promulgation of regulations pursuant thereto, couldhave an adverse effect on our ability to use derivative instruments to reduce the effect ofcommodity-price, interest-rate and other risks associated with our business.
The Dodd-Frank Wall Street Reform and Consumer Protection Act (‘‘Dodd-Frank Act’’), enacted in2010, establishes federal oversight and regulation of the over-the-counter derivatives market and entities,like us, that participate in that market. The Dodd-Frank Act requires the CFTC and the SEC to promulgaterules and regulations implementing the Dodd-Frank Act. Although the CFTC has finalized certainregulations, others remain to be finalized or implemented, and it is not possible at this time to predictwhen this will be accomplished.
The CFTC is authorized to set position limits for certain futures contracts in designated physicalcommodities and for economically equivalent options and swaps. In November 2013, the CFTC proposedrules that would place limits on positions in certain futures and equivalent swap contracts for, or linkedto, certain physical commodities; subject to exceptions for certain bona fide hedging transactions. We donot know when the CFTC will finalize these regulations; therefore, the impact of those provisions on us iscurrently uncertain.
The CFTC designated certain interest rate swaps and credit default swaps for mandatory clearing andexchange trading. In addition, the Dodd-Frank Act requires that regulators establish margin rules foruncleared swaps. The application of such requirements may indirectly change the cost and availability ofthe swaps that we may use for hedging.
The Dodd-Frank Act and regulations could significantly increase the cost of derivative contracts,materially alter the terms of derivative contracts, reduce the availability of derivatives to protect againstrisks we encounter or reduce our ability to monetize or restructure derivative contracts. If we reduce our
20

use of derivatives as a result of the Dodd-Frank Act and regulations, our results of operations maybecome more volatile and our cash flows may be less predictable, which could adversely affect our abilityto plan for and fund capital expenditures.
Our commodity-price risk-management and trading activities may prevent us from fully benefitingfrom price increases and may expose us to other risks.
To the extent that we engage in commodity-price risk management activities to protect our cashflows from commodity-price declines, we may be prevented from realizing the full benefits of priceincreases above the levels stated in the derivative instruments used to manage price risk. In addition, ourcommodity-price risk-management and trading activities may expose us to the risk of financial loss incertain circumstances, including instances in which the following occur:
• our production is less than the notional volumes;• a change in price basis differentials;• the counterparties to our hedging or other price-risk management contracts fail to perform
under those arrangements; and• an event materially impacts oil and natural-gas prices.
Concerns about climate change and other air quality issues may affect our operations or results.
Climate change, the costs that may be associated with its effects and the regulation of GHGs mayaffect our business in many ways, including increasing the costs to provide our products and services, andreducing demand for, and consumption of, our products and services. In addition, legislative andregulatory responses to climate change may increase our operating costs. In 2006, California adopted AB32, which established a statewide cap on GHG emissions, including on the oil and natural gas productionindustry, and a ‘‘cap-and-trade’’ program. Since 2012, CARB regulations have required us to obtain GHGemissions allowances corresponding to reported GHG emissions from operations and, starting in 2015,from the sale of certain products to customers for use in the State. In 2014, we incurred approximately$33 million to purchase mandatory GHG emissions allowances in California, and costs of such allowancesare expected to increase in the future as CARB reduces the number of available allowances, increasestheir targeted price and covers more operations and products in the program. In addition, other CARBregulations, state policies and proposed legislation seek to restrict or reduce the use of petroleumproducts in transportation fuels and electricity generation in California and require the use of renewableenergy, which could increase our costs and reduce the demand for our products and services.
Federal and state regulatory agencies can impose administrative, civil and/or criminal penalties fornon-compliance with air permits or other requirements of the federal Clean Air Act and associated statelaws and regulations. In addition, California air quality laws and regulations, particularly in Southern andCentral California where most of our operations are located, are in many instances more stringent thancomparable federal laws and regulations. As these requirements become more stringent, we may beunable to implement them in a cost-effective manner. As a result of existing and future air qualityinitiatives, we could face risks of increased costs and taxes, an inability to execute projects and reduceddemand for our products and services.
Risks related to our acquisition activities could negatively impact our financial condition and resultsof operations.
Our acquisition activities carry risks that we may: (i) not fully realize anticipated benefits due toless-than-expected reserves or production or changed circumstances, such as the deterioration of naturalgas prices in recent years and oil prices in recent months; (ii) bear unexpected integration costs orexperience other integration difficulties; (iii) experience share price declines based on the market’sevaluation of the activity or (iv) assume liabilities that are greater than anticipated.
In connection with our acquisitions, we are often only able to perform limited due diligence.Successful acquisitions of oil and gas properties require an assessment of a number of factors, includingestimates of recoverable reserves, the timing for recovering the reserves, exploration potential, futurecommodity prices, operating costs and potential environmental, regulatory and other liabilities. Suchassessments are inexact and incomplete, and we may be unable to make these assessments with a highdegree of accuracy.
21

There may be threatened, contemplated, asserted or other claims against the acquired assets relatedto environmental, title, regulatory, tax, contract, litigation or other matters of which we are unaware orfor which we are unable to obtain indemnity.
We may incur substantial losses and be subject to substantial liability claims as a result ofcatastrophic events. We may not be insured for, or our insurance may be inadequate to protect usagainst, these risks.
We are not fully insured against all risks. Our oil and gas exploration and production activities,including well stimulation and completion activities, are subject to operating risks associated with drillingfor and producing oil and natural gas, such as well blowouts, fires, explosions, releases or discharges ofhazardous or toxic materials and industrial accidents. Other catastrophic events such as earthquakes,floods, mudslides, droughts, terrorist attacks and other events that cause operations to cease or becurtailed may negatively affect our business and the communities in which we operate. We may be unableto obtain, or may elect not to obtain, insurance for certain risks if we believe that the cost of availableinsurance is excessive relative to the risks presented.
Cyber attacks could significantly affect us.
Cyber attacks on businesses have escalated in recent years. We rely on electronic systems andnetworks to communicate, control and manage our operations and prepare our financial management andreporting information. If we were to experience an attack and our security measures failed, the potentialconsequences to our business and the communities in which we operate could be significant.
Operational issues could restrict access to markets for the commodities we produce.
Our ability to market our production of oil, natural gas and NGLs depends on a number of factors,including the proximity of production fields to pipelines and terminal facilities, competition for capacity onsuch facilities, the ability of such facilities to gather, transport or process our products and regionaldisruptions, such as strikes and mechanical failures. If our access to markets for commodities we produceis restricted, our costs could increase and our expected production growth may be impaired.
Risks Related to the Spin-off
We may not realize the anticipated benefits from our separation from Occidental.
We may not realize the benefits that we anticipate from our separation from Occidental. Thesebenefits include the following:
• enhancing our ability to grow by reinvesting substantially all of our cash flow in our business;• enhancing growth and efficiency by enabling our management team to focus its attention on the
development and execution of our business in a single state;• enhancing our focus on, and accelerating our technical expertise in, specific reservoirs and fields
in California; and• enhancing our market recognition with investors because of our status as an industry leader in
California.
We may not achieve the anticipated benefits from our separation for a variety of reasons. We maynot generate sufficient cash flow to fund our long-term growth plans and to generate acceptable returns.We also may not fully realize the anticipated benefits from our separation if any of the other mattersidentified as risks in this ‘‘Risk Factors’’ section were to occur.
Our historical financial information may not be representative of the results we would have achievedas a stand-alone public company and may not be a reliable indicator of our future results.
The historical financial information included in this Form 10-K has been derived partly fromOccidental’s accounting records and may not reflect what our financial position, results of operations orcash flows would have been had we been an independent, stand-alone entity during the periods presentedor those that we will achieve in the future. Occidental did not account for us, and we were not operated,as a separate, stand-alone company or as a separate segment for the historical periods presented. Thecosts and expenses reflected in our historical financial information include an allocation for certaincorporate functions historically provided by Occidental, including expense allocations for: (i) executiveoversight, accounting, procurement, engineering, drilling, exploration, finance, internal audit, legal, risk
22

management, tax, treasury, information technology, government relations, investor relations, publicrelations, financial reporting, human resources, marketing, ethics and compliance, and certain othershared services; (ii) certain employee benefits and incentives and (iii) share-based compensation, that maybe different from the comparable expenses that we would have incurred had we operated as a stand-alone company. We have allocated these expenses in our historical financial information on the basis ofdirect usage when identifiable, with the remainder allocated based on estimated time spent by Occidentalpersonnel, headcount or our relative size compared to Occidental and its subsidiaries. The costs ofoperating as a stand-alone public company, other than the debt-related costs, may be slightly higher thanthe costs reported in the 2014 historical financial statements. These estimates may not prove to beaccurate. Our capital investment requirements, including acquisitions, historically have been satisfied aspart of the companywide cash management practices of Occidental. Following the Spin-off, we no longerhave access to Occidental’s working capital, and we may need to obtain additional financing from banks,through public offerings or private placements of debt or equity securities or other arrangements if ourcash flow from operations and our existing credit facilities are not sufficient to fund our capitalinvestment requirements.
In connection with our separation from Occidental, we agreed to indemnify Occidental for certainliabilities, including those related to the operation of our business while it was still owned byOccidental, and Occidental agreed to indemnify us for certain liabilities, which indemnities may not beadequate.
Pursuant to agreements with Occidental, Occidental has indemnified us for certain liabilities, and weagreed to indemnify Occidental for certain liabilities, in each case for uncapped amounts. Indemnitypayments that we may be required to provide Occidental may be significant and could negatively impactour business, particularly indemnity payments relating to our actions that could impact the tax-freenature of the Spin-off. Third parties could also seek to hold us responsible for liabilities that Occidentalhas agreed to retain. Further, there can be no assurance that the indemnity from Occidental will besufficient to protect us against the full amount of such liabilities, or that Occidental will be able to fullysatisfy its indemnification obligations. Moreover, even if we ultimately succeed in recovering fromOccidental any amounts for which we are held liable, we may be temporarily required to bear these lossesourselves.
Our costs may increase as a result of operating as a stand-alone public company, and ourmanagement will be required to devote substantial time to complying with public companyregulations.
Prior to the Spin-off, our operations were fully integrated within Occidental, and we relied onOccidental to provide certain corporate functions. As a stand-alone public company, we may incuradditional expenses for executive oversight, accounting, finance, risk management, treasury, tax, financialreporting, internal audit, legal, information technology, governmental relations, public relations, investorrelations, human resources, procurement, engineering, drilling, exploration, ethics and compliance,marketing and certain other services that we have not incurred historically. As part of Occidental, wewere able to enjoy certain benefits from Occidental’s scale and purchasing power. As an independent,publicly traded company, we do not have similar negotiating leverage.
In addition, we are now obligated to file with the SEC annual and quarterly information and otherreports, and, as a result, must ensure that we have the ability to prepare financial statements that arefully compliant with all SEC reporting requirements on a timely basis. In addition, we are now subject toother reporting and corporate governance requirements, including certain requirements of the NYSE, andcertain provisions of the Sarbanes-Oxley Act of 2002, and the regulations promulgated thereunder, whichimpose significant compliance obligations and costs upon us.
Our Tax Sharing Agreement with Occidental may limit our ability to take certain actions, includingstrategic transactions, and may require us to indemnify Occidental for significant tax liabilities.
Under the Tax Sharing Agreement, we have agreed to take certain actions or refrain from takingcertain actions to ensure that the Spin-off and certain transactions taken in preparation for, or inconnection with, the Spin-off, qualify for tax-free status under the relevant provisions of the InternalRevenue Code of 1986, as amended (the ‘‘Code’’). We have also made various other covenants in the TaxSharing Agreement intended to ensure the tax-free status of the Spin-off. These covenants restrict ourability to sell assets outside the ordinary course of business, to issue or sell additional common stock or
23

other securities (including securities convertible into our common stock), or to enter into certain othercorporate transactions. For example, for a period of two years after the final disposition of the securitiesretained by Occidental after the Spin-off, absent approval by Occidental, we may not enter into anytransaction that would be reasonably likely to cause us to undergo either a 30% or greater change in theownership of our voting stock or a 30% or greater change in the ownership (measured by value) of allclasses of our stock.
We have agreed to indemnify Occidental for (a) taxes incurred as a result of the failure of theSpin-off or certain transactions undertaken in preparation for, or in connection with, the Spin-off, toqualify as tax-free transactions under the relevant provisions of the Internal Revenue Code of 1986, asamended, to the extent caused by (i) our breach of certain tax-related representations or covenants madein connection with the Spin-off, (ii) actions, failures to act and omissions inconsistent with suchrepresentations and covenants and (iii) certain permitted transactions, (b) our separate taxes due tocapitalization of intangible drilling and development costs, (c) any finally determined increases of ourliability for separate tax items included in combined or consolidated Occidental returns, and (d) 50% ofcertain sales, use, transfer, real property transfer, intangible, recordation, registration, documentary,stamp and similar taxes. We also have agreed to pay 50% of any taxes arising from the Spin-off orrelated transactions to the extent that the tax is not attributable to the fault of either party. However, ifwe receive an increase in the tax basis of our depletable, depreciable or amortizable assets as a result ofany such tax begin imposed, we will pay to Occidental any amount equal to any reduction in our taxliability attributable to such basis increase at the time such reduction in tax liability arises. In addition, wehave agreed to indemnify Occidental and its remaining subsidiaries against claims and liabilities relatingto the past operation of our business.
We could have significant tax liabilities for periods during which Occidental operated our business.
For any tax periods (or portion thereof) in which Occidental owned at least 80% of the total votingpower and value of our common stock, we and our subsidiaries will be included in Occidental’sconsolidated group for federal income tax purposes. In addition, we or one or more of our subsidiariesmay be included in the combined, consolidated or unitary tax returns of Occidental or one or more of itssubsidiaries for state or local income tax purposes. Under the Tax Sharing Agreement, for each period inwhich we or any of our subsidiaries are consolidated or combined with Occidental for purposes of any taxreturn, and with respect to which such tax return has not yet been filed, we will pay Occidental for anyadditional taxes payable by Occidental resulting from Occidental’s election to capitalize some or all ofcertain CRC intangible drilling costs. We will also be responsible for any increase in Occidental’s federal orstate tax liability for any period in which we or any of our subsidiaries are combined or consolidated withOccidental if such increase results from audit adjustments attributable to our business. In addition, byvirtue of Occidental’s controlling ownership and the Tax Sharing Agreement, Occidental will effectivelycontrol all of our tax decisions in connection with any consolidated, combined or unitary income taxreturns in which we (or any of our subsidiaries) are included. The Tax Sharing Agreement provides thatOccidental will have sole authority to respond to and conduct all tax proceedings (including tax audits)relating to us, to prepare and file all consolidated, combined or unitary income tax returns in which weare included on our behalf (including the making of any tax elections). This arrangement may result inconflicts of interest between Occidental and us. For example, under the Tax Sharing Agreement,Occidental will be able to choose to contest, compromise or settle any adjustment or deficiency proposedby the relevant taxing authority in a manner that may be beneficial to Occidental and detrimental to us.
Moreover, notwithstanding the Tax Sharing Agreement, federal law provides that each member of aconsolidated group is liable for the group’s entire tax obligation. Thus, to the extent Occidental or othermembers of Occidental’s consolidated group fail to make any federal income tax payments required bylaw, we could be liable for the shortfall with respect to periods in which we were a member ofOccidental’s consolidated group. Similar principles may apply for state or local income tax purposes wherewe file combined, consolidated or unitary returns with Occidental or its subsidiaries for federal, foreign,state or local income tax purposes.
The amount of tax for which we are liable for taxable periods preceding the Spin-off may be impactedby elections Occidental makes on our behalf.
Under the Tax Sharing Agreement, Occidental will have the right to make all elections, includingelections to capitalize intangible drilling costs, relevant to the determination of our tax liability for periodswhile we, or any of our subsidiaries, are required to file tax returns with Occidental on a consolidated orcombined basis or which include pre-Spin-off periods. As a result, the amount of tax for which we are
24

liable for taxable periods preceding the Spin-off may be impacted by elections Occidental makes on ourbehalf.
We could have significant tax liabilities if the Spin-off, and certain transactions in preparationtherefore, are not tax-free.
In certain circumstances, if the Spin-off is determined to be taxable for U.S. federal income taxpurposes, we could incur significant liabilities under a tax-sharing agreement between us and Occidental.Occidental has received a private letter ruling from the IRS to the effect that certain aspects of thetransactions that will be undertaken in preparation for, or in connection with, the Spin-off will not causethe distribution to be taxable to Occidental or its affiliates. Occidental also received opinions from taxcounsel that (i) certain transactions that will be undertaken in preparation for, or in connection with, theSpin-off will not be taxable to Occidental or its affiliates for federal income tax purposes and (ii) theSpin-off generally qualifies as a tax-free transaction under Sections 355, 361 and/or 368(a)(1)(D) of theCode. The private letter ruling relies and the opinions rely on facts, assumptions, representations andundertakings from Occidental and us regarding the past and future conduct of the companies’ respectivebusinesses and other matters. If any of these facts, assumptions, representations, or undertakings are, orbecome, incorrect or not otherwise satisfied, Occidental may not be able to rely on the private letterruling or the opinions of its tax advisor and could be subject to significant tax liabilities. In addition, anopinion of counsel is not binding upon the IRS, so, notwithstanding the opinions of Occidental’s taxadvisor, the IRS could conclude upon audit that the Spin-off is taxable in full or in part. The IRS maydetermine that the Spin-off is taxable for other reasons, including as a result of certain significantchanges in the stock ownership of Occidental or us after the Spin-off.
Several members of our board of directors and management may have actual or potential conflicts ofinterest because of their ownership of shares of common stock of Occidental and the overlap of onemember of our Board with the board of directors of Occidental.
Several members of our board of directors and management will initially own common stock ofOccidental or options to purchase common stock of Occidental, because of their current or priorrelationships with Occidental, which could create, or appear to create, potential conflicts of interest whenour directors and executive officers are faced with decisions that could have different implications forOccidental and us. In addition, the board of directors of each of CRC and Occidental have one member incommon, which could create actual or potential conflicts of interest.
The Spin-off may expose us to potential liabilities arising out of state and federal fraudulentconveyance laws and legal dividend requirements.
The Spin-off is subject to review under various state and federal fraudulent conveyance laws. Underthese laws, if a court in a lawsuit by an unpaid creditor or an entity vested with the power of suchcreditor (including a trustee or debtor-in-possession in a bankruptcy by us or Occidental or any of ourrespective subsidiaries) were to determine that Occidental or any of its subsidiaries did not receive fairconsideration or reasonably equivalent value for distributing our common stock or taking other action aspart of the Spin-off, or that we or any of our subsidiaries did not receive fair consideration or reasonablyequivalent value for incurring indebtedness, including the new debt incurred by us in connection with theSpin-off, transferring assets or taking other action as part of the Spin-off and, at the time of such action,we, Occidental or any of our respective subsidiaries (i) was insolvent or would be rendered insolvent,(ii) had unreasonably small capital with which to carry on its business and all business in which it intendedto engage or (iii) intended to incur, or believed it would incur, debts beyond its ability to repay such debtsas they would mature, then such court could void the Spin-off as a constructive fraudulent transfer. Thecourt could impose a number of different remedies, including voiding our liens and claims againstOccidental, or providing Occidental with a claim for money damages against us in an amount equal to thedifference between the consideration received by Occidental and the fair market value of our company atthe time of the Spin-off.
The measure of insolvency for purposes of the fraudulent conveyance laws will vary depending onwhich jurisdiction’s law is applied. Generally, however, an entity would be considered insolvent if thepresent fair saleable value of its assets is less than (i) the amount of its liabilities (including contingentliabilities) or (ii) the amount that will be required to pay its probable liabilities on its existing debts asthey become absolute and mature. No assurance can be given as to what standard a court would apply todetermine insolvency or that a court would determine that we, Occidental or any of our respective
25

subsidiaries were solvent at the time of or after giving effect to the Spin-off, including the distribution ofour common stock.
Under the Separation and Distribution Agreement, from and after the Spin-off, each of Occidental andCRC will be responsible for the debts, liabilities and other obligations related to the business orbusinesses which it owns and operates following the consummation of the Spin-off, and each ofOccidental and CRC will assume or retain certain liabilities for the operation of our respective businessesprior to the Spin-off and certain liabilities related to the Spin-off. Although we do not expect to be liablefor any such obligations not expressly assumed by us pursuant to the Separation and DistributionAgreement, it is possible that a court would disregard the allocation agreed to between the parties, andrequire that we assume responsibility for obligations allocated to Occidental, particularly if Occidentalwere to refuse or were unable to pay or perform the subject allocated obligations.
The agreements between us and Occidental were not made on an arm’s-length basis.
The agreements we entered into with Occidental in connection with the Spin-off, were negotiated inthe context of the Spin-off while we were still a wholly-owned subsidiary of Occidental. Accordingly,during the period in which the terms of those agreements were negotiated, we did not have anindependent board of directors or a management team independent of Occidental. As a result, the termsof those agreements, including those that are discussed elsewhere, may be unfavorable and may notreflect terms that would have resulted from arm’s-length negotiations between unaffiliated third parties.The terms relate to, among other things, the allocation of assets, liabilities, rights and other obligationsbetween Occidental and us.
ITEM 1B Unresolved Staff Comments
We have no unresolved SEC staff comments at December 31, 2014.
26

27FEB201521135249
ITEM 2 PROPERTIES
Our Operations
Our Areas of Operation
California is one of the most prolific oil and natural gas producing regions in the world and is thethird largest oil producing state in the nation. According to DOGGR, cumulative California production fromall four basins in which we operate is 35 billion barrels of oil equivalent (‘‘BBoe’’), including approximately19 BBoe in the San Joaquin basin, 10 BBoe in Los Angeles basin, 4 BBoe in Ventura basin and 10 trillioncubic feet (‘‘Tcf’’) of natural gas in Sacramento basin. Additionally, Kern County has been the largest oilproducing county in the lower 48 states for a number of years. California imports more than 60% of itsoil, mostly from foreign locations, and 90% of its natural gas. Because of limited crude transportationinfrastructure from other parts of the country to California, the California market is generally isolatedfrom the rest of the nation, which has typically allowed California producers to receive Brent-basedprices, which are international waterborne prices. Brent prices were at a premium to WTI-based prices forcomparable grades in recent years. Our operations include 137 fields with 9,331 gross active wellbores asof December 31, 2014. We believe we are the largest private oil and natural gas mineral acreage holder inCalifornia, with interests in approximately 2.4 million net acres. Approximately 60% of our total netmineral interest position is held in fee. A majority of our interests are in producing properties located inreservoirs characterized by what we believe to be long-lived production profiles with repeatabledevelopment opportunities.
27

Across all of our California operations, we drilled 1,048 development wells in 2014, of which 83%were producers and the rest were injectors. Our 2014 drilling capital was approximately $1.3 billion. Our2014 total capital of $2.1 billion also included investments in support equipment, facilities, workovers andexploration. Our capital program added 118 MMBoe of proved reserves in 2014 representing a 203%reserve replacement ratio, calculated by using the proved reserves additions from our capital program for2014 divided by our 2014 production of 58 MMBoe.
San Joaquin Basin
We actively operate and are developing 45 fields in this inland basin in the southern part ofCalifornia’s central valley which consists of conventional primary, IOR, EOR and unconventional projecttypes with approximately 1.6 million net acres, approximately 62% of which we hold in fee. Approximately68% of our estimated proved reserves as of December 31, 2014 and 70% of our average daily netproduction for the year ended December 31, 2014 were located in the San Joaquin basin.
According to DOGGR, approximately 74% of California’s daily oil production for 2013 was produced inthe San Joaquin basin. Commercial petroleum development began in the basin in the 1800s. Rapiddiscovery of many of the largest oil accumulations followed during the next several decades, including theElk Hills field. We have been redeveloping this field and building our expertise to use in other fields acrossthe state. According to the U.S. Geological Survey as of 2012, the San Joaquin basin contained three ofthe 10 largest oil fields in the United States based on cumulative production and proved reserves. Mostdiscovered oil accumulations occur in Eocene-age through Pleistocene-age sedimentary sections. Sourcerocks are organic-rich shales from the Monterey, Kreyenhagen and Tumey formations. In the 1960s,introduction of thermal techniques resulted in substantial new additions to reserves in heavy oil fields. Wehave been successfully developing steamfloods in our Kern Front operations, which are located next tothe giant Kern River field, and in the northwest portion of the Lost Hills field. Starting in the 1980s,reserves additions have continued in the Monterey formation on the west side of the basin and in ournew conventional field discoveries. The basin contains multiple stacked formations throughout its arealextent, and we believe that the San Joaquin basin provides an appealing inventory of existing fieldre-development opportunities, as well as new play discovery and unconventional play potential. Thecomplex stratigraphy and structure in the San Joaquin basin has allowed continuing discoveries ofstratigraphic and structural traps. We believe our extensive 3D seismic library, which covers over 2,972square miles in the San Joaquin basin, including approximately 50% of our San Joaquin acreage, will giveus a competitive advantage in further exploring this basin.
We have established a large ownership interest in several of the largest existing oil fields in the SanJoaquin basin, including Elk Hills, our largest producing field, as well as the Buena Vista and KettlemanNorth Dome fields.
Elk Hills
Elk Hills is one of the largest fields in the continental United States based on proved reserves andhas produced over 1.6 BBoe. During the year ended December 31, 2014, we produced 64 MBoe/d onaverage from our Elk Hills properties, or approximately 40% of our total average daily production. Of ourtotal Elk Hills production, more than 60% is liquids. At Elk Hills, we operate efficient natural gasprocessing facilities with a combined capacity of over 540 MMcf/d. Additionally, we generate sufficientelectricity to operate the field and sell excess power to the grid. Our operations at Elk Hills possess astate-of-the-art central control facility and remote automation control on over 95% of our wells.
Los Angeles Basin
We actively operate and are developing 10 fields in this urban, coastal basin which consists ofconventional primary, IOR, EOR and unconventional project types, approximately half of which we hold infee. Approximately 22% of our estimated proved reserves as of December 31, 2014 and 18% of ouraverage daily net production for the year ended December 31, 2014 were located in the Los Angelesbasin.
The basin is a northwest-trending plain about 50 miles long and 20 miles wide containing prolificMiocene through Pleistocene sediments. Most of the significant discoveries in the Los Angeles basin dateback to the 1920s. The Los Angeles basin has one of the highest concentrations per acre of crude oil inthe world with 68 fields named in an area of about 450 square miles. The basin contains multiple stackedformations throughout its depths, and we believe that the Los Angeles basin provides a considerable
28

inventory of existing field re-development opportunities as well as new play discovery potential. Largeactive oil fields include the Huntington and the Wilmington fields, where we have significant operations asdescribed further below.
Wilmington Oil Field
The Wilmington field located in Long Beach, is the third largest field in the United States and hasproduced over 2.9 BBoe. During the year ended December 31, 2014, we produced approximately 36,000Boe/d gross on average, or 91% of the Wilmington field daily production from all producers for the year,where we operate on behalf of the State of California and the City of Long Beach. Our net production inthis field equates to approximately 16% of our total average daily production. Most of our Wilmingtonproduction is covered under a set of contracts similar to production-sharing contracts under which werecover capital and operating costs and our share of profits from production. The field is developed byapplying waterflood methods of oil recovery. Our waterflood operations have attractive margins andreturns in the current price environment and extend the productive life of our reservoirs beyond theeconomic life expected for primary development.
Ventura Basin
We actively operate and are developing 29 fields in this central California coastal basin whichconsists of primary conventional, IOR, EOR and unconventional project types. We currently holdapproximately 0.3 million net acres in the Ventura basin, approximately 72% of which we hold in fee.Approximately 8% of our estimated proved reserves as of December 31, 2014 and approximately 6% ofour average daily net production for the year ended December 31, 2014 were located in the Venturabasin.
The Ventura basin contains a Cretaceous-age to Pleistocene-age, mostly marine, sedimentary sectionin a major fold and thrust belt that began developing during the late Pliocene. The Ventura basin is theonshore part of the main structural feature and its offshore extension is the modern Santa Barbara basin.All of the sedimentary section is productive at various locations, and most reservoirs are sandstones withfavorable porosity and permeability. In general, most traps are anticlinal, modified to some degree byfaults and with significant stratigraphic trapping. The basin contains multiple stacked formationsthroughout its depths, and we believe that the Ventura basin provides an appealing inventory of existingfield re-development opportunities, as well as new play exploration potential.
In 2013, we completed the acquisition of, and are currently processing, the first ever 3D seismicsurvey in the Ventura basin. We believe this 3D seismic data gives us a competitive advantage inexploring this basin.
Sacramento Basin
We actively operate and are developing 53 fields in this inland basin in the northern part ofCalifornia’s central valley, primarily consisting of dry gas production. We currently hold approximately0.5 million net acres in the Sacramento basin, approximately 35% of which we hold in fee. We believe oursignificant acreage position in the Sacramento basin gives us the option for future development and rapidproduction growth in an attractive natural gas price environment. Approximately 2% of our estimatedproved reserves as of December 31, 2014 and approximately 6% of our average daily net production forthe year ended December 31, 2014 were located in the Sacramento basin.
The Sacramento basin is a deep, elongated northwest-trending basin covering about 12,000 squaremiles. It contains a thick sequence of sedimentary deposits that range in age from the lower Cretaceousto Neogene. Exploration in the basin started in 1918.
Conventional Reservoir Recovery Methods
We determine which development method to use based on reservoir characteristics, reservespotential and expected returns. We seek to optimize the potential of our conventional assets byprogressively using primary recovery methods, which may include some well stimulation techniques, EORmethods like steamflooding and IOR methods such as waterflooding, using both vertical and horizontaldrilling. All of these techniques are proven technologies we have used extensively in California.
29

Primary Recovery
Primary recovery methods are the first techniques we use to develop a reservoir. These methodsconsist of drilling and producing wells without supplementing the natural energy of the reservoir. Oursuccessful exploration program continues to provide us with primary recovery opportunities in newreservoirs or through extensions of existing fields. Our conventional development programs create futureopportunities to convert these reservoirs to steamfloods or waterfloods after their primary productionphase.
Steamfloods
Some of our fields contain heavy, thick oil. Steamfloods work by injecting steam into the reservoir toheat the oil, decreasing its viscosity, or thinning the oil, allowing it to flow more easily to the producingwellbores. Steamflooding is a well understood process that has been used in California since the early1960s. This process has been known to increase recovery factors from approximately 10% under primaryrecovery methods to up to approximately 75%. Thermal operations are most effective in shallowreservoirs containing heavy, viscous oil. The steamflood process is generally characterized by low capitalinvestment with attractive margins and returns even in the current price environment. The economics ofsteamflooding are largely a function of the ratio between oil and natural gas prices. After drilling, theseoperations typically ramp up production over one to two years as the steam continues to influence the oilproduction, and then exhibit a plateau for several months, with a subsequent low, predictable oilproduction decline rate of 5 to 10% per year. This gradual decline allows us to extend the productive lifeof a reservoir and significantly increase our incremental recovery after primary depletion. We usesteamfloods extensively in the San Joaquin basin, where they have allowed us to grow our productionfrom mature fields such as Kern Front and Lost Hills, among others.
Waterfloods
Some of our fields have been partially produced and no longer have sufficient energy to drive oil toour producing wellbores. Waterflooding is a well understood process that has been used in California forover 50 years to re-introduce energy to the reservoir through water injection and to sweep oil toproducing wellbores. This process has been known to increase recovery factors by approximately doublethose experienced under primary recovery methods. Our waterflood operations have attractive marginsand returns in the current price environment. These operations typically have low and predictableproduction declines and allow us to extend the productive life of a reservoir and significantly increase ourincremental recovery after primary depletion. We use waterfloods extensively in the San Joaquin, LosAngeles and Ventura basins where they have allowed us to reduce production decline or modestly growour production from mature fields such as Elk Hills and Wilmington.
Unconventional Reservoir Potential
We believe our undeveloped unconventional acreage has the potential to provide significant long-termproduction growth. In total, we hold mineral interests in approximately 1.3 million net acres withunconventional potential and have identified over 4,900 gross (4,400 net) unconventional drillinglocations on this acreage. As a result of focusing more on these reservoirs over the past few years,approximately 36% of our 2014 production was from unconventional reservoirs, an increase ofapproximately 150% since the acquisition of our Elk Hills field properties in 1998. As of December 31,2014, we had proved reserves of 216 MMBoe associated with our unconventional properties, withapproximately 24% proved undeveloped.
We hold significant interests in the Monterey formation, which is divided into upper and lowerintervals. We have successfully produced from seven discrete stacked pay horizons within the UpperMonterey. The Lower Monterey is believed to be the principal source rock within the Monterey.
We plan to apply the knowledge acquired from our successes in the upper Monterey to other shalesin the San Joaquin basin such as the Kreyenhagen and Moreno formations. The Kreyenhagen and Morenoformations are hydrocarbon source rocks that have generated oil and gas, and we believe they offersimilar development opportunities to the upper Monterey due to their multiple stacked pay reservoirs andgeneral reservoir characteristics. The lower Monterey has an extremely limited production historycompared to the upper Monterey, and therefore very limited knowledge exists regarding its potential. Forexample, only about 25 wells have been drilled into the lower Monterey to date. However, we believe wewill be able to apply knowledge we gain from the upper Monterey in the lower Monterey as well.
30

Exploration Program
We intend to continue our active exploration program in both conventional and unconventional playswhere discoveries can quickly be developed into producing fields. We believe our experienced technicalstaff, leading acreage position and extensive 3D seismic library give us a strong competitive advantage.Our interpretation of this seismic data, covering a large portion of our prospective acreage, and ourextensive knowledge of California geology and producing fields, has resulted in a large inventory ofexploratory projects. As of December 31, 2014, our drilling inventory included 7,200 gross (5,100 net)exploration drilling locations in proven formations, the majority of which are located near existingproducing fields. Additionally, we have identified 6,400 gross (5,300 net) prospective resource drillinglocations in the lower Monterey, Kreyenhagen and Moreno resource plays.
In 2014, we continued our successful near-field and impact exploration programs in conventional andunconventional reservoirs. Our exploration program delivered a geologic success rate of approximately80% with approximately half of those successful wells determined to be commercial in the current priceenvironment. Notable successes include our conventional reservoir drilling results in proven play trendsoffsetting the Pleito Ranch field in the San Joaquin basin and the Bardsdale field in the Ventura basin.
In the San Emigdio trend, two exploration wells successfully extended the Pleito Ranch field. Bothwells encountered the primary producing reservoir of the Pleito Ranch field at similar reservoir depthsand pressures. Additional step-out exploration prospects have been identified that can further extend thistrend.
In the Ventura basin, one exploration well encountered two hydrocarbon bearing reservoir intervalsand successfully extended the depth of the known producing reservoirs. We have multiple, analogousprospects in this play trend that extends for approximately 30 miles onshore in the southern Venturabasin.
We continue to develop our understanding and knowledge of the significant prospective resources inthe exploration shale reservoirs. In 2014, we completed significant log, core and seismic data acquisitionprojects targeting the Kreyenhagen exploration shale reservoir around the Kettleman North Dome andMiddle Dome fields. We completed seven workovers in existing wellbores and drilled six new wells. Inmany cases, zonal completions were implemented to assess the expected performance of individual zonesof interest and identify landing zones for future horizontal development.
In 2015, we expect to invest approximately three percent of our capital budget, or approximately$15 million, on exploration projects with a continued focus on prospects that can generate near-termreturns. We expect exploration capital in the future to be focused in the San Joaquin, Ventura andSacramento basins, and weighted toward projects where we have a proven track record of success.
Our Reserves and Production Information
Reserve Data
The information with respect to our estimated reserves presented below has been prepared inaccordance with the rules and regulations of the SEC.
Reserves Presentation
Proved oil, NGLs and natural gas reserves were estimated using the unweighted arithmetic averageof the first-day-of-the-month price for each month within the year, unless prices were defined bycontractual arrangements. Oil, NGLs and natural gas prices used for this purpose were based on postedbenchmark prices and adjusted for price differentials including gravity, quality and transportation costs.For the 2014 disclosures, the calculated average Brent oil price was $101.30 per Bbl. The calculatedaverage NYMEX gas price for 2014 disclosures was $4.42 per Mcf. The realized prices used for the 2014disclosures were $95.20 per Bbl for oil, $49.94 per Bbl for NGLs and $4.73 per Mcf for natural gas.
During the second half of 2014 oil prices experienced a steep decline, which has continued into 2015.If prices remain at or near current levels for the rest of 2015, or if they decline further, the prices used todetermine our year-end 2015 reserves will be significantly lower than those used for year-end 2014, asmandated by SEC regulations. Under such circumstances, we may experience significant negative price-related revisions to our proved reserves at year-end 2015. For example, under a much lower pricescenario used for reserves reporting purposes, a significant portion of our proved undeveloped reservesmay no longer meet the economic producibility criteria under the rules. Similarly, while we have
31

significant control over variable costs, certain costs in our long-lived fields, such as Elk Hills, are fixed,having the effect of increasing costs on a per barrel basis in later years as production declines, renderingthem uneconomic in a lower price environment. We would expect that our production-sharing typecontracts would partially offset these negative revisions. Further, we believe that a prolonged period oflow oil prices would result in lower operating costs, which would tend to mitigate price related negativerevisions to some extent by improving the economics of proved undeveloped reserves as well asextending the economic lives of long-lived fields.
The following tables summarize our estimated proved reserves and related PV-10 and StandardizedMeasure at December 31, 2014. Reserves are stated net of applicable royalties. Estimated reserves includeour economic interests under arrangements similar to production-sharing contracts relating to theWilmington field in Long Beach.
As of December 31, 2014
San LosJoaquin Angeles Ventura SacramentoBasin Basin Basin Basin Total
Proved developed reserves:Oil (MMBbl) 229 124 34 — 387NGLs (MMBbl) 62 — 2 — 64Natural Gas (Bcf) 458 11 28 110 607
Total (MMBoe)(1)(2) 367 126 41 18 552
Proved undeveloped reserves:Oil (MMBbl) 111 39 14 — 164NGLs (MMBbl) 20 — 1 — 21Natural Gas (Bcf) 163 5 9 6 183
Total (MMBoe)(2) 158 40 17 1 216
Total proved reserves:Oil (MMBbl) 340 163 48 — 551NGLs (MMBbl) 82 — 3 — 85Natural Gas (Bcf) 621 16 37 116 790
Total (MMBoe)(2) 525 166 58 19 768
(1) Approximately 11% of proved developed oil reserves, 5% of proved developed NGLs reserves, 9% of proved developednatural gas reserves and 10% of total proved developed reserves are non-producing.
(2) Natural gas volumes have been converted to Boe based on the equivalence of energy content between six Mcf of gas andone Bbl of oil. Barrels of oil equivalence does not necessarily result in price equivalence. The price of natural gas on abarrel of oil equivalent basis is currently substantially lower than the corresponding price for oil and has been similarlylower for a number of years. For example, in 2014, the average prices of Brent oil and NYMEX natural gas were $99.51per Bbl and $4.34 per Mcf, respectively, resulting in an oil-to-gas price ratio of approximately 23 to 1.
PV-10 and Standardized Measure
AtDecember 31,
2014
PV-10 of proved reserves (in millions)(1) $ 16,091Standardized measure (in millions) $ 10,828
(1) PV-10 is a non-GAAP financial measure and represents the year-end present value of estimated future cash inflows fromproved oil and natural gas reserves, less future development and production costs, discounted at 10% per annum toreflect the timing of future cash flows and using SEC prescribed pricing assumptions for the period. PV-10 differs fromStandardized Measure because Standardized Measure includes the effects of future income taxes on future net cashflows. Neither PV-10 nor Standardized Measure should be construed as the fair value of our oil and natural gas reserves.PV-10 and Standardized Measure are used by the industry and by our management as an asset value measure tocompare against our past reserve bases and the reserve bases of other business entities because the pricing, costenvironment and discount assumptions are prescribed by the SEC and are comparable. PV-10 further facilitates thecomparisons to other companies as it is not dependent on the tax paying status of the entity.
32

The following table provides a reconciliation of our Standardized Measure to PV-10:
AtDecember 31,
2014
(in millions)PV-10 $ 16,091Present value of future income taxes discounted at 10% (5,263)
Standardized Measure of Discounted Future Net Cash Flows $ 10,828
Proved Reserve Additions
Our total proved reserve additions from all sources were 82 MMBoe in 2014. Of these reserveadditions, 118 MMboe were the result of our capital program and 6 MMBoe as a result of propertyacquisitions. These additions were partially offset by 42 MMBoe of negative revisions. The total additionsto our proved reserves during the year ended December 31, 2014 were as follows:
San LosJoaquin Angeles Ventura SacramentoBasin Basin Basin Basin Total
Improved recovery:Oil (MMBbl) 70 11 4 — 85NGLs (MMBbl) 13 — — — 13Natural Gas (Bcf) 107 — 2 5 114
Total (MMBoe) 101 11 4 1 117
Extensions and discoveries:Oil (MMBbl) 1 — — — 1NGLs (MMBbl) — — — — —Natural Gas (Bcf) — — — — —
Total (MMBoe) 1 — — — 1
Total reserve additions from capitalprogram 102 11 4 1 118
Revisions of previous estimates(1):Oil (MMBbl) (41) 8 (4) — (37)NGLs (MMBbl) 8 — — — 8Natural Gas (Bcf) (91) — 4 7 (80)
Total (MMBoe) (48) 8 (3) 1 (42)
Acquisitions:Oil (MMBbl) 1 — 5 — 6NGLs (MMBbl) — — — — —Natural Gas (Bcf) — — 2 — 2
Total (MMBoe) 1 — 5 — 6
Total proved reserve additionsOil (MMBbl) 31 19 5 — 55NGLs (MMBbl) 21 — — — 21Natural Gas (Bcf) 16 — 8 12 36
Total (MMBoe) 55 19 6 2 82
(1) Of these, (1) MMBoe were price-related.
Our ability to add reserves, other than through purchases, depends on the success of improvedrecovery, extension and discovery projects, each of which depends on reservoir characteristics,technology improvements and oil and natural gas prices, as well as capital and operating costs. Many ofthese factors are outside management’s control, and will affect whether the historical sources of provedreserve additions continue to provide reserves at similar levels.
33

Improved Recovery
In 2014, we added proved reserves of 117 MMBoe from improved recovery through proven IOR andEOR methods, as well as unconventional primary mechanisms. The improved recovery additions in 2014were mainly associated with the continued development of properties in the San Joaquin and Los Angelesbasins. These properties comprise both conventional and unconventional projects. The types ofconventional IOR and EOR development methods we use can be applied through existing wells, thoughadditional drilling is frequently required to fully optimize the development configuration. Many of ourprojects, including unconventional projects, rely on improving permeability to increase flow in the wells. Inaddition, some improved recovery comes from drilling infill wells that allow recovery of reserves thatwould not be recoverable from existing wells.
Extensions and Discoveries
We also added 1 MMBoe of proved reserves from extensions and discoveries, which generally resultfrom exploration and exploitation programs.
Revisions of Previous Estimates
Revisions can include upward or downward changes to previous proved reserve estimates due to theevaluation or interpretation of geologic, production decline or operating performance data. In addition,product price changes affect proved reserves we record. For example, higher prices may increase theeconomically recoverable reserves, because the extra margin extends the expected life of the operations.Offsetting this effect, higher prices slightly decrease our share of proved reserves under arrangementssimilar to production-sharing contracts at our Long Beach operations because less oil is required torecover costs. Conversely, when prices drop, our share of proved reserves slightly increases for sucharrangements similar to production-sharing contracts and economically recoverable reserves may drop forother operations. The negative revisions of 42 million Boe were mainly the result of performance relatedadjustments to several legacy projects concentrated in the San Joaquin basin, primarily in Elk Hills.
34

Proved Undeveloped Reserves
In 2014, we had proved undeveloped reserve additions of 89 MMBoe from improved recovery,primarily in the San Joaquin and Los Angeles basins, partially offset by 24 MMBoe of negative revisions.We also transferred 81 MMBoe of proved undeveloped reserves to the proved developed category as aresult of the 2014 development programs, of which 98% were in the San Joaquin and Los Angeles basins.We invested approximately $1.2 billion in 2014 to convert proved undeveloped reserves to proveddeveloped reserves. The total changes to our proved undeveloped reserves during the year endedDecember 31, 2014 were as follows:
San LosJoaquin Angeles Ventura SacramentoBasin Basin Basin Basin Total
Improved recovery:Oil (MMBbl) 56 8 2 — 66NGLs (MMBbl) 9 — — — 9Natural Gas (Bcf) 80 — 1 — 81
Total (MMBoe) 79 8 2 — 89
Extensions and discoveries:Oil (MMBbl) 1 — — — 1NGLs (MMBbl) — — — — —Natural Gas (Bcf) — — — — —
Total (MMBoe) 1 — — — 1
Revisions of previous estimates:Oil (MMBbl) (13) (2) (4) — (19)NGLs (MMBbl) 2 — — — 2Natural Gas (Bcf) (40) — (2) — (42)
Total (MMBoe) (18) (2) (4) — (24)
Acquisitions:Oil (MMBbl) — — 1 — 1NGLs (MMBbl) — — — — —Natural Gas (Bcf) — — — — —
Total (MMBoe) — — 1 — 1
Transfers to proved developedreserves:Oil (MMBbl) (39) (13) (2) — (54)NGLs (MMBbl) (11) — — — (11)Natural Gas (Bcf) (93) (2) (1) (1) (97)
Total (MMBoe) (66) (13) (2) — (81)
Proved undeveloped reservechanges, net of transfers:Oil (MMBbl) 5 (7) (3) — (5)NGLs (MMBbl) — — — — —Natural Gas (Bcf) (53) (2) (2) (1) (58)
Total (MMBoe) (4) (7) (3) — (14)
Reserves Evaluation and Review Process
Our estimates of proved reserves and associated future net cash flows as of December 31, 2014 weremade by our technical personnel with the assistance of operational and financial personnel and are theresponsibility of management. The estimation of proved reserves is based on the requirement ofreasonable certainty of economic producibility and management’s funding commitments to develop thereserves. This process involves reservoir engineers, geoscientists, planning engineers and financialanalysts. As part of the proved reserves estimation process, all reserve volumes are estimated by aforecast of production rates, operating costs and capital investments. Price differentials between specified
35

benchmark prices and realized prices and specifics of each operating agreement are then used toestimate the net reserves. Production rate forecasts are derived by a number of methods, includingestimates from decline-curve analysis, type-curve analysis, material balance calculations that take intoaccount the volumes of substances replacing the volumes produced and associated reservoir pressurechanges, seismic analysis and computer simulation of the reservoir performance. These field-testedtechnologies have demonstrated reasonably certain results with consistency and repeatability in theformations being evaluated or in analogous formations. Operating and capital costs are forecast using thecurrent cost environment applied to expectations of future operating and development activities relatedto the proved reserves.
Net proved developed reserves are those volumes that are expected to be recovered through existingwells with existing equipment and operating methods, for which the incremental cost of any additionalrequired investment is relatively minor. Net proved undeveloped reserves are those volumes that areexpected to be recovered from new wells on undrilled acreage, or from existing wells where a relativelymajor expenditure is required for recompletion.
Our Vice President, Reserves and Corporate Development assumed primary responsibility foroverseeing the preparation of our reserve estimates in connection with the Spin-off. She has over14 years of experience as an energy sector engineer including as a Senior Reservoir Engineer with RyderScott. She is a member of the Society of Petroleum Engineers, for which she served as past chair of theU.S. Registration Committee. She holds a Master of Engineering in Petroleum Engineering from theUniversity of Houston and a Bachelor of Science from the University of Florida and is a registeredengineer in the State of Texas.
We have an Oil and Gas Reserves Review Committee (‘‘Reserves Committee’’), consisting of seniorcorporate officers, which reviewed and approved our oil and natural gas reserves for 2014. The ReservesCommittee reports to the Audit Committee during the year. Ryder Scott was retained to separatelyreview the oil and natural gas reserves estimation processes used in 2014 for our properties and toprovide the opinion noted below.
Ryder Scott conducted a process review of the methods and analytical procedures used by ourengineering and geological staff to estimate the proved reserves volumes, prepare the economicevaluations and determine reserves classifications as of December 31, 2014. Ryder Scott reviewed thespecific application of such methods and procedures for selected oil and gas properties considered to bea valid representation of our 2014 year-end total proved reserves portfolio. In 2014, Ryder Scott reviewedapproximately 32% of our proved oil and natural gas reserves. Since being engaged by our former parentin 2003, Ryder Scott has reviewed the specific application of reserve estimation methods and proceduresfor approximately 88% of our proved oil and natural gas reserves that existed at December 31, 2014.Ryder Scott was retained to provide objective third-party input on the methods and procedures used toestimate our oil and natural gas reserves for 2014 and to gather industry information applicable to thereserve estimation and reporting process for those reserves. Ryder Scott was not engaged to render anopinion as to the reasonableness of our reserves quantities. We filed Ryder Scott’s independent report asan exhibit to this Form 10-K.
Based on its reviews, including the data, technical processes and interpretations presented withrespect to our oil and natural gas reserves, Ryder Scott concluded that the overall procedures andmethodologies utilized in estimating the proved reserves volumes, documenting the changes in reservesfrom prior estimates, preparing the economic evaluations and determining the reserves classifications forthe reviewed properties are appropriate for the purpose thereof and comply with current SEC regulations.
Because the separation of CRC from Occidental occurred in late 2014, we used Occidental’sestablished reserves review process described above to estimate our 2014 proved reserves. Following the2014 reserve estimation, we intend to rely more heavily on independent reserves estimation companies,such as Ryder Scott, to estimate our proved reserves volumes.
Determination of Identified Drilling Locations
Proven Drilling Locations
Based on our reserves report as of December 31, 2014, we have approximately 2,400 gross (2,300net) drilling locations attributable to our proved undeveloped reserves. We use production data andexperience gained from our development programs to identify and prioritize this proven drilling inventory.These drilling locations are included in our inventory only after they have been evaluated technically and
36
are deemed to have a high likelihood of being drilled within a five-year time frame. As a result of rigoroustechnical evaluation of geologic and engineering data, it can be estimated with reasonable certainty thatreserves from these locations will be commercially recoverable in accordance with SEC guidelines.Management considers the availability of local infrastructure, drilling support assets, state and localregulations and other factors it deems relevant in determining such locations.
Unproven Drilling Locations
We have also identified a multi-year inventory of 10,200 gross (9,800 net) drilling locations that arenot associated with proved undeveloped reserves but are specifically identified on a field-by-field basisconsidering the applicable geologic, engineering and production data. We analyze past field developmentpractices and identify analogous drilling opportunities taking into consideration historical productionperformance, estimated drilling and completion costs, spacing and other performance factors. Thesedrilling locations primarily include (i) infill drilling locations, (ii) additional locations due to field extensionsor (iii) potential IOR and EOR project expansions, some of which are currently in the pilot phase acrossour properties, but have yet to be moved to the proven category. We believe the assumptions and dataused to estimate these drilling locations are consistent with established industry practices with wellspacing selected based on the type of recovery process we are using.
Exploration Drilling Locations
Our portfolio of prospective drilling locations contains approximately 7,200 gross (5,100 net) unriskedexploration drilling locations in proven formations, the majority of which are located near existingproducing fields. We use internally generated information and proprietary models consisting of data fromanalog plays, 3D seismic data, open hole and mud log data, cores, and reservoir engineering data to helpdefine the extent of the targeted intervals and the potential ability of such intervals to producecommercial quantities of hydrocarbons. Information used to identify exploration locations includes bothour own proprietary data, as well as industry data available in the public domain. After defining thereservoir target area, we identified our exploration drilling locations within the applicable intervals byapplying the well spacing we have historically utilized for the applicable type of recovery process used.
Prospective Resource Drilling Locations
In addition, we have approximately 6,400 gross (5,300 net) unrisked prospective resource drillinglocations identified in the lower Monterey, Kreyenhagen and Moreno resource plays based on screeningcriteria that contain geologic and economic considerations and very limited production information.Prospective play areas are defined by geologic data consisting of well cuttings, hydrocarbon shows,open-hole well logs, geochemical data, available 3D or 2D seismic data and formation pressure data,where available. Information used to identify our prospective locations includes both our own proprietarydata, as well as industry data available in the public domain. Prospective resource drilling locations werebased on an assumption of 80-acre spacing per well throughout the prospective area for each resourceplay.
Well Spacing Determination
Our well spacing determinations in the above categories of identified well locations are based onactual operational spacing within our existing producing fields, which we believe are reasonable for theparticular recovery process employed (i.e., primary, waterflood or EOR). Due to the significant verticalthickness and multiple stacked reservoirs usually encountered by our drilling wells, typical well spacing isgenerally less than 20 acres and often 10 acres or less in the majority of our fields unless specifieddifferently above. These parameters also meet the general well spacing restrictions imposed on certain oiland gas fields in California.
Drilling Schedule
Our identified drilling locations have been scheduled as part of our current multi-year drillingschedule or are expected to be scheduled in the future. However, we may not drill our identified sites atthe times scheduled or at all. We view the risk profile for our exploration drilling locations and ourprospective resource drilling locations as being higher than for our other drilling locations due torelatively less available geologic and production data and drilling history, in particular with respect to ourprospective resource locations, which are in unproven geologic plays. We make assumptions about theconsistency and accuracy of data when we identify these locations that may prove inaccurate.
37

Our ability to profitably drill and develop our identified drilling locations depends on a number ofvariables, including crude oil and natural gas prices, the availability of capital, costs, drilling results,regulatory approvals, available transportation capacity and other factors. If future drilling results in theseprojects do not establish sufficient reserves to achieve an economic return, we may curtail drilling ordevelopment of these projects. For a discussion of the risks associated with our drilling program, see‘‘Risk Factors—Risks Related to Our Business.’’
The table below sets forth our total gross identified drilling locations as of December 31, 2014,excluding our prospective drilling locations from new resource plays.
Total Identified DrillingProven Drilling Locations Locations
Oil and Oil andNatural Gas Injection Natural Gas Injection
Wells Wells Wells Wells
San Joaquin BasinPrimary Conventional 150 — 3,900 —Steamflood 900 250 3,100 900Waterflood 100 50 1,000 700Unconventional 300 — 4,550 300
San Joaquin Basin subtotal 1,450 300 12,550 1,900
Los Angeles BasinPrimary Conventional — — 50 —Steamflood — — — —Waterflood 300 150 1,300 650Unconventional — — — —
Los Angeles Basin subtotal 300 150 1,350 650
Ventura BasinPrimary Conventional 50 — 1,650 —Steamflood 15 — 200 —Waterflood 50 50 200 250Unconventional 2 — 50 —
Ventura Basin subtotal 117 50 2,100 250
Sacramento BasinPrimary Conventional 1 — 1,000 —
Sacramento Basin subtotal 1 — 1,000 —
Total Identified Drilling Locations 1,868 500 17,000 2,800
Production, Price and Cost History
Oil, NGLs and natural gas are commodities; therefore, the price that we receive for our production islargely a function of market supply and demand. Product prices are affected by a variety of factors,including changes in consumption patterns, global and local (particularly for natural gas) economicconditions, the actions of OPEC and other oil and natural gas producing countries, inventory levels, actualor threatened production disruptions, currency exchange rates, worldwide drilling and explorationactivities, the effects of conservation, weather, geophysical and technical limitations, refining andprocessing disruptions, transportation bottlenecks and other matters affecting the supply and demanddynamics of oil, natural gas and NGLs, and the effect of changes in market perceptions. We have onlyoccasionally hedged commodity price risk. However, given the recent steep decline in oil prices, werecently started a hedging program to protect our down-side price risk and preserve our ability toexecute our capital program in 2015.
38

The following table sets forth information regarding production, realized and benchmark prices, andproduction costs for oil and gas producing activities for the years ended December 31, 2014, 2013 and2012. For additional information on price calculations, see information set forth in ‘‘Management’sDiscussion and Analysis of Financial Condition and Results of Operations.’’
Year Ended December 31,
2014 2013 2012
Production Data:Oil (MBbl/d) 99 90 88NGLs (MBbl/d) 19 20 17Natural gas (MMcf/d) 246 260 256Average daily combined production (MBoe/d) 159 154 148Total combined production (MMBoe) 58 56 54Average realized prices:Oil (per Bbl) $ 92.30 $ 104.16 $ 104.02NGLs (per Bbl) $ 47.84 $ 50.43 $ 52.76Natural gas (per Mcf) $ 4.39 $ 3.73 $ 2.94Average Benchmark prices:WTI oil ($/Bbl) $ 93.00 $ 97.97 $ 94.21Brent oil ($/Bbl) $ 99.51 $ 108.76 $ 111.70NYMEX gas ($/Mcf) $ 4.34 $ 3.66 $ 2.81Average costs per Boe:Production costs $ 17.64 $ 17.10 $ 22.58General and administrative expenses(a) $ 2.31 $ 2.35 $ 2.48Other operating expenses(b) $ 0.55 $ 0.60 $ 0.33Depreciation, depletion and amortization $ 20.40 $ 20.11 $ 16.82Taxes other than on income $ 3.50 $ 3.05 $ 3.09
(a) For 2014, the amount excludes unusual and infrequent costs of $0.10 per Boe related to Spin-off and transition relatedcosts.
(b) For 2014, the amount excludes unusual and infrequent costs related to rig termination charges and Spin-off and transitionrelated costs of $0.97 per Boe. For 2012, the amount excludes rig termination charges of $0.22 per Boe.
The following table sets forth information regarding production, realized prices and production costsfor our largest two fields, Elk Hills and Wilmington, for the years ended December 31, 2014, 2013 and 2012.
Elk Hills Wilmington
2014 2013 2012 2014 2013 2012
Production data:Oil (MBbl/d) 25 26 29 25 22 21NGLs (MBbl/d) 16 18 15 — — —Natural gas (MMcf/d) 136 145 168 — — —
Average realized prices:Oil (MBbl/d) $ 97.27 $ 106.32 $ 101.19 $ 90.37 $ 103.29 $ 102.15NGLs (MBbl/d) $ 48.68 $ 49.62 $ 53.19 $ — $ — $ —Natural gas (MMcf/d) $ 4.47 $ 3.67 $ 2.86 $ — $ — $ —
Production costs per Boe $ 14.31 $ 12.34 $ 16.46 $ 28.98 $ 31.56 $ 35.13
Note: Natural gas volumes have been converted to Boe based on the equivalence of energy content between six Mcf of naturalgas to one Bbl of oil. Barrels of oil equivalence does not necessarily result in price equivalence. The price of natural gas on a barrelof oil equivalent basis is currently substantially lower than the corresponding price for oil and has been similarly lower for a numberof years. For example, in 2014, the average prices of Brent oil and NYMEX natural gas were $99.51 per Bbl and $4.34 per Mcf,respectively, resulting in an oil-to-gas price ratio of approximately 23 to 1.
39

The following table sets forth our reserves and production by basin and recovery mechanism.
Average Net DailyTotal Proved Production(MBoe/d)
Reserves Year EndedMMBoe Oil (%) December 31, 2014
San Joaquin BasinPrimary Conventional 70 72% 18Waterfloods 60 76% 7Steamfloods(a) 181 100% 30Unconventional 214 33% 57
San Joaquin Basin subtotal 525 65% 112
Los Angeles BasinPrimary Conventional — —% —Waterfloods 166 99% 29Steamfloods — —% —Unconventional — —% —
Los Angeles Basin subtotal 166 99% 29
Ventura BasinPrimary Conventional 31 80% 6Waterfloods 25 87% 2Steamfloods — —% —Unconventional 2 61% 1
Ventura Basin subtotal 58 83% 9
Sacramento BasinPrimary Conventional 19 —% 9
Sacramento Basin subtotal 19 —% 9
Total 768 72% 159
(a) Includes reserves and production from gas injection of 9% and 5%, respectively.
Productive Wells
As of December 31, 2014, we had a total of 9,331 gross (8,384 net) producing wells, approximately90% of which were oil wells. Our average working interest in our producing wells is approximately 90%.Many of our oil wells produce associated natural gas and some of our natural gas wells also producecondensate and NGLs.
The following table sets forth our productive oil and natural gas wells (both producing and capable ofproduction) as of December 31, 2014.
San Joaquin Los Angeles Ventura SacramentoBasin Basin Basin Basin Total
OilGross(a)(b) 10,106 (1,057) 1,943 (56) 1,602 (61) — — 13,651 (1,174)Net(a)(c) 8,994 (817) 1,835 (51) 1,590 (59) — — 12,419 (927)
Natural GasGross(a)(b) 293 (110) 8 — — — 1,345 (52) 1,646 (162)Net(a)(c) 248 (84) 8 — — — 1,260 (50) 1,516 (134)
(a) Numbers in parentheses indicate the number of wells with multiple completions.(b) The total number of wells in which interests are owned.(c) The sum of fractional interests.
40
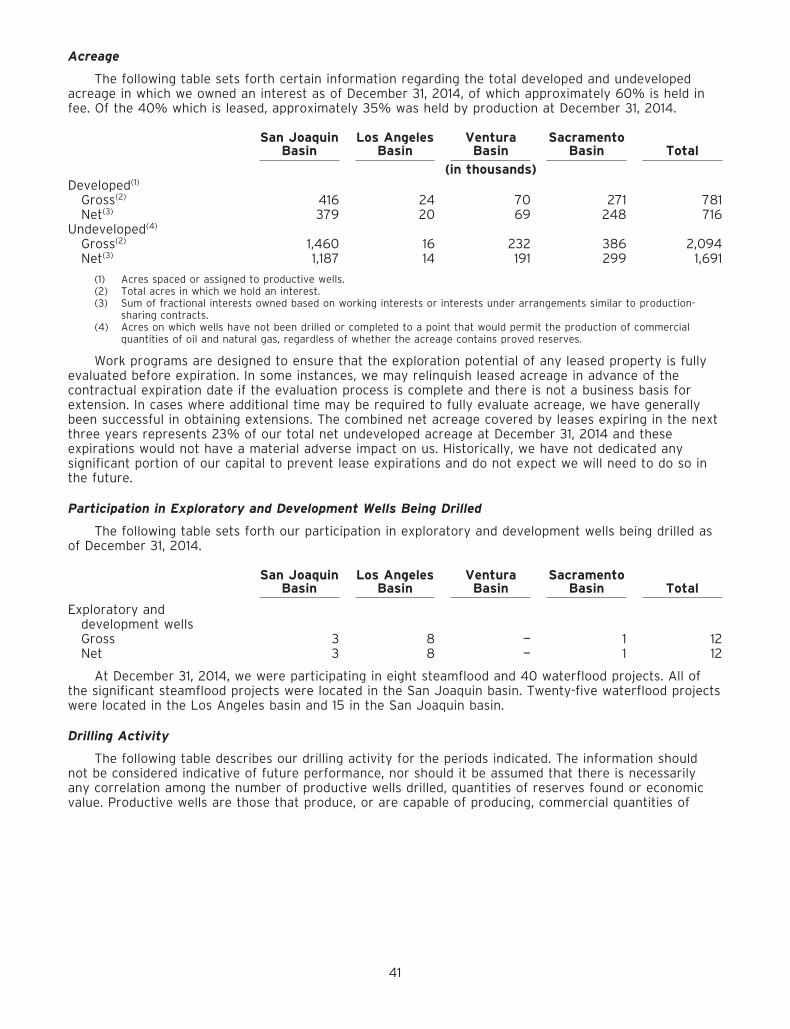
Acreage
The following table sets forth certain information regarding the total developed and undevelopedacreage in which we owned an interest as of December 31, 2014, of which approximately 60% is held infee. Of the 40% which is leased, approximately 35% was held by production at December 31, 2014.
San Joaquin Los Angeles Ventura SacramentoBasin Basin Basin Basin Total
(in thousands)Developed(1)
Gross(2) 416 24 70 271 781Net(3) 379 20 69 248 716
Undeveloped(4)
Gross(2) 1,460 16 232 386 2,094Net(3) 1,187 14 191 299 1,691
(1) Acres spaced or assigned to productive wells.(2) Total acres in which we hold an interest.(3) Sum of fractional interests owned based on working interests or interests under arrangements similar to production-
sharing contracts.(4) Acres on which wells have not been drilled or completed to a point that would permit the production of commercial
quantities of oil and natural gas, regardless of whether the acreage contains proved reserves.
Work programs are designed to ensure that the exploration potential of any leased property is fullyevaluated before expiration. In some instances, we may relinquish leased acreage in advance of thecontractual expiration date if the evaluation process is complete and there is not a business basis forextension. In cases where additional time may be required to fully evaluate acreage, we have generallybeen successful in obtaining extensions. The combined net acreage covered by leases expiring in the nextthree years represents 23% of our total net undeveloped acreage at December 31, 2014 and theseexpirations would not have a material adverse impact on us. Historically, we have not dedicated anysignificant portion of our capital to prevent lease expirations and do not expect we will need to do so inthe future.
Participation in Exploratory and Development Wells Being Drilled
The following table sets forth our participation in exploratory and development wells being drilled asof December 31, 2014.
San Joaquin Los Angeles Ventura SacramentoBasin Basin Basin Basin Total
Exploratory anddevelopment wellsGross 3 8 — 1 12Net 3 8 — 1 12
At December 31, 2014, we were participating in eight steamflood and 40 waterflood projects. All ofthe significant steamflood projects were located in the San Joaquin basin. Twenty-five waterflood projectswere located in the Los Angeles basin and 15 in the San Joaquin basin.
Drilling Activity
The following table describes our drilling activity for the periods indicated. The information shouldnot be considered indicative of future performance, nor should it be assumed that there is necessarilyany correlation among the number of productive wells drilled, quantities of reserves found or economicvalue. Productive wells are those that produce, or are capable of producing, commercial quantities of
41

hydrocarbons, regardless of whether they produce a reasonable rate of return. Net wells represent thesum of fractional interests in wells in which we own an interest.
San Joaquin Los Angeles Ventura SacramentoBasin Basin Basin Basin Total
2014Oil
Exploratory 2.0 — 1.7 — 3.7Development 775.2 170.2 20.3 — 965.7
Natural GasExploratory — — — — —Development — — — 3.0 3.0
DryExploratory 8.0 — 2.0 1.0 11.0Development 2.3 0.9 — — 3.2
2013Oil
Exploratory 2.0 — — — 2.0Development 543.1 125.7 18.8 — 687.6
Natural GasExploratory — — — — —Development — — — 7.7 7.7
DryExploratory 5.0 — 1.0 1.0 7.0Development 2.5 0.9 — — 3.4
2012Oil
Exploratory 8.0 — 2.0 — 10.0Development 485.7 121.4 63.9 — 671.0
Natural GasExploratory 1.0 — — — 1.0Development 2.5 — — 3.0 5.5
DryExploratory 11.0 — — — 11.0Development 4.0 — — — 4.0
Delivery Commitments
We have made commitments to certain refineries and other buyers to deliver oil, natural gas andNGLs. As of December 31, 2014, the total amount contracted to be delivered is approximately 34 MBbls/dof oil under 60-day contracts, 2 Bcf of natural gas under 90-day contracts, and 1 MMBbls of NGLs throughMarch 2015. These are index-based contracts with prices set at the time of delivery at benchmark prices.We have significantly more production capacity than the amounts committed and have the ability tosecure additional volumes in case of a shortfall. None of the commitments in any given year is expectedto have a material impact on our financial statements.
Our Infrastructure
We own infrastructure that is integral to and significantly complements our operations. Our Elk Hillscryogenic gas plant has a capacity of 200 MMcf/d of wellhead gas bringing our total Elk Hills processingcapacity to over 540 MMcf/d. We also own and operate a system of natural gas processing facilities inthe Ventura basin that are capable of processing equity wellhead gas from the surrounding areas. Ournatural gas processing facilities are interconnected via pipelines to nearby third-party rail and truckingfacilities, with access to certain North American NGLs markets. In addition, we have truck rack facilitiescoupled with a battery of pressurized storage tanks at our Elk Hills natural gas processing facility for NGLsales to third parties.
We generate all of our electricity needs at our Elk Hills operations, which run at about 130megawatts, through our wholly-owned 550 megawatt combined-cycle power plant located adjacent to ourElk Hills processing facilities, and sell the excess. We also operate a 46 megawatt cogeneration facility atElk Hills that provides resource diversity and additional reliability to support field operations. Within our
42

Long Beach operations, we operate a 45 megawatt power generating facility that provides over 40% ofthe Long Beach operation’s electricity requirements, reducing operating costs. These power facilities areintegrated with our operations to improve their reliability and performance.
We own an extensive network of over 20,000 miles of oil and gas gathering lines. These gatheringlines are dedicated almost entirely to collect our oil and gas production and are in close proximity to fieldspecific facilities such as tank settings or central processing sites. These lines provide a variety ofservices, including connecting our producing wells to gathering networks, natural gas collection andcompression systems, lines for water treating and injection services, steam supply for our thermalproperties, and water lines that deliver treated water for agriculture. Nearly all of our oil is thentransported through third party pipelines with flexibility to ship to various parties. In addition, virtually allof our natural gas production interconnects with major third-party natural gas pipeline systems. As aresult of these connections, we typically have the ability to access multiple delivery points to improve theprices we obtain for our oil and natural gas production.
ITEM 3 Legal Proceedings
The following is a description of a reportable legal proceeding for this reporting period. It describessignificant developments in this matter previously reported in our Quarterly Report on Form 10-Q for thequarterly period ended September 30, 2014. No new reportable matters arose during the fourth quarterof 2014.
One of our subsidiaries settled a previously disclosed civil claim by the District Attorney for VenturaCounty, California for seven releases of oil or produced water between 2011 and 2014 by paying a$200,000 penalty in January 2015.
ITEM 4 Mine Safety Disclosures
Not applicable.
43
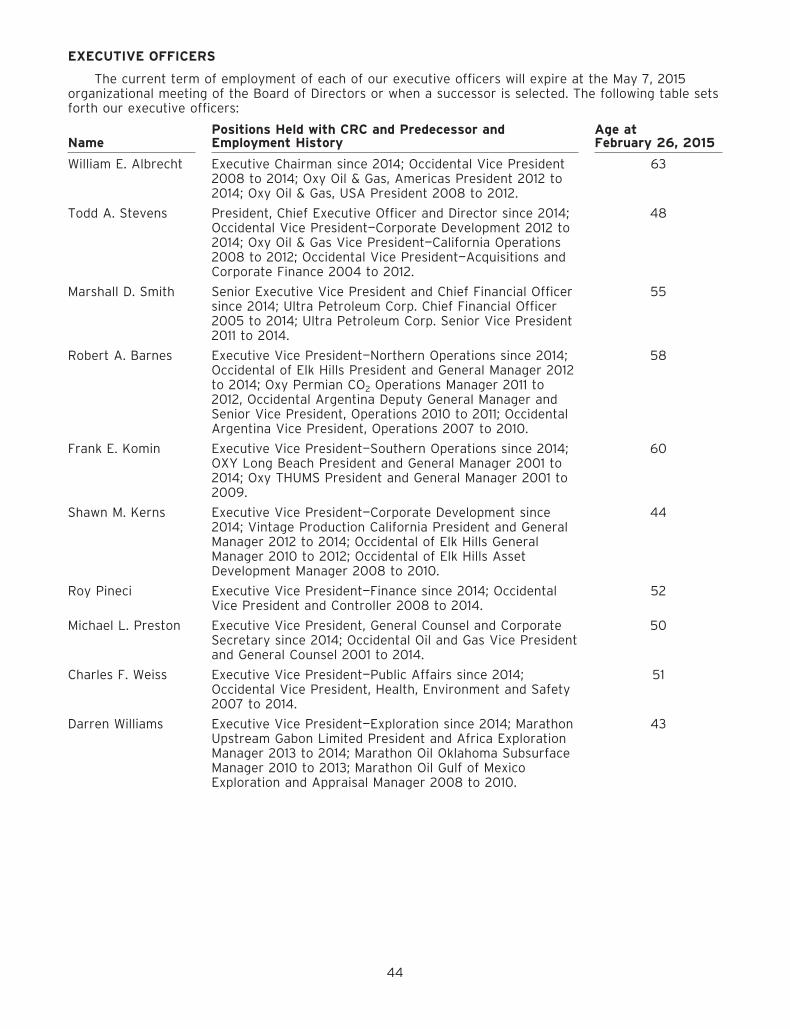
EXECUTIVE OFFICERS
The current term of employment of each of our executive officers will expire at the May 7, 2015organizational meeting of the Board of Directors or when a successor is selected. The following table setsforth our executive officers:
Positions Held with CRC and Predecessor and Age atName Employment History February 26, 2015
William E. Albrecht Executive Chairman since 2014; Occidental Vice President 632008 to 2014; Oxy Oil & Gas, Americas President 2012 to2014; Oxy Oil & Gas, USA President 2008 to 2012.
Todd A. Stevens President, Chief Executive Officer and Director since 2014; 48Occidental Vice President—Corporate Development 2012 to2014; Oxy Oil & Gas Vice President—California Operations2008 to 2012; Occidental Vice President—Acquisitions andCorporate Finance 2004 to 2012.
Marshall D. Smith Senior Executive Vice President and Chief Financial Officer 55since 2014; Ultra Petroleum Corp. Chief Financial Officer2005 to 2014; Ultra Petroleum Corp. Senior Vice President2011 to 2014.
Robert A. Barnes Executive Vice President—Northern Operations since 2014; 58Occidental of Elk Hills President and General Manager 2012to 2014; Oxy Permian CO2 Operations Manager 2011 to2012, Occidental Argentina Deputy General Manager andSenior Vice President, Operations 2010 to 2011; OccidentalArgentina Vice President, Operations 2007 to 2010.
Frank E. Komin Executive Vice President—Southern Operations since 2014; 60OXY Long Beach President and General Manager 2001 to2014; Oxy THUMS President and General Manager 2001 to2009.
Shawn M. Kerns Executive Vice President—Corporate Development since 442014; Vintage Production California President and GeneralManager 2012 to 2014; Occidental of Elk Hills GeneralManager 2010 to 2012; Occidental of Elk Hills AssetDevelopment Manager 2008 to 2010.
Roy Pineci Executive Vice President—Finance since 2014; Occidental 52Vice President and Controller 2008 to 2014.
Michael L. Preston Executive Vice President, General Counsel and Corporate 50Secretary since 2014; Occidental Oil and Gas Vice Presidentand General Counsel 2001 to 2014.
Charles F. Weiss Executive Vice President—Public Affairs since 2014; 51Occidental Vice President, Health, Environment and Safety2007 to 2014.
Darren Williams Executive Vice President—Exploration since 2014; Marathon 43Upstream Gabon Limited President and Africa ExplorationManager 2013 to 2014; Marathon Oil Oklahoma SubsurfaceManager 2010 to 2013; Marathon Oil Gulf of MexicoExploration and Appraisal Manager 2008 to 2010.
44

PART II
ITEM 5 MARKET FOR REGISTRANT’S COMMON EQUITY, RELATED STOCKHOLDER MATTERS ANDISSUER PURCHASES OF EQUITY SECURITIES
Market Information for Common Stock
Our common stock began trading ‘‘regular way’’ on the New York Stock Exchange (NYSE) under thesymbol ‘‘CRC’’ on December 1, 2014. Prior to that date there was no public trading market for ourcommon stock. The following schedule sets forth the high and low sales price per share of our commonstock as reported on the NYSE for the period indicated:
Stock Price
High Low
Fourth Quarter 2014 (starting December 1, 2014) $ 7.37 $ 5.29
Holders of Record
CRC common stock was held by approximately 27,000 stockholders of record at December 31, 2014,and by approximately 400,000 additional stockholders whose shares were held for them in street nameor nominee accounts.
Dividend Policy
Our Board of Directors declared a cash dividend of $0.01 per share on February 26, 2015, payable onApril 15, 2015 to stockholders of record on March 10, 2015. The payment of future cash dividends, if any,will be at the discretion of our Board of Directors and will depend upon, among other things, our financialcondition, results of operations, capital requirements and development expenditures, future businessprospects and any restrictions imposed by future debt instruments.
Securities Authorized for Issuance Under Equity Compensation Plans
Our stock-based compensation plans were approved by our sole stockholder prior to the Spin-off. Adescription of the plans can be found in Note 11 of our Financial Statements and Supplementary Data. Theaggregate number of shares of our common stock authorized for issuance under stock-basedcompensation plans for our employees and non-employee directors is 30 million, of which approximately4.3 million had been issued through December 31, 2014.
The following is a summary of the securities available for issuance under such plans:
c) Number of securities remaininga) Number of securities to be issued b) Weighted-average exercise price of available for future issuance under
upon exercise of outstanding options, outstanding options, warrants and equity compensation plans (excludingwarrants and rights rights securities in column (a))
8,481,337 (1) $8.11 (2) 17,115,099 (3)
(1) Includes shares reserved to be issued pursuant to stock options and performance-based awards. Shares for performance-based awards are included assuming maximum payout, based on the certification of such awards on February 26, 2015.
(2) Price applies only to the Options included in column (a). Exercise price is not applicable to the other awards included incolumn (a).
(3) Includes 5 million shares subject to rights to purchase common stock at 85% of the lower of the market price at (i) thestart of a quarter and (ii) the end of a quarter. Shares will first become subject to purchase at the end of the firstquarter of 2015.
45

2MAR201513305774
Performance Graph
The following graph compares the cumulative total return to stockholders on our common stockrelative to the cumulative total returns of the S&P 500 and Dow Jones U.S. Exploration and Productionindexes (with reinvestment of all dividends). The graph assumes $100 was invested in our common stockand in each index on December 1, 2014, the date our common stock began trading on the NYSE, and itsrelative performance is tracked through December 31, 2014. The returns shown are based on historicalresults and are not intended to suggest future performance.
$120
$100
$80
$60
$40
$20
$012/1/14
California Resources Corp S&P 500 Dow Jones US Exploration & Production
12/31/14
This performance graph shall not be deemed ‘‘soliciting material’’ or to be ‘‘filed’’ with the SEC forpurposes of Section 18 of the Securities Exchange Act of 1934, as amended (Exchange Act), or otherwisesubject to the liabilities under that Section, and shall not be deemed to be incorporated by reference intoany filing of CRC under the Securities Act of 1933, as amended, or the Exchange Act except to the extentthat we specifically request it be treated as soliciting material or specifically incorporate it by reference.
46

ITEM 6 SELECTED FINANCIAL DATA
Prior to the Spin-off on November 30, 2014, the following selected financial data was derived fromthe California business of Occidental. All financial information presented after the Spin-off representsCRC’s consolidated results of operations, financial position and cash flows. Accordingly:
• The selected statement of operations and cash flows data for the year ended December 31, 2014consists of the stand-alone consolidated results of California Resources Corporation post Spin-offand the consolidated and combined results of the California business prior to the Spin-off. Theselected statement of operations data for the years ended December 31, 2013, 2012, 2011, and2010 consist entirely of the combined results of the California business.
• The selected balance sheet data at December 31, 2014 consists of the consolidated balances ofCalifornia Resources Corporation, while the selected balance sheet data at December 31, 2013,2012, 2011 and 2010 consists of the combined balances of the California business.
Year Ended December 31,
2014 2013 2012 2011 2010
(in millions)Statement of Operations DataRevenues $ 4,173 $ 4,284 $ 4,073 $ 3,934 $ 2,912Income / (loss) before income taxes $ (2,421) $ 1,447 $ 1,181 $ 1,641 $ 1,129Net income / (loss) $ (1,434) $ 869 $ 699 $ 971 $ 719
Per common share(a)
Basic $ (3.75) $ 2.24 $ 1.80 $ 2.50 $ 1.85Diluted $ (3.75) $ 2.24 $ 1.80 $ 2.50 $ 1.85
Statement of Cash Flows DataNet cash provided by operating activities $ 2,371 $ 2,476 $ 2,223 $ 2,456 $ 1,751Capital investments $ (2,020) $ (1,669) $ (2,331) $ (2,164) $ (1,056)Acquisitions $ (288) $ (48) $ (427) $ (1,405) $ (448)Borrowings, net of costs $ 6,290 $ — $ — $ — $ —Spin-off related dividends to Occidental $ (6,000) $ — $ — $ — $ —(Distributions to) contributions from
Occidental, net $ (335) $ (763) $ 532 $ 1,106 $ (248)
(a) See Note 13—Earnings Per Share, in the Notes to the Financial Statements.
As of December 31,
2014 2013 2012 2011 2010
(in millions)Balance Sheet DataTotal current assets $ 701 $ 254 $ 245 $ 195 $ 148Property, plant and equipment, net $ 11,685 $ 14,008 $ 13,499 $ 11,778 $ 8,823Total assets $ 12,497 $ 14,297 $ 13,764 $ 11,989 $ 8,987Total current liabilities $ 906 $ 689 $ 551 $ 664 $ 471Long-term debt $ 6,360 $ — $ — $ — $ —Equity / Net Investment $ 2,611 $ 9,989 $ 9,860 $ 8,624 $ 6,557
The selected financial data presented above should be read in conjunction with ‘‘Management’sDiscussion and Analysis of Financial Condition and Results of Operations’’ and the consolidated financialstatements and accompanying notes included elsewhere in this Annual Report on Form 10-K.
47

ITEM 7 MANAGEMENT’S DISCUSSION AND ANALYSIS OF FINANCIAL CONDITION AND RESULTSOF OPERATIONS
Except when the context otherwise requires or where otherwise indicated, (1) all references to ‘‘CRC,’’the ‘‘Company,’’ ‘‘we,’’ ‘‘us’’ and ‘‘our’’ refer to California Resources Corporation and its subsidiaries or theCalifornia business, (2) all references to the ‘‘California business’’ refer to Occidental’s California oil andgas exploration and production operations and related assets, liabilities and obligations, which we haveassumed in connection with the spin-off from Occidental on November 30, 2014 (the ‘‘Spin-off’’), and(3) all references to ‘‘Occidental’’ refer to Occidental Petroleum Corporation, our former parent, and itssubsidiaries.
The Separation and Spin-off
We are an independent oil and natural gas exploration and production company operating propertiesexclusively within the State of California. We were incorporated in Delaware as a wholly-owned subsidiaryof Occidental on April 23, 2014 and remained a wholly-owned subsidiary of Occidental until the Spin-off.On November 30, 2014, Occidental distributed shares of our common stock on a pro rata basis toOccidental stockholders and we became an independent, publicly traded company. Occidental retainedapproximately 18.5% of our outstanding shares of common stock which it has stated it intends to divestwithin 18 months of the Spin-off.
Basis of Presentation and Certain Factors Affecting Comparability
Up until the Spin-off, the accompanying consolidated and combined financial statements were derivedfrom the consolidated financial statements and accounting records of Occidental. These consolidated andcombined financial statements reflect the historical results of operations, financial position and cash flowsof the California business. All financial information presented after the Spin-off consists of the stand-alone consolidated results of operations, financial position and cash flows of CRC. We account for ourshare of oil and gas exploration and production ventures in which we have a direct working interest, byreporting our proportionate share of assets, liabilities, revenues, costs and cash flows within the relevantlines on the balance sheets and statements of income and cash flows.
The consolidated and combined statements of income for periods prior to the Spin-off includeexpense allocations for certain corporate functions and centrally-located activities historically performedby Occidental. These functions include executive oversight, accounting, treasury, tax, financial reporting,finance, internal audit, legal, risk management, information technology, government relations, publicrelations, investor relations, human resources, procurement, engineering, drilling, exploration, marketing,ethics and compliance, and certain other shared services. These allocations are based primarily onspecific identification of time or activities associated with us, employee headcount or our relative sizecompared to Occidental. Our management believes the assumptions underlying the consolidated andcombined financial statements, including the assumptions regarding allocating expenses from Occidental,are reasonable. However, the financial statements may not include all of the actual expenses that wouldhave been incurred, or may include duplicative costs and may not reflect our results of operations,financial position and cash flows had we operated as a stand-alone public company during the periodspresented. Actual costs that would have been incurred if we had been a stand-alone company prior to theSpin-off would depend on multiple factors, including organizational structure and strategic and operatingdecisions. There may be some additional non-recurring costs of operating as a stand-alone company,which are not expected to be material.
Prior to the Spin-off, we participated in Occidental’s centralized treasury management program anddid not incur any debt. Additionally, excess cash generated by our business was distributed to Occidental,and likewise our cash needs were provided by Occidental, in the form of contributions.
Had we been a stand-alone company for the full year 2014, and had the same level of debtthroughout the year as we did on December 31, 2014, of approximately $6.4 billion, we would haveincurred $314 million, $186 million after-tax, of interest expense, on a pro-forma basis, for the year endedDecember 31, 2014, compared to the $72 million pre-tax interest expense reported in our statement ofoperations for the year then ended.
Business Environment and Industry Outlook
Our operating results and those of the oil and gas industry as a whole are heavily influenced bycommodity prices. Oil and gas index prices and differentials may fluctuate significantly, generally as a
48

result of changes in supply and demand and other market-related uncertainties. These and other factorsmake it impossible to predict realized prices reliably. We respond to economic conditions primarily byadjusting our capital investments to be in line with current economic conditions, including adjusting thesize and allocation of our capital program. The changes in the capital program have an impact on ourproduction levels and cash flows.
Given the recent volatile and deteriorating oil price environment, as well as our leverage, we began ahedging program shortly after the Spin-off to protect our down-side price risk and preserve our ability toexecute our capital program. In December 2014, we purchased put options with a $50 per barrel Brentstrike price, measured monthly. This initial program covers almost all of our oil production for the first sixmonths of 2015. More recently, we put into place additional hedging instruments to protect the pricing foralmost two-thirds of our expected third quarter 2015 oil production. For this program we chose acombination of Brent-based collars (between $55 and $72) for 30,000 barrels per day for July throughSeptember as well as put options at $50 per barrel Brent for 40,000 barrels per day in the same period.In addition, we sold a $75 per barrel call for 30,000 barrels per day of oil production in March throughJune of 2015. Going forward as an independent company, we will continue to be strategic andopportunistic in implementing any hedging program. Our objective is to protect against the cyclical natureof commodity prices to provide a level of certainty around our margins and cash flows necessary toimplement our investment program.
We sell all of our crude oil into California markets, which typically reflect international waterborne-based prices because the structural energy deficit in the State results in most of its oil being imported.Over the last several years, these prices have exceeded and continue to exceed West Texas Intermediate(‘‘WTI’’) based prices for comparable grades. Due to much lower levels of natural gas productioncompared to our oil production, the changes in natural gas prices have a significantly lower impact on ouroperating results. Lower natural gas prices generally have a positive effect on our steamflood projectsthat use natural gas to generate the steam being injected. Average oil prices were lower in 2014 than2013, caused by a steep decline in prices in the last half of 2014. Average Brent prices were $108.76 perbarrel in 2013 and $99.51 per barrel in 2014 ending 2014 at $57.33. Our realized price for crude oil as apercentage of Brent prices was approximately 93% and 96% for 2014 and 2013, respectively. Oil pricescontinued to decline in the early part of 2015.
The following table presents the average daily WTI oil, Brent oil and NYMEX gas prices for each ofthe years ended December 31, 2014, 2013 and 2012:
2014 2013 2012
WTI oil ($/Bbl) $ 93.00 $ 97.97 $ 94.21Brent oil ($/Bbl) $ 99.51 $ 108.76 $ 111.70NYMEX gas ($/Mcf) $ 4.34 $ 3.66 $ 2.81
Oil prices and differentials will continue to be affected by (i) global supply and demand, which aregenerally a function of global economic conditions, the actions of OPEC, other significant producers andgovernments, inventory levels, threatened or actual production or refining disruptions, the effects ofconservation, technological advances and regional market conditions; (ii) transportation capacity and costin producing areas; (iii) currency exchange rates; and (iv) the effect of changes in these variables onmarket perceptions.
Prices and differentials for natural gas liquids (‘‘NGLs’’) are related to the supply and demand for theproducts making up these liquids. Some of them more typically correlate to the price of oil while othersare affected by natural gas prices as well as the demand for certain chemical products for which they areused as feedstock. In addition, infrastructure constraints magnify the pricing volatility.
Natural gas prices and differentials are strongly affected by local supply and demand fundamentals,as well as availability of transportation capacity from producing areas.
Our earnings are also affected by the performance of our processing and power generation assets.We process our wet gas to extract NGLs and other natural gas byproducts, and deliver dry gas topipelines and separately sell the NGLs. The efficiency with which we extract liquids from the wet gasstream affects our operating results. In addition, a portion of the power produced by our Elk Hills powerplant is used for certain of our operations while a majority of the output is sold to third parties.
49

Seasonality
Seasonality is not a primary driver of changes in our quarterly earnings during the year.
Taxes
Deferred tax liabilities, net of deferred tax assets of $444 million, were approximately $2.0 billion atDecember 31, 2014. The current portion of total deferred tax assets was $61 million as of December 31,2014, which was reported in other current assets. The realization of deferred tax assets is assessedperiodically based on several factors, including our expectation to generate sufficient future taxableincome and reversal of taxable temporary differences.
The following table sets forth the calculation of our effective income tax rate for each of the yearsended December 31 (in millions):
2014 2013 2012
Pre-tax income/(loss) $ (2,421) $ 1,447 $ 1,181Income tax (expense)/benefit 987 (578) (482)
Net income/(loss) $ (1,434) $ 869 $ 699
Effective tax rate 41% 40% 41%
Operations
We conduct our operations through fee interests, land leases and other contractual arrangements. Webelieve we are the largest private oil and natural gas mineral acreage holder in California, with interestsin approximately 2.4 million net acres, approximately 60% of which we hold in fee. Our oil and gas leaseshave a primary term ranging from one to ten years, which is extended through the end of productiononce it commences. We also own a network of strategically placed and integral infrastructure assets,including gas plants, oil and gas gathering systems, a power plant and other related assets to maximizethe value generated from our production.
Our share of production and reserves from operations in Long Beach, California are subject tocontractual arrangements similar to production-sharing contracts and are in effect through the economiclife of the assets. Under such contracts we are obligated to fund all capital and production costs. Werecord a share of production and reserves to recover such capital and production costs and an additionalshare for profit. Our portion of the production represents volumes: (1) to recover our partners’ share ofcapital and production costs that we incur on their behalf and costs associated with contractually definedbase production, (2) for our defined share of base production and (3) for our defined share of productionin excess of base production for each period. We recover our share of capital and production costs, andgenerate returns, through our defined share of production from base and incremental production in(2) and (3) above. These contracts do not transfer any right of ownership to us and reserves reportedfrom these arrangements are based on our economic interest as defined in the contracts. Our share ofproduction and reserves from these contracts decreases when product prices rise and increases whenprices decline, however, our net economic benefit is greater when product prices are higher. Thesecontracts represented approximately 16% of our production for the year ended December 31, 2014.
50

Results
Results for the year ended December 31, 2014 were a net loss of $1,434 million, compared with netincome of $869 million for the year ended December 31, 2013. The net loss in 2014 largely reflected a$2.0 billion non-cash after-tax impairment charge for proved and unproved properties in the fourthquarter of 2014 and approximately $64 million in after-tax charges for rig terminations, other price-related charges and Spin-off and transition related costs. There were no similar charges or costs in 2013.Net income for 2014, excluding these charges, was $650 million as reflected in the table below.
The table below reconciles net income / (loss) to core income and lists unusual and infrequent itemsaffecting earnings for each year (in millions):
2014 2013 2012
Net income / (loss) $ (1,434) $ 869 $ 699Unusual and infrequent items:
Asset impairments 3,402 — 29Rig terminations and other price-related costs 52 — 12Spin-off and transition related costs 55 — —
3,509 — 41
Tax effect of pre-tax adjustments (1,425) — 17
Core income $ 650 $ 869 $ 675
Our results of operations can include the effects of significant unusual and infrequent transactionsand events affecting earnings that vary widely and unpredictably in nature, timing and amount. Therefore,management uses a measure called ‘‘core income,’’ which excludes those items. This non-GAAP measureis not meant to disassociate those items from management’s performance, but rather is meant to provideuseful information to investors interested in comparing our earnings performance between periods.Reported earnings are considered representative of management’s performance over the long term. Coreincome is not considered to be an alternative to income reported in accordance with generally acceptedaccounting principles.
Core income for 2014, compared to 2013, benefited from higher oil production and higher realizednatural gas prices, which were more than offset by lower realized oil prices and lower realized NGL pricesand volumes, and higher production costs, depreciation rates, property taxes, selling, general andadministrative costs and interest expenses. In addition, unit production costs increased mainly due tohigher natural gas and other energy costs, and expenses for surface operations and maintenance.
Core income for the year ended December 31, 2013 was $869 million, compared to $675 million forthe year ended December 31, 2012. The higher income in 2013 reflected higher oil and gas prices andvolumes and higher NGL volumes, partially offset by higher depreciation rates, taxes other than onincome and other expenses. Production costs decreased in 2013, compared to 2012, due to a wide rangeof operational efficiency initiatives implemented in 2012.
51

The following table sets forth our average production volumes of oil, NGLs and natural gas per dayfor each of the three years in the period ended December 31, 2014:
2014 2013 2012
Oil (MBbl/d)San Joaquin Basin 64 58 58Los Angeles Basin 29 26 24Ventura Basin 6 6 6Sacramento Basin — — —
Total 99 90 88NGLs (MBbl/d)
San Joaquin Basin 18 19 16Los Angeles Basin — — —Ventura Basin 1 1 1Sacramento Basin — — —
Total 19 20 17Natural gas (MMcf/d)
San Joaquin Basin 180 182 204Los Angeles Basin 1 2 3Ventura Basin 11 11 12Sacramento Basin 54 65 37
Total 246 260 256
Total Production (MBoe/d) (a) 159 154 148
Note: MBbl/d refers to thousands of barrels per day; MMcf/d refers to millions of cubic feet per day; MBoe/d refers tothousands of barrels of oil equivalent per day.
(a) Natural gas volumes have been converted to Boe based on the equivalence of energy content between six Mcf of naturalgas to one barrel of oil. Barrels of oil equivalence does not necessarily result in price equivalence. The price of naturalgas on a barrel of oil equivalent basis is currently substantially lower than the corresponding price for oil and has beensimilarly lower for a number of years. For example, for the year ended December 31, 2014, the average prices of Brent oiland NYMEX natural gas were $99.51 per barrel and $4.34 per Mcf, respectively, resulting in an oil-to-gas price ratio ofapproximately 23 to 1.
Daily oil and gas production volumes averaged 159,000 Boe for the year ended December 31, 2014,compared with 154,000 Boe for the year ended December 31, 2013. Average daily oil production increasedby 9,000 Boe, or by ten percent, while daily NGLs production decreased by 1,000 Boe and natural gasdecreased by 14 MMcf. The increase in oil production and decline in NGL and natural gas productionreflected our emphasis on high margin oil drilling and reduction of drilling capital for natural gas. Our oilproduction, as well as total production, increased sequentially each quarter during 2014, reaching 105,000barrels per day and 165,000 Boe/d, respectively, in the fourth quarter, both of which were record levelsfor us.
For the year ended December 31, 2013, daily oil and gas production volumes averaged 154,000 Boe,compared with 148,000 Boe for the year ended December 31, 2012. Our daily liquids production increasedby 5,000 Boe while our daily natural gas production increased by 4 MMcf, or less than 700 Boe. Theslight increase in our natural gas production reflected increased production from acquisitions made in2012 and associated natural gas produced from oil drilling, partially offset by lower gas production due toreduced investment in natural gas drilling in 2013.
The following table sets forth the average realized prices for our products:
2014 2013 2012
Oil Prices ($ per Bbl) $ 92.30 $ 104.16 $ 104.02NGLs Prices ($ per Bbl) $ 47.84 $ 50.43 $ 52.76Gas Prices ($ per Mcf) $ 4.39 $ 3.73 $ 2.94
52

The following table presents our average realized prices as a percentage of WTI, Brent and NYMEXfor each of the three years in the period ended December 31, 2014:
2014 2013 2012
WTI oil 99% 106% 110%Brent oil 93% 96% 93%NYMEX gas 101% 102% 105%
Balance Sheet Analysis
The changes in our balance sheet as of December 31, 2014 and 2013, are discussed below:
2014 2013
(in millions)Cash and cash equivalents $ 14 $ —Trade receivables, net $ 308 $ 30Inventories $ 71 $ 75Other current assets $ 308 $ 149Property, plant and equipment, net $ 11,685 $ 14,008Other assets $ 111 $ 35Accounts payable $ 588 $ 448Accrued liabilities $ 318 $ 241Long-term debt $ 6,360 $ —Deferred income taxes $ 2,055 $ 3,122Other long-term liabilities $ 565 $ 497Equity / Net investment $ 2,611 $ 9,989
See ‘‘Liquidity and Capital Resources’’ for discussion of changes in our cash and cash equivalents andlong-term debt.
The increase in trade receivables was largely the result of marketing our own products directly tothird parties, rather than through Occidental, beginning in mid-2014. The increase in other current assetsincluded additional California greenhouse gas emissions allowances, an increase in the current portion ofour deferred tax assets, increases in joint interest receivables and the fair value of the put optionpurchased in December 2014. The decrease in property, plant and equipment, net, reflected the$3.4 billion pre-tax impairment charge for proved and unproved properties and additional depreciation,depletion and amortization (‘‘DD&A’’) in 2014, partially offset by capital investments of approximately$2.1 billion. The increase in other assets reflected deferred debt costs incurred in 2014.
The increase in accounts payable reflected higher capital levels in the last quarter of 2014, comparedto 2013. The increase in accrued liabilities included unpaid interest attributable to our 2014 borrowings.The decrease in deferred income taxes reflected the impact of the impairment charges, partially offset byaccelerated tax depreciation of the capital investments in 2014. The increase in other long-term liabilitieswas mostly due to employee related liabilities. The decrease in equity / net investment reflected dividendsand distributions to Occidental prior to the Spin-off and our net loss for the year.
53

Statement of Operations Analysis
The following table presents the results of our operations, including the unusual and infrequent itemsdiscussed in the ‘‘Results’’ section above:
2014 2013 2012
(in millions)Oil and natural gas sales (including related parties) $ 4,023 $ 4,139 $ 3,967Other revenue 150 145 106Production costs (1,023) (960) (1,219)Selling, general and administrative expenses (336) (292) (273)Depreciation, depletion and amortization (1,198) (1,144) (926)Asset impairments (3,402) — (29)Taxes other than on income (217) (185) (167)Exploration expense (139) (116) (148)Interest and debt expense, net (72) — —Other expenses (207) (140) (130)Income tax (expense) / benefit 987 (578) (482)
Net income / (loss) $ (1,434) $ 869 $ 699
EBITDAX(1) $ 2,548 $ 2,733 $ 2,296Effective tax rate 41% 40% 41%
(1) We define EBITDAX consistent with our Credit Facilities as earnings before interest expense; income taxes; depreciation,depletion and amortization; exploration expense; and certain other non-cash items and unusual, infrequent charges. Ourmanagement believes EBITDAX provides useful information in assessing our financial condition, results of operations and cashflows and is widely used by the industry and investment community. The amounts included in the calculation of EBITDAX werecomputed in accordance with GAAP. This measure is a material component of one of our financial covenants under our CreditFacilities and is provided in addition to, and not as an alternative for, income and liquidity measures calculated in accordancewith GAAP. Certain items excluded from EBITDAX are significant components in understanding and assessing a company’sfinancial performance, such as a company’s cost of capital and tax structure, as well as the historic cost of depreciable anddepletable assets. EBITDAX should be read in conjunction with the information contained in our financial statements preparedin accordance with GAAP.
The following table presents a reconciliation of the non-GAAP financial measure of EBITDAX to the GAAP financial measure ofnet income (in millions):
2014 2013 2012
Net income / (loss) $ (1,434) $ 869 $ 699Interest expense 72 — —Income tax expense / (benefit) (987) 578 482Asset impairments 3,402 — 29Depreciation, depletion and amortization 1,198 1,144 926Exploration expense 139 116 148Other non-cash items 51 26 —Unusual and infrequent charges(a) 107 — 12
EBITDAX $ 2,548 $ 2,733 $ 2,296
(a) Includes rig terminations and other price-related costs, and Spin-off and transition related costs.
The following represents key metrics of our oil and gas operations, excluding certain corporate items,on a per BOE basis for the years ended December 31, 2014, 2013 and 2012:
2014 2013 2012
Production costs $ 17.64 $ 17.10 $ 22.58General and administrative expenses(a) $ 2.31 $ 2.35 $ 2.48Other operating expenses(b) $ 0.55 $ 0.60 $ 0.33Depreciation, depletion and amortization $ 20.40 $ 20.11 $ 16.82Taxes other than on income $ 3.50 $ 3.05 $ 3.09
(a) For 2014, the amount excludes unusual and infrequent costs of $0.10 per Boe related to Spin-off and transition relatedcosts.
(b) For 2014, the amount excludes unusual and infrequent costs related to rig termination charges and Spin-off and transitionrelated costs of $0.97 per Boe. For 2012, the amount excludes rig termination charges of $0.22 per Boe.
54

Year Ended December 31, 2014 vs. 2013
Oil and natural gas sales decreased 3%, or $116 million, in 2014, compared to 2013. Lower oil prices,which declined significantly in the second half of 2014, contributed $377 million to this decrease, lowernatural gas volumes contributed $71 million and lower NGL prices and volumes contributed $54 million.Partially offsetting these decreases were $318 million related to higher oil volumes and $61 million relatedto higher natural gas prices. Crude oil production increased by 9,000 Boe/d while our NGL and naturalgas production decreased by 1,000 Boe/d and 14 MMcf/d, or approximately 2,000 Boe/d, respectively. Thelower NGL and natural gas production reflects our planned shift in our capital toward higher margin oilprojects.
Other revenue in 2014, attributable to sales from our Elk Hills power plant, was consistent with 2013.
Production costs increased by 6%, or $63 million to $17.64 per Boe in 2014, compared to $17.10 perBoe in 2013. Of this increase, $32 million was due to higher volumes and $31 million due to higher costsfor natural gas used in our steamflood operations and higher energy costs and expenses for surfaceoperations and maintenance. In the fourth quarter we started an aggressive cost containment programand have seen costs start to decline in December.
Selling, general and administrative expenses increased 15%, or $44 million, in 2014 compared to 2013,mostly due to higher employee related costs and costs related to the Spin-off. They were, however,consistent with 2013 on a per barrel basis.
DD&A expense increased 5%, or $54 million, in 2014, compared to 2013. Of this increase, $22 millionwas attributable to higher volumes and $32 million resulted from a higher DD&A rate, due to additionalcapital investments.
At year end 2014, we performed impairment tests with respect to our proved and unprovedproperties as a result of significant declines in oil prices largely during the last half of 2014. As a result, inthe fourth quarter of 2014, we recorded pre-tax asset impairment charges of $3.4 billion on proved andunproved properties throughout our asset base. The impairment charge was related to certain propertiesin the San Joaquin and Los Angeles basins and a portion of our assets in the Ventura basin, as well asour gas properties in the Sacramento basin. Approximately $650 million of the charge was related tounproved acreage. The properties were impaired as a result of accounting rules that require us toevaluate our properties based on the year-end forward price curve, as well as projects we determined wewould not pursue in the foreseeable future given the current environment. We expect a substantialportion of these assets would ultimately become economical as prices recover to higher levels we view asmore sustainable.
Taxes other than on income increased 17%, or $32 million, in 2014 compared to 2013 reflectinghigher property taxes largely due to a refund received in 2013, which reduced that year’s property taxes.
Exploration expense increased 20%, or $23 million, in 2014 compared to 2013 mostly due to higherdry hole expenses in the San Joaquin basin, including $12 million of non-core charges.
Interest expense in 2014 was $72 million, due to our debt incurred in connection with the Spin-off ofapproximately $6.4 billion in the fourth quarter of 2014.
Other expenses increased 48%, or $67 million in 2014, compared to 2013, and included non-core rigtermination costs of $33 million and $35 million for Spin-off, transition and other related items.
Provision for income taxes showed a benefit of $987 million in 2014, reflecting the pre-tax loss ofapproximately $2.4 billion and a slight increase in the effective tax rate compared to 2013.
Year Ended December 31, 2013 vs. 2012
Oil and natural gas sales increased 4%, or $172 million, in 2013, compared to 2012. Of this increase,$47 million was attributable to higher oil and natural gas volumes, $77 million was attributable to higheroil and gas prices and $63 million was attributable to higher volumes for NGLs. The increase was partiallyoffset by $15 million attributable to lower prices for NGLs. Our daily liquids production increased by 5,000Boe while our daily natural gas production increased by 4 MMcf, or less than 700 Boe. The increase inliquids production primarily reflected our strategy to increase our overall capital investment program witha focus on oil drilling while reducing drilling capital for natural gas in light of higher oil prices and lowergas prices in recent years. The slight increase in our natural gas production reflected increased
55

production from acquisitions made in 2012 and associated natural gas produced from oil drilling, partiallyoffset by lower natural gas production due to reduced investment in natural gas drilling in 2013.
Other revenue increased 37%, or $39 million in 2013, compared to 2012, due to higher realized priceson third party power sales from our Elk Hills power plant.
Production costs decreased by $259 million to $17.10 per Boe in 2013, compared to $22.58 per Boefor 2012, almost entirely due to a wide range of operational efficiency initiatives implemented in late 2012,including activities such as high-grading and more efficient utilization of service rigs, improved jobscheduling, more efficient liquids usage and handling, optimization of field supervision and contractorusage, and reduced consumption of purchased fuel, power and field rental equipment.
Selling, general and administrative and other operating expenses increased 7%, or $19 million, in2013, compared to 2012, mostly due to higher compensation and employee related costs, in particularhigher headcount and equity compensation in part due to the higher price of Occidental’s stock.
DD&A expense increased by $218 million. Of this increase, $44 million was attributable to highervolumes and $174 million was attributable to a $3.29 per Boe increase in the DD&A rate, which was aresult of additional capital investments throughout our asset base. In recent years, we have beensystematically increasing our investments in IOR and EOR recovery assets and facilities. Significantinvestment on the front end of these projects is necessary, which has caused an increase in our DD&Arate.
Asset impairments of $29 million in 2012 reflected the write-down of uneconomic properties invarious areas, in particular natural gas properties.
Taxes other than on income increased 11%, or $18 million, in 2013, compared to 2012, primarily due toa $32 million increase in California greenhouse gas costs, which we began incurring at the beginning of2013, partially offset by lower property taxes of $14 million.
Exploration expense decreased 22%, or $32 million, in 2013, compared to 2012, due to higher successrates resulting in lower dry hole expense of $78 million in the San Joaquin and Los Angeles basins,partially offset by higher dry hole expense of $14 million in the Ventura basin and higher expense of$30 million for seismic, geological and geophysical and lease rentals.
Other expenses increased 8%, or $10 million in 2013, compared to 2012, primarily due to highernatural gas prices for purchased natural gas used at our Elk Hills power plant and higher rig idling costs.
Provision for income taxes increased by $96 million due to the effect of higher pre-tax income of$266 million, partially offset by a 1% lower effective tax rate.
Liquidity and Capital Resources
The primary source of liquidity and capital resources to fund our capital programs is cash flow fromoperations. Through November 2014, any excess cash generated by our business was distributed toOccidental, and our cash needs were provided by Occidental, in the form of a contribution. We expect ourneeds for capital investments and any potential acquisitions for at least the next twelve months will bemet by cash generated from operations, and borrowings when necessary. We may, however, considerother options, such as joint ventures and similar arrangements as we work to deleverage. At December 31,2014, we had more than $1.6 billion available on our revolving credit facilities, which has effectively beenreduced by $750 million under the first amendment to our credit facilities. Operating cash flows arelargely dependent on oil and gas prices and differentials, sales volumes and costs. If the currentconditions persist we expect our production levels will be affected as we will not look to accelerateproduction in this price environment.
Given the recent volatile and deteriorating oil price environment, as well as our leverage, we began ahedging program shortly after the Spin-off to protect our down-side price risk and preserve our ability toexecute our capital program. In December 2014, we purchased put options with a $50 per barrel Brentstrike price, measured as a monthly average. This initial program covers almost all of our oil productionfor the first six months of 2015. More recently, we put into place additional hedging instruments toprotect the pricing for almost two-thirds of our expected third quarter 2015 oil production. For thisprogram we chose a combination of Brent-based collars (between $55 and $72) for 30,000 barrels perday for July through September as well as put options at $50 per barrel Brent for 40,000 barrels perday in the same period. In addition, we sold a $75 per barrel call for 30,000 barrels per day of oilproduction in March through June of 2015. Going forward as an independent company, we will continue to
56
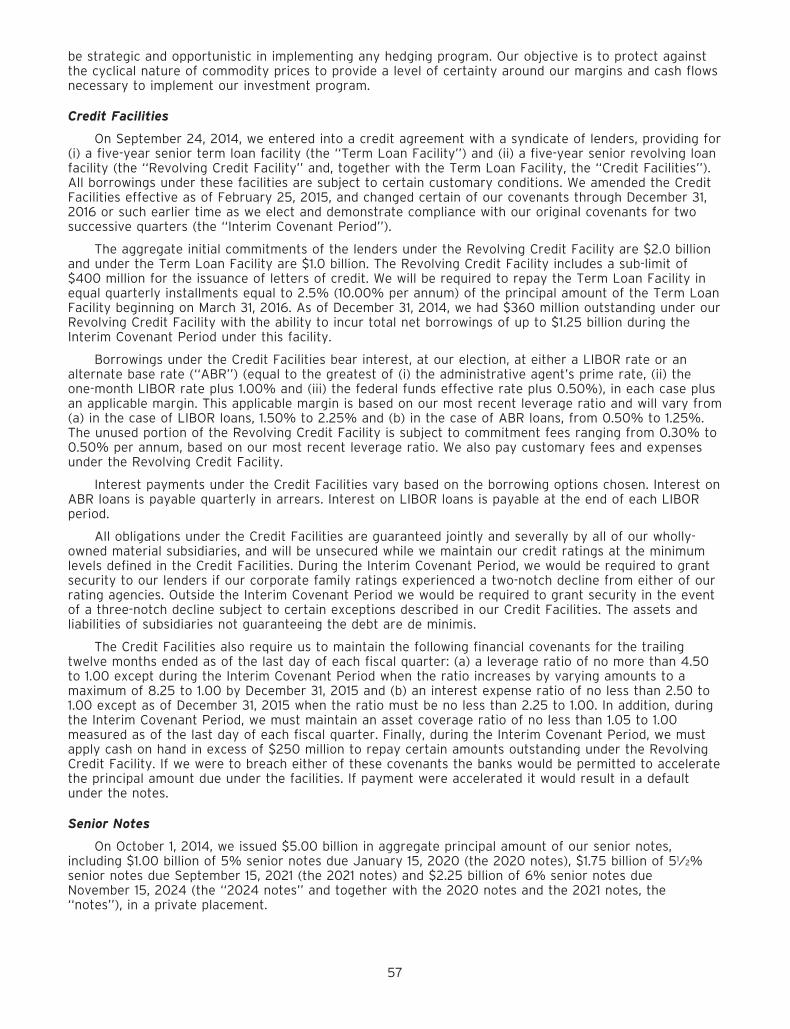
be strategic and opportunistic in implementing any hedging program. Our objective is to protect againstthe cyclical nature of commodity prices to provide a level of certainty around our margins and cash flowsnecessary to implement our investment program.
Credit Facilities
On September 24, 2014, we entered into a credit agreement with a syndicate of lenders, providing for(i) a five-year senior term loan facility (the ‘‘Term Loan Facility’’) and (ii) a five-year senior revolving loanfacility (the ‘‘Revolving Credit Facility’’ and, together with the Term Loan Facility, the ‘‘Credit Facilities’’).All borrowings under these facilities are subject to certain customary conditions. We amended the CreditFacilities effective as of February 25, 2015, and changed certain of our covenants through December 31,2016 or such earlier time as we elect and demonstrate compliance with our original covenants for twosuccessive quarters (the ‘‘Interim Covenant Period’’).
The aggregate initial commitments of the lenders under the Revolving Credit Facility are $2.0 billionand under the Term Loan Facility are $1.0 billion. The Revolving Credit Facility includes a sub-limit of$400 million for the issuance of letters of credit. We will be required to repay the Term Loan Facility inequal quarterly installments equal to 2.5% (10.00% per annum) of the principal amount of the Term LoanFacility beginning on March 31, 2016. As of December 31, 2014, we had $360 million outstanding under ourRevolving Credit Facility with the ability to incur total net borrowings of up to $1.25 billion during theInterim Covenant Period under this facility.
Borrowings under the Credit Facilities bear interest, at our election, at either a LIBOR rate or analternate base rate (‘‘ABR’’) (equal to the greatest of (i) the administrative agent’s prime rate, (ii) theone-month LIBOR rate plus 1.00% and (iii) the federal funds effective rate plus 0.50%), in each case plusan applicable margin. This applicable margin is based on our most recent leverage ratio and will vary from(a) in the case of LIBOR loans, 1.50% to 2.25% and (b) in the case of ABR loans, from 0.50% to 1.25%.The unused portion of the Revolving Credit Facility is subject to commitment fees ranging from 0.30% to0.50% per annum, based on our most recent leverage ratio. We also pay customary fees and expensesunder the Revolving Credit Facility.
Interest payments under the Credit Facilities vary based on the borrowing options chosen. Interest onABR loans is payable quarterly in arrears. Interest on LIBOR loans is payable at the end of each LIBORperiod.
All obligations under the Credit Facilities are guaranteed jointly and severally by all of our wholly-owned material subsidiaries, and will be unsecured while we maintain our credit ratings at the minimumlevels defined in the Credit Facilities. During the Interim Covenant Period, we would be required to grantsecurity to our lenders if our corporate family ratings experienced a two-notch decline from either of ourrating agencies. Outside the Interim Covenant Period we would be required to grant security in the eventof a three-notch decline subject to certain exceptions described in our Credit Facilities. The assets andliabilities of subsidiaries not guaranteeing the debt are de minimis.
The Credit Facilities also require us to maintain the following financial covenants for the trailingtwelve months ended as of the last day of each fiscal quarter: (a) a leverage ratio of no more than 4.50to 1.00 except during the Interim Covenant Period when the ratio increases by varying amounts to amaximum of 8.25 to 1.00 by December 31, 2015 and (b) an interest expense ratio of no less than 2.50 to1.00 except as of December 31, 2015 when the ratio must be no less than 2.25 to 1.00. In addition, duringthe Interim Covenant Period, we must maintain an asset coverage ratio of no less than 1.05 to 1.00measured as of the last day of each fiscal quarter. Finally, during the Interim Covenant Period, we mustapply cash on hand in excess of $250 million to repay certain amounts outstanding under the RevolvingCredit Facility. If we were to breach either of these covenants the banks would be permitted to acceleratethe principal amount due under the facilities. If payment were accelerated it would result in a defaultunder the notes.
Senior Notes
On October 1, 2014, we issued $5.00 billion in aggregate principal amount of our senior notes,including $1.00 billion of 5% senior notes due January 15, 2020 (the 2020 notes), $1.75 billion of 51⁄2%senior notes due September 15, 2021 (the 2021 notes) and $2.25 billion of 6% senior notes dueNovember 15, 2024 (the ‘‘2024 notes’’ and together with the 2020 notes and the 2021 notes, the‘‘notes’’), in a private placement.
57

We will pay interest on the 2020 notes semi-annually in cash in arrears on January 15 and July 15 ofeach year, beginning on July 15, 2015. We will pay interest on the 2021 notes semi-annually in cash inarrears on March 15 and September 15 of each year, beginning on March 15, 2015. We will pay interest onthe 2024 notes semi-annually in cash in arrears on May 15 and November 15 of each year, beginning onMay 15, 2015.
In connection with the private placement of the notes, we granted the initial purchasers certainregistration rights under a registration rights agreement. We expect to file a registration statement toregister the exchange of the notes in the near future.
The indenture governing the notes includes covenants that, among other things, limit our and ourrestricted subsidiaries’ ability to incur debt secured by liens. These covenants also restrict our ability tomerge or consolidate with, or transfer all or substantially all of our assets to, another entity. Thesecovenants are subject to a number of important qualifications and limitations that are set forth in theindenture. The covenants are not, however, directly linked to measures of our financial performance. Inaddition, if we experience a ‘‘change of control triggering event’’ (as defined in the indenture) withrespect to a series of notes, we will be required, unless we have exercised our right to redeem the notesof such series, to offer to purchase the notes of such series at a purchase price equal to 101 percent oftheir principal amount, plus accrued and unpaid interest.
Spin-off Related Distributions to Occidental
We used the net proceeds from the private placement of our notes to make a $4.95 billion cashdistribution to Occidental in October 2014. See ‘‘—Senior Notes’’ for more details regarding the terms ofour senior notes. On November 25, 2014, we borrowed $1.0 billion under our Term Loan Facility and$50 million under a Revolving Credit Facility to make a $1.05 billion cash distribution to Occidental onNovember 26, 2014.
Cash Flow Analysis
2014 2013 2012
(in millions)Net cash flows provided by operating activities $ 2,371 $ 2,476 $ 2,223Net cash flows used in investing activities $ (2,312) $ (1,713) $ (2,755)Net cash flows (used in) provided by financing activities $ (45) $ (763) $ 532EBITDAX(1) $ 2,548 $ 2,733 $ 2,296
(1) We define EBITDAX consistent with our Credit Facilities as earnings before interest expense; income taxes; depreciation,depletion and amortization; exploration expense; and certain other non-cash items and unusual, infrequent charges. Ourmanagement believes EBITDAX provides useful information in assessing our financial condition, results of operations and cashflows and is widely used by the industry and investment community. The amounts included in the calculation of EBITDAX werecomputed in accordance with GAAP. This measure is a material component of one of our financial covenants under our CreditFacilities and is provided in addition to, and not as an alternative for, income and liquidity measures calculated in accordancewith GAAP. Certain items excluded from EBITDAX are significant components in understanding and assessing a company’sfinancial performance, such as a company’s cost of capital and tax structure, as well as the historic cost of depreciable anddepletable assets. EBITDAX should be read in conjunction with the information contained in our financial statements preparedin accordance with GAAP.
The following table sets forth a reconciliation of the non-GAAP financial measure of EBITDAX to the GAAP measure of net cashprovided by operating activities:
2014 2013 2012
(in millions)Net cash provided by operating activities $ 2,371 $ 2,476 $ 2,223Interest expense 72 — —Current income taxes 165 318 (121)Cash exploration expenses 38 44 20Changes in operating assets and liabilities (143) (103) 202Other, net 45 (2) (28)
EBITDAX $ 2,548 $ 2,733 $ 2,296
58
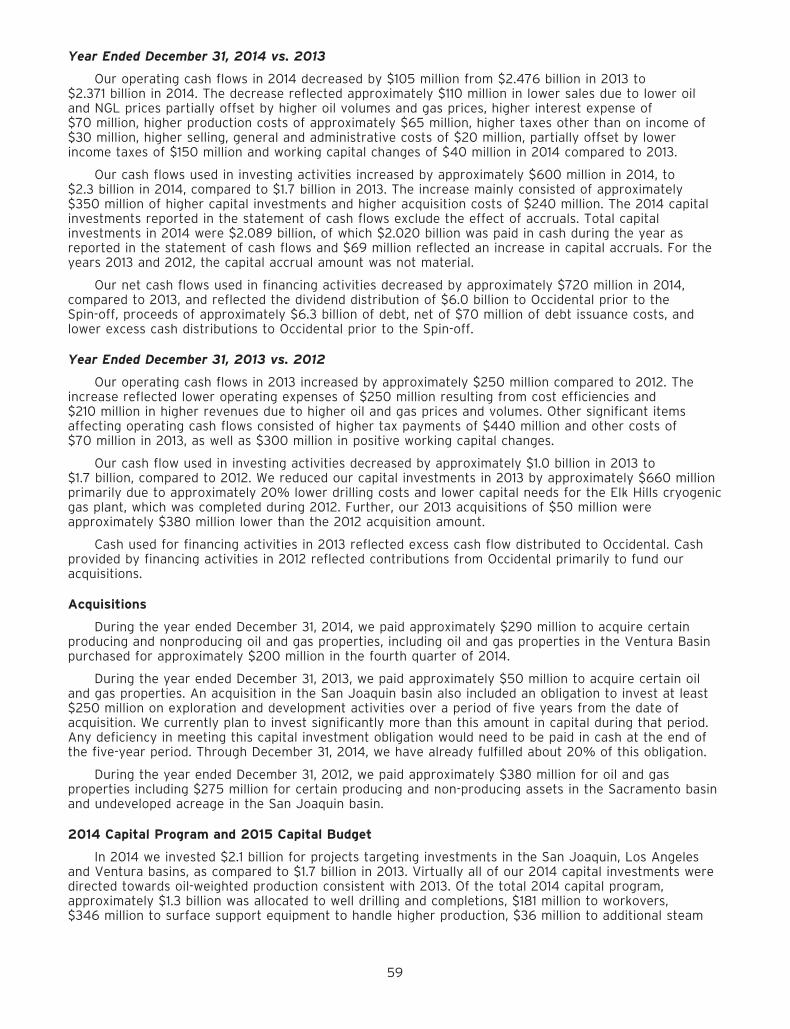
Year Ended December 31, 2014 vs. 2013
Our operating cash flows in 2014 decreased by $105 million from $2.476 billion in 2013 to$2.371 billion in 2014. The decrease reflected approximately $110 million in lower sales due to lower oiland NGL prices partially offset by higher oil volumes and gas prices, higher interest expense of$70 million, higher production costs of approximately $65 million, higher taxes other than on income of$30 million, higher selling, general and administrative costs of $20 million, partially offset by lowerincome taxes of $150 million and working capital changes of $40 million in 2014 compared to 2013.
Our cash flows used in investing activities increased by approximately $600 million in 2014, to$2.3 billion in 2014, compared to $1.7 billion in 2013. The increase mainly consisted of approximately$350 million of higher capital investments and higher acquisition costs of $240 million. The 2014 capitalinvestments reported in the statement of cash flows exclude the effect of accruals. Total capitalinvestments in 2014 were $2.089 billion, of which $2.020 billion was paid in cash during the year asreported in the statement of cash flows and $69 million reflected an increase in capital accruals. For theyears 2013 and 2012, the capital accrual amount was not material.
Our net cash flows used in financing activities decreased by approximately $720 million in 2014,compared to 2013, and reflected the dividend distribution of $6.0 billion to Occidental prior to theSpin-off, proceeds of approximately $6.3 billion of debt, net of $70 million of debt issuance costs, andlower excess cash distributions to Occidental prior to the Spin-off.
Year Ended December 31, 2013 vs. 2012
Our operating cash flows in 2013 increased by approximately $250 million compared to 2012. Theincrease reflected lower operating expenses of $250 million resulting from cost efficiencies and$210 million in higher revenues due to higher oil and gas prices and volumes. Other significant itemsaffecting operating cash flows consisted of higher tax payments of $440 million and other costs of$70 million in 2013, as well as $300 million in positive working capital changes.
Our cash flow used in investing activities decreased by approximately $1.0 billion in 2013 to$1.7 billion, compared to 2012. We reduced our capital investments in 2013 by approximately $660 millionprimarily due to approximately 20% lower drilling costs and lower capital needs for the Elk Hills cryogenicgas plant, which was completed during 2012. Further, our 2013 acquisitions of $50 million wereapproximately $380 million lower than the 2012 acquisition amount.
Cash used for financing activities in 2013 reflected excess cash flow distributed to Occidental. Cashprovided by financing activities in 2012 reflected contributions from Occidental primarily to fund ouracquisitions.
Acquisitions
During the year ended December 31, 2014, we paid approximately $290 million to acquire certainproducing and nonproducing oil and gas properties, including oil and gas properties in the Ventura Basinpurchased for approximately $200 million in the fourth quarter of 2014.
During the year ended December 31, 2013, we paid approximately $50 million to acquire certain oiland gas properties. An acquisition in the San Joaquin basin also included an obligation to invest at least$250 million on exploration and development activities over a period of five years from the date ofacquisition. We currently plan to invest significantly more than this amount in capital during that period.Any deficiency in meeting this capital investment obligation would need to be paid in cash at the end ofthe five-year period. Through December 31, 2014, we have already fulfilled about 20% of this obligation.
During the year ended December 31, 2012, we paid approximately $380 million for oil and gasproperties including $275 million for certain producing and non-producing assets in the Sacramento basinand undeveloped acreage in the San Joaquin basin.
2014 Capital Program and 2015 Capital Budget
In 2014 we invested $2.1 billion for projects targeting investments in the San Joaquin, Los Angelesand Ventura basins, as compared to $1.7 billion in 2013. Virtually all of our 2014 capital investments weredirected towards oil-weighted production consistent with 2013. Of the total 2014 capital program,approximately $1.3 billion was allocated to well drilling and completions, $181 million to workovers,$346 million to surface support equipment to handle higher production, $36 million to additional steam
59

generation capacity expansion, $100 million to exploration and the rest to maintenance capital, health,safety and environmental projects and other items.
The table below sets forth our 2014 capital investments for the year ended December 31, 2014 (inmillions):
TotalConventional Unconventional CapitalPrimary Waterflood Steamflood Total Primary Other Investments
Basin:San Joaquin $ 280 $ 129 $ 381 $ 790 $ 604 $ — $ 1,394Los Angeles 3 466 — 469 — — 469Ventura 82 13 8 103 1 — 104Sacramento 14 — — 14 1 — 15
Basin Total 379 608 389 1,376 606 — 1,982
Exploration and Other — — — — — 107 107
Total $ 379 $ 608 $ 389 $ 1,376 $ 606 $ 107 $ 2,089
We have a 2015 capital investment budget of $440 million for projects targeting investments in theSan Joaquin, Los Angeles and Ventura basins, as compared to $2.1 billion invested in 2014. We expectvirtually all of our 2015 capital budget to be directed towards oil-weighted production consistent with2014. Of the total 2015 capital budget, approximately $150 million is allocated to drilling wells, $50 millionto workovers, $130 million to additional steam-generation capacity and compression expansion, $15 millionto exploration and the rest to 3D seismic, maintenance capital, health, safety and environmental projectsand other items.
Off-Balance-Sheet Arrangements
We have no material off-balance-sheet arrangements other than those noted below.
Leases
We, or certain of our subsidiaries, have entered into various operating lease agreements, mainly forfield equipment, office space and office equipment. We lease assets when leasing offers greater operatingflexibility. Lease payments are generally expensed as part of production costs or selling, general andadministrative expenses. For more information, see ‘‘Contractual Obligations.’’
Contractual Obligations
The table below summarizes and cross-references our contractual obligations as of December 31,2014. This summary indicates on- and off-balance-sheet obligations as of December 31, 2014.
Payments Due by Year
2016 and 2018 and 2020 andTotal 2015 2017 2019 thereafter
(in millions)On-Balance SheetLong-term debt (Note 5)(a) $ 6,360 $ — $ 200 $ 1,160 $ 5,000Other long-term liabilities(b) 147 6 19 16 106Off-Balance SheetOperating leases 125 13 28 26 58Purchase obligations(c) 364 70 79 204 11
Total $ 6,996 $ 89 $ 326 $ 1,406 $ 5,175
(a) Excludes interest on the debt. As of December 31, 2014, interest on long-term debt totaling $2.4 billion is payable in thefollowing years (in millions): 2015—$312, 2016 and 2017—$620, 2018 and 2019—$608, 2020 and thereafter—$825. Thecalculation of interest payable on the variable interest debt assumes the interest rate at December 31, 2014 to be theapplicable interest rate for the entire term. In performing the calculation, the Revolving Credit Facility borrowingsoutstanding at December 31, 2014 of $360 million were assumed to be outstanding for the entire term of the agreement.
(b) Includes obligations under postretirement benefit and deferred compensation plans, as well as certain accrued liabilities.(c) Amounts include payments, which will become due under long-term agreements to purchase goods and services used in
the normal course of business to secure pipeline capacity, drilling rigs and services. These amounts were significantlyreduced as a result of rig contract terminations in 2014. Long-term purchase contracts are discounted using a discountrate of approximately 5%.
60

Lawsuits, Claims, Contingencies and Commitments
We, or certain of our subsidiaries, are involved, in the normal course of business, in lawsuits,environmental and other claims and other contingencies that seek, among other things, compensation foralleged personal injury, breach of contract, property damage or other losses, punitive damages, civilpenalties, or injunctive or declaratory relief. We accrue reserves for currently outstanding lawsuits, claimsand proceedings when it is probable that a liability has been incurred and the liability can be reasonablyestimated. Reserve balances at December 31, 2014 and 2013 were not material to our balance sheets as ofsuch dates. We also evaluate the amount of reasonably possible losses that we could incur as a result ofthese matters. We believe that reasonably possible losses that we could incur in excess of reservesaccrued on our balance sheet would not be material to our consolidated financial position or results ofoperations.
We, our subsidiaries, or both, have indemnified various parties against specific liabilities those partiesmight incur in the future in connection with the Spin-off, purchases and other transactions that they haveentered into with us. These indemnities include indemnities made to Occidental against certain tax-relatedliabilities that may be incurred by Occidental relating to the Spin-off and liabilities related to operation ofour business while it was still owned by Occidental. As of December 31, 2014, we are not aware ofcircumstances that we believe would reasonably be expected to lead to indemnity claims that would resultin payments materially in excess of reserves.
Critical Accounting Policies and Estimates
The process of preparing financial statements in accordance with generally accepted accountingprinciples requires management to select appropriate accounting policies and to make informed estimatesand judgments regarding certain items and transactions. Changes in facts and circumstances or discoveryof new information may result in revised estimates and judgments, and actual results may differ fromthese estimates upon settlement. We consider the following to be our most critical accounting policiesand estimates that involve management’s judgment and that could result in a material impact on thefinancial statements due to the levels of subjectivity and judgment.
Oil and Gas Properties
The carrying value of our property, plant and equipment (‘‘PP&E’’) represents the cost incurred toacquire or develop the asset, including any asset retirement obligations, net of accumulated DD&A andany impairment charges. For assets acquired, initial PP&E cost is based on fair values at the acquisitiondate.
We use the successful efforts method to account for our oil and gas properties. Under this method,we capitalize costs of acquiring properties, costs of drilling successful exploration wells and developmentcosts. The costs of exploratory wells are initially capitalized pending a determination of whether we findproved reserves. If we find proved reserves, the costs of exploratory wells remain capitalized. Otherwise,we charge the costs of the related wells to expense. In some cases, we cannot determine whether wehave found proved reserves at the completion of exploration drilling, and must conduct additional testingand evaluation of the wells. We generally expense the costs of such exploratory wells if we do notdetermine we have found proved reserves within a 12-month period after drilling is complete.
We determine depreciation and depletion of oil and gas producing properties by theunit-of-production method. We amortize acquisition costs over total proved reserves and capitalizeddevelopment and successful exploration costs over proved developed reserves.
Proved oil and gas reserves and production volumes are used as the basis for recording depreciationand depletion of oil and gas producing properties. Proved reserves are those quantities of oil and gaswhich, by analysis of geoscience and engineering data, can be estimated with reasonable certainty to beeconomically producible—from a given date forward, from known reservoirs, and under existing economicconditions, operating methods, and government regulations—regardless of whether deterministic orprobabilistic methods are used for the estimation. We have no proved oil and gas reserves for which thedetermination of economic producibility is subject to the completion of major additional capitalinvestments.
Several factors could change our proved oil and gas reserves. For example, we receive a share ofproduction from arrangements similar to production-sharing contracts to recover costs and generally anadditional share for profit. Our share of production and reserves from these contracts decreases when
61
product prices rise and increases when prices decline. Overall, our net economic benefit from thesecontracts is greater at higher product prices. In other cases, particularly with long-lived properties, lowerproduct prices may lead to a situation where production of a portion of proved reserves becomesuneconomical. For such properties, higher product prices typically result in additional reserves becomingeconomical. Estimation of future production and development costs is also subject to change partially dueto factors beyond our control, such as energy costs and inflation or deflation of oil field service costs.These factors, in turn, could lead to changes in the quantity of proved reserves. Additional factors thatcould result in a change of proved reserves include production decline rates and operating performancediffering from those estimated when the proved reserves were initially recorded.
Additionally, we perform impairment tests with respect to our proved properties when product pricesdecline other than temporarily, reserve estimates change significantly, other significant events occur ormanagement’s plans change with respect to these properties in a manner that may impact our ability torealize the recorded asset amounts. Impairment tests incorporate a number of assumptions involvingexpectations of undiscounted future cash flows, which can change significantly over time. Theseassumptions include estimates of future product prices, which we base on forward price curves and, whenapplicable, contractual prices, estimates of oil and gas reserves and estimates of future expectedoperating and development costs.
The most significant ongoing financial statement effect from a change in our oil and gas reserves orimpairment of the carrying value of our proved properties would be to the DD&A rate. For example, a 5%increase or decrease in the amount of oil and gas reserves would change the DD&A rate by approximately$1.00 per Bbl, which would increase or decrease pre-tax income by approximately $60 million annuallybased on production rates for the year ended December 31, 2014.
A portion of the carrying value of our oil and gas properties is attributable to unproved properties. AtDecember 31, 2014, the net capitalized costs attributable to unproved properties were approximately$300 million. While exploration and development work progresses, the unproved amounts are not subjectto DD&A until they are classified as proved properties. However, if the exploration and development workwere to be unsuccessful, or management decided not to pursue development of these properties as aresult of lower commodity prices, higher development and operating costs, contractual conditions orother factors, the capitalized costs of the related properties would be expensed. The timing of any write-downs of these unproved properties, if warranted, depends upon management’s plans, the nature, timingand extent of future exploration and development activities and their results. We believe our currentplans and exploration and development efforts will allow us to realize the unproved property balance.
At year end 2014, we performed impairment tests with respect to our proved and unprovedproperties as a result of significant declines in oil prices largely during the last half of 2014. As a result, inthe fourth quarter of 2014, we recorded pre-tax asset impairment charges of $3.4 billion on proved andunproved properties throughout our asset base. The impairment charge was related to certain propertiesin the San Joaquin and Los Angeles basins and a portion of our assets in the Ventura basin, as well asour natural gas properties in the Sacramento basin. Approximately $650 million of the charge was relatedto unproved acreage. The properties were impaired as a result of accounting rules that require us toevaluate our properties based on the year-end forward price curve, as well as projects we determined wewould not pursue in the foreseeable future given the current environment. We expect a substantialportion of these assets would ultimately become economical as prices recover to higher levels we view asmore sustainable.
Fair Value Measurements
We have categorized our assets and liabilities that are measured at fair value in a three-level fairvalue hierarchy, based on the inputs to the valuation techniques: Level 1—using quoted prices in activemarkets for the assets or liabilities; Level 2—using observable inputs other than quoted prices for theassets or liabilities; and Level 3—using unobservable inputs. Transfers between levels, if any, arerecognized at the end of each reporting period. We primarily apply the market approach for recurring fairvalue measurement, maximize our use of observable inputs and minimize use of unobservable inputs. Wegenerally use an income approach to measure fair value when observable inputs are unavailable. Thisapproach utilizes management’s judgments regarding expectations of projected cash flows and discountsthose cash flows using a risk-adjusted discount rate.
The most significant items on our balance sheet that would be affected by recurring fair valuemeasurements are derivatives. Based on year end 2014 amounts on the balance sheet for derivatives, a10% increase or decrease in their fair value would affect income by $2.4 million.
62

Other Loss Contingencies
In the normal course of business, we are involved in lawsuits, claims and other environmental andlegal proceedings and audits. We accrue reserves for these matters when it is probable that a liability hasbeen incurred and the liability can be reasonably estimated. In addition, we disclose, if material, inaggregate, our exposure to loss in excess of the amount recorded on the balance sheet for these mattersif it is reasonably possible that an additional material loss may be incurred. We review our losscontingencies on an ongoing basis.
Loss contingencies are based on judgments made by management with respect to the likely outcomeof these matters and are adjusted as appropriate. Management’s judgments could change based on newinformation, changes in, or interpretations of, laws or regulations, changes in management’s plans orintentions, opinions regarding the outcome of legal proceedings, or other factors. See ‘‘—Lawsuits, Claims,Contingencies and Commitments’’ for additional information.
Significant Accounting and Disclosure Changes
In August 2014, the Financial Accounting Standards Board (‘‘FASB’’) issued rules relating tomanagement’s responsibility to evaluate and make disclosures, if applicable, regarding the entity’s abilityto continue as a going concern within one year after the date that the financial statements are issued.These rules are effective for annual periods ending after December 15, 2016. They are not expected tohave a material impact on our financial statements upon adoption and will require assessment on anongoing basis.
In June 2014, the FASB issued rules for employee share-based payment awards in which the terms ofthe awards provide that a performance target can be achieved after the requisite service period. Aperformance target that affects vesting and that could be achieved after the requisite service period willbe treated as a performance condition. These rules are effective for annual periods beginning on or afterDecember 15, 2015 and are not expected to have a material impact on our financial statements uponadoption but will require assessment on an ongoing basis.
In May 2014, the FASB issued rules related to revenue recognition. Under the new rules, an entity willrecognize revenue when it transfers promised goods or services to customers in an amount that reflectswhat it expects to receive in exchange for the goods or services. The rules will also require more detaileddisclosures of the nature, amount, timing and uncertainty of revenue and cash flows arising fromcontracts with customers. The rules are effective for interim and annual periods beginning afterDecember 15, 2016 and early application is not permitted. While we are evaluating any potential impact ofthese new rules, we currently believe the effect of the new rules will not have a material impact on ourfinancial statements.
In April 2014, the FASB issued rules changing the requirements for reporting discontinued operationssuch that only the disposals of components of an entity that represent a strategic shift that has (or willhave) a major effect on an entity’s operations and financial results will be reported as discontinuedoperations in the financial statements. These rules are effective for the annual periods beginning on orafter December 15, 2014. They are not expected to have a material impact on our financial statementsupon adoption and will require assessment on an ongoing basis.
ITEM 7A QUANTITATIVE AND QUALITATIVE DISCLOSURES ABOUT MARKET RISK
Commodity Price Risk
General
Our results are sensitive to fluctuations in oil, NGL and gas prices. Price changes at current levels ofproduction affect our pre-tax annual income by approximately $32 million for a $1 per Bbl change in Brentoil prices and $4 million for a $1 per Bbl change in NGL prices. If natural gas prices varied by $0.50 perMcf, it would have an estimated annual effect on our pre-tax income of approximately $20 million. Theseprice-change sensitivities include the impact on income of volume changes under arrangements similar toproduction-sharing contracts. If production levels change in the future, the sensitivity of our results toprices also will change.
63

Derivatives
In February 2015, we put into place hedging instruments to protect the pricing for almost two-thirdsof our expected third quarter 2015 oil production. For this program we chose a combination of Brent-based collars (between $55 and $72) for 30,000 barrels per day for July through September as well asput options at $50 per barrel Brent for 40,000 barrels per day in the same period. In addition, we sold a$75 per barrel call for 30,000 barrels per day of oil production in March through June of 2015. Goingforward as an independent company, we will continue to be strategic and opportunistic in implementingany hedging program. Our objective is to protect against the cyclical nature of commodity prices toprovide a level of certainty around our margins and cash flows necessary to implement our investmentprogram.
In December 2014, we purchased put options to hedge the risk associated with declining oil prices for100,000 barrels of crude oil production per day, effective on a monthly basis from January 1, 2015through June 30, 2015. The strike price of the put option is $50 per barrel and is tied to the Brent oilindex. Changes in the intrinsic value of the put option are deferred in other comprehensive income/(loss)as a cash flow hedge until the hedged transactions are recognized in the statement of operations.Changes in the time value of the put option are marked to market through the statement of operations.The time value of the put option was valued using Level 2 inputs in the fair value hierarchy and wasvalued at approximately $24 million in other current assets, as of December 31, 2014, which approximatedthe value of the instrument and the amount we paid the counterparty at the time the option wasacquired.
In November 2012, we entered into financial swap agreements for the sale of 50 MMcf/d of ournatural gas production beginning in January 2013 through March 2014. These agreements qualified ascash-flow hedges and represented approximately 5% of our 2013 total production on a Boe basis. Theweighted-average strike price of these swaps was $4.30.
Credit Risk
Our credit risk relates primarily to trade receivables and derivative financial instruments. Creditexposure for each customer is monitored for outstanding balances and current activity. For the derivativeoptions entered into December 2014, we are subject to counterparty credit risk to the extent thecounterparty to this derivative is unable to meet its settlement commitments. We actively manage thiscredit risk by selecting counterparties that we believe to be financially strong and continuing to monitortheir financial health.
As of December 31, 2014, the substantial majority of the credit exposures related to our business waswith investment grade counterparties. We believe exposure to credit-related losses related to our businessat December 31, 2014 was not material and losses associated with credit risk have been insignificant forall years presented.
Concentration of Credit Risk
Through July 2014, substantially all of our products were sold through Occidental’s marketingsubsidiaries at market prices and were settled at the time of sale to those entities. Beginning August2014, we began marketing our own products directly to third parties. For the years ended December 31,2014, 2013 and 2012, sales through Occidental subsidiaries accounted for approximately 65%, 97% and97% of our net sales, respectively. For the years ended December 31, 2014, 2013 and 2012,ConocoPhillips/Phillips 66 Company and Tesoro Refining & Marketing Company LLC each accounted formore than 10% of our net sales. Collectively, they accounted for 45%, 42% and 46% in each of thoseyears, respectively. No other customer accounted for more than 10% of our net sales during theseperiods.
Interest Rate Risk
Historically, we had no interest rate risk exposure as we did not have debt balances. In November2014, we made initial borrowings on our variable-rate Credit Facilities. As of December 31, 2014, we hadborrowings of $1.0 billion outstanding under our Term Loan Facility and approximately $360 millionoutstanding under our Revolving Credit Facility. A one-eighth percent change in the variable interest rateson these outstanding borrowings under our Term Loan Facility and Revolving Credit Facility would resultin an approximately $1.7 million change in annual interest expense.
64

The following table shows our fixed- and variable-rate debt as of December 31, 2014:
U.S. Dollar U.S. DollarFixed-Rate Variable-Rate
Year of Maturity Debt Debt Total
(amounts in millions)2015 $ — $ — $ —2016 — 100 1002017 — 100 1002018 — 100 1002019 — 1,060 1,060Thereafter 5,000 — 5,000
Total $ 5,000 $ 1,360 $ 6,360
Weighted-average interest rate 5.63% 2.24% 4.9%
Fair Value $ 4,285 $ 1,360 $ 5,645
FORWARD-LOOKING STATEMENTS
The information in this document includes ‘‘forward-looking statements.’’ The factors identified in thiscautionary statement are important factors (but not necessarily all of the important factors) that couldcause actual results to differ materially from those expressed in any forward-looking statement made byus, or on our behalf. You can typically identify ‘‘forward-looking statements’’ by the use of forward-looking words such as ‘‘aim,’’ ‘‘anticipate,’’ ‘‘believe,’’ ‘‘budget,’’ ‘‘continue,’’ ‘‘could,’’ ‘‘effort,’’ ‘‘estimate,’’‘‘expect,’’ ‘‘forecast,’’ ‘‘goal,’’ ‘‘guidance,’’ ‘‘intend,’’ ‘‘likely,’’ ‘‘may,’’ ‘‘might,’’ ‘‘objective,’’ ‘‘outlook,’’ ‘‘plan,’’‘‘potential,’’ ‘‘predict,’’ ‘‘project,’’ ‘‘seek,’’ ‘‘should,’’ ‘‘target, ‘‘will’’ or ‘‘would’’ and other similar words.Such statements may include statements regarding our future financial position, budgets, capitalinvestments, projected production growth, projected costs, plans and objectives of management for futureoperations and possible future strategic transactions. For any such forward-looking statement thatincludes a statement of the assumptions or bases underlying such forward-looking statement, we cautionthat, while we believe such assumptions or bases to be reasonable and make them in good faith, assumedfacts or bases almost always vary from actual results. The differences between assumed facts or basesand actual results can be material, depending upon the circumstances. When considering forward-lookingstatements, you should keep in mind the risk factors and other cautionary statements described underthe heading ‘‘Risk Factors’’ included in this report.
Any forward-looking statement in which we, or our management, express an expectation or belief asto future results, is made in good faith and believed to have a reasonable basis. However, there can be noassurance that the statement of expectation or belief will result or be achieved or accomplished. Takingthis into account, the following are identified as important factors that could cause actual results to differmaterially from those expressed in any forward-looking statement made by, or on behalf of, our company:
• commodity pricing;• vulnerability to economic downturns and adverse developments in our business due to our debt;• insufficiency of our operating cash flow to fund planned capital investments;• inability to implement our capital investment program profitably or at all;• compliance with regulations or changes in regulations and the ability to obtain government
permits and approvals;• uncertainties associated with drilling for and producing oil and natural gas;• tax law changes;• competition for oilfield equipment, services, qualified personnel and acquisitions;• the subjective nature of estimates of proved reserves and related future net cash flows;• concentration of operations in a single geographic area;• restrictions on our ability to obtain, use, manage or dispose of water;• inability to drill identified locations when planned or at all;• concerns about climate change and other air quality issues;• risks related to our acquisition activities;• catastrophic events for which we may be uninsured or underinsured;• cyber attacks;• operational issues that restrict market access; and• uncertainties related to the Spin-off, the agreements related thereto and the anticipated effects
of restructuring or reorganizing our business.
65

Readers are cautioned not to place undue reliance on forward-looking statements, which speak onlyas of the date hereof. Unless legally required, we undertake no responsibility to publicly release the resultof any revision of our forward-looking statements after the date they are made.
Should one or more of the risks or uncertainties described in this report occur, or should underlyingassumptions prove incorrect, our actual results and plans could differ materially from those expressed inany forward-looking statements.
All forward-looking statements, expressed or implied, included in this report are expressly qualified intheir entirety by this cautionary statement. This cautionary statement should also be considered inconnection with any subsequent written or oral forward-looking statements that we or persons acting onour behalf may issue.
66

ITEM 8 FINANCIAL STATEMENTS AND SUPPLEMENTARY DATA
Report of Independent Registered Public Accounting Firm on Consolidated and Combined FinancialStatements
To the Board of Directors and StockholdersCalifornia Resources Corporation:
We have audited the accompanying consolidated and combined balance sheets of CaliforniaResources Corporation and subsidiaries (the ‘‘Company’’) as of December 31, 2014 and 2013, and therelated consolidated and combined statements of operations, comprehensive income, equity and cashflows for each of the years in the three-year period ended December 31, 2014. These consolidated andcombined financial statements are the responsibility of the Company’s management. Our responsibility isto express an opinion on these consolidated and combined financial statements based on our audits.
We conducted our audits in accordance with the standards of the Public Company AccountingOversight Board (United States). Those standards require that we plan and perform the audit to obtainreasonable assurance about whether the financial statements are free of material misstatement. An auditincludes examining, on a test basis, evidence supporting the amounts and disclosures in the financialstatements. An audit also includes assessing the accounting principles used and significant estimatesmade by management, as well as evaluating the overall financial statement presentation. We believe thatour audits provide a reasonable basis for our opinion.
In our opinion, the consolidated and combined financial statements referred to above present fairly,in all material respects, the financial position of California Resources Corporation and subsidiaries as ofDecember 31, 2014 and 2013, and the results of their operations and their cash flows for each of the yearsin the three-year period ended December 31, 2014 in conformity with U.S. generally accepted accountingprinciples.
/s/ KPMG LLP
Los Angeles, CaliforniaFebruary 26, 2015
67

CALIFORNIA RESOURCES CORPORATION AND SUBSIDIARIESConsolidated and Combined Balance Sheets
As of December 31, 2014 and 2013(in millions)
2014 2013
CURRENT ASSETSCash and cash equivalents $ 14 $ —Trade receivables, net 308 30Inventories 71 75Other current assets 308 149
Total current assets 701 254
PROPERTY, PLANT AND EQUIPMENT 20,536 20,972Accumulated depreciation, depletion and amortization (8,851) (6,964)
11,685 14,008
OTHER ASSETS 111 35
TOTAL ASSETS $ 12,497 $ 14,297
CURRENT LIABILITIESAccounts payable $ 588 $ 448Accrued liabilities 318 241
Total current liabilities 906 689
LONG-TERM DEBT 6,360 —
DEFERRED INCOME TAXES 2,055 3,122
OTHER LONG-TERM LIABILITIES 565 497
COMMITMENTS AND CONTINGENCIES
EQUITYPreferred stock—no shares outstanding at December 31, 2014 or 2013
(200 million shares authorized at $0.01 par value)Common stock (2.0 billion shares authorized at $0.01 par value) Outstanding
shares (2014—385,639,582 shares and 2013—0 shares) 4 —Additional paid-in capital 4,748 —Accumulated deficit (2,117) —Net parent company investment — 10,013Accumulated other comprehensive income (loss) (24) (24)
Total Equity / Net Investment 2,611 9,989
TOTAL LIABILITIES AND EQUITY $ 12,497 $ 14,297
The accompanying notes are an integral part of these consolidated and combined financial statements.
68

CALIFORNIA RESOURCES CORPORATION AND SUBSIDIARIESConsolidated and Combined Statements of Operations
For the years ended December 31, 2014, 2013 and 2012(in millions)
2014 2013 2012
REVENUESOil and natural gas sales to related parties $ 2,617 $ 4,054 $ 3,878Oil and natural gas sales to third parties 1,406 85 89Other revenue 150 145 106
4,173 4,284 4,073
COSTS AND OTHER DEDUCTIONSProduction costs 1,023 960 1,219Selling, general and administrative expenses 336 292 273Depreciation, depletion and amortization 1,198 1,144 926Asset impairments 3,402 — 29Taxes other than on income 217 185 167Exploration expense 139 116 148Interest and debt expense, net 72 — —Other expenses 207 140 130
6,594 2,837 2,892
INCOME / (LOSS) BEFORE INCOME TAXES (2,421) 1,447 1,181Income tax (expense) / benefit 987 (578) (482)
NET INCOME / (LOSS) $ (1,434) $ 869 $ 699
Net income / (loss) per share of common stockBasic $ (3.75) $ 2.24 $ 1.80Diluted $ (3.75) $ 2.24 $ 1.80
The accompanying notes are an integral part of these consolidated and combined financial statements.
69
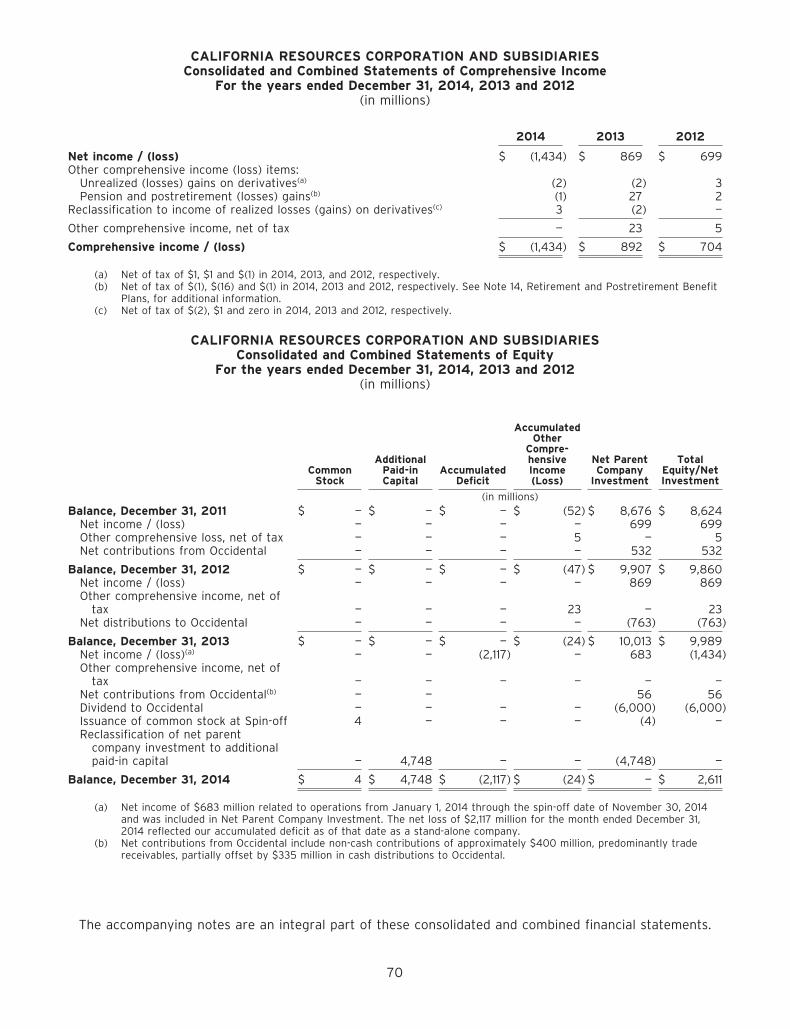
CALIFORNIA RESOURCES CORPORATION AND SUBSIDIARIESConsolidated and Combined Statements of Comprehensive Income
For the years ended December 31, 2014, 2013 and 2012(in millions)
2014 2013 2012
Net income / (loss) $ (1,434) $ 869 $ 699Other comprehensive income (loss) items:
Unrealized (losses) gains on derivatives(a) (2) (2) 3Pension and postretirement (losses) gains(b) (1) 27 2
Reclassification to income of realized losses (gains) on derivatives(c) 3 (2) —
Other comprehensive income, net of tax — 23 5
Comprehensive income / (loss) $ (1,434) $ 892 $ 704
(a) Net of tax of $1, $1 and $(1) in 2014, 2013, and 2012, respectively.(b) Net of tax of $(1), $(16) and $(1) in 2014, 2013 and 2012, respectively. See Note 14, Retirement and Postretirement Benefit
Plans, for additional information.(c) Net of tax of $(2), $1 and zero in 2014, 2013 and 2012, respectively.
CALIFORNIA RESOURCES CORPORATION AND SUBSIDIARIESConsolidated and Combined Statements of Equity
For the years ended December 31, 2014, 2013 and 2012(in millions)
AccumulatedOther
Compre-Additional hensive Net Parent Total
Common Paid-in Accumulated Income Company Equity/NetStock Capital Deficit (Loss) Investment Investment
(in millions)Balance, December 31, 2011 $ — $ — $ — $ (52) $ 8,676 $ 8,624
Net income / (loss) — — — — 699 699Other comprehensive loss, net of tax — — — 5 — 5Net contributions from Occidental — — — — 532 532
Balance, December 31, 2012 $ — $ — $ — $ (47) $ 9,907 $ 9,860Net income / (loss) — — — — 869 869Other comprehensive income, net of
tax — — — 23 — 23Net distributions to Occidental — — — — (763) (763)
Balance, December 31, 2013 $ — $ — $ — $ (24) $ 10,013 $ 9,989Net income / (loss)(a) — — (2,117) — 683 (1,434)Other comprehensive income, net of
tax — — — — — —Net contributions from Occidental(b) — — 56 56Dividend to Occidental — — — — (6,000) (6,000)Issuance of common stock at Spin-off 4 — — — (4) —Reclassification of net parent
company investment to additionalpaid-in capital — 4,748 — — (4,748) —
Balance, December 31, 2014 $ 4 $ 4,748 $ (2,117) $ (24) $ — $ 2,611
(a) Net income of $683 million related to operations from January 1, 2014 through the spin-off date of November 30, 2014and was included in Net Parent Company Investment. The net loss of $2,117 million for the month ended December 31,2014 reflected our accumulated deficit as of that date as a stand-alone company.
(b) Net contributions from Occidental include non-cash contributions of approximately $400 million, predominantly tradereceivables, partially offset by $335 million in cash distributions to Occidental.
The accompanying notes are an integral part of these consolidated and combined financial statements.
70

CALIFORNIA RESOURCES CORPORATION AND SUBSIDIARIESConsolidated and Combined Statements of Cash Flows
For the years ended December 31, 2014, 2013 and 2012(in millions)
2014 2013 2012
CASH FLOW FROM OPERATING ACTIVITIESNet income / (loss) $ (1,434) $ 869 $ 699Adjustments to reconcile net income / (loss) to net cash
provided by operating activities:Depreciation, depletion and amortization 1,198 1,144 926Asset impairments 3,402 — 29Deferred income tax expense / (benefit) (1,152) 260 603Other noncash charges to income 113 29 40Dry hole expenses 101 72 128
Changes in operating assets and liabilities, net(Increase) decrease in trade receivables, net 146 (8) 20(Increase) decrease in inventories 2 8 (23)(Increase) decrease in other current assets (133) 2 (49)Increase (decrease) in accounts payable and other current
liabilities 128 100 (150)
Net cash provided by operating activities 2,371 2,476 2,223
CASH FLOW FROM INVESTING ACTIVITIESCapital investments (2,020) (1,669) (2,331)Acquisitions and other (292) (44) (424)
Net cash used by investing activities (2,312) (1,713) (2,755)
CASH FLOW FROM FINANCING ACTIVITIES(Distributions to) contributions from Occidental, net (335) (763) 532Dividends to Occidental (6,000) — —Issuance of senior notes 5,000 — —Issuance of term loan 1,000 — —Proceeds from revolving credit facility 515 — —Repayments of revolving credit facility (155) — —Debt issuance costs (70) — —
Net cash (used) provided by financing activities (45) (763) 532
Increase in cash and cash equivalents 14 — —Cash and cash equivalents—beginning of year — — —
Cash and cash equivalents—end of year $ 14 $ — $ —
The accompanying notes are an integral part of these consolidated and combined financial statements.
71

CALIFORNIA RESOURCES CORPORATION AND SUBSIDIARIESNotes to Consolidated and Combined Financial Statements
NOTE 1 THE SPIN-OFF AND SUMMARY OF SIGNIFICANT ACCOUNTING POLICIES
The Separation and Spin-off
We are an independent oil and natural gas exploration and production company operating propertiesexclusively within the State of California. We were incorporated in Delaware as a wholly-owned subsidiaryof Occidental Petroleum Corporation (‘‘Occidental’’) on April 23, 2014, and remained a wholly-ownedsubsidiary of Occidental until the spin-off on November 30, 2014 (the ‘‘Spin-off’’). Prior to the Spin-off, allmaterial existing assets, operations and liabilities of the California business were consolidated under us.On November 30, 2014, Occidental distributed shares of our common stock on a pro rata basis toOccidental stockholders and we became an independent, publicly traded company. Occidental retainedapproximately 18.5% of our outstanding shares of common stock which it has stated it intends to divestwithin 18 months of the Spin-off.
Except when the context otherwise requires or where otherwise indicated, (1) all references to ‘‘CRC,’’the ‘‘Company,’’ ‘‘we,’’ ‘‘us’’ and ‘‘our’’ refer to California Resources Corporation and its subsidiaries or theCalifornia business, (2) all references to the ‘‘California business’’ refer to Occidental’s California oil andgas exploration and production operations and related assets, liabilities and obligations, which we haveassumed in connection with the Spin-off, and (3) all references to ‘‘Occidental’’ refer to OccidentalPetroleum Corporation, our former parent, and its subsidiaries.
Basis of Presentation
Up until the Spin-off, the accompanying consolidated and combined financial statements were derivedfrom the consolidated financial statements and accounting records of Occidental. These consolidated andcombined financial statements reflect the historical results of operations, financial position and cash flowsof the California business. We account for our share of oil and gas exploration and production ventures, inwhich we have a direct working interest, by reporting our proportionate share of assets, liabilities,revenues, costs and cash flows within the relevant lines on the balance sheets and statements of incomeand cash flows.
The consolidated and combined statements of income for periods prior to the Spin-off includeexpense allocations for certain corporate functions and centrally-located activities historically performedby Occidental. These functions include executive oversight, accounting, treasury, tax, financial reporting,finance, internal audit, legal, risk management, information technology, government relations, publicrelations, investor relations, human resources, procurement, engineering, drilling, exploration, marketing,ethics and compliance, and certain other shared services. These allocations are based primarily onspecific identification of time or activities associated with us, employee headcount or our relative sizecompared to Occidental. Our management believes the assumptions underlying the consolidated andcombined financial statements, including the assumptions regarding allocating expenses from Occidental,are reasonable. However, the financial statements may not include all of the actual expenses that wouldhave been incurred, may include duplicative costs and may not reflect our consolidated and combinedresults of operations, financial position and cash flows had we operated as a stand-alone public companyduring the periods presented. Actual costs that would have been incurred if we had been a stand-alonecompany prior to the Spin-off would depend on multiple factors, including organizational structure andstrategic and operating decisions. There may be some additional non-recurring costs of operating as astand-alone company, which are not expected to be material.
The assets and liabilities in the consolidated and combined financial statements are presented on ahistorical cost basis. We have eliminated all of our significant intercompany transactions and accounts.Prior to the Spin-off, we participated in Occidental’s centralized treasury management program and hadnot incurred any debt. Additionally, excess cash generated by our business was distributed to Occidental,and likewise our cash needs were provided by Occidental, in the form of contributions.
All financial information presented after the Spin-off represents the financial position, results ofoperations and cash flows of CRC, as follows:
• Our consolidated and combined statements of operations, comprehensive income and cash flowsfor the year ended December 31, 2014 consist of the stand-alone consolidated results of CRCfollowing the Spin-off, and the consolidated and combined results of the California business from
72

January 1, 2014, through the Spin-off. Our statements of income, comprehensive income and cashflows for the years ended December 31, 2013 and 2012 consist entirely of the combined results ofthe California business.
• Our consolidated and combined balance sheet at December 31, 2014 consists of the consolidatedbalances of CRC, while at December 31, 2013, it consists of the combined balances of theCalifornia business.
• Our consolidated and combined statement of changes in equity for the year ended December 31,2014 consists of both the California business prior to the Spin-off and the consolidated activityfor CRC subsequent to the Spin-off. Our consolidated statement of changes in equity for theyears ended December 31, 2013 and 2012 consist entirely of the combined activity of theCalifornia business.
Had we been a stand-alone company for the full year 2014, and had the same level of debtthroughout the year as we did on December 31, 2014, of approximately $6.4 billion, we would haveincurred $314 million pre-tax, or $186 million after-tax, of interest expense, on a pro-forma basis, for theyear ended December 31, 2014, compared to the $72 million pre-tax interest expense reported in ourstatement of operations for the year then ended.
Certain prior year amounts have been reclassified to conform to the 2014 presentation.
Risks and Uncertainties
The process of preparing financial statements in conformity with United States generally acceptedaccounting principles requires management to make informed estimates and judgments regarding certaintypes of financial statement balances and disclosures. Such estimates primarily relate to unsettledtransactions and events as of the date of the financial statements and judgments on expected outcomesas well as the materiality of transactions and balances. Changes in facts and circumstances or discoveryof new information relating to such transactions and events may result in revised estimates andjudgments and actual results may differ from estimates upon settlement. Management believes that theseestimates and judgments provide a reasonable basis for the fair presentation of our financial statements.
Revenue Recognition
We recognize revenue from oil and natural gas production when title has passed from us to thetransportation company or the customer, as applicable. We recognize our share of revenues net of anyroyalties and other third-party share.
Net Parent Company Investment
Prior to the Spin-off, our balance sheets included net parent company investment, which representedOccidental’s historical investment in us, our accumulated net income and the net effect of transactionswith, and allocations from, Occidental.
Inventories
Materials and supplies are valued at weighted-average cost and are reviewed periodically forobsolescence. Finished goods include oil and natural gas products, which are valued at the lower of costor market.
Property, Plant and Equipment
The carrying value of our property, plant and equipment (PP&E) represents the cost incurred toacquire or develop the asset, including any asset retirement obligations and capitalized interest, net ofaccumulated depreciation, depletion and amortization (DD&A) and any impairment charges. For assetsacquired, PP&E cost is based on fair values at the acquisition date. Asset retirement obligations arecapitalized and amortized over the lives of the related assets.
We use the successful efforts method to account for oil and gas properties. Under this method, wecapitalize costs of acquiring properties, costs of drilling successful exploration wells and developmentcosts. The costs of exploratory wells are initially capitalized pending a determination of whether we findproved reserves. If we find proved reserves, the costs of exploratory wells remain capitalized. Otherwise,we charge the costs of the related wells to expense. In some cases, we cannot determine whether wehave found proved reserves at the completion of the exploration drilling, and must conduct additional
73

testing and evaluation of the wells. We generally expense the costs of such exploratory wells if we do notdetermine we have found proved reserves within a 12-month period after drilling is complete.
The following table summarizes the activity of capitalized exploratory well costs for the years endedDecember 31:
2014 2013 2012
(in millions)Balance—Beginning of Year $ 18 $ 18 $ 63Additions to capitalized exploratory well costs pending the
determination of proved reserves 3 46 62Reclassification to property, plant and equipment based on the
determination of proved reserves (8) (31) (61)Capitalized exploratory well costs charged to expense (9) (15) (46)
Balance—End of Year $ 4 $ 18 $ 18
We expense annual lease rentals, the costs of injection used in production and exploration geological,geophysical and seismic costs as incurred. Cost of maintenance and repairs are expensed as incurred,except that the costs of replacements that expand capacity or add proven oil and gas reserves arecapitalized.
We determine depreciation and depletion of oil and gas producing properties by theunit-of-production method. We amortize acquisition costs over total proved reserves, and capitalizeddevelopment and successful exploration costs over proved developed reserves. Substantially all of ourtotal depreciation, depletion and amortization expense relates to production costs.
Proved oil and gas reserves and production volumes are used as the basis for recording depreciationand depletion of oil and gas properties. Proved reserves are those quantities of oil and natural gas which,by analysis of geoscience and engineering data, can be estimated with reasonable certainty to beeconomically producible—from a given date forward, from known reservoirs, and under existing economicconditions, operating methods, and government regulations—prior to the time at which contracts providingthe right to operate expire, unless evidence indicates that renewal is reasonably certain, regardless ofwhether deterministic or probabilistic methods are used for the estimation. We have no proved oil andgas reserves for which the determination of economic producibility is subject to the completion of majoradditional capital investments.
Our gas plant and power plant assets are depreciated over the estimated useful lives of the assets,using the straight-line method, with expected initial useful lives of the assets ranging from two to30 years. Other property and equipment is depreciated using the straight-line method based on expectedinitial lives of the individual assets or group of assets ranging from two to 20 years.
We perform impairment tests with respect to proved properties when product prices decline otherthan temporarily, reserve estimates change significantly, other significant events occur or management’splans change with respect to these properties in a manner that may impact our ability to realize therecorded asset amounts. Impairment tests incorporate a number of assumptions involving expectations ofundiscounted future cash flows, which can change significantly over time. These assumptions includeestimates of future product prices, which we base on forward price curves and, when applicable,contractual prices, estimates of oil and gas reserves and estimates of future expected operating anddevelopment costs. Any impairment loss would be calculated as the excess of the asset’s net book valueover its estimated fair value. We recognize any impairment loss on proved properties by adjusting thecarrying amount of the asset.
A portion of the carrying value of our oil and gas properties is attributable to unproved properties. AtDecember 31, 2014, the net capitalized costs attributable to unproved properties were approximately$300 million. The unproved amounts are not subject to DD&A until they are classified as provedproperties. As exploration and development work progresses, if reserves on these properties are proved,capitalized costs attributable to the properties become subject to DD&A. If the exploration anddevelopment work were to be unsuccessful, or management decided not to pursue development of theseproperties as a result of lower commodity prices, higher development and operating costs, contractualconditions or other factors, the capitalized costs of the related properties would be expensed. The timingof any write-downs of these unproved properties, if warranted, depends upon management’s plans, the
74

nature, timing and extent of future exploration and development activities and their results. We recognizeany impairment loss on unproved properties by providing a valuation allowance.
At year end 2014, we performed impairment tests with respect to our proved and unprovedproperties as a result of significant declines in oil prices largely during the last half of 2014. As a result, inthe fourth quarter of 2014, we recorded pre-tax asset impairment charges of $3.4 billion on proved andunproved properties throughout our asset base. The impairment charge was related to certain propertiesin the San Joaquin and Los Angeles basins and a portion of our assets in the Ventura basin, as well asour natural gas properties in the Sacramento basin. Approximately $650 million of the charge was relatedto unproved properties. The properties were impaired as a result of accounting rules that require us toevaluate our properties based on the year-end forward price curve, as well as projects we determined wewould not pursue in the foreseeable future given the current environment.
In 2012, management decided not to pursue development of certain of our natural gas propertieswhich were impacted by persistently low natural gas prices. As a result, we recorded an impairmentcharge in 2012 of $29 million.
Asset Retirement Obligations
We recognize the fair value of asset retirement obligations in the period in which a determination ismade that a legal obligation exists to dismantle an asset and reclaim or remediate the property at theend of its useful life and the cost of the obligation can be reasonably estimated. The liability amounts arebased on future retirement cost estimates and incorporate many assumptions such as time toabandonment, technological changes, future inflation rates and the risk-adjusted discount rate. When theliability is initially recorded, we capitalize the cost by increasing the related PP&E balances. If theestimated future cost of the asset retirement obligation changes, we record an adjustment to both theasset retirement obligation and PP&E. Over time, the liability is increased and expense is recognized foraccretion, and the capitalized cost is depreciated over the useful life of the asset.
At certain of our facilities, we have identified asset retirement obligations that are related mainly toplant and field decommissioning, including plugging and abandonment of wells. In certain cases, we do notknow or cannot estimate when we may settle these obligations and, therefore, we cannot reasonablyestimate the fair value of these liabilities. We will recognize these asset retirement obligations in theperiods in which sufficient information becomes available to reasonably estimate their fair values.Additionally, for certain plants, we do not have a legal obligation to decommission them and accordinglywe have not recorded a liability.
The following table summarizes the activity of the asset retirement obligation, of which $397 millionand $388 million is included in other long-term liabilities, with the remaining current portion in accruedliabilities at December 31, 2014 and 2013, respectively.
For the years endedDecember 31,
2014 2013
(in millions)Beginning balance $ 415 $ 387Liabilities incurred—capitalized to PP&E 19 25Liabilities settled and paid (29) (9)Accretion expense 22 21Acquisitions, disposition and other—changes in PP&E 26 (2)Revisions to estimated cash flows—changes in PP&E (34) (7)
Ending balance $ 419 $ 415
Derivative Instruments
Derivatives are carried at fair value and on a net basis when a legal right of offset exists with thesame counterparty. Fair value gains and losses from derivative instruments are recognized in earnings inthe current period and are reported on a net basis in the statements of operations. We apply hedgeaccounting when transactions meet specified criteria for hedge treatment and management elects anddocuments such treatment. For hedges, the gain or loss on the effective portion of the derivative isreported as a component of other comprehensive income (OCI) with an offsetting adjustment to the basis
75

of the item being hedged. Realized gains or losses from hedges, and any ineffective portion, are recordedas a component of net sales in the statements of operations. Ineffectiveness is primarily created by a lackof correlation between the hedged item and the hedging instrument due to location, quality, grade orchanges in the expected quantity of the hedged item.
A hedge is regarded as highly effective such that it qualifies for hedge accounting if, at inception andthroughout its life, we expect that changes in the fair value or cash flows of the hedged item will beoffset by 80 to 125 percent of the changes in the fair value or cash flows, respectively, of the hedginginstrument. In the case of hedging a forecast transaction, the transaction must be probable and mustpresent an exposure to variations in cash flows that could ultimately affect reported net income or loss.We discontinue hedge accounting when we determine that a derivative has ceased to be highly effectiveas a hedge; when the hedged item matures or is sold or repaid; or when a forecast transaction is nolonger deemed probable.
Stock-based Incentive Plans
We have stockholder approved stock-based incentive plans for certain employees and directors thatare more fully described in Note 11. A summary of our accounting policy for awards issued under ourplans is as follows.
The fair value of stock options granted to our employees is estimated on the date of grant using theBlack-Scholes option pricing model. The model uses various assumptions, based on management’sestimates at the time of grant, which impact the calculation of fair value and ultimately, the amount ofexpense recognized over the vesting period of the stock option award. Of the required assumptions, theexpected life of the stock option award and the expected volatility of our stock price have the mostsignificant impact on the fair value calculation. In the absence of adequate stock price history of CRCcommon stock, the volatility factor is based on the average volatilities of the stocks of a select group ofpeer companies, which are similar in nature to us. The average expected life is calculated based on thesimplified method.
For cash- and stock-settled restricted stock units, compensation value is initially measured on thegrant date using the quoted market price of CRC common stock. Compensation expense for restrictedstock units is recognized on a straight-line basis over the requisite service periods. Compensation expensefor the cash-settled portion of the awards is adjusted cumulatively for changes in the value of theunderlying stock on a quarterly basis. All stock-price-related changes are recognized in periodiccompensation expense. The stock-settled portion of these awards is expensed using the initially measuredcompensation value.
Earnings Per Share
Our instruments containing rights to nonforfeitable dividends granted in stock-based awards areconsidered participating securities prior to vesting and, therefore, have been deducted from earnings incomputing basic and diluted earnings per share under the two-class method.
Basic earnings per share was computed by dividing net income attributable to common stock, net ofincome allocated to participating securities, by the weighted-average number of common sharesoutstanding during each period, net of treasury shares, if any, and including vested but unissued sharesand share units. The computation of diluted earnings per share reflects the additional dilutive effect ofstock options and unvested stock awards.
Retirement and Postretirement Benefit Plans
Prior to the Spin-off, a majority of our employees participated in postretirement benefit planssponsored by Occidental, which included participants from other Occidental subsidiaries. These plans hadan insignificant amount of assets and were substantially funded as benefits were paid. We recognized aliability in the accompanying balance sheets for the employees of the California operations. The relatedpostretirement expenses were allocated to us from Occidental based on the employees of the Californiabusiness. Following the Spin-off, all of our employees participate in postretirement benefit planssponsored by us. These plans are substantially funded as benefits are paid.
For defined benefit pension and postretirement plans that are sponsored by us, we recognize the netoverfunded or underfunded amounts in the financial statements using a December 31 measurement date.
76

We determine our defined benefit pension and postretirement benefit plan obligations based onvarious assumptions and discount rates. The discount rate assumptions used are meant to reflect theinterest rate at which the obligations could effectively be settled on the measurement date. We estimatethe rate of return on assets with regard to current market factors but within the context of historicalreturns.
Pension plan assets are measured at fair value. Common stock, preferred stock, publicly registeredmutual funds, U.S. government securities and corporate bonds are valued using quoted market prices inactive markets when available. When quoted market prices are not available, these investments arevalued using pricing models with observable inputs from both active and non-active markets. Commonand collective trusts are valued at the fund units’ net asset value (NAV) provided by the issuer, whichrepresents the quoted price in a non-active market. Short-term investment funds are valued at the fundunits’ NAV provided by the issuer.
Actuarial gains and losses that have not yet been recognized through income are recorded inaccumulated OCI within net investment, net of taxes, until they are amortized as a component of netperiodic benefit cost.
Fair Value Measurements
We have categorized our assets and liabilities that are measured at fair value in a three-level fairvalue hierarchy, based on the inputs to the valuation techniques: Level 1—using quoted prices in activemarkets for the assets or liabilities; Level 2—using observable inputs other than quoted prices for theassets or liabilities; and Level 3—using unobservable inputs. Transfers between levels, if any, arerecognized at the end of each reporting period. We apply the market approach for certain recurring fairvalue measurements, maximize our use of observable inputs and minimize use of unobservable inputs. Wegenerally use an income approach to measure fair value when observable inputs are unavailable. Thisapproach utilizes management’s judgments regarding expectations of projected cash flows and discountsthose cash flows using a risk-adjusted discount rate.
Commodity derivatives are carried at fair value. We utilize the mid-point between bid and ask pricesfor valuing these instruments. In addition to using market data in determining these fair values, we makeassumptions about the risks inherent in the inputs to the valuation technique. Our commodity derivativescomprise Over-the-Counter (OTC) bilateral financial commodity contracts, which are generally valuedusing industry-standard models that consider various inputs, including quoted forward prices forcommodities, time value, volatility factors, credit risk and current market and contracted prices for theunderlying instruments, as well as other relevant economic measures. Substantially all of these inputs areobservable data or are supported by observable prices at which transactions are executed in themarketplace. We classify these measurements as Level 2.
The carrying amounts of on-balance-sheet financial instruments approximate fair value.
Other Current Assets
Other current assets at December 31, 2014 include amounts due from joint interest partners ofapproximately $120 million, greenhouse gas emission credits of $65 million and deferred tax assets of$61 million. At December 31, 2013 other current assets included $97 million due from joint interestpartners.
Accrued Liabilities
Accrued liabilities at December 31, 2014 include accrued compensation-related costs of approximately$80 million, interest payable of approximately $70 million, and greenhouse gas liabilities of approximately$65 million. At December 31, 2013 accrued liabilities included $70 million of accrued compensation-relatedcosts.
Supplemental Cash Flow Information
We have not made United States federal and state income tax payments directly to taxingjurisdictions. Up until the Spin-off, our share of Occidental’s tax payments or refunds were paid orreceived, as applicable, by our parent and are reflected as part of the net parent company investment.Such amounts paid during the year ended December 31, 2014 and 2013 were approximately $165 millionand $318 million, respectively, while the year ended December 31, 2012 resulted in a net refund of
77

approximately $121 million. We also paid taxes other than on income, consisting mostly of property taxes,of approximately $183 million, $185 million and $171 million during the years ended December 31, 2014,2013 and 2012, respectively. Interest paid totaled approximately $3 million for the year endedDecember 31, 2014, and zero for each of the two years ended December 31, 2013 and 2012.
The 2014 capital investments reported on the statement of cash flows exclude changes to theconsolidated balance sheets that did not affect cash primarily consisting of the increase in capitalaccruals during the year. Total capital investments in 2014 were $2.089 billion, which included$2.020 billion of cash paid for capital investments as reported in the statement of cash flows and$69 million in increase in capital accruals. For the years 2013 and 2012, the changes in the capital accrualamounts were not material.
In 2014, Occidental transferred to us certain assets, liabilities and accruals, of which the mostsignificant consisted of outstanding trade receivables of approximately $400 million.
These non-cash transfers and the corresponding net contribution to us from Occidental wereexcluded from net cash provided by operating activities and cash flow from financing activities.
Major Customers
For the years ended December 31, 2014, 2013 and 2012, ConocoPhillips/Phillips 66 Company andTesoro Refining & Marketing Company LLC each accounted for more than 10% of our net sales.Collectively, they accounted for 45%, 42% and 46% in each of those years, respectively.
Income Taxes
Our taxable income was historically included in the consolidated U.S. federal income tax returns ofOccidental and in a number of their consolidated state income tax returns. In the accompanying financialstatements, our provision for income taxes is computed as if we were a stand-alone tax-paying entity.
Deferred tax assets and liabilities are recognized for the estimated future tax consequencesattributable to differences between the financial statement carrying amounts of assets and liabilities andtheir tax bases. Deferred tax assets are recorded when it is more likely than not that they will be realized.The realization of deferred tax assets is assessed periodically based on several factors, including ourexpectation that we will generate sufficient future taxable income and reversals of taxable temporarydifferences.
NOTE 2 ACCOUNTING AND DISCLOSURE CHANGES
Recently Adopted Accounting and Disclosure Changes
In August 2014, the Financial Accounting Standards Board (FASB) issued rules relating tomanagement’s responsibility to evaluate and make disclosures, if applicable, regarding the entity’s abilityto continue as a going concern within one year after the date that the financial statements are issued.These rules are effective for annual periods ending after December 15, 2016. They are not expected tohave a material impact on our financial statements upon adoption and will require assessment on anongoing basis.
In June 2014, the FASB issued rules for employee share-based payment awards in which the terms ofthe awards provide that a performance target can be achieved after the requisite service period. Aperformance target that affects vesting and that could be achieved after the requisite service period willbe treated as a performance condition. These rules are effective for annual periods beginning on or afterDecember 15, 2015 and are not expected to have a material impact on our financial statements uponadoption but will require assessment on an ongoing basis.
In May 2014, the FASB issued rules related to revenue recognition. Under the new rules, an entity willrecognize revenue when it transfers promised goods or services to customers in an amount that reflectswhat it expects to receive in exchange for the goods or services. The rules will also require more detaileddisclosures of the nature, amount, timing and uncertainty of revenue and cash flows arising fromcontracts with customers. The rules are effective for interim and annual periods beginning afterDecember 15, 2016 and early application is not permitted. While we are evaluating any potential impact ofthese new rules, we currently believe the effect of the new rules will not have a material impact on ourfinancial statements.
78

In April 2014, the FASB issued rules changing the requirements for reporting discontinued operationssuch that only the disposals of components of an entity that represent a strategic shift that has (or willhave) a major effect on an entity’s operations and financial results will be reported as discontinuedoperations in the financial statements. These rules are effective for the annual periods beginning on orafter December 15, 2014. They are not expected to have a material impact on our financial statementsupon adoption and will require assessment on an ongoing basis.
NOTE 3 ACQUISITIONS
2014
During the year ended December 31, 2014, we paid approximately $290 million to acquire certainproducing and non-producing oil and gas properties, including oil and gas properties in the Ventura basinpurchased for approximately $200 million in the fourth quarter of 2014.
2013
During the year ended December 31, 2013, we paid approximately $50 million to acquire certain oiland gas properties, including an acquisition in the San Joaquin basin, which obligates us to invest at least$250 million on exploration and development activities over a period of five years from the date ofacquisition. We currently plan to invest more than this amount during that period. Any deficiency inmeeting this capital investment obligation would need to be paid in cash at the end of the five-yearperiod. Through December 31, 2014, we have already fulfilled about 20% of this obligation.
2012
During the year ended December 31, 2012, we paid approximately $380 million for oil and gasproperties, including an acquisition for $275 million for certain producing and non-producing assets in theSacramento basin and undeveloped acreage in the San Joaquin basin.
NOTE 4 INVENTORIES
Inventories consisted of the following:
Balance atDecember 31,
2014 2013
(in millions)Materials and supplies $ 66 $ 73Finished goods 5 2
Total $ 71 $ 75
NOTE 5 DEBT
Debt consisted of the following:
December 31,
2014 2013
(in millions)Revolving Credit Facility $ 360 $ —Term Loan Facility 1,000 —5% notes due 2020 1,000 —51⁄2% notes due 2021 1,750 —6% notes due 2024 2,250 —
Total $ 6,360 $ —
79

Credit Facilities
On September 24, 2014, we entered into a credit agreement with a syndicate of lenders, providing for(i) a five-year senior term loan facility (the ‘‘Term Loan Facility’’) and (ii) a five-year senior revolving loanfacility (the ‘‘Revolving Credit Facility’’ and, together with the Term Loan Facility, the ‘‘Credit Facilities’’).All borrowings under these facilities are subject to certain customary conditions. We amended the CreditFacilities effective as of February 25, 2015, and changed certain of our covenants through December 31,2016 or such earlier time as we elect and demonstrate compliance with our original covenants for twosuccessive quarters (the ‘‘Interim Covenant Period’’).
The aggregate initial commitments of the lenders under the Revolving Credit Facility are $2.0 billionand under the Term Loan Facility are $1.0 billion. The Revolving Credit Facility includes a sub-limit of$400 million for the issuance of letters of credit. We will be required to repay the Term Loan Facility inequal quarterly installments equal to 2.5% (10.00% per annum) of the principal amount of the Term LoanFacility beginning on March 31, 2016. As of December 31, 2014, we had $360 million outstanding under ourRevolving Credit Facility with the ability to incur total net borrowings of up to $1.25 billion during theInterim Covenant Period under this facility.
Borrowings under the Credit Facilities bear interest, at our election, at either a LIBOR rate or analternate base rate (‘‘ABR’’) (equal to the greatest of (i) the administrative agent’s prime rate, (ii) theone-month LIBOR rate plus 1.00% and (iii) the federal funds effective rate plus 0.50%), in each case plusan applicable margin. This applicable margin is based on our most recent leverage ratio and will vary from(a) in the case of LIBOR loans, 1.50% to 2.25% and (b) in the case of ABR loans, from 0.50% to 1.25%.The unused portion of the Revolving Credit Facility is subject to commitment fees ranging from 0.30% to0.50% per annum, based on our most recent leverage ratio. We also pay customary fees and expensesunder the Revolving Credit Facility.
Interest payments under the Credit Facilities vary based on the borrowing options chosen. Interest onABR loans is payable quarterly in arrears. Interest on LIBOR loans is payable at the end of each LIBORperiod.
All obligations under the Credit Facilities are guaranteed jointly and severally by all of our wholly-owned material subsidiaries, and will be unsecured while we maintain our credit ratings at the minimumlevels defined in the Credit Facilities. During the Interim Covenant Period, we would be required to grantsecurity to our lenders if our corporate family ratings experienced a two-notch decline from either of ourrating agencies. Outside the Interim Covenant Period we would be required to grant security in the eventof a three-notch decline subject to certain exceptions described in our Credit Facilities. The assets andliabilities of subsidiaries not guaranteeing the debt are de minimis.
The Credit Facilities also require us to maintain the following financial covenants for the trailingtwelve months ended as of the last day of each fiscal quarter: (a) a leverage ratio of no more than 4.50to 1.00 except during the Interim Covenant Period when the ratio increases by varying amounts to amaximum of 8.25 to 1.00 by December 31, 2015 and (b) an interest expense ratio of no less than 2.50 to1.00 except as of December 31, 2015 when the ratio must be no less than 2.25 to 1.00. In addition, duringthe Interim Covenant Period, we must maintain an asset coverage ratio of no less than 1.05 to 1.00measured as of the last day of each fiscal quarter. Finally, during the Interim Covenant Period, we mustapply cash on hand in excess of $250 million to repay certain amounts outstanding under the RevolvingCredit Facility. If we were to breach either of these covenants the banks would be permitted to acceleratethe principal amount due under the facilities. If payment were accelerated it would result in a defaultunder the notes.
Senior Notes
On October 1, 2014, we issued $5.00 billion in aggregate principal amount of our senior notes,including $1.00 billion of 5% senior notes due January 15, 2020 (the 2020 notes), $1.75 billion of 51⁄2%senior notes due September 15, 2021 (the 2021 notes) and $2.25 billion of 6% senior notes dueNovember 15, 2024 (the ‘‘2024 notes’’ and together with the 2020 notes and the 2021 notes, the‘‘notes’’), in a private placement. The notes were issued at par and initially are fully and unconditionallyguaranteed on a senior unsecured basis by all of our material subsidiaries. We used the net proceedsfrom the notes to make a $4.95 billion cash distribution to Occidental in October 2014.
We will pay interest on the 2020 notes semi-annually in cash in arrears on January 15 and July 15 ofeach year, beginning on July 15, 2015. We will pay interest on the 2021 notes semi-annually in cash in
80

arrears on March 15 and September 15 of each year, beginning on March 15, 2015. We will pay interest onthe 2024 notes semi-annually in cash in arrears on May 15 and November 15 of each year, beginning onMay 15, 2015.
In connection with the private placement of the notes, we granted the initial purchasers certainregistration rights under a registration rights agreement.
The indenture governing the notes includes covenants that, among other things, limit our and ourrestricted subsidiaries’ ability to incur debt secured by liens. These covenants also restrict our ability tomerge or consolidate with, or transfer all or substantially all of our assets to, another entity. Thesecovenants are subject to a number of important qualifications and limitations that are set forth in theindenture. The covenants are not, however, directly linked to measures of our financial performance. Inaddition, if we experience a ‘‘change of control triggering event’’ (as defined in the indenture) withrespect to a series of notes, we will be required, unless we have exercised our right to redeem the notesof such series, to offer to purchase the notes of such series at a purchase price equal to 101 percent oftheir principal amount, plus accrued and unpaid interest.
Principal maturities of long-term debt outstanding at December 31, 2014 are as follows:
(in millions)2015 $ —2016 1002017 1002018 1002019 1,060Thereafter 5,000
Total $ 6,360
We estimate the fair value of fixed-rate debt based on prices from known market transactions for ourinstruments. The estimated fair value of our debt at December 31, 2014, the fixed rate portion of whichwas classified as Level 1, and the variable rate portion approximated fair value, was approximately$5.6 billion, compared to a carrying value of approximately $6.4 billion. A one-eighth percent change inthe variable interest rates on the borrowings under our Term Loan Facility and Revolving Credit Facilityon December 31, 2014, would result in an approximately $1.7 million change in annual interest expense. In2014, we incurred $70 million in debt issuance costs related to the notes and the Credit Facility which weamortize using the effective interest rate method over the respective term of each instrument.
As of December 31, 2014, we had letters of credit in the aggregate amount of approximately$25 million that were issued to support ordinary course marketing, regulatory and other matters.
NOTE 6 LEASE COMMITMENTS
We have entered into various operating lease agreements, mainly for office space, office equipment,and field equipment. We lease assets when leasing offers greater operating flexibility. Lease payments aregenerally expensed as part of production costs or selling, general and administrative expenses. AtDecember 31, 2014, future net minimum lease payments for noncancelable operating leases (excluding oiland natural gas and other mineral leases, utilities, taxes, insurance and maintenance expense) totaled:
Amount
(in millions)2015 $ 132016 142017 142018 142019 12Thereafter 58
Total minimum lease payments $ 125
Rental expense for operating leases was $10 million in 2014, $11 million in 2013 and $12 million in2012.
81

NOTE 7 LAWSUITS, CLAIMS, COMMITMENTS AND CONTINGENCIES
We, or certain of our subsidiaries, are involved, in the normal course of business, in lawsuits,environmental and other claims and other contingencies that seek, among other things, compensation foralleged personal injury, breach of contract, property damage or other losses, punitive damages, civilpenalties, or injunctive or declaratory relief. We accrue reserves for currently outstanding lawsuits, claimsand proceedings when it is probable that a liability has been incurred and the liability can be reasonablyestimated. Reserve balances at December 31, 2014 and 2013 were not material to our balance sheets as ofsuch dates. We also evaluate the amount of reasonably possible losses that we could incur as a result ofthese matters. We believe that reasonably possible losses that we could incur in excess of reservesaccrued on our balance sheet would not be material to our consolidated financial position or results ofoperations.
We have certain commitments under contracts, including purchase commitments for goods andservices. At December 31, 2014, total purchase obligations were approximately $364 million, whichincluded approximately $70 million, $47 million, $32 million, $186 million and $18 million that will be paidin 2015, 2016, 2017, 2018 and 2019, respectively. Included in the purchase obligations are commitmentsfor major fixed and determinable capital investments during 2015 and thereafter, which wereapproximately $264 million.
We, our subsidiaries, or both, have indemnified various parties against specific liabilities those partiesmight incur in the future in connection with the Spin-off, purchases and other transactions that they haveentered into with us. These indemnities include indemnities made to Occidental against certain tax-relatedliabilities that may be incurred by Occidental relating to the Spin-off and liabilities related to operation ofour business while it was still owned by Occidental. As of December 31, 2014, we are not aware ofcircumstances that we believe would reasonably be expected to lead to indemnity claims that would resultin payments materially in excess of reserves.
NOTE 8 DERIVATIVES
In February 2015, we put into place additional hedging instruments to protect the pricing for almosttwo-thirds of our expected third quarter 2015 oil production. For this program we chose a combination ofBrent-based collars (between $55 and $72) for 30,000 barrels per day for July through September aswell as put options at $50 per barrel Brent for 40,000 barrels per day in the same period. In addition, wesold a $75 per barrel call for 30,000 barrels per day of oil production in March through June of 2015.Going forward as an independent company, we will continue to be strategic and opportunistic inimplementing any hedging program. Our objective is to protect against the cyclical nature of commodityprices to provide a level of certainty around our margins and cash flows necessary to implement ourinvestment program.
In December 2014, we purchased put options, to hedge the risk associated with declining oil prices,for 100,000 barrels of crude oil production per day, effective on a monthly basis from January 1, 2015through June 30, 2015. The strike price of the put option is $50 tied to the Brent oil index. Changes inthe intrinsic value of the put option are deferred in other comprehensive income/(loss) as a cash flowhedge until the hedged transactions are recognized in the statement of operations. Changes in the timevalue of the put option are marked to market through the statement of operations. The put option wasvalued using Level 2 inputs in the fair value hierarchy and was valued at approximately $24 million inother current assets, as of December 31, 2014, which approximated the value of the instrument and theamount we paid the counterparty at the time the option was acquired.
We entered into financial swap agreements in November 2012 for the sale of a portion of our naturalgas production. These swap agreements hedged 50 MMcf of natural gas per day beginning in January2013 through March 2014 and qualified as cash-flow hedges. The weighted-average strike price of theseswaps was $4.30. The gross and net fair values of these derivatives as of December 31, 2013 were notmaterial and were considered Level 2.
The after-tax gains and losses recognized in, and reclassified to income from, Accumulated OtherComprehensive Income (AOCI), for derivative instruments classified as cash-flow hedges for the yearsended December 31, 2014, 2013 and 2012, and the ending AOCI balances for each period were notmaterial. We recognized gains and losses reclassified to income in net sales. The amount of theineffective portion of cash-flow hedges was immaterial for the years ended December 31, 2014, 2013 and2012. Refer to Note 1 for our accounting policy on derivatives.
82

There were no fair value hedges as of and during the years ended December 31, 2014, 2013 and 2012.
NOTE 9 FAIR VALUE MEASUREMENTS
Fair Values—Recurring
The following table presents assets accounted for at fair value on a recurring basis as ofDecember 31, 2014:
December 31, 2014
(in millions) Level Level 2 Level 3 Collateral TotalCommodity derivative instruments, other
current assets — 24 — —
Total — 24 — — 24
Commodity derivative instruments in Level 2 are over-the-counter put options for the first 100,000barrels of crude oil production per day, effective on a monthly basis from January 1, 2015 throughJune 30, 2015, and are measured at fair value by using industry-standard models using various inputs,including quoted forward prices. We had no material assets or liabilities accounted for at fair value as ofDecember 31, 2013.
Fair Values—Nonrecurring
At year end 2014, we performed impairment tests with respect to our proved and unprovedproperties as a result of significant declines in oil prices largely during the last half of 2014. Wedetermined the carrying amounts of certain assets were not recoverable from future cash flows and,therefore, were impaired. As a result, in the fourth quarter of 2014, we recorded pre-tax asset impairmentcharges of $3.4 billion, of which $2.7 billion was for proved properties throughout our asset base toreduce these assets to their estimated fair values. The impairment charge was related to certainproperties in the San Joaquin and Los Angeles basins and a portion of our assets in the Ventura basin, aswell as our natural gas properties in the Sacramento basin.
The fair values of the proved properties held and used were determined as of the date of theassessment using discounted cash flow models based on management’s expectations for the future.Inputs included estimates of future oil and natural gas production, prices based on recent commodityforward price curves as of the date of the estimate, estimated operating and development costs, and arisk-adjusted discount rate of 10%.
Financial Instruments Fair Value
The carrying amounts of cash and other on-balance sheet financial instruments, other than fixed-ratedebt, approximate fair value.
83

NOTE 10 INCOME TAXES
Income / (loss) before income taxes was ($2,421) million, $1,447 million and $1,181 million for theyears ended December 31, 2014, 2013 and 2012, respectively. The provision (benefit) for federal, state andlocal income taxes consists of the following:
UnitedStates State and
For the years ended December 31, Federal Local Total
(in millions)2014
Current $ 66 $ 99 $ 165Deferred (840) (312) (1,152)
$ (774) $ (213) $ (987)
2013Current $ 227 $ 91 $ 318Deferred 222 38 260
$ 449 $ 129 $ 578
2012Current $ (140) $ 19 $ (121)Deferred 518 85 603
$ 378 $ 104 $ 482
The following reconciliation of the United States federal statutory income tax rate to our effective taxrate is stated as a percentage of pre-tax income or loss:
For the years endedDecember 31,
2014 2013 2012
United States federal statutory tax rate 35% 35% 35%State income taxes, net of federal benefit 6 6 6Other — (1) —
Effective tax rate 41% 40% 41%
The tax effects of temporary differences resulting in deferred income taxes at December 31, 2014 and2013 were as follows:
2014 2013
Deferred Deferred Deferred DeferredTax Tax Tax Tax
Assets Liabilities Assets Liabilities
(in millions)Property, plant and equipment differences $ — $ (2,437) $ — $ (3,583)Postretirement benefit accruals 39 — 14 —Deferred compensation and benefits 62 — 60 —Asset retirement obligations 184 — 182 —Federal benefit of state income taxes 68 — 208 —Net operating loss carryforwards 64 — 8 —All other 27 (1) 14 (2)
Total deferred taxes $ 444 $ (2,438) $ 486 $ (3,585)
The current portion of deferred tax assets was $61 million and $23 million as of December 31, 2014and 2013, respectively, which was reported in other current assets. The noncurrent portion of totaldeferred tax assets was reported net against deferred tax liabilities.
84

We evaluate our deferred tax assets to determine if a valuation allowance is required to reduce ourdeferred tax assets to an amount expected to be realized. We expect to realize our deferred tax assetsthrough future taxable income and reversals of taxable temporary differences.
Due to the Spin-off on November 30, 2014, we will file short year U.S. federal and California incometax returns for the one month ended December 31, 2014. Prior to the Spin-off date, we were included inthe Occidental income tax returns for all applicable years. There could be a settlement between us andOccidental under the tax sharing agreement related to income taxes for the periods prior to the Spin-off.The income tax provision was calculated as if we filed separate tax returns for all periods presented priorto the Spin-off. For the one-month period ended December 31, 2014, there is no current income taxprovision and a $1.5 billion deferred income tax benefit for U.S. federal and California taxes. As ofDecember 31, 2014, an insignificant amount is due to Occidental under the tax sharing agreement. Therewere no amounts due to Occidental as of December 31, 2013.
We have no liabilities for unrecognized tax benefits as of December 31, 2014 and 2013. We believethere will not be material changes to our unrecognized tax benefits within the next 12 months. Werecognize interest and penalties, if any, related to uncertain tax positions in the income tax provision.There were no amounts of interest and penalties related to uncertain tax positions during the yearsended December 31, 2014, 2013 and 2012.
As of December 31, 2014, we had $182 million of U.S. federal net operating losses and $207 million ofCalifornia net operating losses. The net operating loss carryforwards resulted from operations during theone-month ended December 31, 2014 and from the acquisition of a subsidiary in a prior year. The U.S.federal net operating losses begin expiring in 2017 and the California net operating losses begin expiringin 2015. Utilization of $22 million of the U.S. federal and $112 million of the California net operating losscarryforward is subject to an annual limitation as a result of these acquisitions and no financial statementbenefit has been recognized for this portion of the net operating loss carryforward.
Our tax returns for the one-month period December 2014 will be subject to examination by U.S.federal and California tax authorities when filed. Under the tax sharing agreement, Occidental controls taxexaminations for the periods in which we were included in a consolidated or combined income tax returnfiled by Occidental.
NOTE 11 STOCK COMPENSATION
General
Prior to the Spin-off, our employees participated in Occidental’s stock-based incentive plans underwhich, if they were eligible, they received Occidental stock awards. Effective on the Spin-off date ofNovember 30, 2014, our employees and non-employee directors began participating in our long-termincentive plan.
Our incentive plan authorizes the Compensation Committee of our Board of Directors to grant up toa total of 25 million shares in the form of stock options, stock appreciation rights, stock awards,performance awards and cash awards, among others, to our employees, non-employee directors andother plan participants.
In connection with the Spin-off, unvested share-based compensation awards granted to ouremployees under Occidental’s stock-based incentive plans and held by grantees as of November 30, 2014were replaced with substitute awards based on CRC common shares. These substitute awards wereintended to generally preserve the value of the original Occidental award determined as of November 30,2014. Original and remaining vesting periods of Occidental awards were unaffected by the substitution.There were approximately 650 employees affected by the substitution of awards. The substitution ofawards did not cause us to recognize incremental compensation expense. These substitute awardsreduced the maximum number of shares of our common stock available for delivery under our incentiveplan.
We expense all share-based payments to employees and non-employee directors based on the grantdate fair value of the awards over the requisite service period, adjusted for estimated forfeitures.
During 2014, non-employee directors were granted awards for approximately 74,600 shares ofrestricted stock, which fully vest one year from the date of grant. Compensation expense for theseawards that will be recognized during the vesting period was measured using the quoted market price ofour common stock on the grant date.
85

Compensation expense for stock-based awards for the month ended December 31, 2014 wasapproximately $1 million. Prior to the Spin-off, Occidental allocated certain costs to us which includedcompensation costs for stock-based awards of Occidental stock. If we were to estimate the equitycompensation component of all costs allocated to us by Occidental using the same allocation methodused by Occidental, stock compensation expense allocated to us was approximately $26 million,$33 million and $20 million for January 1, 2014 through November 30, 2014, total year 2013, and totalyear 2012, respectively. Since these costs were allocated to us, it is not practical to calculate the taxbenefit for those years.
As of December 31, 2014, unrecognized compensation expense for all our unvested stock-basedincentive awards, based on the year end value of our common stock, was $74 million. This expense isexpected to be recognized over a weighted-average period of 2.3 years.
Restricted Stock Units
Certain employees are awarded restricted stock units (RSUs), some of which have performancecriteria, and are in the form of, or equivalent in value to, actual shares of CRC common stock. Dependingon their terms, restricted stock units are settled in cash or stock at the time of vesting. These awardsvest ratably over three years, or at the end of two or three years, following the date of grant, or uponsatisfaction of any performance criteria, if later. For a substantial majority of the restricted stock units,dividend equivalents are paid during the vesting period.
There were no CRC restricted stock units granted for the years ended December 31, 2013 or 2012.The following summarizes our restricted stock unit activity for the year ended December 31, 2014:
Cash-Settled Stock-Settled
Weighted- Weighted-Average Average
RSUs Grant-Date RSUs Grant-Date(000’s) Fair Value (000’s) Fair Value
Unvested at December 31, 2013 — $ — — $ —Granted 4,562 $ 7.37 6,663 $ 7.84Vested — $ — — $ —Forfeited (14) $ 7.37 — $ —
Unvested at December 31, 2014 4,548 $ 7.37 6,663 $ 7.84
Of the total awards granted, approximately 4,562,000 cash-settled units and 5,950,000 stock-settledunits were substitute awards. The remainder were new awards granted following the Spin-off.
Stock Options
Following the Spin-off, we granted stock options to certain employees under our long-term incentiveplan. The options permit purchase of our common stock at exercise prices no less than the fair marketvalue of the stock on the date the options were granted. The options have terms of seven years and vestratably, with one-third vesting and becoming exercisable on each anniversary date following the date ofgrant.
The fair value of each option is measured on the grant date using the Black-Scholes option valuationmodel and expensed on a straight-line basis over the vesting period. The expected life of stock options iscalculated based on the simplified method and represents the period of time that options granted areexpected to be held prior to exercise. In the absence of adequate stock price history of CRC commonstock, the volatility factor is based on the average volatilities of the stocks of a select group of peercompanies, which are similar in nature to us. The risk-free interest rate is the implied yield available onzero coupon (US Treasury Strip) T-notes at the grant date with a remaining term approximating theexpected life. The dividend yield is the expected annual dividend yield over the expected life, expressed asa percentage of the stock price on the grant date. Estimates of fair value are not intended to predictactual future events or the value ultimately realized by employees who receive stock-based incentiveawards, and subsequent events may not be indicative of the reasonableness of the original estimates offair value made by us.
86

The following table summarizes our option activity during the year ended December 31, 2014:
Weighted-Weighted- Average
Options Average Grant-Date Aggregate(000’s) Exercise Price Fair Value Intrinsic Value
Beginning balance, December 31, 2013 — $ — $ — $ —Granted 8,481 8.11 1.98 —Exercised — — — —Forfeited — — — —Expired or Canceled — — — —
Ending balance, December 31, 2014 8,481 $ 8.11 $ 1.98 $ —
There were no CRC options granted for the years ended December 31, 2013 and 2012. There were novested or exercisable options at December 31, 2014.
The grant date assumptions used in the Black-Scholes valuation for CRC options granted during 2014were as follows:
2014
Exercise price per share $ 8.11Expected life (in years) 4.5Expected volatility 35.4%Risk-free interest rate 1.4%Dividend yield 0.5%Grant date fair value of stock option awards granted $ 1.98
Employee Stock Purchase Plan
Effective January 1, 2015, we have adopted the California Resources Corporation 2014 EmployeeStock Purchase Plan (the ‘‘ESPP’’). The ESPP will provide our employees the ability to purchase shares ofour common stock at a price equal to 85% of the closing price of a share of our common stock as of thefirst or last day of each offering period (a fiscal quarter), whichever amount is less.
The maximum number of shares of our common stock which may be issued pursuant to the ESPP issubject to certain annual limits and has a cumulative limit of 5 million shares, subject to adjustmentpursuant to the terms of the ESPP. As of January 1, 2015, about 45% of our employees have elected toparticipate in the plan.
NOTE 12 EQUITY
The following is a summary of common stock issuances:
CommonStock
(in 000’s)Balance, December 31, 2013 —
Issued 385,640
Balance, December 31, 2014 385,640
All stock issuances occurred in conjunction with the Spin-off. Approximately 3,537,000 sharesconsisted of CRC employee stock-based incentive awards converted from Occidental awards andapproximately 713,000 shares were for new CRC employee awards, all of which were unvested as of theSpin-off date.
Preferred Stock
In November 2014, our board of directors authorized 200 million shares of preferred stock with a parvalue of $0.01 per share. At December 31, 2014, we had no outstanding shares of preferred stock.
87

ACCUMULATED OTHER COMPREHENSIVE INCOME / (LOSS)
Accumulated other comprehensive loss consisted of the following after-tax amounts:
Balance atDecember 31,
2014 2013
(in millions)Unrealized losses (gains) on derivatives $ — $ (1)Pension and post-retirement adjustments(a) (24) (23)
Total $ (24) $ (24)
(a) See Note 14 for further information.
NOTE 13 EARNINGS PER SHARE
We compute earnings per share (EPS) using the two-class method required for participatingsecurities. Undistributed earnings allocated to participating securities are subtracted from net income indetermining net income attributable to common stockholders. Restricted stock awards are consideredparticipating securities because holders of such shares have non-forfeitable dividend rights in the event ofour declaration of a dividend for common shares.
The denominator of basic EPS is the sum of the daily weighted-average number of common sharesoutstanding during the periods presented and vested stock awards that have not yet been issued ascommon stock. The denominator of diluted EPS is based on the basic shares outstanding, adjusted for theeffect of outstanding option awards, to the extent they are dilutive.
On December 1, 2014, the Spin-off date, 381.4 million shares of our common stock were distributed, ofwhich approximately 18.5% was retained by Occidental. For comparative purposes, and to provide a moremeaningful calculation of weighted-average shares outstanding, we have assumed this amount to beoutstanding as of the beginning of each period prior to the Spin-off presented in the calculation ofweighted-average shares. In addition, we have assumed the vested stock awards granted in December2014 were also outstanding for each of the periods presented prior to the Spin-off, resulting in aweighted-average basic share count of 381.8 million shares. The effect of stock options granted inDecember 2014 was anti-dilutive.
The following table presents the calculation of basic and diluted EPS for the years endedDecember 31:
2014 2013 2012
(in millions, except per-shareamounts)
Basic EPS calculationNet income / (loss) $ (1,434) $ 869 $ 699Net income / (loss) allocated to participating securities — (14) (11)
Net income / (loss) available to common stockholders $ (1,434) $ 855 $ 688
Weighted-average common shares outstanding—basic 381.9 381.8 381.8
Basic EPS $ (3.75) $ 2.24 $ 1.80
Diluted EPS calculationNet income / (loss) $ (1,434) $ 869 $ 699Net income / (loss) allocated to participating securities — (14) (11)
Net income / (loss) available to common stockholders $ (1,434) $ 855 $ 688
Weighted average common shares outstanding—basic 381.9 381.8 381.8Dilutive effect of potentially dilutive securities — — —
Weighted-average common shares outstanding—diluted 381.9 381.8 381.8
Diluted EPS $ (3.75) $ 2.24 $ 1.80
88

NOTE 14 RETIREMENT AND POSTRETIREMENT BENEFIT PLANS
We have various benefit plans for our salaried, union and nonunion hourly employees.
Defined Contribution Plans
All of our employees were eligible to participate in one or more of the defined contributionretirement or savings plans that provide for periodic contributions by us, our subsidiaries or, prior to theSpin-off, by Occidental, based on plan-specific criteria, such as base pay, age, level and employeecontributions. Certain salaried employees participated in a supplemental retirement plan that restoredbenefits lost due to governmental limitations on qualified retirement benefits. The accrued liabilities forthe supplemental retirement plan were $27 million and $17 million as of December 31, 2014 and 2013,respectively, and we expensed $29 million in 2014, $34 million in 2013 and $35 million in 2012 under theprovisions of these defined contribution and supplemental retirement plans.
Defined Benefit Plans
Participation in defined benefit pension plans sponsored by us is limited. Approximately 260employees, including union and certain nonunion employees who joined us from acquired operations withgrandfathered benefits, are currently accruing benefits under these plans.
Pension costs for the defined benefit pension plans, determined by independent actuarial valuations,are generally funded by payments to trust funds, which are administered by independent trustees.
Postretirement and Other Benefit Plans
We provided postretirement medical and dental benefits and life insurance coverage for ouremployees and their eligible dependents through Occidental-sponsored plans prior to the Spin-off, andprovide them through CRC-sponsored plans following the Spin-off. The benefits were generally funded asthey were paid during the year. These benefit costs were approximately $22 million in 2014, $18 million in2013 and $17 million in 2012.
Obligations and Funded Status
The following tables show the amounts recognized in our balance sheets related to pension andpostretirement benefit plans, including our share of obligations for Occidental-sponsored plans as well asplans that we or our subsidiaries sponsor, and their funding status, obligations and plan asset fair values(in millions):
PostretirementPension Benefits Benefits
As of December 31,
2014 2013 2014 2013
Amounts recognized in the balance sheet:Accrued liabilities $ — $ — $ — $ (1)Other long-term liabilities (21) (12) (68) (62)
$ (21) $ (12) $ (68) $ (63)
AOCI included the following after-tax balances:Net loss $ 22 $ 19 $ 2 $ 4
89
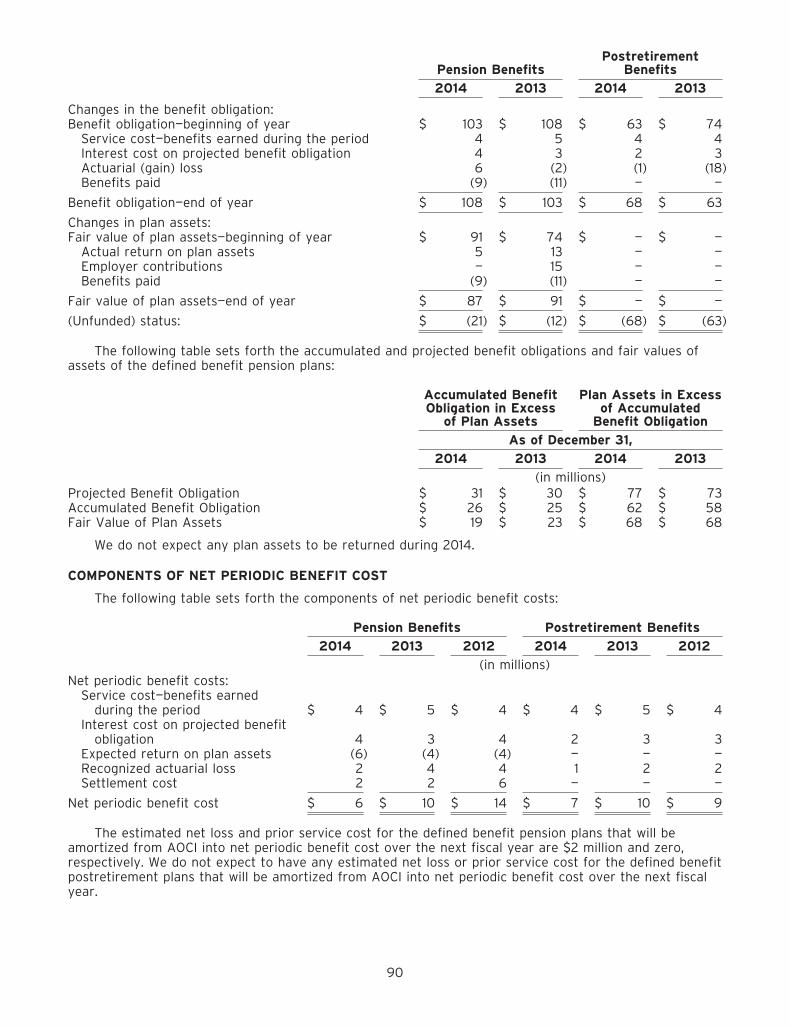
PostretirementPension Benefits Benefits
2014 2013 2014 2013
Changes in the benefit obligation:Benefit obligation—beginning of year $ 103 $ 108 $ 63 $ 74
Service cost—benefits earned during the period 4 5 4 4Interest cost on projected benefit obligation 4 3 2 3Actuarial (gain) loss 6 (2) (1) (18)Benefits paid (9) (11) — —
Benefit obligation—end of year $ 108 $ 103 $ 68 $ 63
Changes in plan assets:Fair value of plan assets—beginning of year $ 91 $ 74 $ — $ —
Actual return on plan assets 5 13 — —Employer contributions — 15 — —Benefits paid (9) (11) — —
Fair value of plan assets—end of year $ 87 $ 91 $ — $ —
(Unfunded) status: $ (21) $ (12) $ (68) $ (63)
The following table sets forth the accumulated and projected benefit obligations and fair values ofassets of the defined benefit pension plans:
Accumulated Benefit Plan Assets in ExcessObligation in Excess of Accumulated
of Plan Assets Benefit Obligation
As of December 31,
2014 2013 2014 2013
(in millions)Projected Benefit Obligation $ 31 $ 30 $ 77 $ 73Accumulated Benefit Obligation $ 26 $ 25 $ 62 $ 58Fair Value of Plan Assets $ 19 $ 23 $ 68 $ 68
We do not expect any plan assets to be returned during 2014.
COMPONENTS OF NET PERIODIC BENEFIT COST
The following table sets forth the components of net periodic benefit costs:
Pension Benefits Postretirement Benefits
2014 2013 2012 2014 2013 2012
(in millions)Net periodic benefit costs:
Service cost—benefits earnedduring the period $ 4 $ 5 $ 4 $ 4 $ 5 $ 4
Interest cost on projected benefitobligation 4 3 4 2 3 3
Expected return on plan assets (6) (4) (4) — — —Recognized actuarial loss 2 4 4 1 2 2Settlement cost 2 2 6 — — —
Net periodic benefit cost $ 6 $ 10 $ 14 $ 7 $ 10 $ 9
The estimated net loss and prior service cost for the defined benefit pension plans that will beamortized from AOCI into net periodic benefit cost over the next fiscal year are $2 million and zero,respectively. We do not expect to have any estimated net loss or prior service cost for the defined benefitpostretirement plans that will be amortized from AOCI into net periodic benefit cost over the next fiscalyear.
90

The following table sets forth the weighted-average assumptions used to determine our benefitobligations and net periodic benefit cost:
PostretirementPension Benefits Benefits
For the years endedDecember 31,
2014 2013 2014 2013
Benefit Obligation Assumptions:Discount rate 3.82% 4.45% 4.44% 4.75%Rate of compensation increase 4.00% 4.00% — —
Net Periodic Benefit Cost Assumptions:Discount rate 4.45% 3.59% 4.75% 3.89%Assumed long term rate of return on assets 6.50% 6.50% — —Rate of compensation increase 4.00% 4.00% — —
For pension plans and postretirement benefit plans that we or our subsidiaries sponsor, we based thediscount rate on the Aon/Hewitt AA Above Median yield curve in 2014 and the Aon/Hewitt AA-AAAUniverse yield curve in 2013. The weighted-average rate of increase in future compensation levels isconsistent with our past and anticipated future compensation increases for employees participating inretirement plans that determine benefits using compensation. The assumed long-term rate of return onassets is estimated with regard to current market factors but within the context of historical returns forthe asset mix that exists at year end.
Effective in 2014, we adopted the Society of Actuaries 20014 Mortality Tables Report and MortalityImprovement Scale, which updated the mortality assumptions that private defined benefit pension plans inthe United States use in the actuarial valuations that determine a plan sponsor’s pension andpostretirement obligations. The updated mortality data reflects increasing life expectancies in the UnitedStates, and affected plans generally expect the value of the actuarial obligations to increase, dependingon the specific demographic characteristics of the plan participants and the types of benefits. Thechanges in the mortality assumptions resulted in an increase of $2 million and $7 million in the pensionand postretirement benefit obligation, respectively, at December 31, 2014.
The postretirement benefit obligation was determined by application of the terms of medical anddental benefits and life insurance coverage, including the effect of established maximums on coveredcosts, together with relevant actuarial assumptions and healthcare cost trend rates projected at anassumed U.S. Consumer Price Index (CPI) increase of 1.79% and 2.36% as of December 31, 2014 and 2013,respectively. Under the terms of our postretirement plans, participants other than certain unionemployees pay for all medical cost increases in excess of increases in the CPI. For those union employees,we projected that healthcare cost trend rates would decrease 0.25 percent per year from 7.75 percent in2014 until they reach 5.0% in 2025, and remain at 5.0% thereafter. A 1-percent increase or a 1-percentdecrease in these assumed healthcare cost trend rates would result in an increase of $6 million or areduction of $5 million, respectively, in the postretirement benefit obligation as of December 31, 2014. Theannual service and interest costs would not be materially affected by these changes.
The actuarial assumptions used could change in the near term as a result of changes in expectedfuture trends and other factors that, depending on the nature of the changes, could cause increases ordecreases in the plan assets and liabilities.
Fair Value of Pension Plan Assets
We employ a total return investment approach that uses a diversified blend of equity and fixed-income investments to optimize the long-term return of plan assets at a prudent level of risk. Theinvestments were monitored by Occidental’s Investment Committee in its role as fiduciary throughNovember 30, 2014, and by our Investment Committee thereafter. Equity investments were diversifiedacross United States and non-United States stocks, as well as differing styles and market capitalizations.Other asset classes, such as private equity and real estate, may have been used with the goals ofenhancing long-term returns and improving portfolio diversification. The target allocation of plan assetswas 65% equity securities and 35% debt securities. Investment performance was measured andmonitored on an ongoing basis through quarterly investment portfolio and manager guideline compliancereviews, annual liability measurements and periodic studies.
91

The fair values of our pension plan assets by asset category are as follows (in millions):
Fair Value Measurements at December 31, 2014Using
Level 1 Level 2 Level 3 Total
Asset Class:Commingled funds:
Fixed income $ — $ 20 $ — $ 20U.S. equity — 31 — 31International equity — 17 — 17
Mutual funds:Bond funds 5 — — 5Blend funds 2 — — 2Value funds 2 — — 2Growth funds 3 — — 3
Guaranteed deposit account — — 7 7
Total pension plan assets $ 12 $ 68 $ 7 $ 87
Fair Value Measurements at December 31, 2013Using
Level 1 Level 2 Level 3 Total
Asset Class:Master trust investment account(a) $ — $ 69 $ — $ 69Mutual funds:
Bond funds 5 — — 5Blend funds 3 — — 3Value funds 3 — — 3Growth funds 3 — — 3
Guaranteed deposit account — — 9 9
Total pension plan assets(b) $ 14 $ 69 $ 9 $ 92
(a) Represents our investment in a master trust investment account established by Occidental. The trust investments includecommon stock, preferred stock, publicly registered mutual funds, U.S. government securities and corporate bonds.
(b) Amounts exclude net payables of approximately $1 million.
92

The activity during the years ended December 31, 2014 and 2013, for the assets using Level 3 fairvalue measurements was insignificant. We expect to contribute $3 million to our defined benefit pensionplans during 2015.
Estimated future benefit payments, which reflect expected future service, as appropriate, are asfollows:
Pension PostretirementFor the years ended December 31, Benefits Benefits
(in millions)2015 $ 15 $ —2016 $ 9 $ 12017 $ 8 $ 12018 $ 10 $ 22019 $ 9 $ 22020 - 2024 $ 44 $ 17
NOTE 15 RELATED-PARTY TRANSACTIONS
During 2014, 2013 and 2012, we entered into the following related-party transactions:
2014 2013 2012
(in millions)Sales(a) $ 2,706 $ 4,174 $ 3,970Allocated costs for services provided by affiliates $ 126 $ 146 $ 129Purchases $ 175 $ 164 $ 119
(a) Amounts include related-party sales from our Elk Hills power plant of $89 million, $120 million and $92 million during2014, 2013 and 2012, respectively. These sales are included in other revenue in the statements of operations.
Through July 2014, substantially all of our products were sold through Occidental’s marketingsubsidiaries at market prices and were settled at the time of sale to those entities. Beginning August2014, we started marketing our own products directly to third parties. For the years ended December 31,2014, 2013 and 2012, sales to Occidental subsidiaries accounted for approximately 65%, 97% and 97% ofour net sales, respectively.
The statements of operations include expense allocations for certain corporate functions andcentrally-located activities performed by Occidental prior to the Spin-off. These functions includeexecutive oversight, accounting, treasury, tax, financial reporting, internal audit, legal, risk management,information technology, government relations, public relations, investor relations, human resources,procurement, engineering, drilling, exploration, finance, marketing, ethics and compliance, and certainother shared services. Charges from Occidental for these services are generally reflected in selling,general and administrative expenses and also include employee-related costs such as salaries, bonusesand stock compensation costs.
Purchases from related parties reflect products purchased at market prices from Occidental’ssubsidiaries and used in our operations. These purchases are included in production costs. There were nosignificant related-party receivable or payable balances at December 31, 2014, 2013 and 2012.
93

Quarterly Financial Data (Unaudited)
2014 2013
Quarter First Second Third Fourth First Second Third Fourth
(in millions, except per share amounts)Revenues $ 1,121 $ 1,140 $ 1,092 $ 820 $ 1,047 $ 1,051 $ 1,107 $ 1,079
Gross profit 865 878 830 577 812 813 863 836
Net income / (loss)(a) $ 223 $ 246 $ 188 $ (2,091) $ 217 $ 205 $ 235 $ 212
Net income / (loss) pershare(b):Basic $ 0.57 $ 0.63 $ 0.48 $ (5.47) $ 0.56 $ 0.53 $ 0.61 $ 0.55
Diluted $ 0.57 $ 0.63 $ 0.48 $ (5.47) $ 0.56 $ 0.53 $ 0.61 $ 0.55
(a) For the quarter ended December 31, 2014, amount includes after-tax non-cash charges consisting of $2.0 billion of assetimpairments, $31 million of rig termination and other price-related costs, and $33 million of Spin-off and transition relatedcosts.
(b) For comparative purposes, and to provide a more meaningful calculation for weighted-average shares, we assumed theshares distributed to Occidental stockholders in conjunction with the Spin-off were outstanding at the beginning of eachperiod prior to the Spin-off.
94
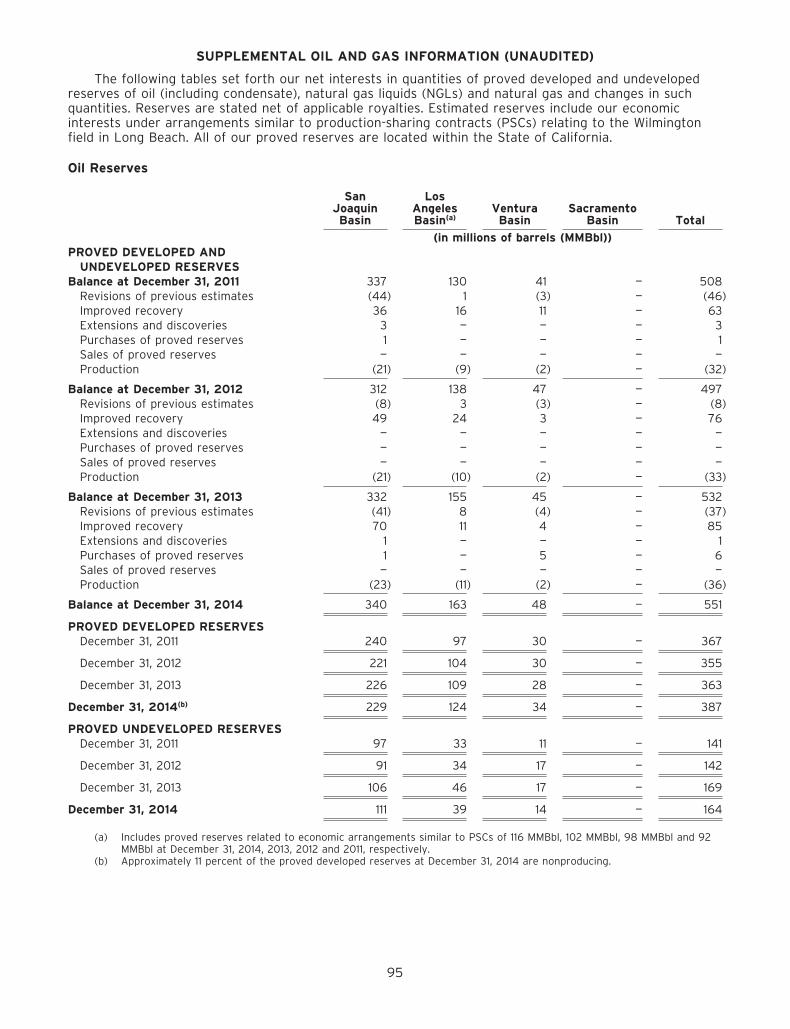
SUPPLEMENTAL OIL AND GAS INFORMATION (UNAUDITED)
The following tables set forth our net interests in quantities of proved developed and undevelopedreserves of oil (including condensate), natural gas liquids (NGLs) and natural gas and changes in suchquantities. Reserves are stated net of applicable royalties. Estimated reserves include our economicinterests under arrangements similar to production-sharing contracts (PSCs) relating to the Wilmingtonfield in Long Beach. All of our proved reserves are located within the State of California.
Oil Reserves
San LosJoaquin Angeles Ventura SacramentoBasin Basin(a) Basin Basin Total
(in millions of barrels (MMBbl))PROVED DEVELOPED AND
UNDEVELOPED RESERVESBalance at December 31, 2011 337 130 41 — 508
Revisions of previous estimates (44) 1 (3) — (46)Improved recovery 36 16 11 — 63Extensions and discoveries 3 — — — 3Purchases of proved reserves 1 — — — 1Sales of proved reserves — — — — —Production (21) (9) (2) — (32)
Balance at December 31, 2012 312 138 47 — 497Revisions of previous estimates (8) 3 (3) — (8)Improved recovery 49 24 3 — 76Extensions and discoveries — — — — —Purchases of proved reserves — — — — —Sales of proved reserves — — — — —Production (21) (10) (2) — (33)
Balance at December 31, 2013 332 155 45 — 532Revisions of previous estimates (41) 8 (4) — (37)Improved recovery 70 11 4 — 85Extensions and discoveries 1 — — — 1Purchases of proved reserves 1 — 5 — 6Sales of proved reserves — — — — —Production (23) (11) (2) — (36)
Balance at December 31, 2014 340 163 48 — 551
PROVED DEVELOPED RESERVESDecember 31, 2011 240 97 30 — 367
December 31, 2012 221 104 30 — 355
December 31, 2013 226 109 28 — 363
December 31, 2014(b) 229 124 34 — 387
PROVED UNDEVELOPED RESERVESDecember 31, 2011 97 33 11 — 141
December 31, 2012 91 34 17 — 142
December 31, 2013 106 46 17 — 169
December 31, 2014 111 39 14 — 164
(a) Includes proved reserves related to economic arrangements similar to PSCs of 116 MMBbl, 102 MMBbl, 98 MMBbl and 92MMBbl at December 31, 2014, 2013, 2012 and 2011, respectively.
(b) Approximately 11 percent of the proved developed reserves at December 31, 2014 are nonproducing.
95

NGLs Reserves
San LosJoaquin Angeles Ventura SacramentoBasin Basin Basin Basin Total
(in MMBbl)PROVED DEVELOPED AND
UNDEVELOPED RESERVESBalance at December 31, 2011 66 — 2 — 68
Revisions of previous estimates (14) — — — (14)Improved recovery 12 — 1 — 13Extensions and discoveries — — — — —Purchases of proved reserves — — — — —Sales of proved reserves — — — — —Production (6) — — — (6)
Balance at December 31, 2012 58 — 3 — 61Revisions of previous estimates 13 — — — 13Improved recovery 4 — — — 4Extensions and discoveries — — — — —Purchases of proved reserves — — — — —Sales of proved reserves — — — — —Production (7) — — — (7)
Balance at December 31, 2013 68 — 3 — 71Revisions of previous estimates 8 — — — 8Improved recovery 13 — — — 13Extensions and discoveries — — — — —Purchases of proved reserves — — — — —Sales of proved reserves — — — — —Production (7) — — — (7)
Balance at December 31, 2014 82 — 3 — 85
PROVED DEVELOPED RESERVESDecember 31, 2011 42 — 2 — 44
December 31, 2012 42 — 1 — 43
December 31, 2013 47 — 1 — 48
December 31, 2014(a) 62 — 2 — 64
PROVED UNDEVELOPED RESERVESDecember 31, 2011 24 — — — 24
December 31, 2012 16 — 2 — 18
December 31, 2013 21 — 2 — 23
December 31, 2014 20 — 1 — 21
(a) Approximately 5 percent of the proved developed reserves at December 31, 2014 are nonproducing.
96
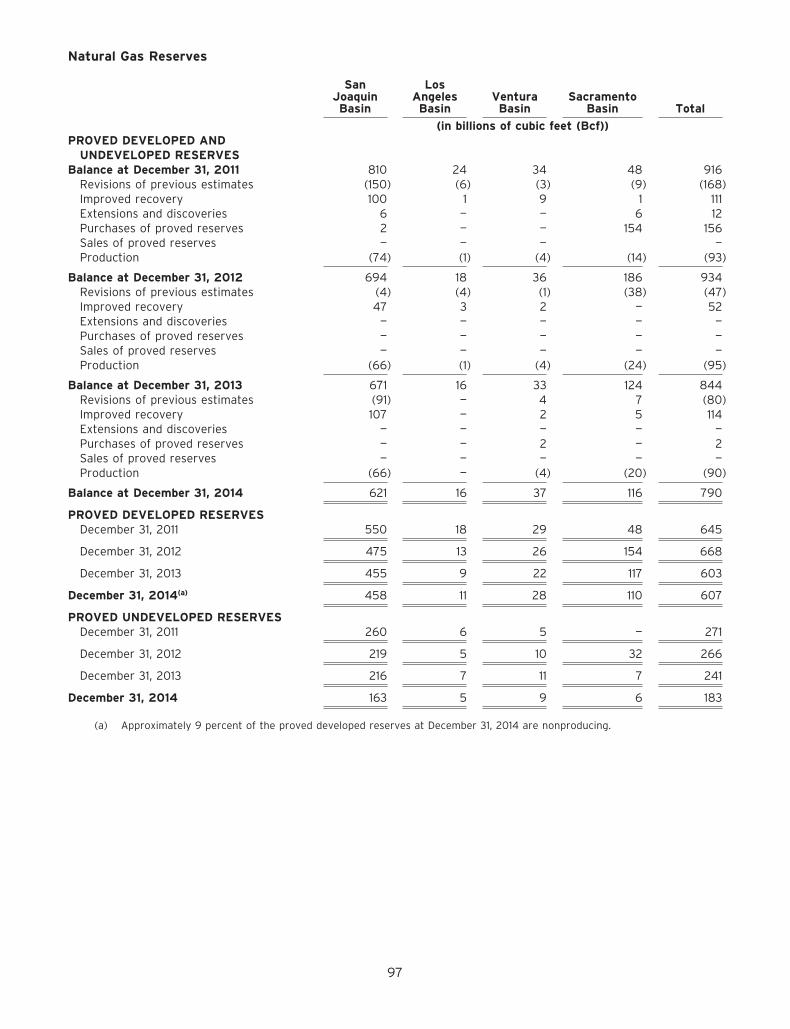
Natural Gas Reserves
San LosJoaquin Angeles Ventura SacramentoBasin Basin Basin Basin Total
(in billions of cubic feet (Bcf))PROVED DEVELOPED AND
UNDEVELOPED RESERVESBalance at December 31, 2011 810 24 34 48 916
Revisions of previous estimates (150) (6) (3) (9) (168)Improved recovery 100 1 9 1 111Extensions and discoveries 6 — — 6 12Purchases of proved reserves 2 — — 154 156Sales of proved reserves — — — —Production (74) (1) (4) (14) (93)
Balance at December 31, 2012 694 18 36 186 934Revisions of previous estimates (4) (4) (1) (38) (47)Improved recovery 47 3 2 — 52Extensions and discoveries — — — — —Purchases of proved reserves — — — — —Sales of proved reserves — — — — —Production (66) (1) (4) (24) (95)
Balance at December 31, 2013 671 16 33 124 844Revisions of previous estimates (91) — 4 7 (80)Improved recovery 107 — 2 5 114Extensions and discoveries — — — — —Purchases of proved reserves — — 2 — 2Sales of proved reserves — — — — —Production (66) — (4) (20) (90)
Balance at December 31, 2014 621 16 37 116 790
PROVED DEVELOPED RESERVESDecember 31, 2011 550 18 29 48 645
December 31, 2012 475 13 26 154 668
December 31, 2013 455 9 22 117 603
December 31, 2014(a) 458 11 28 110 607
PROVED UNDEVELOPED RESERVESDecember 31, 2011 260 6 5 — 271
December 31, 2012 219 5 10 32 266
December 31, 2013 216 7 11 7 241
December 31, 2014 163 5 9 6 183
(a) Approximately 9 percent of the proved developed reserves at December 31, 2014 are nonproducing.
97

Total Reserves
San LosJoaquin Angeles Ventura SacramentoBasin Basin(b) Basin Basin Total
(in MMBoe(a))PROVED DEVELOPED AND
UNDEVELOPED RESERVESBalance at December 31, 2011 537 134 52 6 729
Revisions of previous estimates (83) — (4) (1) (88)Improved recovery 65 16 13 — 94Extensions and discoveries 5 — 1 1 7Purchases of proved reserves 1 — — 25 26Sales of proved reserves — — — — —Production (39) (9) (4) (2) (54)
Balance at December 31, 2012 486 141 58 29 714Revisions of previous estimates 4 2 (3) (6) (3)Improved recovery 61 25 3 — 89Extensions and discoveries — — — — —Purchases of proved reserves — — — — —Sales of proved reserves — — — — —Production (40) (10) (3) (3) (56)
Balance at December 31, 2013 511 158 55 20 744Revisions of previous estimates (48) 8 (3) 1 (42)Improved recovery 101 11 4 1 117Extensions and discoveries 1 — — — 1Purchases of proved reserves 1 — 5 — 6Sales of proved reserves — — — — —Production (41) (11) (3) (3) (58)
Balance at December 31, 2014 525 166 58 19 768
PROVED DEVELOPED RESERVESDecember 31, 2011 372 99 40 6 517
December 31, 2012 341 105 38 24 508
December 31, 2013 349 110 35 20 514
December 31, 2014(c) 367 126 41 18 552
PROVED UNDEVELOPED RESERVESDecember 31, 2011 165 35 12 — 212
December 31, 2012 145 36 20 5 206
December 31, 2013 162 48 20 — 230
December 31, 2014 158 40 17 1 216
(a) Natural gas volumes have been converted to Boe based on the equivalence of energy content between six Mcf of naturalgas to one Bbl of oil. Barrels of oil equivalence does not necessarily result in price equivalence. The price of natural gason a barrel of oil equivalent basis is currently substantially lower than the corresponding price for oil and has beensimilarly lower for a number of years. For example, in 2014, the average prices of Brent oil and NYMEX natural gas were$99.51 per Bbl and $4.34 per Mcf, respectively, resulting in an oil-to-gas price ratio of approximately 23 to 1.
(b) Includes proved reserves related to economic arrangements similar to PSCs of 116 MMBbl, 102 MMBbl, 98 MMBbl and 92MMBbl at December 31, 2014, 2013, 2012 and 2011, respectively.
(c) Approximately 10 percent of the proved developed reserves at December 31, 2014 are nonproducing.
98
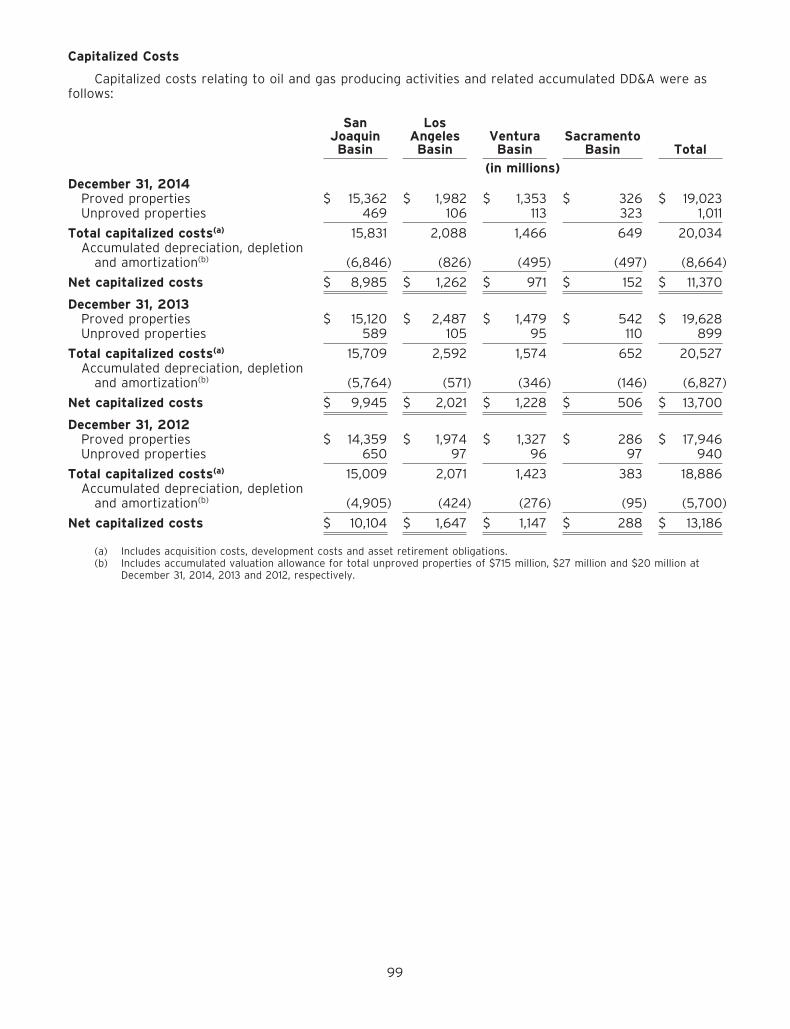
Capitalized Costs
Capitalized costs relating to oil and gas producing activities and related accumulated DD&A were asfollows:
San LosJoaquin Angeles Ventura SacramentoBasin Basin Basin Basin Total
(in millions)December 31, 2014
Proved properties $ 15,362 $ 1,982 $ 1,353 $ 326 $ 19,023Unproved properties 469 106 113 323 1,011
Total capitalized costs(a) 15,831 2,088 1,466 649 20,034Accumulated depreciation, depletion
and amortization(b) (6,846) (826) (495) (497) (8,664)
Net capitalized costs $ 8,985 $ 1,262 $ 971 $ 152 $ 11,370
December 31, 2013Proved properties $ 15,120 $ 2,487 $ 1,479 $ 542 $ 19,628Unproved properties 589 105 95 110 899
Total capitalized costs(a) 15,709 2,592 1,574 652 20,527Accumulated depreciation, depletion
and amortization(b) (5,764) (571) (346) (146) (6,827)
Net capitalized costs $ 9,945 $ 2,021 $ 1,228 $ 506 $ 13,700
December 31, 2012Proved properties $ 14,359 $ 1,974 $ 1,327 $ 286 $ 17,946Unproved properties 650 97 96 97 940
Total capitalized costs(a) 15,009 2,071 1,423 383 18,886Accumulated depreciation, depletion
and amortization(b) (4,905) (424) (276) (95) (5,700)
Net capitalized costs $ 10,104 $ 1,647 $ 1,147 $ 288 $ 13,186
(a) Includes acquisition costs, development costs and asset retirement obligations.(b) Includes accumulated valuation allowance for total unproved properties of $715 million, $27 million and $20 million at
December 31, 2014, 2013 and 2012, respectively.
99

Costs Incurred
Costs incurred includes capital investments, exploration (whether expensed or capitalized),acquisitions, and asset retirement obligations, as follows:
San LosJoaquin Angeles Ventura SacramentoBasin Basin Basin Basin Total
(in millions)FOR THE YEAR ENDED DECEMBER 31, 2014
Property acquisition costsProved properties $ 79 $ 3 $ 128 $ — $ 210Unproved properties 21 — 81 — 102
Exploration costs 105 — 14 5 124Development costs 1,356 495 99 12 1,962
Costs incurred $ 1,561 $ 498 $ 322 $ 17 $ 2,398
FOR THE YEAR ENDED DECEMBER 31, 2013Property acquisition costs
Proved properties $ 14 $ 1 $ — $ 5 $ 20Unproved properties 23 9 1 — 33
Exploration costs 127 — 1 3 131Development costs 1,078 371 110 15 1,574
Costs incurred $ 1,242 $ 381 $ 112 $ 23 $ 1,758
FOR THE YEAR ENDED DECEMBER 31, 2012Property acquisition costs
Proved properties $ 83 $ 8 $ — $ 274 $ 365Unproved properties 30 1 — 10 41
Exploration costs 153 4 1 1 159Development costs 1,721 348 124 26 2,219
Costs incurred $ 1,987 $ 361 $ 125 $ 311 $ 2,784
100

Results of Operations
Our oil and gas producing activities, which exclude items such as asset dispositions and corporateoverhead, were as follows:
San LosJoaquin Angeles Ventura SacramentoBasin Basin Basin Basin Total
(in millions)FOR THE YEAR ENDED DECEMBER 31, 2014
Revenues(a) $ 2,735 $ 956 $ 244 $ 88 $ 4,023Production costs(b) 579 330 89 25 1,023General and administrative expenses(c) 76 42 11 11 140Other operating expenses(d) 44 21 16 5 86Depreciation, depletion and amortization 875 148 79 81 1,183Taxes other than on income 140 49 8 6 203Asset impairments(e) 1,266 1,110 437 589 3,402Exploration expenses(f) 125 — 9 5 139
Pretax income (370) (744) (405) (634) (2,153)Income tax benefit (151) (304) (165) (259) (879)
Results of operations $ (219) $ (440) $ (240) $ (375) $ (1,274)
FOR THE YEAR ENDED DECEMBER 31, 2013Revenues(a) $ 2,823 $ 968 $ 259 $ 89 $ 4,139Production costs(b) 552 306 75 27 960General and administrative expenses 74 36 9 13 132Other operating expenses 21 8 3 2 34Depreciation, depletion and amortization 851 108 73 97 1,129Taxes other than on income 109 43 9 10 171Exploration expenses 94 1 13 8 116
Pretax income 1,122 466 77 (68) 1,597Income tax expense / (benefit) 447 185 31 (27) 636
Results of operations $ 675 $ 281 $ 46 $ (41) $ 961
FOR THE YEAR ENDED DECEMBER 31, 2012Revenues(a) $ 2,738 $ 921 $ 262 $ 46 $ 3,967Production costs(b) 790 331 81 17 1,219General and administrative expenses 73 44 10 7 134Other operating expenses(d) 26 — 2 2 30Depreciation, depletion and amortization 724 79 61 44 908Taxes other than on income 114 37 9 7 167Asset impairments 19 10 — — 29Exploration expenses 112 29 1 6 148
Pretax income 880 391 98 (37) 1,332Income tax expense / (benefit) 359 160 40 (15) 544
Results of operations $ 521 $ 231 $ 58 $ (22) $ 788
(a) Revenues are net of royalty payments.(b) Production costs are the costs incurred in lifting the oil and natural gas to the surface and include gathering, processing,
field storage and insurance on proved properties, but do not include DD&A, royalties, income taxes and general andadministrative expenses.
(c) Includes unusual and infrequent costs related to Spin-off and transition related costs of $6 million in total.(d) For 2014, the total amounts include unusual and infrequent costs related to rig termination charges and Spin-off and
transition related costs totaling $55 million. For 2012, the total amounts include rig termination charges of $12 million.(e) At year end 2014, we recorded pre-tax asset impairment charges of $3.4 billion on certain proved and unproved
properties in the San Joaquin, Los Angeles, Ventura and Sacramento basins.(f) Includes $21 million of unusual and infrequent costs related to dry holes and seismic charges.
101
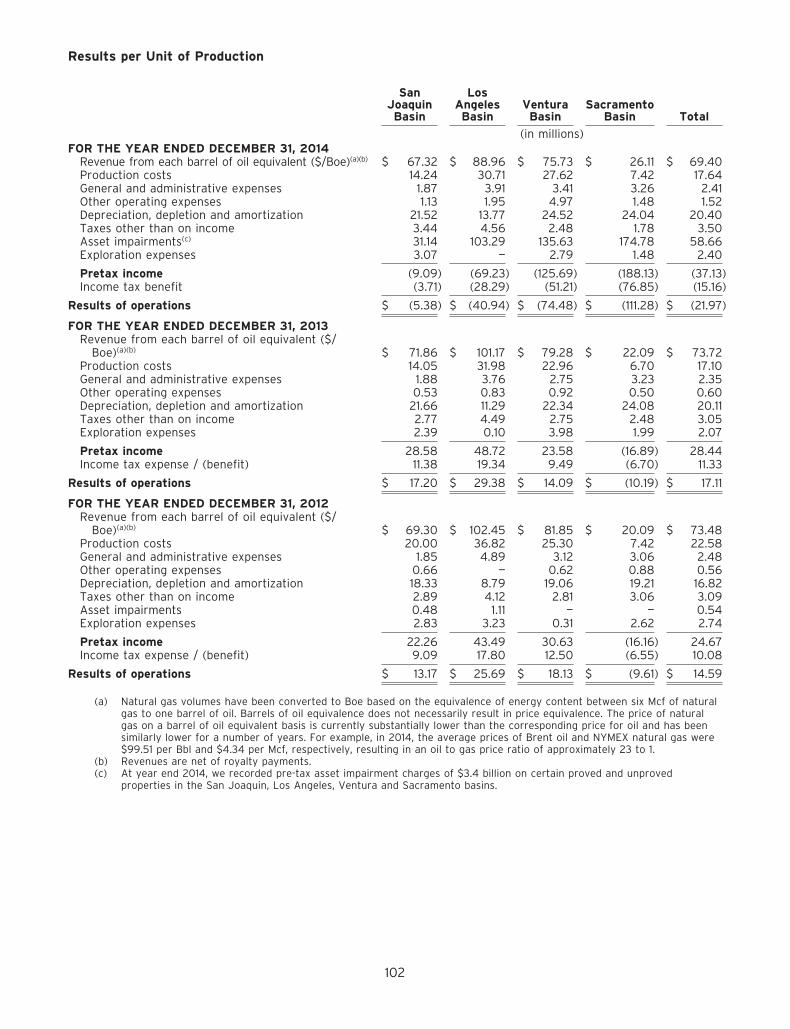
Results per Unit of Production
San LosJoaquin Angeles Ventura SacramentoBasin Basin Basin Basin Total
(in millions)FOR THE YEAR ENDED DECEMBER 31, 2014
Revenue from each barrel of oil equivalent ($/Boe)(a)(b) $ 67.32 $ 88.96 $ 75.73 $ 26.11 $ 69.40Production costs 14.24 30.71 27.62 7.42 17.64General and administrative expenses 1.87 3.91 3.41 3.26 2.41Other operating expenses 1.13 1.95 4.97 1.48 1.52Depreciation, depletion and amortization 21.52 13.77 24.52 24.04 20.40Taxes other than on income 3.44 4.56 2.48 1.78 3.50Asset impairments(c) 31.14 103.29 135.63 174.78 58.66Exploration expenses 3.07 — 2.79 1.48 2.40
Pretax income (9.09) (69.23) (125.69) (188.13) (37.13)Income tax benefit (3.71) (28.29) (51.21) (76.85) (15.16)
Results of operations $ (5.38) $ (40.94) $ (74.48) $ (111.28) $ (21.97)
FOR THE YEAR ENDED DECEMBER 31, 2013Revenue from each barrel of oil equivalent ($/
Boe)(a)(b) $ 71.86 $ 101.17 $ 79.28 $ 22.09 $ 73.72Production costs 14.05 31.98 22.96 6.70 17.10General and administrative expenses 1.88 3.76 2.75 3.23 2.35Other operating expenses 0.53 0.83 0.92 0.50 0.60Depreciation, depletion and amortization 21.66 11.29 22.34 24.08 20.11Taxes other than on income 2.77 4.49 2.75 2.48 3.05Exploration expenses 2.39 0.10 3.98 1.99 2.07
Pretax income 28.58 48.72 23.58 (16.89) 28.44Income tax expense / (benefit) 11.38 19.34 9.49 (6.70) 11.33
Results of operations $ 17.20 $ 29.38 $ 14.09 $ (10.19) $ 17.11
FOR THE YEAR ENDED DECEMBER 31, 2012Revenue from each barrel of oil equivalent ($/
Boe)(a)(b) $ 69.30 $ 102.45 $ 81.85 $ 20.09 $ 73.48Production costs 20.00 36.82 25.30 7.42 22.58General and administrative expenses 1.85 4.89 3.12 3.06 2.48Other operating expenses 0.66 — 0.62 0.88 0.56Depreciation, depletion and amortization 18.33 8.79 19.06 19.21 16.82Taxes other than on income 2.89 4.12 2.81 3.06 3.09Asset impairments 0.48 1.11 — — 0.54Exploration expenses 2.83 3.23 0.31 2.62 2.74
Pretax income 22.26 43.49 30.63 (16.16) 24.67Income tax expense / (benefit) 9.09 17.80 12.50 (6.55) 10.08
Results of operations $ 13.17 $ 25.69 $ 18.13 $ (9.61) $ 14.59
(a) Natural gas volumes have been converted to Boe based on the equivalence of energy content between six Mcf of naturalgas to one barrel of oil. Barrels of oil equivalence does not necessarily result in price equivalence. The price of naturalgas on a barrel of oil equivalent basis is currently substantially lower than the corresponding price for oil and has beensimilarly lower for a number of years. For example, in 2014, the average prices of Brent oil and NYMEX natural gas were$99.51 per Bbl and $4.34 per Mcf, respectively, resulting in an oil to gas price ratio of approximately 23 to 1.
(b) Revenues are net of royalty payments.(c) At year end 2014, we recorded pre-tax asset impairment charges of $3.4 billion on certain proved and unproved
properties in the San Joaquin, Los Angeles, Ventura and Sacramento basins.
102
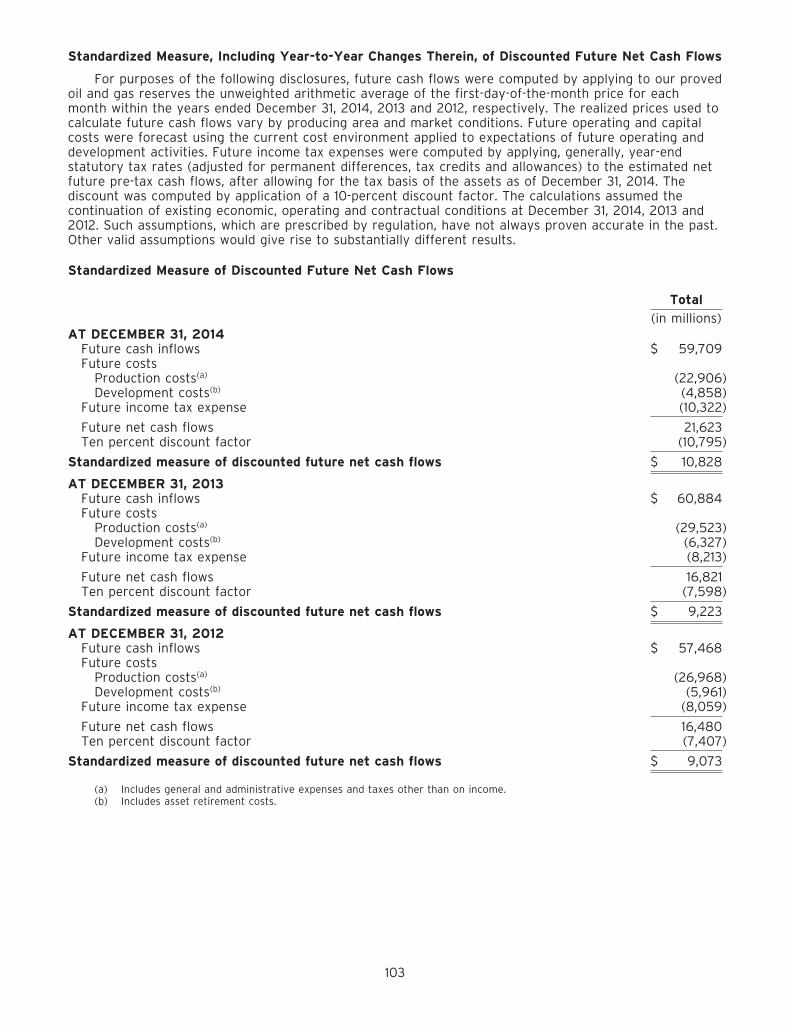
Standardized Measure, Including Year-to-Year Changes Therein, of Discounted Future Net Cash Flows
For purposes of the following disclosures, future cash flows were computed by applying to our provedoil and gas reserves the unweighted arithmetic average of the first-day-of-the-month price for eachmonth within the years ended December 31, 2014, 2013 and 2012, respectively. The realized prices used tocalculate future cash flows vary by producing area and market conditions. Future operating and capitalcosts were forecast using the current cost environment applied to expectations of future operating anddevelopment activities. Future income tax expenses were computed by applying, generally, year-endstatutory tax rates (adjusted for permanent differences, tax credits and allowances) to the estimated netfuture pre-tax cash flows, after allowing for the tax basis of the assets as of December 31, 2014. Thediscount was computed by application of a 10-percent discount factor. The calculations assumed thecontinuation of existing economic, operating and contractual conditions at December 31, 2014, 2013 and2012. Such assumptions, which are prescribed by regulation, have not always proven accurate in the past.Other valid assumptions would give rise to substantially different results.
Standardized Measure of Discounted Future Net Cash Flows
Total
(in millions)AT DECEMBER 31, 2014
Future cash inflows $ 59,709Future costs
Production costs(a) (22,906)Development costs(b) (4,858)
Future income tax expense (10,322)
Future net cash flows 21,623Ten percent discount factor (10,795)
Standardized measure of discounted future net cash flows $ 10,828
AT DECEMBER 31, 2013Future cash inflows $ 60,884Future costs
Production costs(a) (29,523)Development costs(b) (6,327)
Future income tax expense (8,213)
Future net cash flows 16,821Ten percent discount factor (7,598)
Standardized measure of discounted future net cash flows $ 9,223
AT DECEMBER 31, 2012Future cash inflows $ 57,468Future costs
Production costs(a) (26,968)Development costs(b) (5,961)
Future income tax expense (8,059)
Future net cash flows 16,480Ten percent discount factor (7,407)
Standardized measure of discounted future net cash flows $ 9,073
(a) Includes general and administrative expenses and taxes other than on income.(b) Includes asset retirement costs.
103

Changes in the Standardized Measure of Discounted Future Net Cash Flows From Proved ReserveQuantities
For the years ended December 31,
2014 2013 2012
(in millions)Beginning of year $ 9,223 $ 9,073 $ 10,347
Sales and transfers of oil and natural gas produced, net ofproduction costs and other operating expenses (2,658) (3,082) (2,695)
Net change in prices received per Bbl, net of production costsand other operating expenses 567 575 (1,431)
Extensions, discoveries and improved recovery, net of futureproduction and development costs 2,593 1,914 1,897
Change in estimated future development costs 75 (688) (1,526)Revisions of quantity estimates (925) (62) (1,405)Previously estimated development costs incurred during the
period 1,440 1,185 1,039Accretion of discount 1,324 1,292 1,512Net change in income taxes (468) (95) 984Purchases and sales of reserves in place, net 125 4 221Changes in production rates and other (468) (893) 130
Net change 1,605 150 (1,274)
End of year $ 10,828 $ 9,223 $ 9,073
104

Oil, NGLs and Natural Gas Production Per Day
The following table set forth the production volumes of oil, NGLs and natural gas per day for each ofthe three years in the period ended December 31, 2014.
2014 2013 2012
Oil (MBbl/d)San Joaquin Basin(b) 64 58 58Los Angeles Basin(c) 29 26 24Ventura Basin 6 6 6Sacramento Basin — — —
Total 99 90 88
NGLs (MBbl/d)San Joaquin Basin(b) 18 19 16Los Angeles Basin — — —Ventura Basin 1 1 1Sacramento Basin — — —
Total 19 20 17
Natural gas (MMcf/d)San Joaquin Basin(b) 180 182 204Los Angeles Basin(c) 1 2 3Ventura Basin 11 11 12Sacramento Basin 54 65 37
Total 246 260 256
Total Production (MBoe/d)(a) 159 154 148
(a) Natural gas volumes have been converted to Boe based on the equivalence of energy content between six Mcf of naturalgas to one barrel of oil. Barrels of oil equivalence does not necessarily result in price equivalence. The price of naturalgas on a barrel of oil equivalent basis is currently substantially lower than the corresponding price for oil and has beensimilarly lower for a number of years. For example, in 2014, the average prices of Brent oil and NYMEX natural gas were$99.51 per Bbl and $4.34 per Mcf, respectively, resulting in an oil to gas price ratio of approximately 23 to 1.
(b) Includes daily production from Elk Hills field of 25 MBbl oil, 16 MBbl NGLs and 136 MMcf natural gas in 2014; 26 MBbl oil,18 MBbl NGLs and 145 MMcf natural gas in 2013; and 29 MBbl oil, 15 MBbl NGLs and 168 MMcf natural gas in 2012.
(c) Includes daily production from Wilmington field of 25 MBbl Oil in 2014; 22 MBbl Oil in 2013; and 21 MBbl Oil in 2012.
105

ITEM 9 CHANGES IN AND DISAGREEMENTS WITH ACCOUNTANTS ON ACCOUNTING ANDFINANCIAL DISCLOSURE
None.
ITEM 9A CONTROLS AND PROCEDURES
Evaluation of Disclosure Controls and Procedures
Our management, with the participation of our chief executive officer (CEO) and chief financial officer(CFO), has evaluated the effectiveness of our disclosure controls and procedures (as defined inRules 13a-15(e) and 15d- 15(e) under the Securities Exchange Act of 1934, as amended (Exchange Act)), asof the end of the period covered by this Annual Report on Form 10-K. Based on that evaluation, our CEOand CFO have concluded that, as of December 31, 2014, our disclosure controls and procedures areeffective and are designed to provide reasonable assurance that information we are required to disclosein reports that we file or submit under the Exchange Act is recorded, processed, summarized, andreported within the time periods specified in the rules and forms of the Securities and ExchangeCommission (SEC), and that such information is accumulated and communicated to our management,including our CEO and CFO, as appropriate, to allow timely decisions regarding required disclosure.
Changes in Internal Control
Until November 30, 2014 our internal control environment was administered by Occidental. As part ofthe Spin-off we assumed administration of our internal controls. Our environment as a stand-alonecompany including key personnel responsible for our key internal controls is substantially similar to thatadministered by Occidental.
There were no changes in our internal control over financial reporting (as defined in Rules 13a-15(f)and 15d-15(f) of the Exchange Act) identified in management’s evaluation pursuant to Rules 13a-15(d) or15d-15(d) of the Exchange Act during our fourth fiscal quarter that materially affected, or are reasonablylikely to materially affect, our internal control over financial reporting.
Management’s Report on Internal Control over Financial Reporting
The Annual Report on Form 10-K does not include a report of management’s assessment regardinginternal control over financial reporting or an attestation report of our independent registered publicaccounting firm due to a transition period established by the rules of the SEC for newly public companies.
Limitations on Effectiveness of Controls and Procedures
In designing and evaluating the disclosure controls and procedures, management recognizes that anycontrols and procedures, no matter how well designed and operated, can provide only reasonableassurance of achieving the desired control objectives.
ITEM 9B OTHER INFORMATION
None.
PART III
ITEM 10 DIRECTORS, EXECUTIVE OFFICERS AND CORPORATE GOVERNANCE
The information required by this item is incorporated by reference to our Proxy Statement for the2015 Annual Meeting of Stockholders to be filed with the Securities and Exchange Commission (SEC)within 120 days of the fiscal year ended December 31, 2014 where it appears under the caption‘‘Corporate Governance—General Overview,’’ ‘‘—Our Board of Directors,’’ ‘‘—Committees of the Board—AuditCommittee,’’ ‘‘Stock Ownership Information—Section 16(a) Beneficial Ownership Reporting Compliance’’and ‘‘Stockholder Proposals and Other Company Information—Stockholder Proposals and DirectorNominations.’’ The list of our executive officers and related information under ‘‘Executive Officers’’ setforth in Part I of this Annual Report on Form 10-K is incorporated by reference herein.
Our board of directors has adopted a code of business conduct applicable to all officers, directorsand employees, which is available on our website (www.crc.com). We intend to satisfy the disclosure
106

requirement under Item 5.05 of Form 8-K regarding amendment to, or waiver from, a provision of ourcode of business conduct by posting such information on our website at the address specified above.
ITEM 11 EXECUTIVE COMPENSATION
The information required by this item is incorporated by reference to our Proxy Statement for the2015 Annual Meeting of Stockholders to be filed with the SEC within 120 days of the fiscal year endedDecember 31, 2014 where it appears under the caption ‘‘Compensation Discussion and Analysis’’ and‘‘Compensation Committee Interlocks and Insider Participation.’’ Pursuant to the rules and regulationsunder the Exchange Act, the information under the caption ‘‘Compensation Discussion and Analysis—Compensation Committee Report’’ shall not be deemed to be ‘‘soliciting material,’’ or to be ‘‘filed’’ withthe SEC, or subject to Regulation 14A or 14C under the Exchange Act or to the liabilities under Section 18of the Exchange Act, nor shall it be deemed incorporated by reference into any filing under the SecuritiesAct of 1933.
ITEM 12 SECURITY OWNERSHIP OF CERTAIN BENEFICIAL OWNERS AND MANAGEMENT ANDRELATED STOCKHOLDER MATTERS
The information required by this item is incorporated by reference to our Proxy Statement for the2015 Annual Meeting of Stockholders to be filed with the SEC within 120 days of the fiscal year endedDecember 31, 2014 where it appears under the caption ‘‘Stock Ownership Information—Security Ownershipof Directors, Management and Certain Beneficial Holders. See also the information under ‘‘SecuritiesAuthorized for Issuance Under Equity Compensation Plans’’ in Part II, Item 5 of this report.
ITEM 13 CERTAIN RELATIONSHIPS AND RELATED TRANSACTIONS AND DIRECTORINDEPENDENCE
The information required by this item is incorporated by reference to our Proxy Statement for the2015 Annual Meeting of Stockholders to be filed with the SEC within 120 days of the fiscal year endedDecember 31, 2014 where it appears under the caption ‘‘Certain Relationships and Related Transactions’’(except under the subheading ‘‘—Policies and Procedures’’) and ‘‘Corporate Governance—DirectorIndependence Determinations.’’
ITEM 14 PRINCIPAL ACCOUNTANT FEES AND SERVICES
The information required by this item is incorporated by reference to our Proxy Statement for the2015 Annual Meeting of Stockholders to be filed with the SEC within 120 days of the fiscal year endedDecember 31, 2014 where it appears under the caption ‘‘Proposal 2: Ratification of the Appointment of theIndependent Registered Public Accounting Firm.’’
107

PART IV
ITEM 15 EXHIBITS
The agreements included as exhibits to this report are included to provide information about theirterms and not to provide any other factual or disclosure information about us or the other parties to theagreements. The agreements contain representations and warranties by each of the parties to theapplicable agreement that were made solely for the benefit of the other agreement parties and:
• should not be treated as categorical statements of fact, but rather as a way of allocating the riskamong the parties if those statements prove to be inaccurate;
• have been qualified by disclosures that were made to the other party in connection with thenegotiation of the applicable agreement, which disclosures are not necessarily reflected in theagreement;
• may apply standards of materiality in a way that is different from the way investors may viewmateriality; and
• were made only as of the date of the applicable agreement or such other date or dates as maybe specified in the agreement and are subject to more recent developments.
(a) (1) and (2). Financial Statements
Reference is made to Item 8 of the Table of Contents of this report where these documents arelisted.
(a) (3). Exhibits
ExhibitNumber Exhibit Description
2.1 Separation and Distribution Agreement between Occidental Petroleum Corporation andCalifornia Resources Corporation (filed as Exhibit 2.1 to Registrant’s Current Report onForm 8-K filed December 1, 2014 and incorporated herein by reference).
3.1 Amended and Restated Certificate of Incorporation of California Resources Corporation (filedas Exhibit 4.1 to the Registrant’s Registration Statement on Form S-8 filed November 26,2014 and incorporated herein by reference).
3.2 Amended and Restated Bylaws of California Resources Corporation (filed as Exhibit 4.2 tothe Registrant’s Registration Statement on Form S-8 filed November 26, 2014 andincorporated herein by reference).
4.1 Stockholder’s and Registration Rights Agreement (filed as Exhibit 10.1 to Registrant’s CurrentReport on Form 8-K filed December 1, 2014 and incorporated herein by reference).
4.2 Indenture, dated October 1, 2014, by and among California Resources Corporation, theGuarantors and Wells Fargo Bank, National Association (filed as Exhibit 4.2 to AmendmentNo. 4 to the Registrant’s Information Statement on Form 10 filed October 8, 2014 andincorporated herein by reference).
4.3 Registration Rights Agreement, dated October 1, 2014, by and among California ResourcesCorporation, the Guarantors and the Initial Purchasers (filed as Exhibit 4.3 to AmendmentNo. 4 to the Registrant’s Information Statement on Form 10 filed October 8, 2014 andincorporated herein by reference).
4.4 Form of 5% Senior Note due 2020 (included in Exhibit 4.2)
4.5 Form of 51⁄2% Senior Note due 2021 (included in Exhibit 4.2)
4.6 Form of 6% Senior Note due 2024 (included in Exhibit 4.2)
10.1 Transition Services Agreement between Occidental Petroleum Corporation and CaliforniaResources Corporation (filed as Exhibit 10.4 to Registrant’s Current Report on Form 8-K filedDecember 1, 2014 and incorporated herein by reference).
108
ExhibitNumber Exhibit Description
10.2 Tax Sharing Agreement between Occidental Petroleum Corporation and California ResourcesCorporation (filed as Exhibit 10.2 to Registrant’s Current Report on Form 8-K filedDecember 1, 2014 and incorporated herein by reference).
10.3 Employee Matters Agreement between Occidental Petroleum Corporation and CaliforniaResources Corporation (filed as Exhibit 10.3 to Registrant’s Current Report on Form 8-K filedDecember 1, 2014 and incorporated herein by reference).
10.4 Intellectual Property License Agreement between Occidental Petroleum Corporation andCalifornia Resources Corporation (filed as Exhibit 10.7 to Registrant’s Current Report onForm 8-K filed December 1, 2014 and incorporated herein by reference).
The Exhibits numbered 10.5 to 10.18; 10.23 to 10.27 and 10.31 to 10.33 are management contracts andcompensatory plans required to be identified specifically as responsive to Item 601(b)(10)(iii)(A) ofRegulation S-K pursuant to Item 15(b) of Form 10-K.
10.5 California Resources Corporation Long-Term Incentive Plan (filed as Exhibit 4.3 to theRegistrant’s related Registration Statement on Form S-8 filed November 26, 2014 andincorporated herein by reference).
10.6 Form of Nonstatutory Stock Option Award Terms and Conditions (filed as Exhibit 10.6 toAmendment No. 3 to the Registrant’s Information Statement on Form 10 filed September 22,2014 and incorporated herein by reference).
10.7 Form of Restricted Stock Incentive Award Terms and Conditions (Performance-Based) (filedas Exhibit 10.7 to Amendment No. 3 to the Registrant’s Information Statement on Form 10filed September 22, 2014 and incorporated herein by reference).
10.8 Form of Restricted Stock Incentive Award Terms and Conditions (Not Performance-Based)(filed as Exhibit 10.1 to the Registrant’s Current Report on Form 8-K filed February 10, 2015,and incorporated herein by reference and incorporated herein by reference).
10.9 Form of Restricted Stock Unit Award for Non-Employee Directors Grant Agreement (filed asExhibit 10.9 to Amendment No. 3 to the Registrant’s Information Statement on Form 10 filedSeptember 22, 2014 and incorporated herein by reference).
10.10 Form of Long-Term Incentive Award Terms and Conditions (Replacement Award) (filed asExhibit 10.10 to Amendment No. 3 to the Registrant’s Information Statement on Form 10 filedSeptember 22, 2014 and incorporated herein by reference).
10.11 Form of Restricted Stock Incentive Award Terms and Conditions (Replacement Award-Performance-Based) (filed as Exhibit 10.11 to Amendment No. 3 to the Registrant’sInformation Statement on Form 10 filed September 22, 2014 and incorporated herein byreference).
10.12 Form of Restricted Stock Incentive Award Terms and Conditions (Replacement Award-NotPerformance-Based) (filed as Exhibit 10.12 to Amendment No. 3 to the Registrant’sInformation Statement on Form 10 filed September 22, 2014 and incorporated herein byreference).
10.13 Form of Phantom Share Unit Award Terms and Conditions (Replacement Award) (filed asExhibit 10.13 to Amendment No. 3 to the Registrant’s Information Statement on Form 10 filedSeptember 22, 2014 and incorporated herein by reference).
10.14 Form of Indemnification Agreements (filed as Exhibit 10.14 to Amendment No. 3 Registrant’sInformation Statement on Form 10 filed September 22, 2014 and incorporated herein byreference).
10.15 California Resources Corporation 2014 Employee Stock Purchase Plan (filed as Exhibit 4.3 tothe Registrant’s related Registration Statement on Form S-8 filed November 26, 2014 andincorporated herein by reference).
109

ExhibitNumber Exhibit Description
10.16 California Resources Corporation Supplemental Savings Plan (filed as Exhibit 10.1 to theCompany’s Current Report on Form 8-K filed on December 2, 2014, and incorporated hereinby reference and incorporated herein by reference).
10.17 California Resources Corporation Deferred Compensation Plan (filed as Exhibit 10.2 to theCompany’s Current Report on Form 8-K filed December 2, 2014, and incorporated herein byreference and incorporated herein by reference).
10.18 California Resources Corporation Supplemental Retirement Plan II (filed as Exhibit 10.3 to theCompany’s Current Report on Form 8-K filed December 2, 2014, and incorporated herein byreference).
10.19 Area of Mutual Interest Agreement between Occidental Petroleum Corporation and CaliforniaResources Corporation (filed as Exhibit 10.5 to Registrant’s Current Report on Form 8-K filedDecember 1, 2014 and incorporated herein by reference).
10.20 Agreement for Implementation of an Optimized Waterflood Program for the Long Beach Unit,dated November 5, 1991, by and among the State of California, by and through the StateLands Commission, the City of Long Beach, Atlantic Richfield Company and ARCO LongBeach, Inc. (filed as Exhibit 10.10 to Amendment No. 2 to the Company’s RegistrationStatement on Form 10 filed August 20, 2014, and incorporated herein by reference).
10.21 Amendment to the Agreement for Implementation of an Optimized Waterflood Program forthe Long Beach Unit, dated January 16, 2009, by and among the State of California, by andthrough the State Lands Commission, the City of Long Beach, and Oxy Long Beach, Inc. (filedas Exhibit 10.11 to Amendment No. 2 to the Company’s Registration Statement on Form 10filed August 20, 2014, and incorporated herein by reference).
10.22 Contractors’ Agreement, by and between the City of Long Beach, Humble Oil & RefiningCompany, Shell Oil Company, Socony Mobil Oil Company, Inc., Texaco, Inc., Union OilCompany of California, Pauley Petroleum, Inc., Allied Chemical Corporation, Richfield OilCorporation and Standard Oil Company of California (filed as Exhibit 10.12 to AmendmentNo. 2 to the Company’s Registration Statement on Form 10 filed August 20, 2014, andincorporated herein by reference).
10.23 Form of Retention Letter Assignment and Assumption Agreement (filed as Exhibit 10.20 toAmendment No. 3 to the Company’s Registration Statement on Form 10 filed September 22,2014, and incorporated herein by reference).
10.24 Bonus Acknowledgement Agreement between Occidental Petroleum Corporation and WilliamE. Albrecht (filed as Exhibit 10.21 to Amendment No. 3 to the Company’s RegistrationStatement on Form 10 filed September 22, 2014, and incorporated herein by reference).
10.25 Retention and Separation Arrangement with Todd A. Stevens (filed as Exhibit 10.22 toAmendment No. 3 to the Company’s Registration Statement on Form 10 filed September 22,2014, and incorporated herein by reference).
10.26 Retention and Separation Arrangement with William E. Albrecht (filed as Exhibit 10.23 toAmendment No. 3 to the Company’s Registration Statement on Form 10 filed September 22,2014, and incorporated herein by reference).
10.27 Retention and Separation Arrangement with Robert A. Barnes (filed as Exhibit 10.24 toAmendment No. 3 to the Company’s Registration Statement on Form 10 filed September 22,2014, and incorporated herein by reference).
10.30 Credit Agreement, dated as of September 24, 2014, among California Resources Corporation,the Lenders and JPMorgan Chase Bank, N.A. as Administrative Agent, a Swingline Lenderand a Letter of Credit Issuer and Bank of America, N.A. as Syndication Agent, a SwinglineLender and a Letter of Credit Issuer (filed as Exhibit 10.25 to Amendment No. 5 to theCompany’s Registration Statement on Form 10 filed October 14, 2014, and incorporatedherein by reference).
110

ExhibitNumber Exhibit Description
10.31 Form of California Resources Corporation Supplemental Savings Plan (filed as Exhibit 10.1 tothe Registrant’s Current Report on Form 8-K filed on December 2, 2014, and incorporatedherein by reference).
10.32 Form of California Resources Corporation Supplemental Retirement Plan II (filed asExhibit 10.2 to the Registrant’s Current Report on Form 8-K filed on December 2, 2014, andincorporated herein by reference).
10.33 Form of California Resources Corporation Deferred Compensation Plan (filed as Exhibit 10.3to the Registrant’s Current Report on Form 8-K filed on December 2, 2014, and incorporatedherein by reference).
10.34 Confidentiality and Trade Secret Protection Agreement by and between Occidental PetroleumCorporation and California Resources Corporation, dated November 24, 2014 (filed asExhibit 10.6 to the Company’s Current Report on Form 8-K filed on December 1, 2014, andincorporated herein by reference).
10.35* First Amendment to Credit Agreement, dated as of September 24, 2014, among CaliforniaResources Corporation, the Lenders and JPMorgan Chase Bank, N.A. as AdministrativeAgent, a Swingline Lender and a Letter of Credit Issuer and Bank of America, N.A. asSyndication Agent, a Swingline Lender and a Letter of Credit Issuer.
12* Computation of Ratio of Earnings to Fixed Charges.
21* List of Subsidiaries of California Resources Corporation.
23.1* Consent of Independent Registered Public Accounting Firm.
23.2* Consent of Independent Petroleum Engineers.
31.1* Certification of Chief Executive Officer pursuant to Section 302 of the Sarbanes-Oxley Act of2002.
31.2* Certification of Chief Financial Officer pursuant to Section 302 of the Sarbanes-Oxley Act of2002.
32* Certifications of Chief Executive Officer and Chief Financial Officer pursuant to Section 906of the Sarbanes-Oxley Act of 2002.
99.1* Ryder Scott Company Process Review of the Estimated Future Proved Reserves and IncomeAttributable to Certain Fee, Leasehold and Royalty Interests and Certain Economic InterestsDerived Through Certain Production Sharing Type Contracts as of December 31, 2014.
101.INS* XBRL Instance Document.
101.SCH* XBRL Taxonomy Extension Schema Document.
101.CAL* XBRL Taxonomy Extension Calculation Linkbase Document.
101.LAB* XBRL Taxonomy Extension Labels Linkbase Document.
101.PRE* XBRL Taxonomy Extension Presentation Linkbase Document.
101.DEF* XBRL Taxonomy Extension Definition Linkbase Document.
* —Filed herewith.
111

SIGNATURES
Pursuant to the requirements of Section 13 or 15(d) of the Securities Exchange Act of 1934, theregistrant has duly caused this report to be signed on its behalf by the undersigned, thereunto dulyauthorized.
CALIFORNIA RESOURCES CORPORATION
February 26, 2015 By: /s/ TODD A. STEVENS
Todd A. StevensPresident
and Chief Executive Officer
Pursuant to the requirements of the Securities Exchange Act of 1934, this report has been signedbelow by the following persons on behalf of the registrant and in the capacities and on the datesindicated.
Title Date
/s/ TODD A. STEVENS President, Chief Executive Officer and February 26, 2015DirectorTodd A. Stevens
/s/ MARSHALL D. SMITH Senior Executive Vice President and February 26, 2015Chief Financial OfficerMarshall D. Smith
/s/ ROY PINECI Executive Vice President—Finance and February 26, 2015Principal Accounting OfficerRoy Pineci
/s/ WILLIAM E. ALBRECHTExecutive Chairman of the Board February 26, 2015
William E. Albrecht
/s/ JUSTIN A. GANNONDirector February 26, 2015
Justin A. Gannon
/s/ RONALD L. HAVNERDirector February 26, 2015
Ronald L. Havner
/s/ HAROLD M. KORELLDirector February 26, 2015
Harold M. Korell
/s/ RICHARD W. MONCRIEFDirector February 26, 2015
Richard W. Moncrief
/s/ AVEDICK B. POLADIANDirector February 26, 2015
Avedick B. Poladian
/s/ ROBERT V. SINNOTTDirector February 26, 2015
Robert V. Sinnott
/s/ TIMOTHY J. SLOANDirector February 26, 2015
Timothy J. Sloan
112

NOTES

NOTES

(a) On November 30, 2014, the spin-off date from Occidental Petroleum Corporation, 381.4 million shares of our common stock were distributed, of which approximately 18.5% was retained by Occidental. Additional shares were distributed in December to substitute for Occidental stock awards. For comparative purposes, and to provide a more meaningful calculation of weighted-average shares outstanding, we have assumed these amounts to be outstanding for each period prior to the spin-off.
All statements, other than statements of historical fact, included in this report that address activities, events or developments that California Resources Corporation (the “Company” or “CRC”) believes will or may occur in the future are forward-looking statements. The words “believe,” “expect,” “may,” “estimate,” “will,” “anticipate,” “plan,” “intend,” “should,” “would,” “could,” or other similar expressions are intended to identify forward-looking statements, which are generally not historical in nature. Forward-looking statements specifi cally include the Company’s expectations based on its plans, strategies, objectives and anticipated fi nancial and operating results, including as to the Company’s drilling program, production, hedging activities, capital expenditure levels and other guidance included in this report. Such statements are subject to a number of assumptions, risks and uncertainties, many of which are beyond the control of the Company, which may cause actual results to differ materially from those implied or expressed by the forward-looking statements. These include, but are not limited to, commodity pricing; vulnerability to economic downturns and adverse developments due to our debt; insuffi ciency of our operating cash fl ow to fund planned capital investments; inability to implement our capital investment program profi tably or at all; compliance with regulations or changes in regulations and the ability to obtain government permits and approvals; risks of drilling; tax law changes; competition for and costs of oilfi eld equipment, services, qualifi ed personnel and acquisitions; the subjective nature of estimates of proved reserves and related future net cash fl ows; inability to drill identifi ed locations when planned or at all; restrictions on our ability to obtain, use, manage or dispose of water; inability to operate in the United States outside of California; concerns about climate change and air quality issues; risks related to our acquisition activities; catastrophic events for which we may be uninsured or underinsured; cyber attacks; operational issues that restrict market access; and uncertainties related to the anticipated effects of restructuring or reorganizing our business. Any forward-looking statement speaks only as of the date on which such statement is made and the Company undertakes no obligation to correct or update any forward-looking statement, except as required by applicable law.
Financial Highlights
Revenues
Income / (Loss) Before Income Taxes
Net Income / (Loss)
Core Income
EPS – Basic and Diluted(a)
Core EPS – Basic and Diluted(a)
Net Cash Provided by Operating Activities
Capital Investments
Proceeds from Debt
Cash Dividends to Occidental
Net Cash (Used) Provided by Other Financing Activities
Total Assets
Long-Term Debt
Equity/Net Investment
Weighted Average Shares Outstanding(a)
Year-End Shares
Operational Highlights
Production:
Crude Oil (MBbl/d)
NGLs (MBbl/d)
Natural Gas (MMcf/d)
Total (MBoe/d)
Average Realized Prices:
Crude ($/Bbl)
NGLs ($/Bbl)
Natural Gas ($/Mcf)
Reserves:
Crude Oil (MMBbl)
NGLs (MMBbl)
Natural Gas (Bcf)
Total (MBoe/d)
Reserve Replacement from Capital Program
PV-10
Acreage (in thousands):
Net Developed
Net Undeveloped
Total
Closing Share Price
2014
$ 4,173
$ (2,421)
$ (1,434)
$ 650
$ (3.75)
$ 1.67
$ 2,371
$ (2,020)
$ 6,360
$ (6,000)
$ (45)
$ 12,497
$ 6,360
$ 2,611
381.9
385.6
99
19
246
159
$ 92.30
$ 47.84
$ 4.39
551
85
790
768
203%
$16.1 billion
716
1,691
2,407
$ 5.51
2013
$ 4,284
$ 1,447
$ 869
$ 869
$ 2.24
$ 2.24
$ 2,476
$ (1,669)
—
—
$ (763)
$ 14,297
—
$ 9,989
—
—
90
20
260
154
$ 104.16
$ 50.43
$ 3.73
532
71
844
744
159%
$14.0 billion
701
1,604
2,305
2012
$ 4,073
$ 1,181
$ 699
$ 675
$ 1.80
$ 1.74
$ 2,223
$ (2,331)
—
—
$ 532
$ 13,764
—
$ 9,860
—
—
88
17
256
148
$ 104.02
$ 52.76
$ 2.94
497
61
934
714
183%
$13.8 billion
466
1,646
2,112
FINANCIAL & OPERATINGHIGHLIGHTS
Dollar amounts in millions, except per-share amounts as of and for the years ended December 31,
Offi cersTodd A. Stevens
President,
Chief Executive Offi cer
and Director
William E. Albrecht
Executive Chairman
Marshall D. Smith
Senior Executive Vice President
and Chief Financial Offi cer
EXECUTIVE
VICE PRESIDENTS
Robert A. Barnes
Northern Operations
Shawn M. Kerns
Corporate Development
Frank E. Komin
Southern Operations
Roy Pineci
Finance
Michael L. Preston
General Counsel and
Corporate Secretary
Charles F. Weiss
Public Affairs
Darren Williams
Exploration
VICE PRESIDENTS
Carlos A. Contreras
Commercial
Elizabeth A. DeStephens
Reserves and Corporate
Development
Duane D. Dudics
Health, Safety and Environment
Scott A. Espenshade
Investor Relations
Michael S. Helm
Controller
Chia-Fu Hsu
Resource Optimization and
Production Technology
Cynthia J. Johnson
Chief Information Offi cer
Francisco J. Leon
Portfolio Management and
Strategic Planning
Darren K. Mallick
Operations Finance
Mike McGraw
Government Affairs
Noelle M. Repetti
Tax
Alana A. Sotiri
Human Resources
Margita N. Thompson
Communications
Daniel S. Watts
Compensation and Benefi ts
OTHER EXECUTIVES
Ivan I. Gaydarov
Treasurer
Annual MeetingCalifornia Resources Corporation’s annual meeting of
stockholders will be held at 11:00 a.m. on May 7, 2015,
at the Bakersfi eld Marriott at the Convention Center,
801 Truxtun Avenue, Bakersfi eld, CA 93301.
Investor Relations ContactCompany fi nancial information, public disclosures
and other information are available through our
website at www.crc.com. We will promptly
deliver free of charge, upon request, an annual
report on Form 10-K to any stockholder requesting
a copy. Requests should be directed to our
Investor Relations team at our corporate
headquarters address or sent to [email protected].
Dividend InformationCRC’s fi rst dividend record date is March 10, 2015,
and stockholders of record will be paid on April 15.
We currently intend to pay a quarterly cash dividend
of $0.01 per share. Payment of future dividends, if any,
will be at the discretion of our board of directors.
AuditorsKPMG LLP, Los Angeles, California
Transfer Agent & Registrar American Stock Transfer and Trust Company, LLC
Shareholder Services
6201 15th Avenue, Brooklyn, NY 11219
(866) 659-2647
www.amstock.com
Stock Exchange ListingCalifornia Resources Corporation’s common stock
is listed on the New York Stock Exchange (NYSE).
The symbol is CRC.UFCW® 888
This Annual Report is printed on Forest Stewardship Council®-certifi ed paper that contains wood from well-managed forests and other responsible sources.
Financial Highlights
Income / (Loss) Before Income Taxes
Net Income / (Loss)
FINANCIAL & OPERATINGHIGHLIGHTS
Capital Investments
Proceeds from Debt
Cash Dividends to Occidental
Net Cash (Used) Provided by Other Financing Activities
Total Assets
Long-Term Debt
Equity/Net Investment
Weighted Average Shares Outstanding
Year-End Shares
Operational Highlights
Production:
Crude Oil (MBbl/d)
NGLs (MBbl/d)
Natural Gas (MMcf/d)
Total (MBoe/d)
Average Realized Prices:
Crude ($/Bbl)
NGLs ($/Bbl)
Natural Gas ($/Mcf)
Reserves:
Crude Oil (MMBbl)
NGLs (MMBbl)
Natural Gas (Bcf)
Total (MBoe/d)
Reserve Replacement from Capital Program
(a) On November 30, 2014, the spin-off date from Occidental Petroleum Corporation, 381.4 million shares of our common stock were distributed, of which approximately 18.5% was retained by Occidental. Additional shares were distributed in December to substitute for Occidental stock awards. For comparative purposes, and to provide a more meaningful calculation of weighted-average shares outstanding, we have assumed these amounts to be outstanding for each period prior to the spin-off.
All statements, other than statements of historical fact, included in this report that address activities, events or developments that California Resources Corporation (the “Company” or “CRC”) believes will or may occur in the future are forward-looking statements. The words “believe,” “expect,” “may,” “estimate,” “will,” “anticipate,” “plan,” “intend,” “should,” “would,” “could,” or other similar expressions are intended to identify forward-looking statements, which are generally not historical in nature. Forward-looking statements specifi cally include the Company’s expectations based on its plans, strategies, objectives and anticipated fi nancial and operating results, including as to the Company’s drilling program, production, hedging activities, capital expenditure levels and other guidance included in this report. Such statements are subject to a number of assumptions, risks and uncertainties, many of which are beyond the control of the Company, which may cause actual results to differ materially from those implied or expressed by the forward-looking statements. These include, but are not limited to, commodity pricing; vulnerability to economic downturns and adverse developments due to our debt; insuffi ciency of our operating cash fl ow to fund planned capital investments; inability to implement our capital investment program profi tably or at all; compliance with regulations or changes in regulations and the ability to obtain government permits and approvals; risks of drilling; tax law changes; competition for and costs of oilfi eld equipment, services, qualifi ed personnel and acquisitions; the subjective nature of estimates of proved reserves and related future net cash fl ows; inability to drill identifi ed locations when planned or at all; restrictions on our ability to obtain, use, manage or dispose of water; inability to operate in the United States outside of California; concerns about climate change and air quality issues; risks related to our acquisition activities; catastrophic events for which we may be uninsured or underinsured; cyber attacks; operational issues that restrict market access; and uncertainties related to the anticipated effects of restructuring or reorganizing our business. Any forward-looking statement speaks only as of the date on which such statement is made and the Company undertakes no obligation to correct or update any forward-looking statement, except as required by applicable law.
Acreage (in thousands):
Net Developed
Net Undeveloped
Total
Closing Share Price

CA
LIF
OR
NIA
RE
SO
UR
CE
S C
OR
PO
RA
TIO
N 2
014
AN
NU
AL
RE
PO
RT
Corporate Headquarters10889 Wilshire Boulevard
Los Angeles, California 90024
(888) 848-4754
Northern Operations10800 Stockdale Highway
Bakersfi eld, California 93311
(661) 412-5000
Southern Operations111 W. Ocean Boulevard, Suite 800
Long Beach, California 90802
(562) 624-3400
crc.com
ENERGY FOR CALIFORNIA BY CALIFORNIANS Ca l i fo r n i a Reso u rces Co r p o ra t i o n 20 1 4 A n n u a l Re p o r t