Embed Size (px)
Citation preview
1
California Smart GrowthTrip Generation Rates StudyTrip Generation Rates Study
Kevan Shafizadeh, Ph.D., P.E., PTP, PTOE
Associate Professor and Chair, Dept. of Civil Engineering
California State University SacramentoCalifornia State University, Sacramento
ITS‐Davis Seminar
Friday, February 15, 2013
Research Team
• Susan Handy, Ph.D. – Principal Investigator– Professor, Environmental Science and Policy, UC Davis;– Director, Sustainable Transportation Center, UC Davis;– Deputy Director, ULTRANS UC Davis
• Robert J. Schneider, Ph.D., AICP– Post‐Doctoral Researcher, UC DavisN A t P f U i f Wi i Mil k– Now: Asst. Professor, Univ. of Wisconsin, Milwaukee
2
2
Overview
• Background – Definitions – Study Motivation
• Data Collection• Data Analysis• Smart Growth Trip‐Generation Adjustment Tool
• Conclusions• Acknowledgements
3
BACKGROUND
4
3
Definitions
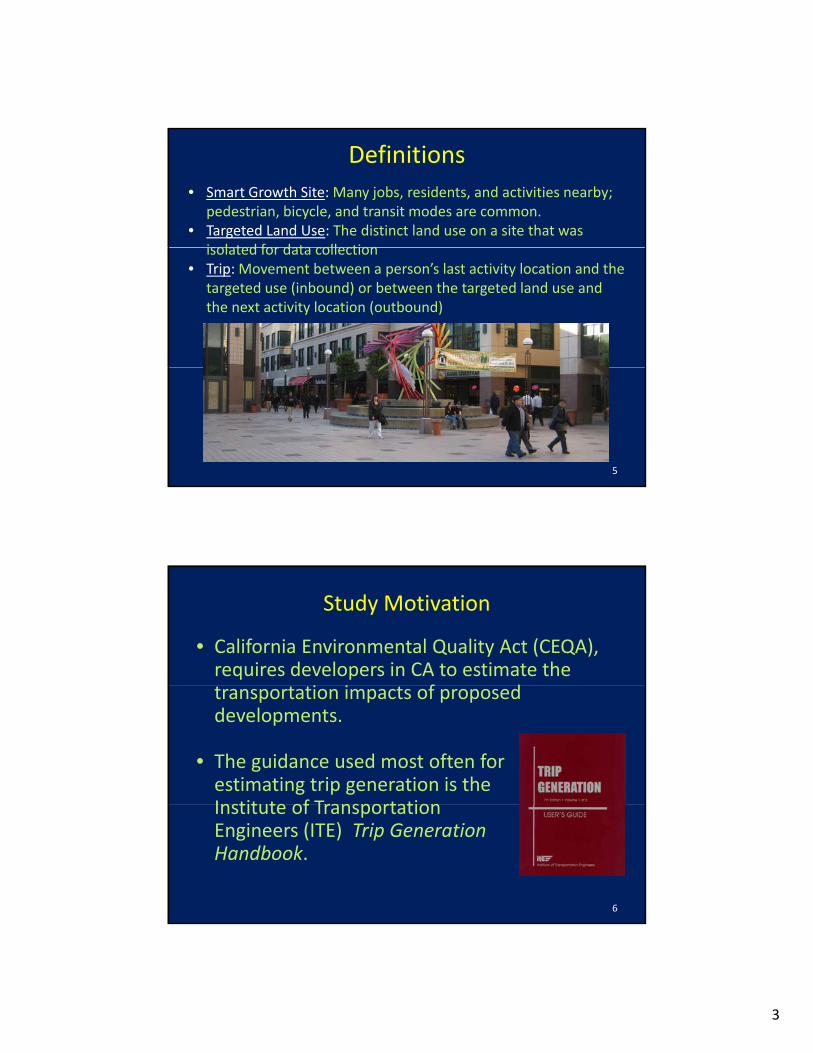
• Smart Growth Site: Many jobs, residents, and activities nearby; pedestrian, bicycle, and transit modes are common.
• Targeted Land Use: The distinct land use on a site that was isolated for data collectionisolated for data collection
• Trip: Movement between a person’s last activity location and the targeted use (inbound) or between the targeted land use and the next activity location (outbound)
5
Study Motivation
• California Environmental Quality Act (CEQA), requires developers in CA to estimate the
f dtransportation impacts of proposed developments.
• The guidance used most often for estimating trip generation is the Institute of TransportationInstitute of Transportation Engineers (ITE) Trip Generation Handbook.
6
4
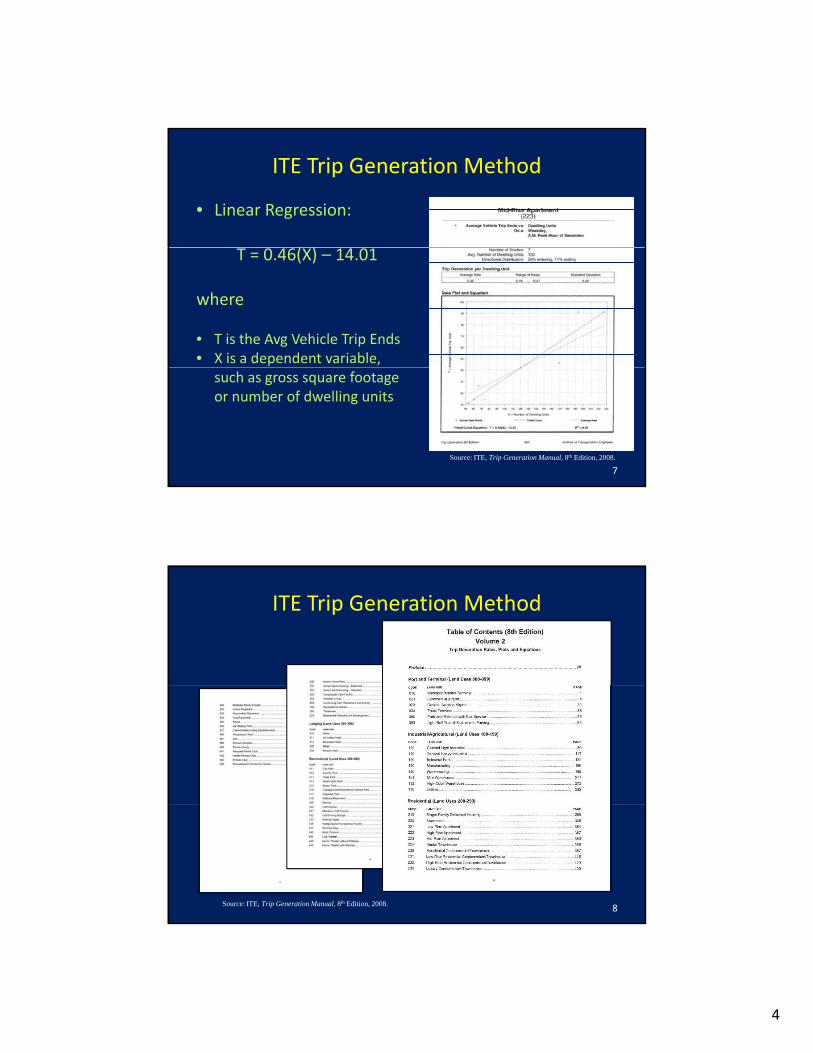
ITE Trip Generation Method
• Linear Regression:
( )T = 0.46(X) – 14.01
where
• T is the Avg Vehicle Trip Ends• X is a dependent variable,
such as gross square footageor number of dwelling units
7
Source: ITE, Trip Generation Manual, 8th Edition, 2008.
ITE Trip Generation Method
8Source: ITE, Trip Generation Manual, 8th Edition, 2008.
5
Study Motivation
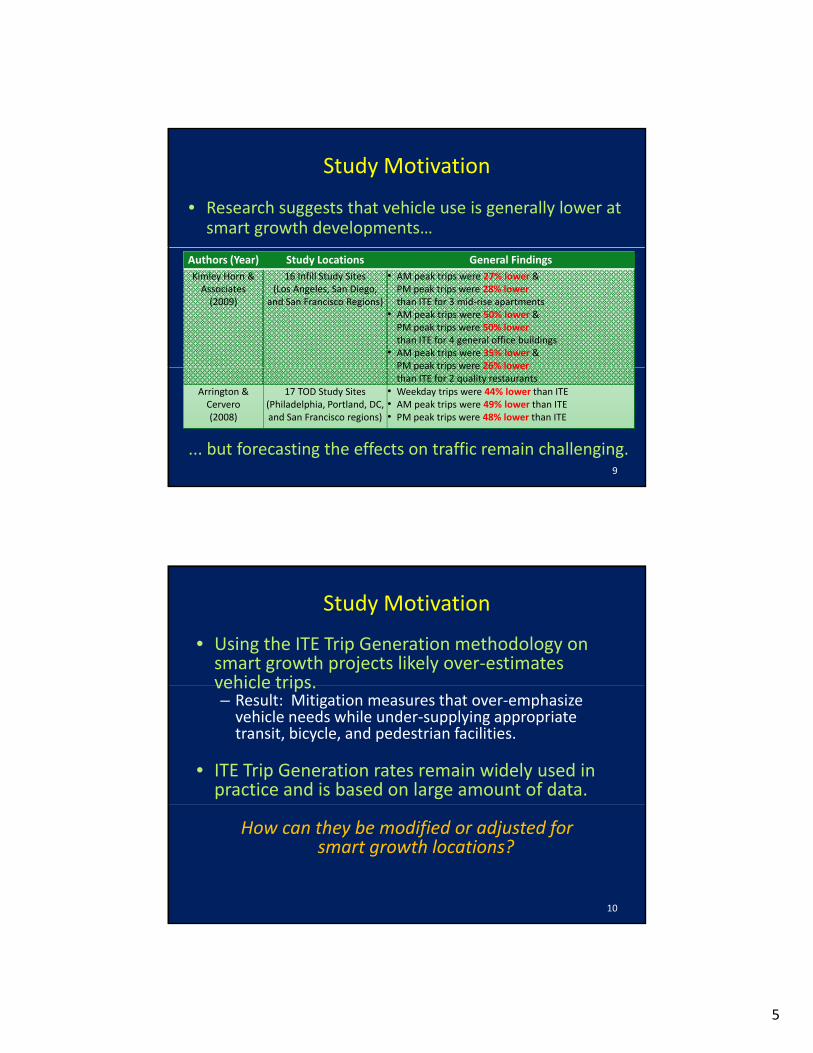
• Research suggests that vehicle use is generally lower at smart growth developments…
Authors (Year) Study Locations General Findings
Kimley Horn & Associates(2009)
16 Infill Study Sites(Los Angeles, San Diego,
and San Francisco Regions)
• AM peak trips were 27% lower & PM peak trips were 28% lower than ITE for 3 mid‐rise apartments
• AM peak trips were 50% lower & PM peak trips were 50% lower than ITE for 4 general office buildings
• AM peak trips were 35% lower & PM peak trips were 26% lower
... but forecasting the effects on traffic remain challenging.9
PM peak trips were 26% lower than ITE for 2 quality restaurants
Arrington & Cervero(2008)
17 TOD Study Sites (Philadelphia, Portland, DC, and San Francisco regions)
• Weekday trips were 44% lower than ITE• AM peak trips were 49% lower than ITE• PM peak trips were 48% lower than ITE
Study Motivation
• Using the ITE Trip Generation methodology on smart growth projects likely over‐estimates vehicle tripsvehicle trips. – Result: Mitigation measures that over‐emphasize vehicle needs while under‐supplying appropriate transit, bicycle, and pedestrian facilities.
• ITE Trip Generation rates remain widely used in practice and is based on large amount of data.
How can they be modified or adjusted for smart growth locations?
10
6
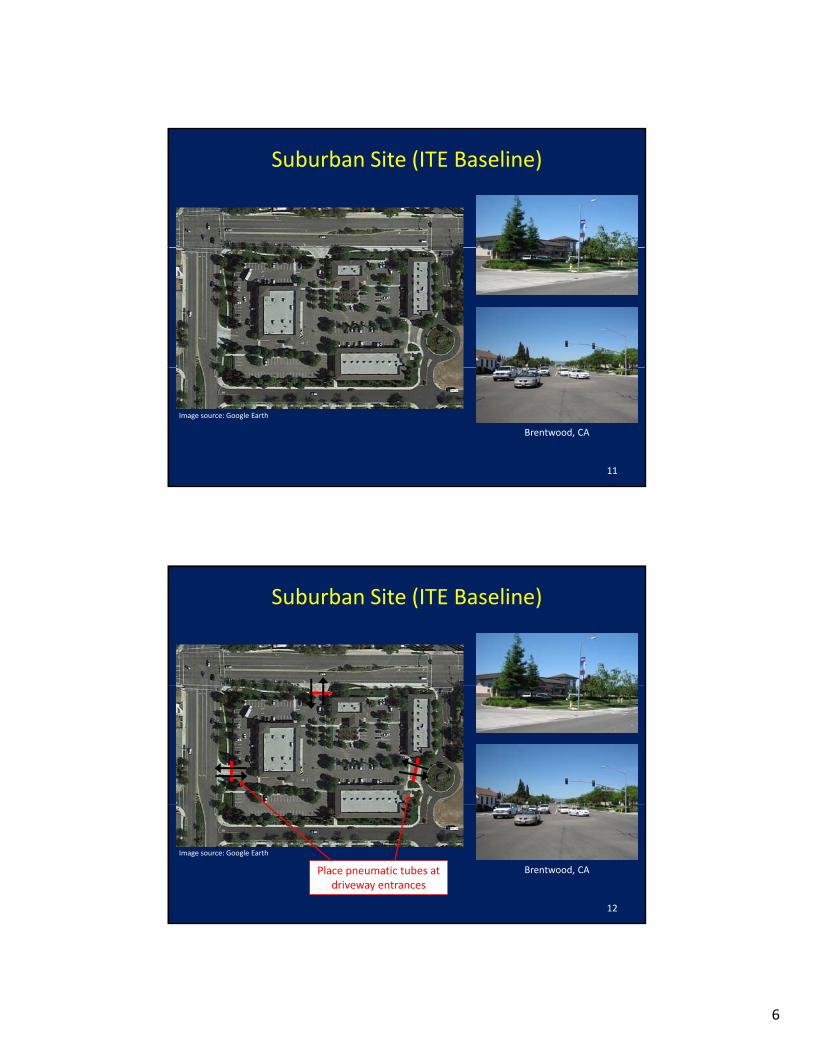
Suburban Site (ITE Baseline)
11
Image source: Google Earth
Brentwood, CA
Suburban Site (ITE Baseline)
12
Image source: Google Earth
Place pneumatic tubes at driveway entrances
Brentwood, CA
7
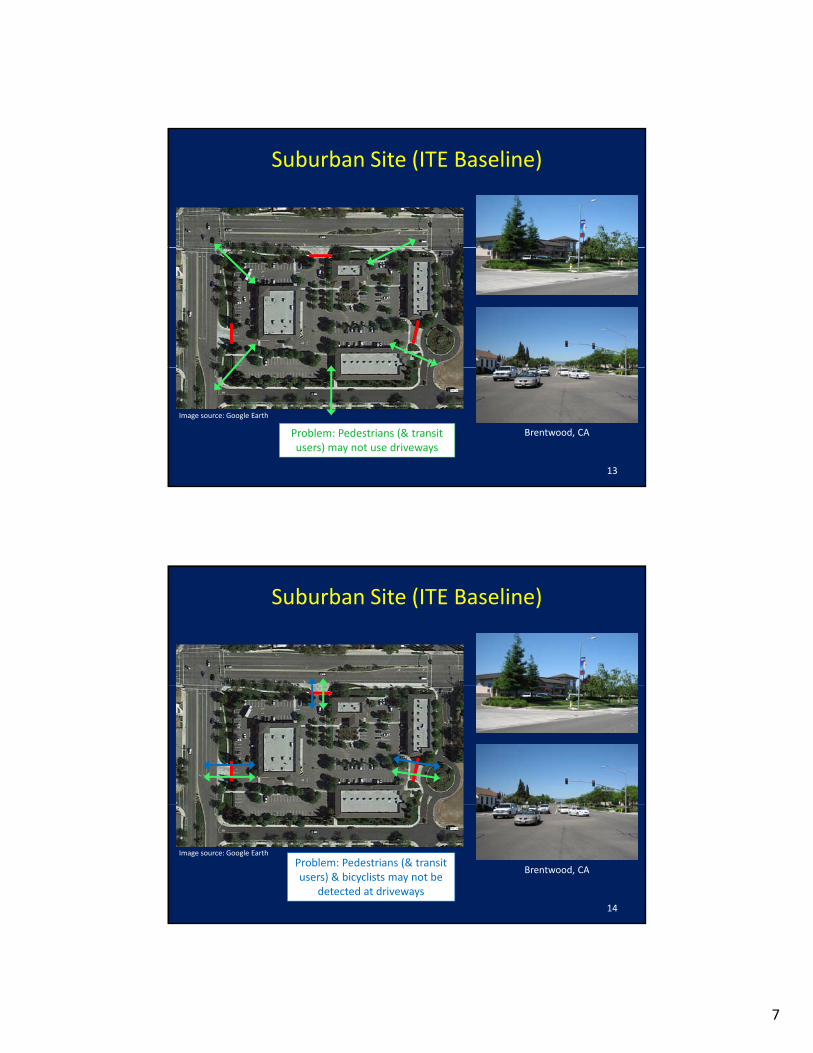
Suburban Site (ITE Baseline)
13
Image source: Google Earth
Problem: Pedestrians (& transit users) may not use driveways
Brentwood, CA
Suburban Site (ITE Baseline)
14
Image source: Google Earth
Problem: Pedestrians (& transit users) & bicyclists may not be
detected at driveways
Brentwood, CA
8
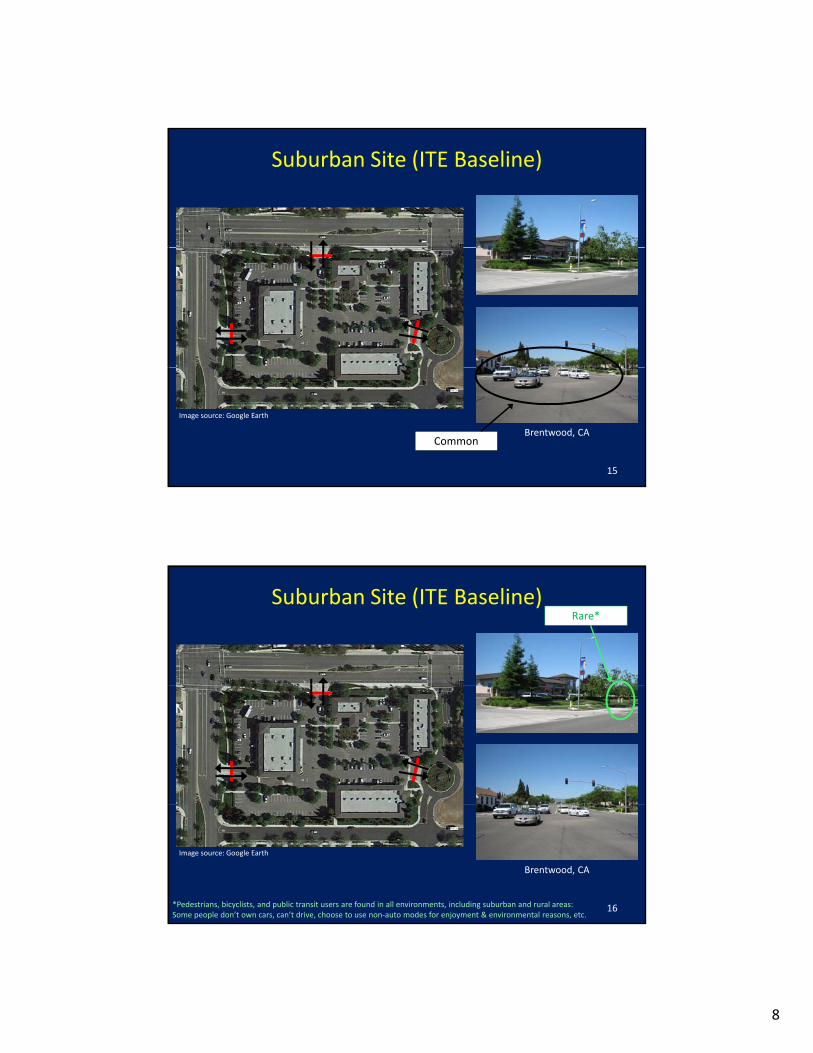
Suburban Site (ITE Baseline)
15
Image source: Google Earth
Brentwood, CACommon
Suburban Site (ITE Baseline)Rare*
16
Image source: Google Earth
Brentwood, CA
*Pedestrians, bicyclists, and public transit users are found in all environments, including suburban and rural areas: Some people don’t own cars, can’t drive, choose to use non‐auto modes for enjoyment & environmental reasons, etc.
9
Smart‐Growth Site
17
Image source: Google EarthSacramento, CA
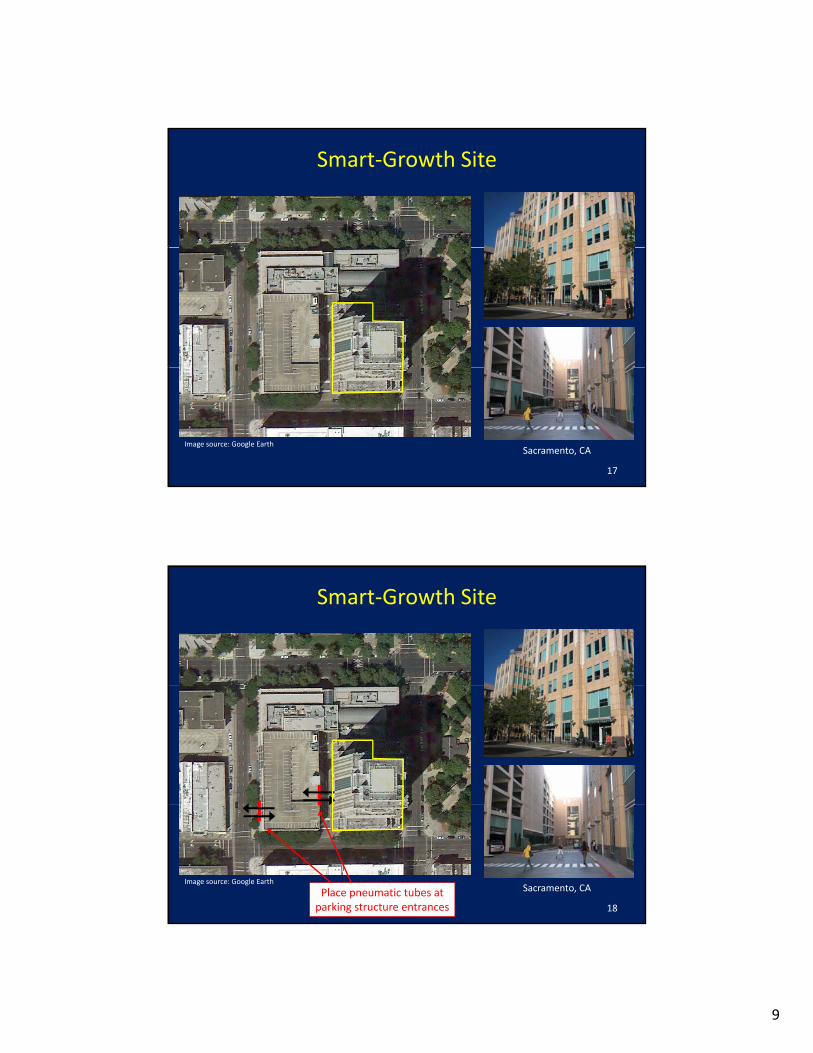
Smart‐Growth Site
18
Image source: Google EarthSacramento, CAPlace pneumatic tubes at
parking structure entrances
10
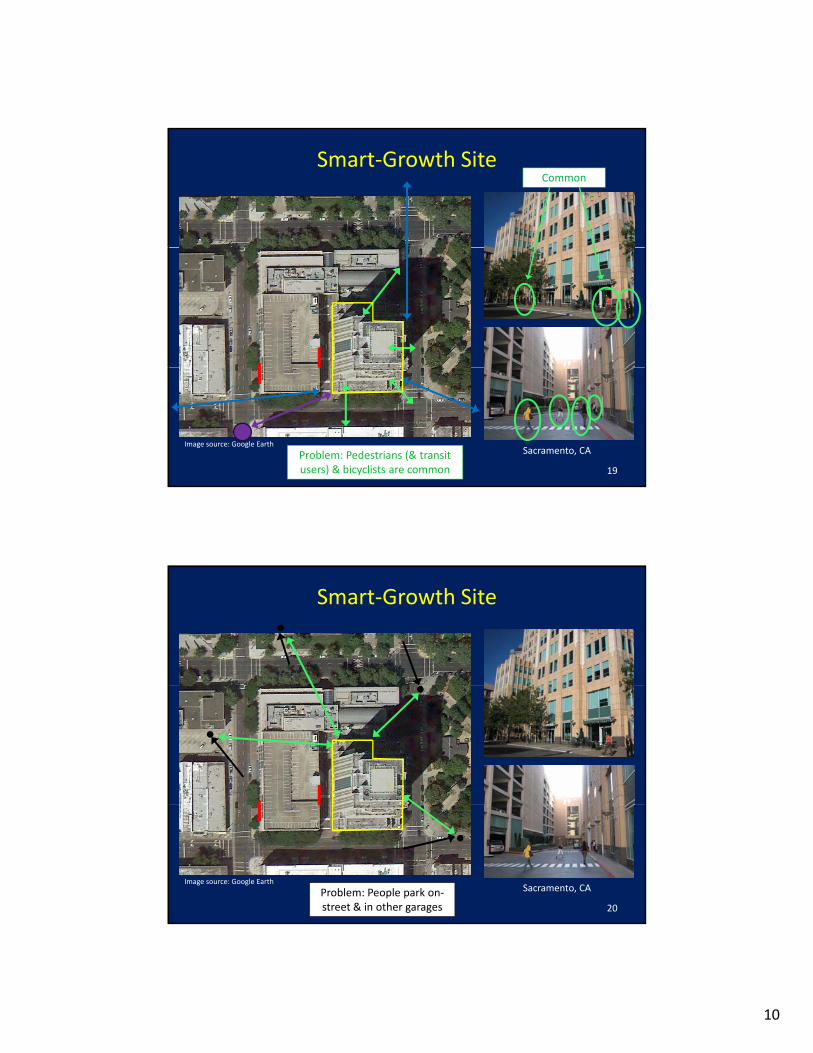
Smart‐Growth SiteCommon
19
Image source: Google EarthSacramento, CAProblem: Pedestrians (& transit
users) & bicyclists are common
Smart‐Growth Site
20
Image source: Google EarthSacramento, CAProblem: People park on‐
street & in other garages
11
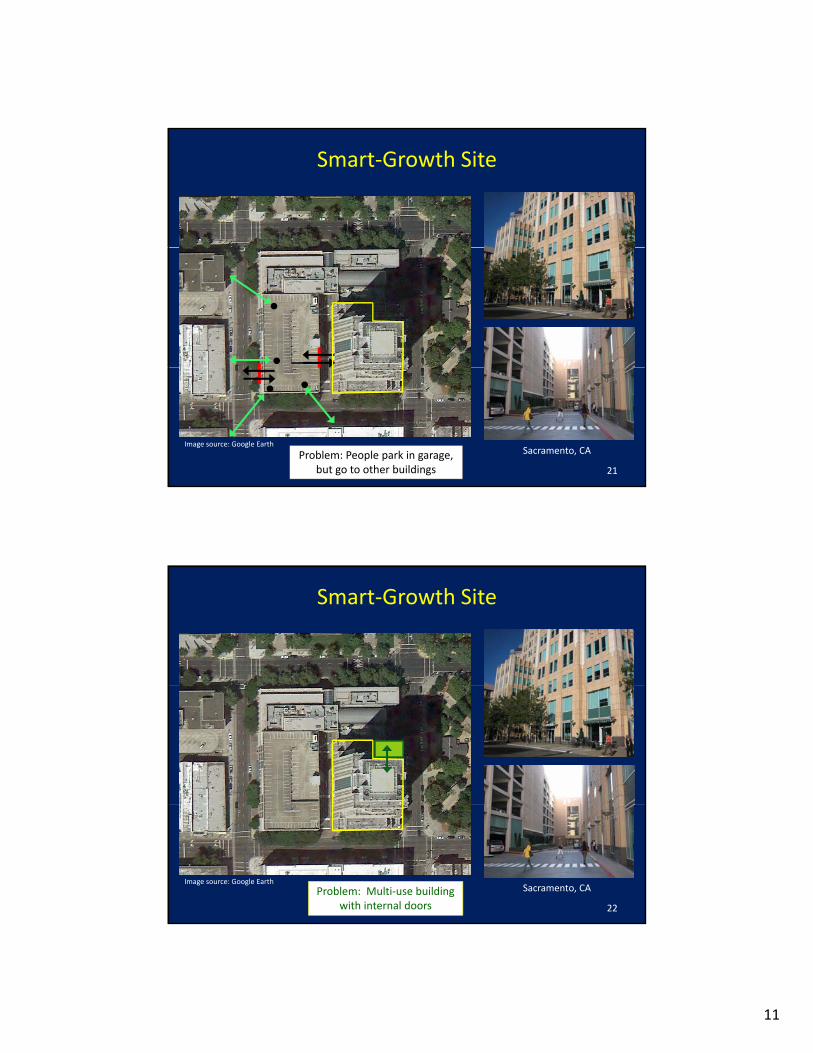
Smart‐Growth Site
21
Image source: Google EarthSacramento, CAProblem: People park in garage,
but go to other buildings
Smart‐Growth Site
22
Image source: Google Earth
Problem: Multi‐use building with internal doors
Sacramento, CA
12
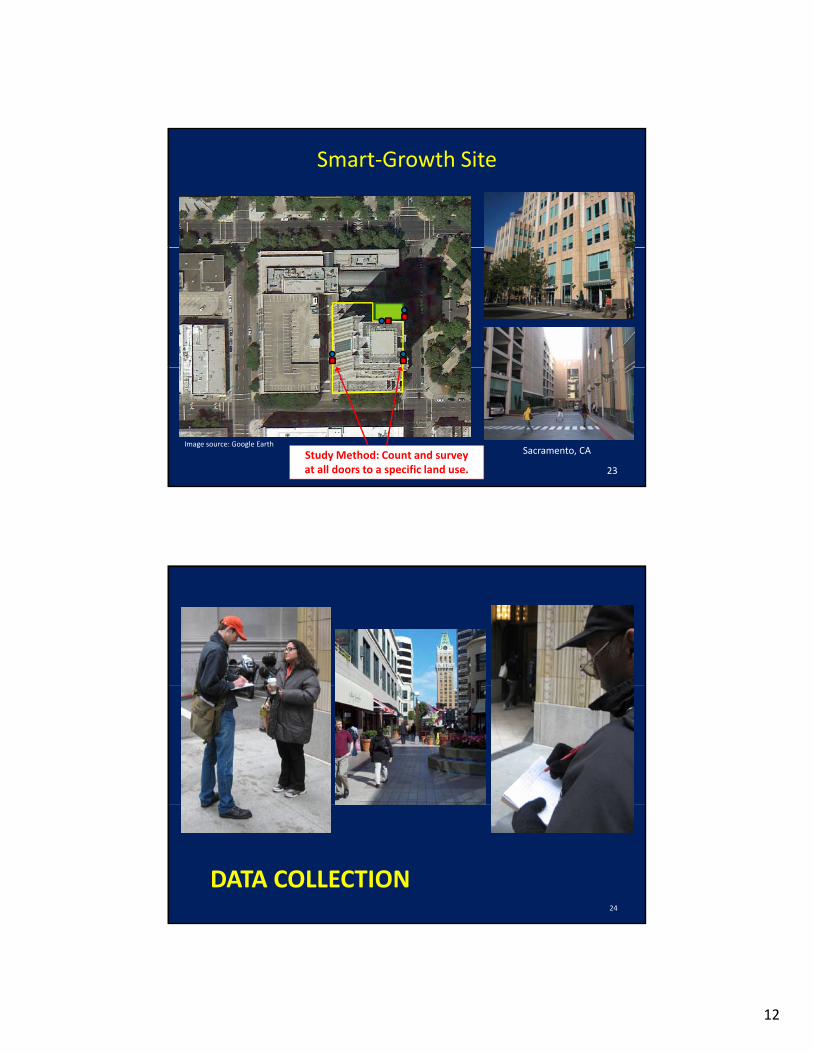
Smart‐Growth Site
23
Image source: Google Earth
Study Method: Count and survey at all doors to a specific land use.
Sacramento, CA
DATA COLLECTION24
13
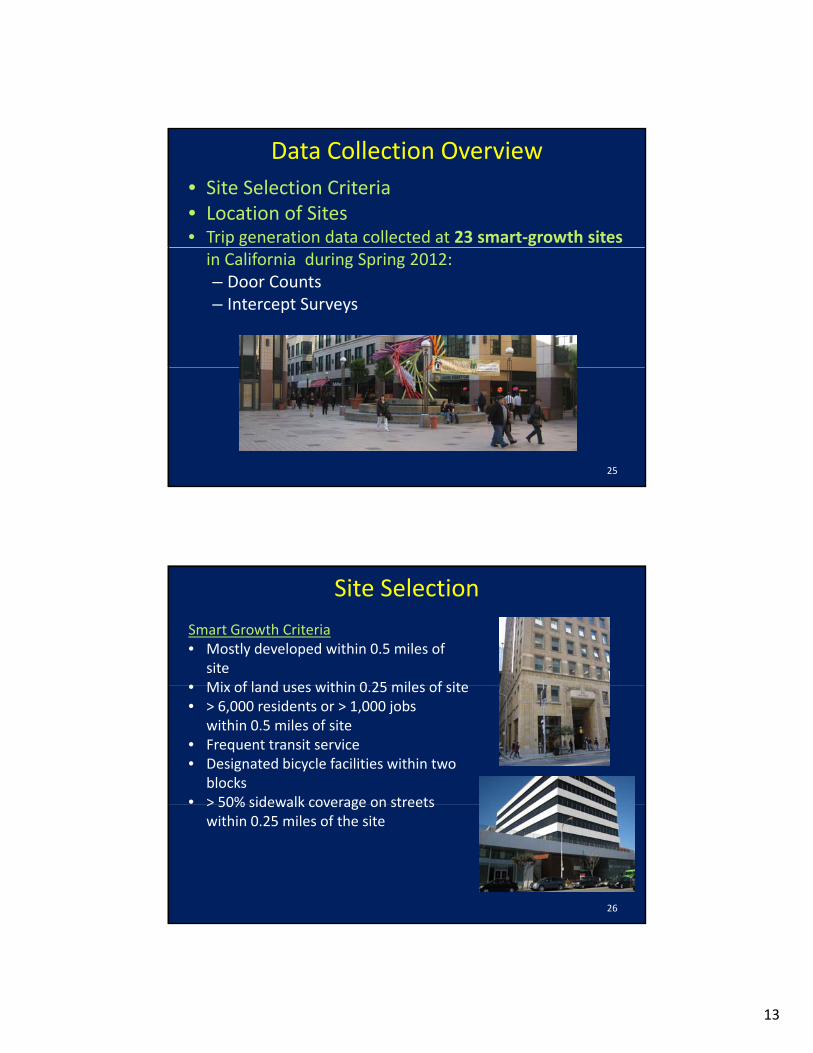
Data Collection Overview
• Site Selection Criteria• Location of Sites• Trip generation data collected at 23 smart‐growth sitesin California during Spring 2012:– Door Counts – Intercept Surveys
25
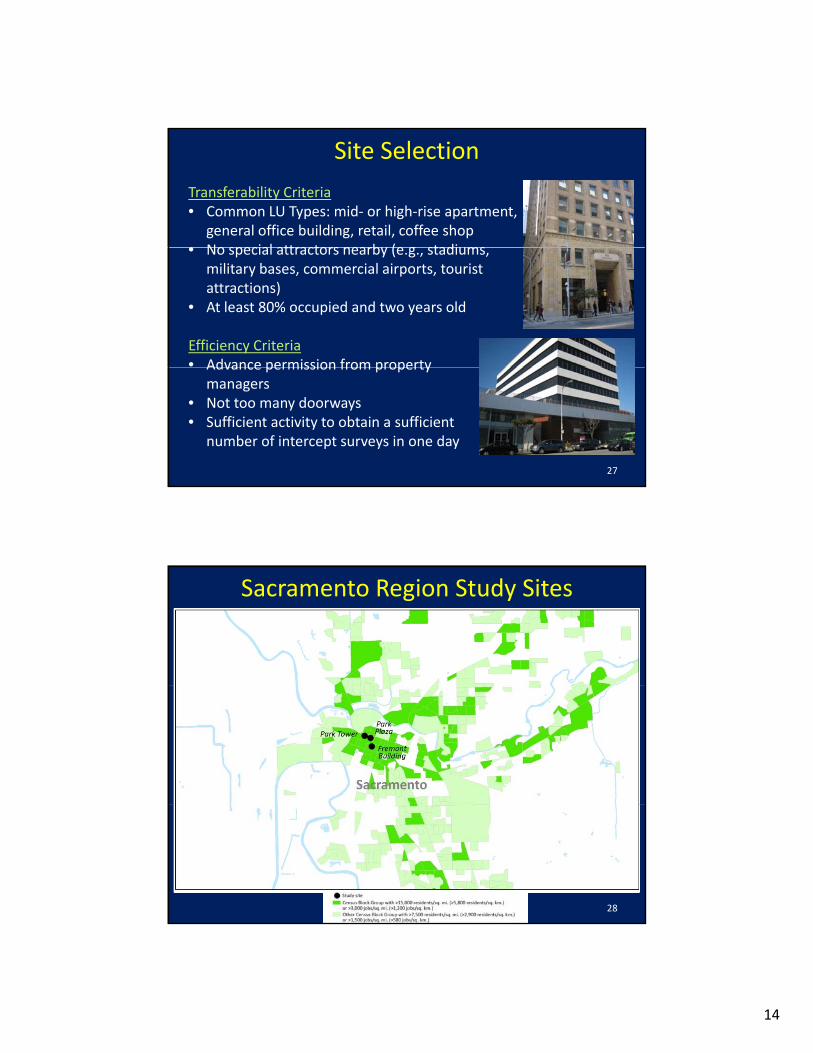
Site Selection
Smart Growth Criteria• Mostly developed within 0.5 miles of
site• Mix of land uses within 0 25 miles of site• Mix of land uses within 0.25 miles of site• > 6,000 residents or > 1,000 jobs
within 0.5 miles of site• Frequent transit service• Designated bicycle facilities within two
blocks• > 50% sidewalk coverage on streets
26
> 50% sidewalk coverage on streets within 0.25 miles of the site
14
Site Selection
Transferability Criteria• Common LU Types: mid‐ or high‐rise apartment,
general office building, retail, coffee shop• No special attractors nearby (e g stadiums• No special attractors nearby (e.g., stadiums,
military bases, commercial airports, tourist attractions)
• At least 80% occupied and two years old
Efficiency Criteria• Advance permission from property
27
Advance permission from property managers
• Not too many doorways• Sufficient activity to obtain a sufficient
number of intercept surveys in one day
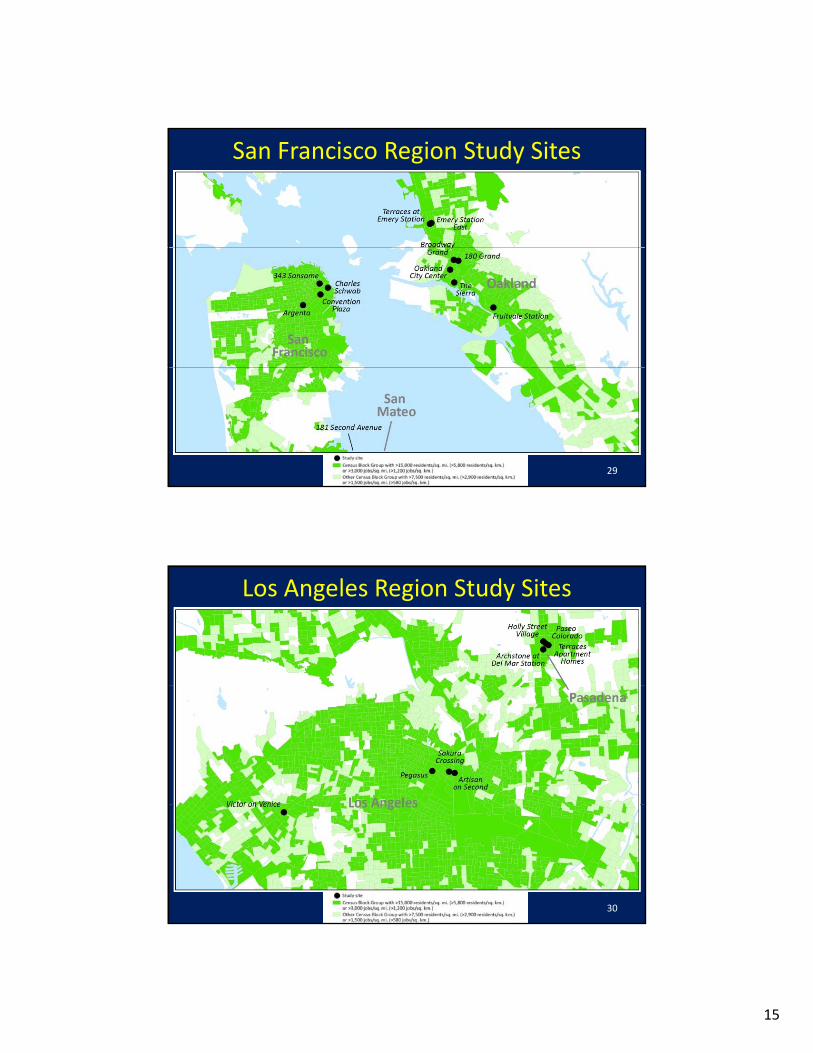
Sacramento Region Study Sites
28
15
San Francisco Region Study Sites
29
Los Angeles Region Study Sites
30

16
181 Second Avenue, San Mateo
1 Door Counter at back entrance
1 Door Counter at 2nd
level garage entrance
1 Surveyor at 1st level garage entrance
(rotated to back entrance)
1 Surveyor at 2nd level garage entrance
g g
1 Door Counter at 1st
level garage entrance
Single‐Use Site: 181 Second Avenue, San Mateo
1 Door Counter at main 2nd Ave. entrance
1 Surveyor at main 2nd
Ave. entrance
level garage entrance
Source: Google Earth31
Fruitvale Station, 3100 E. 9th Street, Oakland
1 Surveyor at K&G Fashion Entrance
1 Surveyor at Office Depot Entrance
K&G Fashion Entrance
1 Door Counter for both Office Depot and K&G Fashion
Multi‐Use Site: Fruitvale Station, Oakland
1 Surveyor at Starbucks entrance
1 Door Counter at Starbucks entrance
32
Source: Google Earth
17
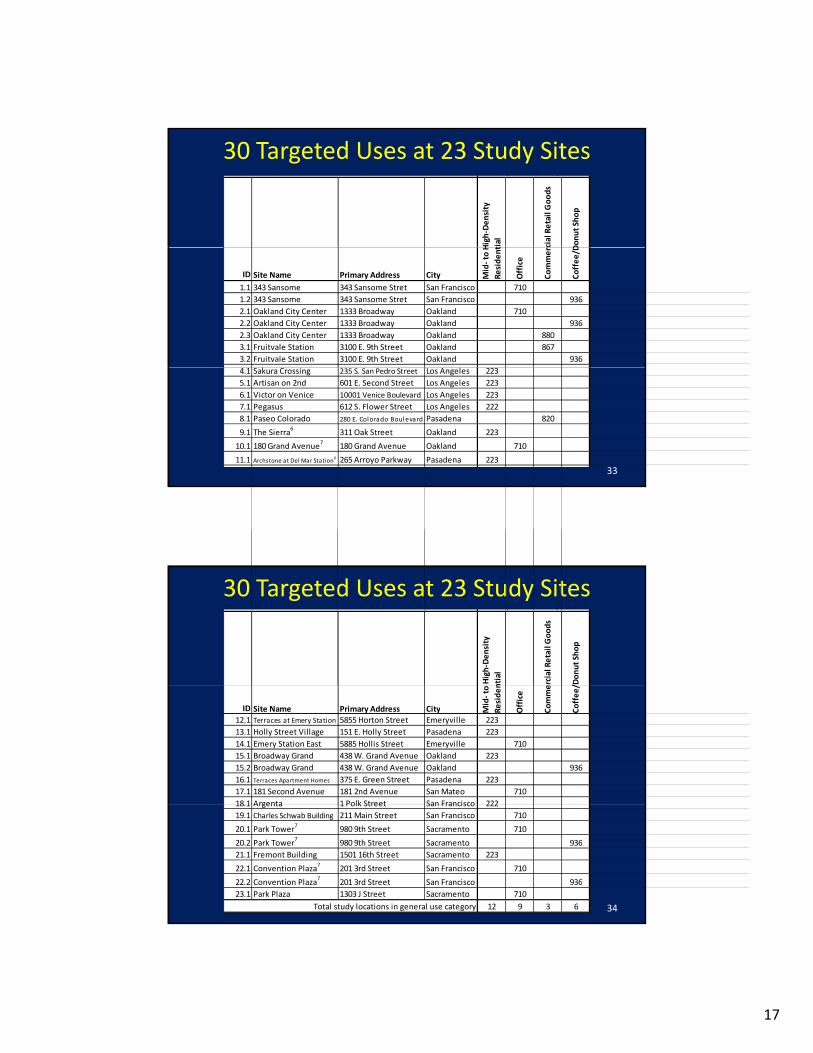
30 Targeted Uses at 23 Study Sites
High‐Density
tial cial Retail Goods
Donut Shop
( )
ID Site Name Primary Address City Mid‐ to H
Resident
Office
Commer
Coffee/ D
1.1 343 Sansome 343 Sansome Stret San Francisco 710
1.2 343 Sansome 343 Sansome Stret San Francisco 936
2.1 Oakland City Center 1333 Broadway Oakland 710
2.2 Oakland City Center 1333 Broadway Oakland 936
2.3 Oakland City Center 1333 Broadway Oakland 880
3.1 Fruitvale Station 3100 E. 9th Street Oakland 867
3.2 Fruitvale Station 3100 E. 9th Street Oakland 936
33
4.1 Sakura Crossing 235 S. San Pedro Street Los Angeles 223
5.1 Artisan on 2nd 601 E. Second Street Los Angeles 223
6.1 Victor on Venice 10001 Venice Boulevard Los Angeles 223
7.1 Pegasus 612 S. Flower Street Los Angeles 222
8.1 Paseo Colorado 280 E. Colorado Boulevard Pasadena 820
9.1 The Sierra6
311 Oak Street Oakland 223
10.1 180 Grand Avenue7
180 Grand Avenue Oakland 710
11.1 Archstone at Del Mar Station6 265 Arroyo Parkway Pasadena 223
30 Targeted Uses at 23 Study Sites
High‐Density
ntial
rcial Retail Goods
/Donut Shop
( )
y y
12.1 Terraces at Emery Station 5855 Horton Street Emeryville 223
13.1 Holly Street Village 151 E. Holly Street Pasadena 223
14.1 Emery Station East 5885 Hollis Street Emeryville 710
15.1 Broadway Grand 438 W. Grand Avenue Oakland 223
15.2 Broadway Grand 438 W. Grand Avenue Oakland 936
16.1 Terraces Apartment Homes 375 E. Green Street Pasadena 223
17.1 181 Second Avenue 181 2nd Avenue San Mateo 710
18 1 Argenta 1 Polk Street San Francisco 222
ID Site Name Primary Address City Mid‐ to
Residen
Office
Comme
Coffee/
34
18.1 Argenta 1 Polk Street San Francisco 222
19.1 Charles Schwab Building 211 Main Street San Francisco 710
20.1 Park Tower7
980 9th Street Sacramento 710
20.2 Park Tower7
980 9th Street Sacramento 936
21.1 Fremont Building 1501 16th Street Sacramento 223
22.1 Convention Plaza7
201 3rd Street San Francisco 710
22.2 Convention Plaza7
201 3rd Street San Francisco 936
23.1 Park Plaza 1303 J Street Sacramento 710
12 9 3 6Total study locations in general use category
18
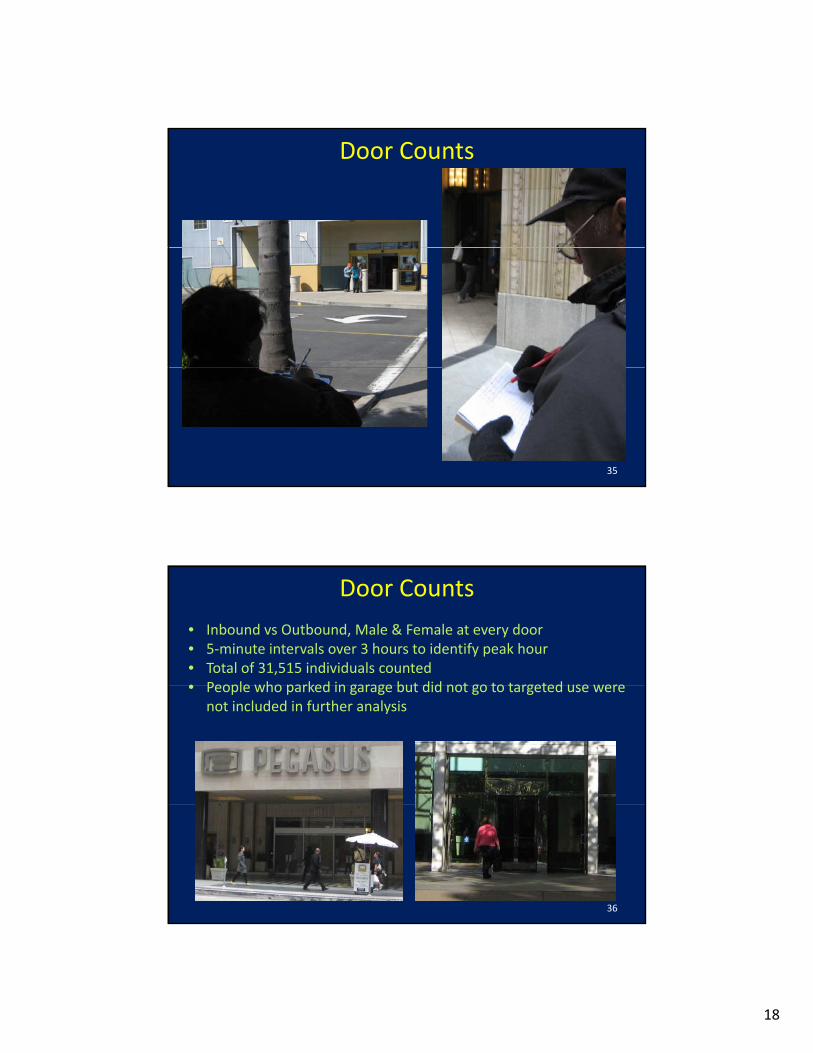
Door Counts
35
Door Counts
• Inbound vs Outbound, Male & Female at every door• 5‐minute intervals over 3 hours to identify peak hour• Total of 31,515 individuals counted • People who parked in garage but did not go to targeted use were• People who parked in garage but did not go to targeted use were
not included in further analysis
36
19
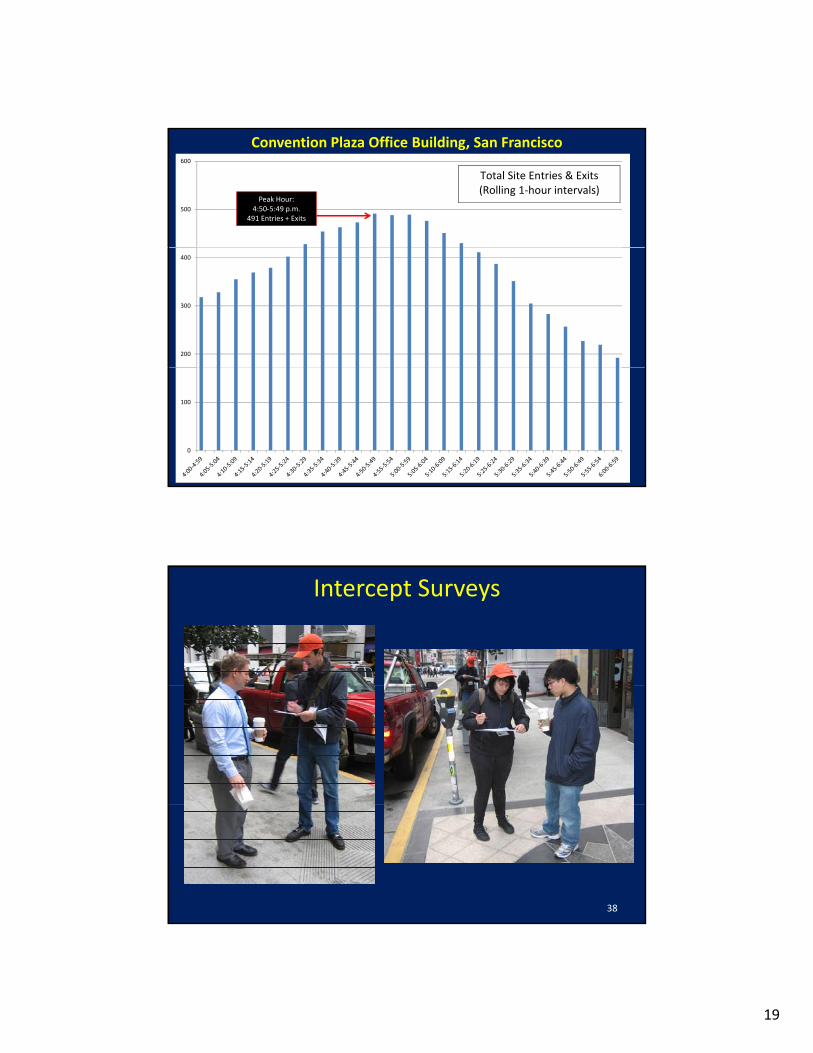
500
600
Total Site Entries & Exits(Rolling 1‐hour intervals)
Convention Plaza Office Building, San Francisco
Peak Hour: 4:50‐5:49 p.m.
491 Entries + Exits
200
300
400
0
100
37
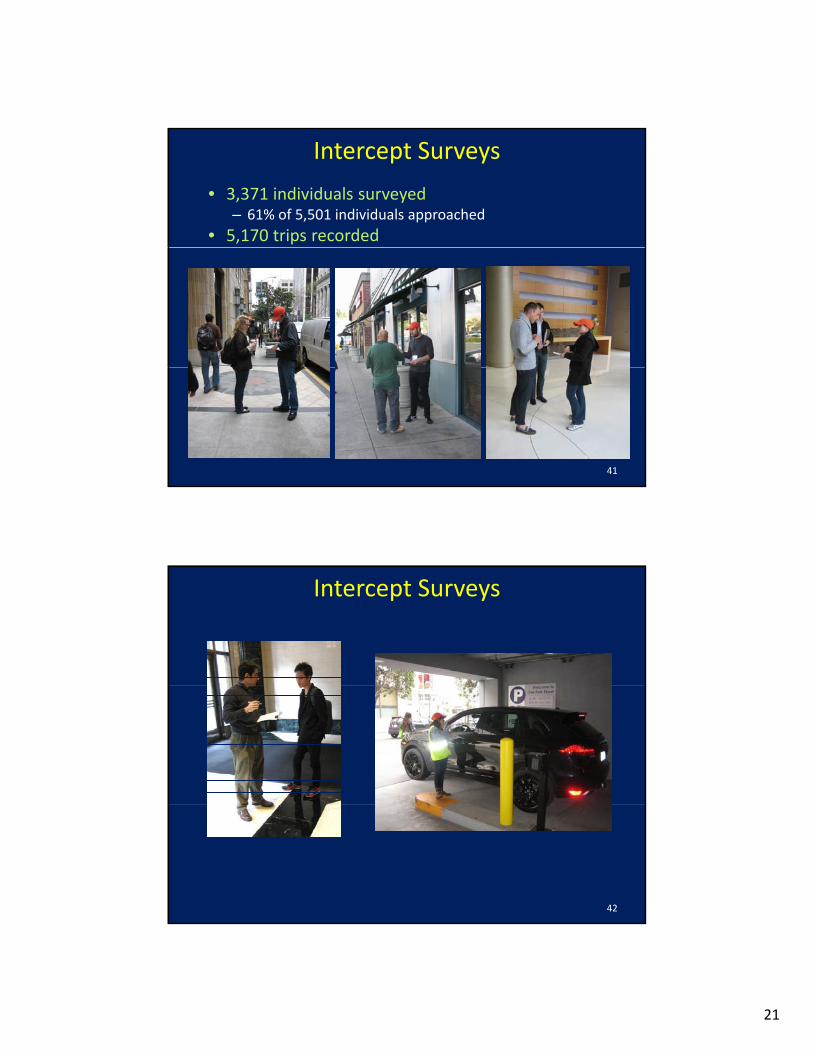
Intercept Surveys
38
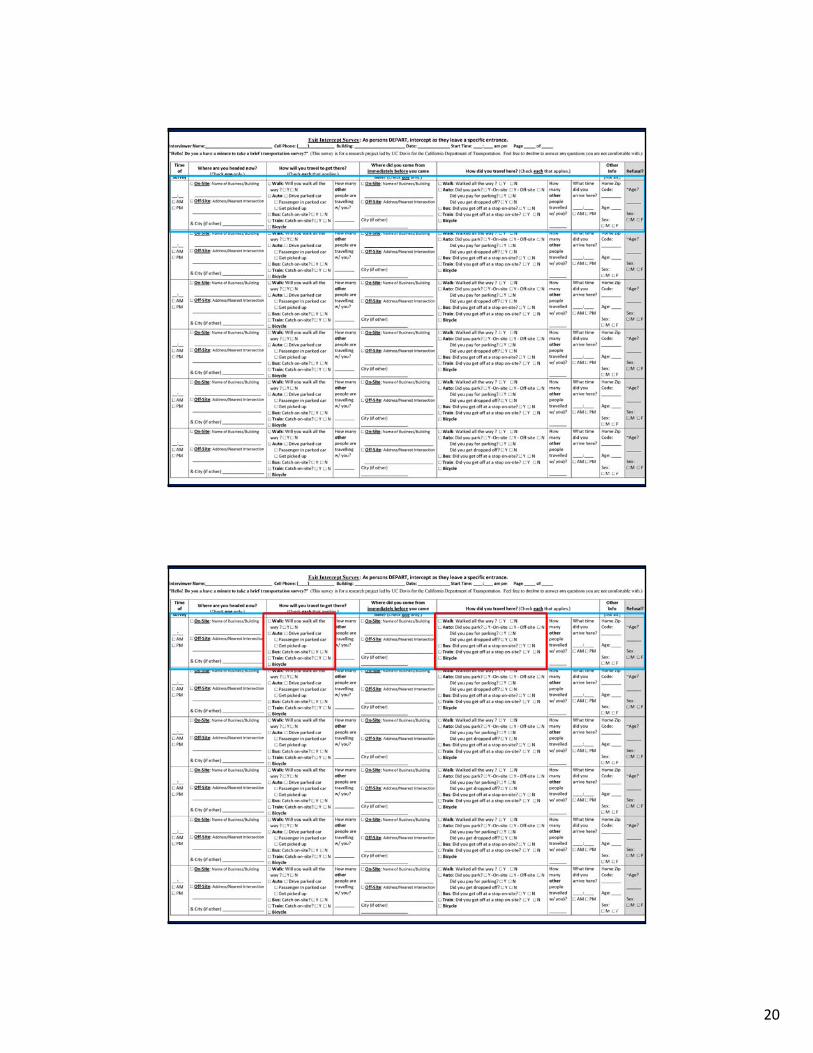
20
39
40
21
Intercept Surveys
• 3,371 individuals surveyed– 61% of 5,501 individuals approached
• 5,170 trips recorded
41
Intercept Surveys
42
22
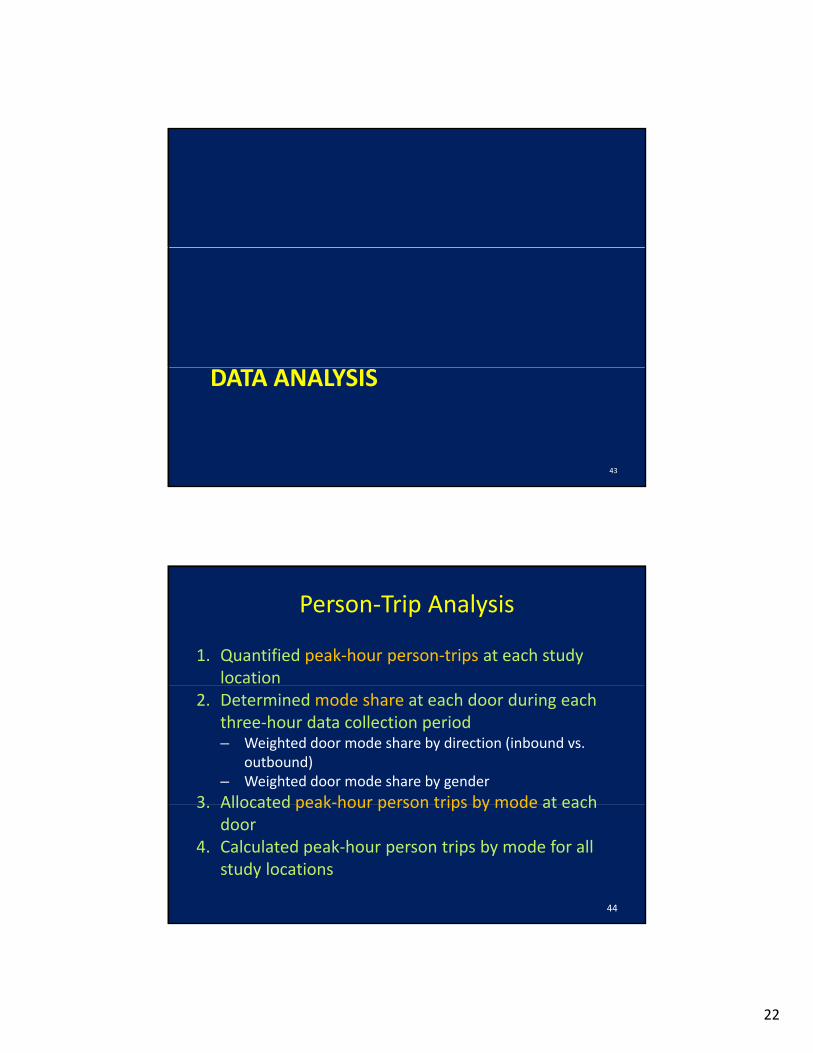
DATA ANALYSIS
43
Person‐Trip Analysis
1. Quantified peak‐hour person‐trips at each study location
2. Determined mode share at each door during each three‐hour data collection period– Weighted door mode share by direction (inbound vs.
outbound)– Weighted door mode share by gender
3 Allocated peak‐hour person trips by mode at each3. Allocated peak hour person trips by mode at each door
4. Calculated peak‐hour person trips by mode for all study locations
44
23
Results: Person‐Trips by Mode(All study sites combined.)
PM Trip Mode ShareAM Trip Mode Share
Pedestrian(26%)
Transit(19%)
Bicycle(2%)
Pedestrian(29%)
Transit(23%)
Bicycle(3%)
45
Automobile(53%)
Automobile(45%)
SpecificPM PeakExamples:S F i
35%
1%
250
300
350
Bicycle
Transit
Pedestrian
AutomobileSan FranciscoSacramentoLos Angeles
39%
5%100
150
200
PM Peak
Hour Person‐Trips
46
25%
25%78%
61% 19%
9%
0
50
343 Sansome, SF(Office)
Park Tower,Sacramento (Coffee)
Artisan on 2nd, LA(Residential)
24
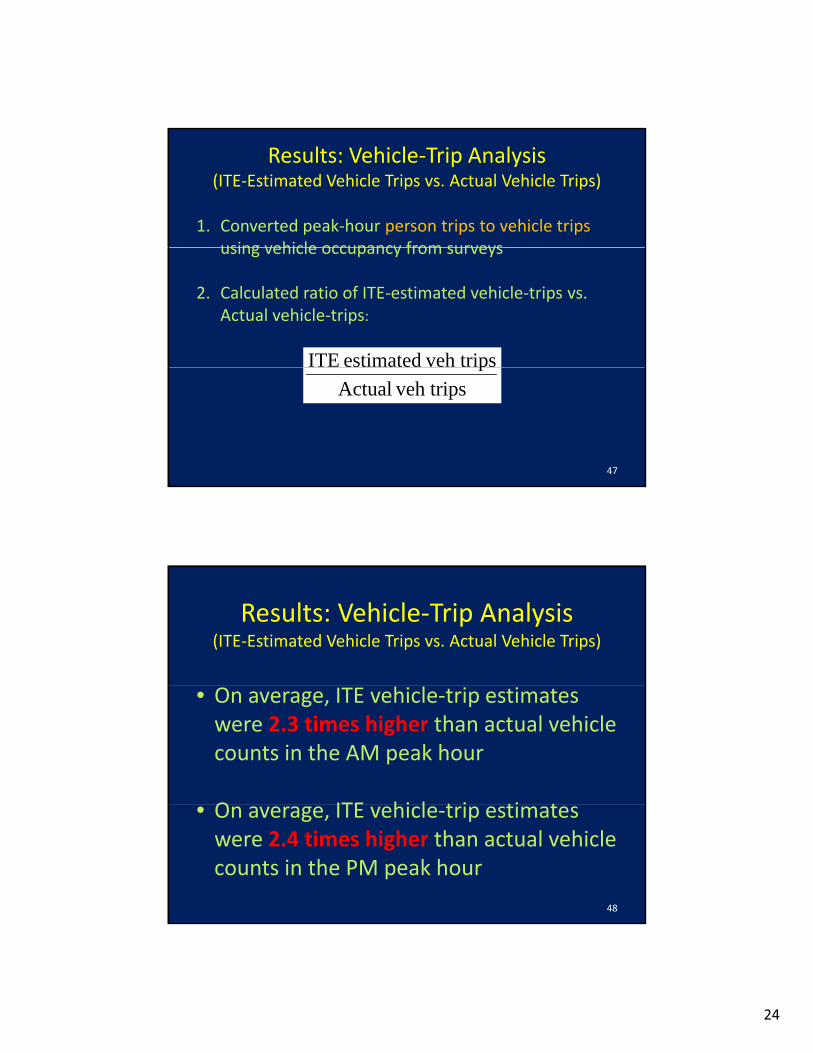
Results: Vehicle‐Trip Analysis(ITE‐Estimated Vehicle Trips vs. Actual Vehicle Trips)
1. Converted peak‐hour person trips to vehicle trips using vehicle occupancy from surveysusing vehicle occupancy from surveys
2. Calculated ratio of ITE‐estimated vehicle‐trips vs. Actual vehicle‐trips:
veh tripsestimatedITE
47
veh tripsActual
p
Results: Vehicle‐Trip Analysis(ITE‐Estimated Vehicle Trips vs. Actual Vehicle Trips)
• On average, ITE vehicle‐trip estimates were 2.3 times higher than actual vehicle counts in the AM peak hour
O ITE hi l t i ti t• On average, ITE vehicle‐trip estimates were 2.4 times higher than actual vehicle counts in the PM peak hour
48
25
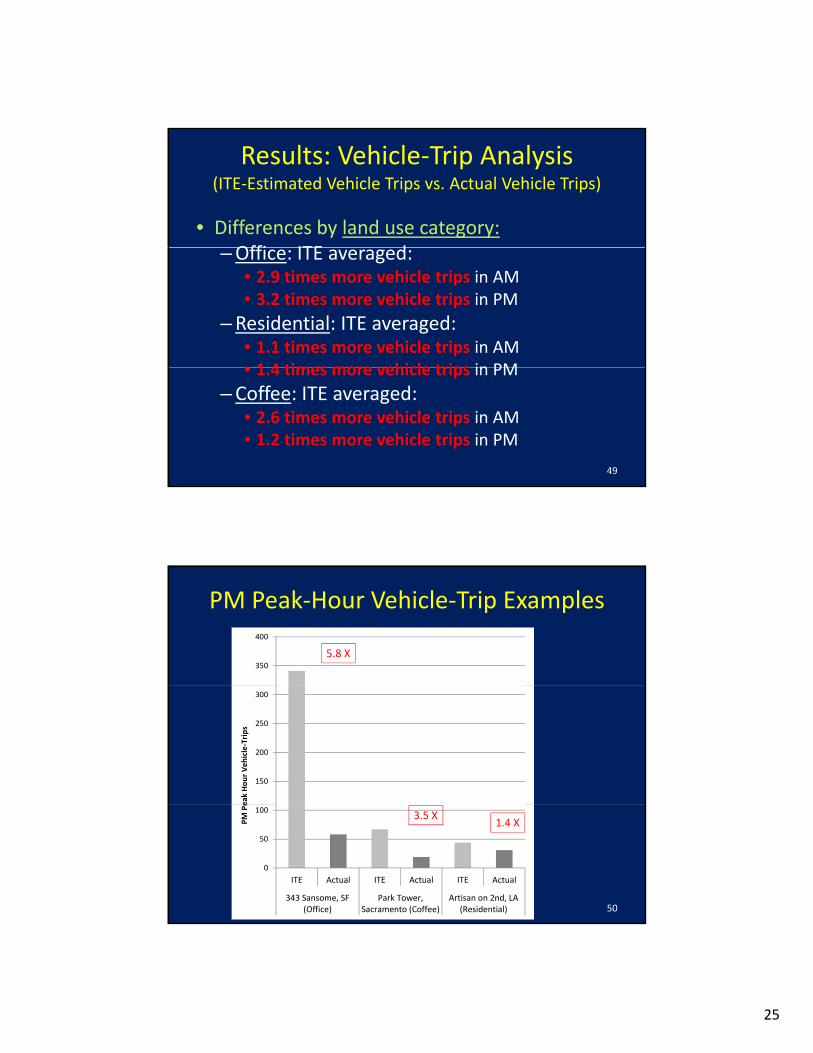
• Differences by land use category:Offi ITE d
Results: Vehicle‐Trip Analysis(ITE‐Estimated Vehicle Trips vs. Actual Vehicle Trips)
–Office: ITE averaged:• 2.9 times more vehicle trips in AM• 3.2 times more vehicle trips in PM
–Residential: ITE averaged: • 1.1 times more vehicle trips in AM • 1 4 times more vehicle trips in PM• 1.4 times more vehicle trips in PM
–Coffee: ITE averaged: • 2.6 times more vehicle trips in AM• 1.2 times more vehicle trips in PM
49
PM Peak‐Hour Vehicle‐Trip Examples
350
400
5.8 X
150
200
250
300
eak Hour Vehicle‐Trips
50
0
50
100
ITE Actual ITE Actual ITE Actual
343 Sansome, SF(Office)
Park Tower,Sacramento (Coffee)
Artisan on 2nd, LA(Residential)
PM Pe
3.5 X1.4 X
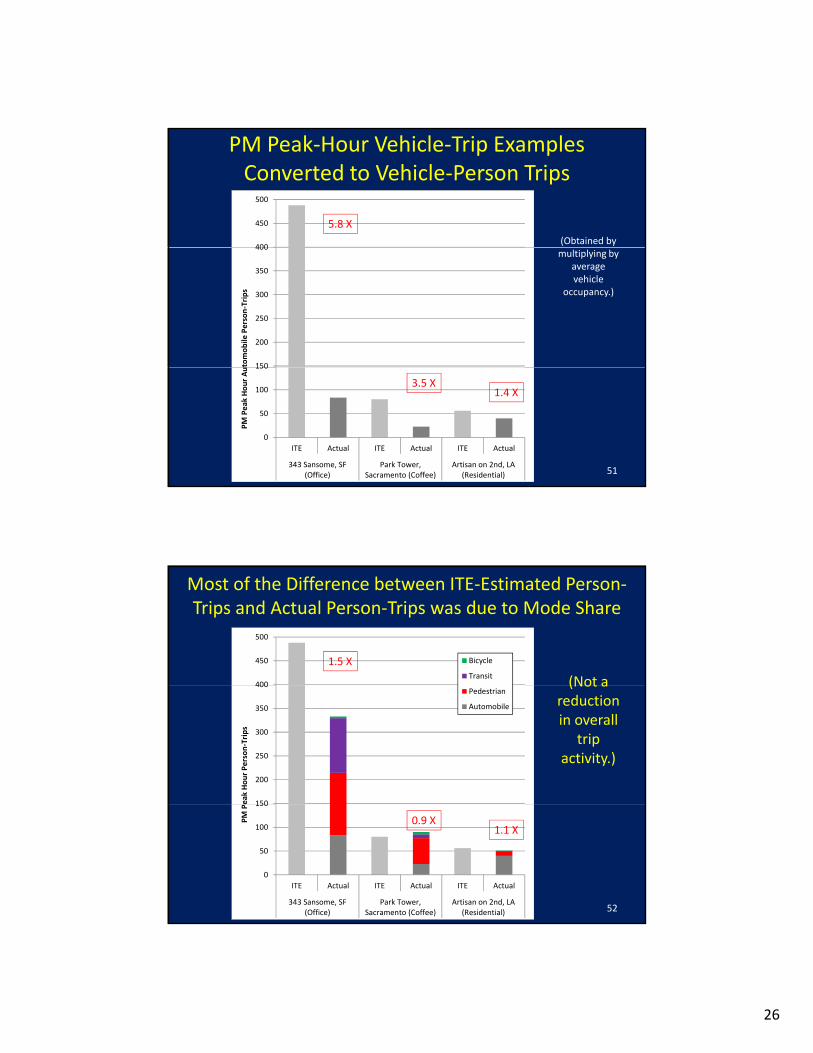
26
400
450
500
PM Peak‐Hour Vehicle‐Trip Examples Converted to Vehicle‐Person Trips
5.8 X
(Obtained by
150
200
250
300
350
400tomobile
Person‐Trips
multiplying by average vehicle
occupancy.)
0
50
100
150
ITE Actual ITE Actual ITE Actual
343 Sansome, SF(Office)
Park Tower,Sacramento (Coffee)
Artisan on 2nd, LA(Residential)
PM Peak Hour Au
51
3.5 X1.4 X
400
450
500
Bicycle
Transit
Most of the Difference between ITE‐Estimated Person‐Trips and Actual Person‐Trips was due to Mode Share
1.5 X
(Not a
150
200
250
300
350
400
Peak Hour Person‐Trips
Pedestrian
Automobile
(Not a reduction in overall
trip activity.)
0
50
100
150
ITE Actual ITE Actual ITE Actual
343 Sansome, SF(Office)
Park Tower,Sacramento (Coffee)
Artisan on 2nd, LA(Residential)
PM P
52
0.9 X1.1 X
27
• On average, ITE‐estimated person‐trips
Most of the Difference between ITE‐Estimated Person‐Trips and Actual Person‐Trips was due to Mode Share
were:–1.1 times higher than actual person‐trips in the AM peak hour
– 1.3 times higher than actual t i i th PM k h
53
person‐trips in the PM peak hour
SMART GROWTH TRIP‐GENERATION ADJUSTMENT TOOL
54
28
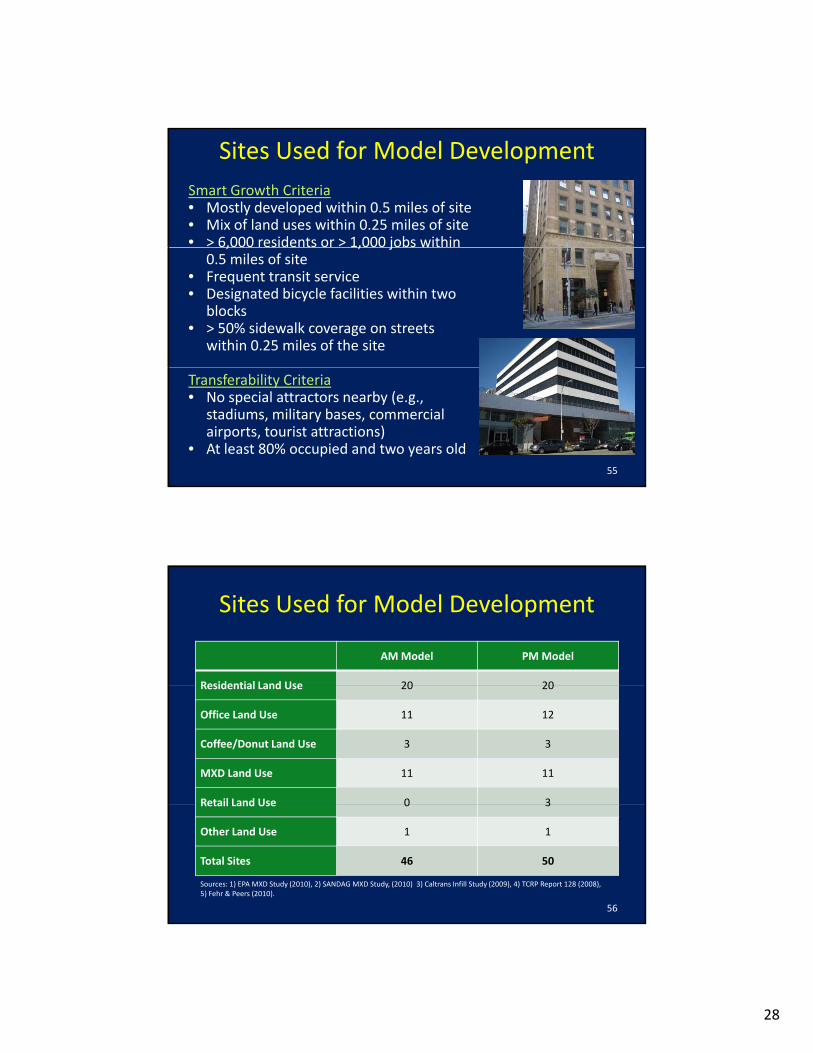
Smart Growth Criteria• Mostly developed within 0.5 miles of site• Mix of land uses within 0.25 miles of site• > 6,000 residents or > 1,000 jobs within
Sites Used for Model Development
, , j0.5 miles of site
• Frequent transit service• Designated bicycle facilities within two
blocks• > 50% sidewalk coverage on streets
within 0.25 miles of the site
55
Transferability Criteria• No special attractors nearby (e.g.,
stadiums, military bases, commercial airports, tourist attractions)
• At least 80% occupied and two years old
Sites Used for Model Development
AM Model PM Model
Residential Land Use 20 20Residential Land Use 20 20
Office Land Use 11 12
Coffee/Donut Land Use 3 3
MXD Land Use 11 11
Retail Land Use 0 3
Sources: 1) EPA MXD Study (2010), 2) SANDAG MXD Study, (2010) 3) Caltrans Infill Study (2009), 4) TCRP Report 128 (2008), 5) Fehr & Peers (2010).
56
Retail Land Use 0 3
Other Land Use 1 1
Total Sites 46 50

29
Database Development: Added Variables
• Site Land Use Category
Office land use
• Land Use Mix Category
Number of commercial– Office land use
– Residential land use
– Service (Coffee Shop) land use
• Density Category
– Number of commercial retail and service properties within one‐quarter mile of study site.
– Number of different categories of retail and service properties within
– Number of jobs within one‐half mile of study site
– Number of residents within one‐half mile of study site
one‐quarter mile of study site.
57
Database Development: Added Variables
• Transportation Category– Metered parking on streets
• Socioeconomics Category– Proportion of housing units
adjacent to study site– Proportion of arterial and
collector roadways with designated bicycle facilities within one‐half mile of study site
– Study site is located within one‐half mile of a rail
within one‐half mile of study site that are rented
– Proportion of population within one‐half mile of study site that is younger than age 15
– Proportion of population within one‐half mile of
station– Metered parking adjacent
to site
study site that is female– Proportion of households
within one‐half mile of study site that do not own a motor vehicle
58
30
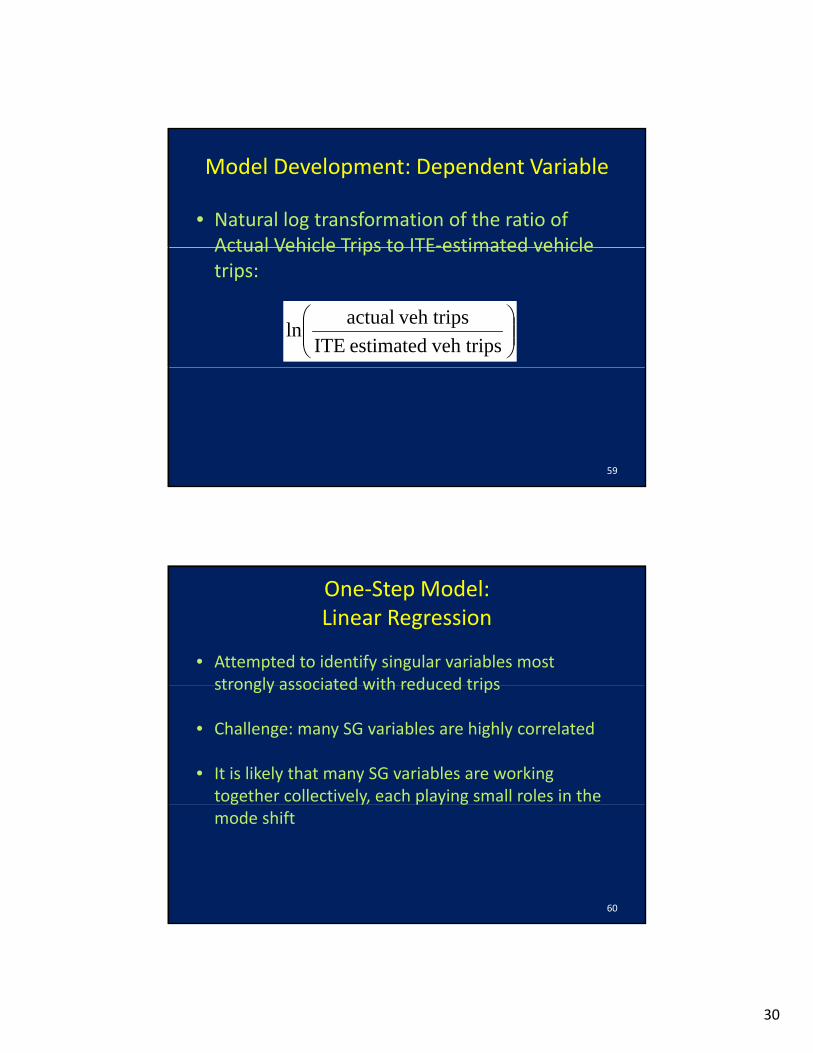
Model Development: Dependent Variable
• Natural log transformation of the ratio of Actual Vehicle Trips to ITE‐estimated vehicleActual Vehicle Trips to ITE estimated vehicle trips:
veh tripsestimated ITE
veh tripsactualln
59
One‐Step Model: Linear Regression
• Attempted to identify singular variables most strongly associated with reduced tripsstrongly associated with reduced trips
• Challenge: many SG variables are highly correlated
• It is likely that many SG variables are working together collectively, each playing small roles in the mode shift
60
31
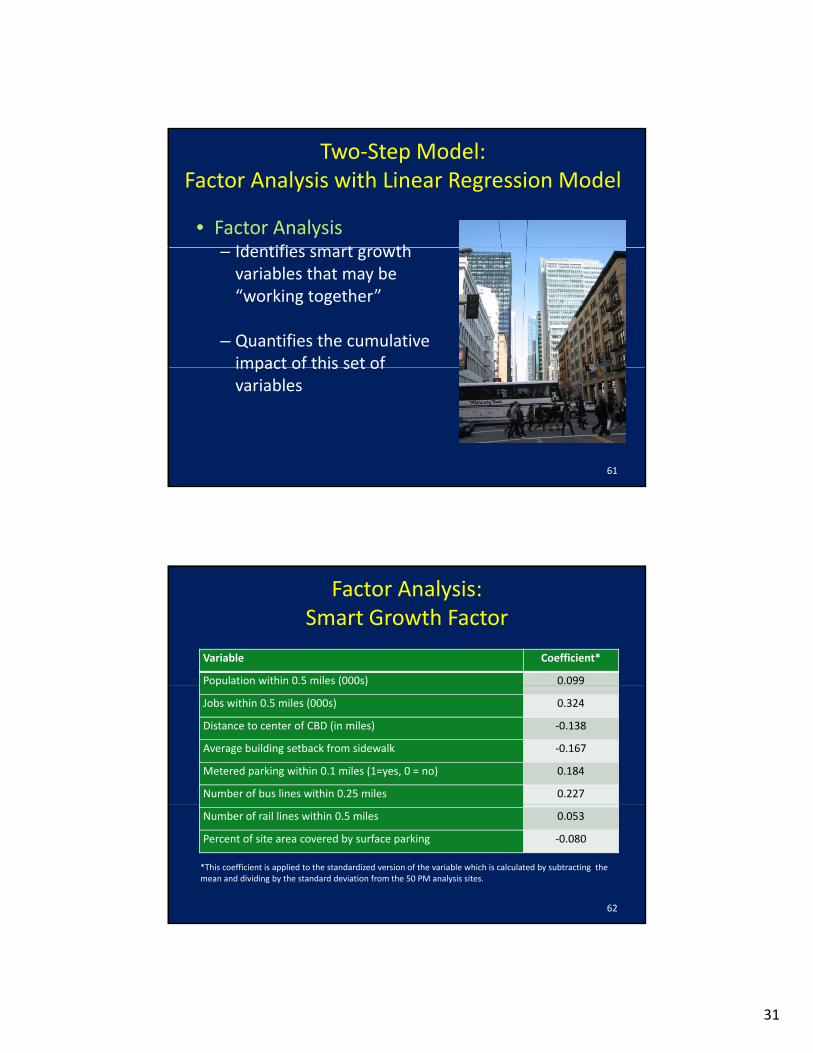
Two‐Step Model: Factor Analysis with Linear Regression Model
• Factor AnalysisId tifi t th– Identifies smart growth variables that may be “working together”
– Quantifies the cumulative impact of this set ofimpact of this set of variables
61
Factor Analysis: Smart Growth Factor
Variable Coefficient*
Population within 0.5 miles (000s) 0.099p ( )
Jobs within 0.5 miles (000s) 0.324
Distance to center of CBD (in miles) ‐0.138
Average building setback from sidewalk ‐0.167
Metered parking within 0.1 miles (1=yes, 0 = no) 0.184
Number of bus lines within 0.25 miles 0.227
62
Number of rail lines within 0.5 miles 0.053
Percent of site area covered by surface parking ‐0.080
*This coefficient is applied to the standardized version of the variable which is calculated by subtracting the mean and dividing by the standard deviation from the 50 PM analysis sites.
32
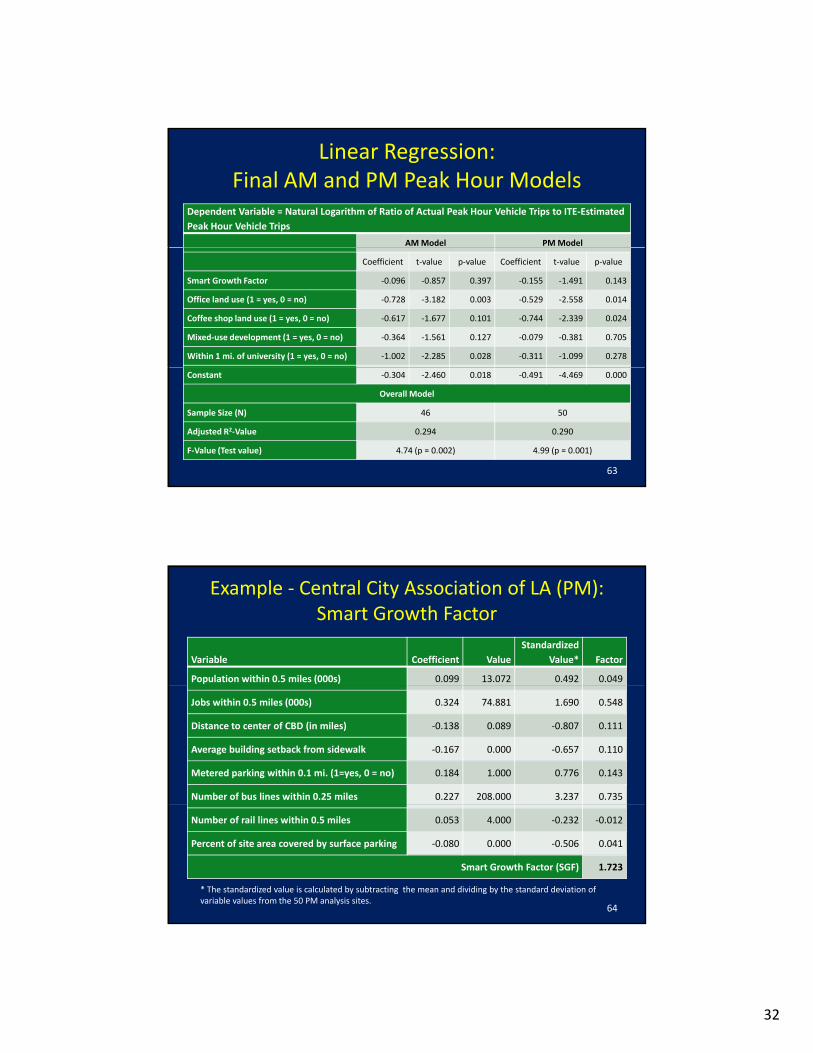
Linear Regression: Final AM and PM Peak Hour Models
Dependent Variable = Natural Logarithm of Ratio of Actual Peak Hour Vehicle Trips to ITE‐Estimated
Peak Hour Vehicle Trips
AM Model PM Model
Coefficient t‐value p‐value Coefficient t‐value p‐value
Smart Growth Factor ‐0.096 ‐0.857 0.397 ‐0.155 ‐1.491 0.143
Office land use (1 = yes, 0 = no) ‐0.728 ‐3.182 0.003 ‐0.529 ‐2.558 0.014
Coffee shop land use (1 = yes, 0 = no) ‐0.617 ‐1.677 0.101 ‐0.744 ‐2.339 0.024
Mixed‐use development (1 = yes, 0 = no) ‐0.364 ‐1.561 0.127 ‐0.079 ‐0.381 0.705
Within 1 mi. of university (1 = yes, 0 = no) ‐1.002 ‐2.285 0.028 ‐0.311 ‐1.099 0.278
63
Constant ‐0.304 ‐2.460 0.018 ‐0.491 ‐4.469 0.000
Overall Model
Sample Size (N) 46 50
Adjusted R2‐Value 0.294 0.290
F‐Value (Test value) 4.74 (p = 0.002) 4.99 (p = 0.001)
Example ‐ Central City Association of LA (PM):Smart Growth Factor
Variable Coefficient Value
Standardized
Value* Factor
Population within 0.5 miles (000s) 0.099 13.072 0.492 0.049
Jobs within 0.5 miles (000s) 0.324 74.881 1.690 0.548
Distance to center of CBD (in miles) ‐0.138 0.089 ‐0.807 0.111
Average building setback from sidewalk ‐0.167 0.000 ‐0.657 0.110
Metered parking within 0.1 mi. (1=yes, 0 = no) 0.184 1.000 0.776 0.143
Number of bus lines within 0.25 miles 0.227 208.000 3.237 0.735
64
Number of rail lines within 0.5 miles 0.053 4.000 ‐0.232 ‐0.012
Percent of site area covered by surface parking ‐0.080 0.000 ‐0.506 0.041
Smart Growth Factor (SGF) 1.723
* The standardized value is calculated by subtracting the mean and dividing by the standard deviation of variable values from the 50 PM analysis sites.
33
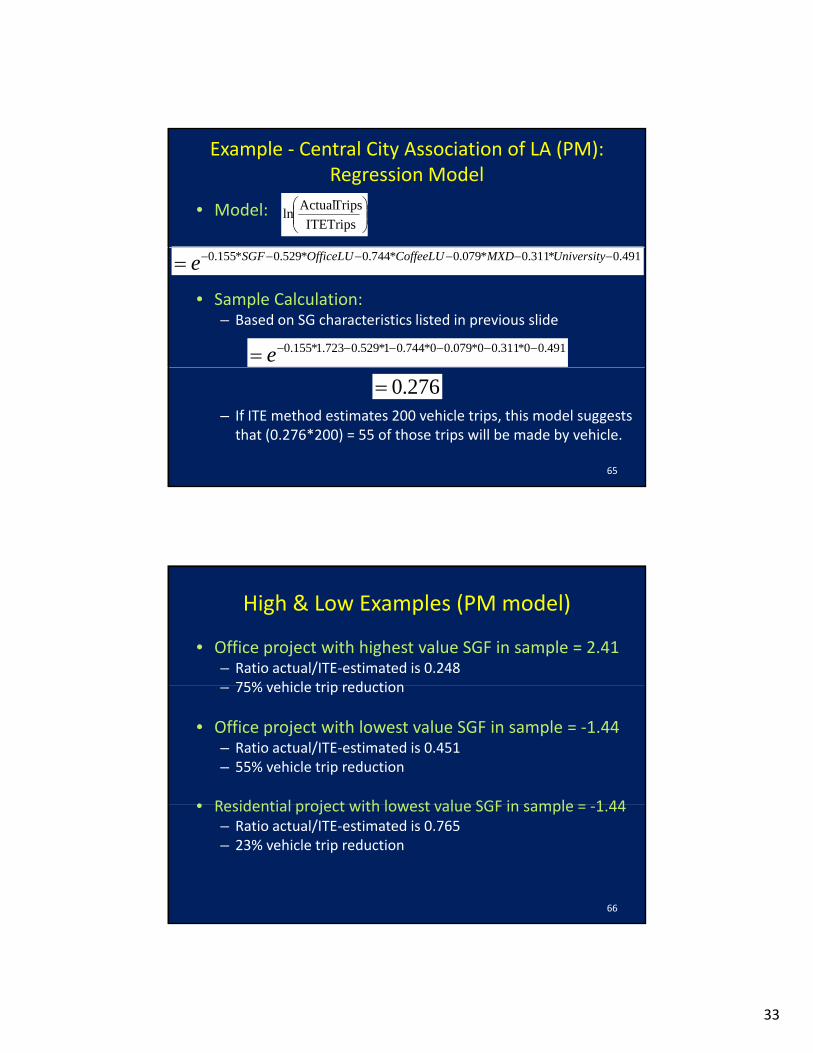
• Model:
Trips ITE
Trips Actualln
Example ‐ Central City Association of LA (PM):Regression Model
• Sample Calculation:– Based on SG characteristics listed in previous slide
491.0*311.0*079.0*744.0*529.0*155.0 UniversityMXDCoffeeLUOfficeLUSGFe
491.00*311.00*079.00*744.01*529.0723.1*155.0 e
– If ITE method estimates 200 vehicle trips, this model suggests that (0.276*200) = 55 of those trips will be made by vehicle.
65
276.0
High & Low Examples (PM model)
• Office project with highest value SGF in sample = 2.41– Ratio actual/ITE‐estimated is 0.24875% vehicle trip reduction– 75% vehicle trip reduction
• Office project with lowest value SGF in sample = ‐1.44– Ratio actual/ITE‐estimated is 0.451– 55% vehicle trip reduction
• Residential project with lowest value SGF in sample = 1 44• Residential project with lowest value SGF in sample = ‐1.44– Ratio actual/ITE‐estimated is 0.765– 23% vehicle trip reduction
66
34
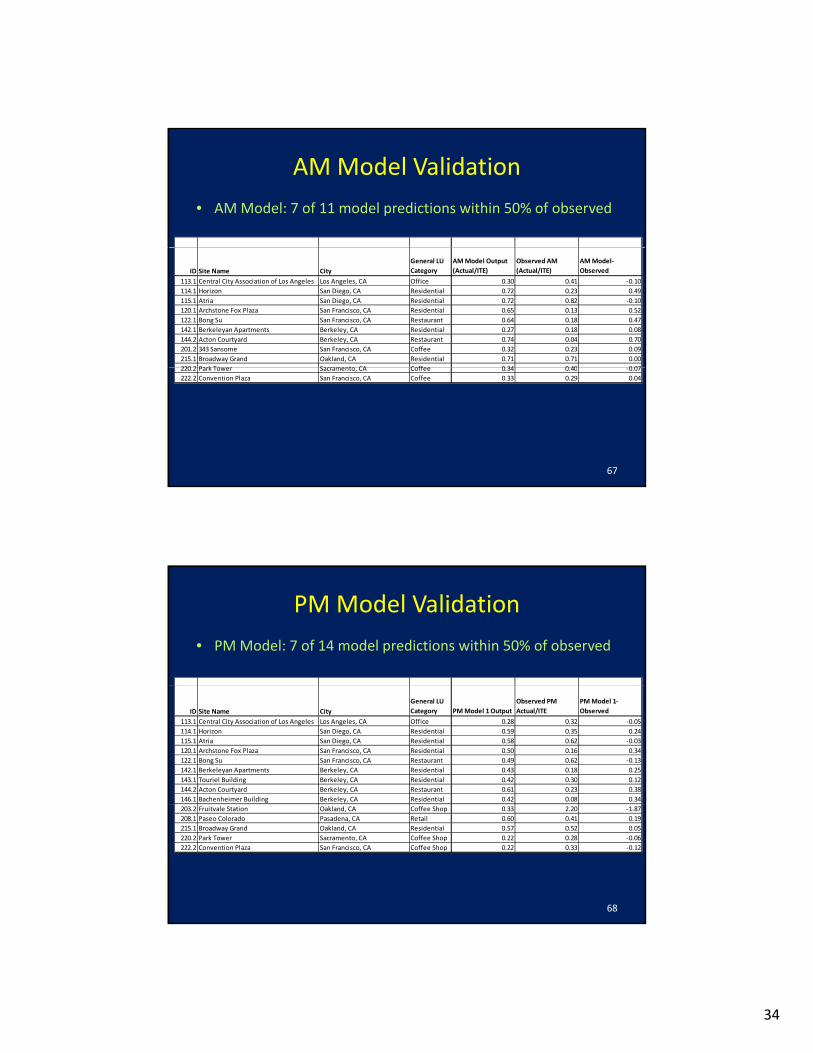
AM Model Validation
• AM Model: 7 of 11 model predictions within 50% of observed
ID Site Name City
General LU
Category
AM Model Output
(Actual/ITE)
Observed AM
(Actual/ITE)
AM Model‐
Observed
113.1 Central City Association of Los Angeles Los Angeles, CA Office 0.30 0.41 ‐0.10
114.1 Horizon San Diego, CA Residential 0.72 0.23 0.49
115.1 Atria San Diego, CA Residential 0.72 0.82 ‐0.10
120.1 Archstone Fox Plaza San Francisco, CA Residential 0.65 0.13 0.52
122.1 Bong Su San Francisco, CA Restaurant 0.64 0.18 0.47
142.1 Berkeleyan Apartments Berkeley, CA Residential 0.27 0.18 0.08
144.2 Acton Courtyard Berkeley, CA Restaurant 0.74 0.04 0.70
201.2 343 Sansome San Francisco, CA Coffee 0.32 0.23 0.09
215.1 Broadway Grand Oakland, CA Residential 0.71 0.71 0.00
220 2 Park To er Sacramento CA Coffee 0 34 0 40 0 07
67
220.2 Park Tower Sacramento, CA Coffee 0.34 0.40 ‐0.07
222.2 Convention Plaza San Francisco, CA Coffee 0.33 0.29 0.04
PM Model Validation
• PM Model: 7 of 14 model predictions within 50% of observed
ID Site Name City
General LU
Category PM Model 1 Output
Observed PM
Actual/ITE
PM Model 1‐
Observed
113.1 Central City Association of Los Angeles Los Angeles, CA Office 0.28 0.32 ‐0.05
114.1 Horizon San Diego, CA Residential 0.59 0.35 0.24
115.1 Atria San Diego, CA Residential 0.58 0.62 ‐0.03
120.1 Archstone Fox Plaza San Francisco, CA Residential 0.50 0.16 0.34
122.1 Bong Su San Francisco, CA Restaurant 0.49 0.62 ‐0.13
142.1 Berkeleyan Apartments Berkeley, CA Residential 0.43 0.18 0.25
143.1 Touriel Building Berkeley, CA Residential 0.42 0.30 0.12
144.2 Acton Courtyard Berkeley, CA Restaurant 0.61 0.23 0.38
146.1 Bachenheimer Building Berkeley, CA Residential 0.42 0.08 0.34
68
203.2 Fruitvale Station Oakland, CA Coffee Shop 0.33 2.20 ‐1.87
208.1 Paseo Colorado Pasadena, CA Retail 0.60 0.41 0.19
215.1 Broadway Grand Oakland, CA Residential 0.57 0.52 0.05
220.2 Park Tower Sacramento, CA Coffee Shop 0.22 0.28 ‐0.06
222.2 Convention Plaza San Francisco, CA Coffee Shop 0.22 0.33 ‐0.12

35
AM Model Validation
2.50
AM Model Output vs. Observed Values
1.00
1.50
2.00
bserved Values (Actual/ITE)
Line shows where model = observed
69
0.00
0.50
0.00 0.50 1.00 1.50 2.00 2.50
Ob
Model Values (Actual/ITE)
PM Model Validation
2.50
PM Model Output vs. Observed Values
Busy PM coffee shop in auto‐oriented shopping complex
1.00
1.50
2.00
bserved Values (Actual/ITE)
Line shows where model = observed
oriented shopping complex
70
0.00
0.50
0.00 0.50 1.00 1.50 2.00 2.50
Ob
Model Values (Actual/ITE)
36
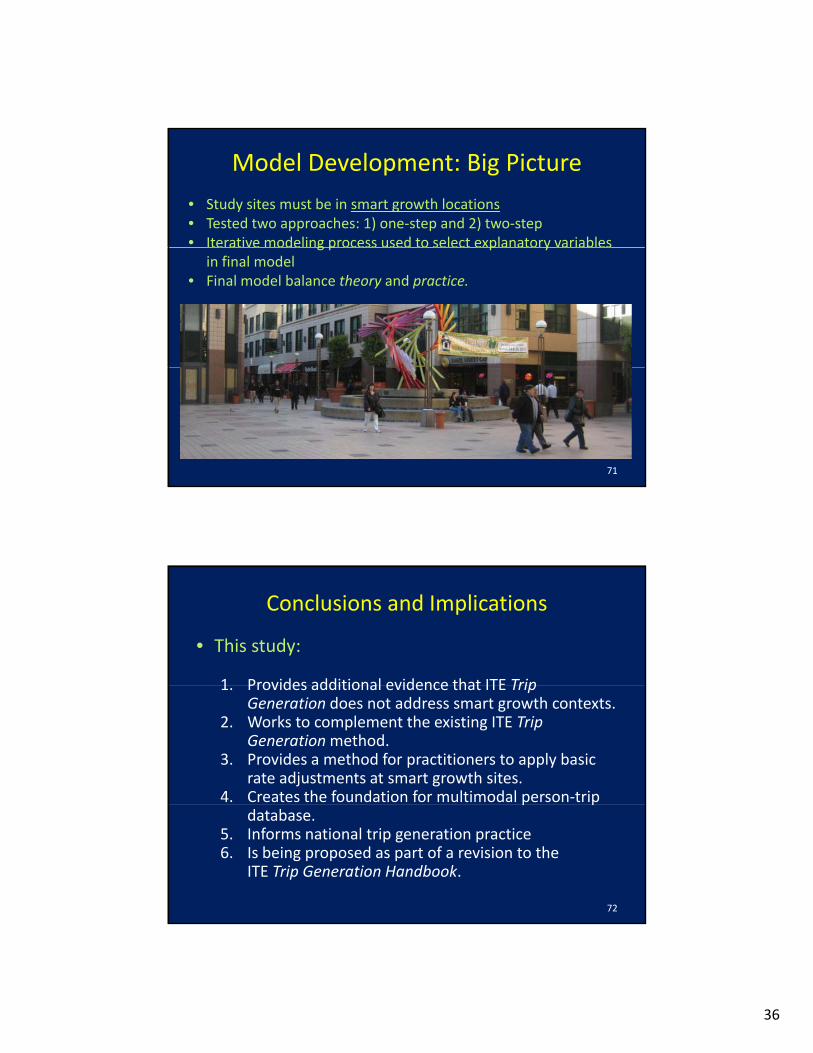
Model Development: Big Picture
• Study sites must be in smart growth locations• Tested two approaches: 1) one‐step and 2) two‐step• Iterative modeling process used to select explanatory variables g p p y
in final model• Final model balance theory and practice.
71
Conclusions and Implications
• This study:
1 Provides additional evidence that ITE Trip1. Provides additional evidence that ITE Trip Generation does not address smart growth contexts.
2. Works to complement the existing ITE Trip Generationmethod.
3. Provides a method for practitioners to apply basic rate adjustments at smart growth sites.
4. Creates the foundation for multimodal person‐trip p pdatabase.
5. Informs national trip generation practice 6. Is being proposed as part of a revision to the
ITE Trip Generation Handbook.
72

37
Acknowledgements
• California Department of Transportation– Terry Parker, Project Manager
• Data collection/methodology– Brian Bochner, PE, PTP, PTOE, Texas
Transportation Institute– Benjamin Sperry, PhD., Texas Transportation
Institute
• Data CollectionData Collection– Ewald & Wasserman Research Consultants– Gene Bregman & Associates– Manpower, Inc.
73
Image source: Benjamin Sperry
Acknowledgements
• Other: Existing methodology review, Data Management QA/QCData Management, QA/QC– Richard Lee, Ph.D., UC Davis– Deb Niemeier, Ph.D., UC Davis– Josh Miller, UC Davis– Rachael Maiss , UC Davis– Calvin Thigpen, UC Davis– Mary Madison Campbell, UC Davis
• Property managers and developers
74
Image source: Benjamin Sperry
38
Acknowledgements
• Caltrans Division of Research & Innovation (DRI)
• Federal Highway Administration (FHWA)
• Practitioner Panel:– Marc Birnbaum, Caltrans– Brian Bochner, Texas Transportation Institute– Ann Cheng, TransForm– Charlie Clouse, TPG Inc.– Paul Crabtree, Townworks + DPZ– Pat Gibson, Gibson Transportation Consulting
Samir Haijiri City of San Diego– Samir Haijiri, City of San Diego– Pang Ho, PH Associates– Don Hubbard, Parsons Brinckerhoff– Eric Ruehr, VRPA Technologies, Inc.– Edward Sullivan, Economic & Planning Systems
75
Questions & Discussion
76
For more information, see the project website:
http://ultrans.its.ucdavis.edu/projects/smart‐growth‐trip‐generation