Embed Size (px)
Citation preview
CALIFORNIA STATE LOTTERY FUND
Financial Statements
June 30, 2014
(With Independent Auditors’ Report Thereon)

KPMG LLP 500 Capitol Mall, Ste 2100 Sacramento, CA 95814-4754
KPMG LLP is a Delaware limited liability partnership, the U.S. member firm of KPMG International Cooperative (“KPMG International”), a Swiss entity.
Independent Auditors’ Report
The California State Lottery Commission
Sacramento, California
We have audited the accompanying statement of net position of the California State Lottery Fund (the
Lottery) as of June 30, 2014, and the related statements of revenues, expenses, and changes in net position
and cash flows for the year then ended, and the related notes to the financial statements.
Management’s Responsibility for the Financial Statements
Management is responsible for the preparation and fair presentation of these financial statements in
accordance with accounting principles generally accepted in the United States of America; this includes the
design, implementation, and maintenance of internal control relevant to the preparation and fair presentation
of financial statements that are free from material misstatement, whether due to fraud or error.
Auditors’ Responsibility
Our responsibility is to express an opinion on these financial statements based on our audit. We conducted
our audit in accordance with auditing standards generally accepted in the United States of America. Those
standards require that we plan and perform the audit to obtain reasonable assurance about whether the
financial statements are free from material misstatement.
An audit involves performing procedures to obtain audit evidence about the amounts and disclosures in the
financial statements. The procedures selected depend on the auditor’s judgment, including the assessment of
the risks of material misstatement of the financial statements, whether due to fraud or error. In making those
risk assessments, the auditor considers internal control relevant to the entity’s preparation and fair
presentation of the financial statements in order to design audit procedures that are appropriate in the
circumstances, but not for the purpose of expressing an opinion on the effectiveness of the entity's internal
control. Accordingly, we express no such opinion. An audit also includes evaluating the appropriateness of
accounting policies used and the reasonableness of significant accounting estimates made by management,
as well as evaluating the overall presentation of the financial statements.
We believe that the audit evidence we have obtained is sufficient and appropriate to provide a basis for our
audit opinion.
Opinion
In our opinion, the financial statements referred to above present fairly, in all material respects, the financial
position of the California State Lottery Fund as of June 30, 2014, and the changes in its financial position
and its cash flows thereof for the year then ended in accordance with accounting principles generally accepted
in the United States of America.

2
Emphasis of Matter
As discussed in note 1, the financial statements present only the California State Lottery Fund and do not
purport to, and do not, present fairly the financial position of the State of California as of June 30, 2014, the
changes in its financial position, or, where applicable, its cash flows for the year then ended in accordance
with accounting principles generally accepted in the United States of America. Our opinion is not modified
with respect to this matter.
Required Supplementary Information
Accounting principles generally accepted in the United States of America require that the management's
discussion and analysis on pages 3–9 be presented to supplement the basic financial statements. Such
information, although not a part of the basic financial statements, is required by the Governmental
Accounting Standards Board who considers it to be an essential part of financial reporting for placing the
basic financial statements in an appropriate operational, economic, or historical context. We have applied
certain limited procedures to the required supplementary information in accordance with auditing standards
generally accepted in the United States of America, which consisted of inquiries of management about the
methods of preparing the information and comparing the information for consistency with management’s
responses to our inquiries, the basic financial statements, and other knowledge we obtained during our audit
of the basic financial statements. We do not express an opinion or provide any assurance on the information
because the limited procedures do not provide us with sufficient evidence to express an opinion or provide
any assurance.
Sacramento, California
October 14, 2014

- 3 -
The following discussion and analysis of the California State Lottery’s fi nancial performance provides an overview of fi nancial activities for the fi scal year ended June 30, 2014. Please read it in conjunction with the California State Lottery Financial Statements that follow this section.
FINANCIAL HIGHLIGHTS
Fiscal year 2013-14 saw sales of $5.03 billion, once again the highest sales in California State Lottery (Lottery) history. This represents an increase of approximately $588.8 million or 13.2 percent over the prior year.
The funds the Lottery allocated to California public schools were also the highest in Lottery history at nearly $1.35 billion, making this the 14th consecutive year the Lottery has transferred over $1 billion to its benefi ciary.
Scratchers® games, Lotto games, and Hot Spot® continue to be strong performers:
○ Lotto games - Powerball®, Mega Millions®, and SuperLotto Plus® - had a combined growth of 31.5 percent or $295 million during 2013-14. The fi rst full year of Powerball sales, and large jackpots in both Powerball and Mega Millions, contributed to this growth.
○ The Hot Spot monitor game had a sales increase of 22 percent or $34 million over the last fi scal year. This is the fourth straight year sales for this popular Keno-style game have increased.
○ Scratchers revenues exceeded those of the previous fi scal year by 9.3 percent or $278.8 million. The increase in Scratchers sales was due to continued demand for $5 and $10 price-point tickets and the introduction of the Lottery’s fi rst $20 price-point game.
The Lottery returned more than $3.4 billion to the public in the form of prizes and retailer compensation. Of this, the Lottery paid approximately $3.1 billion in prizes to players, and approximately $345.5 million in commissions, cashing bonuses, and other applicable fees to retailers.
The assets of the Lottery were $101.1 million greater than the liabilities for the year ended June 30, 2014, which is attributable primarily to realized and unrealized gains on Lottery investments used to fund future payments due on annuitized Lottery prizes.
OVERVIEW OF THE FINANCIAL STATEMENTS
These required statements offer short-term and long-term fi nancial information about the Lottery. The statement of net position provides information about the nature and amounts of investments in resources (assets) and obligations (liabilities) at the close of the fi scal year. All of the current year’s revenues and expenses are accounted for in the statement of revenues, expenses, and changes in net position. This statement measures the success of the Lottery’s operations over the past year. The fi nal required fi nancial statement is the statement of cash fl ows. The primary purpose of this statement is to provide information about the Lottery’s cash receipts and cash payments during the reporting period. The statement reports cash receipts, cash payments, and net changes in cash resulting from operations, investing, and fi nancing activities, and provides answers to such questions as where did cash come from and what was cash used for. The fi nancial statements are prepared on the accrual basis in accordance with accounting principles generally accepted in the United States of America. The Lottery is structured as a single enterprise fund with revenues recognized when earned, not when received.
MANAGEMENT’S DISCUSSION AND ANALYSIS
- 4 -
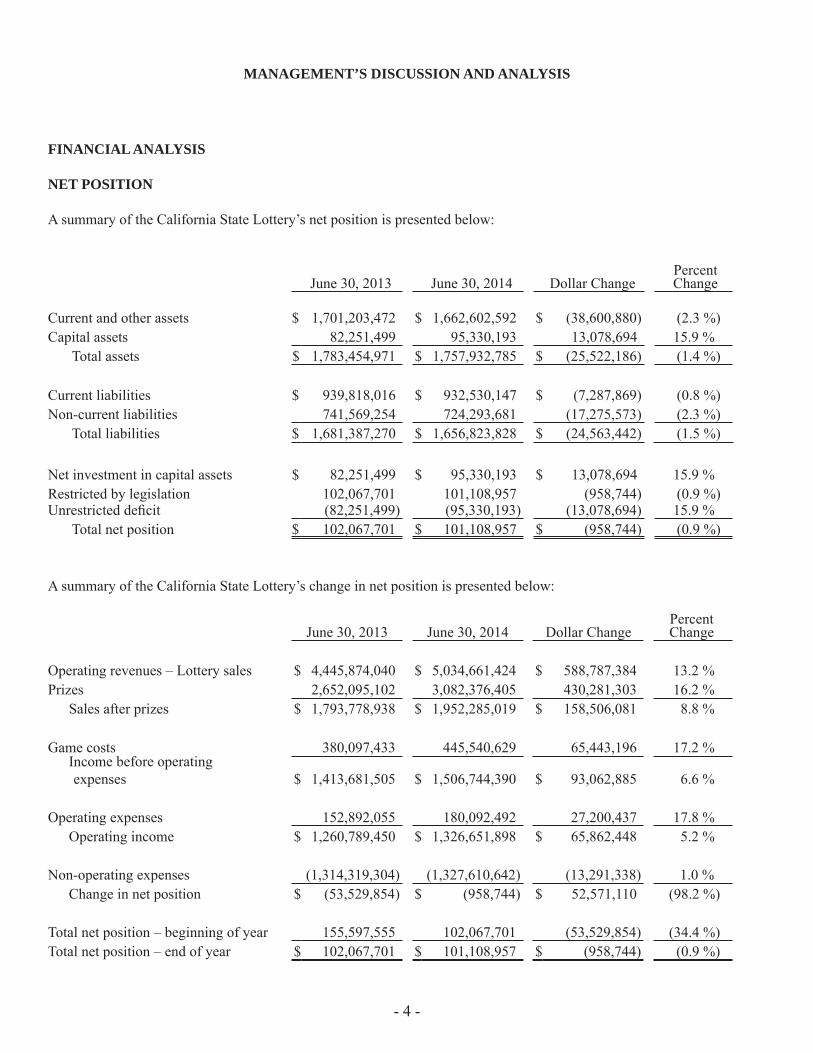
June 30, 2013 June 30, 2014 Dollar ChangePercent Change
Current and other assets $ 1,701,203,472 $ 1,662,602,592 $ (38,600,880) (2.3 %)Capital assets 82,251,499 95,330,193 13,078,694 15.9 % Total assets $ 1,783,454,971 $ 1,757,932,785 $ (25,522,186) (1.4 %)
Current liabilities $ 939,818,016 $ 932,530,147 $ (7,287,869) (0.8 %)Non-current liabilities 741,569,254 724,293,681 (17,275,573) (2.3 %) Total liabilities $ 1,681,387,270 $ 1,656,823,828 $ (24,563,442) (1.5 %)
Net investment in capital assets $ 82,251,499 $ 95,330,193 $ 13,078,694 15.9 %Restricted by legislation 102,067,701 101,108,957 (958,744) (0.9 %)Unrestricted defi cit (82,251,499) (95,330,193) (13,078,694) 15.9 % Total net position $ 102,067,701 $ 101,108,957 $ (958,744) (0.9 %)
A summary of the California State Lottery’s change in net position is presented below:
June 30, 2013 June 30, 2014 Dollar ChangePercent Change
Operating revenues – Lottery sales $ 4,445,874,040 $ 5,034,661,424 $ 588,787,384 13.2 %Prizes 2,652,095,102 3,082,376,405 430,281,303 16.2 % Sales after prizes $ 1,793,778,938 $ 1,952,285,019 $ 158,506,081 8.8 %
Game costs 380,097,433 445,540,629 65,443,196 17.2 % Income before operating expenses $ 1,413,681,505 $ 1,506,744,390 $ 93,062,885 6.6 %
Operating expenses 152,892,055 180,092,492 27,200,437 17.8 % Operating income $ 1,260,789,450 $ 1,326,651,898 $ 65,862,448 5.2 %
Non-operating expenses (1,314,319,304) (1,327,610,642) (13,291,338) 1.0 % Change in net position $ (53,529,854) $ (958,744) $ 52,571,110 (98.2 %)
Total net position – beginning of year 155,597,555 102,067,701 (53,529,854) (34.4 %)Total net position – end of year $ 102,067,701 $ 101,108,957 $ (958,744) (0.9 %)
FINANCIAL ANALYSIS
NET POSITION
A summary of the California State Lottery’s net position is presented below:
MANAGEMENT’S DISCUSSION AND ANALYSIS

- 5 -
June 30, 2013 June 30, 2014 Dollar ChangePercent Change
Operating revenues:Lotto games $ 935,660,488 $ 1,230,661,985 $ 295,001,497 31.5 %Scratchers games 3,010,119,929 3,288,922,307 278,802,378 9.3 %Hot Spot game 154,403,306 188,390,807 33,987,501 22.0 %Daily games 345,690,317 326,686,325 (19,003,992) (5.5 %) Total operating revenues $ 4,445,874,040 $ 5,034,661,424 $ 588,787,384 13.2 %
Non-operating revenues:Unrealized gains (losses) on investments $ (42,158,289) $ 4,829,544 $ 46,987,833 (111.5 %)Interest accreted/earned on investments 38,405,632 37,209,821 (1,195,811) (3.1 %)Interest on funds held by State Treasurer 1,220,691 1,249,094 28,403 2.3 %Other income 47,879 27,400 (20,479) (42.8 %) Total non-operating revenues $ (2,484,087) $ 43,315,859 $ 45,799,946 (1843.7 %)
Total revenues $ 4,443,389,953 $ 5,077,977,283 $ 634,587,330 14.3 %
Operating Revenues
Scratchers games65.3 %
Lotto games24.4 %
Hot Spot game 3.8 %
Daily games6.5 %
REVENUES
The following chart shows the major sources and the percentages of operating revenues for the fi scal year ended June 30, 2014:
A summary of total revenues for the fi scal years ended June 30, 2013 and 2014, and the amount and percentage of change in relation to prior year amounts is as follows:
MANAGEMENT’S DISCUSSION AND ANALYSIS

- 6 -
REVENUES (continued)
Lottery operating revenue increased $588.8 million or 13.2 percent over the previous year, increasing to more than $5 billion. Lotto games led this increase in sales, with a growth of 31.5 percent or $295 million, due to large jackpots in both the Mega Millions and Powerball games. Hot Spot sales increased 22 percent during 2013-14, the fi rst full year of higher prize payouts for this game. Promotions and an increase in social media related to Hot Spot also helped to increase sales. Scratchers sales increased 9.3 percent over the previous year primarily due to the introduction of a $20 price-point game as well as the continued popularity of $5 and $10 price-point games. Non-operating revenue increased $45.8 million due primarily to unrealized gains on investments purchased to pay annuitized prizes. EXPENSES
Prizes and Operating Income Returned to the Public, and Expenses of the Lottery as a Percentage of Operating Revenues
Prizes61.2 %
Retailer costs6.8 %
Game costs2.0 %
Operating expenses3.6 %
The following chart shows prizes, game costs, operating expenses, and allocation to education as a percentage of operating revenues for the fi scal year ended June 30, 2014:
Operating income to education26.4 %
MANAGEMENT’S DISCUSSION AND ANALYSIS

- 7 -
EXPENSES (continued)
The Lottery is required to return not less than 87 percent of annual revenues to the public in the form of prizes and contributions to education, and to spend no more than 13 percent of annual revenues on operating expenses of the Lottery.
Lottery prize payments, contributions to education, and operating expenses are shown below as a percentage of operating revenue for the year ended June 30, 2014.
Lottery Sales $ 5,034,661,424 100.0 %
Revenue returned to the public
Prizes $ 3,082,376,405 61.2 % Operating income to education 1,326,663,398 26.4 %
Total revenue returned to the public $ 4,409,039,803 87.6 %
Expenses of the Lottery
Retailer costs $ 345,513,054 6.8 % Game costs 100,027,575 2.0 % Operating expenses 180,092,492 3.6 % Less bartered operating expenses (11,500) 0.00 %
Total expenses of the Lottery $ 625,621,621 12.4 %
A summary of the total funds transferred by the Lottery to the education community for the fi scal year ended June 30, 2014, is shown below.
Revenues to Education Allocation of sales - operating income $ 1,326,663,398 Unclaimed prizes directly allocated to the Education Fund 21,672,671 Interest income 1,249,094 Other income 27,400 Less bartered income (11,500)
Total declared for allocation to the Education Fund $ 1,349,601,063
MANAGEMENT’S DISCUSSION AND ANALYSIS

- 8 -
EXPENSES (continued)
A summary of expenses for the fi scal years ended June 30, 2013 and 2014, and the amount and percentage change in relation to prior year amounts is as follows:
June 30, 2013 June 30, 2014 Dollar ChangePercent Change
Prizes:Draw game prizes $ 723,654,671 $ 879,474,109 $ 155,819,438 21.5 %Scratchers game prizes 1,928,440,431 2,202,902,296 274,461,865 14.2 % Total prizes $ 2,652,095,102 $ 3,082,376,405 $ 430,281,303 16.2 %
Game costs:Retailer costs $ 302,946,127 $ 345,513,054 $ 42,566,927 14.1 %Draw/Scratchers game costs 77,151,306 100,027,575 22,876,269 29.7 % Total game costs $ 380,097,433 $ 445,540,629 $ 65,443,196 17.2 %
Operating expenses:Salaries, wages, and benefi ts $ 56,781,125 $ 66,108,672 $ 9,327,547 16.4 %Advertising 56,044,193 63,699,190 7,654,997 13.7 %Promotion, public relations, and point of sale 7,854,549 14,507,326 6,652,777 84.7 %Other professional services 12,651,314 13,331,461 680,147 5.4 %Depreciation and amortization 5,980,272 6,075,176 94,904 1.6 %Other general and administrative expenses 13,580,602 16,370,667 2,790,065 20.5 % Total operating expenses $ 152,892,055 $ 180,092,492 $ 27,200,437 17.8 %
Non-operating expenses:Allocation to Education Fund $ 1,262,058,020 $ 1,327,928,392 $ 65,870,372 5.2 %Interest imputed on annuitized prize liability 49,777,197 42,998,109 (6,779,088) (13.6 %) Total non-operating expenses $ 1,311,835,217 $ 1,370,926,501 $ 59,091,284 4.5 %
Total expenses $ 4,496,919,807 $ 5,078,936,027 $ 582,016,220 12.9 %
Prize expense and game costs increased as sales increased. Additionally, Scratchers prize expense increased due to the continued emphasis on games with higher prize payouts, and game costs increased with the purchase of gaming equipment and signs. Advertising expense increased due primarily to a Powerball awareness campaign and to more jackpot alerts. The increase in promotion, public relations and point of sale was due to a point of sale refresh effort, and to a new promotions team that held numerous promotional events throughout the state. Salaries increased as the Lottery added 61 positions during fi scal year 2013-14. Other general and administrative expense increased due to the additional staff, mobile devices supplied to the sales force, additional sales conferences, and costs related to a new method of shipping Scratchers tickets back to the warehouses.
MANAGEMENT’S DISCUSSION AND ANALYSIS

- 9 -
June 30, 2013 June 30, 2014 Dollar ChangePercent Change
Non-depreciable capital assets:Land $ 6,469,219 $ 6,469,219 $ - 0.0 %Depreciable capital assets:Gaming equipment $ $14,392,117 $ 14,362,992 $ (29,125) (0.2 %)Vending machines 30,044,295 43,462,289 13,417,994 44.7 %Buildings 69,986,320 69,986,320 - 0.0 %Data processing equipment 13,361,656 12,406,696 (954,960) (7.1 %)Offi ce furniture and equipment 7,642,537 7,756,106 113,569 1.5 %Leasehold improvements 813,658 813,658 - 0.0 %Other 6,579,301 8,495,074 1,915,773 29.1 % Subtotal $ 142,819,884 $ 157,283,135 $ 14,463,251 10.1 %
Less accumulated depreciation (67,037,604) (68,422,161) (1,384,557) 2.1 % Total depreciable capital assets $ 75,782,280 $ 88,860,974 $ 13,078,694 17.3 %
Capital assets, net $ 82,251,499 $ 95,330,193 $ 13,078,694 15.9 %
Capital assets increased 15.9 percent over the previous fi scal year primarily due to the purchase of new, updated vending machines. Additionally, the Lottery purchased vehicles for new sales staff, to replace old vehicles, and for use at promotional events. More information on the Lottery’s capital assets can be found in Note 5.
LONG - TERM DEBT
At June 30, 2014, the California State Lottery had approximately $724.3 million in non-current liabilities, a decrease of 2.3 percent over the previous fi scal year. This decrease is attributable to prize liability, as the majority of jackpot and annuity-level prize winners choose the cash option rather than annuitized payments. In addition, approximately $7.3 million was accrued for the Net OPEB Obligation (NOO) as required by Statement No. 45 of the Governmental Accounting Standards Board, bringing the total accrued OPEB liability to $41.1 million as of June 30, 2014. Additional detailed information on long-term prize liability may be found in Note 6 and additional information on the NOO may be found in Note 10.
CONTACTING THE LOTTERY’S FINANCIAL MANAGER
This fi nancial report is designed to provide a general overview of the Lottery’s fi nances and to demonstrate the accountability for the money the Lottery earns. If you have questions about this report or need additional fi nancial information, contact the California State Lottery, Finance Division, 700 N. 10th Street, Sacramento, CA 95811.
CAPITAL ASSETS
A summary of capital assets as of June 30, 2013 and 2014, and the amount and percentage of change in relation to prior year amounts is as follows:
MANAGEMENT’S DISCUSSION AND ANALYSIS

- 10 -
ASSETSCurrent assets: Cash and cash equivalents (Note 2) $ 316,260,517 Investments, current portion (Note 2) 116,629,017 Accounts receivable, net of allowances (Note 3) 404,238,835 Due from state funds (Note 4) 295,282 Ticket inventories 7,486,214 Other 5,303,833
Total current assets $ 850,213,698
Non-current assets: Investments, less current portion (Note 2) $ 796,206,592 Capital assets, net (Note 5) 95,330,193 Long-term prepaid charges, net 16,182,302
Total non-current assets $ 907,719,087
TOTAL ASSETS $ 1,757,932,785
LIABILITIES
Current liabilities: Accounts payable $ 52,691,594 Current prize liability (Note 6) 551,259,865 Due to state funds (Note 7) 314,911,688 Accrued liabilities 10,688,184 Unearned revenue 2,978,816
Total current liabilities $ 932,530,147
Non-current liabilities: Prize liability, less current portion (Note 6) $ 683,179,681 Other postemployment benefi ts (Note 10) 41,114,000
Total non-current liabilities $ 724,293,681
TOTAL LIABILITIES $ 1,656,823,828
Commitments and contingencies (Notes 8 and 11)
NET POSITION
Net investment in capital assets (Note 5) $ 95,330,193Restricted by legislation for prizes (Note 2) 101,108,957Unrestricted defi cit (95,330,193)
TOTAL NET POSITION $ 101,108,957
CALIFORNIA STATE LOTTERY FUNDSTATEMENT OF NET POSITION
JUNE 30, 2014
See accompanying notes to the fi nancial statements.

- 11 -
Operating revenues: Lottery sales $ 5,034,661,424 Prizes 3,082,376,405
Sales after prizes $ 1,952,285,019
Less game costs: Retailer costs $ 345,513,054 Draw game costs 70,486,877 Scratchers® game costs 29,540,698
Total game costs $ 445,540,629
Income before operating expenses $ 1,506,744,390
Operating expenses: Salaries, wages, and benefi ts $ 66,108,672 Advertising 63,699,190 Promotion, public relations, and point of sale 14,507,326 Other professional services 13,331,461 Depreciation and amortization 6,075,176 Other general and administrative expenses 16,370,667
Total operating expenses $ 180,092,492
Operating income $ 1,326,651,898
Non-operating (expenses) revenues: Investment earnings (Note 9) $ 43,288,459 Interest expense imputed on annuitized prize liability (42,998,109) Other income 27,400 Allocation to Education Fund (Note 7) (1,327,928,392)
Total non-operating expenses $ (1,327,610,642)
Change in net position $ (958,744)Total net position - beginning balance 102,067,701Total net position - ending balance $ 101,108,957
CALIFORNIA STATE LOTTERY FUNDSTATEMENT OF REVENUES, EXPENSES, AND CHANGES IN NET POSITION
YEAR ENDED JUNE 30, 2014
See accompanying notes to the fi nancial statements.

- 12 -
Cash fl ows from operating activities:Receipts from customers $ 5,013,486,952Payments for prizes (3,567,223,613)Payments to retailers (345,503,499)Payments to suppliers for goods and services (218,881,446)Payments to employees (50,725,767)Internal activity-payments to state funds (15,070,429)Receipts from other states 499,057,503Other receipts 141,301
Net cash fl ows provided by operating activities $ 1,315,281,002
Cash fl ows from non-capital fi nancing activities:Distributions to Education Fund $ (1,415,701,540)
Net cash fl ows used in non-capital fi nancing activities $ (1,415,701,540)
Cash fl ows from capital and related fi nancing activities: Proceeds from disposal of property and equipment $ 38,746 Payments for capital assets (19,177,790)
Net cash fl ows used in capital and related fi nancing activities $ (19,139,044)
Cash fl ows from investing activities: Purchase of securities $ (65,036,957) Proceeds from matured securities 134,853,000 Investment Portfolio and SMIF interest received 23,079,585
Net cash fl ows provided by investing activities $ 92,895,628
Decrease in cash and cash equivalents $ (26,663,954)
Cash and cash equivalents at July 1, 2013 $ 342,924,471
Cash and cash equivalents at June 30, 2014 $ 316,260,517
CALIFORNIA STATE LOTTERY FUNDSTATEMENT OF CASH FLOWS
YEAR ENDED JUNE 30, 2014
See accompanying notes to the fi nancial statements.

- 13 -
Cash fl ows from operating activities: Operating income $ 1,326,651,898 Adjustments to reconcile operating income to net cash provided by operating activities: Depreciation and amortization $ 6,075,176 Provision for doubtful accounts 464,780 Provision for returned tickets (175,065) Provision for free ticket redemptions 632,358 Net non-cash other postemployment cost 7,326,000 Net gain on retirement or disposal of capital assets (14,826) Other income 27,400 Changes in assets and liabilities: Increase in accounts receivable (42,663,781) Decrease in ticket inventories 376,915 Decrease in other assets 464,159 Decrease in long-term prepaid charges 3,230,391 Decrease in accounts payable (1,811,824) Increase in prize liability 14,210,295 Decrease in due to state funds (145,017) Increase in accrued liabilities 793,967 Decrease in unearned revenues (161,824)
Net cash fl ows provided by operating activities $ 1,315,281,002
Supplemental disclosure of non-cash activities:
Interest accreted on annuitized prizes $ 42,998,109
Unclaimed prizes directly allocated to the Education Fund $ 21,672,671
Unrealized gain on investments $ 4,829,544
Interest accreted on zero coupon bonds $ 15,608,267
CALIFORNIA STATE LOTTERY FUNDSTATEMENT OF CASH FLOWS
YEAR ENDED JUNE 30, 2014
See accompanying notes to the fi nancial statements.

- 14 -
1. SUMMARY OF SIGNIFICANT ACCOUNTING POLICIES
Organization
The California State Lottery Fund (the Fund) was created with the passage of the California State Lottery Act of 1984 (the Act). The Fund is a part of the primary government of the State of California and is reported as a proprietary fund and business-type activity within the State of California’s fi nancial statements. The purpose of the Act is to support the preservation of the rights, liberties, and welfare of the people by providing additional monies to benefi t education without the imposition of additional or increased taxes. The operations of the Fund are separate and distinct from other operations of the State of California.
On April 8, 2010, the Governor signed Assembly Bill (AB) 142 amending the Lottery Act to allow the Lottery to offer its players a higher prize payout percentage. Research shows that higher prize payouts result in increased sales revenues and thus will afford increased allocations to education. Under AB 142 beginning with the 2010-11 fi scal year, the Lottery is required to return not less than 87 percent of revenues to the public in the form of prizes and contributions to education, and to spend no more than 13 percent of revenues on operating expenses of the Lottery.
In addition, AB 142 requires that for each fi scal year beginning with 2010-11, the Lottery’s contribution to education under the new percentages be greater than it was in the 2008-09 base fi scal year; otherwise, the law reverts back to previous percentages. Previously, the Act mandated that, as nearly as practical, 50 percent of the total annual revenues from Lottery sales be returned to the public in the form of prizes, at least 34 percent be allocated to benefi t public education, and no more than 16 percent of the total annual revenues from sales of tickets or shares be allocated for payment of operating expenses of the Lottery.
Basis of Presentation
The Fund is accounted for as an enterprise fund. The fi nancial statements are prepared on the accrual basis of accounting and the economic resources measurement focus in accordance with accounting principles generally accepted in the United States of America. Operating revenue and expenses are those that result from providing services and producing and delivering goods and/or services. The principal operating revenue of the Fund is the sale of lottery tickets. The principal operating expenses of the Fund are prizes, retailer commissions, contractual services, advertising and marketing, salaries and benefi ts, and depreciation of assets.
Revenue Recognition – Scratchers Games
Sales of lottery tickets are made to the public through contracted retailers. Revenue is recognized upon the sale of tickets to the retailers for active games. An allowance is recognized for the retailers’ right to return unsold tickets. Operating revenue is reduced for free tickets. Retailers receive a commission of six percent which is recognized when tickets are sold to the retailers.
Revenue Recognition - Draw Games
Lottery sales are made to the public through gaming terminals at contracted retailers. Revenue is recognized upon the sale to the public. With the exception of Powerball® and Mega Millions®, the public has the right to cancel a sale on the same day before pool closure. All Powerball and Mega Millions sales are fi nal. The applicable retailers’ commission of four and one-half to six percent is recognized when sales are made to the public. Recognition of the revenue from sales for future draws is considered unearned until those draws become current. The retailers’ commission related to the unearned revenue is refl ected as a prepaid expense until the revenue is recognized.
Prizes – Scratchers Games
Prize expense for Scratchers games is recognized based on the predetermined prize structure for each game in the period revenue is recognized. Prizes that are not claimed are recognized as unclaimed prizes 180 days after
CALIFORNIA STATE LOTTERY FUNDNOTES TO FINANCIAL STATEMENTS
JUNE 30, 2014

- 15 -
1. SUMMARY OF SIGNIFICANT ACCOUNTING POLICIES (continued)
Prizes – Scratchers Games (continued)
the end of each game. Unclaimed prizes not directly payable by the Lottery are recognized as a reduction of prize expense and included in the Lottery’s operating income that is allocated to the Education Fund. Unclaimed prizes directly payable by the Lottery are allocated directly to the Education Fund.
Scratchers games with annuitized prizes are generally paid in equal, annual installments over 20 or 25 years. Some games offer graduated, annual payments, and others offer the choice of an annuitized prize paid in weekly installments or a lump sum cash payment. Prize expense for annuity prizes is based on the present value of the annuity using an interest rate equal to the interest yield on the zero coupon U.S. Treasury bonds. Interest earned is imputed on the annuity using the same interest rate.
Prizes - Draw Games
Powerball and Mega Millions - The California Lottery joined the multi-state game Powerball on April 8, 2013, for the draw on April 10, 2013. Prize expense for each of the twice-weekly multi-state draw games is recognized on the basis of the predetermined prize structure when the revenue is recognized. Nine distinct prize categories for each game are established which are dependent upon the amount of money wagered and the quantity of numbers to be matched. In the event that no winning share for a specifi c prize category of Powerball or Mega Millions is selected, all monies allocated for that prize are carried forward to the following drawing and remain in the pool for that same prize category.
The total Grand/Jackpot prize liability for each multi-state Powerball or Mega Millions drawing is shared by each participating state lottery (Party Lottery) as follows: each Party Lottery is responsible for an amount equal to a percentage of that Party Lottery’s Powerball or Mega Millions sales, said percentage being the proportion of the total Grand/Jackpot prize liability to the total Powerball or Mega Millions sales. The California Lottery is prohibited by state law from paying fi xed prizes and participating in the liability calculation for prize levels two through nine. The California Lottery is therefore solely responsible for its own prize liability for levels two through nine for the multi-state games.
Powerball and Mega Millions grand/jackpot prizes won in California are paid in 30 graduated, annual installments. For each game, winners have up to 60 days after the date they become entitled to the prize to irrevocably elect to receive the cash value of the prize instead of annual payments. Payments for all other prize categories are made in a single payment.
In the event that a Powerball or Mega Millions jackpot won in California is unclaimed, the prize monies will be returned to the Party Lotteries in the same ratio that each Party Lottery contributed to the prize plus interest, and the amount contributed by the California State Lottery will be allocated to the Education Fund. The unclaimed prize monies for all other Powerball or Mega Millions prize categories won in California but not claimed within the specifi ed period are allocated directly to the Education Fund.
SuperLotto Plus® - Prize expense for the twice-weekly draw game is recognized on the basis of the predetermined prize structure when the revenue is recognized. Nine distinct prize categories are established which are dependent upon the amount of money wagered and the quantity of numbers to be matched. In the event that no winning share for a specifi c prize category in SuperLotto Plus is chosen, all monies allocated for that prize are carried forward to the following drawing and added to the 5 of 5 plus Mega number category (grand prize).
SuperLotto Plus grand/jackpot prizes of $1 million or more won prior to April 1, 1998, are paid in 20 equal, annual installments. Grand/jackpot prizes of $1 million or more won between April 1, 1998, and May 10, 2013, are paid either in 26 graduated, annual payments or in a single payment equal to the cash value of the 26-payment annuity, in accordance with the rules and regulations of the Lottery. Beginning September 21, 2005, claimants have up to 60 days after they became entitled to the prize to irrevocably elect to receive the cash payment instead of the
CALIFORNIA STATE LOTTERY FUNDNOTES TO FINANCIAL STATEMENTS
JUNE 30, 2014

- 16 -
1. SUMMARY OF SIGNIFICANT ACCOUNTING POLICIES (continued)
Prizes – Draw Games (continued)
annuitized payments. Starting May 11, 2013, grand prizes are paid in 30 graduated, annual payments or in a single payment equal to the estimated cost to fully fund the advertised annuity prize. Such estimated cost is determined by market pricing for U.S. Treasury bonds. Payments for all other prize categories are made in a single payment. All SuperLotto Plus prizes won but not claimed within the specifi ed period are allocated directly to the Education Fund.
Fantasy 5 - Prize expense for the seven-draws-per-week game is recognized on the basis of the predetermined prize structure when the revenue is recognized. Distinct prize categories are established which are dependent upon the amount of money wagered and the quantity of numbers to be matched. In the event that no winning share for a specifi c prize category is selected, all monies allocated for that prize category are carried forward to the following drawing and added to the 5 of 5 prize category. All Fantasy 5 prizes won but not claimed within the specifi ed period are allocated directly to the Education Fund.
Daily 3 - Prize expense for the two-draws-per-day game is recognized on the basis of the predetermined prize structure when the revenue is recognized. Distinct prize categories are established which are dependent upon the amount of money wagered, the quantity of numbers to be matched, and the order of numbers chosen. All Daily 3 prizes won but not claimed within the specifi ed period are allocated directly to the Education Fund.
Daily 4 - Prize expense for the seven-draws-per-week game is recognized on the basis of the predetermined prize structure when the revenue is recognized. Distinct prize categories are established which are dependent upon the amount of money wagered, the quantity of numbers to be matched, and the order of numbers chosen. All Daily 4 prizes won but not claimed within the specifi ed period are allocated directly to the Education Fund.
Daily Derby® - Prize expense for the seven-draws-per-week game is recognized on the basis of the predetermined prize structure when the revenue is recognized. Distinct prize categories are established which are dependent upon the amount of money wagered, the quantity of numbers to be matched, and the order of numbers chosen. In the event that no winning share for a specifi c prize category is selected, all monies allocated for that prize category are carried forward to the following drawing and added to the Grand Prize category. All Daily Derby prizes won but not claimed within the specifi ed period are allocated directly to the Education Fund.
Hot Spot® - Prize expense for the multiple-draws-per-day game is recognized on the basis of the predetermined prize structure when the revenue is recognized. On November 27, 2006, the Lottery established Typical Prize Pools (TPP’s) for the 8 Spot Match 8 of 8 category and Typical Prize Amounts (TPA’s) for all spots other than the 8 Spot Match 8 of 8 prize. On that date, the Lottery also made an irrevocable transfer to a Hot Spot Wagered Prize Fund (fund) to pay these prizes. On August 1, 2011, the Lottery expanded the prize categories from 5 spots to 10 spots, and expanded the TPP’s to include the 9 Spot Match 9 of 9 and the 10 Spot Match 10 of 10 categories. In addition to the initial transfer made in 2006, the fund balance is adjusted daily based upon daily sales contributions and prizes won. In the event the balance in the fund is not suffi cient to pay the allocations and amounts of a particular draw, prizes will be systematically reduced until the fund is suffi cient to pay the reduced amounts. The Director will authorize promotions to ensure that the fund balance at the end of any given fi scal year is liquidated. All Hot Spot prizes won but not claimed within the specifi ed period are allocated directly to the Education Fund.
Prior to the changes made on November 27, 2006, and August 1, 2011, distinct prize categories were established which were dependent upon the amount of money wagered and the quantity of numbers to be matched. In the event that no winning share for a specifi c Hot Spot prize category was selected, all monies allocated for that prize category were carried forward to the following drawing and added to its respective prize category.
Raffl e - The Lottery may periodically conduct raffl e games. The $1 million top prizes for the two raffl e games held to date were each paid in single payments.
CALIFORNIA STATE LOTTERY FUNDNOTES TO FINANCIAL STATEMENTS
JUNE 30, 2014

- 17 -
1. SUMMARY OF SIGNIFICANT ACCOUNTING POLICIES (continued)
Cash Equivalents
Cash equivalents represent cash deposited in the Surplus Money Investment Fund (SMIF).
Investments
The Lottery applies Statement No. 31 of the Governmental Accounting Standards Board (GASB 31), Accountingand Financial Reporting for Certain Investments and for External Investment Pools. This statement establishes accounting and fi nancial reporting standards for all investments held by governmental external investment pools and establishes fair value standards for other governmental entities. In accordance with GASB 31 the Lottery has stated investments at fair value. The difference between the carrying value and the fair value of investments is reported as a component of total net position on the statement of net position.
The Lottery applies GASB 40, Deposit and Investment Risk Disclosures – An Amendment of GASB Statement No. 3. This statement addresses common deposit and investment risks related to credit risk, concentration of credit risk, interest rate risk, and foreign currency risk. As an element of interest rate risk, this statement requires certain disclosures of investments that have fair values that are highly sensitive to changes in interest rates. Deposit and investment policies related to the risks identifi ed in this statement also are required to be disclosed.
Allowances for Doubtful Accounts, Ticket Returns, and Free Ticket Redemptions
The allowance for doubtful accounts is based on an analysis of collectibility of accounts receivable which considers the age of the accounts and historical collection results. An allowance for ticket returns for Scratchers games is estimated using sales revenue and historical return data for the games in progress at the end of the reporting period. An allowance for free ticket redemptions for Scratchers games is estimated using sales revenue and free ticket redemption data for games in progress at the end of the reporting period.
Ticket Inventories
Inventories are carried at cost and consist of tickets for games in progress not yet sold to retailers and tickets for future games. The cost of tickets is charged to operations when the tickets are sold to retailers. The cost of unissued and returned tickets is written off at the end of each game.
Capital Assets
The Lottery has adopted a policy of capitalizing assets with an acquisition cost or established value of $5,000 or greater. Capital assets are carried at cost. Depreciation on property and equipment is computed using the straight-line method over estimated lives ranging from one to ten years. Depreciation on buildings, improvements, and land improvements is computed using the straight-line method over estimated lives of fi ve to 40 years. When assets are retired or otherwise disposed of, the costs and related accumulated depreciation are removed from the accounts and any resulting gain or loss is refl ected in operations in the period of disposal. Amortization of leasehold improvements is computed using the straight-line method over the remaining lease terms.
Long-term Prepaid Charges
The Lottery incurs costs in connection with certain contracts which extend beyond a one-year period. These costs are prepaid and amortized over the life of the contracts.
Advertising
Advertising costs are expensed when the related liability is incurred. Advertising expense totaled $63,699,190 for the year ended June 30, 2014.
CALIFORNIA STATE LOTTERY FUNDNOTES TO FINANCIAL STATEMENTS
JUNE 30, 2014

- 18 -
1. SUMMARY OF SIGNIFICANT ACCOUNTING POLICIES (continued)
Investment Earnings
Investment earnings are composed of unrealized gains or losses associated with the change in fair value of investments and interest income including interest accreted on investments. Unrealized gains and losses are generally not realized as the investments are held to satisfy annuitized prizes. As investments must be stated at fair value, investment earnings or losses are created as a result of the adjustment from carrying value to fair value. Generally, all cash is held on deposit with the California State Treasurer and is invested by that offi ce in the Surplus Money Investment Fund. Interest on funds held by the State Treasurer is distributed quarterly.
Compensated Absences Payable
Vested vacation balances are accrued as a liability and adjusted quarterly.
Use of Estimates
The preparation of fi nancial statements in conformity with accounting principles generally accepted in the United States of America requires management to make estimates and assumptions that affect the reported amounts of assets and liabilities and disclosure of contingent assets and liabilities at the date of the fi nancial statements and the reported amounts of revenues and expenses during the reporting period. Actual results could differ from those estimates.
2. DEPOSITS AND INVESTMENTS
The Lottery presents its deposits and investments in accordance with GASB 40, Deposit and Investment Risk Disclosures – An Amendment of GASB Statement No. 3. This statement requires the disclosure of the following risks to the extent that they exist at the date of the statement of net position:
Interest Rate RiskInterest rate risk is the risk that the value of fi xed income securities will decline due to changing interest rates. The prices of fi xed income securities with longer time to maturity tend to be more sensitive to changes in interest rates than those with shorter durations.
Credit RiskCredit risk is the risk that a debt issuer will fail to pay interest or principal in a timely manner, or that negative perceptions of the issuer’s ability to make these payments will cause security prices to decline.
Custodial Credit RiskCustodial credit risk is the risk that, in the event a fi nancial institution or counterparty fails, the investor will not be able to recover the value of its deposits, investments, or collateral.
Concentration of Credit RiskConcentration of credit risk is the risk of loss attributed to the magnitude of an investor’s holdings in a single issuer.
Investments
The deposit and investment policies of the Lottery are determined by the Lottery Commission and state statute. Prize investments consist of zero coupon U.S. Treasury bonds, zero coupon agency bonds, and municipal bonds. Zero coupon U.S. Treasury bonds and zero coupon agency bonds are carried at fair value and are adjusted for the accretion of interest based on the purchase yield and maturity date. Municipal bonds are carried at fair value, and interest is accrued based on the coupon rate.
CALIFORNIA STATE LOTTERY FUNDNOTES TO FINANCIAL STATEMENTS
JUNE 30, 2014

- 19 -
2. DEPOSITS AND INVESTMENTS (continued)
Investments (continued)
As of June 30, 2014, the Lottery’s investments, with yields ranging from 0.06 percent to 6.06 percent, consist of the following:
Face Amount Cost Fair ValueCurrent portion:
U.S. Treasury Bonds $ 11,992,000 $ 11,011,264 $ 11,984,745U.S. Agency Bonds 41,913,000 35,309,531 41,865,992U.S. Municipal Bonds 62,000,000 62,075,284 62,778,280Total current portion $ 115,905,000 $ 108,396,079 $ 116,629,017
Long-term portion:U.S. Treasury Bonds $ 280,973,000 $ 163,617,295 $ 194,924,537U.S. Agency Bonds 235,582,000 139,444,628 195,906,756U.S. Municipal Bonds 358,710,000 360,287,857 405,375,299Total long-term portion $ 875,265,000 $ 663,349,780 $ 796,206,592
Total investments $ 991,170,000 $ 771,745,859 $ 912,835,609
As discussed in Note 1, the Lottery applies the provisions of GASB 31. In accordance with GASB 31, the Lottery carries its investments at fair value. The fair value of investments is based on published market prices and quotations from an independent pricing vendor. The following represents the changes in fair value of investments for the year ended June 30, 2014, in accordance with the requirements of GASB 31.
Changes in fair value of investments: Unrealized investment gains at July 1, 2013 $ 79,090,350 Unrealized investment gain, current period 4,829,544 Total unrealized investment gains $ 83,919,894
On January 28, 2009, the Lottery Commission approved an amendment to the Lottery’s investment policy that allowed for the restructuring of its investment portfolio to maximize the investment return. Prior to this, the Lottery’s policy limited investments to U.S. Treasury zero coupon bonds. The amendment authorizes the Lottery to sell its previously held U.S. Treasury zero coupon bonds and replace them with municipal and agency bonds, as well as with other U.S. Treasuries. The Lottery conducted an investment portfolio restructuring program from May 2009 through September 2010. By replacing U.S. Treasury zero coupon bonds with higher yielding investments, the Lottery generated cash proceeds that were used to further the Lottery’s directives.
As a result of the restructuring transactions, the interest imputed on prize liability will no longer equal the interest earned on the restructured investment portfolio. The difference will be reported in the statement of revenues, expenses, and changes in net position and result in an adjustment to net position restricted by legislation. As the realized and unrealized investment gain and loss activity relates to investments that must be held to satisfy prize liabilities, they are deemed statutorily restricted and therefore reported as restricted by legislation.
CALIFORNIA STATE LOTTERY FUNDNOTES TO FINANCIAL STATEMENTS
JUNE 30, 2014

- 20 -
2. DEPOSITS AND INVESTMENTS (continued)
Interest Rate Risk – Investments
The Lottery does not have a specifi c policy to manage interest rate risk, as investments are purchased to mirror the payment stream of recorded prize liability. The Lottery’s investments have weighted average maturities based on the fi nal maturity dates of all investments as follows:
U.S. Treasury Strips 10.82 yearsU.S. Agency Holdings 5.04 yearsU.S. Municipal Bond Holdings 6.43 yearsSurplus Money Investment Fund 0.64 years
Credit Risk and Concentration of Credit Risk - Investments
The Lottery has adopted a specifi c policy to manage credit risk in the Lottery’s investment portfolio. The zero coupon U.S. Treasury bonds and U.S. Treasury bills are backed by the full faith and credit of the United States government. Therefore, the U.S. Treasury obligation investments are not considered to have credit risk or a concentration of credit risk, as defi ned by the Governmental Accounting Standards Board. The Lottery’s policy to manage credit risk requires municipal bonds to have a minimum double A credit rating by Fitch, Moody’s, or Standard and Poor’s to be eligible for purchase as part of the Lottery’s investment portfolio. Agency bonds have a triple A credit rating and the Surplus Money Investment Fund is not rated at June 30, 2014. Credit risk is further mitigated by a $2.7 million par value agency bond reserve. The bond reserve has a fair value of $1,889,976.
As of June 30, 2014, the fair value of the Lottery’s investment portfolio expressed as a percentage of Moody’s credit rating categories was as follows:
Moody’s Credit Rating Fair Value Percent of Total Portfolio
Aaa $ 457,744,209 50.15 %Aa1 147,445,919 16.15 %Aa2 51,576,962 5.65 %Aa3 228,626,921 25.05 %A3 22,031,735 2.41 %
Baa1 5,409,863 0.59 %Totals $ 912,835,609 100.00 %
The following table provides information about the Lottery’s concentration of credit risk. It shows investments by any one issuer representing fi ve percent or more of the Lottery’s total portfolio, and not explicitly guaranteed by the U.S. government.
Issuer Cost Fair Value Percent of Total Portfolio
Moody’s Credit Rating
State of California $ 164,475,817 $ 178,345,496 19.54 % Aa3Commonwealth of Massachusetts $ 62,546,830 $ 69,039,180 7.56 % Aa1
New York City $ 47,293,479 $ 51,576,962 5.65 % Aa2
CALIFORNIA STATE LOTTERY FUNDNOTES TO FINANCIAL STATEMENTS
JUNE 30, 2014

- 21 -
2. DEPOSITS AND INVESTMENTS (continued)
Custodial Credit Risk – Investments
The Lottery does not have a formal investment policy for custodial credit risk for investments. As of June 30, 2014, all the prize investments are uninsured, registered investments held in book-entry form by the State Treasurer’s Offi ce in a master custody account with Citibank, N.A.
Deposits
The following deposits, included in cash and cash equivalents, are in pools managed by other State of California government units and are not evidenced by securities. Interest income earned on outstanding cash balances is allocated among pool participants based on average daily cash balances. As of June 30, 2014, the carrying value of deposits in the Surplus Money Investment Fund approximated fair value.
State Treasury $ 11,703,737Surplus Money Investment Fund (SMIF) 304,519,000
$ 316,222,737
The total cash and cash equivalents of $316,260,517 also includes retailer payments delivered to the Lottery but not deposited into Lottery accounts by period end. At June 30, 2014, this cash on hand totaled $37,780.
The SMIF consists of available cash of all special funds of the State of California which do not have investment authority of their own. Cash balances in excess of needs in any of these participating funds are invested by the State Treasurer. The Pooled Money Investment Board (PMIB) provides regulatory oversight over the State Treasurer’spooled investment program and is responsible for determining whether any cash balances of the participating funds are in excess of current needs and available for investment, or whether it is necessary to liquidate previous investments to meet current requirements. The PMIB is composed of the State Treasurer, as chairman; the State Controller; and the Director of Finance for the State of California.
All of the resources of the SMIF are invested through the Pooled Money Investment Account (PMIA). By law, PMIA monies can be invested only in the following categories: U.S. Government securities; securities of federally-sponsored agencies; domestic corporate bonds; interest-bearing time deposits in California banks, savings and loan associations, and credit unions; prime-rated commercial paper; repurchase and reverse repurchase agreements; security loans; banker’s acceptances; negotiable certifi cates of deposit; and loans to various bond funds.
CALIFORNIA STATE LOTTERY FUNDNOTES TO FINANCIAL STATEMENTS
JUNE 30, 2014

- 22 -
2. DEPOSITS AND INVESTMENTS (continued)
Deposits (continued)
At June 30, 2014, the allocation of the deposits held by the Lottery in the SMIF was estimated as follows:
Lottery’s Shareof SMIF
U.S. Treasury Securities $ 163,901,568
Federal Agency Debt 25,321,633Supranational Debentures 704,014Bank Notes 2,817,613Certifi cates of Deposit 56,352,696Commercial Paper 31,451,134Time Deposits 22,494,600AB 55 and General Fund Loans 1,475,742 Total $ 304,519,000
The value of the deposits in the State Treasurer’s pooled investment program, including the SMIF, is equal to the dollars deposited in the program. The fair value of the position in the program may be greater or less than the value of the deposits, with the difference representing the unrealized gain or loss. As of June 30, 2014, this difference was immaterial to the valuation of the deposits held by the Lottery in the SMIF.
The Lottery’s share in the interest earnings of the PMIA is based on its ratio of dollar-day contributions to the total dollar-day investments of the PMIA. The overall return on investment for the PMIA was 0.25 percent for the year ended June 30, 2014.
3. ACCOUNTS RECEIVABLE
Accounts receivable consists of the following: Amounts due, primarily from retailers $ 461,201,638Less: Allowance for free ticket redemption (32,286,531)
Allowance for doubtful accounts (4,610,271)Allowance for ticket returns (20,066,001)
Accounts receivable, net $ 404,238,835
4. DUE FROM STATE FUNDS
Due from state funds consists primarily of interest income due on cash deposited with the State Treasurer in the Surplus Money Investment Fund.
CALIFORNIA STATE LOTTERY FUNDNOTES TO FINANCIAL STATEMENTS
JUNE 30, 2014

- 23 -
5. CAPITAL ASSETS
Capital assets consist of the following:
BeginningBalance
Increase Decrease
EndingBalance
Non-depreciable capital assets: Land $ 6,469,219 $ - $ - $ 6,469,219 Depreciable capital assets:Gaming equipment 14,392,117 - (29,125) 14,362,992Vending machines 30,044,295 15,538,474 (2,120,480) 43,462,289Buildings 69,986,320 - - 69,986,320Data processing equipment 13,361,656 1,152,534 (2,107,494) 12,406,696Offi ce furniture and equipment 7,642,537 204,575 (91,006) 7,756,106Leasehold improvements 813,658 - - 813,658Other 6,579,301 2,282,207 (366,434) 8,495,074
$ 149,289,103 $ 19,177,790 $ (4,714,539) $ 163,752,354
Less accumulated depreciation and amortization:Gaming equipment $ (13,839,886) $ (355,615) $ 25,511 $ (14,169,990)Vending machines (30,044,295) (251,480) 2,120,480 (28,175,295)Buildings (3,963,771) (1,786,968) - (5,750,739)Data processing equipment (8,369,317) (1,884,445) 2,107,494 (8,146,268)Offi ce furniture and equipment (4,556,460) (1,013,678) 70,700 (5,499,438)Leasehold improvements (707,886) (76,394) - (784,280)Other (5,555,989) (706,596) 366,434 (5,896,151)
$ (67,037,604) $ (6,075,176) $ 4,690,619 $ (68,422,161) Capital assets, net $ 82,251,499 $ 13,102,614 $ (23,920) $ 95,330,193
Depreciation and amortization charged to income on capital assets was $6,075,176 for the year ended June 30, 2014.
CALIFORNIA STATE LOTTERY FUNDNOTES TO FINANCIAL STATEMENTS
JUNE 30, 2014

- 24 -
6. PRIZE LIABILITY
Prize liability consists of the following:
Scratchers
GamesDraw
Games Total Current: Annuitized prizes $ 21,409,648 $ 189,439,940 $ 210,849,588 Other prizes 311,762,795 28,647,482 340,410,277
Total current prize liability $ 333,172,443 $ 218,087,422 $ 551,259,865
Long-term annuitized prizes $ 190,880,000 $ 797,253,000 $ 988,133,000 Less imputed interest (49,070,104) (255,883,215) (304,953,319)
Net present value of long-term prizes $ 141,809,896 $ 541,369,785 $ 683,179,681
Total prize liability $ 474,982,339 $ 759,457,207 $ 1,234,439,546
The amount of prizes due within one year is $551,259,865.
Long-term prize liability as of June 30, 2014, for each of the next fi ve years and for subsequent years is as follows:
Principal Interest TotalFor the year ending June 30, 2016 $ 47,645,762 $ 49,132,085 $ $96,777,847
2017 38,494,010 30,059,284 68,553,2942018 32,922,596 21,623,162 54,545,7582019 31,550,777 20,686,696 52,237,4732020 30,211,628 19,716,029 49,927,657
2021-2025 130,260,306 82,141,215 212,401,5212026-2030 79,772,675 31,586,102 111,358,7772031-2035 20,968,789 1,777,463 22,746,252 2036-2040 10,185,708 230,065 10,415,7732041-2045 4,151,531 63,798 4,215,329
Total long-term prize liability $ 426,163,782 $ 257,015,899 $ 683,179,681
Activity in the prize liability accounts consists of: Balance, July 1, 2013 $ 1,198,903,813
Prize expense 3,082,376,405 Prize payments (3,567,223,613) Grand/Jackpot prize contributions from Other Party Lotteries 499,057,503 Interest imputed on annuities 42,998,109 Unclaimed prizes (21,672,671)
Balance, June 30, 2014 $ 1,234,439,546
CALIFORNIA STATE LOTTERY FUNDNOTES TO FINANCIAL STATEMENTS
JUNE 30, 2014

- 25 -
7. DUE TO STATE FUNDS
Due to state funds consists of the following:
Due to Education Fund $ 314,619,810 Due to other state funds 291,878
Total due to state funds $ 314,911,688
Activity in the Due to Education Fund account consists of:
Balance, July 1, 2013 $ 380,720,287 Allocation to Education Fund, earned by the California State Lottery Fund $ 1,327,928,392 Unclaimed prizes directly allocated to the Education Fund 21,672,671
$ 1,349,601,063
Distribution to the Education Fund (1,415,701,540)
Balance, June 30, 2014 $ 314,619,810
8. LEASES
The Lottery leases offi ce, warehouse, and parking lot facilities under operating leases. These leases expire in various years through September 30, 2023. Most operating leases have a provision for early termination. These leases could be terminated between December 2014 and September 2023.
The future minimum lease payments under operating leases as of June 30, 2014, are as follows:
OperatingLeases
For the year ending June 30, 2015 $ 1,447,8082016 1,292,9912017 1,329,0572018 724,9422019 524,519
Thereafter 1,276,175
Total minimum payments $ 6,595,492
Rental expense for all operating leases totaled $1,536,337 for the year ended June 30, 2014.
CALIFORNIA STATE LOTTERY FUNDNOTES TO FINANCIAL STATEMENTS
JUNE 30, 2014

- 26 -
9. INVESTMENT EARNINGS
Investment earnings consist of: Interest on funds held by State Treasurer $ 1,249,094 Change in Fair Market Value of Investments 4,829,544 Interest accreted/earned on investments 37,209,821 Total investment earnings $ 43,288,459
10. RETIREMENT PLAN AND OTHER POSTEMPLOYMENT BENEFITS
Retirement Plan
The Lottery contributes to the Public Employees’ Retirement Fund administered by the California Public Employees’ Retirement System (CalPERS), an agent multiple-employer public employee defi ned benefi t pension plan. The State of California (State) is considered the employer and the Lottery is a department of the State. CalPERS provides retirement benefi ts to plan members and benefi ciaries. CalPERS acts as a common investment and administrative agent for participating public entities within the State and uses the accrual basis of accounting. Benefi t provisions and all other requirements are established by state statute. Since all state agencies are considered collectively to be a single employer, the actuarial present value of vested and non-vested accumulated plan benefi ts attributable to the Lottery’s employees cannot be determined. Similarly, the net assets available for benefi ts of Lottery employees cannot be determined. CalPERS issues a separate comprehensive annual fi nancial report that includes fi nancial statements and required supplementary information. CalPERS’ annual fi nancial report may be obtained by writing to the California Public Employees’ Retirement System, Fiscal Services Division, P.O. Box 942703, Sacramento, California 94229 or by visiting the CalPERS web site at www.CalPERS.ca.gov.
Generally, full-time employees are eligible to participate as members of CalPERS and are eligible to retire at age 50 with at least fi ve years of service or age 55 with at least ten years of service, depending on the plan selected by the employee. Employees hired after January 1, 2013, must be at least age 52. Annual retirement benefi ts are determined based on age at retirement, the length of membership service, and the amount of earnings based on the highest or last 12 or 36 consecutive months’ average. Health care and dental benefi ts may be provided to members depending on the date hired and the years of credited service of a member. If members are not fully vested, the health care and dental contributions are prorated based on the years of service.
Active plan members are required to contribute a percentage of their salary depending on their plan selection and employment classifi cation. Employees’ required contributions vary from zero to 13 percent. The Lottery is required to contribute at an actuarially determined rate. The Lottery’s contributions are based on a percentage of annual covered payroll depending on the plan selected and member status. For the year ended June 30, 2014, the Lottery’s payroll for employees covered by CalPERS was approximately $38.6 million and the total payroll for the period was approximately $39.3 million. The contribution requirements of plan members and the Lottery are established and may be amended by CalPERS. Required employer contribution rates (expressed as a percentage of compensation) as of July 2013 for the 2013-14 fi scal year are as follows: State Miscellaneous Member First Tier 21.121 % State Miscellaneous Member Second Tier 20.992 % State Safety Member 17.205 % Peace Offi cer 30.495 %
CALIFORNIA STATE LOTTERY FUNDNOTES TO FINANCIAL STATEMENTS
JUNE 30, 2014

- 27 -
CALIFORNIA STATE LOTTERY FUNDNOTES TO FINANCIAL STATEMENTS
JUNE 30, 2014
10. RETIREMENT PLAN AND OTHER POSTEMPLOYMENT BENEFITS (continued)
Retirement Plan (continued)
The Lottery’s pension cost for the year ended June 30, 2014, was equal to the Lottery’s required contributions which were determined as part of the actuarial valuation performed by CalPERS dated June 30, 2012.
Three year trend information for the Lottery:
Fiscal YearEnding
Annual Pension Cost (APC)
Percentage Of APCContributed
Net PensionObligation
6/30/12 $6,800,344 100 % $06/30/13 $6,036,633 100 % $06/30/14 $7,262,938 100 % $0
Other Postemployment Benefi ts
Post-retirement health care benefi ts are also provided to Lottery employees through the programs sponsored by the State as administered by CalPERS and the California Department of Human Resources (CalHR). As the post-retirement health care plan is sponsored by the State it is considered a single-employer plan. The Lottery is considered a department of the State. The total other postemployment benefi ts (OPEB) actuarial accrued liability is reported at the State level.
Health care and dental benefi ts may be provided to members depending on the date hired and the member’s years of credited service. Post-retirement health benefi ts include medical, prescription drug, and dental benefi ts, and are currently funded on a pay-as-you-go basis. Employer contributions for health premiums during the 2013-14 fi scal year maintained the 100/90 percent contribution formula established by Government Code. Under this formula, the State uses 100 percent of the weighted average premiums of the four largest health benefi t plans in order to calculate the maximum amount the State will contribute toward the retiree’s health benefi ts. The State also contributes 90 percent of this average for the health benefi ts of each of the retiree’s dependents. The retiree is responsible for paying all health benefi t plan costs that exceed the average of the four largest benefi t plans. The monthly estimated contribution is $642 for a single enrollee, $1,218 for an enrollee and one dependent, and $1,559 for an enrollee and two or more dependents. Dental care premiums vary by plan and number of dependents. The contribution formulas are subject to approval and amendment by the State Legislature. If members are not fully vested, the health care and dental contributions are prorated based on the years of service.
The Lottery paid approximately $4 million for post-retirement health and dental benefi ts for retired members for the year ended June 30, 2014. The Lottery adopted GASB 45 during the 2007-08 fi scal year. GASB 45 was implemented prospectively and the Lottery had a zero net OPEB obligation (NOO) upon adoption. The Lottery’s annual OPEB cost (AOC) is calculated based on the annual required contribution (ARC). The AOC recorded by the Lottery is calculated by the primary government and represents an allocation of the total ARC of the State, adjusted for interest and other adjustments. The allocation is based on the Lottery’s retiree health benefi t costs in relation to the total State retiree health benefi t costs. The ARC represents the normal cost plus an amortization of the difference between the actuarial accrued liability and any assets available to pay benefi ts. The AOC for the year ended June 30, 2014, was $11,346,000. The total NOO liability recorded as of June 30, 2014, is $41,114,000. The following table shows the components of the Lottery’s AOC, the amount actually contributed to the plan and the NOO as of and for the year ended June 30, 2014, and the previous two fi scal years.

- 28 -
10. RETIREMENT PLAN AND OTHER POSTEMPLOYMENT BENEFITS (continued)
Other Postemployment Benefi ts (continued)
Net OPEB obligation (NOO), July 1, 2011 $ 20,408,000 Allocated annual OPEB cost (AOC) 10,088,000 Fund allocated contributions (3,590,000)Net OPEB obligation (NOO), July 1, 2012 26,906,000 Allocated annual OPEB cost (AOC) 10,581,000 Fund allocated contributions (3,699,000)Net OPEB obligation (NOO), July 1, 2013 33,788,000 Allocated annual OPEB cost (AOC) 11,346,000 Fund allocated contributions (4,020,000)Net OPEB obligation (NOO), June 30, 2014 $ 41,114,000
The actuarial valuation report for OPEB may be obtained by writing to the Offi ce of State Controller John Chiang, P.O. Box 942850, Sacramento, CA 94250, or by visiting the State Controller’s Web site at www.SCO.ca.gov. The Lottery’s ARC, AOC, and NOO are calculated and adjusted for on an annual basis.
11. COMMITMENTS AND CONTINGENCIES
A contract has been awarded to GTECH that includes both gaming and telecommunication systems and services. The Lottery pays a fee of 1.36 percent of sales up to $4 billion in one year, 1.20 percent of sales over $4 billion and up to $5 billion, and 1.10 percent of sales over $5 billion. The original contract ran through October 13, 2009, and had a total estimated cost of $300 million. A series of contract extensions were awarded. The latest, signed by the Director in September 2010, extends the contract to October 13, 2019, and includes a complete upgrade of the gaming system. The total contract expenditure is not to exceed $1.075 billion. Approximately $637.1 million in fees have been incurred under the contract as of June 30, 2014.
The Lottery has been named as a defendant in various lawsuits and claims. While the ultimate monetary outcome of these claims cannot be estimated at this time, it is the opinion of management, after consulting with legal counsel, that the disposition of any litigation in which the Lottery is involved will not have a material adverse effect on the fi nancial condition or on the results of operations of the Lottery.
12. RISK MANAGEMENT
Since its inception, the Lottery has been primarily self-insured for risks such as fl ood, business interruption, theft, employee errors and omissions, and other potential liabilities. Losses are recognized when conditions for accrual are met.
The Lottery has purchased property insurance for its headquarters campus, including its new headquarters building and central utility plant, and thereby has transferred the risk of loss due to a catastrophic event from the Lottery to the insurance carrier. The Lottery has purchased automobile insurance for its fl eet of vehicles and insurance for electronic data processing equipment through the California Department of General Services, Offi ce of Risk & Insurance Management.
Liabilities for workers’ compensation costs are accrued based on estimates derived from the State Compensation Insurance Fund. This estimate is based on actuarial reviews of the employee workers’ compensation program and includes indemnity payments, compensation benefi ts, and leave benefi ts. The liability for workers’ compensation claims is not material to the fi nancial statements taken as a whole.
CALIFORNIA STATE LOTTERY FUNDNOTES TO FINANCIAL STATEMENTS
JUNE 30, 2014