Embed Size (px)
Citation preview
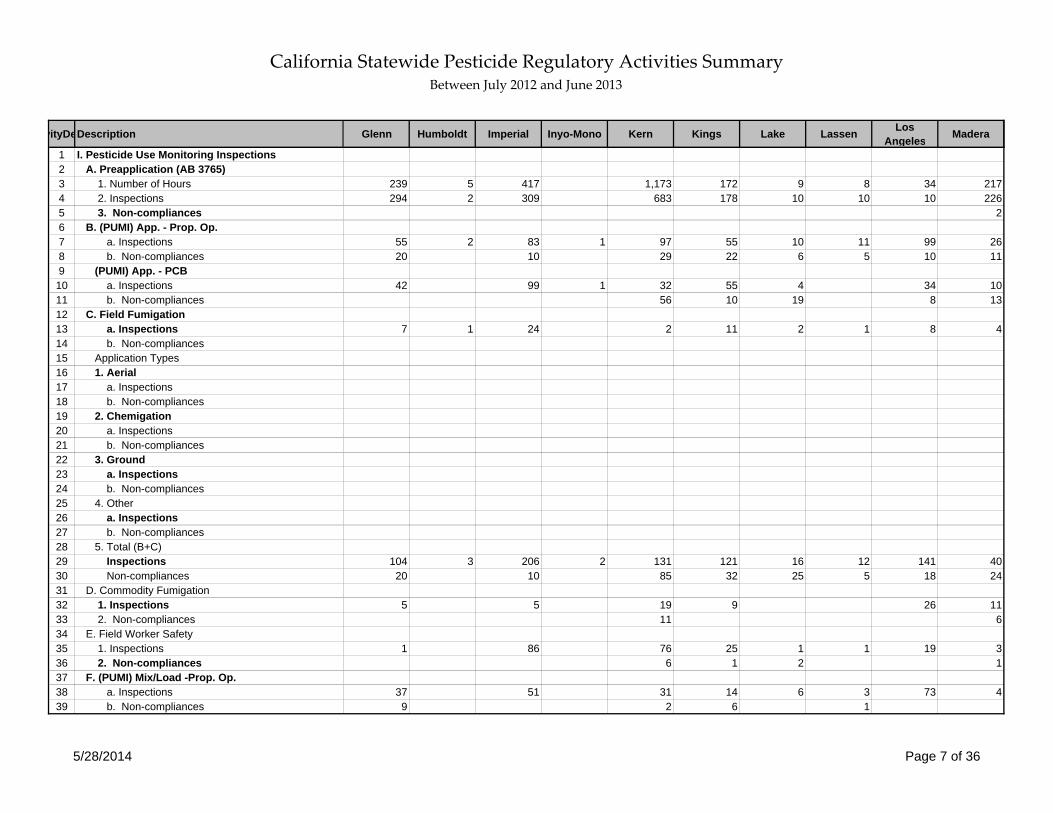
California Statewide Pesticide Regulatory Activities Summary Between July 2012 and June 2013
vityDeDescription Alameda Alpine Amador Butte Calaveras Colusa Contra Costa Del Norte El Dorado Fresno
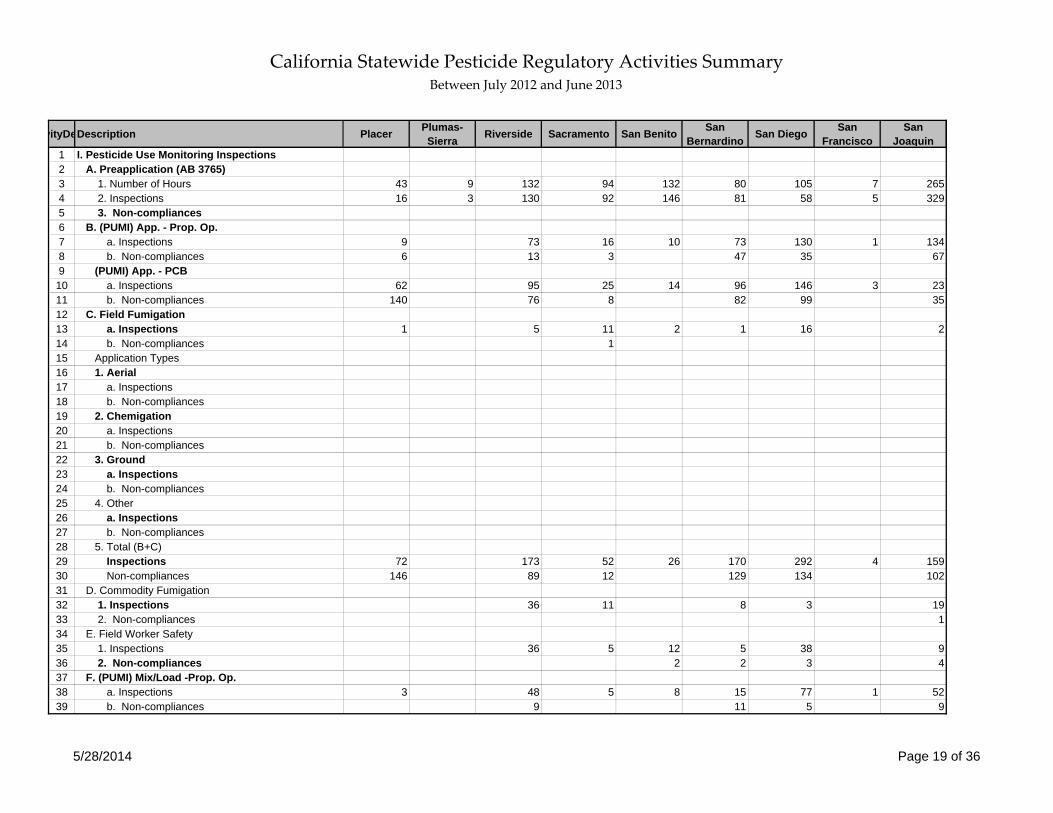
1 I. Pesticide Use Monitoring Inspections2 A. Preapplication (AB 3765)3 1. Number of Hours 12 9 363 19 134 83 15 12 1,0954 2. Inspections 9 11 300 16 227 52 27 5 8905 3. Non-compliances 206 B. (PUMI) App. - Prop. Op.7 a. Inspections 21 6 116 3 33 18 4 16 6198 b. Non-compliances 1 14 4 1 4 22 759 (PUMI) App. - PCB10 a. Inspections 32 85 7 40 91 1 2 17411 b. Non-compliances 17 11 40 1512 C. Field Fumigation13 a. Inspections 10 4 8 1 9214 b. Non-compliances15 Application Types16 1. Aerial17 a. Inspections18 b. Non-compliances19 2. Chemigation20 a. Inspections21 b. Non-compliances22 3. Ground23 a. Inspections24 b. Non-compliances25 4. Other26 a. Inspections27 b. Non-compliances28 5. Total (B+C)29 Inspections 53 6 211 10 73 113 13 19 88530 Non-compliances 17 1 14 15 1 44 22 9031 D. Commodity Fumigation32 1. Inspections 174 37 3 1 4933 2. Non-compliances34 E. Field Worker Safety35 1. Inspections 1 2 2 7 8 4 1 10936 2. Non-compliances 2 6 1 1337 F. (PUMI) Mix/Load -Prop. Op.38 a. Inspections 6 1 48 27 9 2 14439 b. Non-compliances 1 14
5/28/2014 Page 1 of 36
California Statewide Pesticide Regulatory Activities Summary Between July 2012 and June 2013
vityDeDescription Alameda Alpine Amador Butte Calaveras Colusa Contra Costa Del Norte El Dorado Fresno
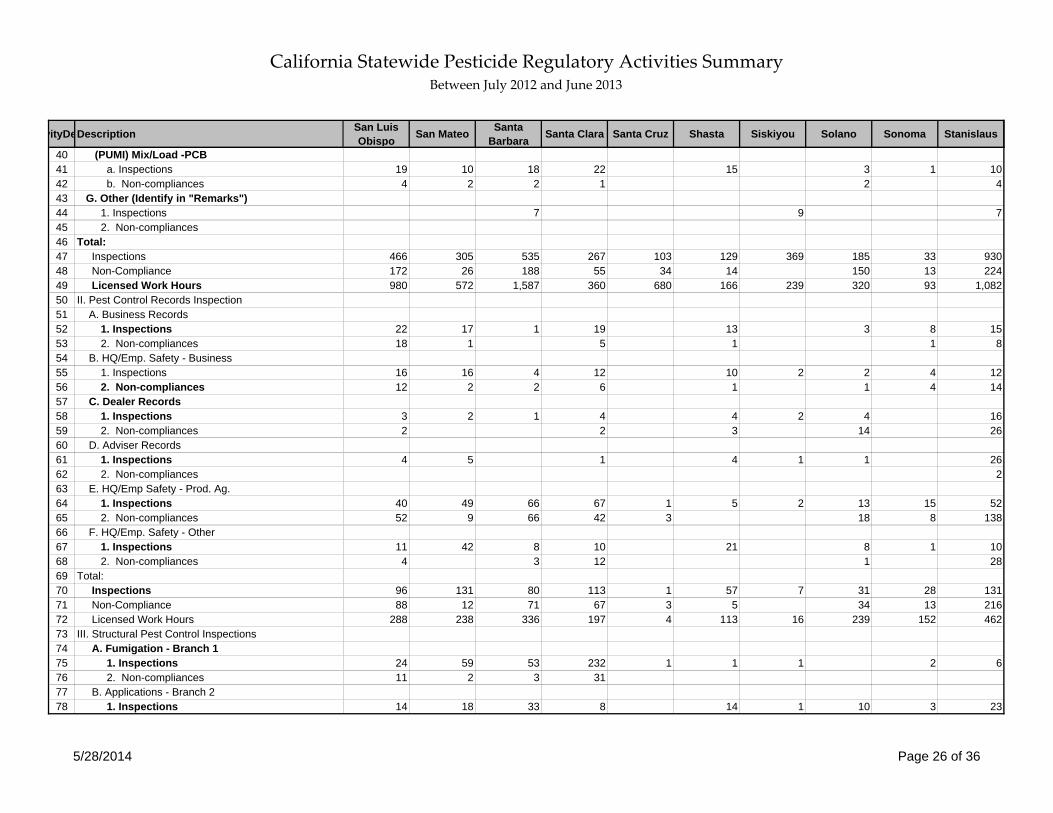
40 (PUMI) Mix/Load -PCB41 a. Inspections 9 39 29 7 9442 b. Non-compliances 3 443 G. Other (Identify in "Remarks")44 1. Inspections 19 145 2. Non-compliances 146 Total:47 Inspections 252 20 654 28 366 190 46 25 2,17248 Non-Compliance 17 3 16 21 1 48 22 14149 Licensed Work Hours 771 523 908 47 323 574 44 57 3,48050 II. Pest Control Records Inspection51 A. Business Records52 1. Inspections 50 2 4 4 71 3053 2. Non-compliances 2 6 6 154 B. HQ/Emp. Safety - Business55 1. Inspections 50 1 2 5 4 50 4 3956 2. Non-compliances 1 2 3 1 457 C. Dealer Records58 1. Inspections 6 3 6 1259 2. Non-compliances 1 160 D. Adviser Records61 1. Inspections 3 1 9 12 4862 2. Non-compliances 163 E. HQ/Emp Safety - Prod. Ag.64 1. Inspections 17 5 18 1 8 77 4 11 8065 2. Non-compliances 4 5 1 4 1 7 766 F. HQ/Emp. Safety - Other67 1. Inspections 72 3 6 8 5 76 2 368 2. Non-compliances 2 10 1 269 Total:70 Inspections 192 9 35 18 33 292 4 17 21271 Non-Compliance 3 4 13 13 4 12 10 1472 Licensed Work Hours 621 67 55 40 69 713 8 37 54173 III. Structural Pest Control Inspections74 A. Fumigation - Branch 175 1. Inspections 34 2 2 16 1 8 13276 2. Non-compliances 3 477 B. Applications - Branch 278 1. Inspections 13 3 16 1 1 7 2 65
5/28/2014 Page 2 of 36
California Statewide Pesticide Regulatory Activities Summary Between July 2012 and June 2013
vityDeDescription Alameda Alpine Amador Butte Calaveras Colusa Contra Costa Del Norte El Dorado Fresno
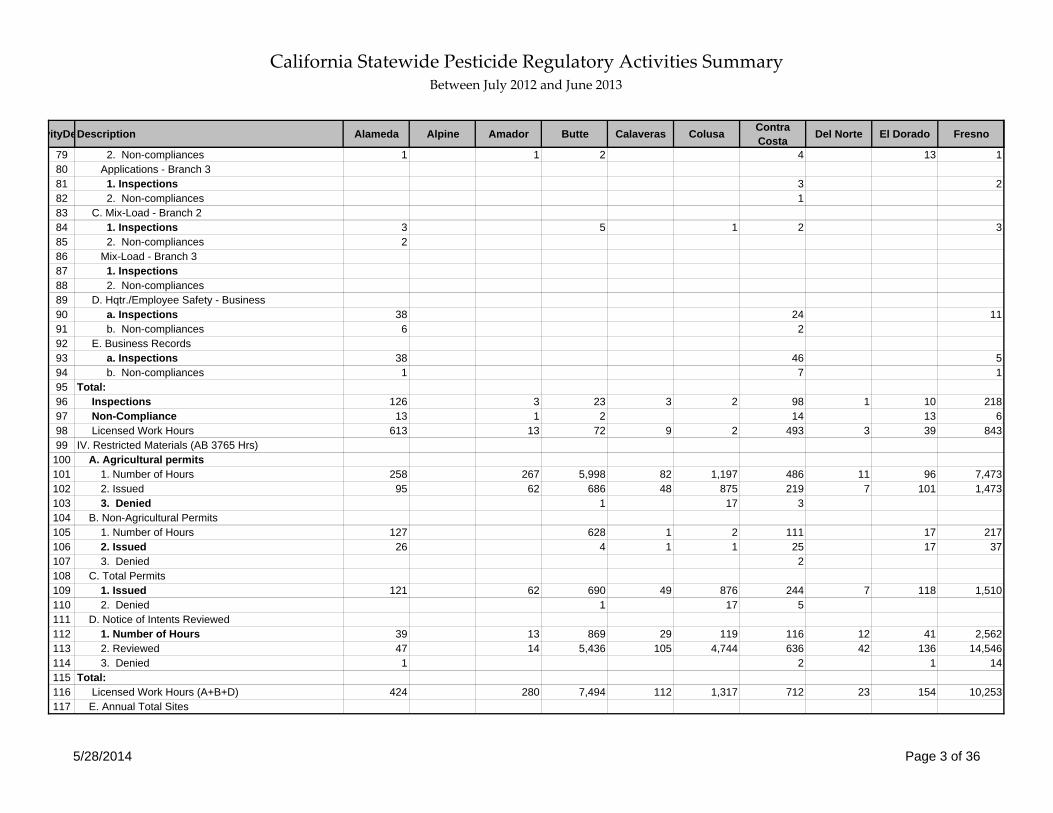
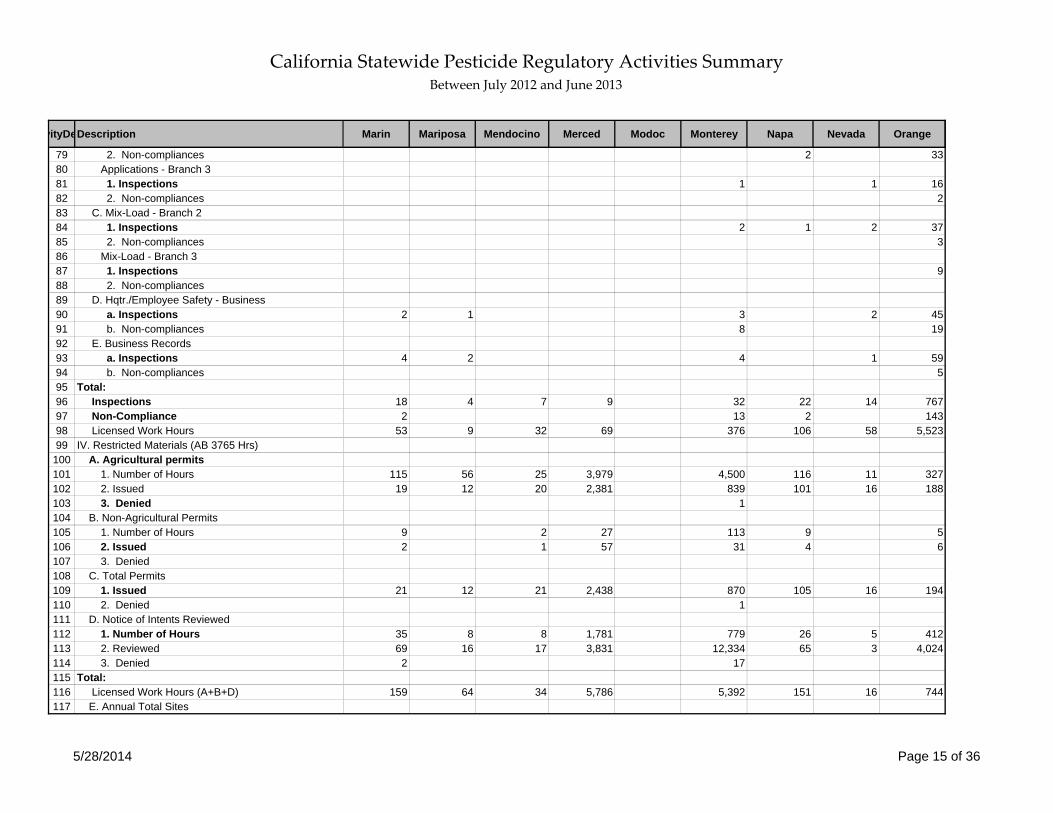
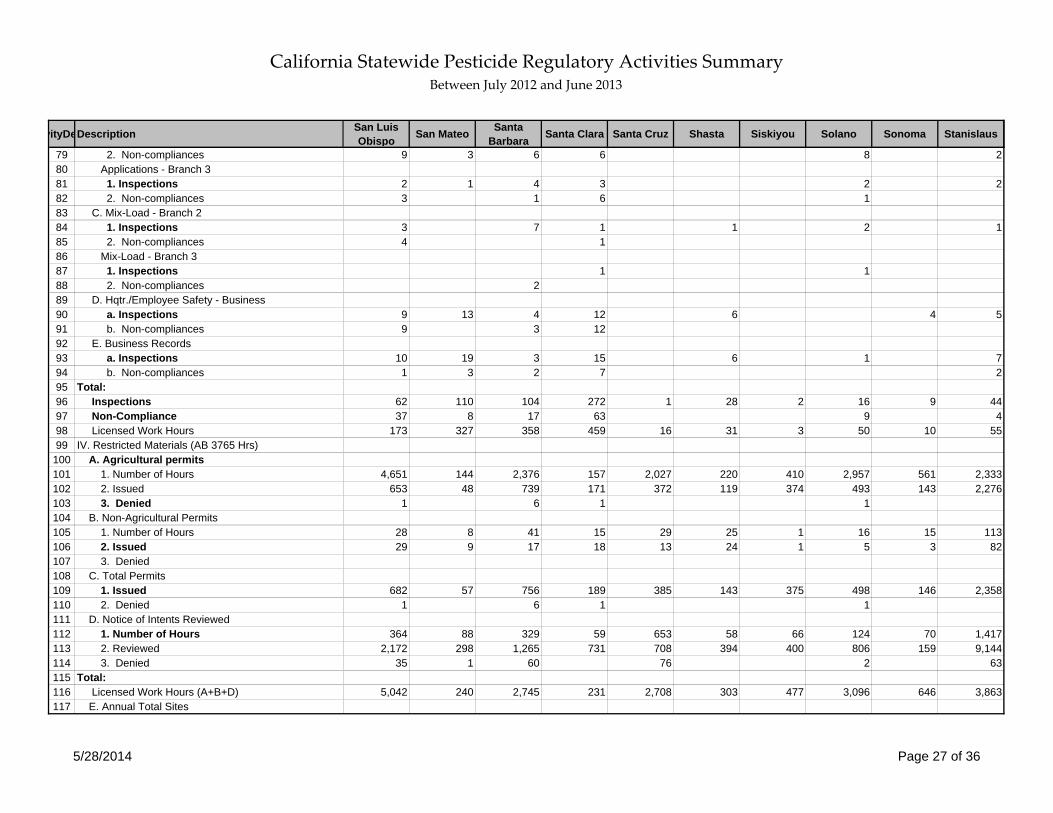
79 2. Non-compliances 1 1 2 4 13 180 Applications - Branch 381 1. Inspections 3 282 2. Non-compliances 183 C. Mix-Load - Branch 284 1. Inspections 3 5 1 2 385 2. Non-compliances 286 Mix-Load - Branch 387 1. Inspections88 2. Non-compliances89 D. Hqtr./Employee Safety - Business90 a. Inspections 38 24 1191 b. Non-compliances 6 292 E. Business Records93 a. Inspections 38 46 594 b. Non-compliances 1 7 195 Total:96 Inspections 126 3 23 3 2 98 1 10 21897 Non-Compliance 13 1 2 14 13 698 Licensed Work Hours 613 13 72 9 2 493 3 39 84399 IV. Restricted Materials (AB 3765 Hrs)
100 A. Agricultural permits101 1. Number of Hours 258 267 5,998 82 1,197 486 11 96 7,473102 2. Issued 95 62 686 48 875 219 7 101 1,473103 3. Denied 1 17 3104 B. Non-Agricultural Permits105 1. Number of Hours 127 628 1 2 111 17 217106 2. Issued 26 4 1 1 25 17 37107 3. Denied 2108 C. Total Permits109 1. Issued 121 62 690 49 876 244 7 118 1,510110 2. Denied 1 17 5111 D. Notice of Intents Reviewed112 1. Number of Hours 39 13 869 29 119 116 12 41 2,562113 2. Reviewed 47 14 5,436 105 4,744 636 42 136 14,546114 3. Denied 1 2 1 14115 Total:116 Licensed Work Hours (A+B+D) 424 280 7,494 112 1,317 712 23 154 10,253117 E. Annual Total Sites
5/28/2014 Page 3 of 36
California Statewide Pesticide Regulatory Activities Summary Between July 2012 and June 2013
vityDeDescription Alameda Alpine Amador Butte Calaveras Colusa Contra Costa Del Norte El Dorado Fresno
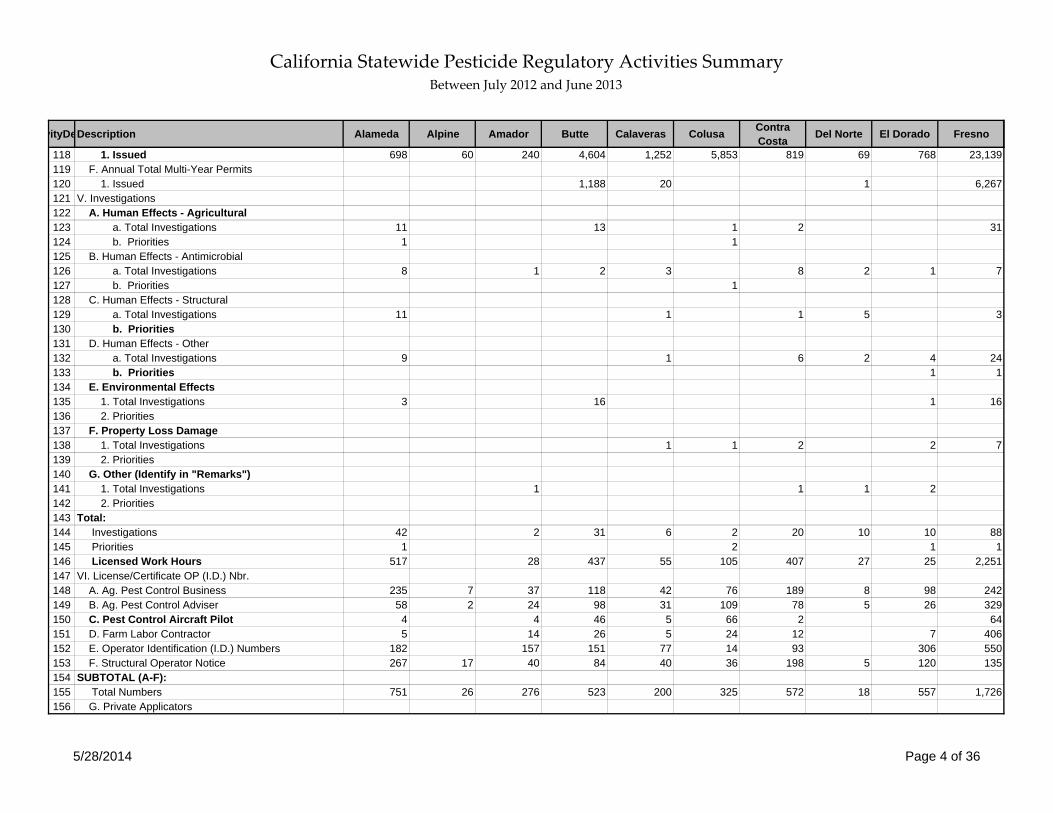
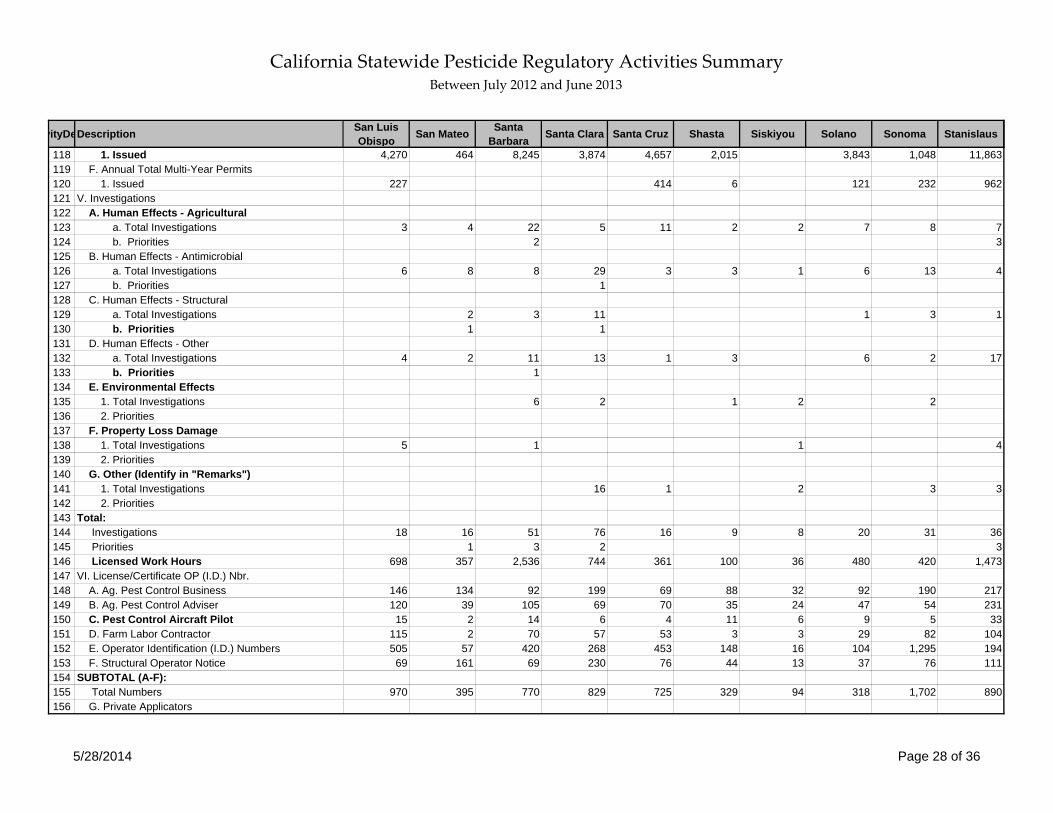
118 1. Issued 698 60 240 4,604 1,252 5,853 819 69 768 23,139119 F. Annual Total Multi-Year Permits120 1. Issued 1,188 20 1 6,267121 V. Investigations122 A. Human Effects - Agricultural123 a. Total Investigations 11 13 1 2 31124 b. Priorities 1 1125 B. Human Effects - Antimicrobial126 a. Total Investigations 8 1 2 3 8 2 1 7127 b. Priorities 1128 C. Human Effects - Structural129 a. Total Investigations 11 1 1 5 3130 b. Priorities131 D. Human Effects - Other132 a. Total Investigations 9 1 6 2 4 24133 b. Priorities 1 1134 E. Environmental Effects135 1. Total Investigations 3 16 1 16136 2. Priorities137 F. Property Loss Damage138 1. Total Investigations 1 1 2 2 7139 2. Priorities140 G. Other (Identify in "Remarks")141 1. Total Investigations 1 1 1 2142 2. Priorities143 Total:144 Investigations 42 2 31 6 2 20 10 10 88145 Priorities 1 2 1 1146 Licensed Work Hours 517 28 437 55 105 407 27 25 2,251147 VI. License/Certificate OP (I.D.) Nbr.148 A. Ag. Pest Control Business 235 7 37 118 42 76 189 8 98 242149 B. Ag. Pest Control Adviser 58 2 24 98 31 109 78 5 26 329150 C. Pest Control Aircraft Pilot 4 4 46 5 66 2 64151 D. Farm Labor Contractor 5 14 26 5 24 12 7 406152 E. Operator Identification (I.D.) Numbers 182 157 151 77 14 93 306 550153 F. Structural Operator Notice 267 17 40 84 40 36 198 5 120 135154 SUBTOTAL (A-F):155 Total Numbers 751 26 276 523 200 325 572 18 557 1,726156 G. Private Applicators
5/28/2014 Page 4 of 36
California Statewide Pesticide Regulatory Activities Summary Between July 2012 and June 2013
vityDeDescription Alameda Alpine Amador Butte Calaveras Colusa Contra Costa Del Norte El Dorado Fresno
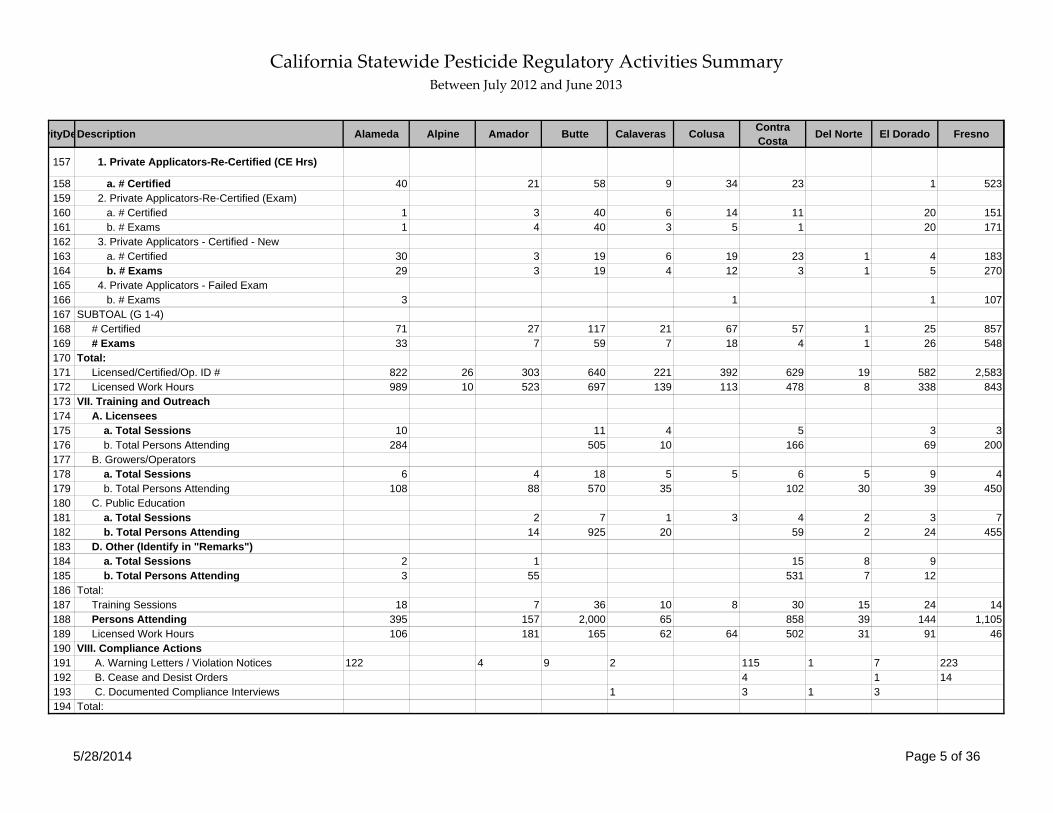
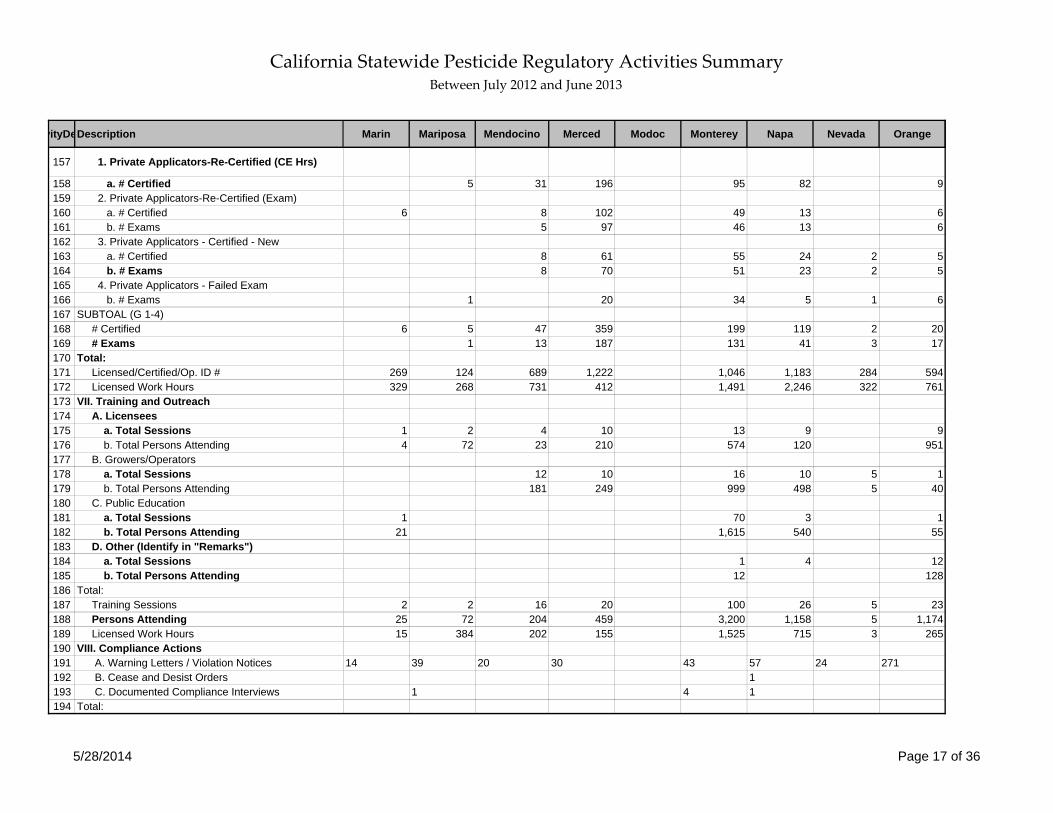
157 1. Private Applicators-Re-Certified (CE Hrs)
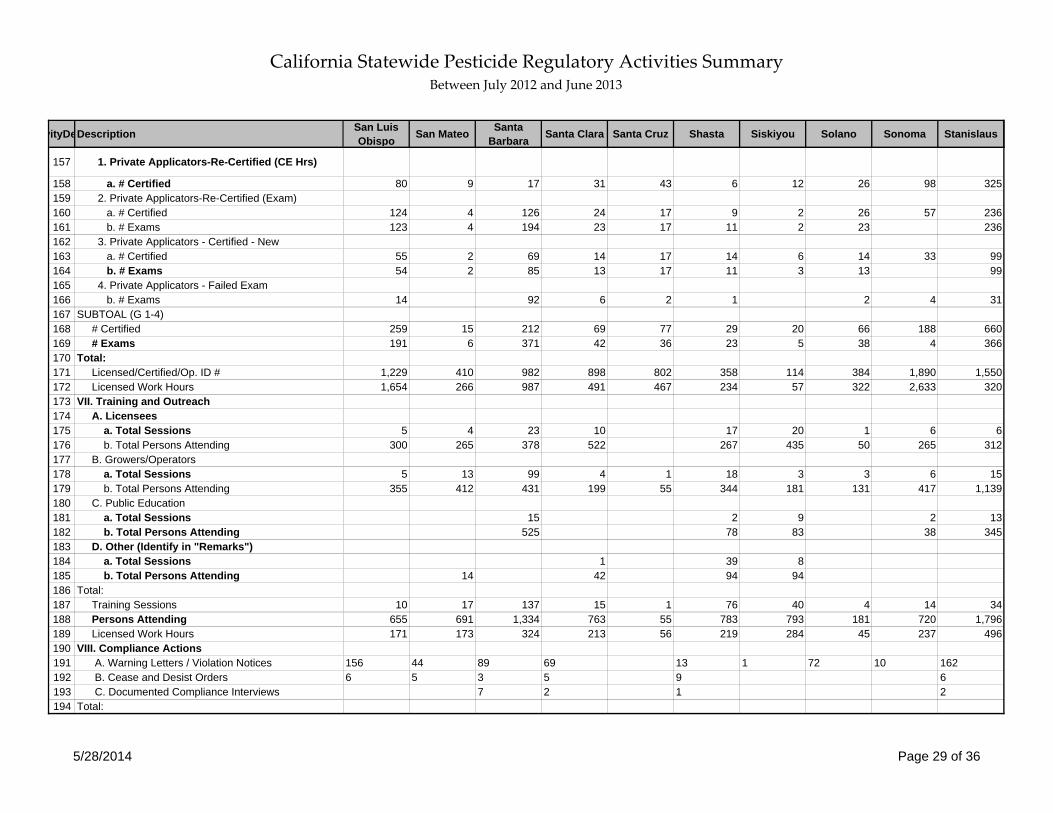
158 a. # Certified 40 21 58 9 34 23 1 523159 2. Private Applicators-Re-Certified (Exam)160 a. # Certified 1 3 40 6 14 11 20 151161 b. # Exams 1 4 40 3 5 1 20 171162 3. Private Applicators - Certified - New163 a. # Certified 30 3 19 6 19 23 1 4 183164 b. # Exams 29 3 19 4 12 3 1 5 270165 4. Private Applicators - Failed Exam166 b. # Exams 3 1 1 107167 SUBTOAL (G 1-4)168 # Certified 71 27 117 21 67 57 1 25 857169 # Exams 33 7 59 7 18 4 1 26 548170 Total:171 Licensed/Certified/Op. ID # 822 26 303 640 221 392 629 19 582 2,583172 Licensed Work Hours 989 10 523 697 139 113 478 8 338 843173 VII. Training and Outreach174 A. Licensees175 a. Total Sessions 10 11 4 5 3 3176 b. Total Persons Attending 284 505 10 166 69 200177 B. Growers/Operators178 a. Total Sessions 6 4 18 5 5 6 5 9 4179 b. Total Persons Attending 108 88 570 35 102 30 39 450180 C. Public Education181 a. Total Sessions 2 7 1 3 4 2 3 7182 b. Total Persons Attending 14 925 20 59 2 24 455183 D. Other (Identify in "Remarks")184 a. Total Sessions 2 1 15 8 9185 b. Total Persons Attending 3 55 531 7 12186 Total:187 Training Sessions 18 7 36 10 8 30 15 24 14188 Persons Attending 395 157 2,000 65 858 39 144 1,105189 Licensed Work Hours 106 181 165 62 64 502 31 91 46190 VIII. Compliance Actions191 A. Warning Letters / Violation Notices 122 4 9 2 115 1 7 223192 B. Cease and Desist Orders 4 1 14193 C. Documented Compliance Interviews 1 3 1 3194 Total:
5/28/2014 Page 5 of 36
California Statewide Pesticide Regulatory Activities Summary Between July 2012 and June 2013
vityDeDescription Alameda Alpine Amador Butte Calaveras Colusa Contra Costa Del Norte El Dorado Fresno
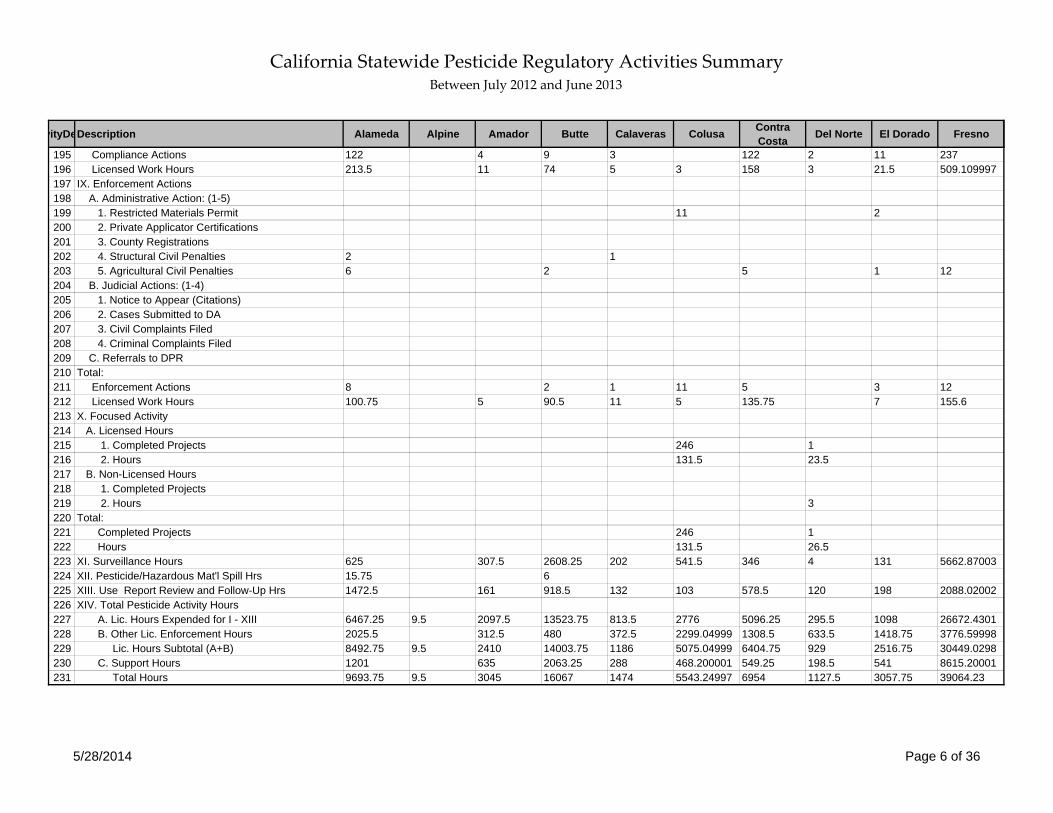
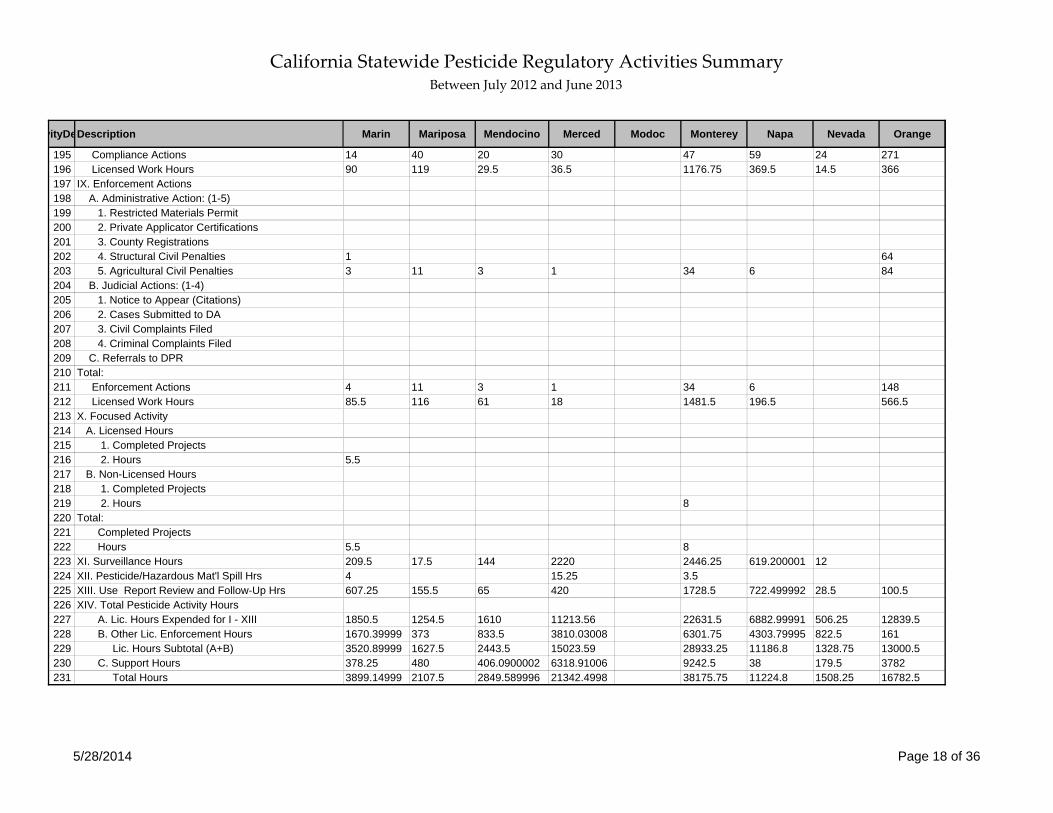
195 Compliance Actions 122 4 9 3 122 2 11 237196 Licensed Work Hours 213.5 11 74 5 3 158 3 21.5 509.109997197 IX. Enforcement Actions198 A. Administrative Action: (1-5)199 1. Restricted Materials Permit 11 2200 2. Private Applicator Certifications201 3. County Registrations202 4. Structural Civil Penalties 2 1203 5. Agricultural Civil Penalties 6 2 5 1 12204 B. Judicial Actions: (1-4)205 1. Notice to Appear (Citations)206 2. Cases Submitted to DA207 3. Civil Complaints Filed208 4. Criminal Complaints Filed209 C. Referrals to DPR210 Total:211 Enforcement Actions 8 2 1 11 5 3 12212 Licensed Work Hours 100.75 5 90.5 11 5 135.75 7 155.6213 X. Focused Activity214 A. Licensed Hours215 1. Completed Projects 246 1216 2. Hours 131.5 23.5217 B. Non-Licensed Hours218 1. Completed Projects219 2. Hours 3220 Total:221 Completed Projects 246 1222 Hours 131.5 26.5223 XI. Surveillance Hours 625 307.5 2608.25 202 541.5 346 4 131 5662.87003224 XII. Pesticide/Hazardous Mat'l Spill Hrs 15.75 6225 XIII. Use Report Review and Follow-Up Hrs 1472.5 161 918.5 132 103 578.5 120 198 2088.02002226 XIV. Total Pesticide Activity Hours227 A. Lic. Hours Expended for I - XIII 6467.25 9.5 2097.5 13523.75 813.5 2776 5096.25 295.5 1098 26672.4301228 B. Other Lic. Enforcement Hours 2025.5 312.5 480 372.5 2299.04999 1308.5 633.5 1418.75 3776.59998229 Lic. Hours Subtotal (A+B) 8492.75 9.5 2410 14003.75 1186 5075.04999 6404.75 929 2516.75 30449.0298230 C. Support Hours 1201 635 2063.25 288 468.200001 549.25 198.5 541 8615.20001231 Total Hours 9693.75 9.5 3045 16067 1474 5543.24997 6954 1127.5 3057.75 39064.23
5/28/2014 Page 6 of 36
California Statewide Pesticide Regulatory Activities Summary Between July 2012 and June 2013
vityDeDescription
1 I. Pesticide Use Monitoring Inspections2 A. Preapplication (AB 3765)3 1. Number of Hours4 2. Inspections5 3. Non-compliances6 B. (PUMI) App. - Prop. Op.7 a. Inspections8 b. Non-compliances9 (PUMI) App. - PCB10 a. Inspections11 b. Non-compliances12 C. Field Fumigation13 a. Inspections14 b. Non-compliances15 Application Types16 1. Aerial17 a. Inspections18 b. Non-compliances19 2. Chemigation20 a. Inspections21 b. Non-compliances22 3. Ground23 a. Inspections24 b. Non-compliances25 4. Other26 a. Inspections27 b. Non-compliances28 5. Total (B+C)29 Inspections30 Non-compliances31 D. Commodity Fumigation32 1. Inspections33 2. Non-compliances34 E. Field Worker Safety35 1. Inspections36 2. Non-compliances37 F. (PUMI) Mix/Load -Prop. Op.38 a. Inspections39 b. Non-compliances
Glenn Humboldt Imperial Inyo-Mono Kern Kings Lake Lassen Los Angeles Madera
239 5 417 1,173 172 9 8 34 217294 2 309 683 178 10 10 10 226
2
55 2 83 1 97 55 10 11 99 2620 10 29 22 6 5 10 11
42 99 1 32 55 4 34 1056 10 19 8 13
7 1 24 2 11 2 1 8 4
104 3 206 2 131 121 16 12 141 4020 10 85 32 25 5 18 24
5 5 19 9 26 1111 6
1 86 76 25 1 1 19 36 1 2 1
37 51 31 14 6 3 73 49 2 6 1
5/28/2014 Page 7 of 36
California Statewide Pesticide Regulatory Activities Summary Between July 2012 and June 2013
vityDeDescription
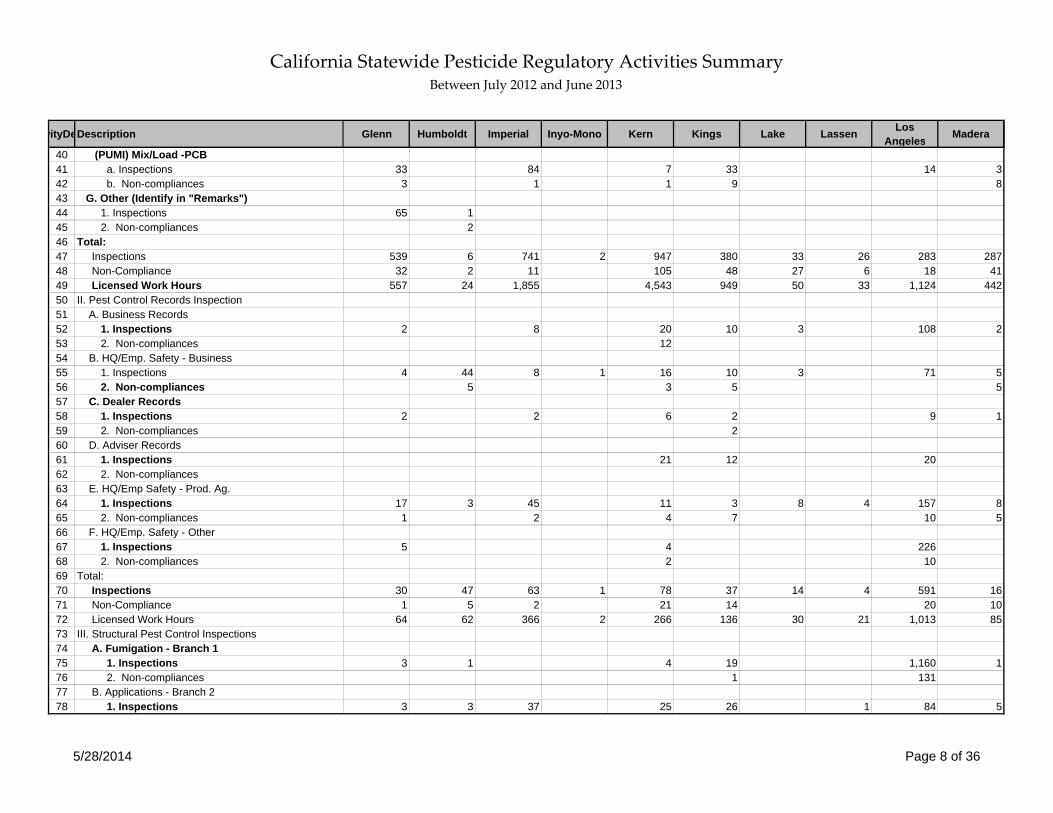
40 (PUMI) Mix/Load -PCB41 a. Inspections42 b. Non-compliances43 G. Other (Identify in "Remarks")44 1. Inspections45 2. Non-compliances46 Total:47 Inspections48 Non-Compliance49 Licensed Work Hours50 II. Pest Control Records Inspection51 A. Business Records52 1. Inspections53 2. Non-compliances54 B. HQ/Emp. Safety - Business55 1. Inspections56 2. Non-compliances57 C. Dealer Records58 1. Inspections59 2. Non-compliances60 D. Adviser Records61 1. Inspections62 2. Non-compliances63 E. HQ/Emp Safety - Prod. Ag.64 1. Inspections65 2. Non-compliances66 F. HQ/Emp. Safety - Other67 1. Inspections68 2. Non-compliances69 Total:70 Inspections71 Non-Compliance72 Licensed Work Hours73 III. Structural Pest Control Inspections74 A. Fumigation - Branch 175 1. Inspections76 2. Non-compliances77 B. Applications - Branch 278 1. Inspections
Glenn Humboldt Imperial Inyo-Mono Kern Kings Lake Lassen Los Angeles Madera
33 84 7 33 14 33 1 1 9 8
65 12
539 6 741 2 947 380 33 26 283 28732 2 11 105 48 27 6 18 41
557 24 1,855 4,543 949 50 33 1,124 442
2 8 20 10 3 108 212
4 44 8 1 16 10 3 71 55 3 5 5
2 2 6 2 9 12
21 12 20
17 3 45 11 3 8 4 157 81 2 4 7 10 5
5 4 2262 10
30 47 63 1 78 37 14 4 591 161 5 2 21 14 20 10
64 62 366 2 266 136 30 21 1,013 85
3 1 4 19 1,160 11 131
3 3 37 25 26 1 84 5
5/28/2014 Page 8 of 36
California Statewide Pesticide Regulatory Activities Summary Between July 2012 and June 2013
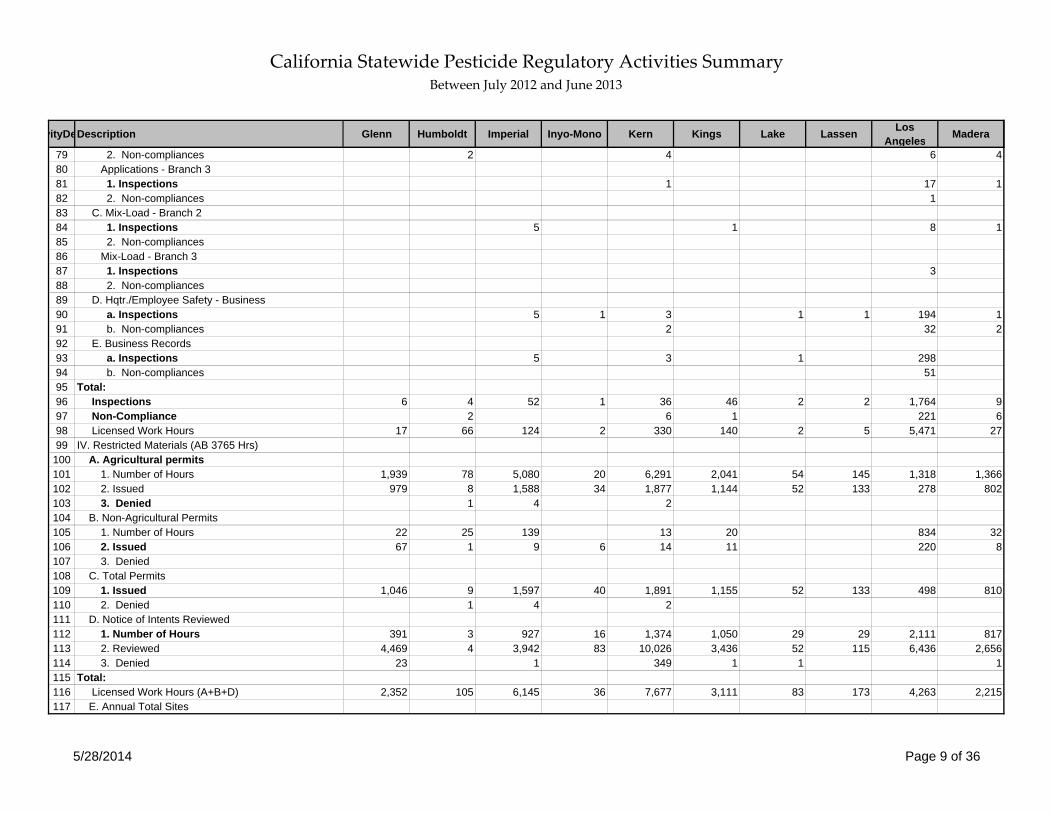
vityDeDescription
79 2. Non-compliances80 Applications - Branch 381 1. Inspections82 2. Non-compliances83 C. Mix-Load - Branch 284 1. Inspections85 2. Non-compliances86 Mix-Load - Branch 387 1. Inspections88 2. Non-compliances89 D. Hqtr./Employee Safety - Business90 a. Inspections91 b. Non-compliances92 E. Business Records93 a. Inspections94 b. Non-compliances95 Total:96 Inspections97 Non-Compliance98 Licensed Work Hours99 IV. Restricted Materials (AB 3765 Hrs)
100 A. Agricultural permits101 1. Number of Hours102 2. Issued103 3. Denied104 B. Non-Agricultural Permits105 1. Number of Hours106 2. Issued107 3. Denied108 C. Total Permits109 1. Issued110 2. Denied111 D. Notice of Intents Reviewed112 1. Number of Hours113 2. Reviewed114 3. Denied115 Total:116 Licensed Work Hours (A+B+D)117 E. Annual Total Sites
Glenn Humboldt Imperial Inyo-Mono Kern Kings Lake Lassen Los Angeles Madera
2 4 6 4
1 17 11
5 1 8 1
3
5 1 3 1 1 194 12 32 2
5 3 1 29851
6 4 52 1 36 46 2 2 1,764 92 6 1 221 6
17 66 124 2 330 140 2 5 5,471 27
1,939 78 5,080 20 6,291 2,041 54 145 1,318 1,366979 8 1,588 34 1,877 1,144 52 133 278 802
1 4 2
22 25 139 13 20 834 3267 1 9 6 14 11 220 8
1,046 9 1,597 40 1,891 1,155 52 133 498 8101 4 2
391 3 927 16 1,374 1,050 29 29 2,111 8174,469 4 3,942 83 10,026 3,436 52 115 6,436 2,656
23 1 349 1 1 1
2,352 105 6,145 36 7,677 3,111 83 173 4,263 2,215
5/28/2014 Page 9 of 36
California Statewide Pesticide Regulatory Activities Summary Between July 2012 and June 2013
vityDeDescription
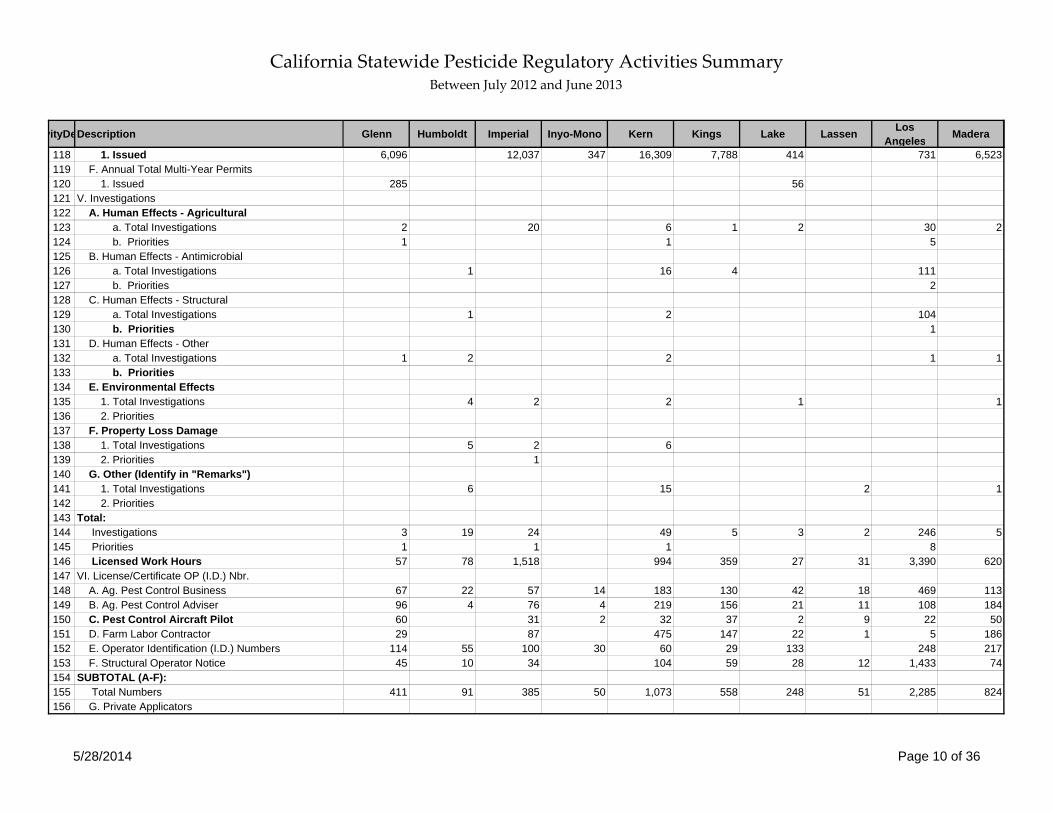
118 1. Issued119 F. Annual Total Multi-Year Permits120 1. Issued121 V. Investigations122 A. Human Effects - Agricultural123 a. Total Investigations124 b. Priorities125 B. Human Effects - Antimicrobial126 a. Total Investigations127 b. Priorities128 C. Human Effects - Structural129 a. Total Investigations130 b. Priorities131 D. Human Effects - Other132 a. Total Investigations133 b. Priorities134 E. Environmental Effects135 1. Total Investigations136 2. Priorities137 F. Property Loss Damage138 1. Total Investigations139 2. Priorities140 G. Other (Identify in "Remarks")141 1. Total Investigations142 2. Priorities143 Total:144 Investigations145 Priorities146 Licensed Work Hours147 VI. License/Certificate OP (I.D.) Nbr.148 A. Ag. Pest Control Business149 B. Ag. Pest Control Adviser150 C. Pest Control Aircraft Pilot151 D. Farm Labor Contractor152 E. Operator Identification (I.D.) Numbers153 F. Structural Operator Notice154 SUBTOTAL (A-F):155 Total Numbers156 G. Private Applicators
Glenn Humboldt Imperial Inyo-Mono Kern Kings Lake Lassen Los Angeles Madera
6,096 12,037 347 16,309 7,788 414 731 6,523
285 56
2 20 6 1 2 30 21 1 5
1 16 4 1112
1 2 1041
1 2 2 1 1
4 2 2 1 1
5 2 61
6 15 2 1
3 19 24 49 5 3 2 246 51 1 1 8
57 78 1,518 994 359 27 31 3,390 620
67 22 57 14 183 130 42 18 469 11396 4 76 4 219 156 21 11 108 18460 31 2 32 37 2 9 22 5029 87 475 147 22 1 5 186
114 55 100 30 60 29 133 248 21745 10 34 104 59 28 12 1,433 74
411 91 385 50 1,073 558 248 51 2,285 824
5/28/2014 Page 10 of 36
California Statewide Pesticide Regulatory Activities Summary Between July 2012 and June 2013
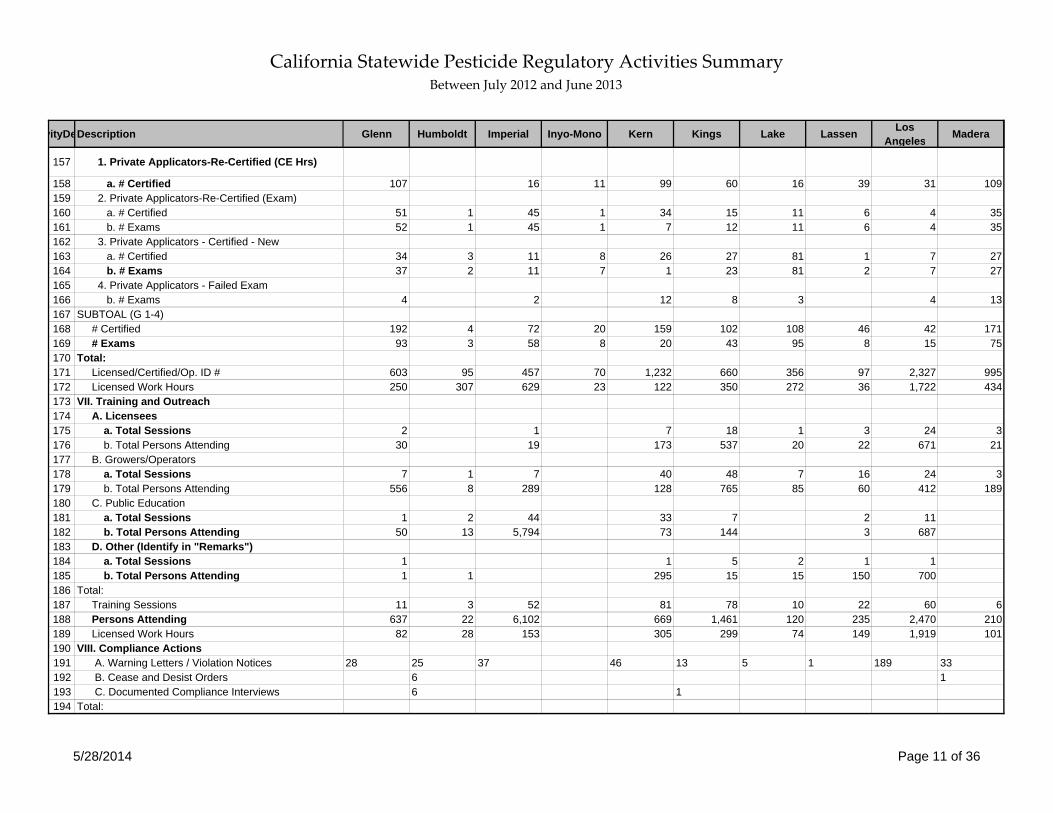
vityDeDescription
157 1. Private Applicators-Re-Certified (CE Hrs)
158 a. # Certified159 2. Private Applicators-Re-Certified (Exam)160 a. # Certified161 b. # Exams162 3. Private Applicators - Certified - New163 a. # Certified164 b. # Exams165 4. Private Applicators - Failed Exam166 b. # Exams167 SUBTOAL (G 1-4)168 # Certified169 # Exams170 Total:171 Licensed/Certified/Op. ID #172 Licensed Work Hours173 VII. Training and Outreach174 A. Licensees175 a. Total Sessions176 b. Total Persons Attending177 B. Growers/Operators178 a. Total Sessions179 b. Total Persons Attending180 C. Public Education181 a. Total Sessions182 b. Total Persons Attending183 D. Other (Identify in "Remarks")184 a. Total Sessions185 b. Total Persons Attending186 Total:187 Training Sessions188 Persons Attending189 Licensed Work Hours190 VIII. Compliance Actions191 A. Warning Letters / Violation Notices192 B. Cease and Desist Orders193 C. Documented Compliance Interviews194 Total:
Glenn Humboldt Imperial Inyo-Mono Kern Kings Lake Lassen Los Angeles Madera
107 16 11 99 60 16 39 31 109
51 1 45 1 34 15 11 6 4 3552 1 45 1 7 12 11 6 4 35
34 3 11 8 26 27 81 1 7 2737 2 11 7 1 23 81 2 7 27
4 2 12 8 3 4 13
192 4 72 20 159 102 108 46 42 17193 3 58 8 20 43 95 8 15 75
603 95 457 70 1,232 660 356 97 2,327 995250 307 629 23 122 350 272 36 1,722 434
2 1 7 18 1 3 24 330 19 173 537 20 22 671 21
7 1 7 40 48 7 16 24 3556 8 289 128 765 85 60 412 189
1 2 44 33 7 2 1150 13 5,794 73 144 3 687
1 1 5 2 1 11 1 295 15 15 150 700
11 3 52 81 78 10 22 60 6637 22 6,102 669 1,461 120 235 2,470 21082 28 153 305 299 74 149 1,919 101
28 25 37 46 13 5 1 189 336 16 1
5/28/2014 Page 11 of 36
California Statewide Pesticide Regulatory Activities Summary Between July 2012 and June 2013
vityDeDescription
195 Compliance Actions196 Licensed Work Hours197 IX. Enforcement Actions198 A. Administrative Action: (1-5)199 1. Restricted Materials Permit200 2. Private Applicator Certifications201 3. County Registrations202 4. Structural Civil Penalties203 5. Agricultural Civil Penalties204 B. Judicial Actions: (1-4)205 1. Notice to Appear (Citations)206 2. Cases Submitted to DA207 3. Civil Complaints Filed208 4. Criminal Complaints Filed209 C. Referrals to DPR210 Total:211 Enforcement Actions212 Licensed Work Hours213 X. Focused Activity214 A. Licensed Hours215 1. Completed Projects216 2. Hours217 B. Non-Licensed Hours218 1. Completed Projects219 2. Hours220 Total:221 Completed Projects222 Hours223 XI. Surveillance Hours224 XII. Pesticide/Hazardous Mat'l Spill Hrs225 XIII. Use Report Review and Follow-Up Hrs226 XIV. Total Pesticide Activity Hours227 A. Lic. Hours Expended for I - XIII228 B. Other Lic. Enforcement Hours229 Lic. Hours Subtotal (A+B)230 C. Support Hours231 Total Hours
Glenn Humboldt Imperial Inyo-Mono Kern Kings Lake Lassen Los Angeles Madera
28 37 37 46 14 5 1 189 3446.5 72.5 203.25 146 130 16.5 1 1806 66.25
2 1 239 11 1 9 30 6 4 69 9
2
1 3 11 30 6 5 308 1024 37.5 157.25 297.5 212.5 33.5 2205 35
11
11
769 101.5 503.5 408 24.5 2091.5 190.5 132.5 4346 311.2512.5
62.5 182 160.5 27 561.5 182 79.5 3312 149.75
4280.25 1062 11826.4 497 14704.3 8338.28998 959.5 659.25 30571 44861933.5 77 1164 3134.05 1579 639.25 149 3375 2047.56213.75 1139 12990.4 497 17838.35 9917.28998 1598.75 808.25 33946 6533.55281 177 5828 330 3966.05002 5431.22 510 6864 3619.8811494.75 1316 18818.4 827 21804.3999 15348.5101 2108.75 808.25 40810 10153.38
5/28/2014 Page 12 of 36
California Statewide Pesticide Regulatory Activities Summary Between July 2012 and June 2013
vityDeDescription
1 I. Pesticide Use Monitoring Inspections2 A. Preapplication (AB 3765)3 1. Number of Hours4 2. Inspections5 3. Non-compliances6 B. (PUMI) App. - Prop. Op.7 a. Inspections8 b. Non-compliances9 (PUMI) App. - PCB10 a. Inspections11 b. Non-compliances12 C. Field Fumigation13 a. Inspections14 b. Non-compliances15 Application Types16 1. Aerial17 a. Inspections18 b. Non-compliances19 2. Chemigation20 a. Inspections21 b. Non-compliances22 3. Ground23 a. Inspections24 b. Non-compliances25 4. Other26 a. Inspections27 b. Non-compliances28 5. Total (B+C)29 Inspections30 Non-compliances31 D. Commodity Fumigation32 1. Inspections33 2. Non-compliances34 E. Field Worker Safety35 1. Inspections36 2. Non-compliances37 F. (PUMI) Mix/Load -Prop. Op.38 a. Inspections39 b. Non-compliances
Marin Mariposa Mendocino Merced Modoc Monterey Napa Nevada Orange
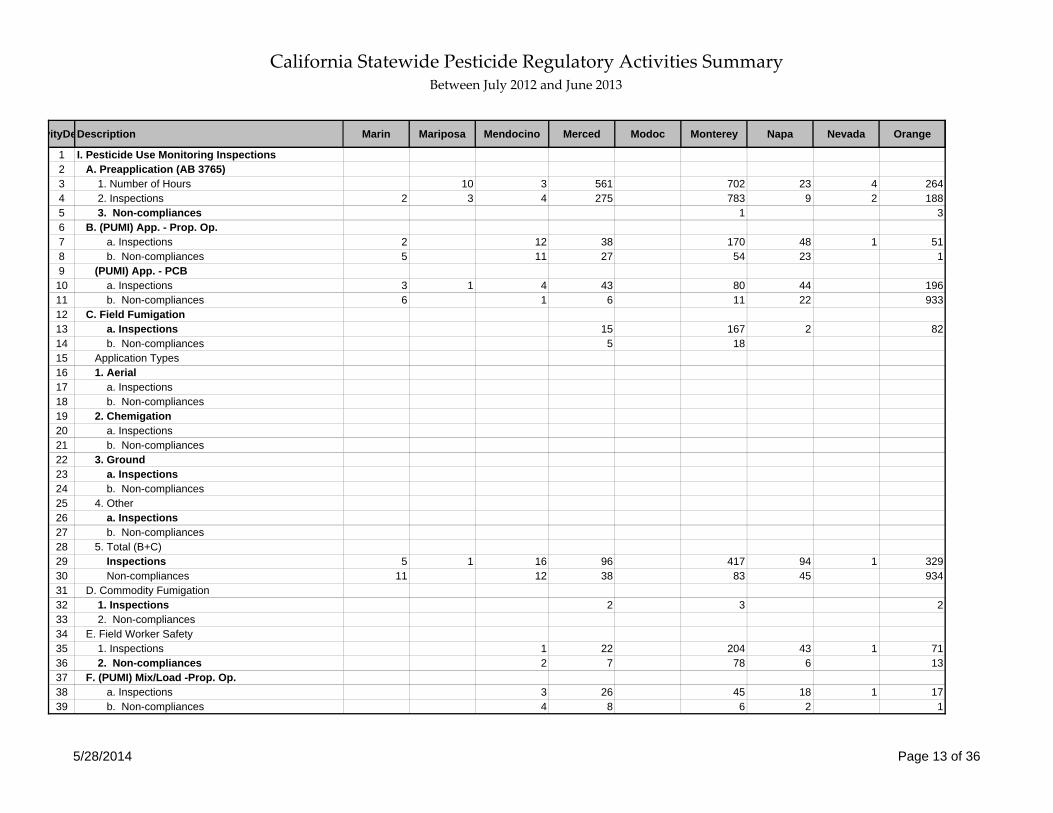
10 3 561 702 23 4 2642 3 4 275 783 9 2 188
1 3
2 12 38 170 48 1 515 11 27 54 23 1
3 1 4 43 80 44 1966 1 6 11 22 933
15 167 2 825 18
5 1 16 96 417 94 1 32911 12 38 83 45 934
2 3 2
1 22 204 43 1 712 7 78 6 13
3 26 45 18 1 174 8 6 2 1
5/28/2014 Page 13 of 36
California Statewide Pesticide Regulatory Activities Summary Between July 2012 and June 2013
vityDeDescription
40 (PUMI) Mix/Load -PCB41 a. Inspections42 b. Non-compliances43 G. Other (Identify in "Remarks")44 1. Inspections45 2. Non-compliances46 Total:47 Inspections48 Non-Compliance49 Licensed Work Hours50 II. Pest Control Records Inspection51 A. Business Records52 1. Inspections53 2. Non-compliances54 B. HQ/Emp. Safety - Business55 1. Inspections56 2. Non-compliances57 C. Dealer Records58 1. Inspections59 2. Non-compliances60 D. Adviser Records61 1. Inspections62 2. Non-compliances63 E. HQ/Emp Safety - Prod. Ag.64 1. Inspections65 2. Non-compliances66 F. HQ/Emp. Safety - Other67 1. Inspections68 2. Non-compliances69 Total:70 Inspections71 Non-Compliance72 Licensed Work Hours73 III. Structural Pest Control Inspections74 A. Fumigation - Branch 175 1. Inspections76 2. Non-compliances77 B. Applications - Branch 278 1. Inspections
Marin Mariposa Mendocino Merced Modoc Monterey Napa Nevada Orange
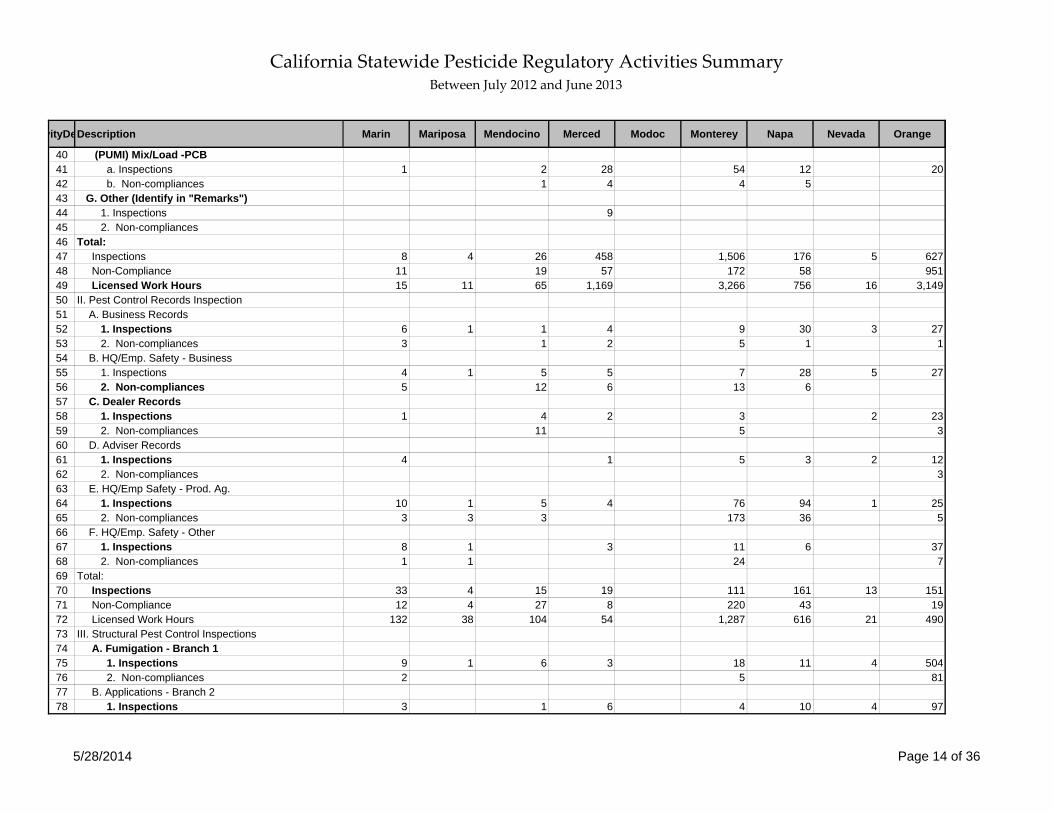
1 2 28 54 12 201 4 4 5
9
8 4 26 458 1,506 176 5 62711 19 57 172 58 95115 11 65 1,169 3,266 756 16 3,149
6 1 1 4 9 30 3 273 1 2 5 1 1
4 1 5 5 7 28 5 275 12 6 13 6
1 4 2 3 2 2311 5 3
4 1 5 3 2 123
10 1 5 4 76 94 1 253 3 3 173 36 5
8 1 3 11 6 371 1 24 7
33 4 15 19 111 161 13 15112 4 27 8 220 43 19
132 38 104 54 1,287 616 21 490
9 1 6 3 18 11 4 5042 5 81
3 1 6 4 10 4 97
5/28/2014 Page 14 of 36
California Statewide Pesticide Regulatory Activities Summary Between July 2012 and June 2013
vityDeDescription
79 2. Non-compliances80 Applications - Branch 381 1. Inspections82 2. Non-compliances83 C. Mix-Load - Branch 284 1. Inspections85 2. Non-compliances86 Mix-Load - Branch 387 1. Inspections88 2. Non-compliances89 D. Hqtr./Employee Safety - Business90 a. Inspections91 b. Non-compliances92 E. Business Records93 a. Inspections94 b. Non-compliances95 Total:96 Inspections97 Non-Compliance98 Licensed Work Hours99 IV. Restricted Materials (AB 3765 Hrs)
100 A. Agricultural permits101 1. Number of Hours102 2. Issued103 3. Denied104 B. Non-Agricultural Permits105 1. Number of Hours106 2. Issued107 3. Denied108 C. Total Permits109 1. Issued110 2. Denied111 D. Notice of Intents Reviewed112 1. Number of Hours113 2. Reviewed114 3. Denied115 Total:116 Licensed Work Hours (A+B+D)117 E. Annual Total Sites
Marin Mariposa Mendocino Merced Modoc Monterey Napa Nevada Orange
2 33
1 1 162
2 1 2 373
9
2 1 3 2 458 19
4 2 4 1 595
18 4 7 9 32 22 14 7672 13 2 143
53 9 32 69 376 106 58 5,523
115 56 25 3,979 4,500 116 11 32719 12 20 2,381 839 101 16 188
1
9 2 27 113 9 52 1 57 31 4 6
21 12 21 2,438 870 105 16 1941
35 8 8 1,781 779 26 5 41269 16 17 3,831 12,334 65 3 4,0242 17
159 64 34 5,786 5,392 151 16 744
5/28/2014 Page 15 of 36

California Statewide Pesticide Regulatory Activities Summary Between July 2012 and June 2013
vityDeDescription
118 1. Issued119 F. Annual Total Multi-Year Permits120 1. Issued121 V. Investigations122 A. Human Effects - Agricultural123 a. Total Investigations124 b. Priorities125 B. Human Effects - Antimicrobial126 a. Total Investigations127 b. Priorities128 C. Human Effects - Structural129 a. Total Investigations130 b. Priorities131 D. Human Effects - Other132 a. Total Investigations133 b. Priorities134 E. Environmental Effects135 1. Total Investigations136 2. Priorities137 F. Property Loss Damage138 1. Total Investigations139 2. Priorities140 G. Other (Identify in "Remarks")141 1. Total Investigations142 2. Priorities143 Total:144 Investigations145 Priorities146 Licensed Work Hours147 VI. License/Certificate OP (I.D.) Nbr.148 A. Ag. Pest Control Business149 B. Ag. Pest Control Adviser150 C. Pest Control Aircraft Pilot151 D. Farm Labor Contractor152 E. Operator Identification (I.D.) Numbers153 F. Structural Operator Notice154 SUBTOTAL (A-F):155 Total Numbers156 G. Private Applicators
Marin Mariposa Mendocino Merced Modoc Monterey Napa Nevada Orange
160 656 11,390 24,288 573 1,587
1 28 929 173 139
1 6 7 2 133 2
1 2 13 5 2 251 1
1 5 1 3 19
5 1 2 4 1 7
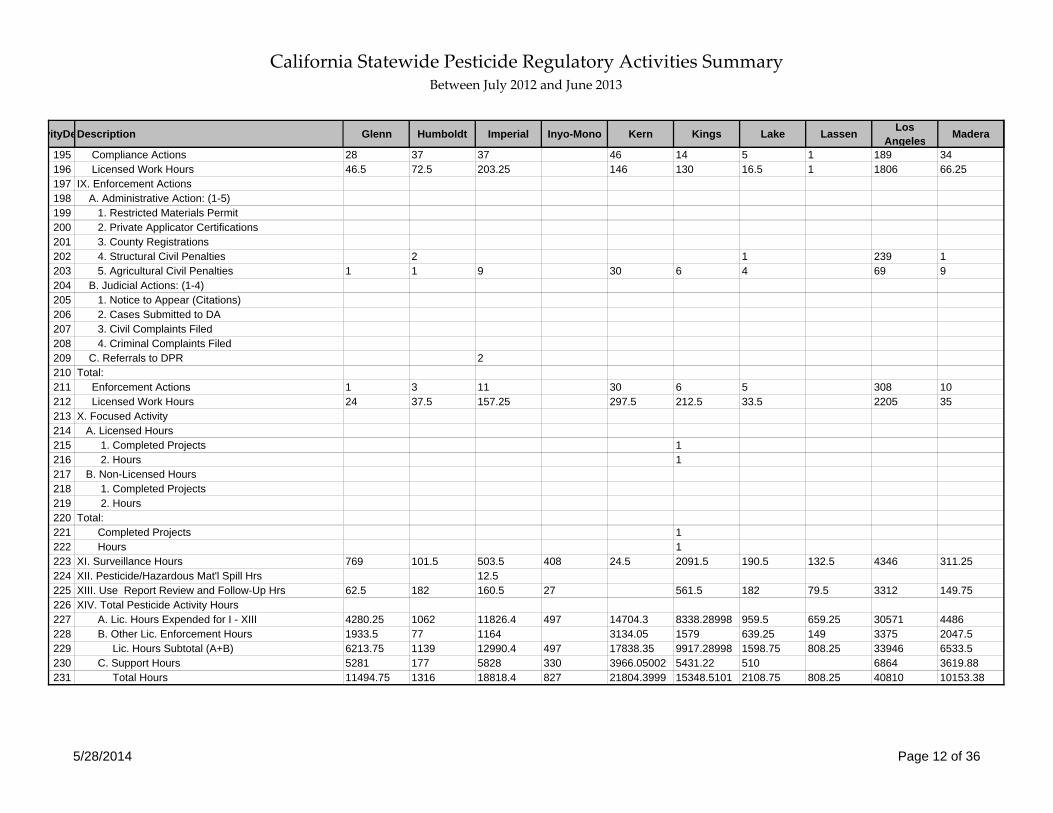
2
1
6 3 1
12 4 6 28 14 15 3 574 2 1
147 74 144 860 2,451 385 16 876
91 20 38 166 96 165 34 13122 13 24 241 131 66 16 262 2 43 24 33 1 19 144 135 72 1
52 51 534 214 309 681 165 1393 32 27 55 152 77 66 404
263 119 642 863 847 1,064 282 574
5/28/2014 Page 16 of 36
California Statewide Pesticide Regulatory Activities Summary Between July 2012 and June 2013
vityDeDescription
157 1. Private Applicators-Re-Certified (CE Hrs)
158 a. # Certified159 2. Private Applicators-Re-Certified (Exam)160 a. # Certified161 b. # Exams162 3. Private Applicators - Certified - New163 a. # Certified164 b. # Exams165 4. Private Applicators - Failed Exam166 b. # Exams167 SUBTOAL (G 1-4)168 # Certified169 # Exams170 Total:171 Licensed/Certified/Op. ID #172 Licensed Work Hours173 VII. Training and Outreach174 A. Licensees175 a. Total Sessions176 b. Total Persons Attending177 B. Growers/Operators178 a. Total Sessions179 b. Total Persons Attending180 C. Public Education181 a. Total Sessions182 b. Total Persons Attending183 D. Other (Identify in "Remarks")184 a. Total Sessions185 b. Total Persons Attending186 Total:187 Training Sessions188 Persons Attending189 Licensed Work Hours190 VIII. Compliance Actions191 A. Warning Letters / Violation Notices192 B. Cease and Desist Orders193 C. Documented Compliance Interviews194 Total:
Marin Mariposa Mendocino Merced Modoc Monterey Napa Nevada Orange
5 31 196 95 82 9
6 8 102 49 13 65 97 46 13 6
8 61 55 24 2 58 70 51 23 2 5
1 20 34 5 1 6
6 5 47 359 199 119 2 201 13 187 131 41 3 17
269 124 689 1,222 1,046 1,183 284 594329 268 731 412 1,491 2,246 322 761
1 2 4 10 13 9 94 72 23 210 574 120 951
12 10 16 10 5 1181 249 999 498 5 40
1 70 3 121 1,615 540 55
1 4 1212 128
2 2 16 20 100 26 5 2325 72 204 459 3,200 1,158 5 1,17415 384 202 155 1,525 715 3 265
14 39 20 30 43 57 24 2711
1 4 1
5/28/2014 Page 17 of 36
California Statewide Pesticide Regulatory Activities Summary Between July 2012 and June 2013
vityDeDescription
195 Compliance Actions196 Licensed Work Hours197 IX. Enforcement Actions198 A. Administrative Action: (1-5)199 1. Restricted Materials Permit200 2. Private Applicator Certifications201 3. County Registrations202 4. Structural Civil Penalties203 5. Agricultural Civil Penalties204 B. Judicial Actions: (1-4)205 1. Notice to Appear (Citations)206 2. Cases Submitted to DA207 3. Civil Complaints Filed208 4. Criminal Complaints Filed209 C. Referrals to DPR210 Total:211 Enforcement Actions212 Licensed Work Hours213 X. Focused Activity214 A. Licensed Hours215 1. Completed Projects216 2. Hours217 B. Non-Licensed Hours218 1. Completed Projects219 2. Hours220 Total:221 Completed Projects222 Hours223 XI. Surveillance Hours224 XII. Pesticide/Hazardous Mat'l Spill Hrs225 XIII. Use Report Review and Follow-Up Hrs226 XIV. Total Pesticide Activity Hours227 A. Lic. Hours Expended for I - XIII228 B. Other Lic. Enforcement Hours229 Lic. Hours Subtotal (A+B)230 C. Support Hours231 Total Hours
Marin Mariposa Mendocino Merced Modoc Monterey Napa Nevada Orange
14 40 20 30 47 59 24 27190 119 29.5 36.5 1176.75 369.5 14.5 366
1 643 11 3 1 34 6 84
4 11 3 1 34 6 14885.5 116 61 18 1481.5 196.5 566.5
5.5
8
5.5 8209.5 17.5 144 2220 2446.25 619.200001 124 15.25 3.5607.25 155.5 65 420 1728.5 722.499992 28.5 100.5
1850.5 1254.5 1610 11213.56 22631.5 6882.99991 506.25 12839.51670.39999 373 833.5 3810.03008 6301.75 4303.79995 822.5 1613520.89999 1627.5 2443.5 15023.59 28933.25 11186.8 1328.75 13000.5378.25 480 406.0900002 6318.91006 9242.5 38 179.5 37823899.14999 2107.5 2849.589996 21342.4998 38175.75 11224.8 1508.25 16782.5
5/28/2014 Page 18 of 36
California Statewide Pesticide Regulatory Activities Summary Between July 2012 and June 2013
vityDeDescription
1 I. Pesticide Use Monitoring Inspections2 A. Preapplication (AB 3765)3 1. Number of Hours4 2. Inspections5 3. Non-compliances6 B. (PUMI) App. - Prop. Op.7 a. Inspections8 b. Non-compliances9 (PUMI) App. - PCB10 a. Inspections11 b. Non-compliances12 C. Field Fumigation13 a. Inspections14 b. Non-compliances15 Application Types16 1. Aerial17 a. Inspections18 b. Non-compliances19 2. Chemigation20 a. Inspections21 b. Non-compliances22 3. Ground23 a. Inspections24 b. Non-compliances25 4. Other26 a. Inspections27 b. Non-compliances28 5. Total (B+C)29 Inspections30 Non-compliances31 D. Commodity Fumigation32 1. Inspections33 2. Non-compliances34 E. Field Worker Safety35 1. Inspections36 2. Non-compliances37 F. (PUMI) Mix/Load -Prop. Op.38 a. Inspections39 b. Non-compliances
Placer Plumas-Sierra Riverside Sacramento San Benito San
Bernardino San Diego San Francisco
San Joaquin
43 9 132 94 132 80 105 7 26516 3 130 92 146 81 58 5 329
9 73 16 10 73 130 1 1346 13 3 47 35 67
62 95 25 14 96 146 3 23140 76 8 82 99 35
1 5 11 2 1 16 21
72 173 52 26 170 292 4 159146 89 12 129 134 102
36 11 8 3 191
36 5 12 5 38 92 2 3 4
3 48 5 8 15 77 1 529 11 5 9
5/28/2014 Page 19 of 36
California Statewide Pesticide Regulatory Activities Summary Between July 2012 and June 2013
vityDeDescription
40 (PUMI) Mix/Load -PCB41 a. Inspections42 b. Non-compliances43 G. Other (Identify in "Remarks")44 1. Inspections45 2. Non-compliances46 Total:47 Inspections48 Non-Compliance49 Licensed Work Hours50 II. Pest Control Records Inspection51 A. Business Records52 1. Inspections53 2. Non-compliances54 B. HQ/Emp. Safety - Business55 1. Inspections56 2. Non-compliances57 C. Dealer Records58 1. Inspections59 2. Non-compliances60 D. Adviser Records61 1. Inspections62 2. Non-compliances63 E. HQ/Emp Safety - Prod. Ag.64 1. Inspections65 2. Non-compliances66 F. HQ/Emp. Safety - Other67 1. Inspections68 2. Non-compliances69 Total:70 Inspections71 Non-Compliance72 Licensed Work Hours73 III. Structural Pest Control Inspections74 A. Fumigation - Branch 175 1. Inspections76 2. Non-compliances77 B. Applications - Branch 278 1. Inspections
Placer Plumas-Sierra Riverside Sacramento San Benito San
Bernardino San Diego San Francisco
San Joaquin
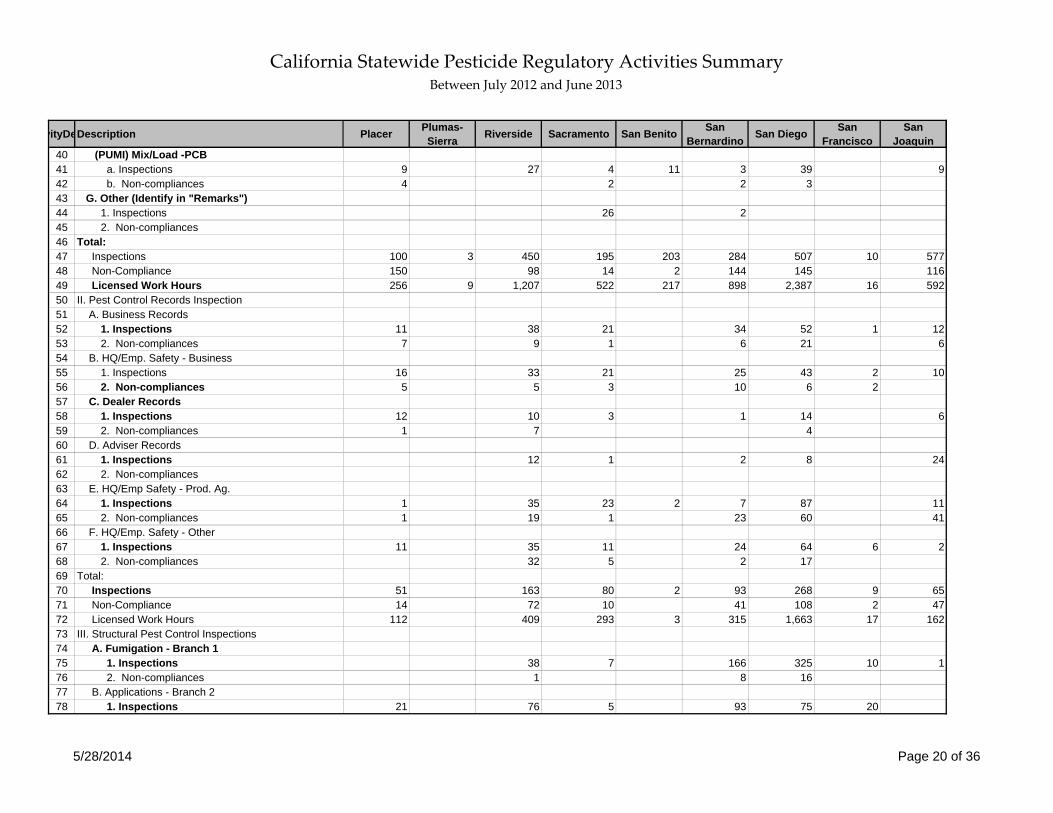
9 27 4 11 3 39 94 2 2 3
26 2
100 3 450 195 203 284 507 10 577150 98 14 2 144 145 116256 9 1,207 522 217 898 2,387 16 592
11 38 21 34 52 1 127 9 1 6 21 6
16 33 21 25 43 2 105 5 3 10 6 2
12 10 3 1 14 61 7 4
12 1 2 8 24
1 35 23 2 7 87 111 19 1 23 60 41
11 35 11 24 64 6 232 5 2 17
51 163 80 2 93 268 9 6514 72 10 41 108 2 47
112 409 293 3 315 1,663 17 162
38 7 166 325 10 11 8 16
21 76 5 93 75 20
5/28/2014 Page 20 of 36
California Statewide Pesticide Regulatory Activities Summary Between July 2012 and June 2013
vityDeDescription
79 2. Non-compliances80 Applications - Branch 381 1. Inspections82 2. Non-compliances83 C. Mix-Load - Branch 284 1. Inspections85 2. Non-compliances86 Mix-Load - Branch 387 1. Inspections88 2. Non-compliances89 D. Hqtr./Employee Safety - Business90 a. Inspections91 b. Non-compliances92 E. Business Records93 a. Inspections94 b. Non-compliances95 Total:96 Inspections97 Non-Compliance98 Licensed Work Hours99 IV. Restricted Materials (AB 3765 Hrs)
100 A. Agricultural permits101 1. Number of Hours102 2. Issued103 3. Denied104 B. Non-Agricultural Permits105 1. Number of Hours106 2. Issued107 3. Denied108 C. Total Permits109 1. Issued110 2. Denied111 D. Notice of Intents Reviewed112 1. Number of Hours113 2. Reviewed114 3. Denied115 Total:116 Licensed Work Hours (A+B+D)117 E. Annual Total Sites
Placer Plumas-Sierra Riverside Sacramento San Benito San
Bernardino San Diego San Francisco
San Joaquin
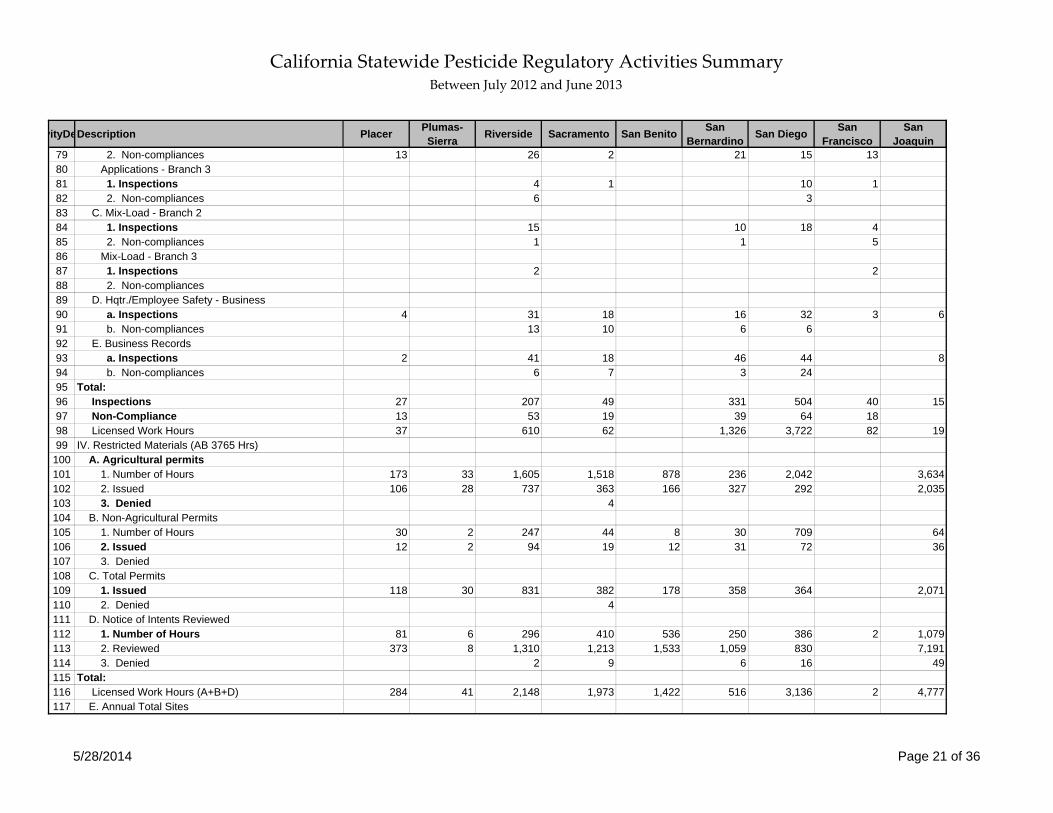
13 26 2 21 15 13
4 1 10 16 3
15 10 18 41 1 5
2 2
4 31 18 16 32 3 613 10 6 6
2 41 18 46 44 86 7 3 24
27 207 49 331 504 40 1513 53 19 39 64 1837 610 62 1,326 3,722 82 19
173 33 1,605 1,518 878 236 2,042 3,634106 28 737 363 166 327 292 2,035
4
30 2 247 44 8 30 709 6412 2 94 19 12 31 72 36
118 30 831 382 178 358 364 2,0714
81 6 296 410 536 250 386 2 1,079373 8 1,310 1,213 1,533 1,059 830 7,191
2 9 6 16 49
284 41 2,148 1,973 1,422 516 3,136 2 4,777
5/28/2014 Page 21 of 36

California Statewide Pesticide Regulatory Activities Summary Between July 2012 and June 2013
vityDeDescription
118 1. Issued119 F. Annual Total Multi-Year Permits120 1. Issued121 V. Investigations122 A. Human Effects - Agricultural123 a. Total Investigations124 b. Priorities125 B. Human Effects - Antimicrobial126 a. Total Investigations127 b. Priorities128 C. Human Effects - Structural129 a. Total Investigations130 b. Priorities131 D. Human Effects - Other132 a. Total Investigations133 b. Priorities134 E. Environmental Effects135 1. Total Investigations136 2. Priorities137 F. Property Loss Damage138 1. Total Investigations139 2. Priorities140 G. Other (Identify in "Remarks")141 1. Total Investigations142 2. Priorities143 Total:144 Investigations145 Priorities146 Licensed Work Hours147 VI. License/Certificate OP (I.D.) Nbr.148 A. Ag. Pest Control Business149 B. Ag. Pest Control Adviser150 C. Pest Control Aircraft Pilot151 D. Farm Labor Contractor152 E. Operator Identification (I.D.) Numbers153 F. Structural Operator Notice154 SUBTOTAL (A-F):155 Total Numbers156 G. Private Applicators
Placer Plumas-Sierra Riverside Sacramento San Benito San
Bernardino San Diego San Francisco
San Joaquin
570 7,785 6,081 1,187 4,622 22,198
472 86 941
1 2 7 3 3 6 391 1 2
6 10 20 37 33 8 401
5 18 3 4 111
5 40 26 2 4 37 5 31 3
3 1 5 1 2 2 141
1 2 1 1 3
25 9 65 95
15 79 65 7 73 146 18 1191 3 5 7
184 1,638 574 258 456 5,648 207 1,969
165 13 349 220 36 237 321 75 21955 7 97 114 46 61 95 13 21222 3 23 23 4 16 3 297 78 86 69 4 37 226
155 35 600 231 108 139 3,550 25 188157 635 195 53 505 399 114 170
561 58 1,782 869 316 962 4,405 227 1,044
5/28/2014 Page 22 of 36

California Statewide Pesticide Regulatory Activities Summary Between July 2012 and June 2013
vityDeDescription
157 1. Private Applicators-Re-Certified (CE Hrs)
158 a. # Certified159 2. Private Applicators-Re-Certified (Exam)160 a. # Certified161 b. # Exams162 3. Private Applicators - Certified - New163 a. # Certified164 b. # Exams165 4. Private Applicators - Failed Exam166 b. # Exams167 SUBTOAL (G 1-4)168 # Certified169 # Exams170 Total:171 Licensed/Certified/Op. ID #172 Licensed Work Hours173 VII. Training and Outreach174 A. Licensees175 a. Total Sessions176 b. Total Persons Attending177 B. Growers/Operators178 a. Total Sessions179 b. Total Persons Attending180 C. Public Education181 a. Total Sessions182 b. Total Persons Attending183 D. Other (Identify in "Remarks")184 a. Total Sessions185 b. Total Persons Attending186 Total:187 Training Sessions188 Persons Attending189 Licensed Work Hours190 VIII. Compliance Actions191 A. Warning Letters / Violation Notices192 B. Cease and Desist Orders193 C. Documented Compliance Interviews194 Total:
Placer Plumas-Sierra Riverside Sacramento San Benito San
Bernardino San Diego San Francisco
San Joaquin
7 34 23 20 2 20 505
5 4 51 25 19 32 51 1321 4 54 24 13 31 51 132
2 1 37 16 20 18 25 6 1024 1 37 16 16 19 25 102
2 11 2 15 3 3 41
14 5 122 64 59 52 96 6 7397 5 102 40 31 65 79 3 275
575 63 1,904 933 375 1,014 4,501 233 1,783809 57 522 947 391 245 908 169 141
9 8 2 2 1 32 93 1 12101 10 290 120 46 207 1,661 1 658
9 7 4 4 2 7 407 8265 10 168 99 107 8 705 1,107
1 1818
2 2 1 3 11 7 18 100 68
20 18 6 6 3 58 503 2 20367 27 458 237 153 333 2,434 1 1,765118 21 22 69 165 123 396 4 531
55 137 24 2 105 187 2130 99 5 16 24 3
1 2
5/28/2014 Page 23 of 36
California Statewide Pesticide Regulatory Activities Summary Between July 2012 and June 2013
vityDeDescription
195 Compliance Actions196 Licensed Work Hours197 IX. Enforcement Actions198 A. Administrative Action: (1-5)199 1. Restricted Materials Permit200 2. Private Applicator Certifications201 3. County Registrations202 4. Structural Civil Penalties203 5. Agricultural Civil Penalties204 B. Judicial Actions: (1-4)205 1. Notice to Appear (Citations)206 2. Cases Submitted to DA207 3. Civil Complaints Filed208 4. Criminal Complaints Filed209 C. Referrals to DPR210 Total:211 Enforcement Actions212 Licensed Work Hours213 X. Focused Activity214 A. Licensed Hours215 1. Completed Projects216 2. Hours217 B. Non-Licensed Hours218 1. Completed Projects219 2. Hours220 Total:221 Completed Projects222 Hours223 XI. Surveillance Hours224 XII. Pesticide/Hazardous Mat'l Spill Hrs225 XIII. Use Report Review and Follow-Up Hrs226 XIV. Total Pesticide Activity Hours227 A. Lic. Hours Expended for I - XIII228 B. Other Lic. Enforcement Hours229 Lic. Hours Subtotal (A+B)230 C. Support Hours231 Total Hours
Placer Plumas-Sierra Riverside Sacramento San Benito San
Bernardino San Diego San Francisco
San Joaquin
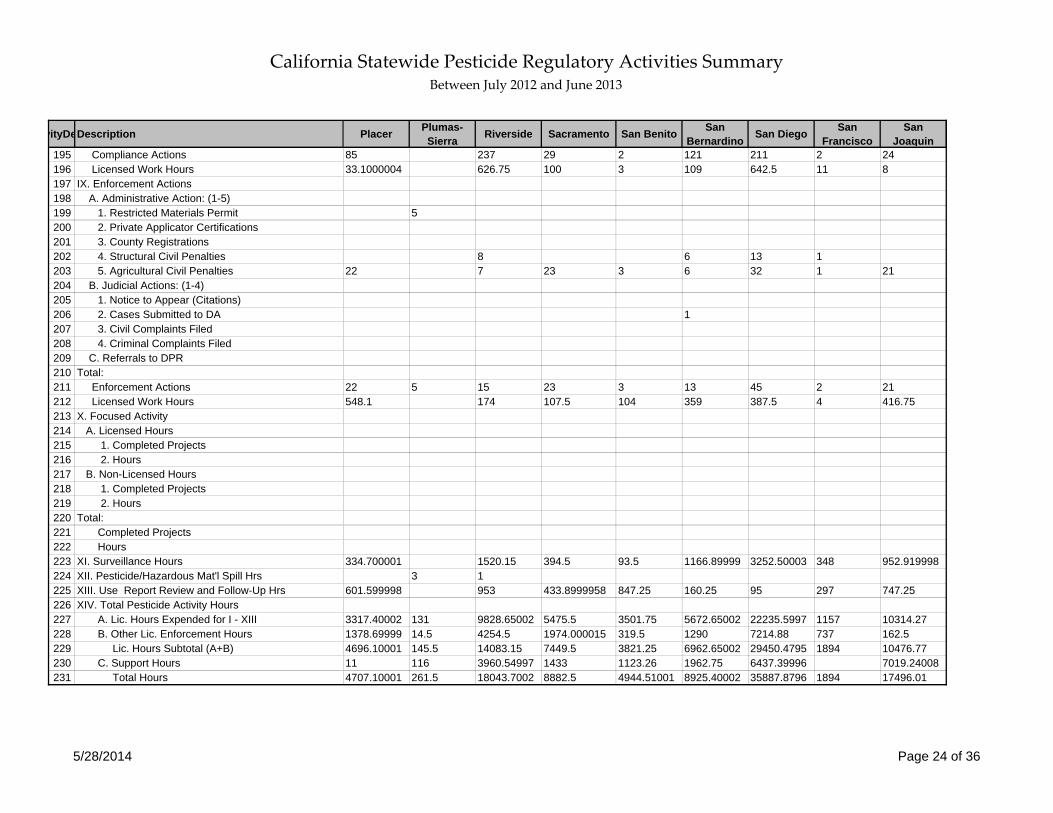
85 237 29 2 121 211 2 2433.1000004 626.75 100 3 109 642.5 11 8
5
8 6 13 122 7 23 3 6 32 1 21
1
22 5 15 23 3 13 45 2 21548.1 174 107.5 104 359 387.5 4 416.75
334.700001 1520.15 394.5 93.5 1166.89999 3252.50003 348 952.9199983 1
601.599998 953 433.8999958 847.25 160.25 95 297 747.25
3317.40002 131 9828.65002 5475.5 3501.75 5672.65002 22235.5997 1157 10314.271378.69999 14.5 4254.5 1974.000015 319.5 1290 7214.88 737 162.54696.10001 145.5 14083.15 7449.5 3821.25 6962.65002 29450.4795 1894 10476.7711 116 3960.54997 1433 1123.26 1962.75 6437.39996 7019.240084707.10001 261.5 18043.7002 8882.5 4944.51001 8925.40002 35887.8796 1894 17496.01
5/28/2014 Page 24 of 36
California Statewide Pesticide Regulatory Activities Summary Between July 2012 and June 2013
vityDeDescription
1 I. Pesticide Use Monitoring Inspections2 A. Preapplication (AB 3765)3 1. Number of Hours4 2. Inspections5 3. Non-compliances6 B. (PUMI) App. - Prop. Op.7 a. Inspections8 b. Non-compliances9 (PUMI) App. - PCB10 a. Inspections11 b. Non-compliances12 C. Field Fumigation13 a. Inspections14 b. Non-compliances15 Application Types16 1. Aerial17 a. Inspections18 b. Non-compliances19 2. Chemigation20 a. Inspections21 b. Non-compliances22 3. Ground23 a. Inspections24 b. Non-compliances25 4. Other26 a. Inspections27 b. Non-compliances28 5. Total (B+C)29 Inspections30 Non-compliances31 D. Commodity Fumigation32 1. Inspections33 2. Non-compliances34 E. Field Worker Safety35 1. Inspections36 2. Non-compliances37 F. (PUMI) Mix/Load -Prop. Op.38 a. Inspections39 b. Non-compliances
San Luis Obispo San Mateo Santa
Barbara Santa Clara Santa Cruz Shasta Siskiyou Solano Sonoma Stanislaus
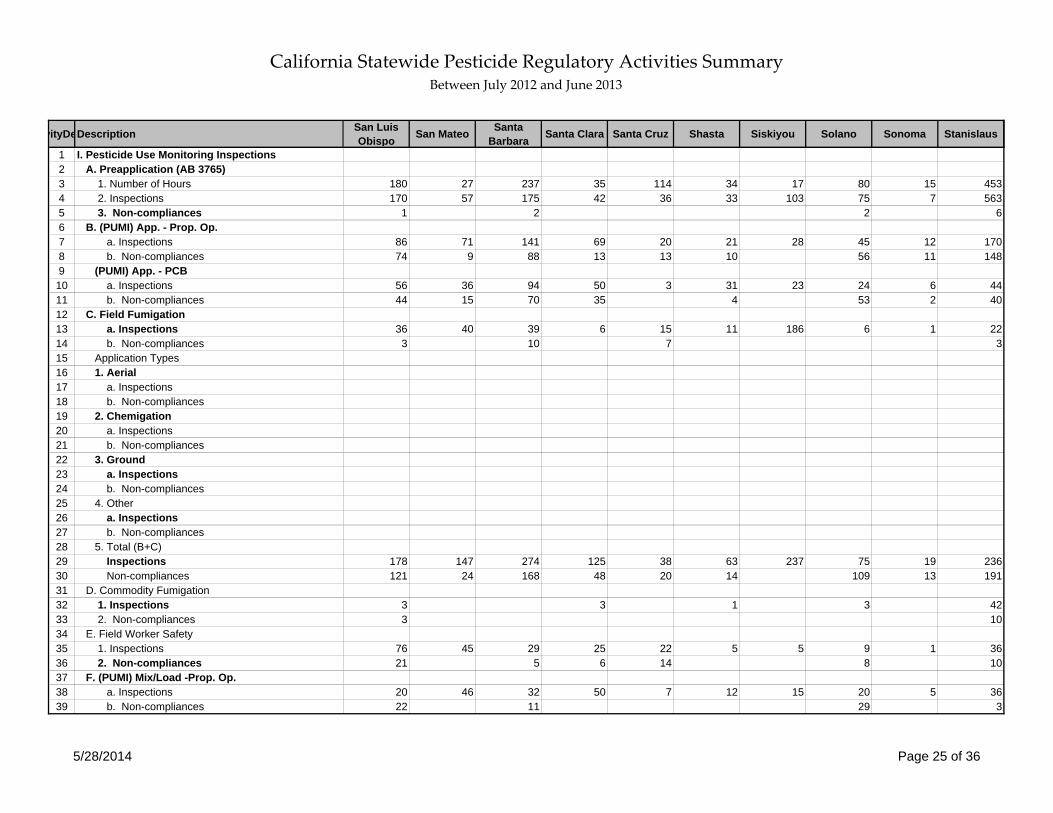
180 27 237 35 114 34 17 80 15 453170 57 175 42 36 33 103 75 7 563
1 2 2 6
86 71 141 69 20 21 28 45 12 17074 9 88 13 13 10 56 11 148
56 36 94 50 3 31 23 24 6 4444 15 70 35 4 53 2 40
36 40 39 6 15 11 186 6 1 223 10 7 3
178 147 274 125 38 63 237 75 19 236121 24 168 48 20 14 109 13 191
3 3 1 3 423 10
76 45 29 25 22 5 5 9 1 3621 5 6 14 8 10
20 46 32 50 7 12 15 20 5 3622 11 29 3
5/28/2014 Page 25 of 36
California Statewide Pesticide Regulatory Activities Summary Between July 2012 and June 2013
vityDeDescription
40 (PUMI) Mix/Load -PCB41 a. Inspections42 b. Non-compliances43 G. Other (Identify in "Remarks")44 1. Inspections45 2. Non-compliances46 Total:47 Inspections48 Non-Compliance49 Licensed Work Hours50 II. Pest Control Records Inspection51 A. Business Records52 1. Inspections53 2. Non-compliances54 B. HQ/Emp. Safety - Business55 1. Inspections56 2. Non-compliances57 C. Dealer Records58 1. Inspections59 2. Non-compliances60 D. Adviser Records61 1. Inspections62 2. Non-compliances63 E. HQ/Emp Safety - Prod. Ag.64 1. Inspections65 2. Non-compliances66 F. HQ/Emp. Safety - Other67 1. Inspections68 2. Non-compliances69 Total:70 Inspections71 Non-Compliance72 Licensed Work Hours73 III. Structural Pest Control Inspections74 A. Fumigation - Branch 175 1. Inspections76 2. Non-compliances77 B. Applications - Branch 278 1. Inspections
San Luis Obispo San Mateo Santa
Barbara Santa Clara Santa Cruz Shasta Siskiyou Solano Sonoma Stanislaus
19 10 18 22 15 3 1 104 2 2 1 2 4
7 9 7
466 305 535 267 103 129 369 185 33 930172 26 188 55 34 14 150 13 224980 572 1,587 360 680 166 239 320 93 1,082
22 17 1 19 13 3 8 1518 1 5 1 1 8
16 16 4 12 10 2 2 4 1212 2 2 6 1 1 4 14
3 2 1 4 4 2 4 162 2 3 14 26
4 5 1 4 1 1 262
40 49 66 67 1 5 2 13 15 5252 9 66 42 3 18 8 138
11 42 8 10 21 8 1 104 3 12 1 28
96 131 80 113 1 57 7 31 28 13188 12 71 67 3 5 34 13 216
288 238 336 197 4 113 16 239 152 462
24 59 53 232 1 1 1 2 611 2 3 31
14 18 33 8 14 1 10 3 23
5/28/2014 Page 26 of 36
California Statewide Pesticide Regulatory Activities Summary Between July 2012 and June 2013
vityDeDescription
79 2. Non-compliances80 Applications - Branch 381 1. Inspections82 2. Non-compliances83 C. Mix-Load - Branch 284 1. Inspections85 2. Non-compliances86 Mix-Load - Branch 387 1. Inspections88 2. Non-compliances89 D. Hqtr./Employee Safety - Business90 a. Inspections91 b. Non-compliances92 E. Business Records93 a. Inspections94 b. Non-compliances95 Total:96 Inspections97 Non-Compliance98 Licensed Work Hours99 IV. Restricted Materials (AB 3765 Hrs)
100 A. Agricultural permits101 1. Number of Hours102 2. Issued103 3. Denied104 B. Non-Agricultural Permits105 1. Number of Hours106 2. Issued107 3. Denied108 C. Total Permits109 1. Issued110 2. Denied111 D. Notice of Intents Reviewed112 1. Number of Hours113 2. Reviewed114 3. Denied115 Total:116 Licensed Work Hours (A+B+D)117 E. Annual Total Sites
San Luis Obispo San Mateo Santa
Barbara Santa Clara Santa Cruz Shasta Siskiyou Solano Sonoma Stanislaus
9 3 6 6 8 2
2 1 4 3 2 23 1 6 1
3 7 1 1 2 14 1
1 12
9 13 4 12 6 4 59 3 12
10 19 3 15 6 1 71 3 2 7 2
62 110 104 272 1 28 2 16 9 4437 8 17 63 9 4
173 327 358 459 16 31 3 50 10 55
4,651 144 2,376 157 2,027 220 410 2,957 561 2,333653 48 739 171 372 119 374 493 143 2,276
1 6 1 1
28 8 41 15 29 25 1 16 15 11329 9 17 18 13 24 1 5 3 82
682 57 756 189 385 143 375 498 146 2,3581 6 1 1
364 88 329 59 653 58 66 124 70 1,4172,172 298 1,265 731 708 394 400 806 159 9,144
35 1 60 76 2 63
5,042 240 2,745 231 2,708 303 477 3,096 646 3,863
5/28/2014 Page 27 of 36
California Statewide Pesticide Regulatory Activities Summary Between July 2012 and June 2013
vityDeDescription
118 1. Issued119 F. Annual Total Multi-Year Permits120 1. Issued121 V. Investigations122 A. Human Effects - Agricultural123 a. Total Investigations124 b. Priorities125 B. Human Effects - Antimicrobial126 a. Total Investigations127 b. Priorities128 C. Human Effects - Structural129 a. Total Investigations130 b. Priorities131 D. Human Effects - Other132 a. Total Investigations133 b. Priorities134 E. Environmental Effects135 1. Total Investigations136 2. Priorities137 F. Property Loss Damage138 1. Total Investigations139 2. Priorities140 G. Other (Identify in "Remarks")141 1. Total Investigations142 2. Priorities143 Total:144 Investigations145 Priorities146 Licensed Work Hours147 VI. License/Certificate OP (I.D.) Nbr.148 A. Ag. Pest Control Business149 B. Ag. Pest Control Adviser150 C. Pest Control Aircraft Pilot151 D. Farm Labor Contractor152 E. Operator Identification (I.D.) Numbers153 F. Structural Operator Notice154 SUBTOTAL (A-F):155 Total Numbers156 G. Private Applicators
San Luis Obispo San Mateo Santa
Barbara Santa Clara Santa Cruz Shasta Siskiyou Solano Sonoma Stanislaus
4,270 464 8,245 3,874 4,657 2,015 3,843 1,048 11,863
227 414 6 121 232 962
3 4 22 5 11 2 2 7 8 72 3
6 8 8 29 3 3 1 6 13 41
2 3 11 1 3 11 1
4 2 11 13 1 3 6 2 171
6 2 1 2 2
5 1 1 4
16 1 2 3 3
18 16 51 76 16 9 8 20 31 361 3 2 3
698 357 2,536 744 361 100 36 480 420 1,473
146 134 92 199 69 88 32 92 190 217120 39 105 69 70 35 24 47 54 23115 2 14 6 4 11 6 9 5 33
115 2 70 57 53 3 3 29 82 104505 57 420 268 453 148 16 104 1,295 19469 161 69 230 76 44 13 37 76 111
970 395 770 829 725 329 94 318 1,702 890
5/28/2014 Page 28 of 36
California Statewide Pesticide Regulatory Activities Summary Between July 2012 and June 2013
vityDeDescription
157 1. Private Applicators-Re-Certified (CE Hrs)
158 a. # Certified159 2. Private Applicators-Re-Certified (Exam)160 a. # Certified161 b. # Exams162 3. Private Applicators - Certified - New163 a. # Certified164 b. # Exams165 4. Private Applicators - Failed Exam166 b. # Exams167 SUBTOAL (G 1-4)168 # Certified169 # Exams170 Total:171 Licensed/Certified/Op. ID #172 Licensed Work Hours173 VII. Training and Outreach174 A. Licensees175 a. Total Sessions176 b. Total Persons Attending177 B. Growers/Operators178 a. Total Sessions179 b. Total Persons Attending180 C. Public Education181 a. Total Sessions182 b. Total Persons Attending183 D. Other (Identify in "Remarks")184 a. Total Sessions185 b. Total Persons Attending186 Total:187 Training Sessions188 Persons Attending189 Licensed Work Hours190 VIII. Compliance Actions191 A. Warning Letters / Violation Notices192 B. Cease and Desist Orders193 C. Documented Compliance Interviews194 Total:
San Luis Obispo San Mateo Santa
Barbara Santa Clara Santa Cruz Shasta Siskiyou Solano Sonoma Stanislaus
80 9 17 31 43 6 12 26 98 325
124 4 126 24 17 9 2 26 57 236123 4 194 23 17 11 2 23 236
55 2 69 14 17 14 6 14 33 9954 2 85 13 17 11 3 13 99
14 92 6 2 1 2 4 31
259 15 212 69 77 29 20 66 188 660191 6 371 42 36 23 5 38 4 366
1,229 410 982 898 802 358 114 384 1,890 1,5501,654 266 987 491 467 234 57 322 2,633 320
5 4 23 10 17 20 1 6 6300 265 378 522 267 435 50 265 312
5 13 99 4 1 18 3 3 6 15355 412 431 199 55 344 181 131 417 1,139
15 2 9 2 13525 78 83 38 345
1 39 814 42 94 94
10 17 137 15 1 76 40 4 14 34655 691 1,334 763 55 783 793 181 720 1,796171 173 324 213 56 219 284 45 237 496
156 44 89 69 13 1 72 10 1626 5 3 5 9 6
7 2 1 2
5/28/2014 Page 29 of 36
California Statewide Pesticide Regulatory Activities Summary Between July 2012 and June 2013
vityDeDescription
195 Compliance Actions196 Licensed Work Hours197 IX. Enforcement Actions198 A. Administrative Action: (1-5)199 1. Restricted Materials Permit200 2. Private Applicator Certifications201 3. County Registrations202 4. Structural Civil Penalties203 5. Agricultural Civil Penalties204 B. Judicial Actions: (1-4)205 1. Notice to Appear (Citations)206 2. Cases Submitted to DA207 3. Civil Complaints Filed208 4. Criminal Complaints Filed209 C. Referrals to DPR210 Total:211 Enforcement Actions212 Licensed Work Hours213 X. Focused Activity214 A. Licensed Hours215 1. Completed Projects216 2. Hours217 B. Non-Licensed Hours218 1. Completed Projects219 2. Hours220 Total:221 Completed Projects222 Hours223 XI. Surveillance Hours224 XII. Pesticide/Hazardous Mat'l Spill Hrs225 XIII. Use Report Review and Follow-Up Hrs226 XIV. Total Pesticide Activity Hours227 A. Lic. Hours Expended for I - XIII228 B. Other Lic. Enforcement Hours229 Lic. Hours Subtotal (A+B)230 C. Support Hours231 Total Hours
San Luis Obispo San Mateo Santa
Barbara Santa Clara Santa Cruz Shasta Siskiyou Solano Sonoma Stanislaus
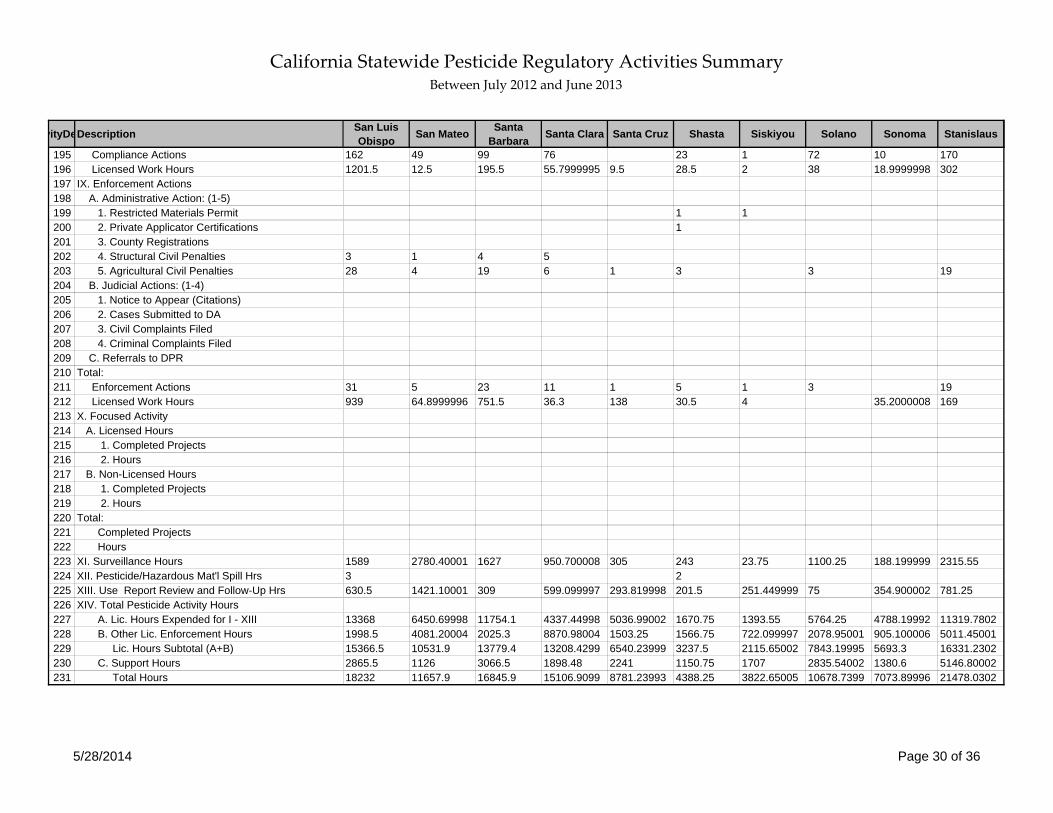
162 49 99 76 23 1 72 10 1701201.5 12.5 195.5 55.7999995 9.5 28.5 2 38 18.9999998 302
1 11
3 1 4 528 4 19 6 1 3 3 19
31 5 23 11 1 5 1 3 19939 64.8999996 751.5 36.3 138 30.5 4 35.2000008 169
1589 2780.40001 1627 950.700008 305 243 23.75 1100.25 188.199999 2315.553 2630.5 1421.10001 309 599.099997 293.819998 201.5 251.449999 75 354.900002 781.25
13368 6450.69998 11754.1 4337.44998 5036.99002 1670.75 1393.55 5764.25 4788.19992 11319.78021998.5 4081.20004 2025.3 8870.98004 1503.25 1566.75 722.099997 2078.95001 905.100006 5011.4500115366.5 10531.9 13779.4 13208.4299 6540.23999 3237.5 2115.65002 7843.19995 5693.3 16331.23022865.5 1126 3066.5 1898.48 2241 1150.75 1707 2835.54002 1380.6 5146.8000218232 11657.9 16845.9 15106.9099 8781.23993 4388.25 3822.65005 10678.7399 7073.89996 21478.0302
5/28/2014 Page 30 of 36
California Statewide Pesticide Regulatory Activities Summary Between July 2012 and June 2013
vityDeDescription
1 I. Pesticide Use Monitoring Inspections2 A. Preapplication (AB 3765)3 1. Number of Hours4 2. Inspections5 3. Non-compliances6 B. (PUMI) App. - Prop. Op.7 a. Inspections8 b. Non-compliances9 (PUMI) App. - PCB10 a. Inspections11 b. Non-compliances12 C. Field Fumigation13 a. Inspections14 b. Non-compliances15 Application Types16 1. Aerial17 a. Inspections18 b. Non-compliances19 2. Chemigation20 a. Inspections21 b. Non-compliances22 3. Ground23 a. Inspections24 b. Non-compliances25 4. Other26 a. Inspections27 b. Non-compliances28 5. Total (B+C)29 Inspections30 Non-compliances31 D. Commodity Fumigation32 1. Inspections33 2. Non-compliances34 E. Field Worker Safety35 1. Inspections36 2. Non-compliances37 F. (PUMI) Mix/Load -Prop. Op.38 a. Inspections39 b. Non-compliances
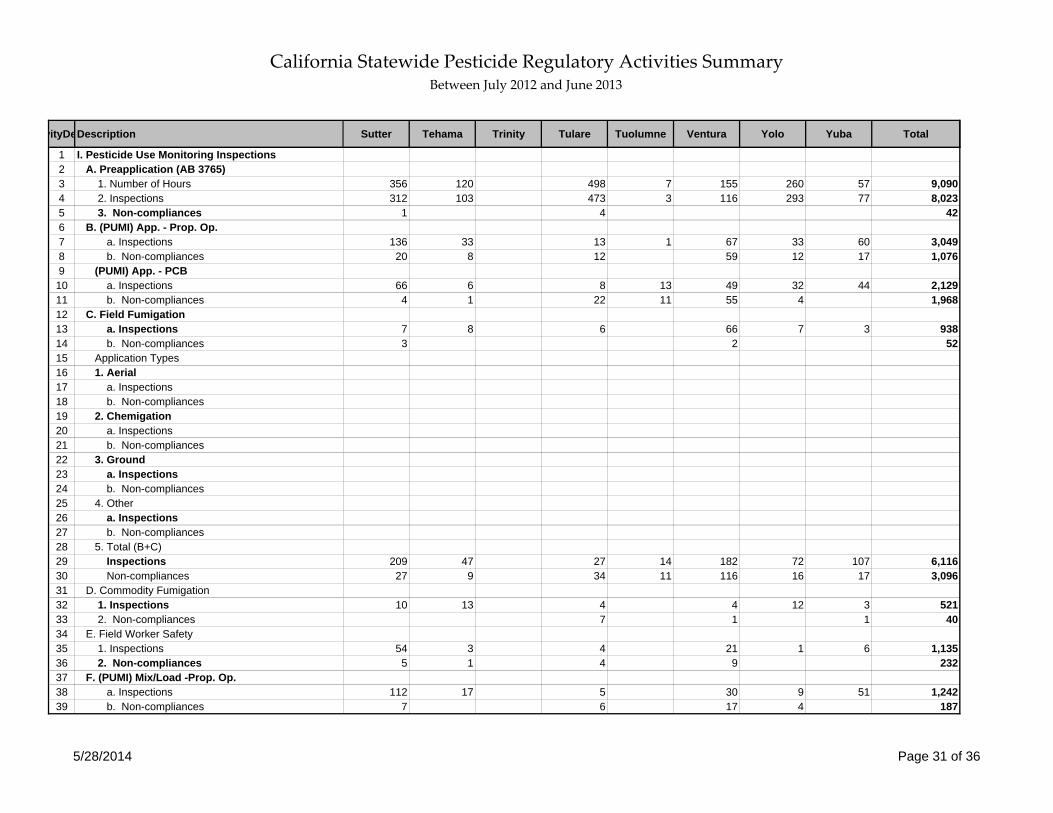
Sutter Tehama Trinity Tulare Tuolumne Ventura Yolo Yuba Total
356 120 498 7 155 260 57 9,090312 103 473 3 116 293 77 8,023
1 4 42
136 33 13 1 67 33 60 3,04920 8 12 59 12 17 1,076
66 6 8 13 49 32 44 2,1294 1 22 11 55 4 1,968
7 8 6 66 7 3 9383 2 52
209 47 27 14 182 72 107 6,11627 9 34 11 116 16 17 3,096
10 13 4 4 12 3 5217 1 1 40
54 3 4 21 1 6 1,1355 1 4 9 232
112 17 5 30 9 51 1,2427 6 17 4 187
5/28/2014 Page 31 of 36
California Statewide Pesticide Regulatory Activities Summary Between July 2012 and June 2013
vityDeDescription
40 (PUMI) Mix/Load -PCB41 a. Inspections42 b. Non-compliances43 G. Other (Identify in "Remarks")44 1. Inspections45 2. Non-compliances46 Total:47 Inspections48 Non-Compliance49 Licensed Work Hours50 II. Pest Control Records Inspection51 A. Business Records52 1. Inspections53 2. Non-compliances54 B. HQ/Emp. Safety - Business55 1. Inspections56 2. Non-compliances57 C. Dealer Records58 1. Inspections59 2. Non-compliances60 D. Adviser Records61 1. Inspections62 2. Non-compliances63 E. HQ/Emp Safety - Prod. Ag.64 1. Inspections65 2. Non-compliances66 F. HQ/Emp. Safety - Other67 1. Inspections68 2. Non-compliances69 Total:70 Inspections71 Non-Compliance72 Licensed Work Hours73 III. Structural Pest Control Inspections74 A. Fumigation - Branch 175 1. Inspections76 2. Non-compliances77 B. Applications - Branch 278 1. Inspections
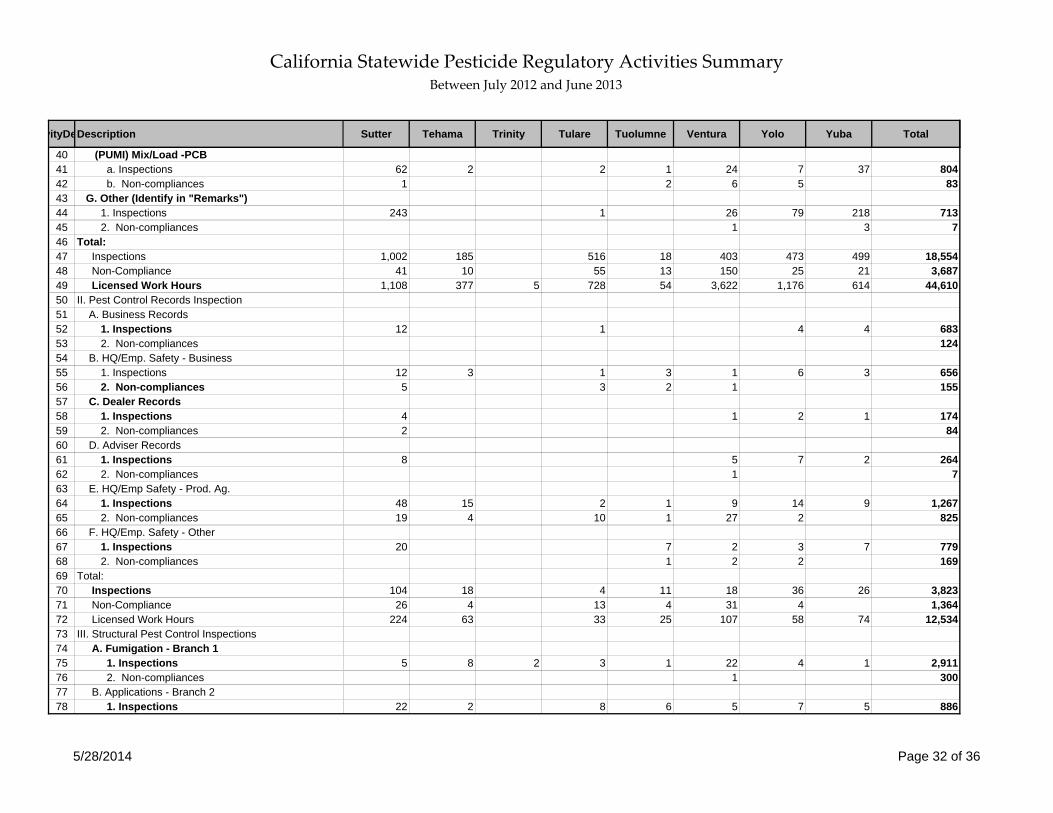
Sutter Tehama Trinity Tulare Tuolumne Ventura Yolo Yuba Total
62 2 2 1 24 7 37 8041 2 6 5 83
243 1 26 79 218 7131 3 7
1,002 185 516 18 403 473 499 18,55441 10 55 13 150 25 21 3,687
1,108 377 5 728 54 3,622 1,176 614 44,610
12 1 4 4 683124
12 3 1 3 1 6 3 6565 3 2 1 155
4 1 2 1 1742 84
8 5 7 2 2641 7
48 15 2 1 9 14 9 1,26719 4 10 1 27 2 825
20 7 2 3 7 7791 2 2 169
104 18 4 11 18 36 26 3,82326 4 13 4 31 4 1,364
224 63 33 25 107 58 74 12,534
5 8 2 3 1 22 4 1 2,9111 300
22 2 8 6 5 7 5 886
5/28/2014 Page 32 of 36
California Statewide Pesticide Regulatory Activities Summary Between July 2012 and June 2013
vityDeDescription
79 2. Non-compliances80 Applications - Branch 381 1. Inspections82 2. Non-compliances83 C. Mix-Load - Branch 284 1. Inspections85 2. Non-compliances86 Mix-Load - Branch 387 1. Inspections88 2. Non-compliances89 D. Hqtr./Employee Safety - Business90 a. Inspections91 b. Non-compliances92 E. Business Records93 a. Inspections94 b. Non-compliances95 Total:96 Inspections97 Non-Compliance98 Licensed Work Hours99 IV. Restricted Materials (AB 3765 Hrs)
100 A. Agricultural permits101 1. Number of Hours102 2. Issued103 3. Denied104 B. Non-Agricultural Permits105 1. Number of Hours106 2. Issued107 3. Denied108 C. Total Permits109 1. Issued110 2. Denied111 D. Notice of Intents Reviewed112 1. Number of Hours113 2. Reviewed114 3. Denied115 Total:116 Licensed Work Hours (A+B+D)117 E. Annual Total Sites
Sutter Tehama Trinity Tulare Tuolumne Ventura Yolo Yuba Total
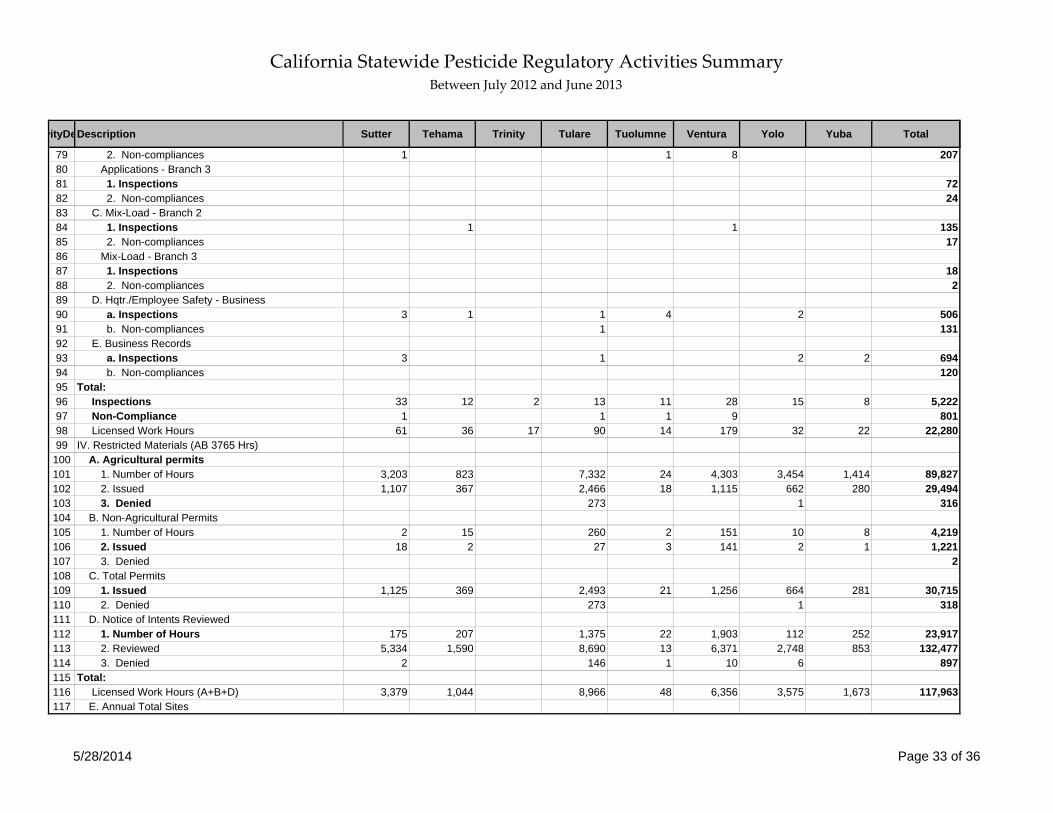
1 1 8 207
7224
1 1 13517
182
3 1 1 4 2 5061 131
3 1 2 2 694120
33 12 2 13 11 28 15 8 5,2221 1 1 9 801
61 36 17 90 14 179 32 22 22,280
3,203 823 7,332 24 4,303 3,454 1,414 89,8271,107 367 2,466 18 1,115 662 280 29,494
273 1 316
2 15 260 2 151 10 8 4,21918 2 27 3 141 2 1 1,221
2
1,125 369 2,493 21 1,256 664 281 30,715273 1 318
175 207 1,375 22 1,903 112 252 23,9175,334 1,590 8,690 13 6,371 2,748 853 132,477
2 146 1 10 6 897
3,379 1,044 8,966 48 6,356 3,575 1,673 117,963
5/28/2014 Page 33 of 36
California Statewide Pesticide Regulatory Activities Summary Between July 2012 and June 2013
vityDeDescription
118 1. Issued119 F. Annual Total Multi-Year Permits120 1. Issued121 V. Investigations122 A. Human Effects - Agricultural123 a. Total Investigations124 b. Priorities125 B. Human Effects - Antimicrobial126 a. Total Investigations127 b. Priorities128 C. Human Effects - Structural129 a. Total Investigations130 b. Priorities131 D. Human Effects - Other132 a. Total Investigations133 b. Priorities134 E. Environmental Effects135 1. Total Investigations136 2. Priorities137 F. Property Loss Damage138 1. Total Investigations139 2. Priorities140 G. Other (Identify in "Remarks")141 1. Total Investigations142 2. Priorities143 Total:144 Investigations145 Priorities146 Licensed Work Hours147 VI. License/Certificate OP (I.D.) Nbr.148 A. Ag. Pest Control Business149 B. Ag. Pest Control Adviser150 C. Pest Control Aircraft Pilot151 D. Farm Labor Contractor152 E. Operator Identification (I.D.) Numbers153 F. Structural Operator Notice154 SUBTOTAL (A-F):155 Total Numbers156 G. Private Applicators
Sutter Tehama Trinity Tulare Tuolumne Ventura Yolo Yuba Total
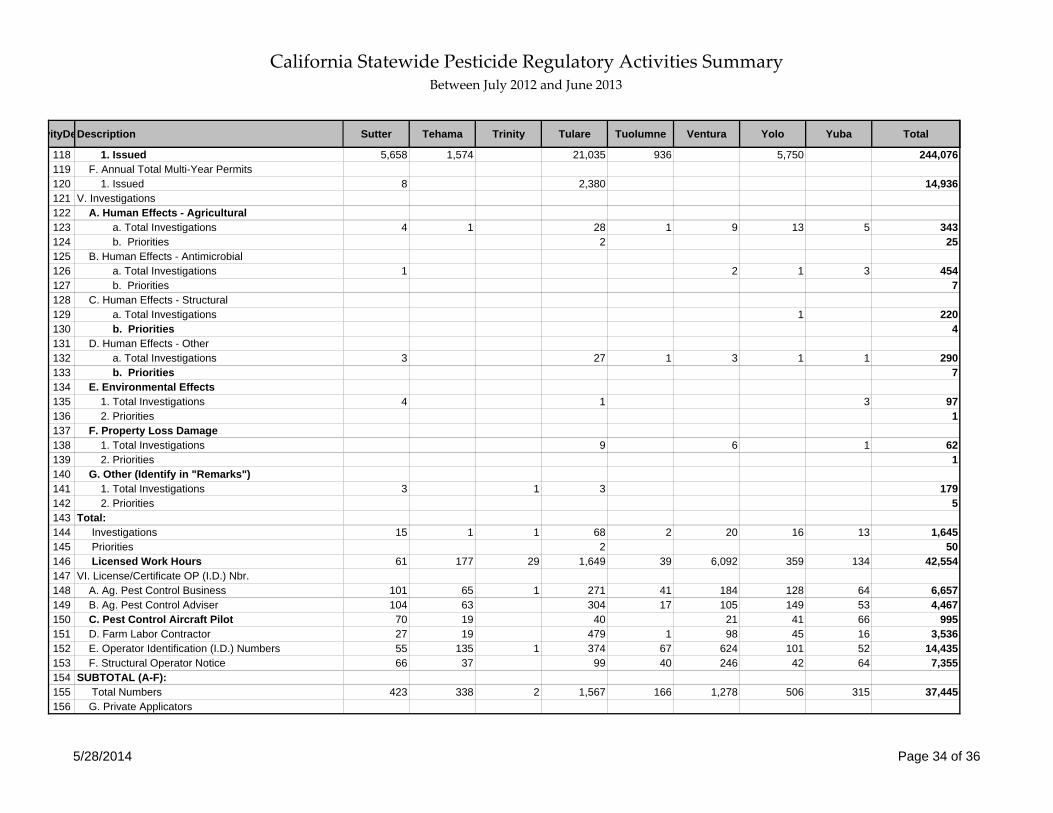
5,658 1,574 21,035 936 5,750 244,076
8 2,380 14,936
4 1 28 1 9 13 5 3432 25
1 2 1 3 4547
1 2204
3 27 1 3 1 1 2907
4 1 3 971
9 6 1 621
3 1 3 1795
15 1 1 68 2 20 16 13 1,6452 50
61 177 29 1,649 39 6,092 359 134 42,554
101 65 1 271 41 184 128 64 6,657104 63 304 17 105 149 53 4,46770 19 40 21 41 66 99527 19 479 1 98 45 16 3,53655 135 1 374 67 624 101 52 14,43566 37 99 40 246 42 64 7,355
423 338 2 1,567 166 1,278 506 315 37,445
5/28/2014 Page 34 of 36
California Statewide Pesticide Regulatory Activities Summary Between July 2012 and June 2013
vityDeDescription
157 1. Private Applicators-Re-Certified (CE Hrs)
158 a. # Certified159 2. Private Applicators-Re-Certified (Exam)160 a. # Certified161 b. # Exams162 3. Private Applicators - Certified - New163 a. # Certified164 b. # Exams165 4. Private Applicators - Failed Exam166 b. # Exams167 SUBTOAL (G 1-4)168 # Certified169 # Exams170 Total:171 Licensed/Certified/Op. ID #172 Licensed Work Hours173 VII. Training and Outreach174 A. Licensees175 a. Total Sessions176 b. Total Persons Attending177 B. Growers/Operators178 a. Total Sessions179 b. Total Persons Attending180 C. Public Education181 a. Total Sessions182 b. Total Persons Attending183 D. Other (Identify in "Remarks")184 a. Total Sessions185 b. Total Persons Attending186 Total:187 Training Sessions188 Persons Attending189 Licensed Work Hours190 VIII. Compliance Actions191 A. Warning Letters / Violation Notices192 B. Cease and Desist Orders193 C. Documented Compliance Interviews194 Total:
Sutter Tehama Trinity Tulare Tuolumne Ventura Yolo Yuba Total
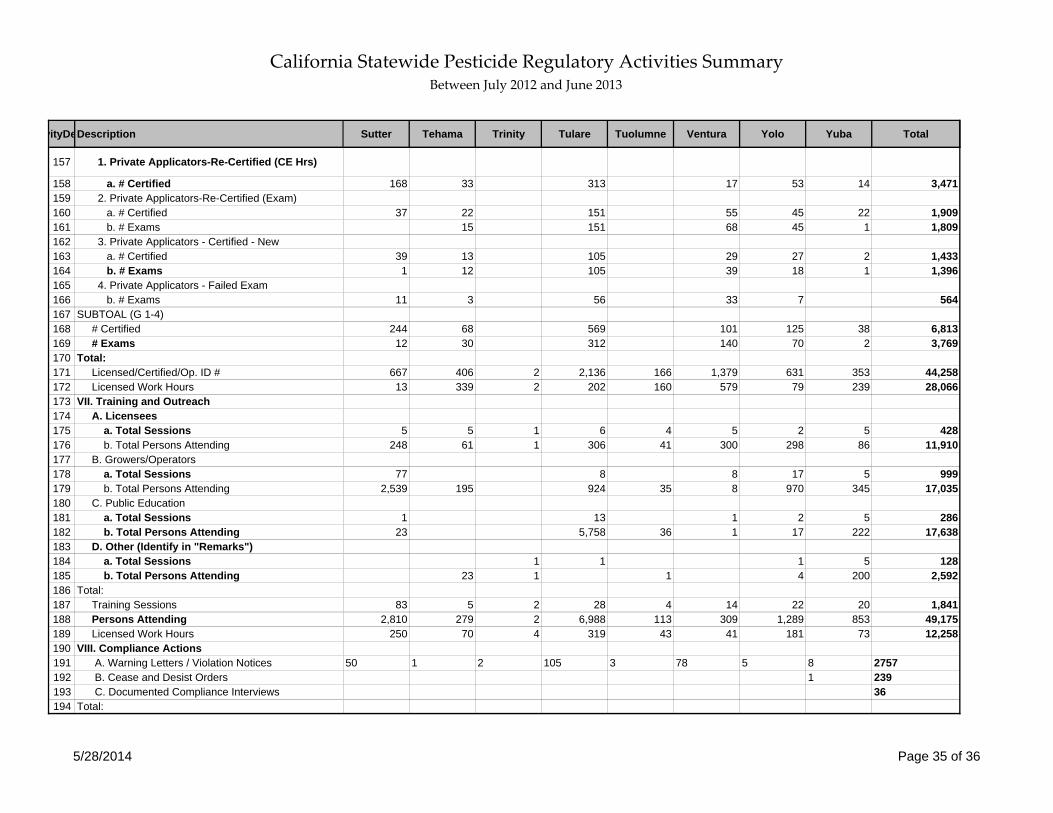
168 33 313 17 53 14 3,471
37 22 151 55 45 22 1,90915 151 68 45 1 1,809
39 13 105 29 27 2 1,4331 12 105 39 18 1 1,396
11 3 56 33 7 564
244 68 569 101 125 38 6,81312 30 312 140 70 2 3,769
667 406 2 2,136 166 1,379 631 353 44,25813 339 2 202 160 579 79 239 28,066
5 5 1 6 4 5 2 5 428248 61 1 306 41 300 298 86 11,910
77 8 8 17 5 9992,539 195 924 35 8 970 345 17,035
1 13 1 2 5 28623 5,758 36 1 17 222 17,638
1 1 1 5 12823 1 1 4 200 2,592
83 5 2 28 4 14 22 20 1,8412,810 279 2 6,988 113 309 1,289 853 49,175
250 70 4 319 43 41 181 73 12,258
50 1 2 105 3 78 5 8 27571 239
36
5/28/2014 Page 35 of 36
California Statewide Pesticide Regulatory Activities Summary Between July 2012 and June 2013
vityDeDescription
195 Compliance Actions196 Licensed Work Hours197 IX. Enforcement Actions198 A. Administrative Action: (1-5)199 1. Restricted Materials Permit200 2. Private Applicator Certifications201 3. County Registrations202 4. Structural Civil Penalties203 5. Agricultural Civil Penalties204 B. Judicial Actions: (1-4)205 1. Notice to Appear (Citations)206 2. Cases Submitted to DA207 3. Civil Complaints Filed208 4. Criminal Complaints Filed209 C. Referrals to DPR210 Total:211 Enforcement Actions212 Licensed Work Hours213 X. Focused Activity214 A. Licensed Hours215 1. Completed Projects216 2. Hours217 B. Non-Licensed Hours218 1. Completed Projects219 2. Hours220 Total:221 Completed Projects222 Hours223 XI. Surveillance Hours224 XII. Pesticide/Hazardous Mat'l Spill Hrs225 XIII. Use Report Review and Follow-Up Hrs226 XIV. Total Pesticide Activity Hours227 A. Lic. Hours Expended for I - XIII228 B. Other Lic. Enforcement Hours229 Lic. Hours Subtotal (A+B)230 C. Support Hours231 Total Hours
Sutter Tehama Trinity Tulare Tuolumne Ventura Yolo Yuba Total
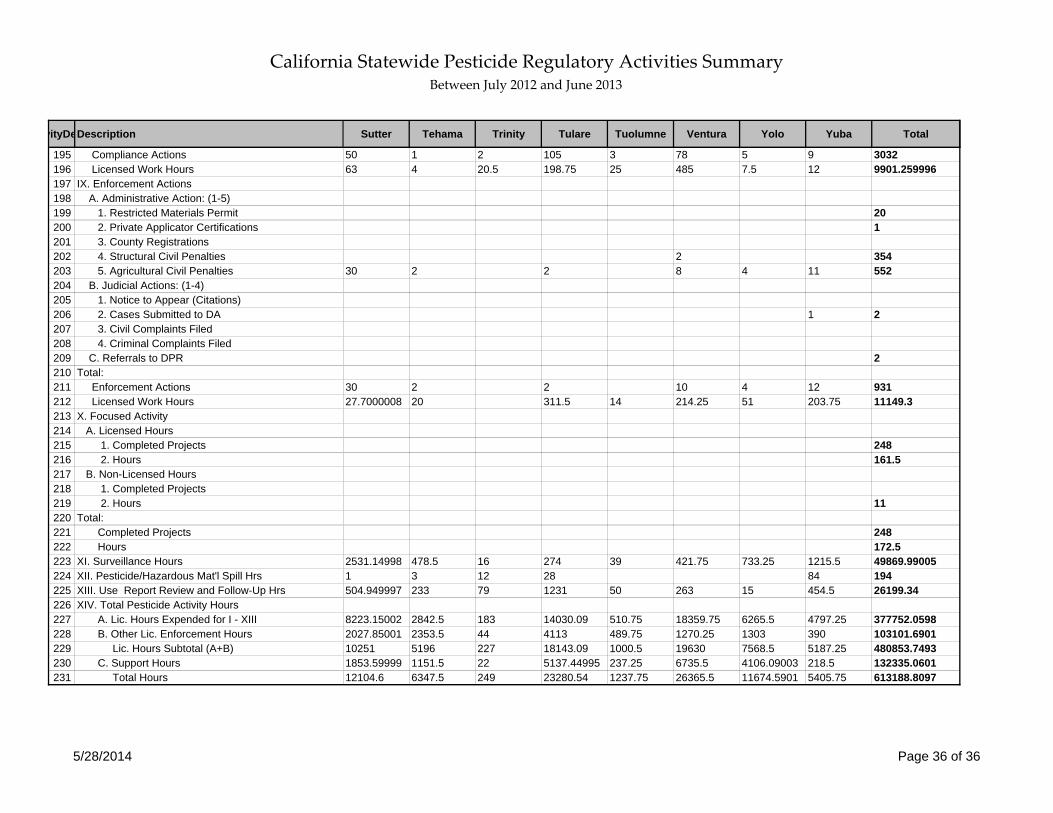
50 1 2 105 3 78 5 9 303263 4 20.5 198.75 25 485 7.5 12 9901.259996
201
2 35430 2 2 8 4 11 552
1 2
2
30 2 2 10 4 12 93127.7000008 20 311.5 14 214.25 51 203.75 11149.3
248161.5
11
248172.5
2531.14998 478.5 16 274 39 421.75 733.25 1215.5 49869.990051 3 12 28 84 194504.949997 233 79 1231 50 263 15 454.5 26199.34
8223.15002 2842.5 183 14030.09 510.75 18359.75 6265.5 4797.25 377752.05982027.85001 2353.5 44 4113 489.75 1270.25 1303 390 103101.690110251 5196 227 18143.09 1000.5 19630 7568.5 5187.25 480853.74931853.59999 1151.5 22 5137.44995 237.25 6735.5 4106.09003 218.5 132335.060112104.6 6347.5 249 23280.54 1237.75 26365.5 11674.5901 5405.75 613188.8097
5/28/2014 Page 36 of 36