Embed Size (px)
Citation preview
California ZEV Investment Plan: Cycle 3 Public Version
May 2021
2 California ZEV Investment Plan: Cycle 3
Table of Contents List of Acronyms ...................................................................................................................................... 3
Executive Summary ................................................................................................................................. 4
1. Introduction ........................................................................................................................................ 9
2. Corporate Social Responsibility .......................................................................................................... 13
3. National Outreach Efforts .................................................................................................................. 18
4. Infrastructure Investments ($127M) .................................................................................................. 22
5. Public Education, Awareness, Access, and Marketing Activities (~28M) ............................................. 51
6. Green Cities 2 ($25M) ........................................................................................................................ 65
7. Closing ............................................................................................................................................... 72
Sources Cited ........................................................................................................................................ 73
Appendix ............................................................................................................................................... 78
I. ZEV Glossary ................................................................................................................................... 78
3 California ZEV Investment Plan: Cycle 3
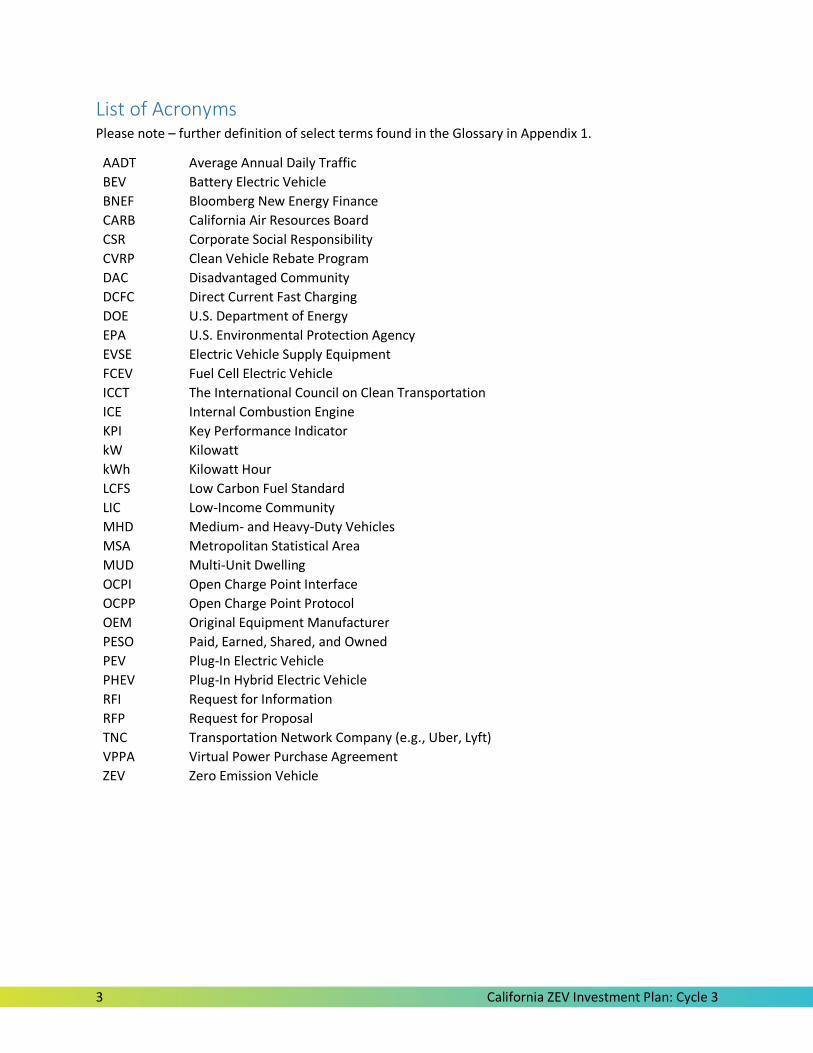
List of Acronyms Please note – further definition of select terms found in the Glossary in Appendix 1.
AADT Average Annual Daily Traffic
BEV Battery Electric Vehicle
BNEF Bloomberg New Energy Finance
CARB California Air Resources Board
CSR Corporate Social Responsibility
CVRP Clean Vehicle Rebate Program
DAC Disadvantaged Community
DCFC Direct Current Fast Charging
DOE U.S. Department of Energy
EPA U.S. Environmental Protection Agency
EVSE Electric Vehicle Supply Equipment
FCEV Fuel Cell Electric Vehicle
ICCT The International Council on Clean Transportation
ICE Internal Combustion Engine
KPI Key Performance Indicator
kW Kilowatt
kWh Kilowatt Hour
LCFS Low Carbon Fuel Standard
LIC Low-Income Community
MHD Medium- and Heavy-Duty Vehicles
MSA Metropolitan Statistical Area
MUD Multi-Unit Dwelling
OCPI Open Charge Point Interface
OCPP Open Charge Point Protocol
OEM Original Equipment Manufacturer
PESO Paid, Earned, Shared, and Owned
PEV Plug-In Electric Vehicle
PHEV Plug-In Hybrid Electric Vehicle
RFI Request for Information
RFP Request for Proposal
TNC Transportation Network Company (e.g., Uber, Lyft)
VPPA Virtual Power Purchase Agreement
ZEV Zero Emission Vehicle
4 California ZEV Investment Plan: Cycle 3
Executive Summary Electrify America is pleased to present this California Zero Emission Vehicle (ZEV) Investment Plan for its
third cycle of ZEV infrastructure, education and awareness, and access investments in the State of
California. As required by Appendix C to the 2.0-Liter Partial Consent Decree entered by the U.S. District
Court for the Northern District of California on October 25, 2016, Volkswagen Group of America is
investing $800 million over 10 years to support the increased adoption of ZEV technology in California.
This investment represents the largest commitment of its kind to date. This plan is the culmination of
nearly a year of collaboration with the California Air Resources Board (CARB), and defines the
investments to be made or targeted in Cycle 3, from January 2022 through June 2024.
After nearly five years investing in driving ZEV adoption, Electrify America has opened more than 600
ultra-fast charging stations, deployed over 2700 Level 2 workplace and multi-unit dwelling (MUD)
charging outlets, and run multiple marketing campaigns collectively garnering over one billion
impressions across the U.S. We have made these investments with the primary goal of accelerating
electric vehicle (EV) adoption, and we believe the EV industry is at a critical juncture. Automotive
manufacturers across the globe are committing to electrification, and bringing vehicles to market with
new body styles, longer ranges, and higher charging speeds. In parallel, through Executive Order N-79-
20 the State of California has committed to a target that 100% of new passenger vehicles will be zero
emission by 2035.
With this backdrop, Electrify America has undergone a multi-faceted planning effort to develop this
Cycle 3 plan. Electrify America applied its corporate social responsibility framework of enabling electric
transportation, committing to environmental sustainability, creating a positive community impact, and
ensuring equality and diversity to ensure our investments are leading toward a cleaner, more equitable,
and just world. As a company we have taken lessons from our experience to date. These lessons were
combined with insights and perspectives from a broad outreach effort that included reviews of
academic literature, dozens of phone calls with state and local government officials, and engagement
with hundreds of stakeholders across the state. Each touchpoint yielded new ideas and
recommendations for investment, many of which complemented our own internal thinking, and we are
deeply grateful for all those who took part in this effort.
Making smart, data-driven investments that will stand the test of time remains core to our approach,
and this is critical in order to overcome the barriers to EV adoption that remain. For example, consumer
awareness and education of ZEVs continues to lag. According to a 2019 UC Davis study of consumers in
Sacramento, the public remains unaware of state efforts to increase ZEV adoption (Hardman et. al,
2019). DC fast charging stations are more than 30 percent more expensive to construct in California than
other states, and Rocky Mountain Institute’s groundbreaking study recently identified soft costs, such as
regulations and permitting, as a major cause of this (Nelder et al., 2019). Utility interconnection costs
and demand-based rates and fees also pose a serious challenge to the long term economic viability of
DC fast charging stations, while real estate acquisition continues to be a significant barrier to rapid
deployment of EV charging, and in turn, more widespread ZEV adoption. Finally, driver and rider
behaviors have shifted as a result of the COVID-19 pandemic, and future travel patterns, vehicle
purchasing, and fueling needs are far less certain than before. Electrify America approaches each of
these barriers with eyes wide open, and our planning efforts have focused on turning each challenge
into an opportunity.
5 California ZEV Investment Plan: Cycle 3
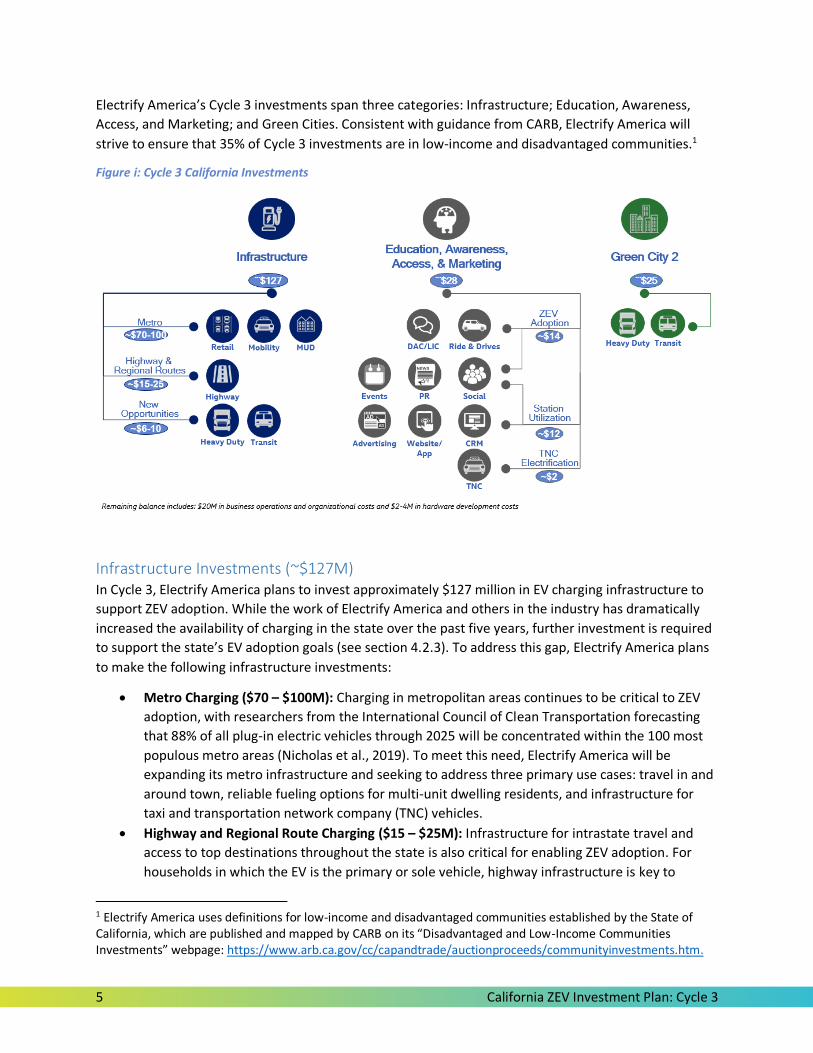
Electrify America’s Cycle 3 investments span three categories: Infrastructure; Education, Awareness,
Access, and Marketing; and Green Cities. Consistent with guidance from CARB, Electrify America will
strive to ensure that 35% of Cycle 3 investments are in low-income and disadvantaged communities.1
Figure i: Cycle 3 California Investments
Infrastructure Investments (~$127M) In Cycle 3, Electrify America plans to invest approximately $127 million in EV charging infrastructure to
support ZEV adoption. While the work of Electrify America and others in the industry has dramatically
increased the availability of charging in the state over the past five years, further investment is required
to support the state’s EV adoption goals (see section 4.2.3). To address this gap, Electrify America plans
to make the following infrastructure investments:
Metro Charging ($70 – $100M): Charging in metropolitan areas continues to be critical to ZEV
adoption, with researchers from the International Council of Clean Transportation forecasting
that 88% of all plug-in electric vehicles through 2025 will be concentrated within the 100 most
populous metro areas (Nicholas et al., 2019). To meet this need, Electrify America will be
expanding its metro infrastructure and seeking to address three primary use cases: travel in and
around town, reliable fueling options for multi-unit dwelling residents, and infrastructure for
taxi and transportation network company (TNC) vehicles.
Highway and Regional Route Charging ($15 – $25M): Infrastructure for intrastate travel and
access to top destinations throughout the state is also critical for enabling ZEV adoption. For
households in which the EV is the primary or sole vehicle, highway infrastructure is key to
1 Electrify America uses definitions for low-income and disadvantaged communities established by the State of California, which are published and mapped by CARB on its “Disadvantaged and Low-Income Communities Investments” webpage: https://www.arb.ca.gov/cc/capandtrade/auctionproceeds/communityinvestments.htm.
6 California ZEV Investment Plan: Cycle 3
unlocking long distance travel. Cycle 3 investments will expand the highway network built
through Cycles 1 and 2, adding density along major routes and unlocking new destinations
including Joshua Tree National Park.
Transit and Medium-Duty/Heavy-Duty Fleet Charging ($6 - $10M): Both the transit and
medium/heavy duty sectors are poised for significant growth over the coming decade, as
battery densities rise and vehicle costs fall. However, many fleet owners and operators lack the
expertise, funding, or desire to develop and operate charging infrastructure for these new
fleets. To fill this gap, Electrify America is committing $6-10M in infrastructure to support these
emerging, but transformational, technologies.
Hardware Development and Capacity Building ($2 - $4M): Through our National Outreach
Process, Electrify America identified two key areas for continuous improvement, both in the
industry as a whole and in our own business: customer experience and station economics. To
address these areas, Electrify America plans to invest in new tools and techniques, such as site-
level energy management and energy modeling, to drive down both capital and operating costs,
and to ensure a fast, reliable, and customer-centric experience at all of our stations.
Public Education, Awareness, Access, and Marketing ($28M) Over the next few years, new vehicle launches will provide consumers more options than ever, and
strong policy support at the local, state, and Federal level will help make EVs even more affordable.
However, to actually drive adoption, public education and marketing will be critical to informing
consumers of this new era. According to 2020 research by Mark Singer of NREL, a mere 34% of
consumers are familiar with existing EV tax incentives, indicating a strong need for effective
communication to drive change. To address this gap, Electrify America has planned both brand neutral
education, awareness, and access initiatives, as well as a branded marketing campaign to drive station
utilization:
Brand Neutral Campaign: Boosting ZEV Adoption through Education and Awareness ($14M):
Similar to Electrify America’s Cycle 2 investments, in Cycle 3 Electrify America plans to drive
increased education and awareness through educational marketing, ride and drives, and other
experiential marketing. The core pillars of our messaging include ZEV performance, charging
availability, affordability, models, and environmental impact. Whereas in Cycle 2 we built
NormalNow.com to showcase these messages, in Cycle 3 we intend to bring the messaging
directly to consumers through social media and other marketing channels. By reducing the
number of clicks required before learning key facts, Electrify America can ultimately have a more
immediate impact on the target audience.
Access: Driving Education and Awareness through TNC Electrification ($2M): Electrification of
TNCs and taxis has potential to dramatically reduce greenhouse gas emissions, provide ZEV
education to millions of passengers that otherwise might not have had an opportunity to
experience a ZEV, and offer economic opportunity for many low-income and disadvantaged
drivers. However, the upfront cost of a ZEV can often be a barrier to adoption by TNC and taxi
drivers. To address this need, Electrify America will invest $2 million in incentives to help drivers
obtain electric taxis and TNC vehicles, resulting in an influx of 500 – 1,000 vehicles into California
markets.
Branded Campaign: Boosting Station Utilization through Branded Marketing ($12M): Electrify
America will also invest in driving utilization of its charging network through branded events,
7 California ZEV Investment Plan: Cycle 3
promotions, and marketing. As outlined in Appendix C of the Partial Consent Decree, Electrify
America must target utilization to demonstrate its investments are “addressing an existing need
or supporting a reasonably anticipated need.” According to focus groups conducted by Electrify
America, consumers (including ZEV owners and considers) have significant knowledge gaps
around charging. Many drivers are unaware of charging options around them, and are
unfamiliar with terminology related to the charging experience. To address this need, Electrify
America will conduct a branded marketing campaign to educate consumers and drive station
utilization based on four pillars: charging speed, locations/accessibility, quality customer
experience, and corporate social responsibility.
Green Cities 2 ($25M) Pending CARB approval of this Cycle 3 ZEV Investment Plan, Electrify America is thrilled to announce our
second Green City: Long Beach / Wilmington. Over the past year, Electrify America has engaged in a
thorough review of investment opportunities and geographic locations throughout the state. This effort
culminated in a request for proposals to finalist communities soliciting specific projects for investment.
Long Beach / Wilmington put forward over a dozen potential projects, and we are excited to work hand-
in-hand with local leaders to implement as many projects as possible in this initiative.
The Green City investments will focus on ZEV technologies for transit and heavy duty operations in and
serving the Long Beach / Wilmington area. Electrify America’s detailed, quantitative evaluation to
determine where to focus Green City investments that would meet the greatest needs and most
positively impact the host community, revealed that CARB’s zero emission truck mandate approved in
June 2020 (CARB, 2020) and CARB’s Innovative Clean Transit Regulation adopted in 2018 (CARB, 2018)
have spurred a significant, and serious new effort by fleet operators to electrify fleets, and charging
solutions are needed in the Cycle 3 investment period. Project details for each specific investment are
still being worked out with fleet partners, site hosts, transit agencies, city officials, and others, but we
plan to showcase ultra-fast charging technology, storage, and energy management for these two
emerging use cases.
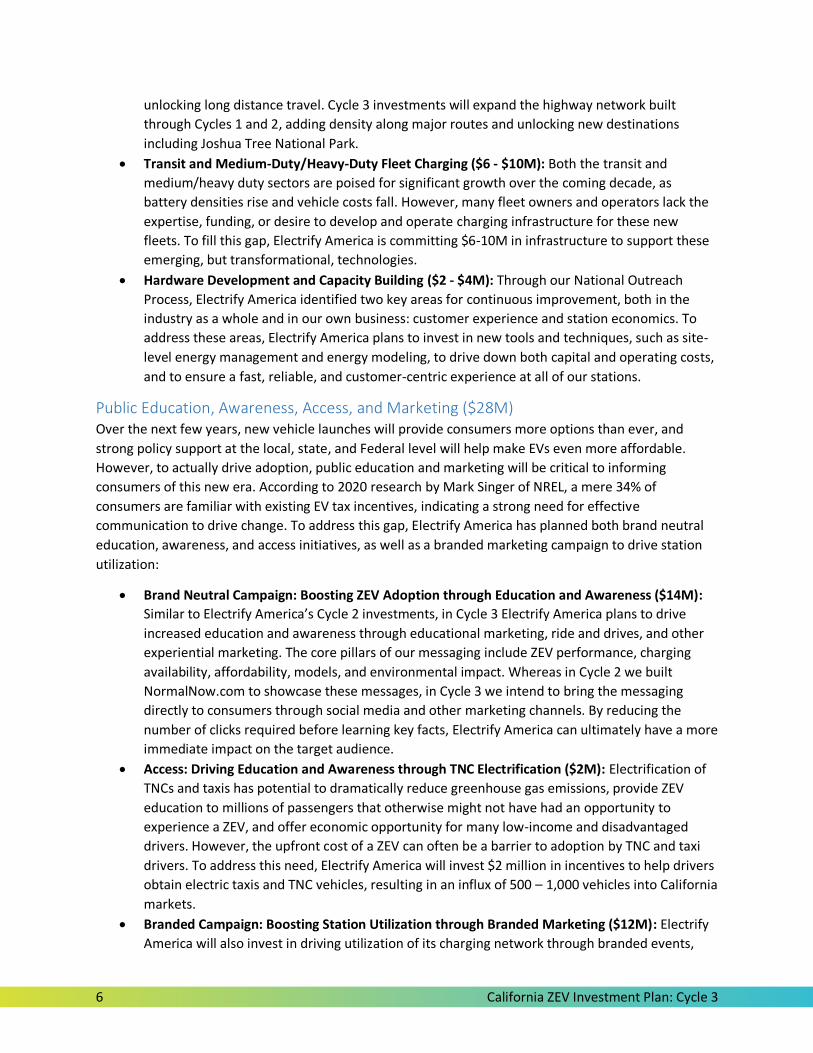
Conclusion Electrify America’s investments are summarized in Table i below. Cycle 3 builds off of the
unprecedented successes achieved through Cycles 1 and 2 – building the largest open ultra-fast network
in the U.S., featuring state of the art speed, customer-centric sites, industry-leading quality, and
executing at a construction pace unmatched in the industry – while also unlocking emerging areas for
ZEV adoption including TNC/taxi, transit, and heavy duty. The marketing investments continue to bring
awareness and consideration, and bring critical education to owners, considerers, and the mass market
alike.
8 California ZEV Investment Plan: Cycle 3
Table i: Cycle 3 California Budget
Category Estimated Budget ($M)1
Infrastructure & Station Operating Costs ~$127
Metro Charging $70 - $100
Highway and Regional Route Charging $15 - $25
Transit and Medium-Duty/Heavy-Duty Fleet Charging $6 - $10
Hardware Development and Capacity Building $2 - 4
Brand Neutral Campaign: Boosting ZEV Adoption through Education and Awareness
~$14
Access: Driving Education and Awareness through TNC Electrification
~$2
Branded Campaign: Boosting Station Utilization through Branded Marketing
~$12
Green City 2 ~$25
Electrify America Business Operation & Organization2 $20
TOTAL $200 1 Costs include creditable operating expenses and on site storage where appropriate. 2 According section 5.1 of Appendix C-1 of the Partial Consent Decree, Electrify America is permitted to spend 10% of the total budget on these costs.
Cycle 3 offers a critical turning point, both for Electrify America’s investments and for ZEV adoption
more broadly. We are excited to help lead the way, and we look forward to collaborating with the many
stakeholders across the state working to implement Governor Newsom’s extraordinarily ambitious
mandate that all new passenger cars and trucks be zero emission by 2035.
9 California ZEV Investment Plan: Cycle 3
1. Introduction
1.1 Background on EA and Investment Cycles As agreed to in Appendix C to the 2.0-Liter Partial Consent Decree entered by the U.S. District Court for
the Northern District of California on October 25, 2016, Volkswagen Group of America is investing $2
billion over 10 years in zero emission vehicle (ZEV) infrastructure, education and awareness, and access
efforts to support the increased adoption of zero emission vehicle technology in the United States.
Volkswagen Group of America created Electrify America LLC, a wholly-owned subsidiary headquartered
in Reston, Virginia, to fulfill the ZEV Investment Commitment in Appendix C. The company has grown to
more than 81 full-time employees with a diversity of backgrounds in automotive, utilities, electric
vehicle (EV) infrastructure, technology, construction, and state and federal government, split across the
Reston office, a second office in California, and on assignment across the country. All employees share a
passion for helping transform and electrify the transportation sector through investments to grow the
market for all zero emission drivers and stakeholders.
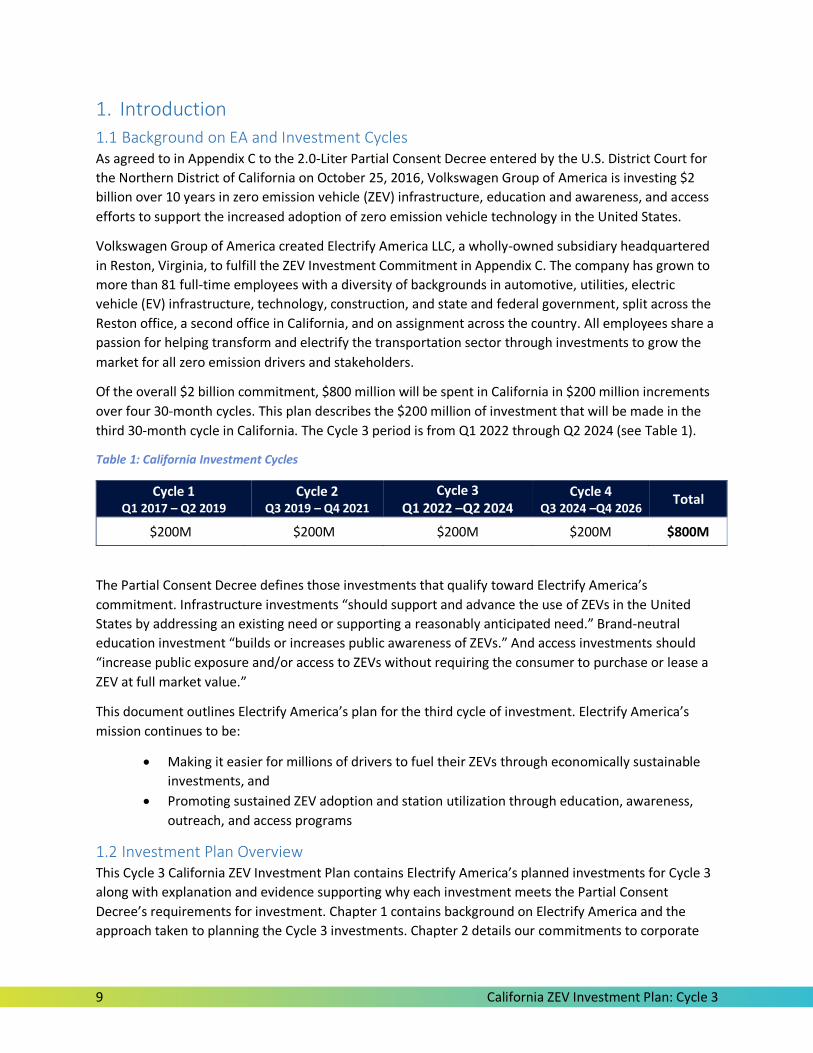
Of the overall $2 billion commitment, $800 million will be spent in California in $200 million increments
over four 30-month cycles. This plan describes the $200 million of investment that will be made in the
third 30-month cycle in California. The Cycle 3 period is from Q1 2022 through Q2 2024 (see Table 1).
Table 1: California Investment Cycles
Cycle 1 Q1 2017 – Q2 2019
Cycle 2 Q3 2019 – Q4 2021
Cycle 3 Q1 2022 –Q2 2024
Cycle 4 Q3 2024 –Q4 2026
Total
$200M $200M $200M $200M $800M
The Partial Consent Decree defines those investments that qualify toward Electrify America’s
commitment. Infrastructure investments “should support and advance the use of ZEVs in the United
States by addressing an existing need or supporting a reasonably anticipated need.” Brand-neutral
education investment “builds or increases public awareness of ZEVs.” And access investments should
“increase public exposure and/or access to ZEVs without requiring the consumer to purchase or lease a
ZEV at full market value.”
This document outlines Electrify America’s plan for the third cycle of investment. Electrify America’s
mission continues to be:
Making it easier for millions of drivers to fuel their ZEVs through economically sustainable
investments, and
Promoting sustained ZEV adoption and station utilization through education, awareness,
outreach, and access programs
1.2 Investment Plan Overview This Cycle 3 California ZEV Investment Plan contains Electrify America’s planned investments for Cycle 3
along with explanation and evidence supporting why each investment meets the Partial Consent
Decree’s requirements for investment. Chapter 1 contains background on Electrify America and the
approach taken to planning the Cycle 3 investments. Chapter 2 details our commitments to corporate
10 California ZEV Investment Plan: Cycle 3
social responsibility, including efforts underway and anticipated for Cycle 3. Chapter 3 describes Electrify
America’s National Outreach effort, including results from our submissions web portal and insights from
stakeholder conversations. Chapter 4 captures planned investments in ZEV infrastructure, as well as all
outreach insights leading to the selection of these investments. Chapter 5 details investment plans for
brand neutral education and access programs to support ZEV adoption, as well as investments to
support Electrify America station utilization. Finally, Chapter 6 describes our Green City initiative,
including both the approach used to select the community and identify opportunities, as well as details
on the intended investments.
The investments outlined in this Cycle 3 California ZEV Investment Plan will build on our experience and
impacts in Cycles 1 and 2, and continue to unlock ZEV adoption across the state of California.
Thank you to the hundreds of stakeholders who provided input to these plans, and we look forward to
implementing them together.
1.3 Cycle 3 Approach
1.3.1 Background Each investment cycle offers Electrify America the opportunity to evaluate new information, revisit past
assumptions, and consider new ideas and feedback in the planning process. In addition, Cycle 3 provides
Electrify America the opportunity to learn from and build upon the investments made in Cycles 1 and 2.
In this context, it is worth highlighting a few of Electrify America’s largest accomplishments to date.
Through our Cycle 1 and 2 investments, the Electrify America network has become the nation’s largest
open direct current fast charger (DCFC) network in the U.S. By the end of Cycle 2, in December 2021, we
expect to have more than 800 DCFC stations open or under development nationwide. In California
alone, Electrify America will have at least 230 DCFC stations open or under development and over 900
ultra-fast chargers, providing coverage in nearly all parts of the state. Electrify America also has over 450
Level 2 workplace and multi-unit dwelling (MUD) stations, including 241 station sites and over 1,500
chargers installed in California.
Our marketing and education campaigns have also made a major impact on ZEV awareness and
consideration. Our Cycle 1 mass media campaign called “The Jetstones” generated 1.1 billion
impressions from viewers around the country. We followed this with a Cycle 2 campaign called “Normal
Now” which has generated over 330 million impressions through the end of 2020. We also partnered
with Veloz, funding half of its “Kicking Gas” video shorts that feature Arnold Schwarzenegger
highlighting the benefits of ZEVs. And to help more consumers experience the benefits of driving a ZEV
first hand, we have provided support for National Drive Electric Week in both 2019 and 2020.
We found that for some target populations, the best way to drive ZEV adoption is to leverage the
existing programs, networks, and organizations already doing great work in these communities. To this
end, we supported over 100 events in low-income and disadvantaged communities (LIC/DAC) in
California supporting ZEV adoption, including 22 ride and drives. These events alone have led to the
purchase of over 1,800 ZEVs. In addition to providing general ZEV education and awareness at events,
Electrify America is funding over $1.6 million to support science, technology, engineering, and math
(STEM) and workforce development programs that educate students and train workers through new
ZEV-focused curriculums, as well as on-the-job vocational training. This investment is critical to develop
a workforce of future engineers, software developers, battery technicians, energy management
11 California ZEV Investment Plan: Cycle 3
specialists, construction managers, and a wide variety of additional jobs that the industry need for as it
continues to grow.
Finally, we are very actively engaged with consumers on social media channels. The team regularly
engages with thousands of followers across Facebook, Twitter, LinkedIn, and other platforms to share
information and stories about plug-in electric vehicles (PEVs), and ultimately to build charging
confidence among consumers.
1.3.2 Guiding Principles Recognizing the contributions and lessons learned from our Cycle 1 and 2 investments, we have
developed six guiding principles for our Cycle 3 investments:
Build on Successes to Date: Electrify America’s Cycle 1 and 2 investments have made
significant impact on ZEV awareness, adoption, and usage. Nonetheless, there is plenty
more to do to reach our mission. In Cycle 3, we will seek to extend the gains through
continued investment in similar areas from previous cycles, and exploring new adjacent
opportunities.
Corporate Social Responsibility (CSR): At Electrify America, social responsibility is at the
core of our mission to drive ZEV adoption. But it doesn’t stop there - we are committed
to enabling electric transportation, driving environmental sustainability, fostering
positive community impact, and incorporating equity and diversity in everything we do.
Drive Customer Experience: Through our Cycle 3 investments, we will continue to focus
on providing simple, reliable, and customer-centric experiences at our stations, on our
app and website, and in every touchpoint with our consumers.
Boost Utilization: Electrify America will continue to focus on serving high utilization
locations and high usage customers. These areas offer the highest possible impact on
greenhouse gas reduction, and ultimately on PEV adoption.
Unlock Cost Efficiency: Electrify America is committed to building a charging network
that is self-sustaining far beyond Cycle 4. In Cycle 3, we will continue to focus on driving
down capital, operating, and energy costs in the name of achieving sustainable
economics and securing long-term growth potential.
Pursue Transformational Change: Seek investments supporting emerging use cases
including ZEV ridehail, buses, and trucks that will unlock new growth areas for the
industry and drive meaningful reductions in greenhouse gas emissions.
Improve Perceptions of ZEVs: Electrify America’s brand neutral education and
awareness efforts will continue to focus on moving customers through the purchase
funnel from awareness through consideration and, ultimately, through vehicle purchase.
1.3.3 Good Faith Estimate Electrify America notes that the estimated budgets represent a good faith estimate of Cycle 3 costs.
Given uncertainties regarding both capital and operating costs, it is possible that total costs may exceed
or fall below targeted levels. In the event that costs fall below targets, Electrify America will deploy
additional investments in approved use cases, including Green Cities, to meet the Appendix C ZEV
Investment commitment. If costs exceed budget forecasts, the number of investments will be reduced
by a commensurate amount. In addition, given the early stage of partner discussions, availability of site
locations, and/or the technology itself (e.g. heavy-duty), each new use case involves a level of

12 California ZEV Investment Plan: Cycle 3
uncertainty in both cost and operational feasibility. Should investment targets in any new use case,
including Green Cities, be unachievable due to practical considerations, the allocated funds will be
redeployed into one or more of the other approved use cases to ensure the total investment fulfills
Appendix C requirements.
13 California ZEV Investment Plan: Cycle 3
2. Corporate Social Responsibility CSR is at the heart of everything Electrify America does. Our company’s mission is to enable electric
transportation, and that goal frames all of our investments. From ZEV infrastructure, to education,
awareness, and access campaigns, to our Green City initiatives, each project and commitment we
undertake helps lead the way toward a more electrified, more sustainable future.
In addition to our focus on enabling electric transportation, we have three additional pillars that round
out our CSR efforts: environmental sustainability, community impact, and equality and diversity. The
activities and goals detailed below offer examples of our commitment to customers and to the larger
public under each pillar. We also recognize that CSR is a journey, and that Electrify America’s approach
to CSR will evolve as we learn about new initiatives and seek out innovative ways to be corporate
stewards.
Enabling Electric Transportation
When Electrify America began in 2016, 50 kilowatt (kW) charging was state-of-the-art technology,
charging stations were limited to a few major metro areas and a handful of corridors, and Tesla was the
only automotive manufacturer (OEM) selling vehicles with charging faster than 100kW. Today, in part
due to Electrify America’s ultra-fast 150kW and 350kW charging stations, nearly every OEM, from Ford
to Hyundai to Lucid, is deploying, or has announced plans to deploy, high-powered vehicles.
Example activities for Enabling Electric Transportation include:
Ultra-Fast Charging: Electrify America’s network offers industry-leading 150kW and
350kW chargers2 to reduce the time customers spend charging. This investment has led
OEMs to develop higher powered, and faster charging vehicles. Nearly all battery
electric vehicles (BEVs) coming to market in 2021 and beyond will have charging speeds
of at least 100kW. Moreover, the availability of a 350kW charging network has inspired
several OEMs to develop 800 volt (V) vehicle platforms that enable vehicles to charge up
to 20 miles per minute.
Plug & Charge: Electrify America’s network features Plug & Charge capabilities at all of
our DCFC stations, offering drivers with capable cars the ability to drive up, plug in, and
charge. This service allows for a much faster and better customer experience, as the
vehicle and charger seamlessly handle all authorization, payment, and charging steps,
without additional driver interaction other than connecting and disconnecting the car
from the charger.
2 CHAdeMO charging at Electrify America stations is limited to 50kW, meeting the needs of the vast majority of CHAdeMO vehicles in operation today.
14 California ZEV Investment Plan: Cycle 3
Customer Experience: Electrify
America has achieved industry-
leading quality – in December
2020 Electrify America received
CHARGED EV’s Charging
Infrastructure Best-in-Test award.
In addition, our scores on
PlugShare, a social application that
allows users to find and rate
charging stations, exceed those of
all other large open DCFC
networks.
Education & Awareness: Electrify
America’s marketing efforts have garnered more than one billion impressions, driving
awareness of ZEVs and charging options through traditional, digital, and social
engagement. Recent research we have done in collaboration with Comscore showed
that the Normal Now campaign has significantly decreased concerns about affordability,
range anxiety, and accessibility of electric vehicles.
Speaking Engagements: Electrify America executives and staff are frequently asked to
speak at meetings, conferences, and other nationwide events regarding ZEVs, charging
technology, and e-mobility. Electrify America cannot accept all invitations received, as
we must focus our resources on ZEV infrastructure and investment executions.
However, Electrify America participates selectively in events specifically focused on ZEV
technology that are likely to grow ZEV awareness and that are consistent with Electrify
America’s obligations and the spirit of the National Outreach process.
As a company we are focused on helping spur the e-mobility revolution through our investments in
nationwide charging infrastructure, public education, awareness, access, and marketing activities. The
above advancements and activities have allowed Electrify America to increase general awareness of ZEV
technology, to decrease perceived barriers to ZEV ownership, to introduce audiences to our ZEV
Investment Plans, and to collaborate with an ever-growing industry focused on increased ZEV adoption.
Environmental Sustainability
Electrify America is committed to being carbon-neutral, powering our stations with renewable energy
where feasible, and building infrastructure sustainably.
Example Environmental Sustainability activities include:
Charging Powered by Renewable Energy: All energy delivered to customers at Electrify
America’s California stations is already powered by renewable energy, through the purchase of
renewable energy credits (RECs) from California producers. This effort ensures that our stations’
renewable energy is additional to the renewable energy generation required under California’s
Renewable Portfolio Standard and meets the California Air Resources Board’s rules for zero-
carbon electricity under the Low Carbon Fuels Standard. In parallel, we are exploring options for
renewable energy procurement for the remainder of our national network. Electrify America is
15 California ZEV Investment Plan: Cycle 3
also deploying solar canopies at some stations, and in 2020 Electrify America deployed 30 off-
grid, solar-powered Level 2 charging stations in rural California communities.
Building Grid Assets: We are also helping to decarbonize the grid by drawing power from
renewable energy for battery storage, along with solar charging solutions at Electrify America
stations. By the end of Cycle 2, Electrify America will have behind-the-meter energy storage at
more than 125 of our DCFC sites, and in Cycle 3, we intend to expand this investment. Batteries,
on-site solar photovoltaic (PV), and advanced technology are part of our investments to ensure
that our stations are grid-friendly.
Community Impact
We seek to unlock electrification for all, including investments and education in disadvantaged, low-
income and rural areas. Infrastructure and education investment in LIC/DAC areas foster widespread
adoption and can lead to improved air quality. To that end, our second Green City will focus on tackling
medium-duty/heavy-duty (MHD) emissions in a predominantly disadvantaged community. We will also
continue our investments in rural parts of the state, including the Central Valley.
The ZEV Investment Commitment is already having a big impact on California businesses. To date,
Electrify America has contracted by way of purchase order with 312 vendors, including 94 located in
California, for a total contract value of $712 million. As noted in Electrify America’s 2020 Annual Report
to CARB, Electrify America vendors reported that nearly 8,800 people (and more than 1,000
Californians) worked professionally on Electrify America’s investments in 2020, and more than 1,200
jobs were created or sustained due to Electrify America’s investment.
In addition, based on figures from the Council of Economic Advisors and U.S. Department of
Transportation related to highway and transit investments, the $200 million being invested in California
in Cycle 3 is estimated to support up to 780 jobs over the 2.5 years of the Cycle. In total, Electrify
America’s Cycle 3 investments in California are estimated to generate over 1.5 million staff-hours of new
work.3
Example activities for Community Impact include:
California Community-Based Organizations (CBOs): In 2020, Electrify America committed
over $3 million in investment in six California CBOs as part of its efforts to drive brand-
neutral ZEV awareness and education in low-income and disadvantaged communities.
The six recipients of the funding include: Breathe Southern California, Central California
Asthma Collaborative, Drive Clean Bay Area, Ecology Action, Liberty Hill Foundation, and
Valley Clean Air Now. This represents just one aspect of the company’s commitment to
equitably increasing awareness of the benefits of driving ZEVs and educating low-
income and disadvantaged communities on available ZEV related rebates and
incentives.
3 The Council of Economic Advisors estimates that every $1 billion in federal highway and transit investment would support 13,000 jobs. This total count includes direct, indirect, and induced jobs. The estimate here is for the number of jobs created by infrastructure investments, and it does not include jobs created through education, awareness, and outreach or Electrify America overhead. The estimate assumes that ZEV investments create a similar number of job-hours per dollar spent as highway and transit investments.
16 California ZEV Investment Plan: Cycle 3
EVNoire: Electrify America is collaborating with EVNoire, a California-based minority-
owned e-mobility group, by sponsoring a communications campaign “Drive the Future
California” to help normalize zero emission transportation for diverse and underserved
communities throughout California. The campaign is part of EVNoire’s larger effort to
increase awareness and access to educational resources on the benefits of e-mobility,
and highlight equitable opportunities and resources available to facilitate EV adoption
among diverse and underserved communities. Electrify America’s funding helps EVNoire
scale its existing work to reach even more of California’s diverse and underserved
communities. With the addition of this new collaboration, Electrify America will have
invested $6 million in California community-based ZEV education programs over the
past two years. Additionally, in November 2020, Electrify America presented at the
National E-Mobility Equity Virtual Conference hosted by EVNoire and Forth. The E-
Mobility Equity Conference facilitated conversations about strategies and best practices
for engaging diverse communities often hit worst and first by air pollution.
Clean Energy Access Working Group: Electrify America is a member of the Clean Energy
Access Working Group, launched by Southern California Edison and The Greenlining
Institute, to develop community-centric solutions for healthy air and environment, to
identify barriers to ZEV adoption in disadvantages and low-income communities, and to
explore viable solutions to these barriers.
Equality and Diversity
Electrify America’s diversity and inclusion efforts span both internal and external activities in order to
help effect a greater impact. We strive to achieve diversity and inclusion in our approach to hiring and
engaging suppliers. We have an emphasis on engaging in sponsorships that support education and
awareness activities focused on diverse audiences including minority groups and the LGBTQ+
community. Internally, we are strengthening corporate processes including recruiting and staffing,
supplier diversity, request for proposal (RFP) evaluations, review of sponsorships, and marketing.
Example Equality and Diversity activities include:
Recruiting: Electrify America believes diversity in backgrounds and experiences within
our team is an important part of our cultural fabric and a key to driving ZEV adoption. To
achieve this diversity, Electrify America and its parent company have implemented a set
of recruiting practices that promote career openings to traditionally underrepresented
groups including women, racial minorities, and members of the LGBTQ+ community.
Diversity and Inclusion Committee (IDEA): Electrify America believes in diversity and
inclusion in the workplace and has formed the IDEA (Inclusion, Diversity, Equality,
Awareness) Committee to underline that commitment. This committee focuses on the
support and advocacy for better and equal outcomes for all areas of diversity and
inclusion, including but not limited to gender, race, sexual orientation, religion, and age.
A core part of the committee’s mission statement is the recognition of the intersection
of environmental impact and environmental justice.
Supplier Diversity: Electrify America is committed to ensuring that investment under its
ZEV Investment Commitment reflects the rich and diverse characteristics of California
and its people. To meet this commitment, Electrify America staff conducts outreach
17 California ZEV Investment Plan: Cycle 3
efforts and activities to: ensure potential new suppliers and contractors are aware of
RFP opportunities resulting from the ZEV Investment Commitment; to encourage
greater participation by underrepresented groups and community based organizations,
including certified veteran-, women-, and minority-owned businesses; and to assist
applicants in understanding how to participate in the RFP process.
Electrify America’s purchasing team maintains a list of potential minority-, women-, and
veteran-owned vendors, and the team has established attracting diverse suppliers as a
key internal goal. Electrify America includes language in all RFPs indicating our
commitment to a diverse vendor base, and bidders to Electrify America RFPs are asked
to include information regarding certified minority-, women-, and veteran-owned
business enterprise participation along with their proposal. On a semi-annual basis,
Electrify America continues to survey its vendors to assess the job creation and
economic activity occurring as a result of the ZEV Investment Commitment, particularly
in disadvantaged and low-income communities and among minority-, women- and
veteran-owned and controlled businesses and organizations.
In summary, Electrify America embraces CSR and seeks to be a CSR leader in the ZEV industry. We
believe our past, current, and future actions serving our four CSR pillars are the keys to unlocking clean
and equitable transportation for everyone.
18 California ZEV Investment Plan: Cycle 3
3. National Outreach Efforts As Electrify America has learned through its first two investment cycles, driving progress on ZEV
adoption requires collaboration with stakeholders across the ZEV space. To begin this call for feedback,
Electrify America launched a National Outreach process to receive feedback from state, local, and tribal
governments; academics; interest groups; customers; automotive companies; infrastructure suppliers;
utilities; and the general public in the summer of 2020. This effort combined a public-facing submissions
page on ElectrifyAmerica.com with dozens of stakeholder discussions and a review of academic
literature to gather the latest insights and thinking on our investments and priorities.
Figure 1: Cycle 3 Outreach Efforts
From our webpage alone, Electrify America received over 949 unique submissions, including over 150
from California. Because COVID-19 impacted our ability to travel and meet with some stakeholders in
person, we strove to create meaningful engagement through webinars, video meetings, phone calls, and
emails. Electrify America is very appreciative of everyone who has taken the time to send us a
submission.
Given that this was our third call for public input through the National Outreach process, we refined our
approach from Cycle 2 and tailored our request for public feedback to the following seven specific
submission types:
Suggestions and Data Relevant to Cycle 3 Investments: Any suggestions that may impact our
investment thinking including: unique opportunities to work with submitters in deploying
impactful and financially sustainable ZEV investments, specific actions submitters are taking to
support EV adoption by taxi and ridehail vehicles, anonymized usage data from existing charging
stations (DCFC and Level 2) in submitters’ communities, current/expected ZEV infrastructure
plans or strategies for communities, and fuel cell electric vehicle (FCEV) data and/or adoption
perspectives, especially with regard to MHD vehicles.
Information Regarding ZEV Policy in Your Community: Information from governments and
entities about policies and incentives available in their communities that aim to increase ZEV
adoption.
Education & Access Suggestions: Suggestions concerning Electrify America’s approach to
education and access or specific events they should consider for participation or sponsorship.
Specific Site Locations: Suggestions for specific station locations for consideration in Cycle 3
infrastructure investments.
19 California ZEV Investment Plan: Cycle 3
Cycle 1 and 2 Comments and Feedback: Specific feedback on Cycle 1 and 2 National and
California ZEV Investment Plans, including approaches to metro and highway charging station
locations, evaluation of their use cases, and integration of new technology.
Vendor Interest: Requests for information from vendors or subcontractors interested in working
with Electrify America and learning more about Electrify America’s Request for Information (RFI)
and RFP process.
Event Invitations: Suggestions for specific events Electrify America should consider for
participation or sponsorship.
Other: All other comments or submissions that relate directly to Electrify America’s ZEV
Investment Commitment.
The submission portal remains open and Electrify America continues to receive, review, and respond to
the submissions we receive.
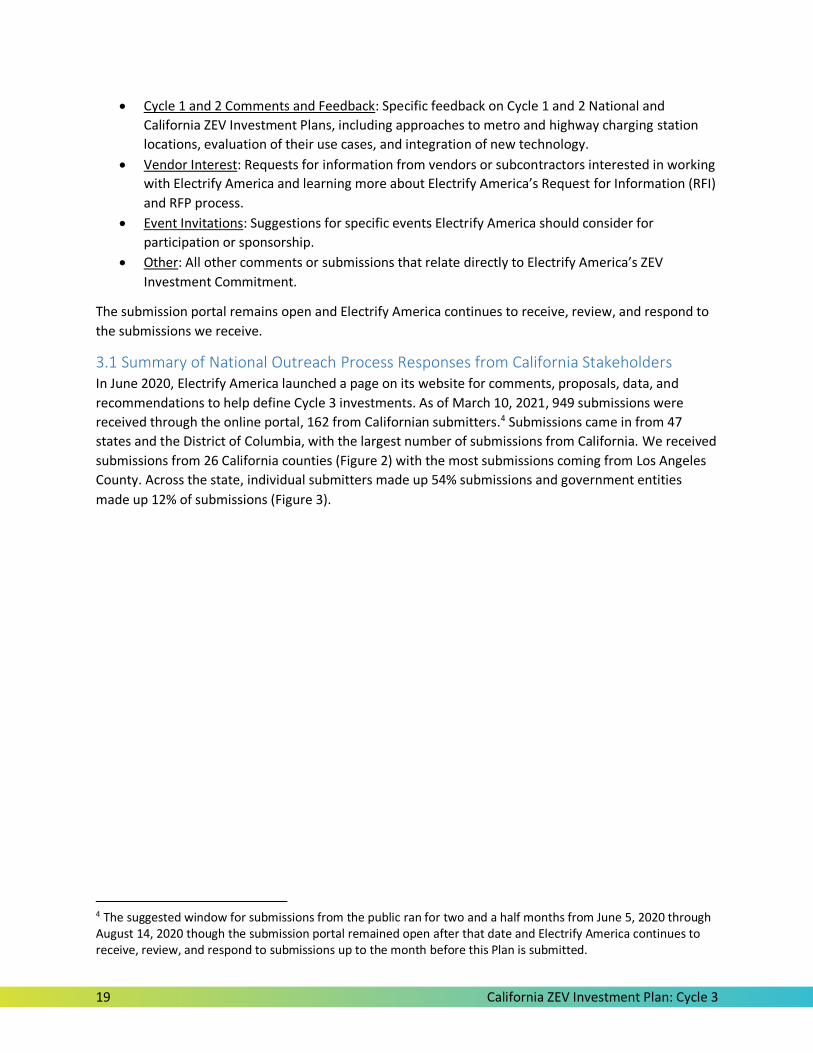
3.1 Summary of National Outreach Process Responses from California Stakeholders In June 2020, Electrify America launched a page on its website for comments, proposals, data, and
recommendations to help define Cycle 3 investments. As of March 10, 2021, 949 submissions were
received through the online portal, 162 from Californian submitters.4 Submissions came in from 47
states and the District of Columbia, with the largest number of submissions from California. We received
submissions from 26 California counties (Figure 2) with the most submissions coming from Los Angeles
County. Across the state, individual submitters made up 54% submissions and government entities
made up 12% of submissions (Figure 3).
4 The suggested window for submissions from the public ran for two and a half months from June 5, 2020 through August 14, 2020 though the submission portal remained open after that date and Electrify America continues to receive, review, and respond to submissions up to the month before this Plan is submitted.
20 California ZEV Investment Plan: Cycle 3
Figure 2: Map of Californian Submissions by County
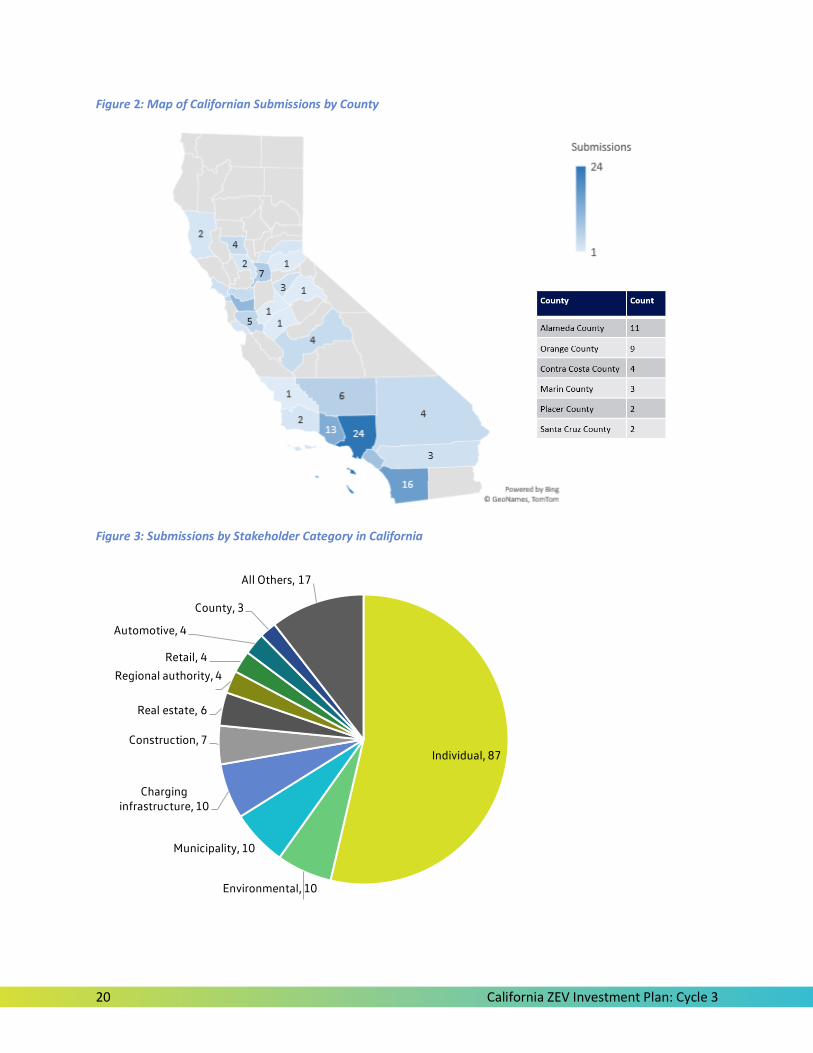
Figure 3: Submissions by Stakeholder Category in California
Individual, 87
Environmental, 10
Municipality, 10
Charging infrastructure, 10
Construction, 7
Real estate, 6
Regional authority, 4
Retail, 4
Automotive, 4
County, 3
All Others, 17

21 California ZEV Investment Plan: Cycle 3
Electrify America received submissions from a variety of stakeholders, including state, county, and local
governments, private companies, and individuals (Figure 3). It is interesting to note that in Cycle 3, we
received more than two-times the number of submissions from individuals than in Cycle 2. We are
encouraged to see that as our station utilization grows, more customers know about our business and
are motivated to offer us help in contributing to this next round of investment.
Through the National Outreach effort, four broad themes were identified. First, stakeholders expressed
enthusiasm for the investments that are already underway and encouraged Electrify America to
continue to focus on ultra-fast charging and customer experience. Second, many stakeholders see
freight and transit as emerging opportunities for electrification and emissions reductions, and urged
action in these areas. Third, many municipalities are eager to electrify the taxis and ridehail vehicles in
their communities, but further investment and support is required to make the transition. And finally, as
we drive forward on electrification, equity and access must remain a priority. For each of these themes,
as well as additional insights from the National Outreach Process, please see Sections 4.2 and 5.2 of this
document.
3.2 Ongoing Outreach Efforts Electrify America’s National Outreach effort for Cycle 3 was successful in providing us with insights on
emerging industry research, data on customer preferences that will drive utilization, and potential new
partnerships. Many of the insights identified are detailed in Chapters 4.2 and 5.2 of this paper.
Each month we continue to receive additional submissions to our National Outreach website and will
continue to review and respond to submissions up to the month before this Plan is submitted. We will
also continue our outreach throughout Cycle 3, especially as we receive more information about our
proposed target metros. Within Cycle 3, Electrify America plans to conduct a similar process of outreach
in order to draft our Cycle 4 ZEV Investment Plans.
22 California ZEV Investment Plan: Cycle 3
4. Infrastructure Investments ($127M)
4.1 Introduction Electrify America embarks on its third cycle of investment at a critical time in the PEV industry. With
traditional and startup automotive manufacturers bringing new models (see 4.2.2 and 5.2.2) and new
body styles (see 5.2.2), consumers will have unprecedented vehicle options and technology to choose
from. In addition, infrastructure has improved dramatically since Electrify America first started building
chargers. As just one proof point, in January 2021 a small team, using almost exclusively Electrify
America stations, completed an EV Cannonball Run from New York to Los Angeles. Coming in under 45
hours, the run set a new EV cannonball record and showcased both vehicle and charging equipment
technology and speeds along the way, as well as the viability of the CCS charging protocol (Loveday,
2021). However, despite these leaps forward, infrastructure remains a critical barrier to PEV adoption,
with many consumers citing lack of infrastructure as a top reason they would not buy a PEV (see 5.2.4).
Cycle 3 offers Electrify America another opportunity to continue building out its network and delivering
the infrastructure customers need. By the end of Cycle 3, we plan to have more than 1,000 ultra-fast
charging stations nationwide, and over 300 within California alone. While this investment is certainly not
large enough to address all outstanding needs for public charging infrastructure in the short-term, not to
mention the long-term, we hope these investments will substantially advance the state of the industry
not only with charging density and power, but helping lower barriers to entry for other private and
public sector organizations through supplier alternatives, skilled construction resources, and best
practices/lessons learned.
4.2 Insights from Our National Outreach and Cycles 1 and 2 Electrify America’s National Outreach process, as described in Chapter 3, provides the Electrify America
planning team with a tremendous amount of data and perspectives on industry trends. These insights, in
turn, help shape our investment decisions in each cycle. This section summarizes the infrastructure
insights gathered through submissions to our National Outreach website, meetings with key
stakeholders, and a thorough review of research by academics and other leading thinkers in our
industry.
4.2.1 Light-duty PEV adoption is poised to grow significantly through 2024, with a majority BEVs The PEV market is poised for significant growth in the coming decade. Despite slightly slower sales
volumes in 2020 due to COVID-19, stakeholders across California are making significant strides toward
the state goals of 1.5 million ZEVs by 2025 set forth in Executive Order B-16-12, and five million by 2030
set forth in Executive Order B-48-18. Furthermore, early analysis from the California Air Resources Board
(CARB) estimates that 8 million light-duty ZEVs and 180,000 medium- and heavy-duty ZEVs will be
needed in 2030 to meet Governor Newsom’s Executive Order N-79-20 goals, and the State has begun
implementing policies to attain these deployment targets (California Energy Commission, 2021).
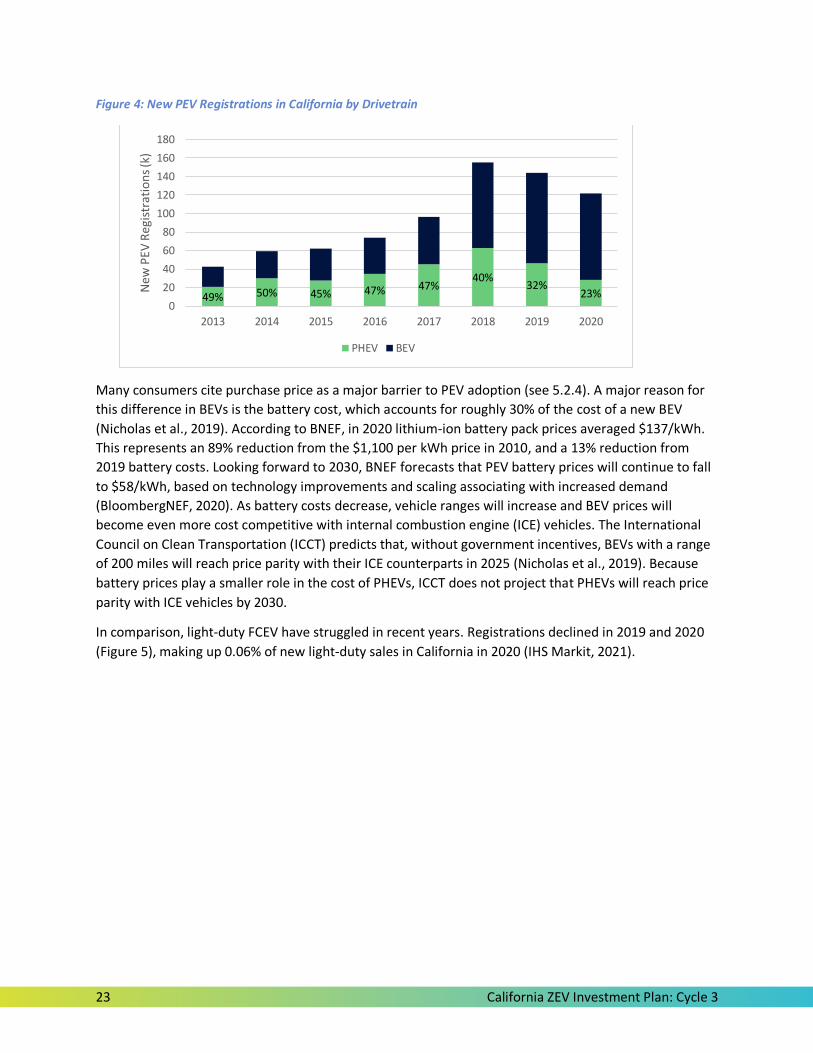
Through 2020, the mix of PEVS in California has shifted heavily to BEVs, which made up nearly 80% of
PEV sales in 2020 (Figure 4) (IHS Markit, 2021). In 2021, we expect this trend to continue, as nearly 90%
of new PEV models coming to market are BEVs (Plug In America, 2021).
23 California ZEV Investment Plan: Cycle 3
Figure 4: New PEV Registrations in California by Drivetrain
Many consumers cite purchase price as a major barrier to PEV adoption (see 5.2.4). A major reason for
this difference in BEVs is the battery cost, which accounts for roughly 30% of the cost of a new BEV
(Nicholas et al., 2019). According to BNEF, in 2020 lithium-ion battery pack prices averaged $137/kWh.
This represents an 89% reduction from the $1,100 per kWh price in 2010, and a 13% reduction from
2019 battery costs. Looking forward to 2030, BNEF forecasts that PEV battery prices will continue to fall
to $58/kWh, based on technology improvements and scaling associating with increased demand
(BloombergNEF, 2020). As battery costs decrease, vehicle ranges will increase and BEV prices will
become even more cost competitive with internal combustion engine (ICE) vehicles. The International
Council on Clean Transportation (ICCT) predicts that, without government incentives, BEVs with a range
of 200 miles will reach price parity with their ICE counterparts in 2025 (Nicholas et al., 2019). Because
battery prices play a smaller role in the cost of PHEVs, ICCT does not project that PHEVs will reach price
parity with ICE vehicles by 2030.
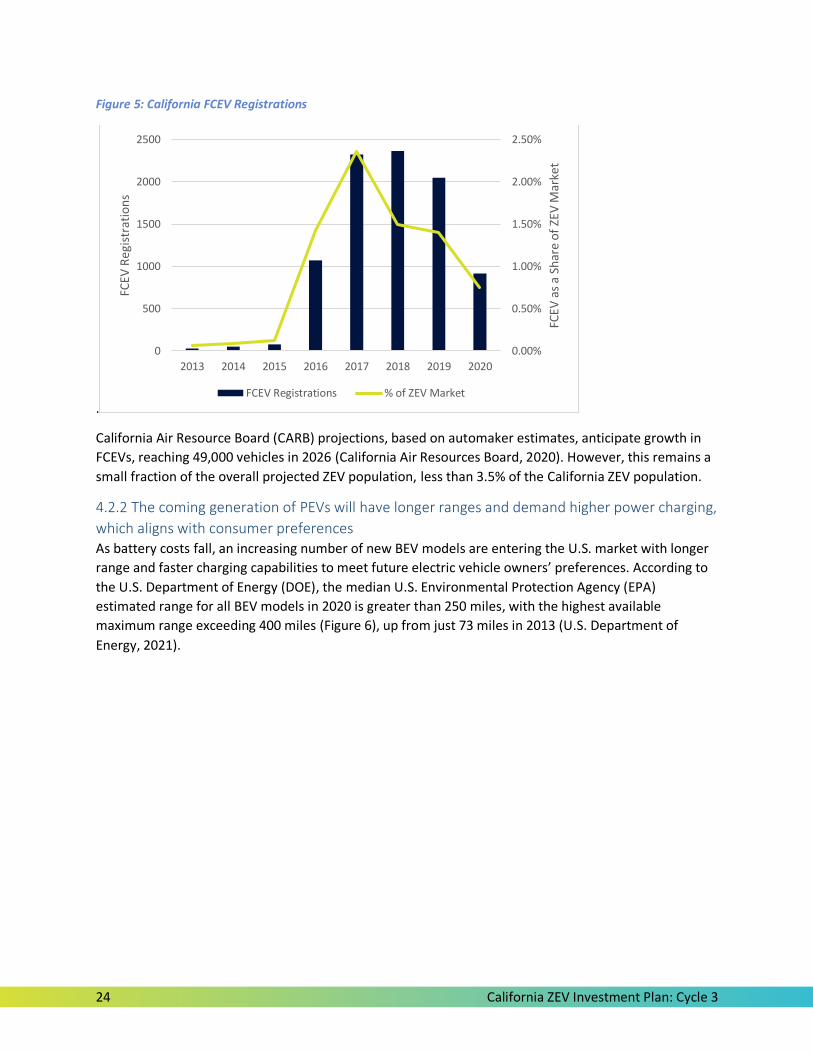
In comparison, light-duty FCEV have struggled in recent years. Registrations declined in 2019 and 2020
(Figure 5), making up 0.06% of new light-duty sales in California in 2020 (IHS Markit, 2021).
49% 50% 45% 47% 47%40%
32%23%
0
20
40
60
80
100
120
140
160
180
2013 2014 2015 2016 2017 2018 2019 2020
New
PEV
Reg
istr
atio
ns
(k)
PHEV BEV
24 California ZEV Investment Plan: Cycle 3
Figure 5: California FCEV Registrations
.
California Air Resource Board (CARB) projections, based on automaker estimates, anticipate growth in
FCEVs, reaching 49,000 vehicles in 2026 (California Air Resources Board, 2020). However, this remains a
small fraction of the overall projected ZEV population, less than 3.5% of the California ZEV population.
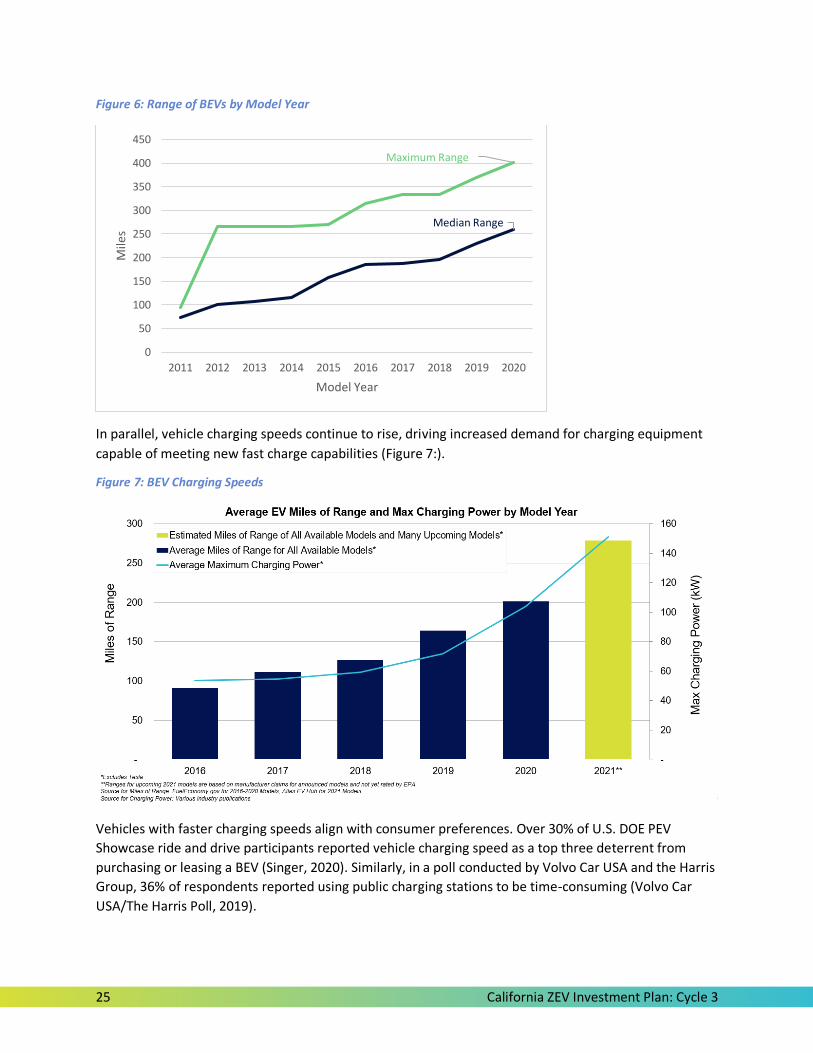
4.2.2 The coming generation of PEVs will have longer ranges and demand higher power charging,
which aligns with consumer preferences As battery costs fall, an increasing number of new BEV models are entering the U.S. market with longer
range and faster charging capabilities to meet future electric vehicle owners’ preferences. According to
the U.S. Department of Energy (DOE), the median U.S. Environmental Protection Agency (EPA)
estimated range for all BEV models in 2020 is greater than 250 miles, with the highest available
maximum range exceeding 400 miles (Figure 6), up from just 73 miles in 2013 (U.S. Department of
Energy, 2021).
0.00%
0.50%
1.00%
1.50%
2.00%
2.50%
0
500
1000
1500
2000
2500
2013 2014 2015 2016 2017 2018 2019 2020
FCEV
as
a Sh
are
of
ZEV
Mar
ket
FCEV
Reg
istr
atio
ns
FCEV Registrations % of ZEV Market
25 California ZEV Investment Plan: Cycle 3
Figure 6: Range of BEVs by Model Year
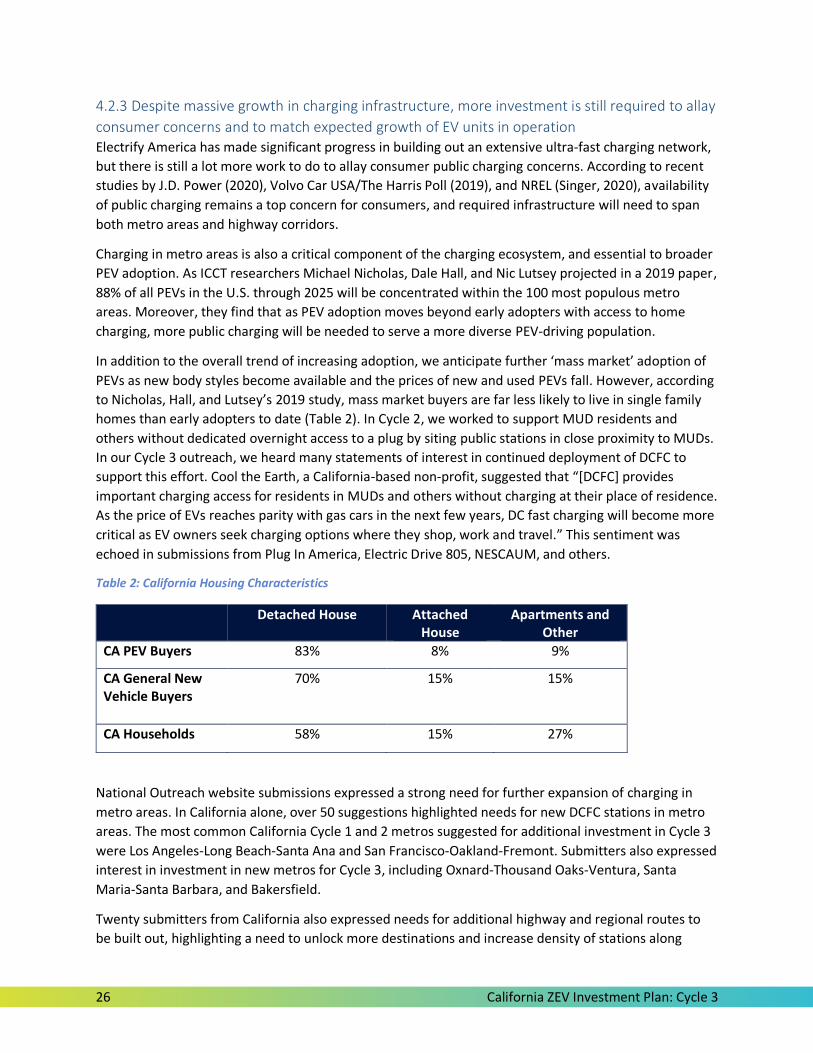
In parallel, vehicle charging speeds continue to rise, driving increased demand for charging equipment
capable of meeting new fast charge capabilities (Figure 7:).
Figure 7: BEV Charging Speeds
Vehicles with faster charging speeds align with consumer preferences. Over 30% of U.S. DOE PEV
Showcase ride and drive participants reported vehicle charging speed as a top three deterrent from
purchasing or leasing a BEV (Singer, 2020). Similarly, in a poll conducted by Volvo Car USA and the Harris
Group, 36% of respondents reported using public charging stations to be time-consuming (Volvo Car
USA/The Harris Poll, 2019).
Maximum Range
Median Range
0
50
100
150
200
250
300
350
400
450
2011 2012 2013 2014 2015 2016 2017 2018 2019 2020
Mile
s
Model Year
26 California ZEV Investment Plan: Cycle 3
4.2.3 Despite massive growth in charging infrastructure, more investment is still required to allay
consumer concerns and to match expected growth of EV units in operation Electrify America has made significant progress in building out an extensive ultra-fast charging network,
but there is still a lot more work to do to allay consumer public charging concerns. According to recent
studies by J.D. Power (2020), Volvo Car USA/The Harris Poll (2019), and NREL (Singer, 2020), availability
of public charging remains a top concern for consumers, and required infrastructure will need to span
both metro areas and highway corridors.
Charging in metro areas is also a critical component of the charging ecosystem, and essential to broader
PEV adoption. As ICCT researchers Michael Nicholas, Dale Hall, and Nic Lutsey projected in a 2019 paper,
88% of all PEVs in the U.S. through 2025 will be concentrated within the 100 most populous metro
areas. Moreover, they find that as PEV adoption moves beyond early adopters with access to home
charging, more public charging will be needed to serve a more diverse PEV-driving population.
In addition to the overall trend of increasing adoption, we anticipate further ‘mass market’ adoption of
PEVs as new body styles become available and the prices of new and used PEVs fall. However, according
to Nicholas, Hall, and Lutsey’s 2019 study, mass market buyers are far less likely to live in single family
homes than early adopters to date (Table 2). In Cycle 2, we worked to support MUD residents and
others without dedicated overnight access to a plug by siting public stations in close proximity to MUDs.
In our Cycle 3 outreach, we heard many statements of interest in continued deployment of DCFC to
support this effort. Cool the Earth, a California-based non-profit, suggested that “[DCFC] provides
important charging access for residents in MUDs and others without charging at their place of residence.
As the price of EVs reaches parity with gas cars in the next few years, DC fast charging will become more
critical as EV owners seek charging options where they shop, work and travel.” This sentiment was
echoed in submissions from Plug In America, Electric Drive 805, NESCAUM, and others.
Table 2: California Housing Characteristics
National Outreach website submissions expressed a strong need for further expansion of charging in
metro areas. In California alone, over 50 suggestions highlighted needs for new DCFC stations in metro
areas. The most common California Cycle 1 and 2 metros suggested for additional investment in Cycle 3
were Los Angeles-Long Beach-Santa Ana and San Francisco-Oakland-Fremont. Submitters also expressed
interest in investment in new metros for Cycle 3, including Oxnard-Thousand Oaks-Ventura, Santa
Maria-Santa Barbara, and Bakersfield.
Twenty submitters from California also expressed needs for additional highway and regional routes to
be built out, highlighting a need to unlock more destinations and increase density of stations along
Detached House Attached House
Apartments and Other
CA PEV Buyers 83% 8% 9%
CA General New Vehicle Buyers
70% 15% 15%
CA Households 58% 15% 27%
27 California ZEV Investment Plan: Cycle 3
heavily used routes. Multiple submitters focused on enabling travel to national and state parks,
including Joshua Tree National Park. Other submissions focused on increased connectivity in major
travel corridors. For example, Electric Drive 8055 suggested increased connectivity along the Central
Coast, while Charged Future submitted a recommendation to build a station in Kettleman City to
improve travel along I-5 and CA-41.
4.2.4 Despite the rapid pace of growth, customer experience and cost optimization must remain
at the forefront While availability of charging infrastructure is important for ZEV adoption, the customer experience with
the infrastructure is also crucial. In a 2020 study by Georgia Tech, researchers used machine learning to
analyze PlugShare comments for public charging stations. The results were concerning – they found that
only 56% of comments expressed a positive sentiment about the charging experience (Asensio et al.,
2020). In a similar vein, a 2021 survey by Plug In America found that even among PEV owners who are
highly satisfied with their vehicle, over 50% reported experiencing problems with public charging
infrastructure (Ast et al., 2021). Respondents to our National Outreach process were similarly vocal, with
18 California submitters emphasizing the importance of reliability and customer experience. In addition
to submissions about general quality, several submissions asked for additional amenities, such as
protection from the natural elements.
Another common request was for improved wayfinding to charging sites. One element voiced was for
more prominent signage for charging stations along highways. Plug In America, as part of their broader
Cycle 3 investment recommendations, suggested that Electrify America add more signage up to the last
100 yards from an EV station to help users locate charging stations. Another submitter mentioned that
increased signage would make the public more aware of the prevalence of stations to overcome the
misconception that public charging is sparsely available. The City of Sacramento asked Electrify America
to participate in a highway and street frontage signage pilot they are working on with a non-profit,
Coltura and University of California, Davis staff. This feedback shows that increasing the accessibly of our
stations to make it easy for all customers, even new ones, to find and use chargers will help build
confidence in public charging options. Electrify America also received feedback on how to improve our
mobile app to facilitate finding and navigating to stations. With over 50% of customers using our app to
start a charging session, this is a critical tool for helping customers to find sites. In response to the
feedback received, Electrify America launched a new and improved app in 2021, with directions for
navigating to stations and an intuitive display of charging station information.
Finally, station capital and operating costs continue to be a barrier to further investment in the industry.
As noted in studies by Great Plains Institute (2019), Rocky Mountain Institute (Fitzgerald, et al., 2019),
and NREL (2017), commercial utility rate structures, and in particular demand charges, present serious
challenges to station economics. In addition, research from the Rocky Mountain Institute highlighted
that soft costs, including “permitting delays, utility interconnection requests, compliance with a
balkanized framework of regulations, and the reengineering of projects because they were based on
incorrect information, among others” can significantly impact the cost of installing EV charging (Nelder,
5 Electric Drive 805 is a coalition founded by the Community Environmental Council, the Central Coast Clean Cities Coalition, and the Air Pollution Control Districts of Ventura, Santa Barbara, and San Luis Obispo
28 California ZEV Investment Plan: Cycle 3
2019). Based on Electrify America’s experience from Cycles 1 and 2, these soft costs are often higher in
California than the rest of the nation.
As we build out our network, Electrify America will continue to focus on quality, customer experience,
and cost as key drivers for where and how we install charging infrastructure. Electrify America will also
continue to invest the necessary resources to participate in state and local government processes in
order to advocate for changes that will reduce permitting timelines, reduce EV charging station soft
costs, and reform utility rates.
4.2.5 Electrifying shared mobility is a top priority due to potential impact on emissions reduction
and exposure to ZEVs As the light-duty vehicle market electrifies, many stakeholders have expressed keen interest in
electrifying a specific subset of the population: shared mobility including transportation network
companies (TNCs), taxis, and car share. Electrify America’s National Outreach process highlighted this
focus. Twenty-nine submissions, primarily from high-level government entities or major regional interest
groups, referenced this vehicle population and emphasized that electrifying shared mobility was a major
policy focus for these entities.
Electrifying shared mobility offers a number of key benefits. First, Alan Jenn’s 2019 paper “Emissions
Benefits of Electric Vehicles in Uber and Lyft Services” finds that the emissions savings from electrifying
a TNC vehicle are nearly three-times as high as electrifying an average vehicle in California (Jenn, 2019).
Second, industry advocate Forth has found through their driver research that PEV TNC drivers often
become evangelists for the technology. As these drivers pick up passengers, the in-vehicle chatter often
includes discussions of PEVs, their benefits, how/where to charge, and other related topics. As a result,
the passenger gets both a zero emission ride, and an educational experience. Third, TNC and taxi drivers
often come from low-income brackets (Mishel, 2018), and electrifying their vehicles unlocks lower cost
operations and greater opportunity for take-home pay. And finally, TNCs increasingly provide critical
mobility solutions for low-income communities and populations with limited access to private vehicles
or public transit, both in densely populated urban centers and rural areas. In 2020, 46% of Lyft rides
started or ended in low-income areas, and 51% of riders used the platform to connect to public transit
(Lyft, 2021).
Along with the enthusiasm about electrifying shared mobility vehicles, many industry experts and
researchers note that building charging infrastructure will be critical to spurring adoption. A recent
report by ICCT estimates that fewer than 44% of ridehail drivers could feasibly install Level 2 home
charging (Nicholas et al., 2020).6 A California Energy Commission 2021 staff report notes that “in 2018,
ZEVs serving in TNC fleets represented fewer than 0.5 percent of the ZEV population in California but
used 35 percent of non-Tesla public charging.” And Rocky Mountain Institute’s 2021 paper “Racing to
Accelerate EV Adoption—Decarbonizing Transportation with Ridehailing” highlights that at present
insufficient infrastructure and the resulting ‘opportunity cost’ of route diversions or queueing for
charging can impact a driver’s bottom line (McLane et al., 2021). NESCAUM also expressed a need for
targeted infrastructure, suggesting in their National Outreach submission that Electrify America,
“strategically place community charging hubs along travel corridors, at airports and train stations, and at
other places that will help to accelerate electrification of TNCs and taxi fleets.”
6 ICCT notes that “this 44% could include those who can find charging off-shift near their home or at a workplace.”
29 California ZEV Investment Plan: Cycle 3
Electrifying shared mobility can bring both environmental benefits and increased driver and rider
awareness of PEVs, and we plan to work collaboratively with the leaders in this space to make an
impact.
4.2.6 Medium- and heavy-duty electrification is growing, as new vehicles and models offer
increasing opportunity for emissions reduction MHD vehicles are major sources of both greenhouse gas (GHG) and particulate emissions. Despite
making up less than 7% of vehicles in California, MHD trucks are responsible for 22% of on-road GHG
emissions, 70% of smog-forming pollutants, and 80% of carcinogenic diesel soot (California Air
Resources Board, 2020).
In order to meet California’s larger goals for reducing carbon emissions in the transportation sector,
CARB instituted the Advanced Clean Truck Program that requires all new MHD vehicles sold in California
to be a ZEV by 2045 (California Air Resources Board, 2020). Manufacturers in the MHD arena will be
required to increases their ZEV sales in under four years and this mandate will likely lead to the creation
of new fleet models and charging technologies with the collaboration of the trucking industry. This rule
built on the 2018 Innovative Clean Transit Rule, which requires transit agencies to transition an
estimated 14,600 buses to zero emission technology by 2040. CARB’s new programs are game changers
for the industry, and Electrify America anticipates it will lead to major advances in vehicle development
and deployment.
Even outside of CARB’s announcement, industry stakeholders are expecting zero emission MHD vehicles
to quickly become a reality. A report by ICCT identified over 125 zero emission truck and bus models
that are in development, demonstration, or production, and every major truck or bus manufacturer has
announced the development of or collaboration on at least one electrified model (Sharpe et al., 2020).
The paper reports that industry experts expect the number of zero emission heavy duty models to
double by 2023. As these vehicles become available, their unique charging needs will need to be
addressed. In a survey of private fleets, the Electrification Coalition reported that 75% of respondents
reported that planning for and installing charging infrastructure is a major barrier to MHD electrification
(Buholtz et al., 2020).
Electrify America also observed very high levels of interest in ZEV trucks, buses, and delivery vehicles
from stakeholders across the industry. Through our National Outreach website, we received 14
submissions on the topic, including many that were very excited about California’s Advanced Clean
Truck regulation and the 2045 target it defines for all MHD trucks to be zero emission. Specifically,
Electric Drive 805 suggested “that Electrify America invest Cycle 3 funds to help build out a network of
EV charging stations for MHD trucks in the Central Coast region, to support truck electrification.” In
particular, they recommend installing charging stations at “heavily trafficked truck stops” and funding
“shared-use infrastructure for MHD ZEVs that can serve multiple users including licensed motor carriers,
independent owner-operators, transit, and school buses.” The Metropolitan Transportation Commission
& Bay Area Air Quality Management District also referenced the Advanced Clean Trucks Rule, suggesting
the “successful transition to zero emissions technologies within [these] industr[ies] is critical to reducing
air pollution both regionally and locally.”
To help foster this new DCFC application, in 2019 Electrify America became a member of CharIN, an
association working to facilitate use of non-proprietary charging standards, which is also coordinating
30 California ZEV Investment Plan: Cycle 3
the development of a new global 1 MW+ charging standard. Electrify America staff actively participates
in the Megawatt Charging System (MCS) task force, together with other charging providers, automotive
OEMs, utilities, and infrastructure companies from around the globe. Electrify America is committed to
supporting ZEV adoption in all vehicle classes and is eager to collaborate with industry partners in this
emerging field.
4.3 Metro Charging ($70 – $100M)
4.3.1 Investment Overview As evidenced by feedback from the National Outreach process (4.2.3, 4.2.5), California’s metropolitan
areas need additional charging station investments in order to serve the continued growth in PEV
adoption. To support this goal, Electrify America plans to invest $70 - $100 million in metropolitan area
charging across California.
Within each metro, investments will seek to serve at least one of three (at times overlapping) needs:
Supporting travel in and around town: To support intra-city travel, Electrify America will add
density in our existing metro areas, and Electrify America will also add investments to new
metro markets.
Providing reliable fueling for drivers living in MUDs: Within major metro areas, Electrify America
will continue to build stations in urban centers where we can support the electrification of all
driver populations, including those living in MUDs.
Enabling the electrification of TNC and taxi vehicles: Electrify America will target select stations
to help drive the electrification of taxis, TNCs, and car share fleets across the state.
Electrification of this critical segment of the vehicle population will require further deployment
of targeted, and in some cases dedicated, DCFC stations, and therefore a portion of Cycle 3
metro stations will focus on serving the TNC market.
Based on the buildout Electrify America has been able to achieve in our first two cycles, in Cycle 3 we
can now focus on building a smaller number of highly targeted stations in many of our existing metro
areas. This natural evolution in our strategy allows us to serve needs of drivers for each use case
identified above, achieve high levels of utilization, and expand our investment into a larger number of
metro areas.
4.3.2 Investment Selection Methodology Electrify America conducted a multi-faceted analysis to select metro areas and their respective
investment sizing for Cycle 3. This methodology builds on those used in Cycles 1 and 2, employing a
similar approach and many common inputs, but refining the analysis.
Our Cycle 3 methodology relies on four key inputs: an assessment of charging needs for each
metropolitan statistical area (MSA) in California, a PEV policy metric, a utility metric, and a review of all
submissions and feedback from our Cycle 3 National Outreach process.
31 California ZEV Investment Plan: Cycle 3
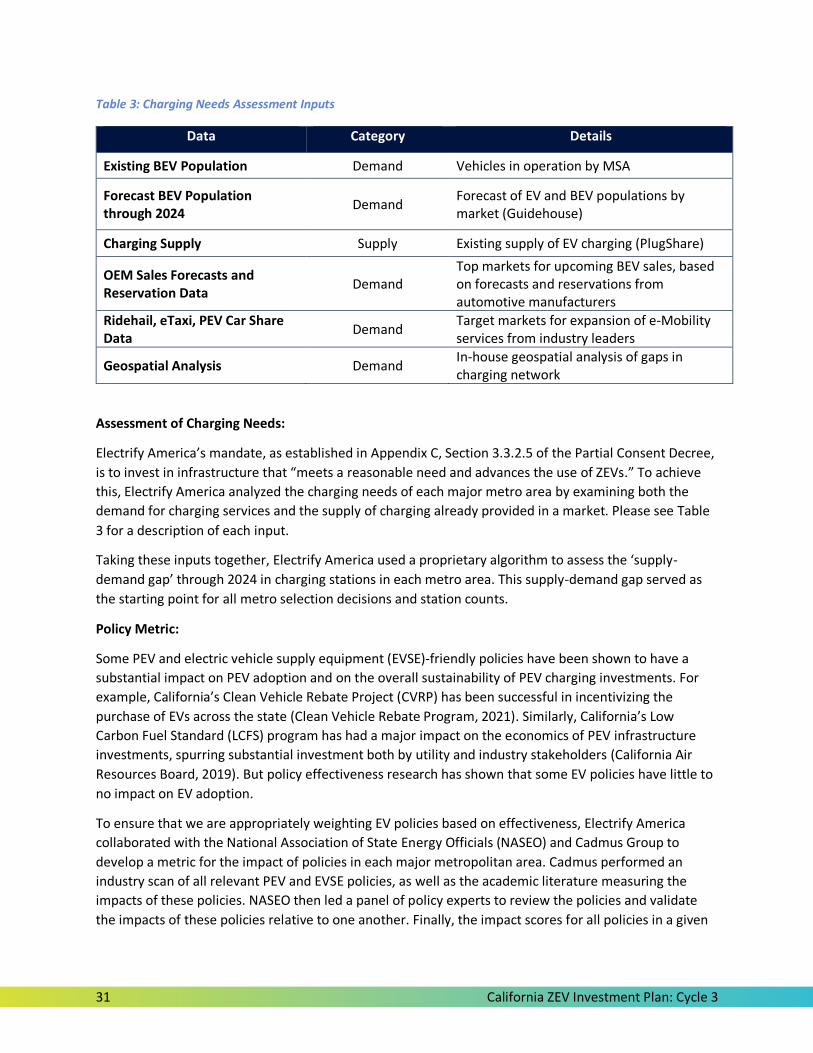
Table 3: Charging Needs Assessment Inputs
Assessment of Charging Needs:
Electrify America’s mandate, as established in Appendix C, Section 3.3.2.5 of the Partial Consent Decree,
is to invest in infrastructure that “meets a reasonable need and advances the use of ZEVs.” To achieve
this, Electrify America analyzed the charging needs of each major metro area by examining both the
demand for charging services and the supply of charging already provided in a market. Please see Table
3 for a description of each input.
Taking these inputs together, Electrify America used a proprietary algorithm to assess the ‘supply-
demand gap’ through 2024 in charging stations in each metro area. This supply-demand gap served as
the starting point for all metro selection decisions and station counts.
Policy Metric:
Some PEV and electric vehicle supply equipment (EVSE)-friendly policies have been shown to have a
substantial impact on PEV adoption and on the overall sustainability of PEV charging investments. For
example, California’s Clean Vehicle Rebate Project (CVRP) has been successful in incentivizing the
purchase of EVs across the state (Clean Vehicle Rebate Program, 2021). Similarly, California’s Low
Carbon Fuel Standard (LCFS) program has had a major impact on the economics of PEV infrastructure
investments, spurring substantial investment both by utility and industry stakeholders (California Air
Resources Board, 2019). But policy effectiveness research has shown that some EV policies have little to
no impact on EV adoption.
To ensure that we are appropriately weighting EV policies based on effectiveness, Electrify America
collaborated with the National Association of State Energy Officials (NASEO) and Cadmus Group to
develop a metric for the impact of policies in each major metropolitan area. Cadmus performed an
industry scan of all relevant PEV and EVSE policies, as well as the academic literature measuring the
impacts of these policies. NASEO then led a panel of policy experts to review the policies and validate
the impacts of these policies relative to one another. Finally, the impact scores for all policies in a given
Data Category Details
Existing BEV Population Demand Vehicles in operation by MSA
Forecast BEV Population through 2024
Demand Forecast of EV and BEV populations by market (Guidehouse)
Charging Supply Supply Existing supply of EV charging (PlugShare)
OEM Sales Forecasts and Reservation Data
Demand Top markets for upcoming BEV sales, based on forecasts and reservations from automotive manufacturers
Ridehail, eTaxi, PEV Car Share Data
Demand Target markets for expansion of e-Mobility services from industry leaders
Geospatial Analysis Demand In-house geospatial analysis of gaps in charging network
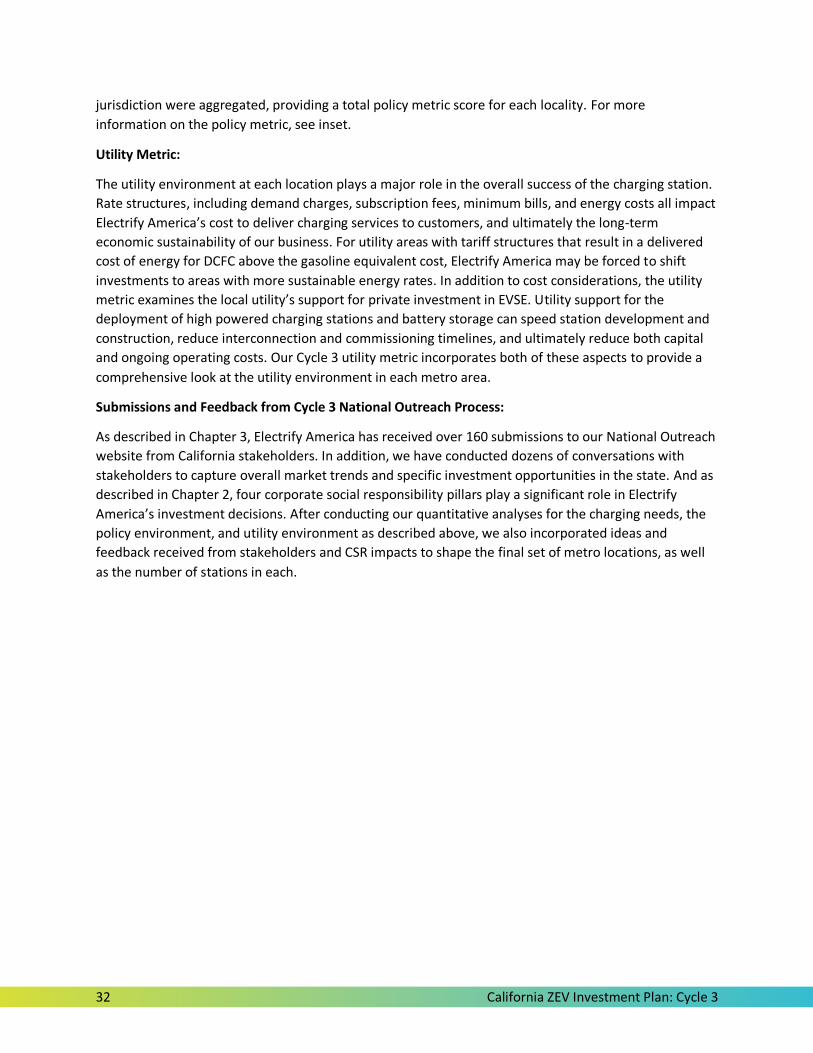
32 California ZEV Investment Plan: Cycle 3
jurisdiction were aggregated, providing a total policy metric score for each locality. For more
information on the policy metric, see inset.
Utility Metric:
The utility environment at each location plays a major role in the overall success of the charging station.
Rate structures, including demand charges, subscription fees, minimum bills, and energy costs all impact
Electrify America’s cost to deliver charging services to customers, and ultimately the long-term
economic sustainability of our business. For utility areas with tariff structures that result in a delivered
cost of energy for DCFC above the gasoline equivalent cost, Electrify America may be forced to shift
investments to areas with more sustainable energy rates. In addition to cost considerations, the utility
metric examines the local utility’s support for private investment in EVSE. Utility support for the
deployment of high powered charging stations and battery storage can speed station development and
construction, reduce interconnection and commissioning timelines, and ultimately reduce both capital
and ongoing operating costs. Our Cycle 3 utility metric incorporates both of these aspects to provide a
comprehensive look at the utility environment in each metro area.
Submissions and Feedback from Cycle 3 National Outreach Process:
As described in Chapter 3, Electrify America has received over 160 submissions to our National Outreach
website from California stakeholders. In addition, we have conducted dozens of conversations with
stakeholders to capture overall market trends and specific investment opportunities in the state. And as
described in Chapter 2, four corporate social responsibility pillars play a significant role in Electrify
America’s investment decisions. After conducting our quantitative analyses for the charging needs, the
policy environment, and utility environment as described above, we also incorporated ideas and
feedback received from stakeholders and CSR impacts to shape the final set of metro locations, as well
as the number of stations in each.

33 California ZEV Investment Plan: Cycle 3
Electrify America commissioned NASEO, in partnership with Cadmus Group, to develop an updated Plug-In Electric
Vehicle Policy Tool (the “Tool”) to evaluate the impact of state and local policies on PEV adoption in states and cities
across the United States. The Tool was designed for Electrify America to use when considering potential areas for
Cycle 3 investment, and allows the user to evaluate the combined strengths and weaknesses of all PEV-related
policies in a given metro area on a scale of 1-100 and compare the result with other metro areas.
The Tool provides a unique, evidence-based method to evaluate the ZEV investment climate of a metro area. The
Tool’s main feature – the Policy Evaluation Rubric – categorizes all PEV policies into 13 policy categories. Each policy
category is assigned a weight, based on its strength to spur PEV adoption relative to other policies. These weightings
were assigned after an exhaustive review of peer-reviewed journal articles, publications from government, non-
governmental organizations (NGOs), and the National Academies of Sciences, as well as rounds of expert input from
an external Technical Advisory Committee (TAC). Members of the TAC provided input on the project’s Policy Tool
Methodology and Policy Evaluation Rubric; however, the TAC was not shown the proposed Cycle 3 investment
jurisdictions, and did not partake in reviewing the draft rankings of candidate jurisdictions. TAC members included:
Jeff Allen, Forth
Samantha Bingham, Chicago Department of Transportation
Austin Lannes Brown, University of California-Davis
JR DeShazo, University of California-Los Angeles, Luskin Center
Sarah Garman, U.S. Department of Energy
David Greene, University of Tennessee
Britta Gross, Rocky Mountain Institute
Kathy Kinsey, Northeast States for Coordinated Air Use Management
Patricia Monahan, California Energy Commission
Andrea Pratt, City of Seattle
Pete Slowik, International Council on Clean Transportation
Alexa Voytek, Tennessee Department of Environment and Conservation
Joy Wang, Michigan Public Service Commission
Christian Willis, Colorado Energy Office
The NASEO team assigned the highest weight to vehicle purchase incentives and vehicle mandates/targets, followed
by incentives for EVSE installation, non-residential utility rates that promote EV charging, streamlined permitting
processes and building/zoning codes, and transportation sector carbon pricing. While there is some debate in the
literature around the relative effectiveness of these policies, it is the project team’s conclusion that these six types of
policies represent the most effective policies at advancing PEV adoption.
This Tool was designed for Electrify America in its Cycle 3 investment planning, but may also be used by policymakers
at the state and local level to evaluate their jurisdiction’s current PEV policy environment. The Tool, as well as a
detailed report on the methodology behind it, are available online here: https://naseo.org/news-
article?NewsID=3583
POLICY METRIC
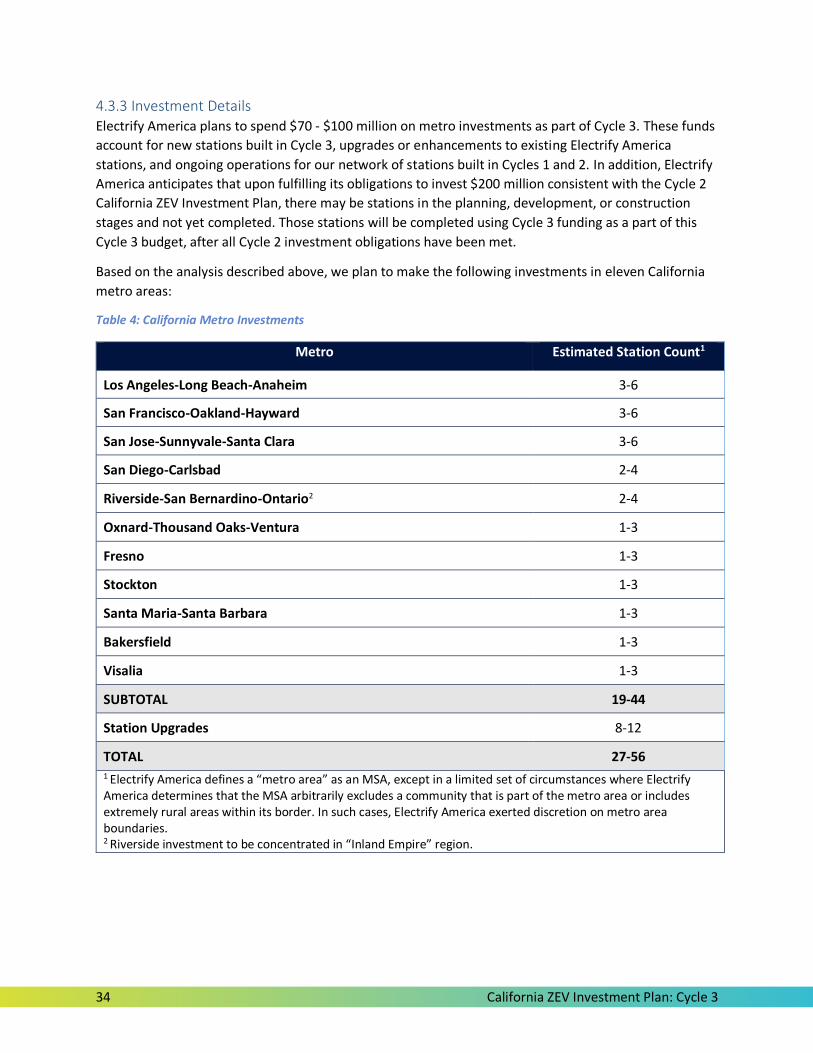
34 California ZEV Investment Plan: Cycle 3
4.3.3 Investment Details
Electrify America plans to spend $70 - $100 million on metro investments as part of Cycle 3. These funds
account for new stations built in Cycle 3, upgrades or enhancements to existing Electrify America
stations, and ongoing operations for our network of stations built in Cycles 1 and 2. In addition, Electrify
America anticipates that upon fulfilling its obligations to invest $200 million consistent with the Cycle 2
California ZEV Investment Plan, there may be stations in the planning, development, or construction
stages and not yet completed. Those stations will be completed using Cycle 3 funding as a part of this
Cycle 3 budget, after all Cycle 2 investment obligations have been met.
Based on the analysis described above, we plan to make the following investments in eleven California
metro areas:
Table 4: California Metro Investments
Metro Estimated Station Count1
Los Angeles-Long Beach-Anaheim 3-6
San Francisco-Oakland-Hayward 3-6
San Jose-Sunnyvale-Santa Clara 3-6
San Diego-Carlsbad 2-4
Riverside-San Bernardino-Ontario2 2-4
Oxnard-Thousand Oaks-Ventura 1-3
Fresno 1-3
Stockton 1-3
Santa Maria-Santa Barbara 1-3
Bakersfield 1-3
Visalia 1-3
SUBTOTAL 19-44
Station Upgrades 8-12
TOTAL 27-56 1 Electrify America defines a “metro area” as an MSA, except in a limited set of circumstances where Electrify America determines that the MSA arbitrarily excludes a community that is part of the metro area or includes extremely rural areas within its border. In such cases, Electrify America exerted discretion on metro area boundaries.
2 Riverside investment to be concentrated in “Inland Empire” region.
35 California ZEV Investment Plan: Cycle 3
Figure 8: Cycle 3 California Metros
Electrify America routinely analyzes the charging landscape, including vehicle adoption, existing
infrastructure, utility and policy changes, real estate availability, and changing customer needs, in an
effort to ensure our investments have the largest possible impact on PEV adoption and lead to a
sustainable business model. In the event that the charging landscape shifts, Electrify America may opt to
increase or decrease investment in planned Cycle 3 metros, or add investments in new metros.
Station Siting Details:
As described above, Electrify America intends to build stations to serve three core use cases within
metros: supporting intra-city travel, providing reliable fueling for drivers living in MUDs, and enabling
the electrification of TNC vehicles. Practically speaking, these use cases often overlap, allowing a single
station to serve multiple sets of drivers (e.g., MUD stations are likely to be well-situated for TNC drivers
due to the proximity of stations to urban clusters and pickup/drop-off locations).
To site each location, we use a proprietary geospatial model that examines travel patterns, existing
charging stations, historical utilization data, existing and expected vehicle adoption, and our CSR
framework, to identify target areas within each metro. Once a target zone has been identified, Electrify
America uses a combination of desktop research and local resources to identify and screen specific real

36 California ZEV Investment Plan: Cycle 3
estate opportunities. A high quality charging experience is paramount to us, so we have a long list of
criteria when deciding where to locate a charging station – consistent with our proven approach in
Cycles 1 and 2. Several factors include: accessibility (24/7 access and year round operations), high
visibility (station must be clearly visible from surrounding roads and entrances), proximity to amenities
(reasonable walking distance to stores, restaurants, etc.), nearby power sources, and projected
utilization.
For stations targeted at MUD residents, in addition to the above criteria we also seek locations adjacent
or close to areas with a high concentration of MUDs. Where possible, we look for locations that are
frequent destinations of those living in the local area, including grocery stores, banks, and shopping
centers.
Stations serving shared mobility providers, including electric taxis, ridehail vehicles, and car share, can
often share locations and siting criteria with both MUD stations and general retail locations. However, in
certain circumstances these use cases may require unique locations. While every PEV driver wants a fast
charging experience, TNC drivers are particularly sensitive to the length of charging sessions. In their
2020 paper on ridehail electrification, NESCAUM notes that because time spent charging represents lost
opportunity costs, TNC drivers need DCFC conveniently located within their service areas with minimal
wait times (Bomey, 2020). Electrify America’s conversations with shared mobility providers further
highlight these needs, with many emphasizing a need for locations near airports, downtown areas, and
near where their drivers live. Electrify America aims to serve as many drivers and vehicles as possible,
and will keep many of our shared mobility-focused stations fully open to the public. However, some
locations serving this use case may be ‘dedicated’ or have restricted access to ensure sufficient
availability for these critical services.
Similar to Cycles 1 and 2, we anticipate working with a variety of site hosts. We have built successful
collaborations ranging from national retailers like Target and Bank of America, to small “mom and pop”
shops. Through the National Outreach process, we received over 680 suggested station site locations,
including interest from 107 submitters who have site control, and these leads have been referred to our
real estate team. As we build our network for the long-term, station site selection and station
experience remains an extremely important part of our investment strategy.
Station Design Details
Electrify America charging stations in metro areas typically include four ultra-fast PEV chargers. In
locations for which we anticipate high demand, Electrify America may deploy up to 10 chargers, or even
more at select “megasites” intended to serve drivers in the locations with highest demand. In areas with
limited real estate, available power, or projected utilization, Electrify America may opt to build as few as
two chargers in a single location.
Electrify America’s ultra-fast chargers range from 150kW to 350kW of power7 based on anticipated
needs and use cases, as well as available real estate and power. Some Electrify America metro stations
may include Level 2 charging where the site host prefers, and where the business case can be justified.
Electrify America does not include these chargers as standard at metro sites as experience from our
7 CHAdeMO charging at Electrify America stations is limited to 50kW, meeting the needs of the vast majority of CHAdeMO vehicles in operation today.
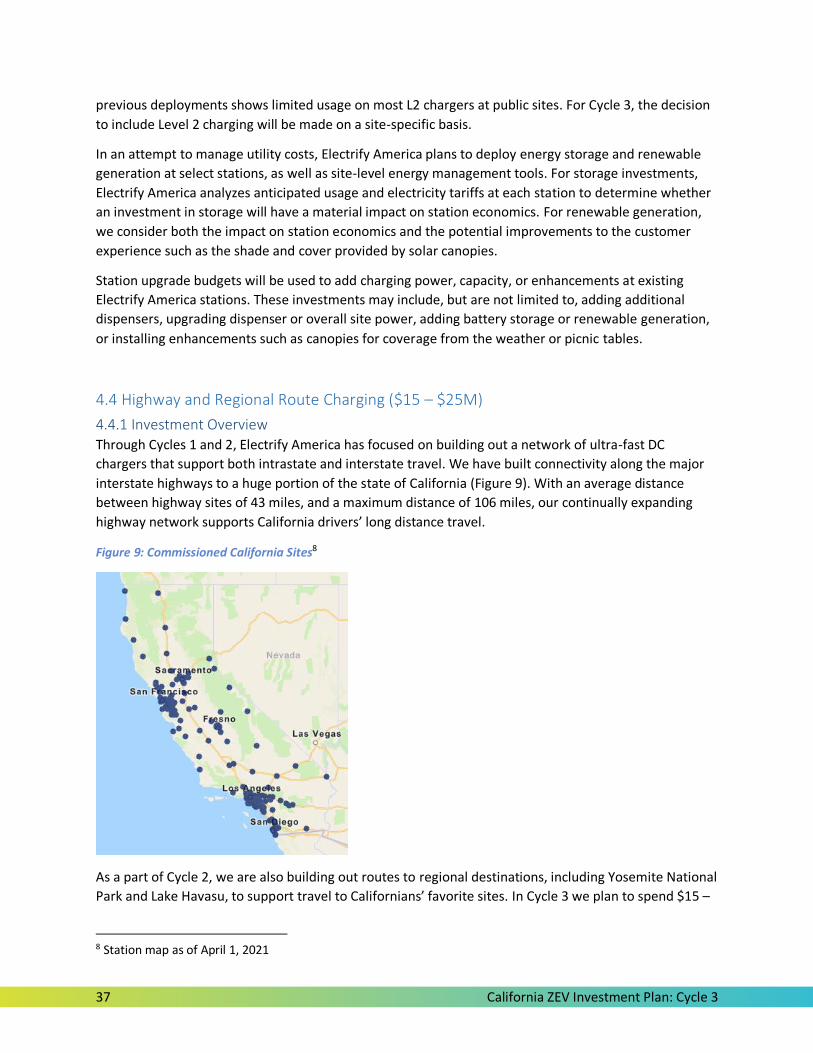
37 California ZEV Investment Plan: Cycle 3
previous deployments shows limited usage on most L2 chargers at public sites. For Cycle 3, the decision
to include Level 2 charging will be made on a site-specific basis.
In an attempt to manage utility costs, Electrify America plans to deploy energy storage and renewable
generation at select stations, as well as site-level energy management tools. For storage investments,
Electrify America analyzes anticipated usage and electricity tariffs at each station to determine whether
an investment in storage will have a material impact on station economics. For renewable generation,
we consider both the impact on station economics and the potential improvements to the customer
experience such as the shade and cover provided by solar canopies.
Station upgrade budgets will be used to add charging power, capacity, or enhancements at existing
Electrify America stations. These investments may include, but are not limited to, adding additional
dispensers, upgrading dispenser or overall site power, adding battery storage or renewable generation,
or installing enhancements such as canopies for coverage from the weather or picnic tables.
4.4 Highway and Regional Route Charging ($15 – $25M)
4.4.1 Investment Overview Through Cycles 1 and 2, Electrify America has focused on building out a network of ultra-fast DC
chargers that support both intrastate and interstate travel. We have built connectivity along the major
interstate highways to a huge portion of the state of California (Figure 9). With an average distance
between highway sites of 43 miles, and a maximum distance of 106 miles, our continually expanding
highway network supports California drivers’ long distance travel.
Figure 9: Commissioned California Sites8
As a part of Cycle 2, we are also building out routes to regional destinations, including Yosemite National
Park and Lake Havasu, to support travel to Californians’ favorite sites. In Cycle 3 we plan to spend $15 –
8 Station map as of April 1, 2021
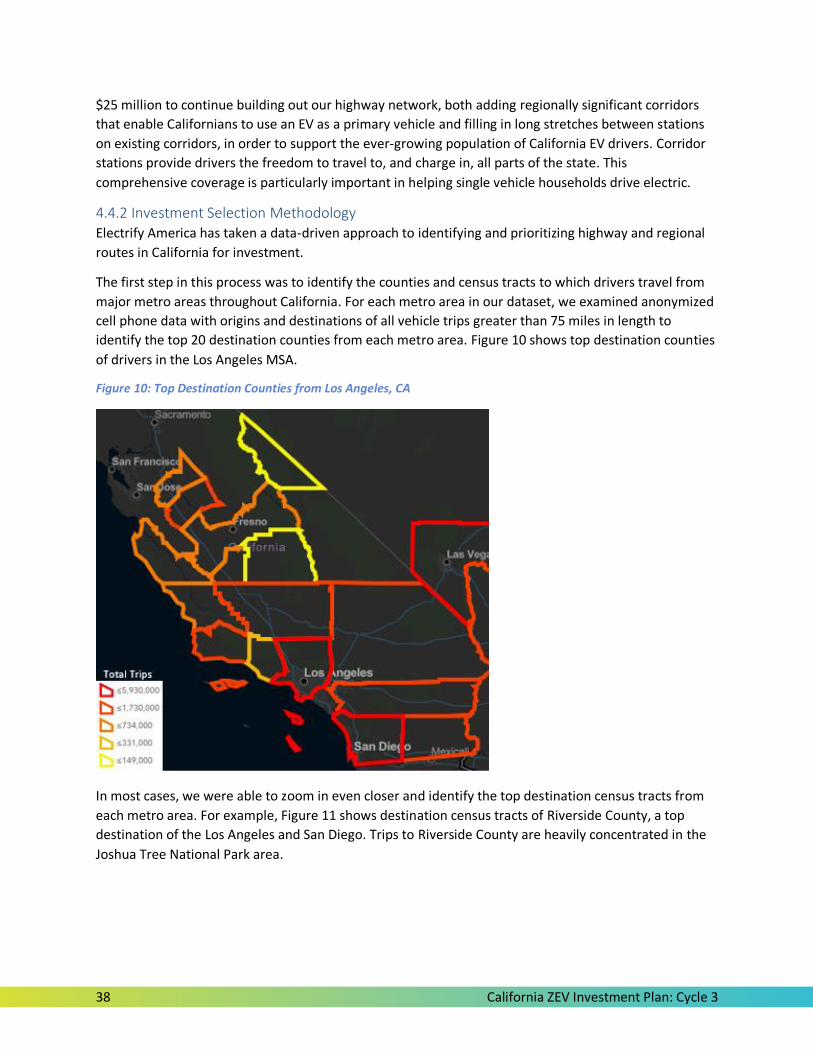
38 California ZEV Investment Plan: Cycle 3
$25 million to continue building out our highway network, both adding regionally significant corridors
that enable Californians to use an EV as a primary vehicle and filling in long stretches between stations
on existing corridors, in order to support the ever-growing population of California EV drivers. Corridor
stations provide drivers the freedom to travel to, and charge in, all parts of the state. This
comprehensive coverage is particularly important in helping single vehicle households drive electric.
4.4.2 Investment Selection Methodology Electrify America has taken a data-driven approach to identifying and prioritizing highway and regional
routes in California for investment.
The first step in this process was to identify the counties and census tracts to which drivers travel from
major metro areas throughout California. For each metro area in our dataset, we examined anonymized
cell phone data with origins and destinations of all vehicle trips greater than 75 miles in length to
identify the top 20 destination counties from each metro area. Figure 10 shows top destination counties
of drivers in the Los Angeles MSA.
Figure 10: Top Destination Counties from Los Angeles, CA
In most cases, we were able to zoom in even closer and identify the top destination census tracts from
each metro area. For example, Figure 11 shows destination census tracts of Riverside County, a top
destination of the Los Angeles and San Diego. Trips to Riverside County are heavily concentrated in the
Joshua Tree National Park area.
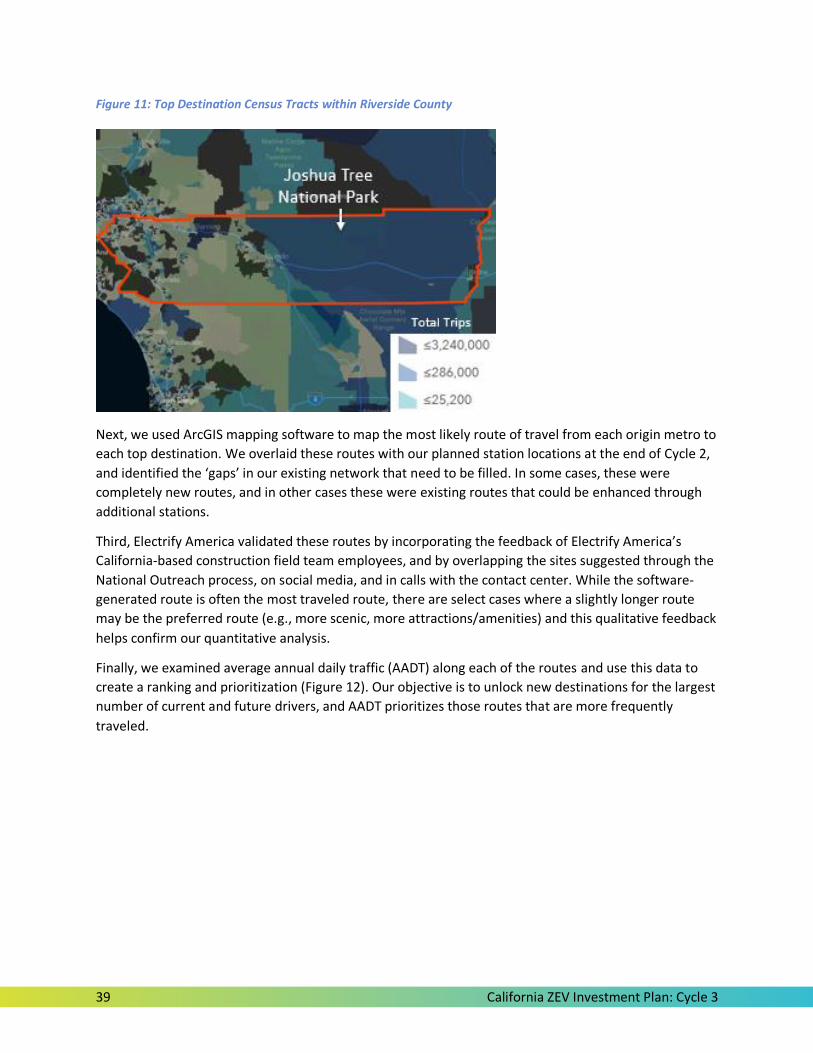
39 California ZEV Investment Plan: Cycle 3
Figure 11: Top Destination Census Tracts within Riverside County
Next, we used ArcGIS mapping software to map the most likely route of travel from each origin metro to
each top destination. We overlaid these routes with our planned station locations at the end of Cycle 2,
and identified the ‘gaps’ in our existing network that need to be filled. In some cases, these were
completely new routes, and in other cases these were existing routes that could be enhanced through
additional stations.
Third, Electrify America validated these routes by incorporating the feedback of Electrify America’s
California-based construction field team employees, and by overlapping the sites suggested through the
National Outreach process, on social media, and in calls with the contact center. While the software-
generated route is often the most traveled route, there are select cases where a slightly longer route
may be the preferred route (e.g., more scenic, more attractions/amenities) and this qualitative feedback
helps confirm our quantitative analysis.
Finally, we examined average annual daily traffic (AADT) along each of the routes and use this data to
create a ranking and prioritization (Figure 12). Our objective is to unlock new destinations for the largest
number of current and future drivers, and AADT prioritizes those routes that are more frequently
traveled.
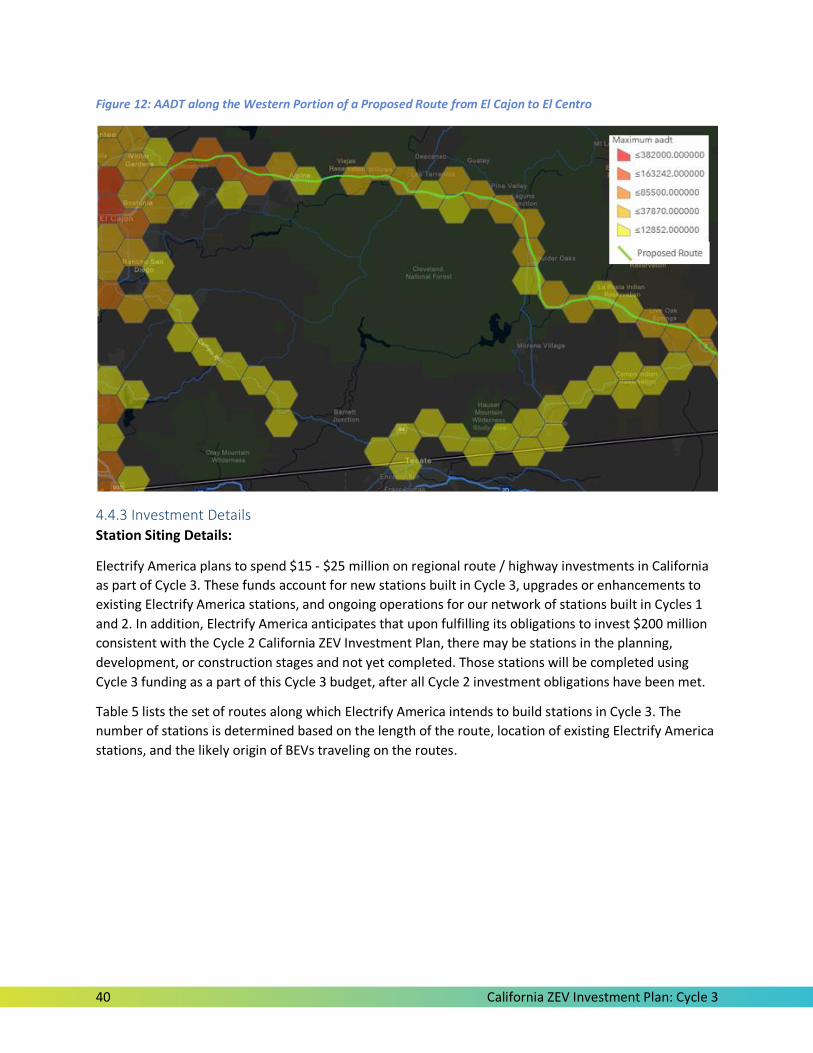
40 California ZEV Investment Plan: Cycle 3
Figure 12: AADT along the Western Portion of a Proposed Route from El Cajon to El Centro
4.4.3 Investment Details
Station Siting Details:
Electrify America plans to spend $15 - $25 million on regional route / highway investments in California
as part of Cycle 3. These funds account for new stations built in Cycle 3, upgrades or enhancements to
existing Electrify America stations, and ongoing operations for our network of stations built in Cycles 1
and 2. In addition, Electrify America anticipates that upon fulfilling its obligations to invest $200 million
consistent with the Cycle 2 California ZEV Investment Plan, there may be stations in the planning,
development, or construction stages and not yet completed. Those stations will be completed using
Cycle 3 funding as a part of this Cycle 3 budget, after all Cycle 2 investment obligations have been met.
Table 5 lists the set of routes along which Electrify America intends to build stations in Cycle 3. The
number of stations is determined based on the length of the route, location of existing Electrify America
stations, and the likely origin of BEVs traveling on the routes.
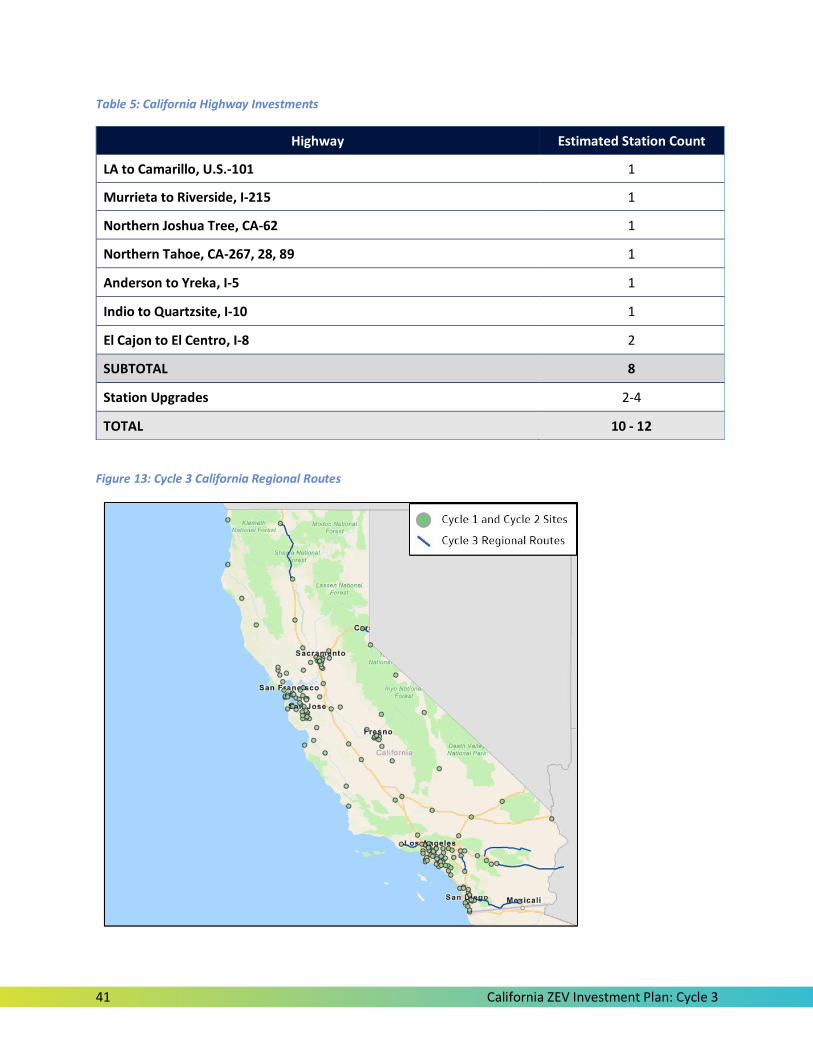
41 California ZEV Investment Plan: Cycle 3
Table 5: California Highway Investments
Figure 13: Cycle 3 California Regional Routes
Highway Estimated Station Count
LA to Camarillo, U.S.-101 1
Murrieta to Riverside, I-215 1
Northern Joshua Tree, CA-62 1
Northern Tahoe, CA-267, 28, 89 1
Anderson to Yreka, I-5 1
Indio to Quartzsite, I-10 1
El Cajon to El Centro, I-8 2
SUBTOTAL 8
Station Upgrades 2-4
TOTAL 10 - 12
42 California ZEV Investment Plan: Cycle 3
Throughout Cycle 3, Electrify America will continue analyzing charging needs throughout California. In
the event that additional highway or regional route stations are required, or that real estate or
operational challenges limit our ability to build along the proposed routes, Electrify America may opt to
add or eliminate routes at its own discretion, and consistent with the methodologies established to
guide investment within this plan.
Station Design Details
Electrify America charging stations along highways and regional routes typically employ four ultra-fast
DC fast chargers. In locations for which we anticipate high demand, Electrify America may employ up to
10 chargers. In areas with limited real estate or available power, Electrify America may opt to build as
few as two chargers in a single location.
Electrify America’s ultra-fast chargers range from 150kW to 350kW of power9 based on anticipated
needs and use cases, as well as available real estate and power.
In an attempt to manage utility costs and reduce demand charges, Electrify America plans to deploy
energy storage and renewable generation at select stations, as well as site-level energy management
tools. For storage investments, Electrify America analyzes anticipated usage and electricity tariffs at each
station site to determine whether an investment in storage will have a material impact on station
economics. For renewable generation we consider station economics, permitting and zoning limitations,
as well as the potential improvements to the customer experience such as shade/cover provided by
solar canopies.
Station upgrade budgets will be used to add charging power, capacity, or enhancements at existing
Electrify America stations. These investments may include, but are not limited to, adding additional
dispensers, upgrading dispenser or overall site power, adding battery storage or renewable generation,
or installing enhancements such as canopies for coverage from the weather or picnic tables.
4.5 Transit and Medium-Duty/ Heavy-Duty Fleet Charging ($6 – $10M)
4.5.1 Investment Overview As detailed in section 4.2.6, the MHD zero emission freight and transit sector is poised for significant
growth over the coming decade. To help spur conversion of these heavy polluting vehicles, Electrify
America will invest $6 - $10M in infrastructure to support the adoption and deployment of PEV buses
and trucks.
4.5.2 Investment Methodology Specific investments within the transit and MHD fleet infrastructure space are highly dependent on the
needs and timing of projects led by the fleet owners and disparate sources of vehicle funding. For this
reason, we are unable to identify locations or investments far in advance of committing funding for
these projects. To meet this investment commitment, Electrify America plans to work with transit
9 CHAdeMO charging at Electrify America stations is limited to 50kW, meeting the needs of the vast majority of CHAdeMO vehicles in operation today.
43 California ZEV Investment Plan: Cycle 3
agencies and MHD fleet operators over the course of Cycle 3 to identify charging needs, and associated
infrastructure investments.
Transit
For transit related investments, Electrify America will collaborate with the relevant transit agency to
develop a business model that meets all parties’ needs. Electrify America’s dual goals are to promote
ZEV adoption and to develop a long-term sustainable business. A pure ‘grant’ style of funding support
would fulfil the first goal, but would not represent a business investment sustainable for the long-term.
To ensure both goals are addressed, Electrify America will work with our transit partners to develop an
investment structure, revenue model, and station ownership structure that meets the transit agencies’
needs and also achieves Electrify America’s goals, consistent with the requirements of the ZEV
Investment Commitment and the Creditable Cost Guidance. In those areas where funding for electrical
infrastructure and make readies is available from the local utility, the California Energy Commission, or
other California agencies, Electrify America will also collaborate with the transit agency to maximize
overall investment impact.
MHD Fleets
MHD truck fleets require different types of infrastructure (charging speeds, technology) depending on
the vehicle use case. For fleets that return back to a depot or warehouse each night, behind-the-fence
dedicated infrastructure can best integrate charging into normal operations. For fleets without fixed
routes, or that may not return back to a depot each night, public or semi-public (e.g., restricted access)
stations may be more appropriate. Electrify America will work closely with truck OEMs, fleet owners and
operators and local officials and stakeholders to identify charging needs and design infrastructure to
suit.
Similar to transit, as appropriate Electrify America will work closely with fleets and operators to identify
a business model that meets the fleets’ needs and also and achieves Electrify America’s goals, consistent
with the requirements of the ZEV Investment Commitment and the Creditable Cost Guidance.
4.5.3 Investment Details The specific details of charging equipment installed for a given project will be highly dependent on the
vehicle specifications and needs, and the commercially available technology at time of deployment. At
time of writing, most buses and trucks coming to market will be capable of charging between 50 and
350kW. However, Electrify America will monitor the evolving landscape and needs of customers, and in
the event that new technology (including higher power charging such as 1MW+ or alternative
connections such as wireless charging) becomes commercially available,10 Electrify America will work
closely with fleet owners to ensure the equipment deployed is optimized for their needs.
Given the project-based nature of this investment, costs and charger counts are difficult to estimate.
However, based on information to date, a $6 - $10 million investment could look like the following in
Table 6:
10 In accordance with the ZEV Investment Commitment in 3.3.2.9 of the Partial Consent Decree, Electrify America will not use creditable funds to fund research.
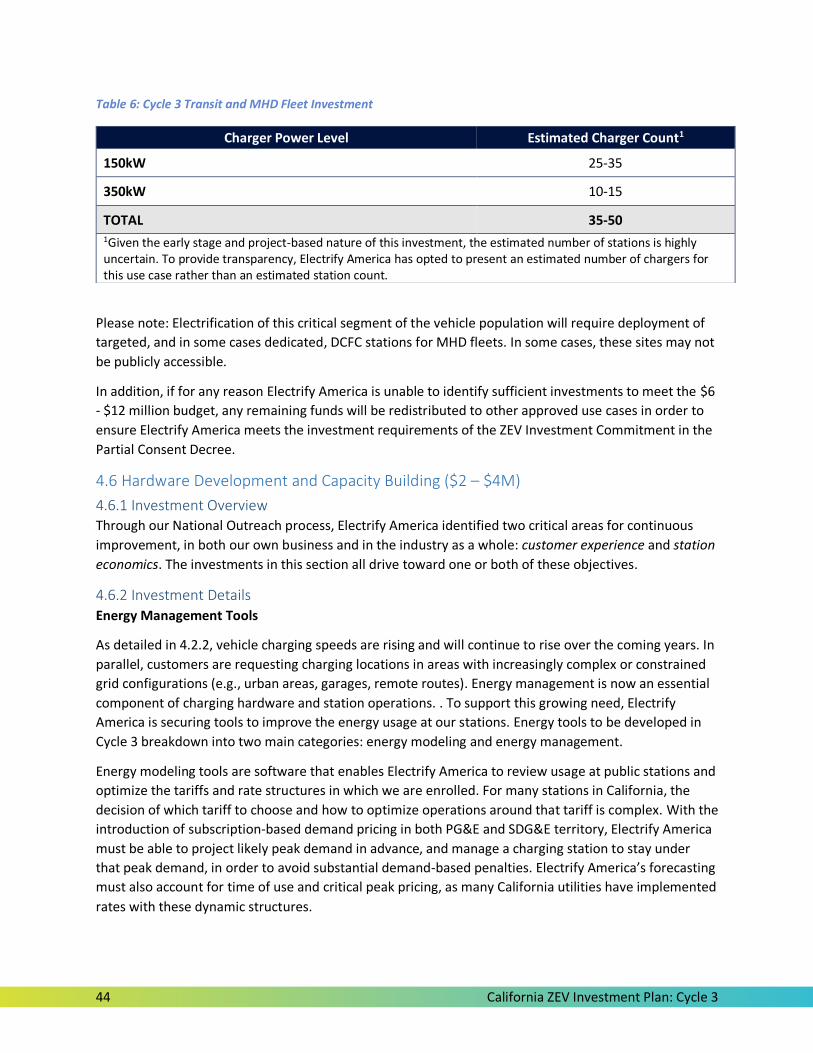
44 California ZEV Investment Plan: Cycle 3
Table 6: Cycle 3 Transit and MHD Fleet Investment
Please note: Electrification of this critical segment of the vehicle population will require deployment of
targeted, and in some cases dedicated, DCFC stations for MHD fleets. In some cases, these sites may not
be publicly accessible.
In addition, if for any reason Electrify America is unable to identify sufficient investments to meet the $6
- $12 million budget, any remaining funds will be redistributed to other approved use cases in order to
ensure Electrify America meets the investment requirements of the ZEV Investment Commitment in the
Partial Consent Decree.
4.6 Hardware Development and Capacity Building ($2 – $4M)
4.6.1 Investment Overview Through our National Outreach process, Electrify America identified two critical areas for continuous
improvement, in both our own business and in the industry as a whole: customer experience and station
economics. The investments in this section all drive toward one or both of these objectives.
4.6.2 Investment Details
Energy Management Tools
As detailed in 4.2.2, vehicle charging speeds are rising and will continue to rise over the coming years. In
parallel, customers are requesting charging locations in areas with increasingly complex or constrained
grid configurations (e.g., urban areas, garages, remote routes). Energy management is now an essential
component of charging hardware and station operations. . To support this growing need, Electrify
America is securing tools to improve the energy usage at our stations. Energy tools to be developed in
Cycle 3 breakdown into two main categories: energy modeling and energy management.
Energy modeling tools are software that enables Electrify America to review usage at public stations and
optimize the tariffs and rate structures in which we are enrolled. For many stations in California, the
decision of which tariff to choose and how to optimize operations around that tariff is complex. With the
introduction of subscription-based demand pricing in both PG&E and SDG&E territory, Electrify America
must be able to project likely peak demand in advance, and manage a charging station to stay under
that peak demand, in order to avoid substantial demand-based penalties. Electrify America’s forecasting
must also account for time of use and critical peak pricing, as many California utilities have implemented
rates with these dynamic structures.
Charger Power Level Estimated Charger Count1
150kW 25-35
350kW 10-15
TOTAL 35-50 1Given the early stage and project-based nature of this investment, the estimated number of stations is highly uncertain. To provide transparency, Electrify America has opted to present an estimated number of chargers for this use case rather than an estimated station count.
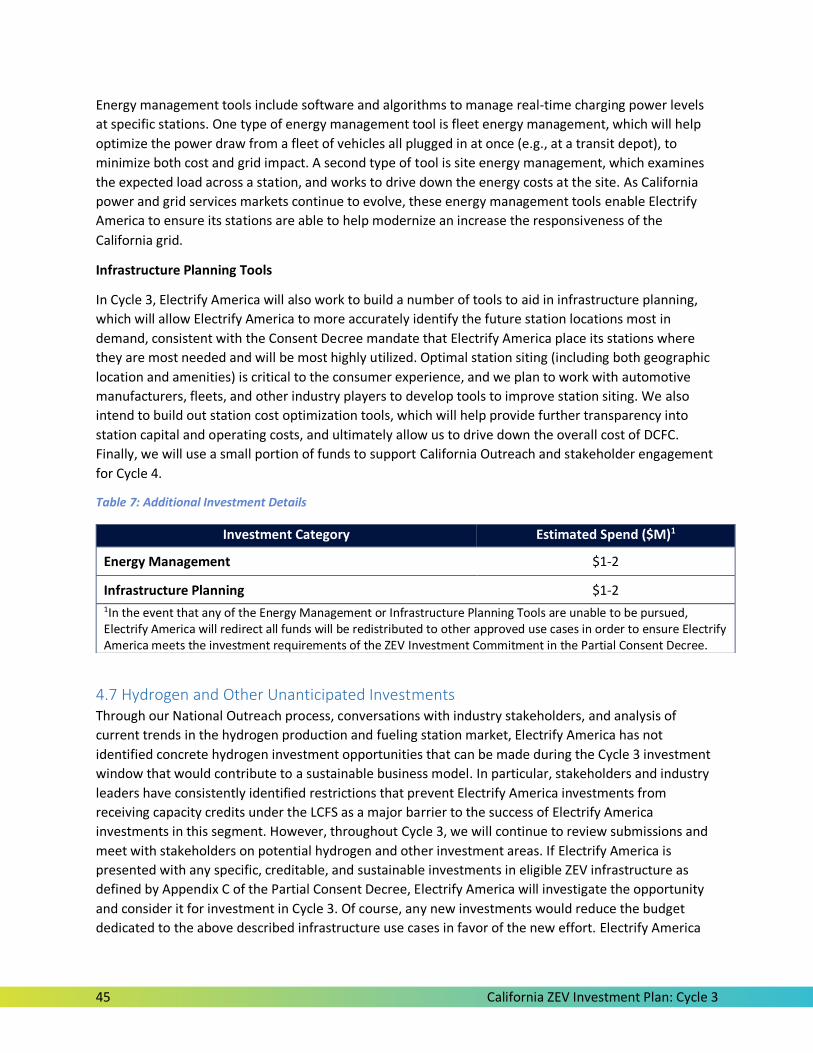
45 California ZEV Investment Plan: Cycle 3
Energy management tools include software and algorithms to manage real-time charging power levels
at specific stations. One type of energy management tool is fleet energy management, which will help
optimize the power draw from a fleet of vehicles all plugged in at once (e.g., at a transit depot), to
minimize both cost and grid impact. A second type of tool is site energy management, which examines
the expected load across a station, and works to drive down the energy costs at the site. As California
power and grid services markets continue to evolve, these energy management tools enable Electrify
America to ensure its stations are able to help modernize an increase the responsiveness of the
California grid.
Infrastructure Planning Tools
In Cycle 3, Electrify America will also work to build a number of tools to aid in infrastructure planning,
which will allow Electrify America to more accurately identify the future station locations most in
demand, consistent with the Consent Decree mandate that Electrify America place its stations where
they are most needed and will be most highly utilized. Optimal station siting (including both geographic
location and amenities) is critical to the consumer experience, and we plan to work with automotive
manufacturers, fleets, and other industry players to develop tools to improve station siting. We also
intend to build out station cost optimization tools, which will help provide further transparency into
station capital and operating costs, and ultimately allow us to drive down the overall cost of DCFC.
Finally, we will use a small portion of funds to support California Outreach and stakeholder engagement
for Cycle 4.
Table 7: Additional Investment Details
4.7 Hydrogen and Other Unanticipated Investments Through our National Outreach process, conversations with industry stakeholders, and analysis of
current trends in the hydrogen production and fueling station market, Electrify America has not
identified concrete hydrogen investment opportunities that can be made during the Cycle 3 investment
window that would contribute to a sustainable business model. In particular, stakeholders and industry
leaders have consistently identified restrictions that prevent Electrify America investments from
receiving capacity credits under the LCFS as a major barrier to the success of Electrify America
investments in this segment. However, throughout Cycle 3, we will continue to review submissions and
meet with stakeholders on potential hydrogen and other investment areas. If Electrify America is
presented with any specific, creditable, and sustainable investments in eligible ZEV infrastructure as
defined by Appendix C of the Partial Consent Decree, Electrify America will investigate the opportunity
and consider it for investment in Cycle 3. Of course, any new investments would reduce the budget
dedicated to the above described infrastructure use cases in favor of the new effort. Electrify America
Investment Category Estimated Spend ($M)1
Energy Management $1-2
Infrastructure Planning $1-2 1In the event that any of the Energy Management or Infrastructure Planning Tools are unable to be pursued, Electrify America will redirect all funds will be redistributed to other approved use cases in order to ensure Electrify America meets the investment requirements of the ZEV Investment Commitment in the Partial Consent Decree.
46 California ZEV Investment Plan: Cycle 3
would inform CARB staff of any reallocation of Cycle 3 funding to new ZEV infrastructure use cases not
included in the Cycle 3 California ZEV Investment Plan.
4.8 Infrastructure Investment Timeline and Milestones In Cycle 3, Electrify America will rely on our extensive experience from Cycles 1 and 2 in installing PEV
charging stations across the United States efficiently. Deploying DCFC stations can be complicated since
it requires substantial coordination between real estate owners, hardware vendors, construction
contractors, utilities, permitting agencies, and our own internal teams. To deliver the investments
detailed in this chapter, Electrify America undertakes a range of activities including:
Ordering equipment
Developing new property leads
Validating the suitability of multiple property leads per station
Negotiating and signing lease or license agreements (or, where appropriate, purchasing property)
Developing permitting/pre‐construction packages
Filing permits
Warehousing equipment and performing quality assurance/quality control
Securing permit approval
Preparing the station site for construction
Delivering equipment to the site
Constructing the station
Landscaping
Coordinating with the utility on the grid/inspection and any additional utility preparation including new transformers or upgraded substations
Commissioning
It can be difficult to estimate a standard timeframe required to go from securing a potential DCFC
station to having it ready for customer use due to major station by station differences in real estate
availability, utility capacity considerations, local permitting agencies’ timelines, required easements, and
other often unforeseen business factors.
To aid in efficient roll outs, Electrify America has developed national commercial agreements with major
real-estate holders including Target, Walmart, Simon Malls, Brixmor, Sheetz, Bank of America, and
others. Partnering to install stations in the parking lots of these storefronts reduces the time spent
brokering unique contract agreements, haggling over station configurations, and provides us with real
estate leads in some of the most challenging charging station siting markets. Over the course of the last
two Cycles, we have also focused on building constructive relationships with numerous local utilities and
permitting agencies. We have learned that these business to business relationships are essential for
more predictable and streamlined station deployment.
Continuing a practice already begun in Cycles 1 and 2, Electrify America will work closely with California
state agencies, including the Governor's Office of Business and Economic Development, the California
Department of Transportation, the California Energy Commission, and the California Public Utilities
Commission, to improve charging infrastructure planning and deployment, to identify station site leads,
and to improve processes such as permitting, easements, and other factors that slow down charging
infrastructure installations. State agencies will play a critical role in enforcing AB 1236, which requires all
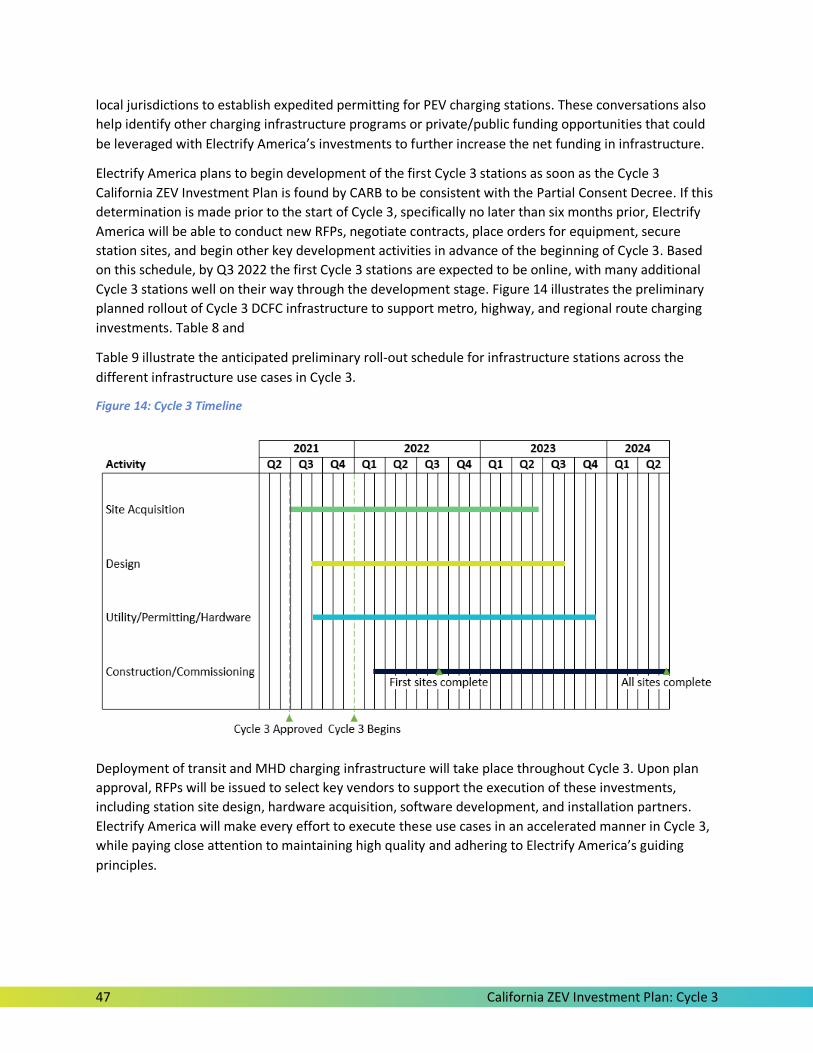
47 California ZEV Investment Plan: Cycle 3
local jurisdictions to establish expedited permitting for PEV charging stations. These conversations also
help identify other charging infrastructure programs or private/public funding opportunities that could
be leveraged with Electrify America’s investments to further increase the net funding in infrastructure.
Electrify America plans to begin development of the first Cycle 3 stations as soon as the Cycle 3
California ZEV Investment Plan is found by CARB to be consistent with the Partial Consent Decree. If this
determination is made prior to the start of Cycle 3, specifically no later than six months prior, Electrify
America will be able to conduct new RFPs, negotiate contracts, place orders for equipment, secure
station sites, and begin other key development activities in advance of the beginning of Cycle 3. Based
on this schedule, by Q3 2022 the first Cycle 3 stations are expected to be online, with many additional
Cycle 3 stations well on their way through the development stage. Figure 14 illustrates the preliminary
planned rollout of Cycle 3 DCFC infrastructure to support metro, highway, and regional route charging
investments. Table 8 and
Table 9 illustrate the anticipated preliminary roll-out schedule for infrastructure stations across the
different infrastructure use cases in Cycle 3.
Figure 14: Cycle 3 Timeline
Deployment of transit and MHD charging infrastructure will take place throughout Cycle 3. Upon plan
approval, RFPs will be issued to select key vendors to support the execution of these investments,
including station site design, hardware acquisition, software development, and installation partners.
Electrify America will make every effort to execute these use cases in an accelerated manner in Cycle 3,
while paying close attention to maintaining high quality and adhering to Electrify America’s guiding
principles.
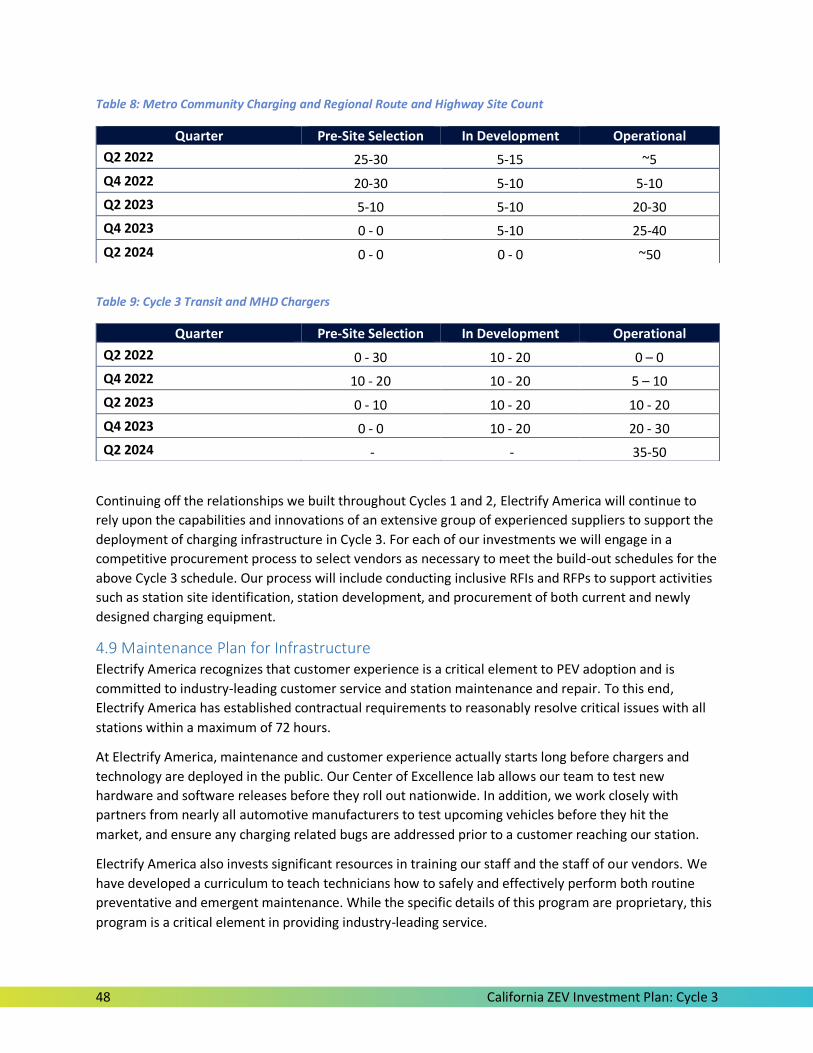
48 California ZEV Investment Plan: Cycle 3
Table 8: Metro Community Charging and Regional Route and Highway Site Count
Table 9: Cycle 3 Transit and MHD Chargers
Continuing off the relationships we built throughout Cycles 1 and 2, Electrify America will continue to
rely upon the capabilities and innovations of an extensive group of experienced suppliers to support the
deployment of charging infrastructure in Cycle 3. For each of our investments we will engage in a
competitive procurement process to select vendors as necessary to meet the build-out schedules for the
above Cycle 3 schedule. Our process will include conducting inclusive RFIs and RFPs to support activities
such as station site identification, station development, and procurement of both current and newly
designed charging equipment.
4.9 Maintenance Plan for Infrastructure Electrify America recognizes that customer experience is a critical element to PEV adoption and is
committed to industry-leading customer service and station maintenance and repair. To this end,
Electrify America has established contractual requirements to reasonably resolve critical issues with all
stations within a maximum of 72 hours.
At Electrify America, maintenance and customer experience actually starts long before chargers and
technology are deployed in the public. Our Center of Excellence lab allows our team to test new
hardware and software releases before they roll out nationwide. In addition, we work closely with
partners from nearly all automotive manufacturers to test upcoming vehicles before they hit the
market, and ensure any charging related bugs are addressed prior to a customer reaching our station.
Electrify America also invests significant resources in training our staff and the staff of our vendors. We
have developed a curriculum to teach technicians how to safely and effectively perform both routine
preventative and emergent maintenance. While the specific details of this program are proprietary, this
program is a critical element in providing industry-leading service.
Quarter Pre-Site Selection In Development Operational
Q2 2022 25-30 5-15 ~5
Q4 2022 20-30 5-10 5-10
Q2 2023 5-10 5-10 20-30
Q4 2023 0 - 0 5-10 25-40
Q2 2024 0 - 0 0 - 0 ~50
Quarter Pre-Site Selection In Development Operational
Q2 2022 0 - 30 10 - 20 0 – 0
Q4 2022 10 - 20 10 - 20 5 – 10
Q2 2023 0 - 10 10 - 20 10 - 20
Q4 2023 0 - 0 10 - 20 20 - 30
Q2 2024 - - 35-50
49 California ZEV Investment Plan: Cycle 3
All routine preventative, campaign, and emergency maintenance is conducted by a contractor we
selected through a competitive bid process. Prior to the conclusion of the contract, or as necessary,
Electrify America will solicit competitive bids to ensure no lapses in maintenance coverage for 10 years
from the Partial Consent Decree effective date. In addition, all public Cycle 3 stations will be marked
with a toll-free customer service hotline. Since our inception in 2017, our Contact Center has received
repeated praise from consumers for its customer service, and should any customers encounter issues
charging at an Electrify America station, the contact center will be able to provide support. Agents and
operators have access to real-time station status information and can perform tasks such as reviewing
unit performance history, initiating a charge, resetting a charger, or other issue resolution tasks. The
Contact Center is able to resolve the majority of customer-related issues by receiving and triaging phone
calls from customers. In 2020, the Contact Center answered 98.5% of the calls in 30 seconds or less. For
non-English speaking customers, a translation line 3-way service is available to agents to translate
between the customer and the agent.
For customer issues that require further technical assistance, Contact Center agents work with Electrify
America’s Network Operations Center (NOC) to identify a solution for the customer. The NOC team
conducts root-cause analysis of customer issues, develops solutions with hardware manufacturers,
functionally operates and monitors charging assets, supports maintenance service personnel, manages
field maintenance deliverables, drives key performance metrics, reports network trends, and works to
maximize the value of equipment and service warranties.
4.10 Pricing, Interoperability, and Open Access Electrify America plans to own and operate the vast majority of PEV infrastructure investments
proposed in this Cycle 3 ZEV Investment Plan, though select investments may be handled under
different ownership/operating structures as required for specific locations and use case needs. At
stations for which Electrify America owns and operates the infrastructure, pricing will be a function of
inputs including utility costs, station capital and operating costs, competitor pricing for subscription and
rack rate products, and gasoline equivalent prices. Electrify America will set and adjust prices as
required to reflect these inputs and drive toward a sustainable business model that always offers fair
and reasonable value to consumers.
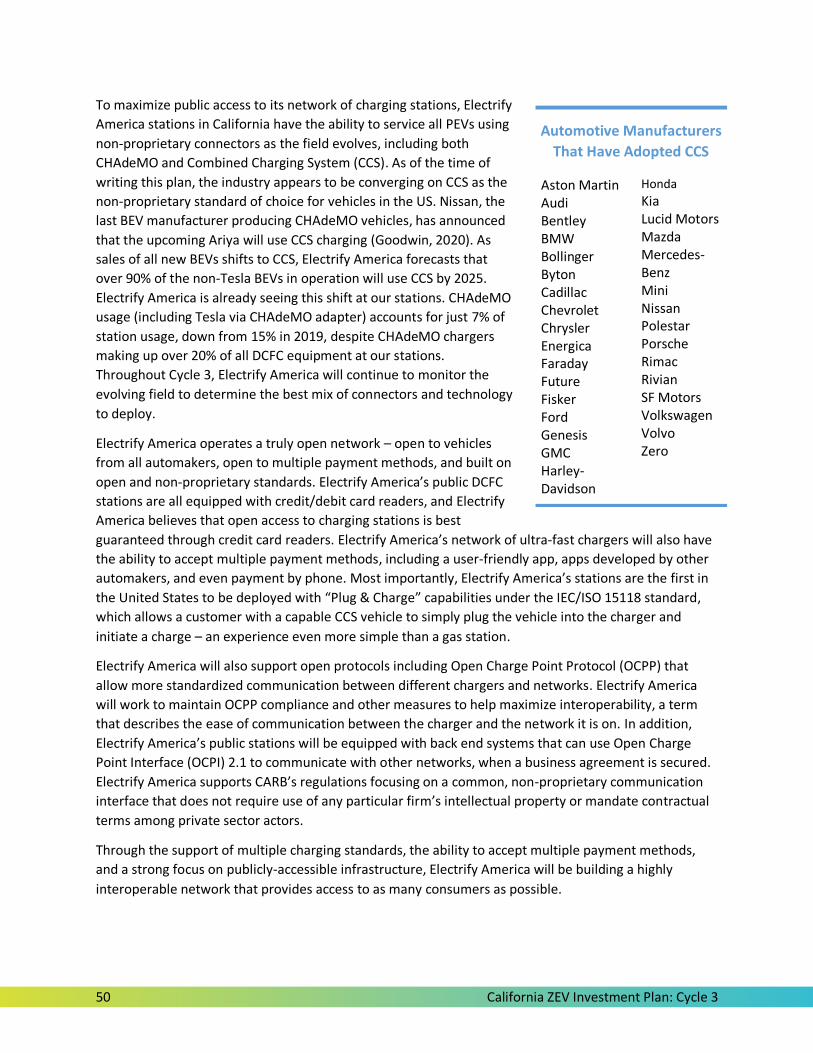
50 California ZEV Investment Plan: Cycle 3
To maximize public access to its network of charging stations, Electrify
America stations in California have the ability to service all PEVs using
non-proprietary connectors as the field evolves, including both
CHAdeMO and Combined Charging System (CCS). As of the time of
writing this plan, the industry appears to be converging on CCS as the
non-proprietary standard of choice for vehicles in the US. Nissan, the
last BEV manufacturer producing CHAdeMO vehicles, has announced
that the upcoming Ariya will use CCS charging (Goodwin, 2020). As
sales of all new BEVs shifts to CCS, Electrify America forecasts that
over 90% of the non-Tesla BEVs in operation will use CCS by 2025.
Electrify America is already seeing this shift at our stations. CHAdeMO
usage (including Tesla via CHAdeMO adapter) accounts for just 7% of
station usage, down from 15% in 2019, despite CHAdeMO chargers
making up over 20% of all DCFC equipment at our stations.
Throughout Cycle 3, Electrify America will continue to monitor the
evolving field to determine the best mix of connectors and technology
to deploy.
Electrify America operates a truly open network – open to vehicles
from all automakers, open to multiple payment methods, and built on
open and non-proprietary standards. Electrify America’s public DCFC
stations are all equipped with credit/debit card readers, and Electrify
America believes that open access to charging stations is best
guaranteed through credit card readers. Electrify America’s network of ultra-fast chargers will also have
the ability to accept multiple payment methods, including a user-friendly app, apps developed by other
automakers, and even payment by phone. Most importantly, Electrify America’s stations are the first in
the United States to be deployed with “Plug & Charge” capabilities under the IEC/ISO 15118 standard,
which allows a customer with a capable CCS vehicle to simply plug the vehicle into the charger and
initiate a charge – an experience even more simple than a gas station.
Electrify America will also support open protocols including Open Charge Point Protocol (OCPP) that
allow more standardized communication between different chargers and networks. Electrify America
will work to maintain OCPP compliance and other measures to help maximize interoperability, a term
that describes the ease of communication between the charger and the network it is on. In addition,
Electrify America’s public stations will be equipped with back end systems that can use Open Charge
Point Interface (OCPI) 2.1 to communicate with other networks, when a business agreement is secured.
Electrify America supports CARB’s regulations focusing on a common, non-proprietary communication
interface that does not require use of any particular firm’s intellectual property or mandate contractual
terms among private sector actors.
Through the support of multiple charging standards, the ability to accept multiple payment methods,
and a strong focus on publicly-accessible infrastructure, Electrify America will be building a highly
interoperable network that provides access to as many consumers as possible.
Automotive Manufacturers
That Have Adopted CCS
Aston Martin Audi Bentley BMW Bollinger Byton Cadillac Chevrolet Chrysler Energica Faraday Future Fisker Ford Genesis GMC Harley-Davidson
Honda
Kia Lucid Motors Mazda Mercedes-Benz Mini Nissan Polestar Porsche Rimac Rivian SF Motors Volkswagen Volvo Zero
51 California ZEV Investment Plan: Cycle 3
5. Public Education, Awareness, Access, and Marketing Activities (~28M)
5.1 Introduction As Electrify America embarks on building our Education, Awareness, Access, and Marketing campaigns,
the ZEV marketplace is changing. For the first time in many years, there is excitement and political will at
the federal, state, and local levels, and significant progress within the automotive industry.
Demographics and consumer attitudes are catching up with the wave of innovation. At the same time,
the industry’s growth trajectory is weighed down by tired myths and inaccuracies which continue to
cloud public perceptions and discourage consumers from making the switch to ZEVs. More work is
needed in awareness and education.
As we look ahead to Cycle 3, our marketing activities will seek to correct misconceptions while building
off of the success and lessons learned from Cycle 2.
5.2 Insights from Our National Outreach and Experience in Cycles 1 and 2 Some of history’s most successful marketing campaigns are those that not only highlight the core
attributes of the product or service itself, but also draw upon the broader context and climate of the
world at that moment. Electrify America’s National Outreach process, as described in Chapter 3,
provides some of this macro context, offering varied perspectives to complement the marketing
research Electrify America conducts for our day-to-day business. This section summarizes the marketing
insights gathered through this effort from our National Outreach website; meetings with key
stakeholders, reporters, bloggers, and social media influencers; and a thorough review of research by
academics and other leading thinkers in our industry. It also contains insights and lessons learned from
our ZEV investments to date, which have informed our thinking regarding investments in Cycle 3.
5.2.1 Insights on Brand-Neutral Messaging
Awareness of Incentive Programs Must Increase Through Education
According to the Plug-In Electric Vehicle Policy Tool developed by NASEO and Cadmus (see 4.3.1),
financial incentives are the single most effective mechanism for driving EV adoption. This is especially
true in California, where incentives often make EV adoption a financially beneficial decision – according
to an Auto Alliance analysis, the total cost of three year leases advertised in California for three models
of BEVs was lower or nearly the same as California’s incentive for low-income residents to lease a ZEV
(Alliance for Automotive Innovation, 2019).
However, to ensure these incentives have maximum impact, consumers need to know about them.
Unfortunately, a 2019 UC Davis study of consumers in Sacramento found that “Californians are largely
unaware of the state’s efforts to dramatically increase ZEV adoption” (Hardman et al., 2019). Similarly,
NREL’s PEV Showcases report notes just 34% of consumers are familiar with EV tax incentives (Singer,
2020), and a 2019 study by Morning Consult found 84% of adults said they were unsure about whether
their state offers incentives to electric vehicle buyers . While legislators and policy makers in California
have created the most robust set of vehicle and EV charging infrastructure incentives in the United
States, a myriad of programs with different qualification rules and applications make both awareness
and simplification efforts essential. This is especially true in low-income and disadvantaged
communities.
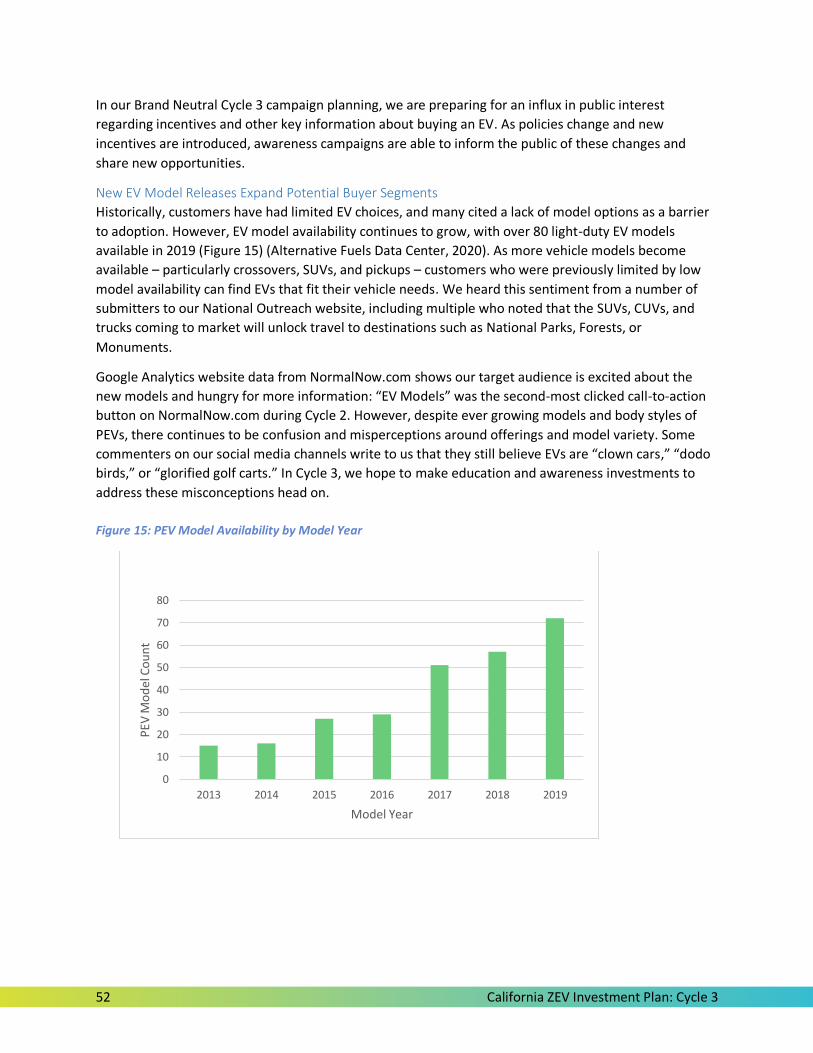
52 California ZEV Investment Plan: Cycle 3
In our Brand Neutral Cycle 3 campaign planning, we are preparing for an influx in public interest
regarding incentives and other key information about buying an EV. As policies change and new
incentives are introduced, awareness campaigns are able to inform the public of these changes and
share new opportunities.
New EV Model Releases Expand Potential Buyer Segments
Historically, customers have had limited EV choices, and many cited a lack of model options as a barrier
to adoption. However, EV model availability continues to grow, with over 80 light-duty EV models
available in 2019 (Figure 15) (Alternative Fuels Data Center, 2020). As more vehicle models become
available – particularly crossovers, SUVs, and pickups – customers who were previously limited by low
model availability can find EVs that fit their vehicle needs. We heard this sentiment from a number of
submitters to our National Outreach website, including multiple who noted that the SUVs, CUVs, and
trucks coming to market will unlock travel to destinations such as National Parks, Forests, or
Monuments.
Google Analytics website data from NormalNow.com shows our target audience is excited about the
new models and hungry for more information: “EV Models” was the second-most clicked call-to-action
button on NormalNow.com during Cycle 2. However, despite ever growing models and body styles of
PEVs, there continues to be confusion and misperceptions around offerings and model variety. Some
commenters on our social media channels write to us that they still believe EVs are “clown cars,” “dodo
birds,” or “glorified golf carts.” In Cycle 3, we hope to make education and awareness investments to
address these misconceptions head on.
Figure 15: PEV Model Availability by Model Year
0
10
20
30
40
50
60
70
80
2013 2014 2015 2016 2017 2018 2019
PEV
Mo
del
Co
un
t
Model Year
53 California ZEV Investment Plan: Cycle 3
Consumers Continue to Show Concerns about Vehicle Functionality, Even As Awareness Increases
Despite recent growth in EV models, ranges, affordability, and available charging infrastructure,
consumers continue to express concerns about whether an EV is right for them. Concerns persist across
a number of areas including:
Performance and range:
According to research by Bo MacInnis and Jon A. Krosnick at Resources for the Future,
only 26% of surveyed Americans believed that all-electric cars have better acceleration
than gasoline-powered cars, while almost as many (25%) believe that all-electric cars
have poorer acceleration than gasoline-powered cars. The research further showed that
the perception that EVs have better acceleration than gasoline-powered cars was a
statistically significant predictor of openness to purchasing all-electric cars. As these
people are more motivated to buy EVs than others and superior acceleration is in fact
an EV attribute, this study demonstrates that performance-based messaging is likely to
be very effective. (MacInnis et al., 2020). Similarly, a 2020 survey of 1000 Americans on
attitudes toward electric vehicles found that 26% of Americans think that range is the
most important factor in choosing whether to drive an EV or ICE vehicle (Archer, 2020).
Charging Anxiety and Accessibility:
MacInnis and Krosnick’s research also found that 78% of Americans perceive charging
EV batteries to be difficult, with 22% of Americans believe that charging EV batteries is
extremely difficult, 24% think it is very difficult, and 32% perceive it to be moderately
difficult. The study also showed that those who believe charging EV batteries to be
difficult are also more likely to be reluctant to buy EVs than those who believe battery
charging is slightly difficult or not difficult at all) (MacInnis et al., 2020).
A Comscore study of Electrify America’s Normal Now Cycle 2: Flight 1 campaign found
additional evidence of charging anxiety. According to the findings, as our target
audience became more familiar with EVs, there was also an increase in common
concerns around charging (+4.4% increase in concern around charge time). This might
seem counterintuitive, but as people become more aware of EVs, they have more
nuanced questions about their functionality. For example they become more concerned
about things like range, which they might not have thought of before. This suggests a
need for additional complementary messaging to assuage these concerns.
Affordability
On consumer perceptions of affordability, MacInnis and Krosnick found 22% of
Americans believe that driving EVs is more costly than driving gasoline-powered cars,
and that a perceived higher cost of maintaining an EV was a predictor of purchasing
reluctance (MacInnis et al., 2020).
Environmentalism
Finally, MacInnis and Krosnick found more than one-quarter (28%) of Americans believe
that driving an EV will not help the environment at all or that it will help the
environment “a little.” Furthermore, these buyers are approximately 40% more likely to
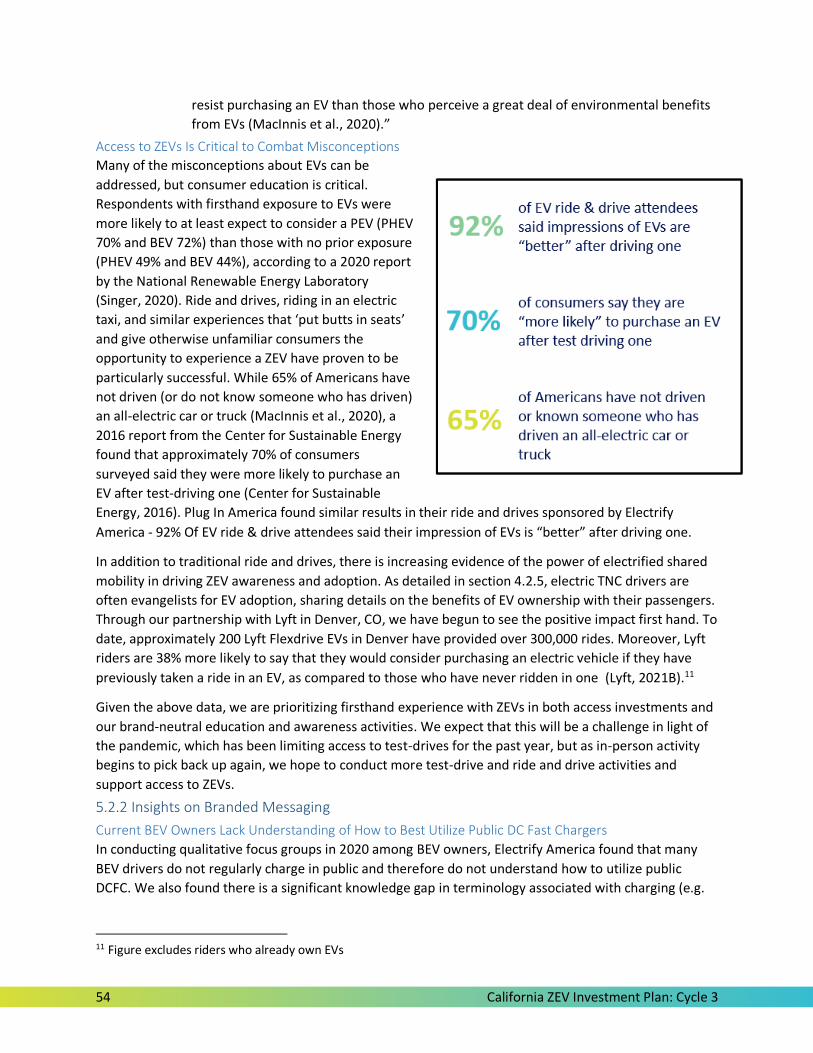
54 California ZEV Investment Plan: Cycle 3
resist purchasing an EV than those who perceive a great deal of environmental benefits
from EVs (MacInnis et al., 2020).”
Access to ZEVs Is Critical to Combat Misconceptions
Many of the misconceptions about EVs can be
addressed, but consumer education is critical.
Respondents with firsthand exposure to EVs were
more likely to at least expect to consider a PEV (PHEV
70% and BEV 72%) than those with no prior exposure
(PHEV 49% and BEV 44%), according to a 2020 report
by the National Renewable Energy Laboratory
(Singer, 2020). Ride and drives, riding in an electric
taxi, and similar experiences that ‘put butts in seats’
and give otherwise unfamiliar consumers the
opportunity to experience a ZEV have proven to be
particularly successful. While 65% of Americans have
not driven (or do not know someone who has driven)
an all-electric car or truck (MacInnis et al., 2020), a
2016 report from the Center for Sustainable Energy
found that approximately 70% of consumers
surveyed said they were more likely to purchase an
EV after test-driving one (Center for Sustainable
Energy, 2016). Plug In America found similar results in their ride and drives sponsored by Electrify
America - 92% Of EV ride & drive attendees said their impression of EVs is “better” after driving one.
In addition to traditional ride and drives, there is increasing evidence of the power of electrified shared
mobility in driving ZEV awareness and adoption. As detailed in section 4.2.5, electric TNC drivers are
often evangelists for EV adoption, sharing details on the benefits of EV ownership with their passengers.
Through our partnership with Lyft in Denver, CO, we have begun to see the positive impact first hand. To
date, approximately 200 Lyft Flexdrive EVs in Denver have provided over 300,000 rides. Moreover, Lyft
riders are 38% more likely to say that they would consider purchasing an electric vehicle if they have
previously taken a ride in an EV, as compared to those who have never ridden in one (Lyft, 2021B).11
Given the above data, we are prioritizing firsthand experience with ZEVs in both access investments and
our brand-neutral education and awareness activities. We expect that this will be a challenge in light of
the pandemic, which has been limiting access to test-drives for the past year, but as in-person activity
begins to pick back up again, we hope to conduct more test-drive and ride and drive activities and
support access to ZEVs.
5.2.2 Insights on Branded Messaging
Current BEV Owners Lack Understanding of How to Best Utilize Public DC Fast Chargers
In conducting qualitative focus groups in 2020 among BEV owners, Electrify America found that many
BEV drivers do not regularly charge in public and therefore do not understand how to utilize public
DCFC. We also found there is a significant knowledge gap in terminology associated with charging (e.g.
11 Figure excludes riders who already own EVs
55 California ZEV Investment Plan: Cycle 3
‘State of Charge’). There are many nuances to optimal use of public DCFC that are not being
communicated by OEMs and must be addressed by charging companies like Electrify America.
Customers Care about Charging Speed, Range, the Customer Experience, and Innovation
Through our social listening, qualitative analysis, and third-party research, we have gained vital insights
into the wants and needs of EV drivers and car buyers that will inform our Cycle 3 strategy. These
important takeaways have pointed us to areas for improvement and focus our branded marketing
moving forward.
● Charging Speed: We have found that many EV owners continue to believe that charging is slow
or difficult, likely due to a lack of experience using DCFC.
● Locations/Accessibility: Range anxiety among our audience is tightly tied to charger accessibility.
We receive frequent feedback on social media channels from customers requesting more
station sites. We must instill range confidence.
● Quality Customer Experience: Our customers continue to seek out reliable charging and a high-
functioning app experience, both of which we continue to optimize and communicate against
accordingly. Additionally, many customer complaints stem from user error at the charging
station (e.g., credit card issues), indicating an increased need for educational content around
using charging stations.
● Industry Innovation and Corporate Social Responsibility: The environmental impact of BEV
charging at public ultra-fast charging stations continues to be a topic of conversation among
drivers. We plan to address these concerns via our Innovation and CSR communications,
including renewable energy initiatives and a carbon offset program.
5.2.3 Insights on Channels and Strategy for Both Brand Neutral and Branded Communications
Digital Channels Are Increasingly Important
Similar to the evolution occurring in the broader marketing and advertising space, digital advertising and
social media are becoming increasingly important channels for reaching consumers. According to a 2020
Google/C-Space survey and interviews of American and European consumers, new car buyers
(consumers who do not currently have their own car and COVID-19 has influenced their decision to
consider purchasing a new car) were 1.2x more likely to turn to YouTube in their research process and
1.5x more likely than the typical car buyer (consumers who currently own a car and would like to
purchase a new car to replace it) to use social media for information about vehicles (Google, 2020).
Electrify America’s National Outreach Process submissions also highlighted a similar trend, with state
agencies in Tennessee and New York noting the importance and opportunity of digital campaigns to
tailor and target brand neutral education and awareness to local audiences.
In light of the demographics mentioned above, YouTube and other social channels are increasingly
important channels for both our brand neutral and branded marketing initiatives.
Social Media Enables Customer Success
For Electrify America, social media has become an extension of our call center, providing real-time, one-
on-one communication and improving the customer experience. Research shows that 63% of customers
expect companies to offer customer service via their social media channels, and 90% of social media
users have already used social media as a way to communicate with a brand or business (Mangles,
56 California ZEV Investment Plan: Cycle 3
2017). Social media is faster than traditional telephone outreach, can be more responsive, and is
available on the platforms where people are increasingly spending their time (Amaresan, 2020).
EV drivers love to communicate, especially on social media. Through our monitoring of social
conversations, we have found that drivers today on social media have many questions on station
locations, charger availability, amenities, and Plug & Charge. In our Cycle 3 branded marketing strategy,
and to a more limited extent in our brand neutral strategy, we plan to continue engagement with
consumers through social media.
Workforce Training and Development Is Key to Growing Institutional Industry Knowledge
Through our National Outreach Process, we heard a number of calls for workforce training related to
ZEV maintenance and EVSE maintenance and installation. Submissions suggested partnership with either
trade schools, local colleges, or high schools. The West Virginia University National Alternative Fuels
Training Consortium wrote to “encourage the inclusion of funding in the development and deployment
of standardized EV technician training curricula.” The North Central Texas Council of Governments called
for investments in technician and dealer training, and The Lion Electrify Co. suggested investment in
training activities for heavy-duty electric vehicle technicians. Electrify America recognizes the need for
further workforce training and is committed to helping educate the future leaders and workers of the EV
industry.
New Opportunities as Buyer Demographics Evolve
As the EV market matures, and the national landscape evolves from Covid-19 and other major events,
buyer demographics are shifting. In some cases, new customer segments are considering EVs that might
not have considered them in the past. For example, according to a 2020 EV Model Launch Survey
conducted by Google, as a result of COVID-19 a segment of consumers who do not currently own a car is
now considering purchase, as they opt for personal vehicles instead of public transportation. According
to the survey, relative to a typical new car buyer, these new considerers are younger, more urban, and
more open to BEVs and PHEVs.
Electrify America monitors evolving purchase behavior on a monthly basis to keep a close assessment on
how the customer set is evolving. As we craft marketing campaigns and messaging for Cycle 3, we will
optimize our media campaigns to the evolving base of both EV adopters and intenders alike.
5.3 Investment Overview
5.3.1 Marketing Framework The framework Electrify America plans to use for both its brand neutral education and awareness and
branded marketing efforts in Cycle 3 follows the same Paid, Earned, Shared, and Owned (PESO) model
used in Cycle 2. As its name implies, the PESO model relies on four distinct and complementary media
channels. These categories (described below) work in concert to maximize the effectiveness and
consistency of marketing efforts. The PESO model is comprehensive but also provides enough flexibility
to support a wide range of channel messaging. Given this, Electrify America plans to use PESO for both
its Education and Awareness and Station Utilization campaigns.
● Paid Media - Content methodically distributed based on financial compensation to place the
message and control its distribution. This includes traditional TV, radio, digital banner ads, out-
of-home (billboard) advertising, and sponsored content on social media.
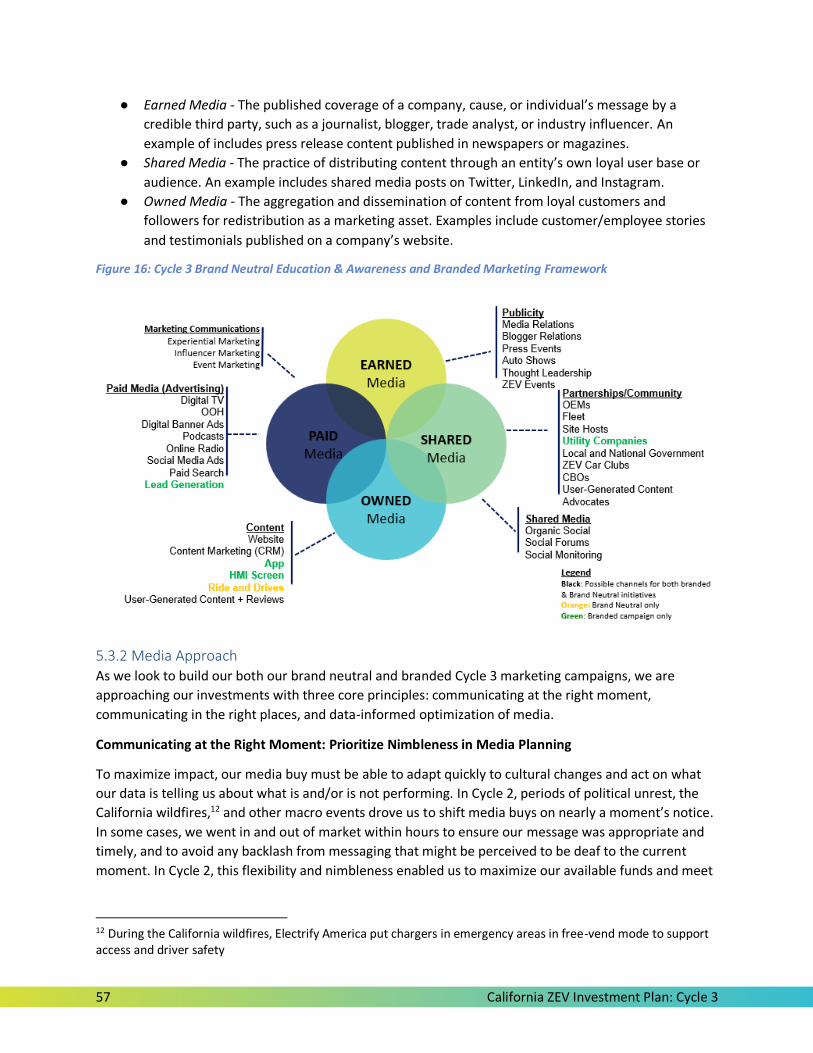
57 California ZEV Investment Plan: Cycle 3
● Earned Media - The published coverage of a company, cause, or individual’s message by a
credible third party, such as a journalist, blogger, trade analyst, or industry influencer. An
example of includes press release content published in newspapers or magazines.
● Shared Media - The practice of distributing content through an entity’s own loyal user base or
audience. An example includes shared media posts on Twitter, LinkedIn, and Instagram.
● Owned Media - The aggregation and dissemination of content from loyal customers and
followers for redistribution as a marketing asset. Examples include customer/employee stories
and testimonials published on a company’s website.
Figure 16: Cycle 3 Brand Neutral Education & Awareness and Branded Marketing Framework
5.3.2 Media Approach As we look to build our both our brand neutral and branded Cycle 3 marketing campaigns, we are
approaching our investments with three core principles: communicating at the right moment,
communicating in the right places, and data-informed optimization of media.
Communicating at the Right Moment: Prioritize Nimbleness in Media Planning
To maximize impact, our media buy must be able to adapt quickly to cultural changes and act on what
our data is telling us about what is and/or is not performing. In Cycle 2, periods of political unrest, the
California wildfires,12 and other macro events drove us to shift media buys on nearly a moment’s notice.
In some cases, we went in and out of market within hours to ensure our message was appropriate and
timely, and to avoid any backlash from messaging that might be perceived to be deaf to the current
moment. In Cycle 2, this flexibility and nimbleness enabled us to maximize our available funds and meet
12 During the California wildfires, Electrify America put chargers in emergency areas in free-vend mode to support access and driver safety
58 California ZEV Investment Plan: Cycle 3
the consumer at the right moment. In Cycle 3, Electrify America will continue this approach, leveraging
all available data and prioritizing flexible media buys.
Communicating in the Right Places: from Mass Media to Targeted Emerging Media
In Cycle 1, our primary messaging tactic was mass media, leveraging TV ads. In Cycle 2, “cord cutting,”
known as cancelling or forgoing a cable television subscription, hit record numbers, in part due to
shelter in place from COVID-19. According to new research from eMarketer, the cable, satellite and
telecom TV industry is on track to lose the most subscribers ever. In 2020, over 6 million U.S. households
will cut the cord with pay TV, bringing the total number of cord-cutter households to 31.2 million. The
analysis showed that by 2024, the number will grow even further, reaching 46.6 million total cord-cutter
households, or more than a third of all U.S. households that no longer have pay TV (Perez, 2020).
Reflecting this broader shift, we adjusted our advertising efforts to emerging media (digitization of
traditional media) such as podcasts, streaming audio, and digital TV (i.e., Hulu, Roku, and Sling TV).
In addition to audience growth, there are many benefits of using emerging media platforms, which are
outlined in the below sections. In Cycle 3, we will continue our emerging media efforts, building on Cycle
2 insights.
Data-Informed Optimization of Media
A key element of Electrify America’s success in Cycle 2 was our ability to gather data in real time (or near
real time) about the impacts of our campaigns and shift channels or messaging as necessary to maximize
impact. In Cycle 3, we plan to use similar third party measurement mechanisms, such as:
● Comscore: Comscore studies lifts in campaign key performance indicators (KPIs) (e.g.,
awareness, familiarity, purchase consideration) as measured by comparing results between
audiences who saw our campaign vs. those who did not (control group). These insights inform
overall campaign strategy, goalsetting, and optimization.
● Facebook: Facebook studies measure paid media performance and brand lift (awareness,
favorability, and intent). This information is used to optimize Facebook campaigns for video
completions, ad recall, reach, or impressions.
● Twitter: Twitter studies measure paid media performance and brand lift (awareness,
favorability, intent, and brand imagery). This information is used to optimize Twitter campaigns
for impressions, video views, and swipe-ups.
● Creative Testing: We will commission quantitative and qualitative research to study the creative
work’s likeability and clarity of message. For example, in Cycle 2, we commissioned two
quantitative surveys that reached 1,679 individuals, as well as two rounds of qualitative focus
groups including 34 individuals. These types of creative studies are used to inform campaign
concept, tagline choice, and visual approach.
● Website Testing and Analytics: We will analyze the campaign website’s Google Analytics
performance monthly, measuring total sessions, percent of new sessions, bounce rate, average
session duration, traffic sources, page visits, and on-site actions. This data will be used to
indicate areas of audience interest and overall website performance. We may also conduct
website creative testing on an as-needed basis, such as A/B testing different landing pages to
optimize for best audience engagement.
59 California ZEV Investment Plan: Cycle 3
● Paid Media Performance: We will analyze paid media performance on a monthly basis,
measuring impressions, click-through rates, video completion rates, total video views, engaged
visits, and on-site actions. This data will be used to remove lower-performing ad units from
rotation to focus spend on effective units; track performance to inform new creative.
● Paid Social Media Sentiment Analysis: We will continue to analyze comments related to our
social media on a daily basis, including both paid social ads and organic social posts. In Cycle 2,
we reviewed 4,849 comments on our social channels.
● Google Audience Insights: Through Google’s Audience Insights tool, we are able to access
information about website audience demographics, passion points, top interests, auto in-market
shopping, and geographic region. Leveraging these insights–such as passion points (e.g., value
shoppers)–allows us to optimize our messaging and media placements to meet our audience
with the right message in the right place.
5.4 Brand Neutral Campaign: Boosting ZEV Adoption through Education and Awareness
(~$14M)
5.4.1 Brand Neutral Campaign: Strategy & Audience Similar to Cycle 2, this cycle we intend to increase public awareness and interest in ZEVs in California
through educational marketing, ride and drives, and other experiential marketing. However, we will be
shifting the focus of our attention from a ‘pull’ strategy of bringing customers to our brand neutral
campaign page to a ‘push’ strategy in which we are pushing educational content directly to the
consumer through their existing media channels.
In Cycle 2, we launched NormalNow.com to help inform consumers about ZEVs, dispel common
consumer myths, and provide tools for consumers to research and ultimately purchase ZEVs. The
website has been quite successful, garnering over two million website visitors in Cycle 2. While we have
been successful in driving our target audience to learn more through NormalNow.com, we see an
opportunity to increase our reach and impact by surfacing educational content directly on both
emerging and traditional media outlets.
With this in mind, in Cycle 3 we look to include more educational content and culturally relevant
communications in our emerging omni-channel media marketing. The goal is to counter common
misconceptions without requiring our target audience to visit a website. While an educational microsite
will remain active, we believe that surfacing the educational messaging in the paid marketing
communications will reduce the number of clicks required before learning key facts, and ultimately have
a more immediate impact on the audience.
With respect to our target audience, in Cycle 3 we aim to increase awareness among Americans who are
unfamiliar with ZEVs, and promote adoption among those considering purchasing a new vehicle. We
plan to utilize Google Audience Insights and NormalNow.com performance analytics to ensure we are
delivering our message in a manner that meets the media habits and content interests of our audience.
We also plan to deliver content in languages other than English to ensure our message can reach as
broad an audience as possible.
5.4.2 Brand Neutral Campaign: Communication Pillars Electrify America’s communication pillars will remain relatively consistent between Cycles 2 and 3.
Despite campaigns from Electrify America and dozens of other players across the industry, past
60 California ZEV Investment Plan: Cycle 3
campaign performance and research indicate that these pillars remain essential to overcoming EV
misconceptions (see Section 5.2.1). Additionally, Electrify America feels that Cycle 2 was not able to fully
tackle each pillar due to the complications caused by the COVID-19 pandemic, which halted ride and
drives, canceled auto shows, and pushed back OEM model launches. In Cycle 3, Electrify America plans
to use the PESO model as the basis for our communication tactics in this campaign. See Section 5.3.1 for
details.
The campaign will feature the following pillars:
Performance:
a. Range: Most BEVs can drive over 200 miles on a single charge—with some up to
500.
b. Fun to Drive: EVs are fun to drive with instant torque, a silent motor, and great
handling resulting from the low center of gravity. Handling remains a key factor in
purchasing decisions among car buyers.
Charging Availability: With a home charger, you just plug in your EV overnight and wake up
to a full charge in the morning. When you need to charge away from home, public fast-
charging stations are located all across the country.
Affordability: On average, BEV fuel costs are about half as much as fuel for an ICE vehicle,
and federal, state, and local incentives can help make the initial vehicle purchase more
affordable, especially for those of low and moderate income.
Models: With many new EV models that include SUVs, sedans, hatchbacks, trucks, and
luxury vehicles, it’s easy to find one that’s right for you.
Environmental Impact: New to Cycle 3’s communication pillars is environmental impact — a
subject of recurring conversation among our audience on social.
a. PEVs can help keep your town and your world clean. In general, PEVs produce fewer
emissions that contribute to climate change and smog than conventional vehicles
(U.S. Department of Energy, 2020).
b. All vehicles produce substantial life cycle emissions, and calculating them is
complex. However, EVs typically produce fewer life cycle emissions than
conventional vehicles because most emissions are lower for electricity generation
than burning gasoline or diesel (U.S. Department of Energy, 2020).
More than 35% of the California media buy will continue to be targeted in LIC/DAC zip codes.
Organizations that request funding with a mission to drive ZEV adoption in LIC/DAC census tracts will be
considered additional investments to our community-based commitment.
In addition to our standard media campaigns, Electrify America’s Cycle 1 and Cycle 2 experience has
demonstrated that local organizations, community groups, and other non-profit organizations are often
the best communicators of the messaging pillars identified above within their communities, and they
are able to reach populations that a larger campaign would struggle to reach. Therefore, in Cycle 3
Electrify America will also continue to sponsor the great and effective work of other organizations.
● Membership and Sponsorship of Local Activities, Education, Training, and Ride and Drives:
Electrify America will again support organizations that facilitate ZEV adoption in low-income and
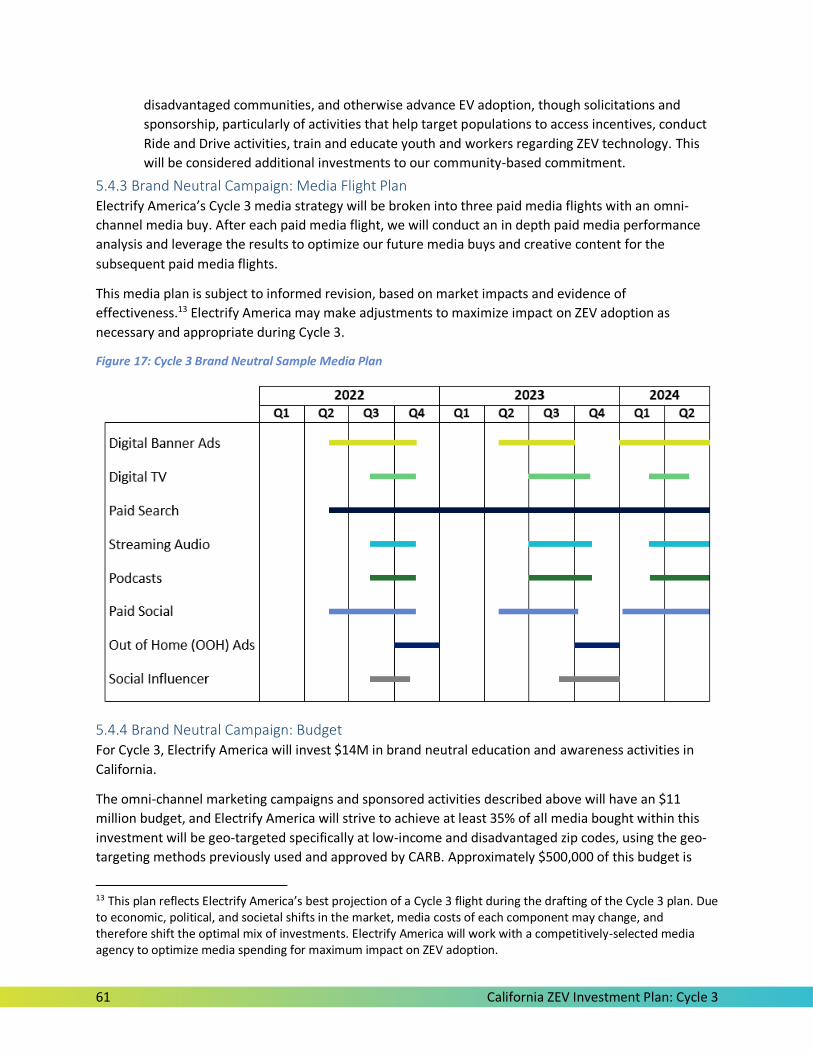
61 California ZEV Investment Plan: Cycle 3
disadvantaged communities, and otherwise advance EV adoption, though solicitations and
sponsorship, particularly of activities that help target populations to access incentives, conduct
Ride and Drive activities, train and educate youth and workers regarding ZEV technology. This
will be considered additional investments to our community-based commitment.
5.4.3 Brand Neutral Campaign: Media Flight Plan Electrify America’s Cycle 3 media strategy will be broken into three paid media flights with an omni-
channel media buy. After each paid media flight, we will conduct an in depth paid media performance
analysis and leverage the results to optimize our future media buys and creative content for the
subsequent paid media flights.
This media plan is subject to informed revision, based on market impacts and evidence of
effectiveness.13 Electrify America may make adjustments to maximize impact on ZEV adoption as
necessary and appropriate during Cycle 3.
Figure 17: Cycle 3 Brand Neutral Sample Media Plan
5.4.4 Brand Neutral Campaign: Budget For Cycle 3, Electrify America will invest $14M in brand neutral education and awareness activities in
California.
The omni-channel marketing campaigns and sponsored activities described above will have an $11
million budget, and Electrify America will strive to achieve at least 35% of all media bought within this
investment will be geo-targeted specifically at low-income and disadvantaged zip codes, using the geo-
targeting methods previously used and approved by CARB. Approximately $500,000 of this budget is
13 This plan reflects Electrify America’s best projection of a Cycle 3 flight during the drafting of the Cycle 3 plan. Due to economic, political, and societal shifts in the market, media costs of each component may change, and therefore shift the optimal mix of investments. Electrify America will work with a competitively-selected media agency to optimize media spending for maximum impact on ZEV adoption.
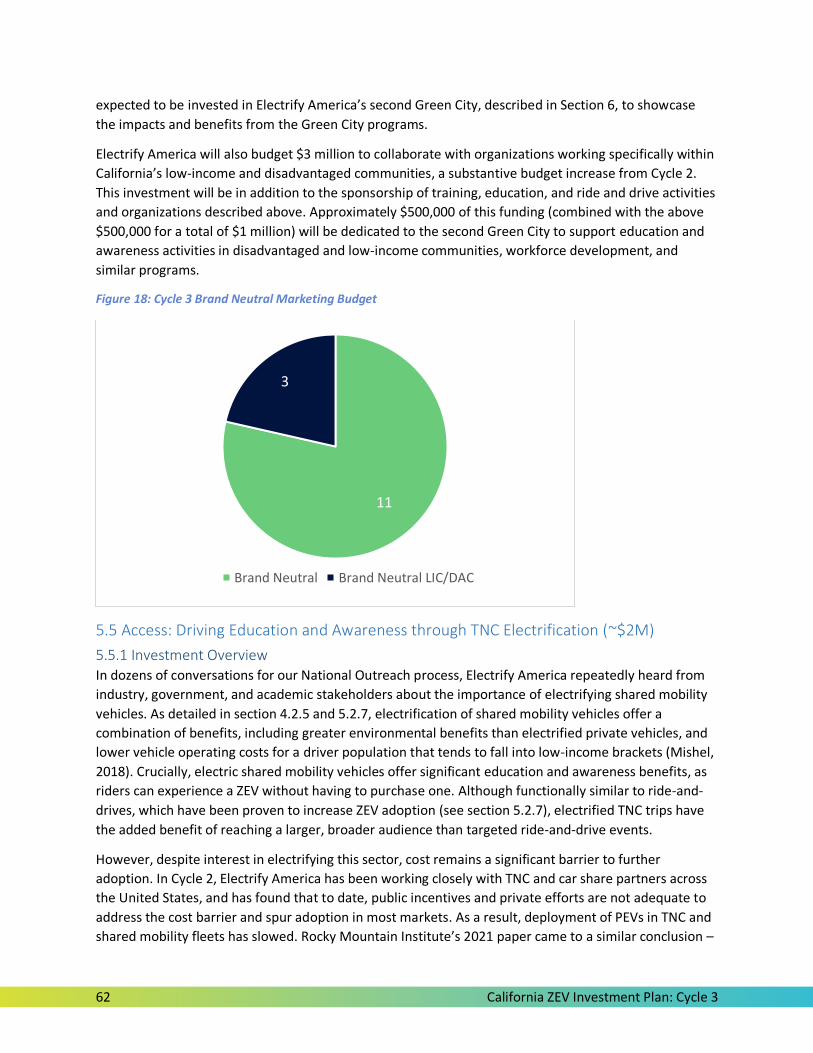
62 California ZEV Investment Plan: Cycle 3
expected to be invested in Electrify America’s second Green City, described in Section 6, to showcase
the impacts and benefits from the Green City programs.
Electrify America will also budget $3 million to collaborate with organizations working specifically within
California’s low-income and disadvantaged communities, a substantive budget increase from Cycle 2.
This investment will be in addition to the sponsorship of training, education, and ride and drive activities
and organizations described above. Approximately $500,000 of this funding (combined with the above
$500,000 for a total of $1 million) will be dedicated to the second Green City to support education and
awareness activities in disadvantaged and low-income communities, workforce development, and
similar programs.
Figure 18: Cycle 3 Brand Neutral Marketing Budget
5.5 Access: Driving Education and Awareness through TNC Electrification (~$2M)
5.5.1 Investment Overview In dozens of conversations for our National Outreach process, Electrify America repeatedly heard from
industry, government, and academic stakeholders about the importance of electrifying shared mobility
vehicles. As detailed in section 4.2.5 and 5.2.7, electrification of shared mobility vehicles offer a
combination of benefits, including greater environmental benefits than electrified private vehicles, and
lower vehicle operating costs for a driver population that tends to fall into low-income brackets (Mishel,
2018). Crucially, electric shared mobility vehicles offer significant education and awareness benefits, as
riders can experience a ZEV without having to purchase one. Although functionally similar to ride-and-
drives, which have been proven to increase ZEV adoption (see section 5.2.7), electrified TNC trips have
the added benefit of reaching a larger, broader audience than targeted ride-and-drive events.
However, despite interest in electrifying this sector, cost remains a significant barrier to further
adoption. In Cycle 2, Electrify America has been working closely with TNC and car share partners across
the United States, and has found that to date, public incentives and private efforts are not adequate to
address the cost barrier and spur adoption in most markets. As a result, deployment of PEVs in TNC and
shared mobility fleets has slowed. Rocky Mountain Institute’s 2021 paper came to a similar conclusion –
11
3
Brand Neutral Brand Neutral LIC/DAC
63 California ZEV Investment Plan: Cycle 3
in many markets across the country, BEVs are not yet cost competitive options for TNC drivers (McLane
et al., 2021). While vehicle prices are falling, and will continue to fall over the coming decade, action is
needed in order to kick start this critical segment of the industry.
The second barrier to adoption by TNC and taxi drivers is limited infrastructure. According to a 2020
study by Angela Sanguinetti and Ken Kurani at UC Davis, over 50% of existing PEV TNC drivers cited more
charger locations as one of their top three choices for how to improve the experience of driving a PEV
for TNC. This sentiment is echoed in Rocky Mountain Institute’s 2021 paper, as well as in the
experiences of the electric taxis in Washington, DC which lost out on substantial earnings opportunity
due to insufficient charging locations (Di Caro, 2017).
To address this gap, Electrify America is planning to invest $2 million in funds to incentivize the purchase
and deployment of electric taxis and TNC vehicles in fleets that provide access to sufficient and
adequate charging. Electrify America estimated that this funding will reduce the costs of EVs sufficiently
to enable between 500 – 1,000 vehicles into California markets. Based on estimates from deployment of
EVs in the Lyft ExpressDrive program in Denver, these additional EVs could provide one to three million
EV rides per year.
5.5.2 Investment Details To deploy the $2 million as effectively and efficiently as possible, Electrify America plans to conduct an
RFP to major TNC leasing and taxi companies to solicit proposals for use of the funds. Respondents will
be asked to propose the number and type of vehicles that will be deployed,14 the specific metros for
deployment, and the expected pricing for drivers to use the vehicles. In addition, respondents will be
asked to propose a mechanism for passenger education.
Electrify America aims to deploy this capital quickly, and we intend to issue the RFP in the first year of
Cycle 3. We believe that the faster we can deploy the vehicles, the faster we can boost exposure to ZEVs
and drive ZEV adoption.
As this is primarily an education and awareness activity, if for any reason Electrify America is unable to
deploy all or part of the funding as part of this program, we will redirect this budget to approved brand
neutral education and awareness investments.
5.6 Branded Campaign: Boosting Station Utilization through Branded Marketing (~$12M) As part of Cycle 3, Electrify America will engage in a branded marketing campaign intended to drive
station utilization. High utilization is a key objective of the Partial Consent Decree and helps ensure
sustainability of the infrastructure and network beyond the 10-year ZEV Investment Commitment. The
branded campaign is built on communication pillars captured directly from the voice of the EV driver. In
Cycle 2, we have leveraged voice of the customer data by the way of PlugShare comments, social media
sentiment (over 80,000 comments), focus groups (over met with 330 EV driver & Intenders), and third
party research to shape our communication pillars. The communication pillars are tailored to drive
station utilization.
14 Vendors will have the ability to select a desired vehicle make or model, assuming vehicle range and charging speed are sufficient for use as a taxi or TNC vehicle and vehicle cost after incorporating the incentive is competitive with an internal combustion alternative.
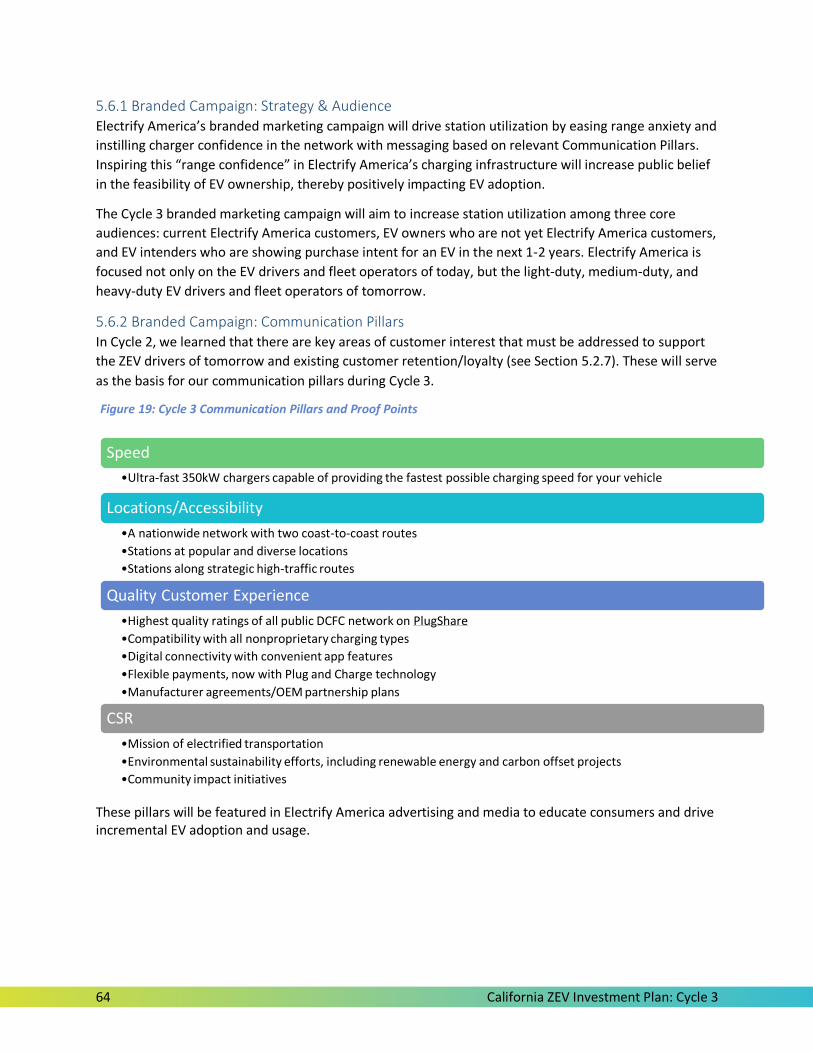
64 California ZEV Investment Plan: Cycle 3
5.6.1 Branded Campaign: Strategy & Audience Electrify America’s branded marketing campaign will drive station utilization by easing range anxiety and
instilling charger confidence in the network with messaging based on relevant Communication Pillars.
Inspiring this “range confidence” in Electrify America’s charging infrastructure will increase public belief
in the feasibility of EV ownership, thereby positively impacting EV adoption.
The Cycle 3 branded marketing campaign will aim to increase station utilization among three core
audiences: current Electrify America customers, EV owners who are not yet Electrify America customers,
and EV intenders who are showing purchase intent for an EV in the next 1-2 years. Electrify America is
focused not only on the EV drivers and fleet operators of today, but the light-duty, medium-duty, and
heavy-duty EV drivers and fleet operators of tomorrow.
5.6.2 Branded Campaign: Communication Pillars In Cycle 2, we learned that there are key areas of customer interest that must be addressed to support
the ZEV drivers of tomorrow and existing customer retention/loyalty (see Section 5.2.7). These will serve
as the basis for our communication pillars during Cycle 3.
These pillars will be featured in Electrify America advertising and media to educate consumers and drive incremental EV adoption and usage.
Speed
•Ultra-fast 350kW chargers capable of providing the fastest possible charging speed for your vehicle
Locations/Accessibility
•A nationwide network with two coast-to-coast routes
•Stations at popular and diverse locations
•Stations along strategic high-traffic routes
Quality Customer Experience
•Highest quality ratings of all public DCFC network on PlugShare
•Compatibility with all nonproprietary charging types
•Digital connectivity with convenient app features
•Flexible payments, now with Plug and Charge technology
•Manufacturer agreements/OEM partnership plans
CSR
•Mission of electrified transportation
•Environmental sustainability efforts, including renewable energy and carbon offset projects
•Community impact initiatives
Figure 19: Cycle 3 Communication Pillars and Proof Points
65 California ZEV Investment Plan: Cycle 3
6. Green Cities 2 ($25M)
6.1 Green Cities Background As part of Volkswagen’s agreement in the Partial Consent Decree entered by the U.S. District Court for
the Northern District of California on October 25, 2016, and in the Second California Partial Consent
Decree entered by the U.S. District Court for the Northern District of California on May 17, 2017,
Electrify America is committed to delivering two Green City efforts in California over the 10 year
settlement term.
The Green City is defined in Second California Partial Consent Decree as an initiative “including, but not
limited to: the operation of ZEV car sharing services, zero emission transit applications, and zero
emission freight transport projects.” Moreover, the second of the two Green City initiatives is to be in a
community “with a population of approximately 500,000 that predominately consists of Disadvantaged
Communities […].”
CARB’s February 2017 guidance to Electrify America further highlights that “The ‘Green City’ initiative in
California includes investments that promote a broad conceptual transformation of transportation
systems to ZEVs within a given city using ZEV car share, zero emission transit, zero emission freight, and
other innovative strategies such as a fully electrified public parking garage within a concentrated area to
showcase the benefits of ZEVs” (California Air Resources Board, 2017).
Under this guidance, Electrify America successfully implemented its first Green City initiative in
Sacramento as part of Cycle 1. Investments in Sacramento included three ZEV car share programs
(Envoy, GIG Car Share, and AAA Car Subscription), a zero emission bus service, a ZEV on-demand shuttle
program, and 13 public DCFC stations supporting local travel in and around the city. These investments
have already had a major impact on the Sacramento region, resulting in more than three million EV
miles traveled collectively between the car share services, and a strong focus on ZEV mobility access in
low-income and disadvantaged communities.
Through our Green City 1 initiative we learned a tremendous amount about how to successfully
implement such an enormous initiative, and are excited to bring these lessons into our Green City 2
plans. In particular, as Sacramento noted in its National Outreach submission, Electrify America’s
“provision of a dedicated Green City team with technical expertise, commitment, passion, and
significant ongoing collaboration with the City, vendors, and local partners during all phases of the
investment” was a key to the success of the initiative. The City also detailed other factors they believe
were critical for success including strong political leadership, a streamlined regulatory environment,
supportive policies, involvement of city staff and leadership in decision-making, and funding local
outreach.
6.2 Approach to City and Investment Type Selection In planning our second Green City, we have taken a multi-step approach to identify both the specific
types of investment and the geographic area. The first step was to identify which of the allowable Green
City investments types had the greatest potential to transform the community, meet a substantial and
concrete need, demonstrate innovation, and have the economic sustainability necessary to serve the
community for many years to come. Following this, we identified those geographic areas in California
that both meet the minimum criteria for a Green City, and also have the relevant facilities, industries,
and services that would benefit most from the investments Electrify America planned to make. Our
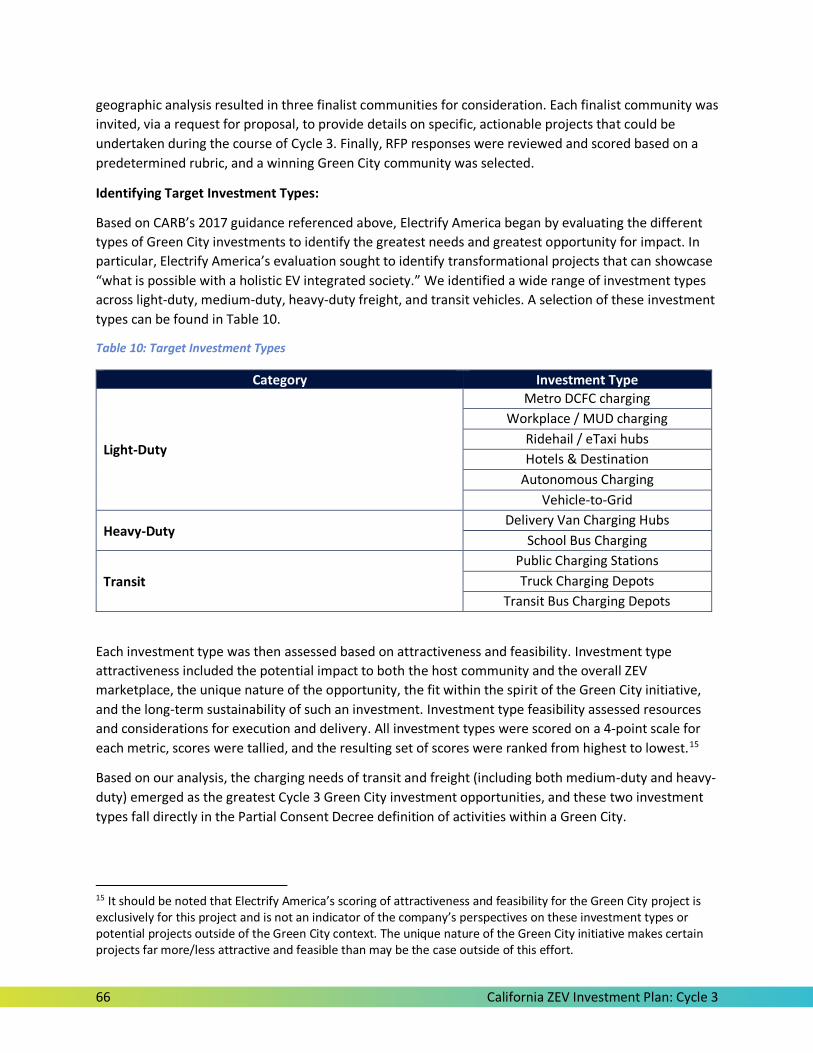
66 California ZEV Investment Plan: Cycle 3
geographic analysis resulted in three finalist communities for consideration. Each finalist community was
invited, via a request for proposal, to provide details on specific, actionable projects that could be
undertaken during the course of Cycle 3. Finally, RFP responses were reviewed and scored based on a
predetermined rubric, and a winning Green City community was selected.
Identifying Target Investment Types:
Based on CARB’s 2017 guidance referenced above, Electrify America began by evaluating the different
types of Green City investments to identify the greatest needs and greatest opportunity for impact. In
particular, Electrify America’s evaluation sought to identify transformational projects that can showcase
“what is possible with a holistic EV integrated society.” We identified a wide range of investment types
across light-duty, medium-duty, heavy-duty freight, and transit vehicles. A selection of these investment
types can be found in Table 10.
Table 10: Target Investment Types
Each investment type was then assessed based on attractiveness and feasibility. Investment type
attractiveness included the potential impact to both the host community and the overall ZEV
marketplace, the unique nature of the opportunity, the fit within the spirit of the Green City initiative,
and the long-term sustainability of such an investment. Investment type feasibility assessed resources
and considerations for execution and delivery. All investment types were scored on a 4-point scale for
each metric, scores were tallied, and the resulting set of scores were ranked from highest to lowest.15
Based on our analysis, the charging needs of transit and freight (including both medium-duty and heavy-
duty) emerged as the greatest Cycle 3 Green City investment opportunities, and these two investment
types fall directly in the Partial Consent Decree definition of activities within a Green City.
15 It should be noted that Electrify America’s scoring of attractiveness and feasibility for the Green City project is exclusively for this project and is not an indicator of the company’s perspectives on these investment types or potential projects outside of the Green City context. The unique nature of the Green City initiative makes certain projects far more/less attractive and feasible than may be the case outside of this effort.
Category Investment Type
Light-Duty
Metro DCFC charging
Workplace / MUD charging
Ridehail / eTaxi hubs
Hotels & Destination
Autonomous Charging
Vehicle-to-Grid
Heavy-Duty Delivery Van Charging Hubs
School Bus Charging
Transit
Public Charging Stations
Truck Charging Depots
Transit Bus Charging Depots
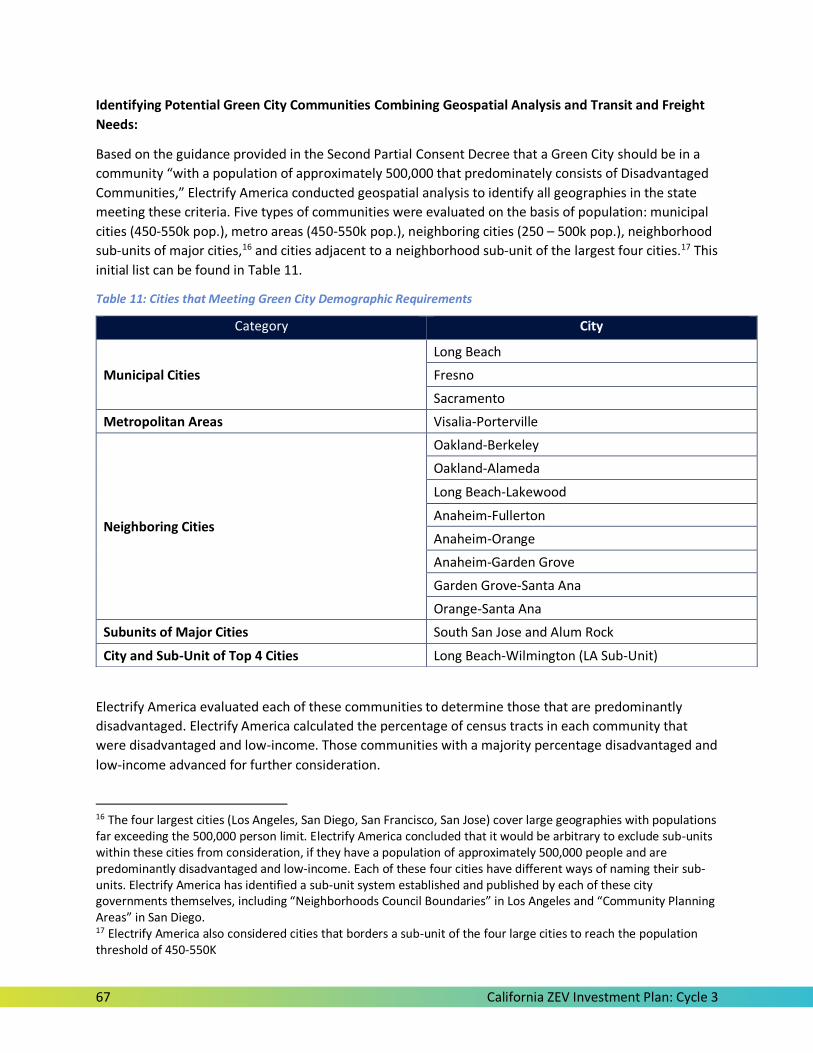
67 California ZEV Investment Plan: Cycle 3
Identifying Potential Green City Communities Combining Geospatial Analysis and Transit and Freight
Needs:
Based on the guidance provided in the Second Partial Consent Decree that a Green City should be in a
community “with a population of approximately 500,000 that predominately consists of Disadvantaged
Communities,” Electrify America conducted geospatial analysis to identify all geographies in the state
meeting these criteria. Five types of communities were evaluated on the basis of population: municipal
cities (450-550k pop.), metro areas (450-550k pop.), neighboring cities (250 – 500k pop.), neighborhood
sub-units of major cities,16 and cities adjacent to a neighborhood sub-unit of the largest four cities.17 This
initial list can be found in Table 11.
Table 11: Cities that Meeting Green City Demographic Requirements
Electrify America evaluated each of these communities to determine those that are predominantly
disadvantaged. Electrify America calculated the percentage of census tracts in each community that
were disadvantaged and low-income. Those communities with a majority percentage disadvantaged and
low-income advanced for further consideration.
16 The four largest cities (Los Angeles, San Diego, San Francisco, San Jose) cover large geographies with populations far exceeding the 500,000 person limit. Electrify America concluded that it would be arbitrary to exclude sub-units within these cities from consideration, if they have a population of approximately 500,000 people and are predominantly disadvantaged and low-income. Each of these four cities have different ways of naming their sub-units. Electrify America has identified a sub-unit system established and published by each of these city governments themselves, including “Neighborhoods Council Boundaries” in Los Angeles and “Community Planning Areas” in San Diego. 17 Electrify America also considered cities that borders a sub-unit of the four large cities to reach the population threshold of 450-550K
Category City
Municipal Cities
Long Beach
Fresno
Sacramento
Metropolitan Areas Visalia-Porterville
Neighboring Cities
Oakland-Berkeley
Oakland-Alameda
Long Beach-Lakewood
Anaheim-Fullerton
Anaheim-Orange
Anaheim-Garden Grove
Garden Grove-Santa Ana
Orange-Santa Ana
Subunits of Major Cities South San Jose and Alum Rock
City and Sub-Unit of Top 4 Cities Long Beach-Wilmington (LA Sub-Unit)
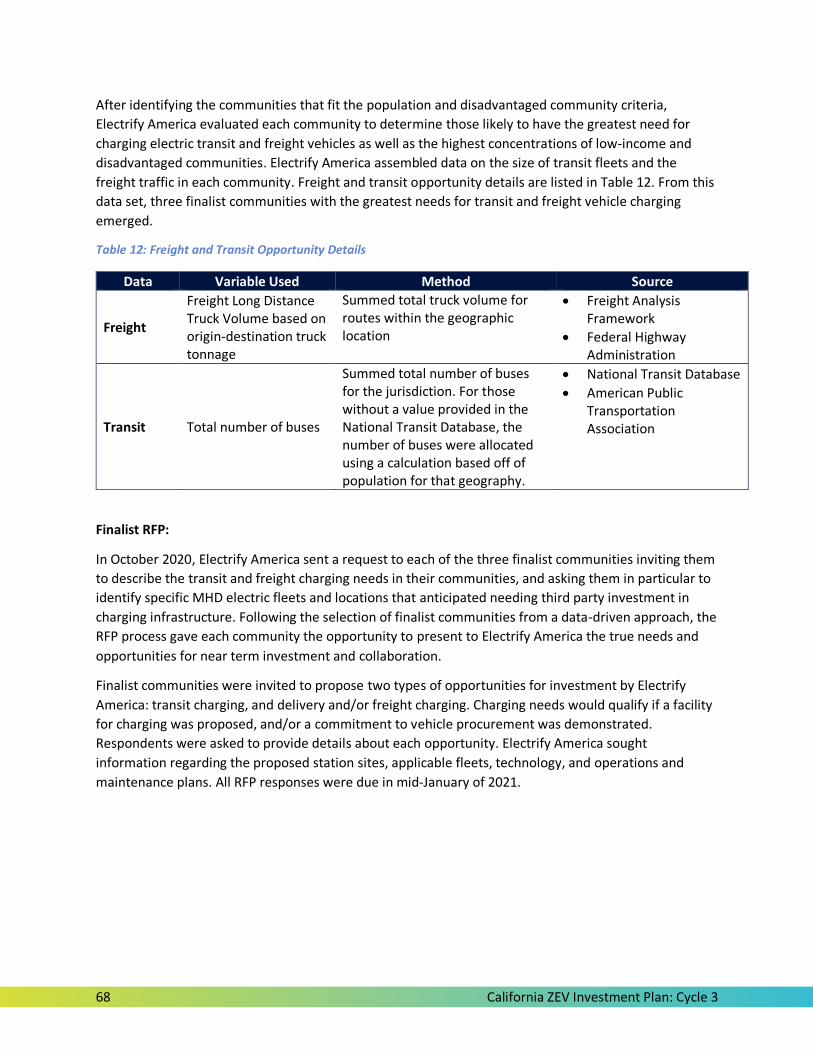
68 California ZEV Investment Plan: Cycle 3
After identifying the communities that fit the population and disadvantaged community criteria,
Electrify America evaluated each community to determine those likely to have the greatest need for
charging electric transit and freight vehicles as well as the highest concentrations of low-income and
disadvantaged communities. Electrify America assembled data on the size of transit fleets and the
freight traffic in each community. Freight and transit opportunity details are listed in Table 12. From this
data set, three finalist communities with the greatest needs for transit and freight vehicle charging
emerged.
Table 12: Freight and Transit Opportunity Details
Finalist RFP:
In October 2020, Electrify America sent a request to each of the three finalist communities inviting them
to describe the transit and freight charging needs in their communities, and asking them in particular to
identify specific MHD electric fleets and locations that anticipated needing third party investment in
charging infrastructure. Following the selection of finalist communities from a data-driven approach, the
RFP process gave each community the opportunity to present to Electrify America the true needs and
opportunities for near term investment and collaboration.
Finalist communities were invited to propose two types of opportunities for investment by Electrify
America: transit charging, and delivery and/or freight charging. Charging needs would qualify if a facility
for charging was proposed, and/or a commitment to vehicle procurement was demonstrated.
Respondents were asked to provide details about each opportunity. Electrify America sought
information regarding the proposed station sites, applicable fleets, technology, and operations and
maintenance plans. All RFP responses were due in mid-January of 2021.
Data Variable Used Method Source
Freight
Freight Long Distance Truck Volume based on origin-destination truck tonnage
Summed total truck volume for routes within the geographic location
Freight Analysis Framework
Federal Highway Administration
Transit Total number of buses
Summed total number of buses for the jurisdiction. For those without a value provided in the National Transit Database, the number of buses were allocated using a calculation based off of population for that geography.
National Transit Database
American Public Transportation Association
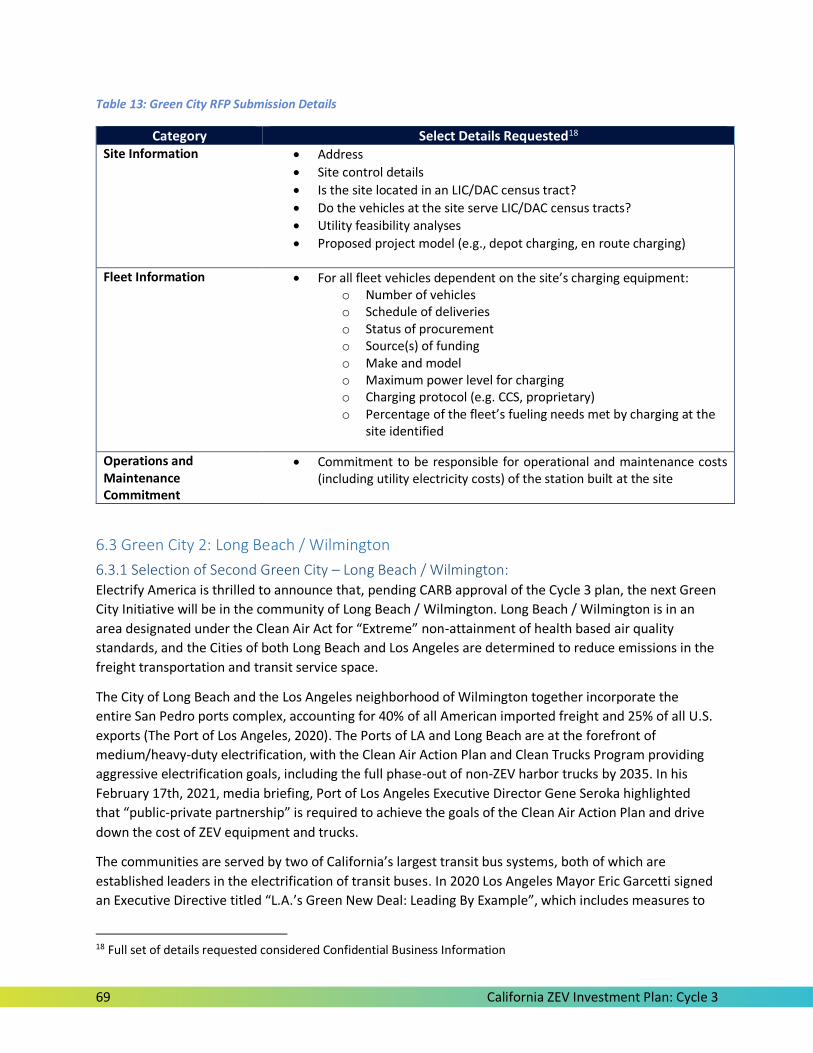
69 California ZEV Investment Plan: Cycle 3
Table 13: Green City RFP Submission Details
6.3 Green City 2: Long Beach / Wilmington
6.3.1 Selection of Second Green City – Long Beach / Wilmington: Electrify America is thrilled to announce that, pending CARB approval of the Cycle 3 plan, the next Green
City Initiative will be in the community of Long Beach / Wilmington. Long Beach / Wilmington is in an
area designated under the Clean Air Act for “Extreme” non-attainment of health based air quality
standards, and the Cities of both Long Beach and Los Angeles are determined to reduce emissions in the
freight transportation and transit service space.
The City of Long Beach and the Los Angeles neighborhood of Wilmington together incorporate the
entire San Pedro ports complex, accounting for 40% of all American imported freight and 25% of all U.S.
exports (The Port of Los Angeles, 2020). The Ports of LA and Long Beach are at the forefront of
medium/heavy-duty electrification, with the Clean Air Action Plan and Clean Trucks Program providing
aggressive electrification goals, including the full phase-out of non-ZEV harbor trucks by 2035. In his
February 17th, 2021, media briefing, Port of Los Angeles Executive Director Gene Seroka highlighted
that “public-private partnership” is required to achieve the goals of the Clean Air Action Plan and drive
down the cost of ZEV equipment and trucks.
The communities are served by two of California’s largest transit bus systems, both of which are
established leaders in the electrification of transit buses. In 2020 Los Angeles Mayor Eric Garcetti signed
an Executive Directive titled “L.A.’s Green New Deal: Leading By Example”, which includes measures to
18 Full set of details requested considered Confidential Business Information
Category Select Details Requested18
Site Information Address
Site control details
Is the site located in an LIC/DAC census tract?
Do the vehicles at the site serve LIC/DAC census tracts?
Utility feasibility analyses
Proposed project model (e.g., depot charging, en route charging)
Fleet Information For all fleet vehicles dependent on the site’s charging equipment: o Number of vehicles o Schedule of deliveries o Status of procurement o Source(s) of funding o Make and model o Maximum power level for charging o Charging protocol (e.g. CCS, proprietary) o Percentage of the fleet’s fueling needs met by charging at the
site identified
Operations and Maintenance Commitment
Commitment to be responsible for operational and maintenance costs (including utility electricity costs) of the station built at the site
70 California ZEV Investment Plan: Cycle 3
make LADOT’s bus fleet entirely emissions-free in time for the 2028 Olympic and Paralympic Games.
Long Beach Transit is also aiming to rapidly grow its ZEV bus fleet, with plans for a nearly full transition
to ZEV by 2030.
The selection of Long Beach / Wilmington is the result of the charging investment opportunities
identified by both Long Beach and the City of Los Angeles through the RFP process. Together they
identified more than a dozen potentially viable investment opportunities with project scopes ranging
from transit, MHD freight, drayage, and refuse. Potential projects were all either directly located in Long
Beach / Wilmington, or actively serve these areas.
6.3.2 Investment Details: Electrify America has its second Green City initiative in the Long Beach / Wilmington community. The
first stage of this investment will include due diligence, scoping and contracting for each potential
charging station investment identified in the Long Beach / Wilmington proposals. Electrify America
anticipates making multiple significant charging station infrastructure investments, but Electrify America
has not yet determined which of the many potential investments identified thus far will be economically
and technologically viable. The due diligence and contracting process, which must proceed confidentially
due to its commercial nature, will enable the finalization of investments in service of the Long
Beach/Wilmington community.
Based on the projects put forward and Electrify America’s vision for the second Green City, investments
will feature the following:
DCFC charging equipment, ranging from 150 – 350kW, though charging powers may exceed
350kW should a higher power standard become available, or be lower than 150kW if required to
meet the needs of the project partners
All chargers are expected to use the CCS standard, as is typical for MHD trucks and transit buses,
unless a new, higher-power standard is developed and ready for commercial deployment
Many projects require 10+ chargers deployed for use by one or more fleets. As a result, these
projects will feature large utility interconnections far in excess of 1MW
To manage interconnection size, as well as overall energy costs at the stations, Electrify America
will seek to implement site-level energy management tools. Tools are station and use-case
specific, but may include load management and charge scheduling
As appropriate based on investment type, operational, and economic considerations, we will
seek to deploy storage assets, renewable generation, and energy management software. These
assets will be used primarily to manage energy loads for the project, but may also be used as a
grid resource should excess energy and resources be available
It is important to note that delivery of projects like those identified in the Long Beach / Wilmington
submission require collaboration with a large, diverse set of stakeholders including fleet owners,
property owners, utilities, automotive OEMs, and government/regulatory entities. Electrify America is
fully committed to delivering these projects as quickly as possible to support the ZEV goals of our second
Green City, but we acknowledge that some of the required inputs are beyond our control. In some
cases, projects may require additional time to complete, including extending beyond the end of Cycle 3
in June of 2024. In the event that Electrify America is unable to complete $25M of Green City projects
during the Cycle 3 period, we will invest in additional creditable investment types to meet our $200M

71 California ZEV Investment Plan: Cycle 3
Cycle 3 commitment under the Partial Consent Decree. Electrify America will then complete and fund
any outstanding Green City projects as part of Cycle 4.
As we learned in Cycle 1 in Sacramento, the Green City initiative requires a strong partnership, planning,
and coordination, and has the ability to make a major impact on the city’s economic opportunities,
pollution and emissions, and overall transportation landscape. We are thrilled to be taking this journey
with the Cities of Long Beach and Wilmington (and Los Angeles by association) and excited to help
transform two key transportation sectors in the region.

72 California ZEV Investment Plan: Cycle 3
7. Closing After nearly five years of investing in non-proprietary charging infrastructure and brand neutral
marketing, there are clear indications Electrify America’s efforts are helping to increase ZEV adoption.
OEMs are bringing new models to market with longer ranges, higher charging powers, and larger body
styles. Coupled with Electrify America’s robust highway network and ultra-fast charging, these vehicles
finally are unlocking the promise of EVs as a household’s primary vehicle.
In addition to driving ZEV adoption, Electrify America has secured major achievements in its first two
investment cycles. We have built the largest and most powerful open DCFC network in the U.S. by
acquiring, building, and commissioning sites at an unprecedented construction pace. In spite of this
rapid growth, our network leads the industry in quality as well, as judged by PlugShare scores and
Charged EV. And we have implemented a site acquisition approach that puts the customer first, and
ensures a great charging experience each and every visit.
However, significant work still remains. Consumers demand more stations and faster charging to
continue adopting ZEVs, and station economics and quality must also improve dramatically. On the
education side, more work is needed to familiarize consumers with ZEVs, their benefits, and the many
incentives available for adopters. Finally, corporate sustainability and responsibility will be critical to
ensuring that efforts bring about the promises of environmental sustainability and equity for all as we
transition to a zero emission future.
Our sincere thanks must be extended to those outside of Electrify America, including the California Air
Resources Board and Environmental Protection Agency. Their guidance has been instrumental in nearly
five years of collective effort to determine the right approach to investing in ZEV infrastructure and to
communicating education and awareness messaging. We are also grateful to all those who have
engaged in the National Outreach Process and California public hearings. Your valuable insights,
alternative views, and confirmation of key strategies are critical to the success of this unprecedented
effort.
Our Electrify America team remains inspired by challenges and opportunities ahead to create a better
pathway to ZEV adoption for the United States. We trust these efforts will not only be enjoyed by
drivers for many generations to come but also become an example of successful private and public
sector cooperation within the U.S., if not globally.
73 California ZEV Investment Plan: Cycle 3
Sources Cited Sources used in the creation of this plan are listed below:
Alternative Fuels Data Center (2020). Light Duty AFV, HEV, and Diesel Model Offerings by
Technology/Fuel Type. U.S. Department of Energy. Accessed at: https://afdc.energy.gov/data/10303.
Amaresan, S. (2020). What Are Your Customers' Expectations for Social Media Response Time?.
Accessed at: https://blog.hubspot.com/service/social-media-response-time.
Archer, S. (2020). Americans’ Views on Electric Vehicles [Study]. Accessed at:
https://www.thesimpledollar.com/insurance/auto/electric-car-survey/.
Asensio, O., et al. (2020). Real-Time Data from Mobile Platforms to Evaluate Sustainable Transportation
Infrastructure. Georgia Tech. Accessed at: https://www.nature.com/articles/s41893-020-0533-6.
Ast, E., O’Connor, P., Barnes, N. (2021). Satisfied Drivers, Optimistic Intenders: How the EV market can
continue to thrive, fix pain points, and evolve for the next generation of drivers. Plug In America.
Accessed at: https://pluginamerica.org/wp-content/uploads/2021/02/2021-PIA-Survey-Report.pdf.
Alliance for Automotive Innovation (2019). The Future of Sustainable Mobility. Accessed February 2021.
BloombergNEF (2020). Battery Pack Prices Cited Below $100/kWh for the First Time in 2020, While
Market Average Sits at $137/kWh. Accessed at: https://about.bnef.com/blog/battery-pack-prices-cited-
below-100-kwh-for-the-first-time-in-2020-while-market-average-sits-at-137-kwh/.
Bomey, Nathan (2020). Ford's F-series remains America's best-selling vehicle, but in 19 states these
models were more popular. USA Today. Accessed at:
https://www.usatoday.com/story/money/cars/2020/01/10/honda-civic-tesla-model-3-ford-f-150-most-
popular/2833753001/.
Buholtz, T., et al. (2020). Electrifying Freight: Pathways to Accelerating the Transition. Electrification
Coalition. Accessed at: https://www.electrificationcoalition.org/wp-
content/uploads/2020/11/Electrifying-Freight-Pathways-to-Accelerating-the-Transition.pdf.
California Air Resources Board (2020). 15 States and the District of Columbia join forces to accelerate
bus and truck electrification. Accessed at: https://ww2.arb.ca.gov/news/15-states-and-district-
columbia-join-forces-accelerate-bus-and-truck-electrification.
California Air Resources Board (2020). 2000-2018 GHG Inventory. Accessed at:
https://ww2.arb.ca.gov/ghg-inventory-data.
California Air Resources Board (2020). Advanced Clean Trucks Regulation. Accessed at:
https://ww2.arb.ca.gov/our-work/programs/advanced-clean-trucks.
California Air Resources Board (2020). Annual Evaluation of Fuel Cell Electric Vehicle Deployment &
Hydrogen Fuel Station Network Development. Accessed at:
https://ww2.arb.ca.gov/sites/default/files/2020-09/ab8_report_2020.pdf.
California Air Resources Board (2017). California Air Resources Board’s Guidance to Volkswagen on First
30 Month Electric Vehicle Infrastructure Investment Plan of the 2.0 Liter Diesel Engine Partial Consent
74 California ZEV Investment Plan: Cycle 3
Decree Settlement. Accessed at: https://ww2.arb.ca.gov/sites/default/files/2020-
03/zip_1_%20guidance_ac.pdf.
California Air Resources Board (2019). Cleaner fuels have now replaced more than 3 billion gallons of
diesel fuel under the Low Carbon Fuel Standard. Accessed at: https://ww2.arb.ca.gov/news/cleaner-
fuels-have-now-replaced-more-3-billion-gallons-diesel-fuel-under-low-carbon-fuel.
California Air Resources Board (2018). Innovative Clean Transit. Accessed at:
https://ww2.arb.ca.gov/our-work/programs/innovative-clean-transit.
California Energy Commission (2021). Assembly Bill 2127 Electric Vehicle Charging Infrastructure
Assessment: Analyzing Charging Needs to Support Zero-Emission Vehicles in 2030. Accessed at:
https://efiling.energy.ca.gov/getdocument.aspx?tn=236237.
Center for Sustainable Energy (2016). Experience Electric: #TheBetterRide. Accessed at:
https://mtc.ca.gov/sites/default/files/MTC_EXEL_Final_Report.pdf.
Clean Vehicle Rebate Program (2021). CVRP Rebate Statistics. Accessed at:
https://cleanvehiclerebate.org/eng/rebate-statistics.
Di Caro, M. (2017). With No Place To Charge, D.C.’s Electric Cab Drivers Ask For Help. WAMU. Accessed
at: https://wamu.org/story/17/08/14/no-place-charge-d-c-s-electric-cab-drivers-ask-help/.
Fitzgerald, Garrett and Nelder, Chris (2019). DCFC Rate Design Study. Rocky Mountain Institute.
Accessed at: https://rmi.org/insight/dcfc-rate-design-study/.
Goodwin, Antuan (2020). Cheerio, CHAdeMO: Nissan adopts CCS fast-charging with new Ariya electric
SUV. CNET. Accessed at: https://www.cnet.com/roadshow/news/nissan-ariya-electric-suv-adopts-ccs-
fast-charging/.
Google/C-Space Survey and Interviews; Interviews conducted June 17-24, 2020 in US and DE; Surveys
conducted July 7-23, 2020 in US, CA,MX, BR, UK, DE, FR, IT, JP, IN, AU, n=2,495
Hawlins, Andrew J. (2021). Biden wants to replace government fleet with electric vehicles. Verge.
Accessed at: https://www.theverge.com/2021/1/25/22249237/biden-electric-vehicle-government-fleet-
ev.
Hardman, Scott; Jang, Nora; and Dahlia, Garas (2019). Consumer Awareness of Plug-in Electric Vehicles:
A Study of Sacramento. UC Davis. Accessed at:
https://escholarship.org/content/qt7sw5b5vk/qt7sw5b5vk.pdf?t=pxs2y1.
Hunt, J., McKearnan, S. (2020). Accelerating Ride-Hailing Electrification: Challenges, Benefits, And
Options For State Action. NESCAUM. Accessed at: https://www.nescaum.org/documents/ride-hailing-
electrification_white-paper_120220.pdf/.
IHS Markit (2021). Vehicle Registration Data. Accessed February 2021.
J.D. Power (2020). Q1 Mobility Confidence Index Study. Accessed at:
https://www.jdpower.com/business/press-releases/2020-q1-mobility-confidence-index-study-fueled-
surveymonkey-audience.
75 California ZEV Investment Plan: Cycle 3
Jenn, A. (2019). Emissions Benefits of Electric Vehicles in Uber and Lyft Services. UC Davis. Accessed at:
https://www.nature.com/articles/s41560-020-0632-7.
Loveday, S. (2021). Porsche Taycan Beats Electric Cross-Country Cannonball Record. InsideEVs.com.
Accessed at: https://insideevs.com/news/464763/porsche-taycan-beats-electric-cross-country-
cannonball-record/.
Lyft (2021). Lyft 2021 Economic Impact Report. Accessed at:
https://drive.google.com/file/d/1jzJt3QI8yvw9dDms3eyk4LH2ejuiHhVM/view.
Lyft (2021B). Lyft 2021 Economic Impact Report Rider Survey. Provided to Electrify America by Lyft
MacInnis, B., Krosnick, J. (2020). Climate Insights 2020 - Surveying American Public Opinion on Climate
Change and the Environment. Resources for the Future. Accessed at:
https://media.rff.org/documents/Climate_Insights_2020_Electric_Vehicles.pdf.
Mangles, Carolanne (2017). Why social median customer care is important is retaining loyal customers
and positive brand awareness. Accessed at: https://www.smartinsights.com/customer-relationship-
management/customer-service-and-support/rise-social-media-customer-care/.
McFarland, Dane; Prorok, Matt; Jordan, Brendan; and Kemabonta, Tam (2019). Analytical White Paper:
Overcoming Barriers to Expanding Fast Charging Infrastructure in the Midcontinent Region. Great Plains
Institute. Accessed at: https://scripts.betterenergy.org/reports/GPI_DCFC_Analysis_July_2019.pdf.
McKinsey & Company (2020). The future of mobility is at our doorstep. Accessed at:
https://www.mckinsey.com/~/media/McKinsey/Industries/Automotive%20and%20Assembly/Our%20In
sights/The%20future%20of%20mobility%20is%20at%20our%20doorstep/The-future-of-mobility-is-at-
our-doorstep.pdf.
McLane, R., et al. (2021). Racing to Accelerate EV Adoption: Decarbonizing Transportation with
Ridehailing (Rocky Mountain Institute). Accessed at: https://rmi.org/insight/accelerating-the-electric-
vehicle-transition.
Mishel, L. (2018). Uber and the labor market: Uber drivers’ compensation, wages, and the scale of Uber
and the gig economy. Economic Policy Institute. Accessed at: https://www.epi.org/publication/uber-
and-the-labor-market-uber-drivers-compensation-wages-and-the-scale-of-uber-and-the-gig-economy/.
Morning Consult (2019). For Widespread Adoption of Electric Vehicles, Many Roadblocks Ahead.
Accessed at: https://morningconsult.com/2019/05/22/for-widespread-adoption-of-electric-vehicles-
many-roadblocks-ahead/
National Association of State Energy Officials (2021). NASEO and Cadmus Release Plug-In Electric Vehicle
Policy Impact Rubric. Accessed at: https://naseo.org/news-article?NewsID=3583.
National Renewable Energy Laboratory (2017). Identifying Potential Markets for Behind-the-Meter
Battery Energy Storage: A Survey of U.S. Demand Charges. Accessed at:
https://www.nrel.gov/docs/fy17osti/68963.pdf.
Guidehouse (2020). EV Geographic Forecast. Accessed February 2021.
76 California ZEV Investment Plan: Cycle 3
Nelder, Chris and Rogers, Emily (2019). Reducing EV Charging Infrastructure Costs. Rocky Mountain
Institute. Accessed at: https://rmi.org/insight/reducing-ev-charging-infrastructure-costs/.
Nicholas, M., Hall, D., Lutsey, Nic (2020). Charging infrastructure requirements to support electric ride-
hailing in U.S. cities. ICCT. Accessed at:
https://theicct.org/sites/default/files/publications/Charging_infrastructure_ride_hailing_US_03242020.
pdf.
Nicholas, M., Hall, D., Lutsey, Nic (2019). Quantifying the Electric Vehicle Charging Infrastructure Gap
Across U.S. Markets. ICCT. Accessed at:
https://theicct.org/sites/default/files/publications/US_charging_Gap_20190124.pdf.
Nicholas, M., Lutsey, Nic (2019). Update on electric vehicle costs in the United States through 2030.
ICCT. Accessed at:
https://theicct.org/sites/default/files/publications/EV_cost_2020_2030_20190401.pdf.
Perez, Sarah (2020). Pandemic accelerated cord cutting, making 2020 the worst-ever year for pay TV.
Accessed at: https://techcrunch.com/2020/09/21/pandemic-accelerated-cord-cutting-making-2020-the-
worst-ever-year-for-pay-tv/?guccounter=1.
Plug In America (2021). New Electric Vehicles Coming in 2021. Accessed at:
https://pluginamerica.org/new-electric-vehicle-models-coming-in-2021.
The Port of Los Andeles (2020). Port of Los Angeles Receives $9.9 Million Infrastructure Development
Grant. Accessed at: https://www.portoflosangeles.org/references/news_102120_port_receives_grant.
Sanguinetti, A., Kurani, K. (2020). Characteristics and Experiences of Ride-Hailing Drivers with Plug-in
Electric Vehicles. UC Davis. Accessed February 2021.
Sharpe, B., Buysse, C., Mathers, J., Poudelet, V. (2020). Race to Zero: How Manufacturers are Positioned
for Zero Emission Commercial Trucks and Buses in North America. ICCT. Accessed at:
https://theicct.org/publications/canada-race-to-zero-oct2020.
Singer, Mark (2020). Plug-In Electric Vehicle Showcases: Consumer Experience and Acceptance (NREL).
Accessed at: https://www.nrel.gov/docs/fy20osti/75707.pdf.
U.S. Bureau of Transportation Statistics (2021). COVID-19 Takes a Big Bite out of 2020 Passenger
Transportation. Accessed at: https://www.bts.gov/data-spotlight/covid-19-takes-big-bite-out-2020-
passenger-transportation.
U.S. Department of Energy (2021). Fact of the Week 1167. Accessed at:
https://www.energy.gov/eere/vehicles/articles/fotw-1167-january-4-2021-median-driving-range-all-
electric-vehicles-tops-250.
U.S. Department of Energy, Office of Energy Efficiency & Renewable Energy (2021). Reducing Pollution
with Electric Vehicles. Accessed at: https://www.energy.gov/eere/electricvehicles/reducing-pollution-
electric-vehicles.

77 California ZEV Investment Plan: Cycle 3
Volvo Car USA/The Harris Poll (2019). The State of Electric Vehicles in America. Accessed at:
https://www.media.volvocars.com/us/en-us/media/documentfile/249123/volvo-reports-the-state-of-
electric-vehicles-in-america.
78 California ZEV Investment Plan: Cycle 3
Appendix
I. ZEV Glossary AC Charging
The majority of PEV charging is done with alternating current (AC) Level 1 (120 volts or normal
household current) or Level 2 (240 volts or an electric dryer power equivalent). AC charging is typically a
more cost effective solution, with lower equipment and installation costs. As it takes advantage of
longer dwell times to provide lower power to a ZEV, AC charging is an excellent solution for residential,
workplace, multiunit dwelling, and other longer-term parking situations like hotels and municipal or
airport parking garages.
Disadvantaged Communities/Low-income Communities
Electrify America uses definitions for low-income and disadvantaged communities established by the
State of California, which are published and mapped by CARB on its “Disadvantaged and Low-income
Communities Investments” webpage:
https://www.arb.ca.gov/cc/capandtrade/auctionproceeds/communityinvestments.htm.
DC Fast Charging (DCFC)
Direct current (DC) charging for electric vehicles allows for higher charging speeds, as DC current can be
supplied directly to the electric vehicle’s battery at power levels normally higher than AC charging. The
higher the DC power supplied, the faster the EV can be charged, provided the vehicle is designed to
handle such power. To illustrate the charging power difference between Level 2 AC and DC fast
charging, a Level 2 7.2kW AC charger will deliver about 27 miles of ZEV range per hour of charging,
whereas a 150kW or 350kW DC fast charger can deliver 90 or 200 miles of electric range per 10 minutes
respectively.
OCPP and OCPI
Open Charge Point Protocol (OCPP) and Open Charge Point Interface (OCPI) are communications
standards that have been developed by numerous public and private ZEV infrastructure leaders. OCPP
enables standardized communication between charging hardware and the charging station networks
that support them, while OCPI enables communication between different charging station networks.
OCPP makes it possible to change the network supporting an individual charging station at some future
time if desired. OCPI, on the other hand, is the communications standard that enables commercial
entities such as charging networks or automotive OEMs to transfer charging station data between each
other, such as charger availability or customer information, to enable roaming.
Plug & Charge
Plug & Charge is part of the latest revision of the CCS standard, featuring the IEC/ISO 15118 standard
which prescribes the means by which a charger and network can identify and authenticate a specific
vehicle. This allows for a charging session to begin automatically by simply “plugging in,” without the
need for supplemental membership cards or fobs.
Zero Emission Vehicle (ZEV)
79 California ZEV Investment Plan: Cycle 3
Under Appendix C, the following three vehicle types are considered Zero Emission Vehicles:
1. An on-road passenger car or light duty vehicle, light duty truck, medium duty vehicle, or heavy
duty vehicle that produces zero exhaust emissions of all of the following pollutants: non-
methane organic gases, carbon monoxide, particulate matter, carbon dioxide, methane,
formaldehyde, oxides of nitrogen, or nitrous oxide, including, but not limited to, battery electric
vehicles (“BEV”) and fuel cell vehicles (“FEV”);
2. An on-road plug-in hybrid electric vehicle (“PHEV”) with zero emission range greater than 35
miles as measured on the federal Urban Dynamometer Driving Schedule (“UDDS”) in the case of
passenger cars, light duty vehicles and light duty trucks, and 10 miles as measured on the
federal UDDS in the case of medium- and heavy-duty vehicles; or
3. An on-road heavy-duty vehicle with an electric powered takeoff. ZEVs do not include: zero
emission off-road equipment and vehicles; zero emission light rail; additions to transit bus fleets
utilizing existing catenary electric power; or any vehicle not capable of being licensed for use on
public roads.