Embed Size (px)
Citation preview

California’s Green Economy
LMI Advisory GroupOctober 22, 2009
Bonnie Graybill,Deputy Division Chief
Labor Market Information Division

Understanding the Green EconomyWhat is California LMI Doing/Planning?
Responding to state and national information needs
See our “green web page” at http://www.labormarketinfo.edd.ca.gov/?pageid=1032
Collaborating to expand knowledge
with federal/state/local research partners to review existing research and identify information gaps
with state and local partners to define workforce needs and support workforce development
with control entities and utilities responsible for bringing about climate change
Surveying California businesses to establish baselines
Publishing career research to support workforce development

Our Working Definition of Green
Green or clean is any activity or service that performs at leastone of the following:
Generating and storing renewable energy
Recycling existing materials
Energy efficient product manufacturing, distribution, construction, installation, and maintenance
Education, compliance and awareness
Natural and sustainable product manufacturing
For the complete definition see:http://www.labormarketinfo.edd.ca.gov/contentpub/GreenDigest/Californias-Draft- Definition-Green-Industries.pdf

Sustainable Practices Increase Demand
Important caveat…LMID’s definition focuses on the “supply” side of the economy, on businesses that produce products or service directly related to the functions described in this GREEN definition.Entities that have adopted sustainable business practices (the “demand” side) are equally important to California’s green economy.Demand leads to increased pressure for additional supply. Sustainable business practices might include (but not limited to) entities that have adopted renewable energy, efficiency and conservation strategies.

Tie to Recovery Act Funding for “Green Activities”
Smart Grid Transmission LinesRenewable EnergyEnergy EfficiencyWeatherization
Strategy: Prepare dislocated workers for reemployment careers in these areas as appropriate

Green Industries tied to Recovery Act (Examples)
EnergyPublic and Private UtilitiesPower Generation plants (electric, hydroelectric, other fuels)Power TransmissionPower DistributionPower and communication line construction
ConstructionResidential, commercial, industrial, remodelingGlazing contractorsRoofing contractors
ManufacturingVarious sectors—lighting, appliance, motor and generator, storage batteries, motor vehicle, semiconductors Automatic environmental controls

Moving unemployed into green jobs “Re-skilling” (just a sampling…)
Professional (BA or Advanced degree): architects, cost estimators, engineers, planners, vocational education teachers
Skilled workers (AA or post secondary education): auto, bus and truck mechanics, biological and chemical technicians
Crafts and Trades workers (OJT—varying durations): assemblers, carpenters, electricians, plumbers, HVAC, insulation/weatherization

Green Economy Survey Details
First mailing in May 2009
Over 50,000 businesses across the California economy; all industries, all sizes, all areas
5.2M employment in surveyed firms
Collecting information on:
Number of workers in green or clean product manufacturing and/or services
Number of businesses that have adopted green practices
Emerging occupations for further study related to skills and workforce needs
Partnering with Community Colleges, Air Resources Board, California Energy Commission, California Workforce Investment Board, Economic Strategy Panel, Employment Training Panel, and others

Preliminary data as of October 8, 2009
Preliminary Survey Responses
Over 9,000 employers have responded, representing over 140,000 businesses and 3 million workers in California
9.2 percent of employers report employees working on green products and services
About 3.7 percent of all workers are working on green products and services
About two-thirds of green workers spend more than half time on green aspects of job
62 percent of employers report using at least one green business practice

Preliminary data as of October 8, 2009
Comparison to Other States’
Recent Green Workforce Surveys?Green as a percent of total employment
California 3.7 % (Prelim)Washington 1.6 %Oregon 3.0 %Michigan 3.0 %
Caveat…Definitions vary somewhat between states…Renewable energy, recycling, and energy efficiency are in each states definition
Energy EfficiencyRecycling
Renewable Energy

Preliminary data as of October 8, 2009
Green Workers ReportedTotal Green Employment Reported by Category
Recycling existing materials
27%Natural and sustainable product manufacturing
32%
Other6%
Generating and storing renewable energy
6%
Education, compliance, and awareness
12%
Energy efficient product manufacturing,
distribution, construction, installation, and
maintenance17%

Preliminary data as of October 8, 2009
6%
Generating and storing renewable energy
Top industriesProfessional and Business Services UtilitiesWholesale Electronic Markets and Agents
Top occupationsArchitects, Except LandscapeAlternative Energy EngineersElectrical Engineers Heating and Air Conditioning Technicians and InstallersWastewater Technicians and OperatorsPlumbers, Pipefitters, and Steamfitters Solar Photovoltaic Panel Installers and TechniciansAir Quality Engineers; Air Pollution Specialists; Air Resources EngineersBuilding Performance or Retro-Fitting SpecialistsElectricians

Preliminary data as of October 8, 2009
27%
Recycling
existing materials
Top industriesMerchant Wholesalers, Durable GoodsWaste Management and RemediationEducational ServicesFabricated Metal Product ManufacturingProfessional and Technical Services
Top occupationsRecycling Center OperatorsAssemblersHazardous Materials Removal WorkersHeating and Air Conditioning Technicians and InstallersWastewater Technicians and OperatorsConstruction ManagersSustainable Farmers and Farm workers Industrial Production ManagersPlumbers, Pipefitters, and SteamfittersAir Quality Engineers; Air Pollution Specialist; Air Resource Engineers

Preliminary data as of October 8, 2009
17%
Energy efficient product manufacturing
Top industriesSpecialty Trade ContractorsComputer and Electronic Product ManufacturingConstruction of BuildingsProfessional and Technical ServicesManagement of Companies and Enterprises
Top occupationsAssemblersHeating and Air Conditioning Technicians and Installers ElectriciansArchitects, Except LandscapeCarpentersConstruction ManagersEnergy Auditors, Home and CommercialHazardous Materials Removal WorkersBuilding Performance or Retro-Fitting SpecialistsPlumbers, Pipefitters, and Steamfitters

Preliminary data as of October 8, 2009
12%
Education, compliance and awareness
Top industriesProfessional and Technical ServicesEducational ServicesFood Services and Drinking PlacesMembership Associations and OrganizationsUtilities
Top occupationsAssemblersPlumbers, Pipefitters, and SteamfittersHeating and Air Conditioning Technicians and Installers Architects, Except LandscapeElectriciansConstruction ManagersCarpentersAlternative Energy EngineersWastewater Technicians and OperatorsEnvironmental Engineers

Preliminary data as of October 8, 2009
32%
Natural and sustainable product mfg
Top industriesCrop ProductionFood ManufacturingPaper ManufacturingFabricated Metal Product ManufacturingNonmetallic Mineral Product Manufacturing
Top occupationsSustainable Farmers and FarmworkersAssemblersRecycling Center OperatorsCarpenters Biomass CollectorsIndustrial Production ManagersBiological TechniciansConstruction ManagersSoil and Plant ScientistsHazardous Materials Removal Workers

Preliminary data as of October 8, 2009
What Industries are green?An initial analysis by the Bureau of Labor Statistics identified 62 six-digit NAICS codes as green.
In a similar analysis LMID identified 121 six-digit NAICS codes as green using our definition.
Surveyed businesses representing 381 different NAICS codes have reported green employment. More analysis and detail to follow!

Preliminary data as of October 8, 2009
Greening Manufacturing688 Manufacturing firms have responded, representing 251,400 in employment.
Of those, 177 firms reported 33,500 employees performing green job tasks.
Over 70 percent of those reported employees perform green job tasks more than 50 percent of the time.

Preliminary data as of October 8, 2009
Greening ManufacturingMost reported Green Occupations in the Manufacturing sector:
AssemblersIndustrial Production Managers
58 percent of all green Assemblers reported are found in Manufacturing.
Likewise, 52 percent of all green Industrial Production Managersreported are found in Manufacturing.

Preliminary data as of October 8, 2009
Preparation of Current Green Workers –
OJT!
Training Methods Used by Employers to Prepare Current Workers for Green Jobs
3.1%3.3%6.1%8.0%10.7%16.6%18.9%8.6%
77.2%
0.0%10.0%20.0%30.0%40.0%50.0%60.0%70.0%80.0%90.0%
Other
Comm
unity C
olleg e c
ourses
Vocational tr
aining
Appren tic
eship p
rogra
ms
College D
egree (
AA/AS or a
bove)
Hire o
nly work
ers w
ho are al
re...
Vendor t
rainin
g
In-hous e
clas s
room
train
ing
On-the-j
ob train
ing
Per
cent
age
of E
mpl
oyer
s

Preliminary data as of October 8, 2009
Sustainable Practices—Current Use?If your business makes use of green practices, services or
products, what does your firm currently USE on site
59.8%
37.8%
27.4%
7.6%
22.7%
8.5%1.8%
7.2%3.9% 3.2%
0.0%
10.0%
20.0%
30.0%
40.0%
50.0%
60.0%
70.0%
Recyc
ling
Recyc
led P
rodu
ctsEne
rgy E
fficie
ncy
Wate
r Con
serv
ation
Energ
y Effi
cient
Con
struc
tion a
nd R
emod
eling
Pollut
ion R
educ
tion
Altern
ative
Fuel
Some F
orm of
Ren
ewab
le Ene
rgy
Sustai
nable
Farm
ing
Other
Perc
enta
ge o
f Res
pons
es

Preliminary data as of October 8, 2009
Sustainable Practices –
Expectations
During the Next 12 Months, Do You Expect Your Firm's Green Practices to: Increase, Decrease, or Remain the Same?
25.2%
1.3%
73.5%
0.0%
10.0%
20.0%
30.0%
40.0%
50.0%
60.0%
70.0%
80.0%
90.0%
100.0%
Increase Decrease Remain the Same
Perc
enta
ge o
f Firm
s

Preliminary data as of October 8, 2009
Sustainable Practices—New skills?What new skills or knowledge will future employees need in
order to perform green activities at your firm?
56.0%
35.5%
19.9% 18.0% 16.3%10.9%
18.9%
5.5%
0.0%
10.0%
20.0%
30.0%
40.0%
50.0%
60.0%
70.0%
Waste
Minimiza
tion
Princip
les of
Ene
rgy C
onserv
ation
Inform
ation
Tech
nolog
y
Pollutio
n Red
uctio
n and C
ontro
l
Codes/S
tanda
rds/L
egisl
ation
Vechic
le Te
chnolo
gy and M
ainten
ance
Altern
ative
Energy
Other
Perc
ent o
f Firm
s

Preliminary data as of October 8, 2009
Sustainable Practices –
Barriers
What barriers, if any, stand in the way of implementing green practices at your firm?
1.2%
31.8%
15.7%
11.9%
52.8%
12.3%7.3%
49.4%
0.0%
10.0%
20.0%
30.0%
40.0%
50.0%
60.0%
70.0%
Costs of
Implem
entat
ionEco
nomic Cond
itions
Lack
of Inform
ation
Govern
ment P
olicies
Shortage
of Worke
rs
Shortage
of Avail
able Tr
aining
Training C
lasse
s Too F
ull
Other
Perc
enta
ge o
f Res
pons
es

Preliminary data as of October 8, 2009
Sustainable Practices –
BenefitsWhat do you view as the largest benefit to your business in
taking steps to reduce greenhouse gas emissions?
39.8%
11.1%
2.3% 1.1%
15.4%
30.3%
0.0%
10.0%
20.0%
30.0%
40.0%
50.0%
60.0%
NoneEnvir
onmental
ly ben
eficia
l
Cost-sa
vings
Competitiv
e adva
ntage/c
ommunity re
cognitio
n
Advantag
eous p
osition sh
ould some r
egulat
ion...
Other
Perc
enta
ge o
f Res
pons
es
Preliminary data as of October 8, 2009
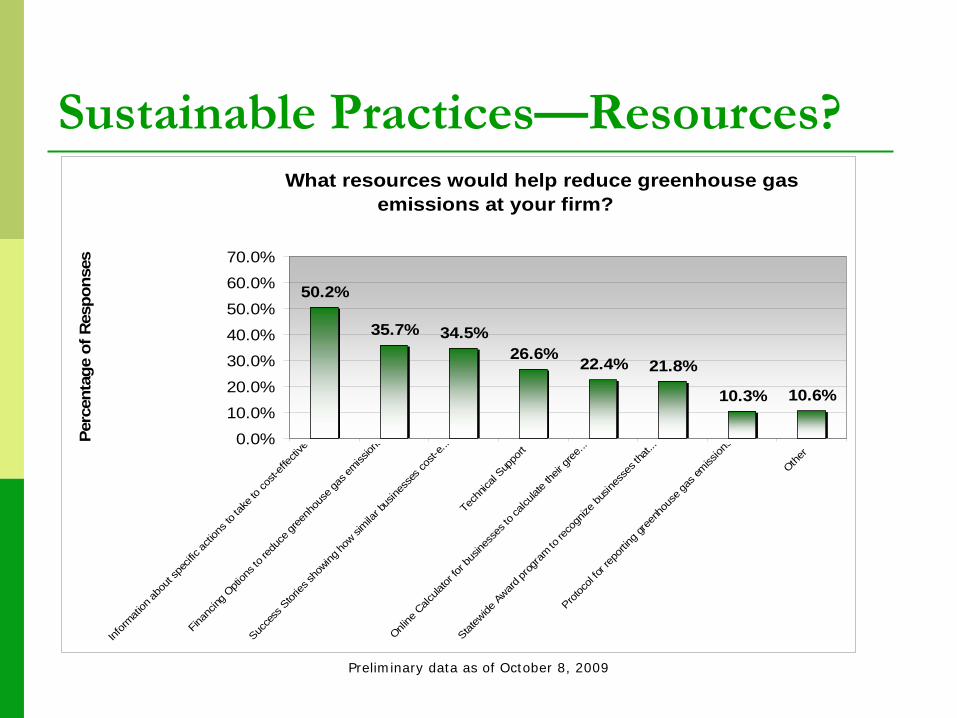
Sustainable Practices—Resources? What resources would help reduce greenhouse gas
emissions at your firm?
50.2%
35.7% 34.5%26.6% 22.4% 21.8%
10.3% 10.6%
0.0%
10.0%
20.0%
30.0%
40.0%
50.0%
60.0%
70.0%
Inform
ation
abou
t spe
cific
actio
ns to
take
to co
st-eff
ectiv
e
Finan
cing O
ption
s to r
educ
e gree
nhou
se ga
s emiss
ions
Succe
ss S
tories
show
ing ho
w simila
r bus
iness
es co
st-e..
.Tec
hnica
l Sup
port
Online
Calc
ulator
for b
usine
sses
to ca
lculat
e the
ir gree
...
Statew
ide A
ward pr
ogra
m to re
cogn
ize bu
sines
ses t
hat...
Protoc
ol for
repo
rting g
reen
hous
e gas
emiss
ions
Other
Perc
enta
ge o
f Res
pons
es

Preliminary data as of October 8, 2009
Preliminary Occupational FindingsEmployers categorized 127,800 green employees within the 34 green jobs described on the survey. An additional 15,600 workers were reported under “Other Green Job Titles”Write ins–include:
Janitors and Cleaners, Sustainability Assistants, LEED Accredited Professionals, Mobile Heavy Equipment Mechanics (maintaining electric forklifts),Recyclers (reprocessing on site materials)
Greater detail will be collected in a subsequent occupational skills survey.

Preliminary data as of October 8, 2009
Survey respondents’
top green jobs—Farmers, Assemblers, Recyclers, Carpenters …
Top 10 Green Jobs Reported - Preliminary (Weighted Sample)
0
2000
4000
6000
8000
10000
12000
14000
16000
Top Occupations
Empl
oyee
s (W
eigh
ted)
Sustainable Farmers andFarmworkers
Assemblers
Recycling Center Operators
Carpenters
Hazardous Materials RemovalWorkers
Architects, Except Landscape
Plumbers, Pipefitters, andSteamfitters
Heating and Air ConditioningTechnicians and Installers
Construction Managers
Electricians

Preliminary data as of October 8, 2009
More about these jobs OES median wage* by training level
High skill—BA or higherArchitect $81, 105 Construction Manager $101,354
Skilled—2 years of education or trainingCarpenters $51,839Electricians $53,314Farmers, Sustainable (emerging) $94,164Plumbers $50,643HVAC Technicians $46,625
Up to one year trainingAssemblers $23,959Farm Workers, sustainable (emerging) $23,476HAZMAT workers $40,520Recycling Center Operators (emerging) $39,678
*Source: 2009 Occupational Employment Statistics. Not a green survey wage!

Next StepsComplete data collectionAnalyze complete data Review findings with key playersPrepare summary report, with regional distinctions as warranted by the dataPrepare industry level reportsDetailed occupational follow-up surveys and analysisReport on occupational skills and workforce development needs