Embed Size (px)
Citation preview

1
RRUKARAIL RESEARCHUK ASSOCIATION
Call For ResearchData Sandbox: Improving Network Performance
31 October 2017

2
Excellent data is key to fully understanding how we can maximise capacity whilst improving performance. Bringing data together from numerous sources is the only way we can fully understand the impact of something before it happens. For too long we have taken ‘steps in the dark’ to improve a timetable or deliver a performance improvement only to see it not work and not deliver the expected benefits. We hope that the feasibility studies funded through this call will help us gain valuable insights into our data.
Keith PalmerHead of Performance and Planning, Greater Anglia
The rail industry is data-rich, but we can at times struggle to get the best value from this data to drive improvements in train performance and inform our investment decisions. This RSSB initiative offers the opportunity to build relationships outside of the railway and introduce new ways of thinking to address our challenges.
Dominic MedwayOperational Performance and Analysis Manager, Network Rail
Follow the conversation on twitter: #RRUKAsandbox

3
Contents1. Background ....................................................................................................5
2. Scope ................................................................................................................9
3. Data Sandbox ...............................................................................................12
4. Proposal submission guidance ...............................................................13
4.1 A fresh approach ..........................................................................................14
4.2 Proposal format and guidance ...............................................................14
4.3 Evaluation criteria ........................................................................................15
4.4 Consortia guidance .....................................................................................16
4.5 Funding ............................................................................................................16
5. Future funding opportunities ..................................................................17
6. Key dates .........................................................................................................17

4
The Rail Safety and Standards Board (RSSB), via the Rail Research UK Association (RRUKA), is making up to £500,000 available for academic-led feasibility studies to identify data-driven solutions to key rail network performance challenges in order to increase reliability, capacity and improve punctuality.
Proposals funded through this competition should develop novel ideas and innovative solutions that can help the rail industry extract useful information from its data and use it to improve network performance.
Submissions are welcome from non-rail experts whose experience in other fields could be transferred or applied to this specific research challenge.
The competition opens on 31 October 2017. The deadline to submit proposals is at 17:00 on 22 December 2017.
This document contains background information about the challenge and serves as guidance for the submission of proposals.
The Rail Research UK Association (RRUKA) is a partnership between the British rail industry and UK universities. Established in 2010, RRUKA seeks to enhance already strong collaborative relationships between academia and the railway industry.
www.rruka.org.uk
RRUKARAIL RESEARCHUK ASSOCIATION

5
1. BackgroundThe effective management of information is vital for the railway, a tightly coupled system of systems, where changes to any one part can have significant implications for other parts of the system. Therefore, the industry needs to develop systems and capabilities to make the best use of the rich data sets that are available to improve operational performance.
The rail industry already generates and collects a vast amount of data from multiple sources, which, in this digital age, gets constantly added to with greater currency and detail. This situation has caused the volume of data to be too unwieldy to allow the industry to yield increased value from it. At the same time, there may be gaps where more data is needed or where current data needs augmenting. Rationalising the information sources and systems currently in use has the potential to make processes more efficient and allow the industry to take well-informed decisions.
The industry is keen to explore opportunities to better use its data, particularly to improve operational performance. The Rail Technical Strategy Capability Delivery Plan1 has identified 12 whole-system ‘Key Capabilities’ (Figure 1). These are capabilities which the railway needs to develop in order to meet its objectives of increasing capacity and improving customer service. The following Key Capabilities are particularly relevant for this research competition:
• Key Capability 4: More value from data
Data collection and real-time information helps rail staff to make better decisions and provides customers with useful and up to date information.
• Key Capability 7: Services timed to the second Knowing the exact location, speed and status of all trains in real time will improve situational awareness, increase operational flexibility and allow for faster recovery from disruption.
1
Rail Technical Strategy Capability Delivery Plan: www.rssb.co.uk/innov-prog/pages/rts.aspx 1
Figure 1: RTS Capability Delivery Plan

6
A key opportunity lies in the ability to integrate data from various sources (Network Rail, train operators, maintainers and others) in an ‘industry warehouse’, which Network Rail is building through iTED (industry Train Event Data). The ‘vision’ is to build a common information architecture, establish a governance structure and sharing principles, and integrate existing systems (e.g. traffic management; stocking crew; incident management; signalling; customer information; asset information; timetabling etc.).
The ‘data warehouse’ will feed live information into a performance management system that can process information and identify issues. This system shall act as an industry ‘super brain’ able to provide business intelligence, enable data to be interrogated, forecast changes and adjust variables in order to develop different action plans to solve performance issues (see diagram below). This has the potential to allow reporting processes to be streamlined and automated; it would also provide better understanding of the root causes of operational issues and would shift the focus from identifying the problems to resolving them more efficiently and promptly. Ultimately, more robust data analysis will allow better performance management, will offer operational savings to both Network Rail and the operators, and it would also improve the experience of rail customers.
Strengthened Analysis
Timetabling
Stock and crew info
Trust data
Industry DataWarehouse
Other Data
Action X,Y,Z
A train is defined ‘on time’ if it arrives at its destination within 5 minutes of the planned arrival time or 10 minutes for long distance services.
2
Feasibility studies
Traffic management
On train data
Signalling data
Customer information
The industry standard to measure the performance of passenger trains against their planned timetable is the Public Performance Measure (PPM), which combines figures for punctuality2 and reliability into a single performance measure. The responsibility for delivering good performance lies both with the train operators and Network Rail.

7
The industry has a national target to deliver a PPM of 92.5% by March 2019. Therefore, with increasing demands on services and a need to improve the reliability and availability of the railway system, network capacity must be utilised in the most efficient way. Although punctuality on long distance and regional and Scottish services has been static or improving, in London and the South-East, where the lines are most congested, punctuality has been declining in recent years (see Figure 2 and 3).
Figure 3 Planned Train Services and Train Services Arriving on time (Source: Network Rail and ORR data portal)
Figure 2 Public Performance Measure by Operating Sector (Source: ORR data portal)

8
Figure 4 PPM from 2011 – 2017 (Source: Network Rail)
Figure 5 CaSL from 2011 to 2017 (Source: Network Rail)
In 2015-16, 88.9% of train services arrived on time (Figure 2). However, year 3 of Control Period 5 ended (in March 2017) with a PPM of 87.4%, which is lower compared to Network Rail’s internal target of 89.9% and the regulated target of 92.3% (see Figure 4). Over the same period, Cancellations and Significant Lateness (CaSL)3 increased to 4.0% (see Figure 5).4
CaSL is the proportion of trains which fail to run at all or fail to call at all booked stops or arrive at their final destination 30 minutes or more later than planned.
ORR’s Network Rail Monitor, Quarters 3-4 of Year 3 of CP5 (16 October 2016 to 31 March 2017): www.orr.gov.uk/rail/economic-regulation/regulation-of-network-rail/monitoring-performance/network-rail-monitor
3
4

9
2. ScopeThe feasibility studies funded through this research call should look at how industry data can be used and analysed to improve network operational performance, with the aim of developing tools that can support and optimise performance management. Therefore, the outputs need to be user friendly, easily interpreted and actionable without the need for further analysis.
The feasibility studies funded by this call will aim to identify novel solutions that will improve the following aspects of operational performance:
A. Predicting and avoiding reactionary delay5 Whilst primary delay has remained relatively stable over the last 4-5 financial years, staying within 300k to 350k delay minutes, the ripple effect caused by each delay – also called reactionary delay – has risen steadily from 600k to almost 800k delay minutes per year. This means that the impact of each primary delay has grown, as the railway is more congested. The rise in reactionary delay has led to a drop in PPM.
These knock-on delays often affect both the route with the issue and any connecting routes. This in turn can mean that trains, drivers and crews aren’t in the right place at the right time to run other services in the day’s timetable.
The current systems are able to identify which train causes reactionary delay to another (A onto B); however, they cannot see the reactionary association (i.e. train A has caused a delay to train B and then train B has delayed train C). An example of a manual process to link delay events is shown below (see Figure 7). Understanding these linkages and the geographical spread of delay is something that is not seen within the industry at a macro level.
Reactionary delay indicates a knock-on effect that a delay to a train has on another train indirectly concerned. See: www.networkrail.co.uk/running-the-railway/looking-after-the-railway/delays-explained/knock-on-delays/
5
Figure 6 A graphical representation of the ripple effect of a reactionary delay. (Source: Network Rail)

10
Some pertinent questions are therefore likely to include, but not to be limited to:
• What is the relationship between initial delay and the subsequent patterns?
• With the data available, can we predict and avoid delays?
• Can we predict the impact of a reactionary delay on the network in order to create a tactical delay methodology?
B. Understanding train movementsWith increasing demands on services and a need to improve the reliability and availability of the railway system, Network Rail needs to make the best use of spare capacity. The amount of time a train spends within a signal block has an impact on network capacity. One of the causes of delays is the lack of berth availability, therefore more effective time scheduling will allow the network to maximize occupancy and optimise capacity.
Adverse weather is another cause of disruptions. Despite the significant investments the problem cannot be easily solved. The industry would therefore benefit from understanding the effect weather has on train performance.
171Y37MO205
YB
021V60MC2014
Primary
551V12MQ203/4
YB/YD
172N27MN206
YA
652N64MR204
YD
321V61MQ203
YB
662L63MR202
YD
652N72MU204
Y1
651V24MV204
YD
812C22MV207/4
YB/YD
772C85MU206
YB
232R84MO203
YB
211B81MM203
YD
121040MN204
YD
Figure 7 Example of a manual process to link delay events. The 10 digit alpha-numeric code indicates a specific train; the second line indicates the number of delay minutes incurred by that train; the third line indicates the reactionary reason code (a full list of reactionary reason codes is available on the competition hub ‘Library’ page).
YA: Lost path - regulated for train running less late
YB: Lost path - regulated for another late running train
YD: Lost path - following another late running train
YI: Late arrival of booked inward stock

11
Asset data could also provide useful insights into network performance. Information about trains (such as their load, class type etc.) and about signals are likely to have an impact on train movements and, by default, on general performance. The same applies to driver behaviour (i.e. being more cautious and driving under the average speed in case of adverse weather, or due to restrictive signalling where sectional running times are not met as a result etc.).
Some pertinent questions are therefore likely to include, but not to be limited to:
• How can data analytics be used to maximise network capacity?
• Could asset information shed some insight into train movement variations?
C. Dwell time variationsDwell time indicates the time taken by the train between the wheel stop and wheel start at the platform; it is determined by various factors: doors opening/closing; passengers boarding and alighting; driver reaction time.
Dwell times have a significant effect on network capacity as it is essential to plan railway timetables. Analysis of dwell time variations indicates that even small ‘sub-threshold’ delays (i.e. tens of seconds) can adversely impact the overall performance of the network. Dwell time varies between platforms, peak/off-peak time and has an impact on subsequent trains, which means that longer dwell-times can increase reactionary delay.
Some pertinent questions are therefore likely to include, but not be limited to:
• What insight can be gained about the causes of long dwell times at certain platforms?
• Could asset information data shed some insight into dwell time variations?
• With the data available, can we understand which parameters affect dwell time the most?
• How can we better predict dwell time and identify influencing factors?
• What can station data tell us about passenger behaviour?
D. Other challengesThe industry faces a range of performance challenges, some shared across the network and others that may be more specific to Network Rail or an operator, a certain area, time of the year etc.
Some data sources are currently not fully exploited, such as position information from GPS trackers and on-train data. These can be used to identify irregularities and discrepancies in performance to improve decision-making and planning.
If your feasibility study idea fits the overall remit of this research call, but does not fit in one of the challenges listed above, please elaborate in your proposal submission to tell us which aspect(s) of network performance it relates to.
Feel free to discuss your idea with us by emailing: [email protected]
YA: Lost path - regulated for train running less late
YB: Lost path - regulated for another late running train
YD: Lost path - following another late running train
YI: Late arrival of booked inward stock

12
Definition of ‘berth’: http://nrodwiki.rockshore.net/index.php/TD_Berths
Definition of ‘train movements’: www.nrodwiki.rockshore.net/index.php/Train_Movements
6
7
3. Data SandboxThere are pockets of data gathered from various sources across the industry. These data resources are often held in silos, making it difficult for individual players to get the best out of them.
In order to make a first step towards breaking down these silos and give bidders a rough idea of what the ‘industry data warehouse’ would look like, this research call will make sample datasets available. This information, in conjunction with openly available industry data, will provide a ‘sandbox’ environment that researchers can access and use to develop innovative solutions.
Please note that the data is in multiple formats with mixed levels of quality and variable recording parameters; in some cases, there might be conflicting information or gaps. Despite the vast amount of data collected, there may still be gaps where more data is needed or datasets that are not fully exploited.
Some of the available data sources include:
• Train event recorder data (On-Train Monitoring Recorder – OTMR or On-Train Data Recorder – OTDR): this is comparable to a train ‘black box’; the data records all train control operations and performance.
• RTPPM (Real Time Public Performance Measure): this shows the performance of trains against the timetable, measured as the percentage of trains arriving at destination on time, and is updated every minute.
• Train Movement data: this is a record of the time at which train movements happen past timetabled calling and passing points. A train movement message is sent whenever a train arrives, passes or departs a location monitored by a system called TRUST.
• Train Describer (TD) feed: this provides details about the position of trains and their train reporting number through a network of berths (usually a berth6 is associated with a signal). A step between berths represents movement of the train from one berth to another. It shows raw data in more detail than the Train Movements7 feed.
• Performance Metrics: this is a combination of Public Performance Measure (PPM) and Cancellation and significant lateness data (CaSL)
• Darwin: provides real-time arrival and departure predictions, platform numbers, delay estimates, as well as real-time schedule changes and cancellations. It powers all National Rail Enquiry and train operator customer-facing real-time information tools, including websites, mobile apps and train station departure board screens
• Knowledgebase: contains a wealth of static and real-time information, such as information about station facilities, service disruption, and engineering work
• Weather data: this data is collected by the Met Office and captures details such as temperature; wind speed/direction; humidity; precipitation; snow depth (if any); dew point and other general weather information.
For a full list of the sample datasets available, please visit the ‘Data Sandbox’, which is accessible through the competition hub: www.rruka.wavecast.io/datasandbox/data-sandbox (Note: You must agree to the T&Cs outlined on the website before you can gain access).
13
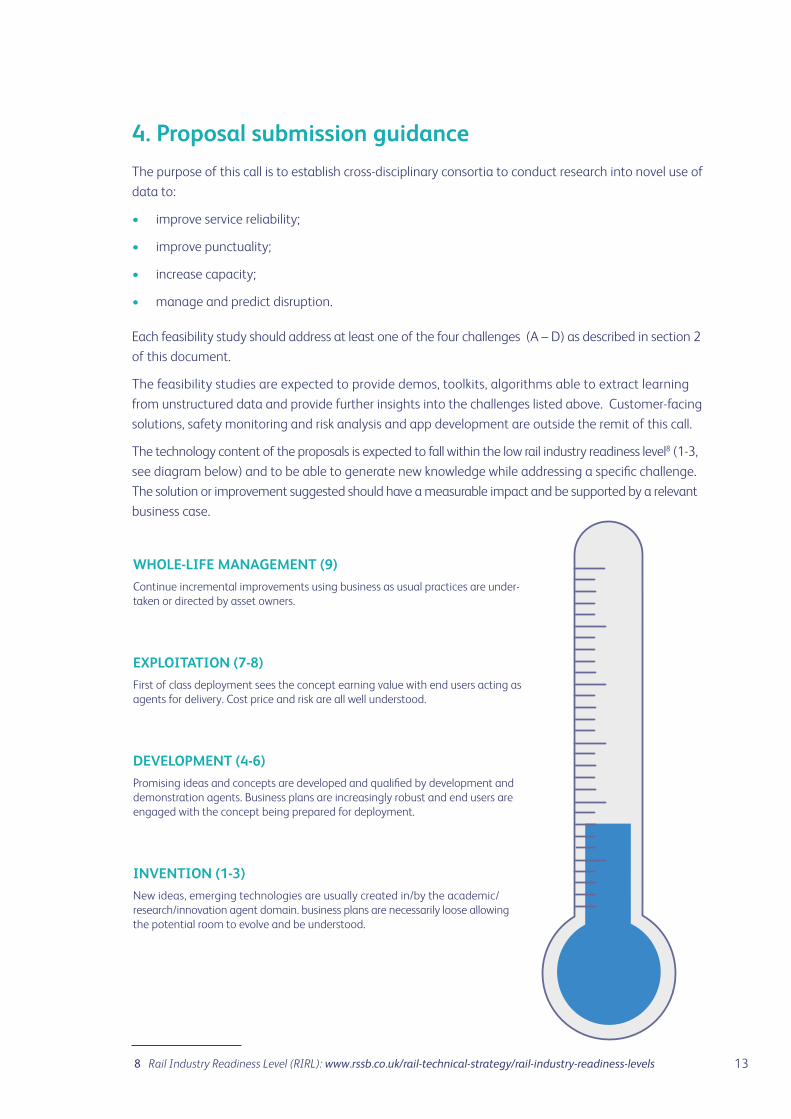
4. Proposal submission guidanceThe purpose of this call is to establish cross-disciplinary consortia to conduct research into novel use of data to:
• improve service reliability;
• improve punctuality;
• increase capacity;
• manage and predict disruption.
Each feasibility study should address at least one of the four challenges (A – D) as described in section 2 of this document.
The feasibility studies are expected to provide demos, toolkits, algorithms able to extract learning from unstructured data and provide further insights into the challenges listed above. Customer-facing solutions, safety monitoring and risk analysis and app development are outside the remit of this call.
The technology content of the proposals is expected to fall within the low rail industry readiness level8 (1-3, see diagram below) and to be able to generate new knowledge while addressing a specific challenge. The solution or improvement suggested should have a measurable impact and be supported by a relevant business case.
Rail Industry Readiness Level (RIRL): www.rssb.co.uk/rail-technical-strategy/rail-industry-readiness-levels8
WHOLE-LIFE MANAGEMENT (9)Continue incremental improvements using business as usual practices are under-taken or directed by asset owners.
EXPLOITATION (7-8)First of class deployment sees the concept earning value with end users acting as agents for delivery. Cost price and risk are all well understood.
DEVELOPMENT (4-6)Promising ideas and concepts are developed and qualified by development and demonstration agents. Business plans are increasingly robust and end users are engaged with the concept being prepared for deployment.
INVENTION (1-3)New ideas, emerging technologies are usually created in/by the academic/research/innovation agent domain. business plans are necessarily loose allowing the potential room to evolve and be understood.

14
4.1 A fresh approachInter-departmental collaboration is highly recommended. Potential bidders are encouraged to think beyond traditional constraints and foster collaborations with colleagues in disciplines and backgrounds different to those they would normally collaborate with.
The proposals must demonstrate both a good understanding of the chosen challenge and an awareness of relevant research that has already been undertaken in the area.
4.2 Proposal format and guidanceWe are expecting good quality proposals, clearly written and formatted. You must use the proposal template provided, which is available via the webinar hub9.
Your proposal should be between 8-12 pages long and should include the following:
• Description of the proposed research including clear scope and objectives; methodology; break-down of tasks; description of expected deliverables for each task and associated delivery dates. (4-6 pages max.)
• Workplan: a Gantt chart or other graphic representation comprehensive of milestones, activities and deliverable dates. (1 page max.)
• Pathway to impact: this should be a high-level description of next steps and an explanation of all the associated potential benefits to the industry, should the proposal be successful. This section is expected to be kept live during the life of the project (1-2 pages max.)
• Justification of resources: Breakdown of costs using the template provided. Feasibility studies should be cost at 80% FEC. (1 page max.)
• Track record: a list of all academic consortium members and industry supporters (if any), which should detail the relevant expertise that each investigator will bring to the research. (1-2 pages max.)
• Short summary which we will upload on SPARK, if your feasibility study is selected and funded. (half page)
Please note that the assessment panel may request additional clarifications or ask for a proposal to be resubmitted if it does not meet the required format.
Data Sandbox webinar hub: www.rruka.wavecast.io/datasandbox 9
15
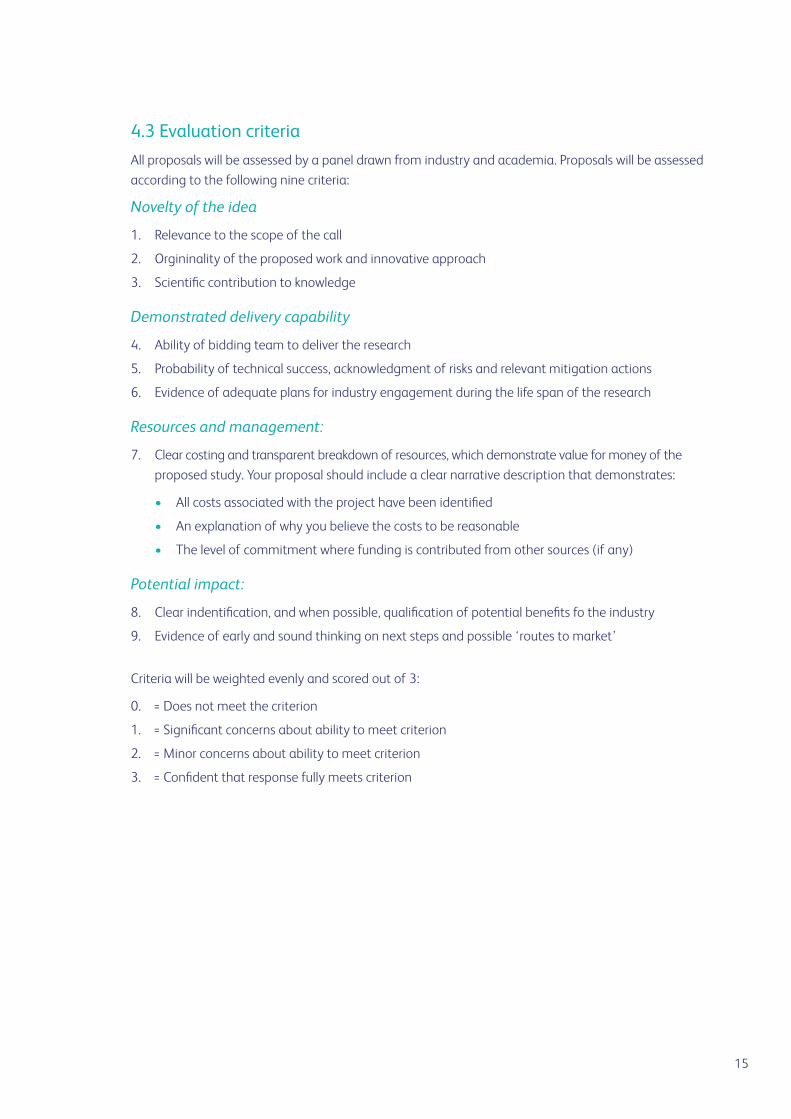
4.3 Evaluation criteriaAll proposals will be assessed by a panel drawn from industry and academia. Proposals will be assessed according to the following nine criteria:
Novelty of the idea
1. Relevance to the scope of the call
2. Orgininality of the proposed work and innovative approach
3. Scientific contribution to knowledge
Demonstrated delivery capability
4. Ability of bidding team to deliver the research
5. Probability of technical success, acknowledgment of risks and relevant mitigation actions
6. Evidence of adequate plans for industry engagement during the life span of the research
Resources and management:
7. Clear costing and transparent breakdown of resources, which demonstrate value for money of the proposed study. Your proposal should include a clear narrative description that demonstrates:
• All costs associated with the project have been identified
• An explanation of why you believe the costs to be reasonable
• The level of commitment where funding is contributed from other sources (if any)
Potential impact:
8. Clear indentification, and when possible, qualification of potential benefits fo the industry
9. Evidence of early and sound thinking on next steps and possible ‘routes to market’
Criteria will be weighted evenly and scored out of 3:
0. = Does not meet the criterion
1. = Significant concerns about ability to meet criterion
2. = Minor concerns about ability to meet criterion
3. = Confident that response fully meets criterion

16
4.4 Consortia guidanceA successful consortium is likely to consist of participants with a range of disciplinary perspectives and different rail expertise.
• Academic input: Researchers from non-UK based universities or research institutes can participate but they need to be part of a consortium where at least one member is a UK-based institution.
• Industry input: Consortia should include industry experts. Industry representatives are encouraged to provide their in-kind support.
• Contractual arrangements: Consortia must be academic-led. The funding will be given to the lead academic partner to manage.
4.5 Funding If a proposal is accepted, each consortium must appoint a lead academic partner, who will be responsible for receiving and managing the funding accordingly. RSSB will contract directly with the lead academic partner.
RSSB will issue a grant agreement. The lead academic partner is required to sign and return it with 30 days of receipt or funding may be withdrawn.
RSSB will fund as many feasibility studies as can be afforded within the available £500,000 funding. Potential bidders should note that 4 to 8 feasibility studies are expected to be funded, spread across the different challenges. RSSB will pay 50% of the contribution at the start and 50% at completion, upon acceptance of the final deliverable.
A sample agreement is available on the webinar hub10 for reference. Bidders are encouraged to review the grant agreement and submit any changes together with their proposal. This will enable us to accelerate the procurement process.
We expect all feasibility studies to be in contract by March 2018.
Data Sandbox webinar hub: www.rruka.wavecast.io/datasandbox 10

17
5. Future funding opportunitiesOnce the successful feasibility studies have been completed, and if they demonstrate the required stage of development, they could be considered for trials and demonstration or for additional funding via other mechanisms. The timescale over which this could happen will depend on the nature of the project itself.
We encourage interested bidders to establish contacts with relevant industry stakeholders early on. RSSB will facilitate contact with industry representatives, should the academics require support with this.Dissemination and networking opportunities will be made available throughout the life of the feasibility studies.
6. Key datesAn information day will be held on 31 October 2017 at Code Node – Skills Matter, in London. The recording of the event, proceedings and background material are available on the webinar hub, which can be accessed via the following link: www.rruka.wavecast.io/datasandbox
From the hub, you will also be able to download the feasibility study template, the master pricing sheet and the grant agreement.
All the proposals should be submitted by 17:00 on 22 December 2017 via email to [email protected]
Please use “Data Sandbox Competition” in the email subject. The submission should include:
• Project proposal using the feasibility study template provided
• Master pricing sheet
For any questions, please contact: [email protected]
Twitter: #RRUKAsandbox
Feasibility studies proposals due 22 December 2017
Winning bids will be announced Early February 2018
Contracts to be in place by Early March 2018
Feasibility studies to start By end of March 2018
Outcomes to be presented at the RRUKA Annual Conference November 2019

18
NOTES

19
NOTES

20
RRUKARAIL RESEARCHUK ASSOCIATION
Email: [email protected]: +44 (0) 20 3142 5300Twitter: @RSSB_railWeb: www.rssb.co.uk
Email: [email protected] Twitter: @RRUK_AWeb: www.rruka.org.uk
RSSB, The Helicon One South PlaceLondon EC2M 2RB


![DDS C ,bc ]^ - NEDO · DDS ˘ˇˆ ... DSBL 3.70 ppm DSBL 1.23 ppm BC 100.00 ppm BC 33.33 ppm BC 11.11 ppm BC 3.70 ppm BC 1.23 ppm DMCBL 100.00 ppm DMCBL 33.33 ppm DMCBL 11.11 ppm](https://img.pdfslide.net/doc/110x75/5ad6c02a7f8b9a6d708e8ad8/dds-c-bc-dsbl-370-ppm-dsbl-123-ppm-bc-10000-ppm-bc-3333-ppm.jpg)