Embed Size (px)
Citation preview
Cisco BTS 102OL-25016-02
C H A P T E R 4
Call Processing TroubleshootingRevised: May 14, 2012, OL-25016-02
IntroductionThis chapter provides the information needed for monitoring and troubleshooting call processing events and alarms. This chapter is divided into the following sections:
• Call Processing Events and Alarms—Provides a brief overview of each call processing event and alarm
• Monitoring Call Processing Events—Provides the information needed for monitoring and correcting the call processing events
• Troubleshooting Call Processing Alarms—Provides the information needed for troubleshooting and correcting the call processing alarms
For additional call processing routing and translation information, refer to the Cisco BTS 10200 Softswitch Routing and Dial Plan Guide, Release 6.0.4.
Note The following billing records are created when a call is rejected due to overload conditions:
• SS7 termination cause code 42• Cable signaling stop event cause code “resource unavailable”
Calls rejected by the signaling adapter will not generate a billing record.
4-100 Softswitch Troubleshooting Guide, Release 6.0.4
Chapter 4 Call Processing TroubleshootingCall Processing Events and Alarms
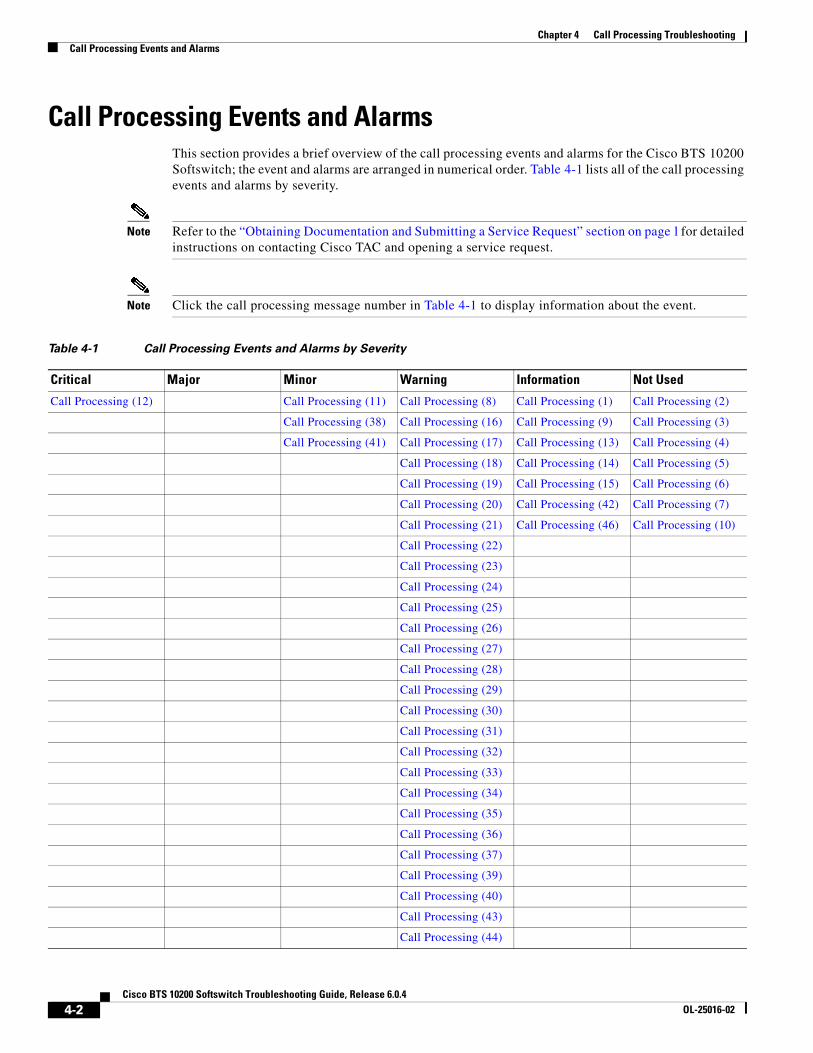
Call Processing Events and AlarmsThis section provides a brief overview of the call processing events and alarms for the Cisco BTS 10200 Softswitch; the event and alarms are arranged in numerical order. Table 4-1 lists all of the call processing events and alarms by severity.
Note Refer to the “Obtaining Documentation and Submitting a Service Request” section on page l for detailed instructions on contacting Cisco TAC and opening a service request.
Note Click the call processing message number in Table 4-1 to display information about the event.
Table 4-1 Call Processing Events and Alarms by Severity
Critical Major Minor Warning Information Not Used
Call Processing (12) Call Processing (11) Call Processing (8) Call Processing (1) Call Processing (2)
Call Processing (38) Call Processing (16) Call Processing (9) Call Processing (3)
Call Processing (41) Call Processing (17) Call Processing (13) Call Processing (4)
Call Processing (18) Call Processing (14) Call Processing (5)
Call Processing (19) Call Processing (15) Call Processing (6)
Call Processing (20) Call Processing (42) Call Processing (7)
Call Processing (21) Call Processing (46) Call Processing (10)
Call Processing (22)
Call Processing (23)
Call Processing (24)
Call Processing (25)
Call Processing (26)
Call Processing (27)
Call Processing (28)
Call Processing (29)
Call Processing (30)
Call Processing (31)
Call Processing (32)
Call Processing (33)
Call Processing (34)
Call Processing (35)
Call Processing (36)
Call Processing (37)
Call Processing (39)
Call Processing (40)
Call Processing (43)
Call Processing (44)
4-2Cisco BTS 10200 Softswitch Troubleshooting Guide, Release 6.0.4
OL-25016-02

Chapter 4 Call Processing TroubleshootingCall Processing Events and Alarms
Call Processing (1)Table 4-2 lists the details of the Call Processing (1) informational event. For additional information, refer to the “Test Report—Call Processing (1)” section on page 4-27.
Call Processing (2)Call Processing (2) is not used.
Call Processing (3)Call Processing (3) is not used.
Call Processing (4)Call Processing (4) is not used.
Call Processing (5)Call Processing (5) is not used.
Call Processing (6)Call Processing (6) is not used.
Call Processing (7)Call Processing (7) is not used.
Call Processing (45)
Call Processing (47)
Table 4-1 Call Processing Events and Alarms by Severity (continued)
Critical Major Minor Warning Information Not Used
Table 4-2 Call Processing (1) Details
Description Test Report
Severity Information
Threshold 10000
Throttle 0
4-3Cisco BTS 10200 Softswitch Troubleshooting Guide, Release 6.0.4
OL-25016-02
Chapter 4 Call Processing TroubleshootingCall Processing Events and Alarms
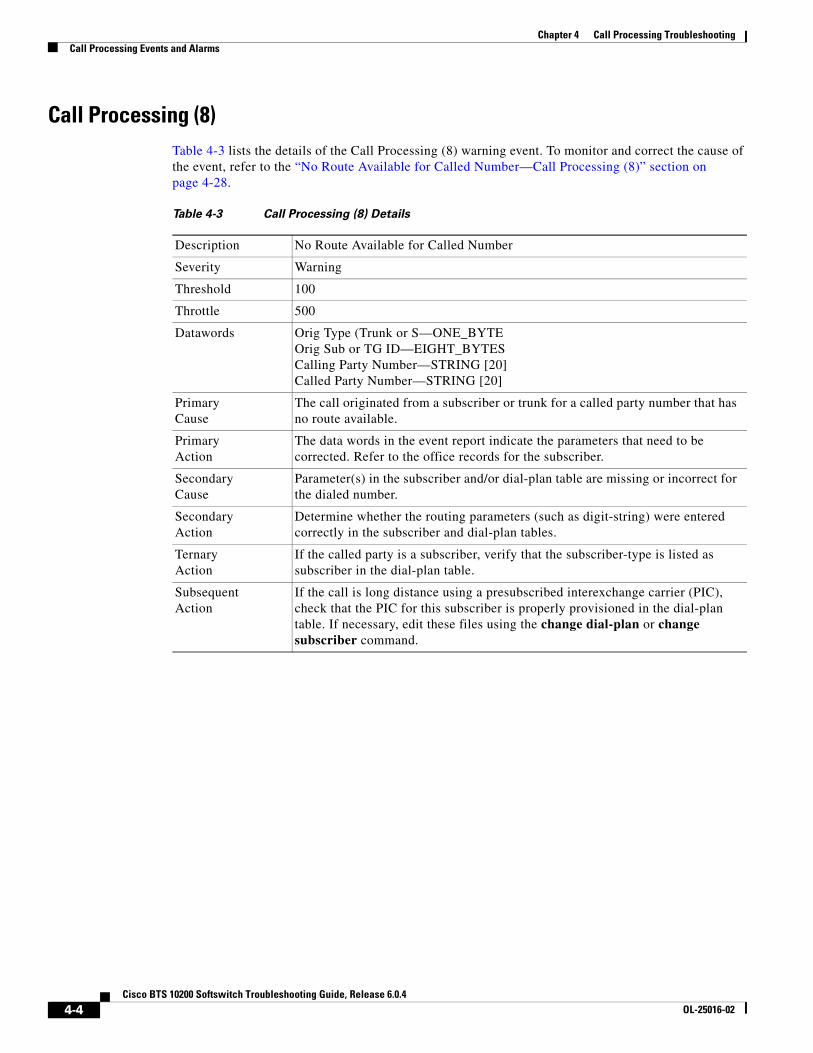
Call Processing (8)Table 4-3 lists the details of the Call Processing (8) warning event. To monitor and correct the cause of the event, refer to the “No Route Available for Called Number—Call Processing (8)” section on page 4-28.
Table 4-3 Call Processing (8) Details
Description No Route Available for Called Number
Severity Warning
Threshold 100
Throttle 500
Datawords Orig Type (Trunk or S—ONE_BYTEOrig Sub or TG ID—EIGHT_BYTESCalling Party Number—STRING [20]Called Party Number—STRING [20]
PrimaryCause
The call originated from a subscriber or trunk for a called party number that has no route available.
PrimaryAction
The data words in the event report indicate the parameters that need to be corrected. Refer to the office records for the subscriber.
SecondaryCause
Parameter(s) in the subscriber and/or dial-plan table are missing or incorrect for the dialed number.
SecondaryAction
Determine whether the routing parameters (such as digit-string) were entered correctly in the subscriber and dial-plan tables.
TernaryAction
If the called party is a subscriber, verify that the subscriber-type is listed as subscriber in the dial-plan table.
SubsequentAction
If the call is long distance using a presubscribed interexchange carrier (PIC), check that the PIC for this subscriber is properly provisioned in the dial-plan table. If necessary, edit these files using the change dial-plan or change subscriber command.
4-4Cisco BTS 10200 Softswitch Troubleshooting Guide, Release 6.0.4
OL-25016-02

Chapter 4 Call Processing TroubleshootingCall Processing Events and Alarms
Call Processing (9)Table 4-4 lists the details of the Call Processing (9) informational event. For additional information, refer to the “No Route Available for Carrier Dialed—Call Processing (9)” section on page 4-28.
Call Processing (10)Call Processing (10) is not used.
Table 4-4 Call Processing (9) Details
Description No Route Available for Carrier Dialed
Severity Information
Threshold 100
Throttle 0
Datawords Orig Type Trunk or S—ONE_BYTEOrig Sub or TG ID—EIGHT_BYTESCalling Party Number—STRING [20]Called Party Number—STRING [20]Carrier Code Dialed—STRING [20]
PrimaryCause
No route is available for the interexchange carrier (IXC) dialed.
PrimaryAction
The data words in the event report indicate the parameters that need to be corrected. Refer to the office records for the carrier.
SecondaryCause
Parameter(s) in the carrier and/or route-grp table are missing or incorrect for the carrier.
SecondaryAction
Determine whether the routing parameters were entered correctly in the carrier and/or route-grp tables.
TernaryAction
If the carrier-identification (ID) or route-grp-ID is not specified or is incorrect in the dial-plan table, enter the correct value. Use the change carrier or change route-grp command.
4-5Cisco BTS 10200 Softswitch Troubleshooting Guide, Release 6.0.4
OL-25016-02

Chapter 4 Call Processing TroubleshootingCall Processing Events and Alarms
Call Processing (11)Table 4-5 lists the details of the Call Processing (11) minor alarm. To troubleshoot and correct the cause of the alarm, refer to the “Feature Server One Link Down—Call Processing (11)” section on page 4-36.
Call Processing (12)Table 4-6 lists the details of the Call Processing (12) critical alarm. To troubleshoot and correct the cause of the alarm, refer to the “Feature Server Both Links Down—Call Processing (12)” section on page 4-38.
Table 4-5 Call Processing (11) Details
Description Feature Server One Link Down
Severity Minor
Threshold 100
Throttle 0
Datawords Interface Name—STRING [65]Interface IP Address—STRING [65]
PrimaryCause
The hardware is broken.
PrimaryAction
Check the link interfaces.
Table 4-6 Call Processing (12) Details
Description Feature Server Both Links Down
Severity Critical
Threshold 100
Throttle 0
Datawords Interface Name—STRING [65]Interface IP Address—STRING [65]Interface Name—STRING [65]Interface IP Address—STRING [65]
PrimaryCause
The hardware is broken.
PrimaryAction
Check the link interfaces.
4-6Cisco BTS 10200 Softswitch Troubleshooting Guide, Release 6.0.4
OL-25016-02
Chapter 4 Call Processing TroubleshootingCall Processing Events and Alarms
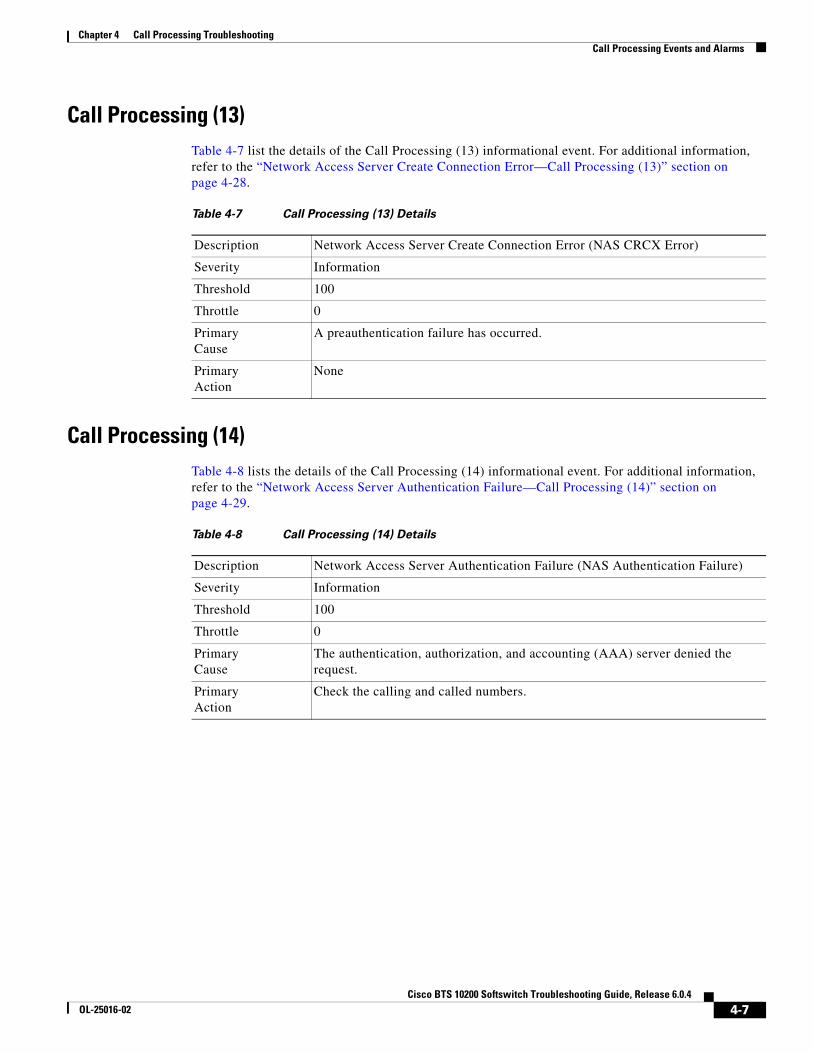
Call Processing (13)Table 4-7 list the details of the Call Processing (13) informational event. For additional information, refer to the “Network Access Server Create Connection Error—Call Processing (13)” section on page 4-28.
Call Processing (14)Table 4-8 lists the details of the Call Processing (14) informational event. For additional information, refer to the “Network Access Server Authentication Failure—Call Processing (14)” section on page 4-29.
Table 4-7 Call Processing (13) Details
Description Network Access Server Create Connection Error (NAS CRCX Error)
Severity Information
Threshold 100
Throttle 0
PrimaryCause
A preauthentication failure has occurred.
PrimaryAction
None
Table 4-8 Call Processing (14) Details
Description Network Access Server Authentication Failure (NAS Authentication Failure)
Severity Information
Threshold 100
Throttle 0
PrimaryCause
The authentication, authorization, and accounting (AAA) server denied the request.
PrimaryAction
Check the calling and called numbers.
4-7Cisco BTS 10200 Softswitch Troubleshooting Guide, Release 6.0.4
OL-25016-02

Chapter 4 Call Processing TroubleshootingCall Processing Events and Alarms
Call Processing (15)Table 4-9 lists the details of the Call Processing (15) informational event. For additional information, refer to the “Cable Modem Termination System Easily Recognizable Identification Not Found in Media Gateway Table—Call Processing (15)” section on page 4-29.
Call Processing (16)Table 4-10 lists the details of the Call Processing (16) warning event. To monitor and correct the cause of the event, refer to the “Route Index Has No Trunk Group Assigned—Call Processing (16)” section on page 4-29.
Table 4-9 Call Processing (15) Details
Description Cable Modem Termination System Easily Recognizable Identification Not Found in Media Gateway Table (CMTS ER ID Not Found in MGW Table)
Severity Information
Threshold 100
Throttle 0
Datawords MGW-NAME—STRING [80]
PrimaryCause
The cable modem termination system (CMTS) easily recognizable (ER) entry was not found in the Media Gateway Table.
PrimaryAction
Provision the CMTS-ER index in the Media Gateway Table.
Table 4-10 Call Processing (16) Details
Description Route Index has No Trunk Group Assigned
Severity Warning
Threshold 100
Throttle 0
Datawords Route Index—FOUR_BYTES
PrimaryCause
A trunk group was not assigned to the given route.
PrimaryAction
Provision a trunk group for the associated route index.
4-8Cisco BTS 10200 Softswitch Troubleshooting Guide, Release 6.0.4
OL-25016-02

Chapter 4 Call Processing TroubleshootingCall Processing Events and Alarms
Call Processing (17)Table 4-11 lists the details of the Call Processing (17) warning event. To monitor and correct the cause of the event, refer to the “Invalid Route Index Used—Call Processing (17)” section on page 4-29.
Call Processing (18)Table 4-12 lists the details of the Call Processing (18) warning event. To monitor and correct the cause of the event, refer to the “Unable to Play Announcement—Call Processing (18)” section on page 4-29.
Table 4-11 Call Processing (17) Details
Description Invalid Route Index Used
Severity Warning
Threshold 100
Throttle 0
Datawords Route Index—FOUR_BYTES
PrimaryCause
An invalid route index was used.
PrimaryAction
Correct the provisioning and assign a valid route index.
Table 4-12 Call Processing (18) Details
Description Unable to Play Announcement
Severity Warning
Threshold 100
Throttle 0
Datawords Announcement Index—FOUR_BYTES
PrimaryCause
An announcement was not provisioned correctly.
PrimaryAction
Provision the announcement.
4-9Cisco BTS 10200 Softswitch Troubleshooting Guide, Release 6.0.4
OL-25016-02

Chapter 4 Call Processing TroubleshootingCall Processing Events and Alarms
Call Processing (19)Table 4-13 lists the details of the Call Processing (19) warning event. To monitor and correct the cause of the event, refer to the “Call Routed to Unprovisioned Subscriber—Call Processing (19)” section on page 4-29.
Call Processing (20)Table 4-14 lists the details of the Call Processing (20) warning event. To monitor and correct the cause of the event, refer to the “No Route or Trunk Group Available to Route Call—Call Processing (20)” section on page 4-30.
Table 4-13 Call Processing (19) Details
Description Call Routed to Unprovisioned Subscriber
Severity Warning
Threshold 100
Throttle 0
Datawords Subscriber Index—FOUR_BYTESDirectory Number Dialed—STRING [20]
PrimaryCause
A subscriber was not provisioned correctly.
PrimaryAction
Provision the subscriber.
Table 4-14 Call Processing (20) Details
Description No Route or Trunk Group Available to Route Call
Severity Warning
Threshold 100
Throttle 0
Datawords Calling Number—STRING [20]Called Number—STRING [20]Route Index—FOUR_BYTESTrunk Group ID—FOUR_BYTES
PrimaryCause
A Trunk Group was not provisioned correctly in the route.
PrimaryAction
Verify the route and trunk group provisioning.
4-10Cisco BTS 10200 Softswitch Troubleshooting Guide, Release 6.0.4
OL-25016-02

Chapter 4 Call Processing TroubleshootingCall Processing Events and Alarms
Call Processing (21)Table 4-15 lists the details of the Call Processing (21) warning event. To monitor and correct the cause of the event, refer to the “Call Released Due to Maximum Hop Count Exceeded—Call Processing (21)” section on page 4-30.
Call Processing (22)Table 4-16 lists the details of the Call Processing (22) warning event. To monitor and correct the cause of the event, refer to the “Trunk Group Index Read Failure—Call Processing (22)” section on page 4-30.
Table 4-15 Call Processing (21) Details
Description Call Released Due to Maximum Hop Count Exceeded
Severity Warning
Threshold 100
Throttle 0
Datawords Calling Number—STRING [20]Called Number—STRING [20]Hop Count—FOUR_BYTES
PrimaryCause
The number of hops between destinations is excessive.
PrimaryAction
Reduce number of hops between destinations.
Table 4-16 Call Processing (22) Details
Description Trunk Group Index Read Failure
Severity Warning
Threshold 100
Throttle 0
Datawords Trunk Group Index—FOUR_BYTESCall Index—FOUR_BYTES
PrimaryCause
The Trunk Group Index could not be retrieved from call data.
PrimaryAction
Check the provisioning.
4-11Cisco BTS 10200 Softswitch Troubleshooting Guide, Release 6.0.4
OL-25016-02
Chapter 4 Call Processing TroubleshootingCall Processing Events and Alarms
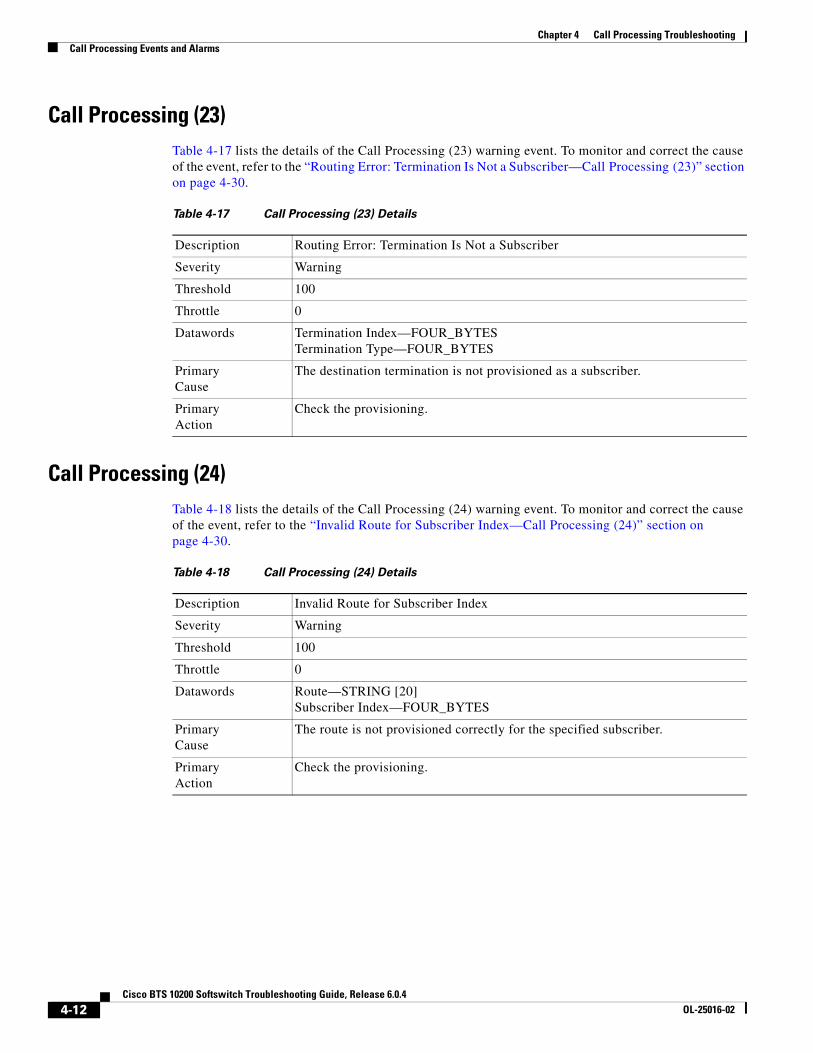
Call Processing (23)Table 4-17 lists the details of the Call Processing (23) warning event. To monitor and correct the cause of the event, refer to the “Routing Error: Termination Is Not a Subscriber—Call Processing (23)” section on page 4-30.
Call Processing (24)Table 4-18 lists the details of the Call Processing (24) warning event. To monitor and correct the cause of the event, refer to the “Invalid Route for Subscriber Index—Call Processing (24)” section on page 4-30.
Table 4-17 Call Processing (23) Details
Description Routing Error: Termination Is Not a Subscriber
Severity Warning
Threshold 100
Throttle 0
Datawords Termination Index—FOUR_BYTESTermination Type—FOUR_BYTES
PrimaryCause
The destination termination is not provisioned as a subscriber.
PrimaryAction
Check the provisioning.
Table 4-18 Call Processing (24) Details
Description Invalid Route for Subscriber Index
Severity Warning
Threshold 100
Throttle 0
Datawords Route—STRING [20]Subscriber Index—FOUR_BYTES
PrimaryCause
The route is not provisioned correctly for the specified subscriber.
PrimaryAction
Check the provisioning.
4-12Cisco BTS 10200 Softswitch Troubleshooting Guide, Release 6.0.4
OL-25016-02
Chapter 4 Call Processing TroubleshootingCall Processing Events and Alarms
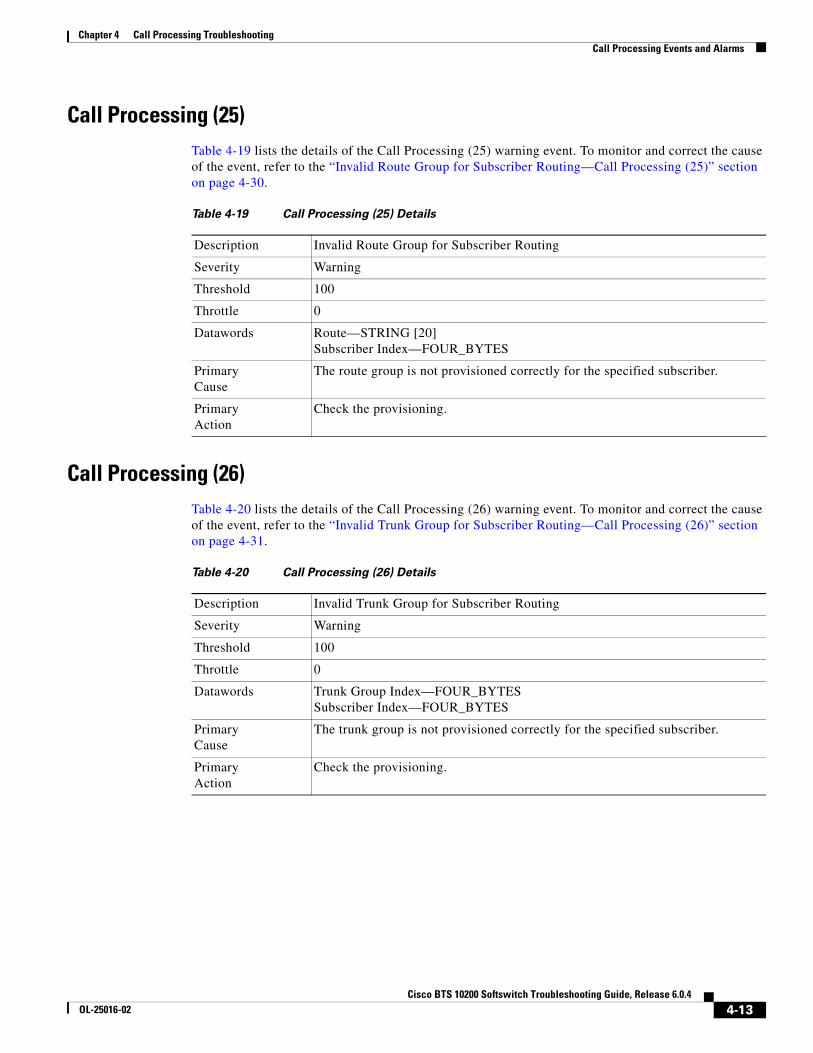
Call Processing (25)Table 4-19 lists the details of the Call Processing (25) warning event. To monitor and correct the cause of the event, refer to the “Invalid Route Group for Subscriber Routing—Call Processing (25)” section on page 4-30.
Call Processing (26)Table 4-20 lists the details of the Call Processing (26) warning event. To monitor and correct the cause of the event, refer to the “Invalid Trunk Group for Subscriber Routing—Call Processing (26)” section on page 4-31.
Table 4-19 Call Processing (25) Details
Description Invalid Route Group for Subscriber Routing
Severity Warning
Threshold 100
Throttle 0
Datawords Route—STRING [20]Subscriber Index—FOUR_BYTES
PrimaryCause
The route group is not provisioned correctly for the specified subscriber.
PrimaryAction
Check the provisioning.
Table 4-20 Call Processing (26) Details
Description Invalid Trunk Group for Subscriber Routing
Severity Warning
Threshold 100
Throttle 0
Datawords Trunk Group Index—FOUR_BYTESSubscriber Index—FOUR_BYTES
PrimaryCause
The trunk group is not provisioned correctly for the specified subscriber.
PrimaryAction
Check the provisioning.
4-13Cisco BTS 10200 Softswitch Troubleshooting Guide, Release 6.0.4
OL-25016-02

Chapter 4 Call Processing TroubleshootingCall Processing Events and Alarms
Call Processing (27)Table 4-21 lists the details of the Call Processing (27) warning event. To monitor and correct the cause of the event, refer to the “Unable to Route: Blocked by Destination Subscriber Status—Call Processing (27)” section on page 4-31.
Call Processing (28)Table 4-22 lists the details of the Call Processing (28) warning event. To monitor and correct the cause of the event, refer to the “Route Name Does Not Exist—Call Processing (28)” section on page 4-31.
Table 4-21 Call Processing (27) Details
Description Unable to Route: Blocked by Destination Subscriber Status
Severity Warning
Threshold 100
Throttle 0
Datawords Subscriber Index—FOUR_BYTESSubscriber Status—STRING [20]
PrimaryCause
The subscriber provisioning is not in the correct state.
PrimaryAction
Check the provisioning.
Table 4-22 Call Processing (28) Details
Description Route Name Does Not Exist
Severity Warning
Threshold 100
Throttle 0
Datawords Route Name—STRING [40]
PrimaryCause
The route is not correctly provisioned.
PrimaryAction
Check the provisioning.
4-14Cisco BTS 10200 Softswitch Troubleshooting Guide, Release 6.0.4
OL-25016-02

Chapter 4 Call Processing TroubleshootingCall Processing Events and Alarms
Call Processing (29)Table 4-23 lists the details of the Call Processing (29) warning event. To monitor and correct the cause of the event, refer to the “Routing Selection Failure—Call Processing (29)” section on page 4-31.
Call Processing (30)Table 4-24 lists the details of the Call Processing (30) warning event. To monitor and correct the cause of the event, refer to the “Customer-Originated Trace Test Failed—Call Processing (30)” section on page 4-31.
Table 4-23 Call Processing (29) Details
Description Routing Selection Failure
Severity Warning
Threshold 100
Throttle 0
Datawords Route Index—FOUR_BYTESCalling Number—STRING [20]Called Number—STRING [20]
PrimaryCause
The route is not correctly provisioned.
PrimaryAction
Check the provisioning.
Table 4-24 Call Processing (30) Details
Description Customer-Originated Trace Test Failed (COT Test Failed)
Severity Warning
Threshold 100
Throttle 0
Datawords Termination Index—FOUR_BYTES
PrimaryCause
A customer-originated trace (COT) test has failed.
PrimaryAction
Contact the Cisco Technical Assistance Center (TAC) for information on how to further debug the problem.
4-15Cisco BTS 10200 Softswitch Troubleshooting Guide, Release 6.0.4
OL-25016-02

Chapter 4 Call Processing TroubleshootingCall Processing Events and Alarms
Call Processing (31)Table 4-25 lists the details of the Call Processing (31) warning event. To monitor and correct the cause of the event, refer to the “Call Authorization Failure—Call Processing (31)” section on page 4-31.
Call Processing (32)Table 4-26 lists the details of the Call Processing (32) warning event. To monitor and correct the cause of the event, refer to the “Country Code Dialing Plan Error—Call Processing (32)” section on page 4-31.
Table 4-25 Call Processing (31) Details
Description Call Authorization Failure
Severity Warning
Threshold 100
Throttle 0
Datawords Calling Number—STRING [20]Called Number—STRING [20]
PrimaryCause
Due to incorrect provisioning the call cannot be completed.
PrimaryAction
Contact Cisco TAC for more information.
Table 4-26 Call Processing (32) Details
Description Country Code Dialing Plan Error
Severity Warning
Threshold 100
Throttle 0
Datawords Called Number—STRING [20]Dial Plan Index—FOUR_BYTES
PrimaryCause
The country code was not found in the dial plan.
PrimaryAction
Check the provisioning.
4-16Cisco BTS 10200 Softswitch Troubleshooting Guide, Release 6.0.4
OL-25016-02

Chapter 4 Call Processing TroubleshootingCall Processing Events and Alarms
Call Processing (33)Table 4-27 lists the details of the Call Processing (33) warning event. To monitor and correct the cause of the event, refer to the “Invalid Call—Call Processing (33)” section on page 4-32.
Call Processing (34)Table 4-28 lists the details of the Call Processing (34) warning event. To monitor and correct the cause of the event, refer to the “Dial Plan Information Not Found for Digits Received—Call Processing (34)” section on page 4-32.
Table 4-27 Call Processing (33) Details
Description Invalid Call
Severity Warning
Threshold 100
Throttle 0
Datawords Calling Number—STRING [20]Called Number—STRING [20]
PrimaryCause
The call could not be completed because the number entered was invalid.
PrimaryAction
Check the provisioning and the number dialed.
Table 4-28 Call Processing (34) Details
Description Dial Plan Information Not Found for Digits Received
Severity Warning
Threshold 100
Throttle 0
Datawords Calling Number—STRING [20]Called Number—STRING [20]Dial Plan Index—FOUR_BYTES
PrimaryCause
The call could not be completed because the number entered could not be located in the dial plan.
PrimaryAction
Check the provisioning and the number dialed.
4-17Cisco BTS 10200 Softswitch Troubleshooting Guide, Release 6.0.4
OL-25016-02
Chapter 4 Call Processing TroubleshootingCall Processing Events and Alarms
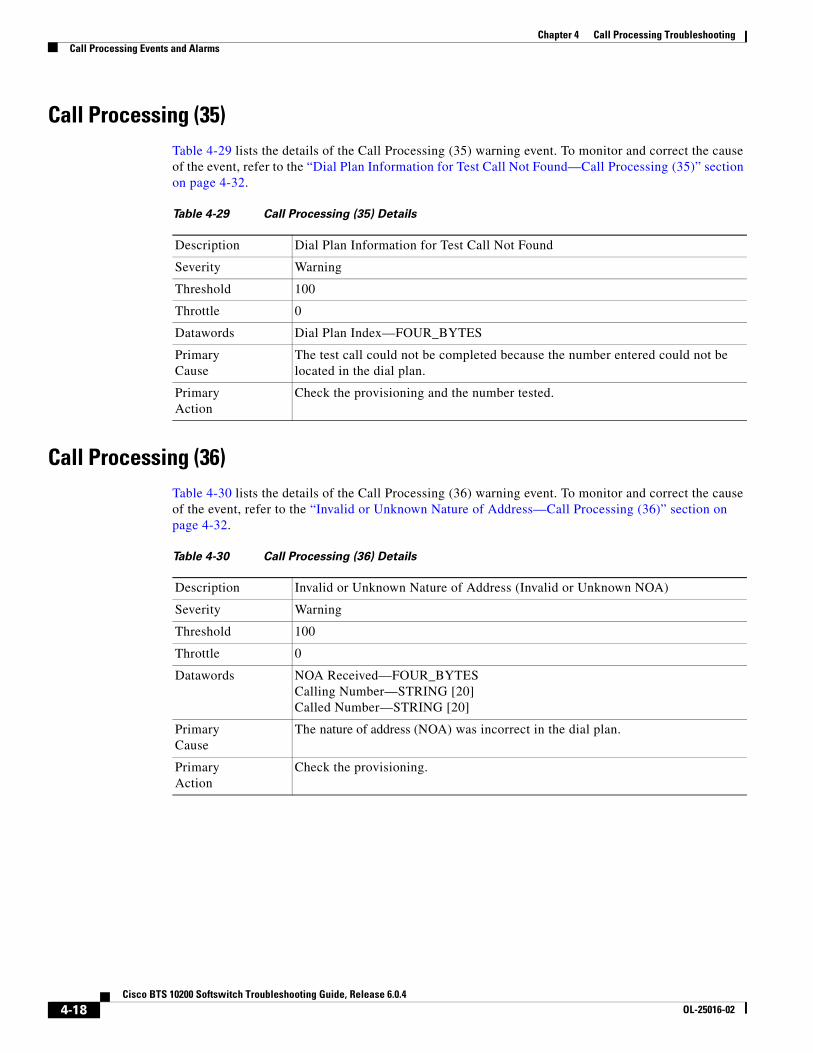
Call Processing (35)Table 4-29 lists the details of the Call Processing (35) warning event. To monitor and correct the cause of the event, refer to the “Dial Plan Information for Test Call Not Found—Call Processing (35)” section on page 4-32.
Call Processing (36)Table 4-30 lists the details of the Call Processing (36) warning event. To monitor and correct the cause of the event, refer to the “Invalid or Unknown Nature of Address—Call Processing (36)” section on page 4-32.
Table 4-29 Call Processing (35) Details
Description Dial Plan Information for Test Call Not Found
Severity Warning
Threshold 100
Throttle 0
Datawords Dial Plan Index—FOUR_BYTES
PrimaryCause
The test call could not be completed because the number entered could not be located in the dial plan.
PrimaryAction
Check the provisioning and the number tested.
Table 4-30 Call Processing (36) Details
Description Invalid or Unknown Nature of Address (Invalid or Unknown NOA)
Severity Warning
Threshold 100
Throttle 0
Datawords NOA Received—FOUR_BYTESCalling Number—STRING [20]Called Number—STRING [20]
PrimaryCause
The nature of address (NOA) was incorrect in the dial plan.
PrimaryAction
Check the provisioning.
4-18Cisco BTS 10200 Softswitch Troubleshooting Guide, Release 6.0.4
OL-25016-02

Chapter 4 Call Processing TroubleshootingCall Processing Events and Alarms
Call Processing (37)Table 4-31 lists the details of the Call Processing (37) warning event. To monitor and correct the cause of the event, refer to the “Call Failure—Call Processing (37)” section on page 4-32.
Call Processing (38)Table 4-32 lists the details of the Call Processing (38) minor alarm. To troubleshoot and correct the cause of the alarm, refer to the “Release Cause 25 Exchange Routing Error Received—Call Processing (38)” section on page 4-39.
Table 4-31 Call Processing (37) Details
Description Call Failure
Severity Warning
Threshold 100
Throttle 0
Datawords Type of Call—FOUR_BYTESCalling Number—STRING [20]Called Number—STRING [20]Failure Indication—STRING [40]
PrimaryCause
The call failed for the reason indicated in the Failure Indication dataword.
PrimaryAction
Contact Cisco TAC for more information.
Table 4-32 Call Processing (38) Details
Description Release Cause 25 Exchange Routing Error Received
Severity Minor
Threshold 100
Throttle 0
Datawords CIC—FOUR_BYTESTGN-ID—FOUR_BYTESDPC—STRING [64]OPC—STRING [64]
PrimaryCause
Received release (REL) with cause number 25.
PrimaryAction
Log and map the cause to number 31.
4-19Cisco BTS 10200 Softswitch Troubleshooting Guide, Release 6.0.4
OL-25016-02
Chapter 4 Call Processing TroubleshootingCall Processing Events and Alarms
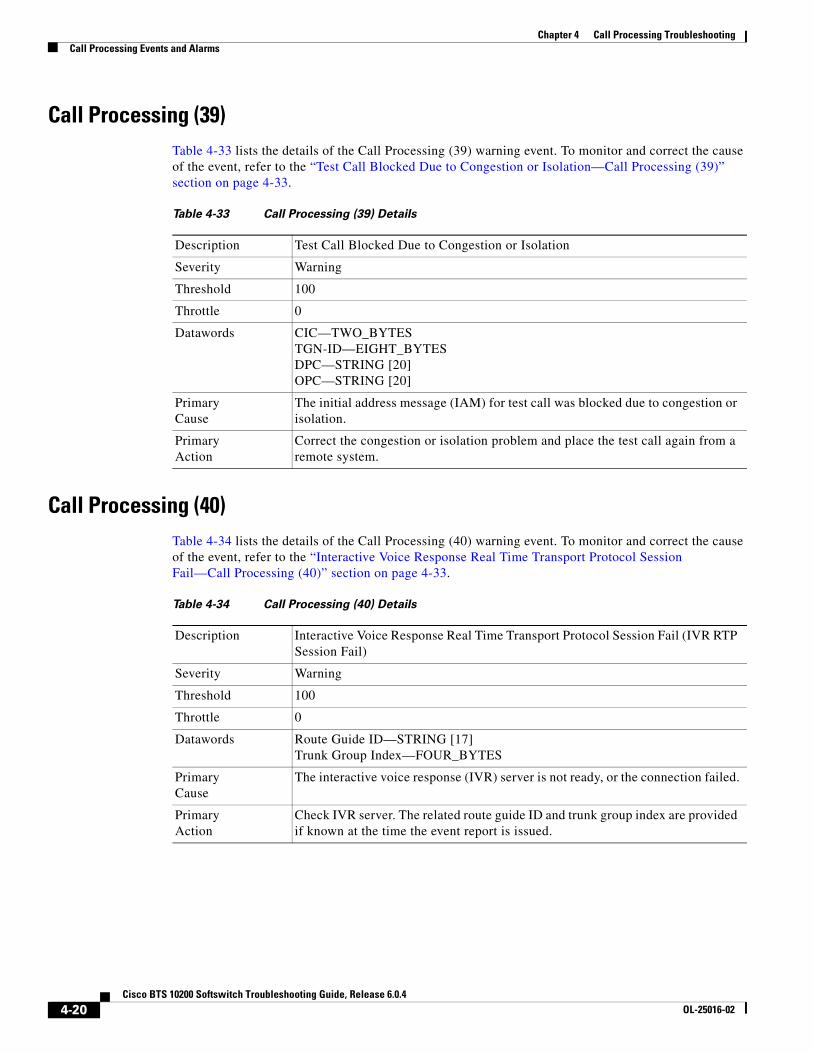
Call Processing (39)Table 4-33 lists the details of the Call Processing (39) warning event. To monitor and correct the cause of the event, refer to the “Test Call Blocked Due to Congestion or Isolation—Call Processing (39)” section on page 4-33.
Call Processing (40)Table 4-34 lists the details of the Call Processing (40) warning event. To monitor and correct the cause of the event, refer to the “Interactive Voice Response Real Time Transport Protocol Session Fail—Call Processing (40)” section on page 4-33.
Table 4-33 Call Processing (39) Details
Description Test Call Blocked Due to Congestion or Isolation
Severity Warning
Threshold 100
Throttle 0
Datawords CIC—TWO_BYTESTGN-ID—EIGHT_BYTESDPC—STRING [20]OPC—STRING [20]
PrimaryCause
The initial address message (IAM) for test call was blocked due to congestion or isolation.
PrimaryAction
Correct the congestion or isolation problem and place the test call again from a remote system.
Table 4-34 Call Processing (40) Details
Description Interactive Voice Response Real Time Transport Protocol Session Fail (IVR RTP Session Fail)
Severity Warning
Threshold 100
Throttle 0
Datawords Route Guide ID—STRING [17]Trunk Group Index—FOUR_BYTES
PrimaryCause
The interactive voice response (IVR) server is not ready, or the connection failed.
PrimaryAction
Check IVR server. The related route guide ID and trunk group index are provided if known at the time the event report is issued.
4-20Cisco BTS 10200 Softswitch Troubleshooting Guide, Release 6.0.4
OL-25016-02
Chapter 4 Call Processing TroubleshootingCall Processing Events and Alarms
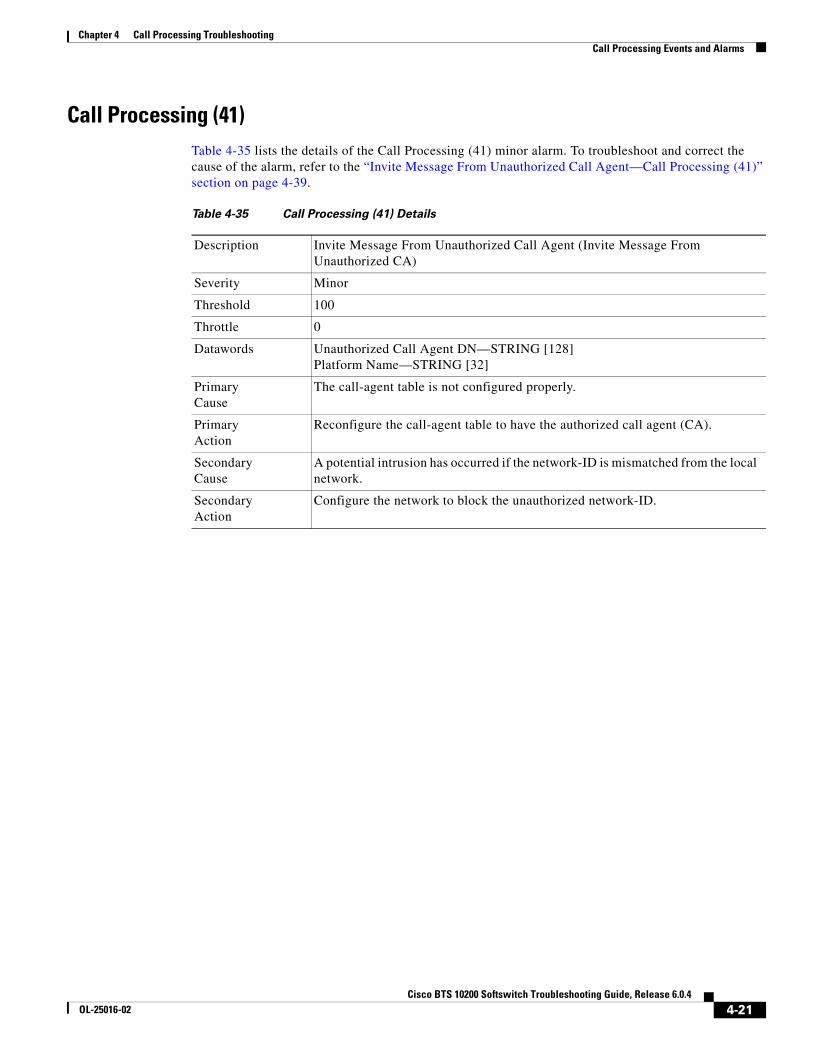
Call Processing (41)Table 4-35 lists the details of the Call Processing (41) minor alarm. To troubleshoot and correct the cause of the alarm, refer to the “Invite Message From Unauthorized Call Agent—Call Processing (41)” section on page 4-39.
Table 4-35 Call Processing (41) Details
Description Invite Message From Unauthorized Call Agent (Invite Message From Unauthorized CA)
Severity Minor
Threshold 100
Throttle 0
Datawords Unauthorized Call Agent DN—STRING [128]Platform Name—STRING [32]
PrimaryCause
The call-agent table is not configured properly.
PrimaryAction
Reconfigure the call-agent table to have the authorized call agent (CA).
SecondaryCause
A potential intrusion has occurred if the network-ID is mismatched from the local network.
SecondaryAction
Configure the network to block the unauthorized network-ID.
4-21Cisco BTS 10200 Softswitch Troubleshooting Guide, Release 6.0.4
OL-25016-02
Chapter 4 Call Processing TroubleshootingCall Processing Events and Alarms
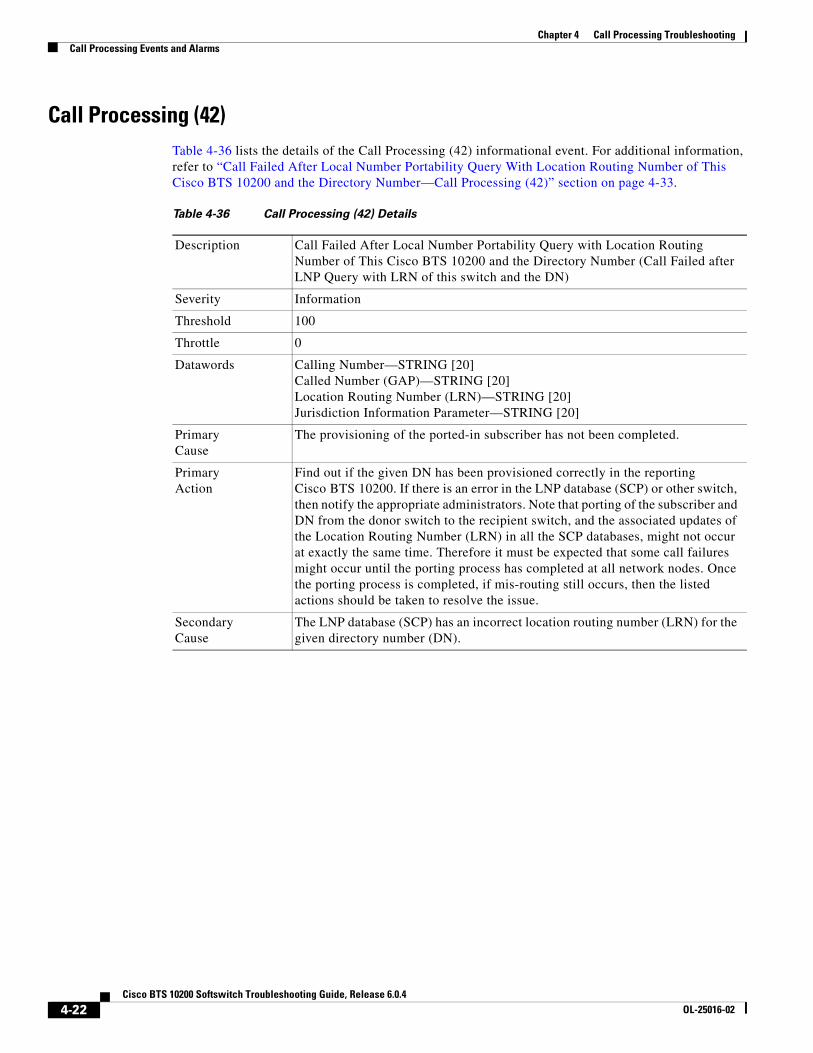
Call Processing (42)Table 4-36 lists the details of the Call Processing (42) informational event. For additional information, refer to “Call Failed After Local Number Portability Query With Location Routing Number of This Cisco BTS 10200 and the Directory Number—Call Processing (42)” section on page 4-33.
Table 4-36 Call Processing (42) Details
Description Call Failed After Local Number Portability Query with Location Routing Number of This Cisco BTS 10200 and the Directory Number (Call Failed after LNP Query with LRN of this switch and the DN)
Severity Information
Threshold 100
Throttle 0
Datawords Calling Number—STRING [20]Called Number (GAP)—STRING [20]Location Routing Number (LRN)—STRING [20]Jurisdiction Information Parameter—STRING [20]
PrimaryCause
The provisioning of the ported-in subscriber has not been completed.
PrimaryAction
Find out if the given DN has been provisioned correctly in the reporting Cisco BTS 10200. If there is an error in the LNP database (SCP) or other switch, then notify the appropriate administrators. Note that porting of the subscriber and DN from the donor switch to the recipient switch, and the associated updates of the Location Routing Number (LRN) in all the SCP databases, might not occur at exactly the same time. Therefore it must be expected that some call failures might occur until the porting process has completed at all network nodes. Once the porting process is completed, if mis-routing still occurs, then the listed actions should be taken to resolve the issue.
SecondaryCause
The LNP database (SCP) has an incorrect location routing number (LRN) for the given directory number (DN).
4-22Cisco BTS 10200 Softswitch Troubleshooting Guide, Release 6.0.4
OL-25016-02
Chapter 4 Call Processing TroubleshootingCall Processing Events and Alarms
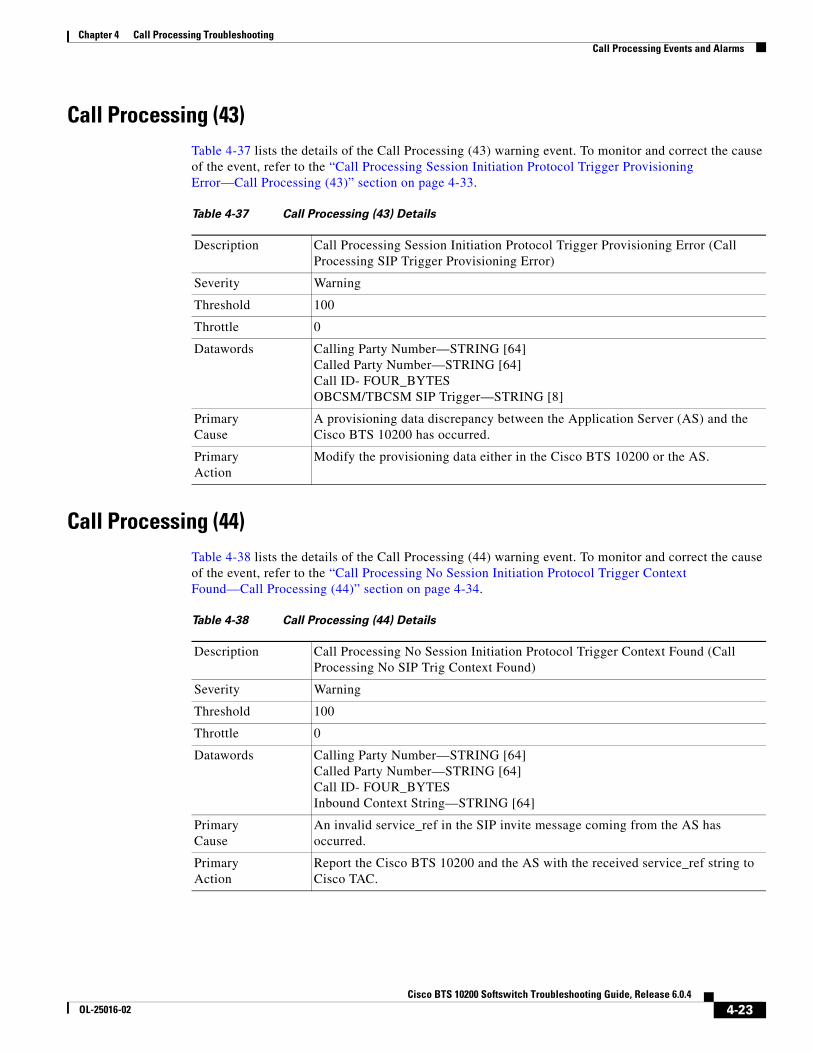
Call Processing (43)Table 4-37 lists the details of the Call Processing (43) warning event. To monitor and correct the cause of the event, refer to the “Call Processing Session Initiation Protocol Trigger Provisioning Error—Call Processing (43)” section on page 4-33.
Call Processing (44)Table 4-38 lists the details of the Call Processing (44) warning event. To monitor and correct the cause of the event, refer to the “Call Processing No Session Initiation Protocol Trigger Context Found—Call Processing (44)” section on page 4-34.
Table 4-37 Call Processing (43) Details
Description Call Processing Session Initiation Protocol Trigger Provisioning Error (Call Processing SIP Trigger Provisioning Error)
Severity Warning
Threshold 100
Throttle 0
Datawords Calling Party Number—STRING [64]Called Party Number—STRING [64]Call ID- FOUR_BYTESOBCSM/TBCSM SIP Trigger—STRING [8]
PrimaryCause
A provisioning data discrepancy between the Application Server (AS) and the Cisco BTS 10200 has occurred.
PrimaryAction
Modify the provisioning data either in the Cisco BTS 10200 or the AS.
Table 4-38 Call Processing (44) Details
Description Call Processing No Session Initiation Protocol Trigger Context Found (Call Processing No SIP Trig Context Found)
Severity Warning
Threshold 100
Throttle 0
Datawords Calling Party Number—STRING [64]Called Party Number—STRING [64]Call ID- FOUR_BYTESInbound Context String—STRING [64]
PrimaryCause
An invalid service_ref in the SIP invite message coming from the AS has occurred.
PrimaryAction
Report the Cisco BTS 10200 and the AS with the received service_ref string to Cisco TAC.
4-23Cisco BTS 10200 Softswitch Troubleshooting Guide, Release 6.0.4
OL-25016-02

Chapter 4 Call Processing TroubleshootingCall Processing Events and Alarms
Call Processing (45)Table 4-39 lists the details of the Call Processing (45) warning event. To monitor and correct the cause of the event, refer to the “Context In Call From Application Server Not Found—Call Processing (45)” section on page 4-34.
Call Processing (46)Table 4-40 lists the details of the Call Processing (46) informational event. For additional information, refer to “Limit of Calls Allowed for the Pool Has Been Reached—Call Processing (46)” section on page 4-34.
Table 4-39 Call Processing (45) Details
Description Context In Call From Application Server Not Found (Context in Call from App Server not Found)
Severity Warning
Threshold 100
Throttle 0
PrimaryCause
The Cisco BTS 10200 has received an invite from an AS which contains a context ID in the route header which is invalid. It may be that the AS has not properly returned the route header.
PrimaryAction
Get the AS to return the Cisco BTS 10200 route header correctly.
SecondaryCause
It is possible that the Cisco BTS 10200 cleared the call and removed the context before the AS returned an invite to the Cisco BTS 10200.
SecondaryAction
Check timing for the calls returned to the Cisco BTS 10200 from the AS.
Table 4-40 Call Processing (46) Details
Description Limit of Calls Allowed for the Pool Has Been Reached
Severity Information
Threshold 100
Throttle 0
Datawords Pool ID - STRING [32]
PrimaryCause
Number of calls over all SIP trunk groups utilizing the pool exceeds size of the pool.
PrimaryAction
If situation persists, you may wish to resize the affected pool or you may need to do additional traffic engineering.
4-24Cisco BTS 10200 Softswitch Troubleshooting Guide, Release 6.0.4
OL-25016-02
Chapter 4 Call Processing TroubleshootingCall Processing Events and Alarms
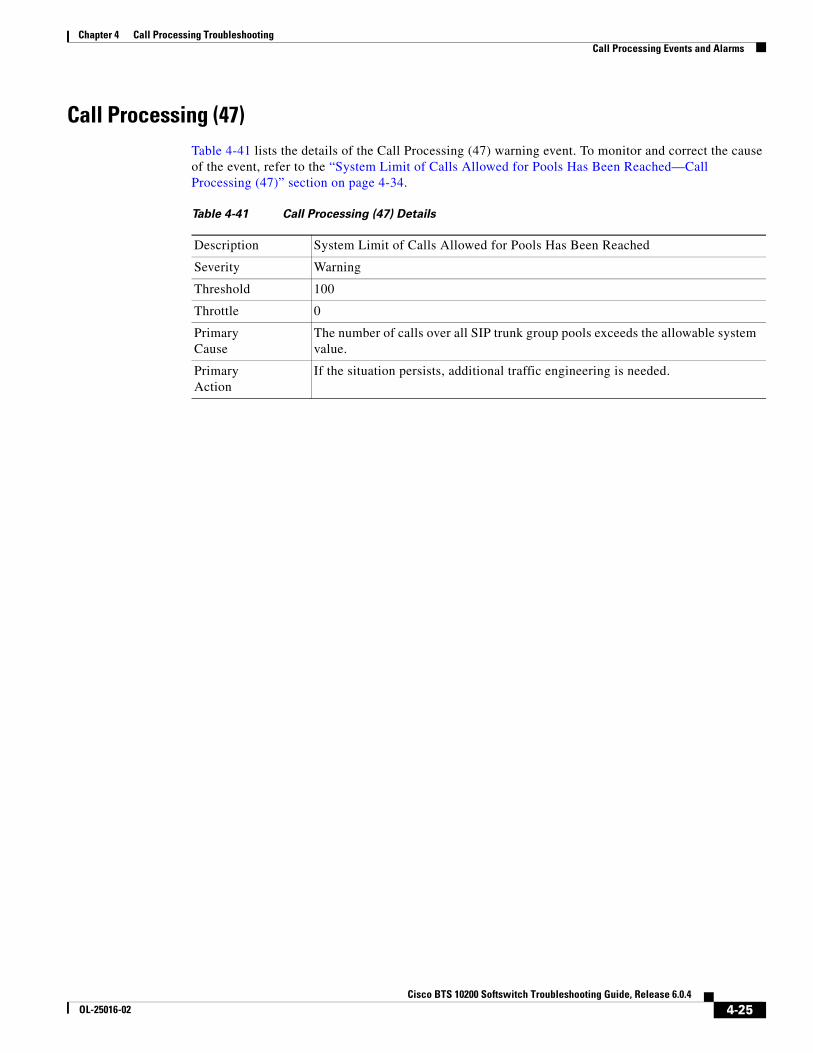
Call Processing (47)Table 4-41 lists the details of the Call Processing (47) warning event. To monitor and correct the cause of the event, refer to the “System Limit of Calls Allowed for Pools Has Been Reached—Call Processing (47)” section on page 4-34.
Table 4-41 Call Processing (47) Details
Description System Limit of Calls Allowed for Pools Has Been Reached
Severity Warning
Threshold 100
Throttle 0
PrimaryCause
The number of calls over all SIP trunk group pools exceeds the allowable system value.
PrimaryAction
If the situation persists, additional traffic engineering is needed.
4-25Cisco BTS 10200 Softswitch Troubleshooting Guide, Release 6.0.4
OL-25016-02
Chapter 4 Call Processing TroubleshootingMonitoring Call Processing Events
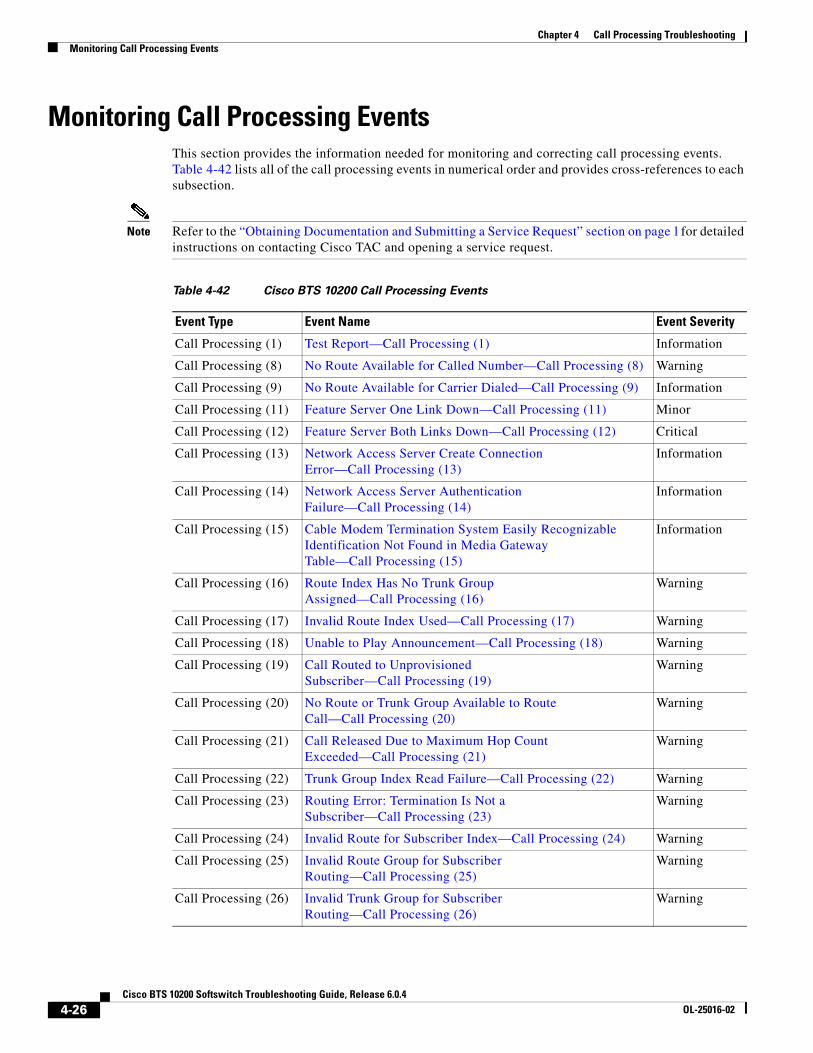
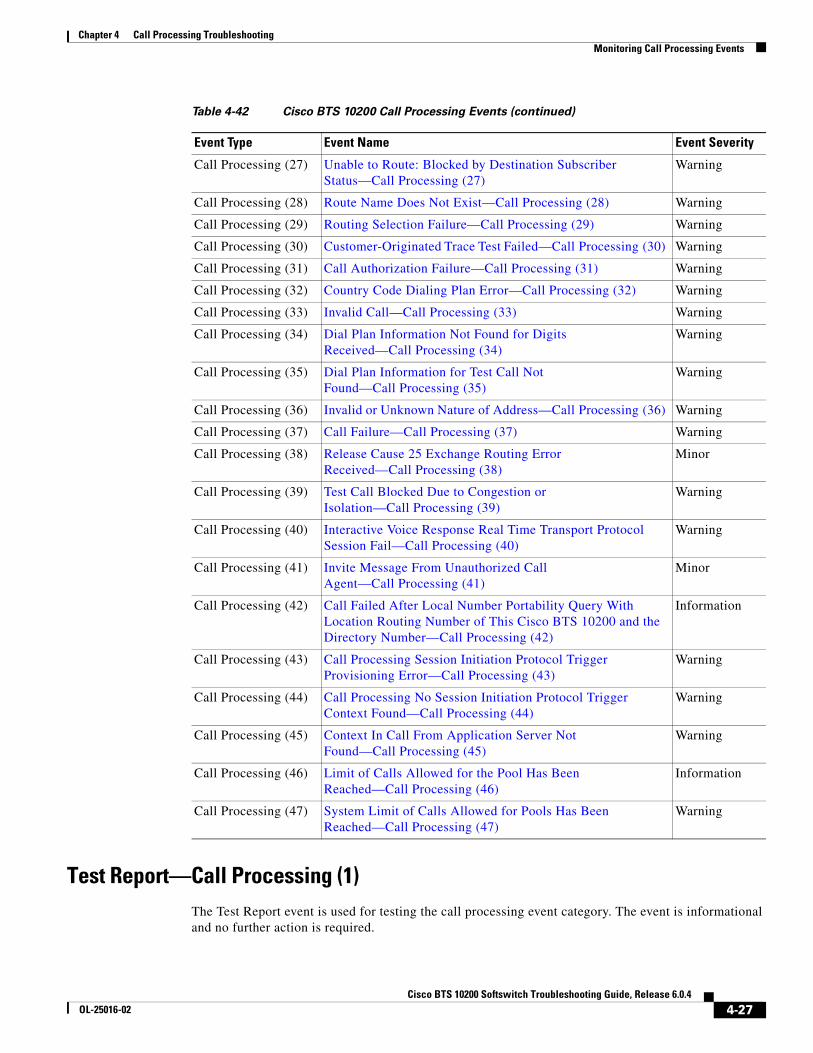
Monitoring Call Processing EventsThis section provides the information needed for monitoring and correcting call processing events. Table 4-42 lists all of the call processing events in numerical order and provides cross-references to each subsection.
Note Refer to the “Obtaining Documentation and Submitting a Service Request” section on page l for detailed instructions on contacting Cisco TAC and opening a service request.
Table 4-42 Cisco BTS 10200 Call Processing Events
Event Type Event Name Event Severity
Call Processing (1) Test Report—Call Processing (1) Information
Call Processing (8) No Route Available for Called Number—Call Processing (8) Warning
Call Processing (9) No Route Available for Carrier Dialed—Call Processing (9) Information
Call Processing (11) Feature Server One Link Down—Call Processing (11) Minor
Call Processing (12) Feature Server Both Links Down—Call Processing (12) Critical
Call Processing (13) Network Access Server Create Connection Error—Call Processing (13)
Information
Call Processing (14) Network Access Server Authentication Failure—Call Processing (14)
Information
Call Processing (15) Cable Modem Termination System Easily Recognizable Identification Not Found in Media Gateway Table—Call Processing (15)
Information
Call Processing (16) Route Index Has No Trunk Group Assigned—Call Processing (16)
Warning
Call Processing (17) Invalid Route Index Used—Call Processing (17) Warning
Call Processing (18) Unable to Play Announcement—Call Processing (18) Warning
Call Processing (19) Call Routed to Unprovisioned Subscriber—Call Processing (19)
Warning
Call Processing (20) No Route or Trunk Group Available to Route Call—Call Processing (20)
Warning
Call Processing (21) Call Released Due to Maximum Hop Count Exceeded—Call Processing (21)
Warning
Call Processing (22) Trunk Group Index Read Failure—Call Processing (22) Warning
Call Processing (23) Routing Error: Termination Is Not a Subscriber—Call Processing (23)
Warning
Call Processing (24) Invalid Route for Subscriber Index—Call Processing (24) Warning
Call Processing (25) Invalid Route Group for Subscriber Routing—Call Processing (25)
Warning
Call Processing (26) Invalid Trunk Group for Subscriber Routing—Call Processing (26)
Warning
4-26Cisco BTS 10200 Softswitch Troubleshooting Guide, Release 6.0.4
OL-25016-02
Chapter 4 Call Processing TroubleshootingMonitoring Call Processing Events
Test Report—Call Processing (1)The Test Report event is used for testing the call processing event category. The event is informational and no further action is required.
Call Processing (27) Unable to Route: Blocked by Destination Subscriber Status—Call Processing (27)
Warning
Call Processing (28) Route Name Does Not Exist—Call Processing (28) Warning
Call Processing (29) Routing Selection Failure—Call Processing (29) Warning
Call Processing (30) Customer-Originated Trace Test Failed—Call Processing (30) Warning
Call Processing (31) Call Authorization Failure—Call Processing (31) Warning
Call Processing (32) Country Code Dialing Plan Error—Call Processing (32) Warning
Call Processing (33) Invalid Call—Call Processing (33) Warning
Call Processing (34) Dial Plan Information Not Found for Digits Received—Call Processing (34)
Warning
Call Processing (35) Dial Plan Information for Test Call Not Found—Call Processing (35)
Warning
Call Processing (36) Invalid or Unknown Nature of Address—Call Processing (36) Warning
Call Processing (37) Call Failure—Call Processing (37) Warning
Call Processing (38) Release Cause 25 Exchange Routing Error Received—Call Processing (38)
Minor
Call Processing (39) Test Call Blocked Due to Congestion or Isolation—Call Processing (39)
Warning
Call Processing (40) Interactive Voice Response Real Time Transport Protocol Session Fail—Call Processing (40)
Warning
Call Processing (41) Invite Message From Unauthorized Call Agent—Call Processing (41)
Minor
Call Processing (42) Call Failed After Local Number Portability Query With Location Routing Number of This Cisco BTS 10200 and the Directory Number—Call Processing (42)
Information
Call Processing (43) Call Processing Session Initiation Protocol Trigger Provisioning Error—Call Processing (43)
Warning
Call Processing (44) Call Processing No Session Initiation Protocol Trigger Context Found—Call Processing (44)
Warning
Call Processing (45) Context In Call From Application Server Not Found—Call Processing (45)
Warning
Call Processing (46) Limit of Calls Allowed for the Pool Has Been Reached—Call Processing (46)
Information
Call Processing (47) System Limit of Calls Allowed for Pools Has Been Reached—Call Processing (47)
Warning
Table 4-42 Cisco BTS 10200 Call Processing Events (continued)
Event Type Event Name Event Severity
4-27Cisco BTS 10200 Softswitch Troubleshooting Guide, Release 6.0.4
OL-25016-02
Chapter 4 Call Processing TroubleshootingMonitoring Call Processing Events
No Route Available for Called Number—Call Processing (8)The No Route Available for Called Number event functions as a warning that no route is available for the number called. The primary cause for the event is that the call originates from a subscriber or trunk for a called party number that has no route available. The Orig Type (1 byte), Orig Sub or trunk group (TG) ID (8 bytes), calling party number (20), and called party number (20) data words in the event report indicate the parameters that need to be corrected. Refer to office records for the subscriber. The secondary cause for the event is that parameters in the subscriber and/or dial-plan table are missing or incorrect for the number dialed. To correct any parameter error, determine whether the routing parameters (such as digit-string) were entered incorrectly in the subscriber and dial-plan tables. If the called party is a subscriber, verify that the subscriber-type is listed as a subscriber in the dial-plan table. If the call is long distance and a PIC is used, check that the PIC for this subscriber is properly provisioned in the dial-plan table. If necessary, edit these files using the change dial-plan or change subscriber command.
No Route Available for Carrier Dialed—Call Processing (9)The No Route Available for Carrier Dialed event functions as a warning that no route is available for the dialed carrier. The primary cause for the event is that no route is available for the IXC dialed. The Orig Type (1 byte), Orig Sub or TG ID (8 bytes), calling party number (20), called party number (20), and carrier code dialed (20) data words in the event report indicate the parameters that need to be corrected. Refer to office records for the carrier. The secondary cause for the event is that parameters in the carrier and/or route-grp table are missing or incorrect for the carrier. Determine whether the routing parameters were entered correctly in the carrier and/or route-grp tables. If the Carrier-ID or Route-Grp-ID is not specified or is incorrect in the dial-plan table, enter the correct value. Use the change carrier or change route-grp command.
Feature Server One Link Down—Call Processing (11)The Feature Server One Link Down alarm (minor) indicates that one link to the feature server is down. To troubleshoot and correct the cause of the Feature Server One Link Down alarm, refer to the “Feature Server One Link Down—Call Processing (11)” section on page 4-36.
Feature Server Both Links Down—Call Processing (12)The Feature Server Both Links Down alarm (critical) indicates that both links to the feature server are down. To troubleshoot and correct the cause of the Feature Server Both Links Down alarm, refer to the “Feature Server Both Links Down—Call Processing (12)” section on page 4-38.
Network Access Server Create Connection Error—Call Processing (13)The Network Access Server Create Connection Error event functions as an informational alert that a network access server (NAS) create connection (CRCX) preauthentication has failed. The event is informational and no further action is required.
4-28Cisco BTS 10200 Softswitch Troubleshooting Guide, Release 6.0.4
OL-25016-02
Chapter 4 Call Processing TroubleshootingMonitoring Call Processing Events
Network Access Server Authentication Failure—Call Processing (14)The Network Access Server Authentication Failure event functions as an informational alert that a NAS authentication failure has occurred. The primary cause of the event is the AAA server denied the call request. Check the calling and called numbers.
Cable Modem Termination System Easily Recognizable Identification Not Found in Media Gateway Table—Call Processing (15)
The Cable Modem Termination System Easily Recognizable Identification Not Found in Media Gateway Table event functions as an informational alert that the CMTS ER ID was not found in the media gateway (MGW) table. The primary cause of the event is that the CMTS/ER entry was not found in the media gateway table. To correct the cause of the event, provision the CMTS-ER index in the media gateway table.
Route Index Has No Trunk Group Assigned—Call Processing (16)The Route Index Has No Trunk Group Assigned event functions as a warning that the route index has no trunk group assigned. The primary cause of the event is that a trunk group was not assigned to the given route. To correct the cause of the event, provision a trunk group for the associated route index.
Invalid Route Index Used—Call Processing (17)The Invalid Route Index Used event functions as a warning that an invalid route index is being used. The primary cause of the event is that an invalid route index is being used. To correct the cause of the event, correct the Cisco BTS 10200 provisioning by assigning a valid route index.
Unable to Play Announcement—Call Processing (18)The Unable to Play Announcement event functions as a warning that an announcement was not played. The primary cause of the event is that the announcement was not provisioned correctly. To correct the primary cause of the event, check the provisioning of the announcement and, if necessary, correct the provisioning of the announcement.
Call Routed to Unprovisioned Subscriber—Call Processing (19)The Call Routed to Unprovisioned Subscriber event functions as a warning that a call was routed to an unprovisioned subscriber. The primary cause of the event is that the subscriber account was not properly provisioned. To correct the primary cause of the event, provision the subscriber.
4-29Cisco BTS 10200 Softswitch Troubleshooting Guide, Release 6.0.4
OL-25016-02

Chapter 4 Call Processing TroubleshootingMonitoring Call Processing Events
No Route or Trunk Group Available to Route Call—Call Processing (20)The No Route or Trunk Group Available to Route Call event functions as a warning that there was no route or trunk group available to route a call. The primary cause of the event is that the trunk group in the route was not provisioned correctly. To correct the primary cause of the event, check and correct the route and trunk group provisioning.
Call Released Due to Maximum Hop Count Exceeded—Call Processing (21)The Call Released Due to Maximum Hop Count Exceeded event functions as a warning that the call was released due to the maximum hop count being exceeded. The primary cause of the event is that the number of hops between the destinations is excessive. To correct the primary cause of the event, reduce the number of hops between the destinations.
Trunk Group Index Read Failure—Call Processing (22)The Trunk Group Index Read Failure event functions as a warning that a trunk group index read failed. The primary cause of the event is that the trunk group index could not be retrieved from the call data. To correct the primary cause of the event, check and correct the Cisco BTS 10200 trunk group and call data provisioning.
Routing Error: Termination Is Not a Subscriber—Call Processing (23)The Routing Error: Termination Is Not a Subscriber event functions as a warning that the destination termination is not a subscriber. The primary cause of the event is that the destination termination is not provisioned as a subscriber. To correct the primary cause of the event, check and correct the Cisco BTS 10200 subscriber termination provisioning.
Invalid Route for Subscriber Index—Call Processing (24)The Invalid Route for Subscriber Index event functions as a warning that an invalid route was selected for the subscriber index. The primary cause of the event is that the route is not provisioned correctly for the specified subscriber. To correct the primary cause of the event, check and correct the Cisco BTS 10200 subscriber index provisioning.
Invalid Route Group for Subscriber Routing—Call Processing (25)The Invalid Route Group for Subscriber Routing event functions as a warning that an invalid route group for the subscriber routing was selected. The primary cause of the event is that the route group is not provisioned correctly for the specified subscriber. To correct the primary cause of the event, check and correct the Cisco BTS 10200 route group provisioning.
4-30Cisco BTS 10200 Softswitch Troubleshooting Guide, Release 6.0.4
OL-25016-02

Chapter 4 Call Processing TroubleshootingMonitoring Call Processing Events
Invalid Trunk Group for Subscriber Routing—Call Processing (26)The Invalid Trunk Group for Subscriber Routing event functions as a warning that an invalid trunk group for the subscriber routing was selected. The primary cause of the event is that the trunk group is not provisioned correctly for the specified subscriber. To correct the primary cause of the event, check and correct the Cisco BTS 10200 trunk group provisioning.
Unable to Route: Blocked by Destination Subscriber Status—Call Processing (27)
The Unable to Route: Blocked by Destination Subscriber Status event functions as a warning that a call route was blocked by the destination subscriber status. The primary cause of the event is that the subscriber is not in the correct state. To correct the primary cause of the event, check and correct the Cisco BTS 10200 subscriber state provisioning.
Route Name Does Not Exist—Call Processing (28)The Route Name Does Not Exist event functions as a warning that the requested route name does not exist. The primary cause of the event is that the route is not provisioned correctly. To correct the primary cause of the event, check and correct the Cisco BTS 10200 route provisioning.
Routing Selection Failure—Call Processing (29)The Routing Selection Failure event functions as a warning that the routing selection failed. The primary cause of the event is that the route is not provisioned correctly. To correct the primary cause of the event, check and correct the Cisco BTS 10200 route provisioning.
Customer-Originated Trace Test Failed—Call Processing (30)The Customer-Originated Trace Test Failed event functions as a warning that the COT test failed. The primary cause of the event is that the COT failed. To correct the primary cause of the event, contact Cisco TAC for information on how to debug the problem.
Call Authorization Failure—Call Processing (31)The Call Authorization Failure event functions as a warning that the call authorization failed. The primary cause of the event is that a provisioning error is not allowing the call to be completed. To correct the primary cause of the event, contact Cisco TAC.
Country Code Dialing Plan Error—Call Processing (32)The Country Code Dialing Plan Error event functions as a warning that a country code dialing plan error occurred. The primary cause of the event is that the country code was not found in the dial plan. To correct the primary cause of the event, check and correct the Cisco BTS 10200 dial plan provisioning.
4-31Cisco BTS 10200 Softswitch Troubleshooting Guide, Release 6.0.4
OL-25016-02

Chapter 4 Call Processing TroubleshootingMonitoring Call Processing Events
Invalid Call—Call Processing (33)The Invalid Call event functions as a warning that an invalid call was attempted. The primary cause of the event is that the call could not be completed because the number entered was invalid. To correct the primary cause of the event, check and correct the Cisco BTS 10200 provisioning. Additionally, check the number dialed to verify that it is a valid number.
Dial Plan Information Not Found for Digits Received—Call Processing (34)The Dial Plan Information Not Found for Digits Received event functions as a warning that the number entered could not be located in the dial plan. The primary cause of the event is that the call could not be completed because the number entered could not be located in the dial plan. To correct the primary cause of the event, check and correct the Cisco BTS 10200 dial plan provisioning. Additionally, check the number dialed to verify that it is a valid number.
Dial Plan Information for Test Call Not Found—Call Processing (35)The Dial Plan Information for Test Call Not Found event functions as a warning that the test call could not be completed. The primary cause for the event is that the test call could not be completed because the number entered could not be located in the dial plan. To correct the primary cause of the event, check and correct the Cisco BTS 10200 dial plan provisioning. Additionally, check the number tested to verify that it is a valid number.
Invalid or Unknown Nature of Address—Call Processing (36)The Invalid or Unknown Nature of Address event functions as a warning that the NOA was invalid or incorrect. The primary cause of the event is that the NOA was incorrect in the dial plan. To correct the primary cause of the event, check and correct the Cisco BTS 10200 dial plan provisioning.
Call Failure—Call Processing (37)The Call Failure event functions as a warning that the placed call failed. The primary cause of the event is that the call failed for the reasons indicated in the data words. To correct the primary cause of the event, check the data words type of call (4 bytes), calling number (20), called number (20), and failure indication (20). Once the data words are checked, contact Cisco TAC to resolve the failure indicated.
Prior to contacting Cisco TAC, collect a billing-record for the failed call using the following:
report billing-record orignumber=<string>
Release Cause 25 Exchange Routing Error Received—Call Processing (38)The Release Cause 25 Exchange Routing Error Received alarm (minor) indicates that a release with cause number 25 occurred because an exchange routing error was received. To troubleshoot and correct the cause of the Release Cause 25 Exchange Routing Error Received alarm, refer to the “Release Cause 25 Exchange Routing Error Received—Call Processing (38)” section on page 4-39.
4-32Cisco BTS 10200 Softswitch Troubleshooting Guide, Release 6.0.4
OL-25016-02
Chapter 4 Call Processing TroubleshootingMonitoring Call Processing Events
Test Call Blocked Due to Congestion or Isolation—Call Processing (39)The Test Call Blocked Due to Congestion or Isolation event functions as a warning that the test call was blocked due to congestion or isolation in the network. The primary cause of the event is that the IAM for test call was blocked due to congestion or isolation. To correct the primary cause of the event, correct the congestion or isolation problem and place test call again from remote system.
Interactive Voice Response Real Time Transport Protocol Session Fail—Call Processing (40)
The Interactive Voice Response Real Time Transport Protocol Session Fail event functions as a warning that the IVR Real Time Transport Protocol (RTP) session failed. The primary cause of the event is that the IVR server is not ready, or the connection failed. To correct the primary cause of the event, check IVR server. The related route guide ID and/or trunk group index are provided if known at the time the event report is issued
Invite Message From Unauthorized Call Agent—Call Processing (41)The Invite Message From Unauthorized Call Agent alarm (minor) indicates that a invite message was received from an unauthorized CA. To troubleshoot and correct the cause of the Invite Message From Unauthorized Call Agent alarm, refer to the “Invite Message From Unauthorized Call Agent—Call Processing (41)” section on page 4-39.
Call Failed After Local Number Portability Query With Location Routing Number of This Cisco BTS 10200 and the Directory Number—Call Processing (42)
The Call Failed after Local Number Portability Query With Location Routing Number of This Cisco BTS 10200 and the Directory Number event serves as an information alert that the provisioning of a ported-in subscriber has not been completed. To correct the primary cause of the event, verify whether the given DN has been provisioned correctly in the reporting Cisco BTS 10200. If there is an error in the LNP database (SCP) or in another switch, notify the appropriate administrators. Note that porting of the subscriber and DN from the donor switch to the recipient switch, and associated updates of the Location Routing Number (LRN) in all the SCP databases, might not all occur at exactly the same time. Therefore it must be expected that some call failures might occur until the porting process has completed at all network nodes. If you think the porting process is complete but mis-routing still occurs, take the above actions to resolve the issue. The secondary cause of the event is that the LNP database (SCP) has an incorrect LRN for the given DN.
Call Processing Session Initiation Protocol Trigger Provisioning Error—Call Processing (43)
The Call Processing Session Initiation Protocol Trigger Provisioning Error event serves as warning that a provisioning data discrepancy between the Application Server and the Cisco BTS 10200 has occurred. To correct the cause of the event, modify the provisioning data either in the Cisco BTS 10200 or the Application Server.
4-33Cisco BTS 10200 Softswitch Troubleshooting Guide, Release 6.0.4
OL-25016-02
Chapter 4 Call Processing TroubleshootingMonitoring Call Processing Events
Call Processing No Session Initiation Protocol Trigger Context Found—Call Processing (44)
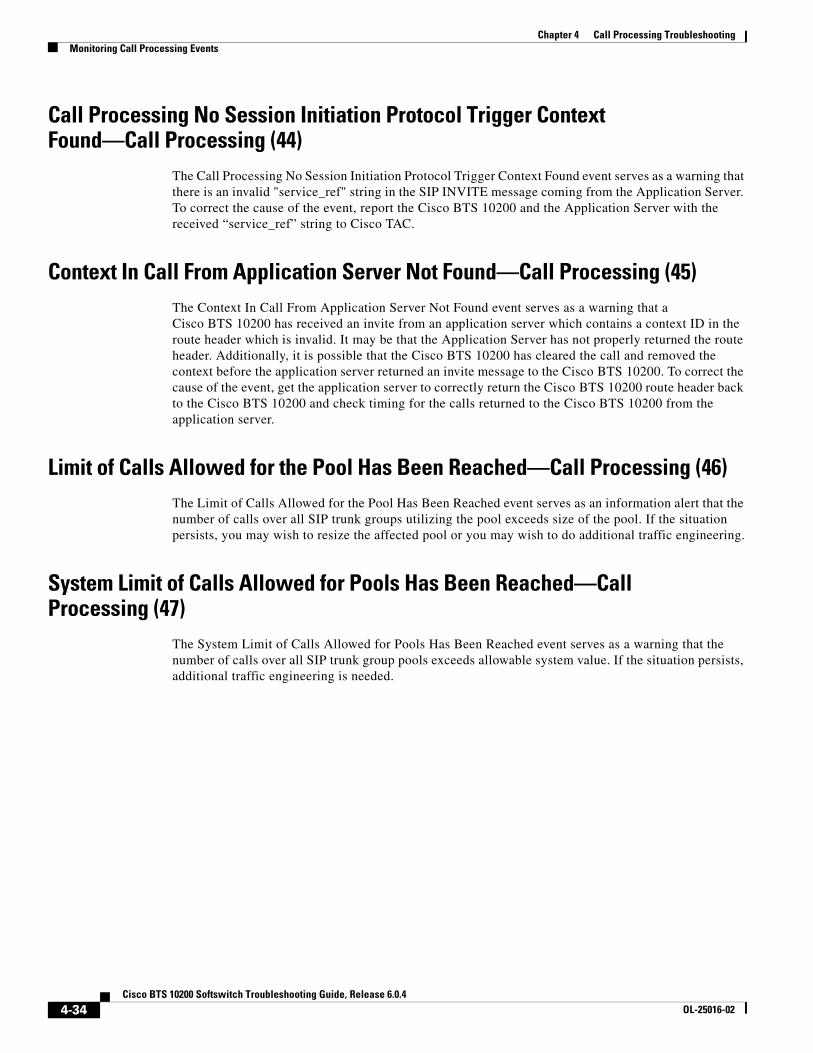
The Call Processing No Session Initiation Protocol Trigger Context Found event serves as a warning that there is an invalid "service_ref" string in the SIP INVITE message coming from the Application Server. To correct the cause of the event, report the Cisco BTS 10200 and the Application Server with the received “service_ref” string to Cisco TAC.
Context In Call From Application Server Not Found—Call Processing (45)The Context In Call From Application Server Not Found event serves as a warning that a Cisco BTS 10200 has received an invite from an application server which contains a context ID in the route header which is invalid. It may be that the Application Server has not properly returned the route header. Additionally, it is possible that the Cisco BTS 10200 has cleared the call and removed the context before the application server returned an invite message to the Cisco BTS 10200. To correct the cause of the event, get the application server to correctly return the Cisco BTS 10200 route header back to the Cisco BTS 10200 and check timing for the calls returned to the Cisco BTS 10200 from the application server.
Limit of Calls Allowed for the Pool Has Been Reached—Call Processing (46)The Limit of Calls Allowed for the Pool Has Been Reached event serves as an information alert that the number of calls over all SIP trunk groups utilizing the pool exceeds size of the pool. If the situation persists, you may wish to resize the affected pool or you may wish to do additional traffic engineering.
System Limit of Calls Allowed for Pools Has Been Reached—Call Processing (47)
The System Limit of Calls Allowed for Pools Has Been Reached event serves as a warning that the number of calls over all SIP trunk group pools exceeds allowable system value. If the situation persists, additional traffic engineering is needed.
4-34Cisco BTS 10200 Softswitch Troubleshooting Guide, Release 6.0.4
OL-25016-02
Chapter 4 Call Processing TroubleshootingTroubleshooting Call Processing Alarms
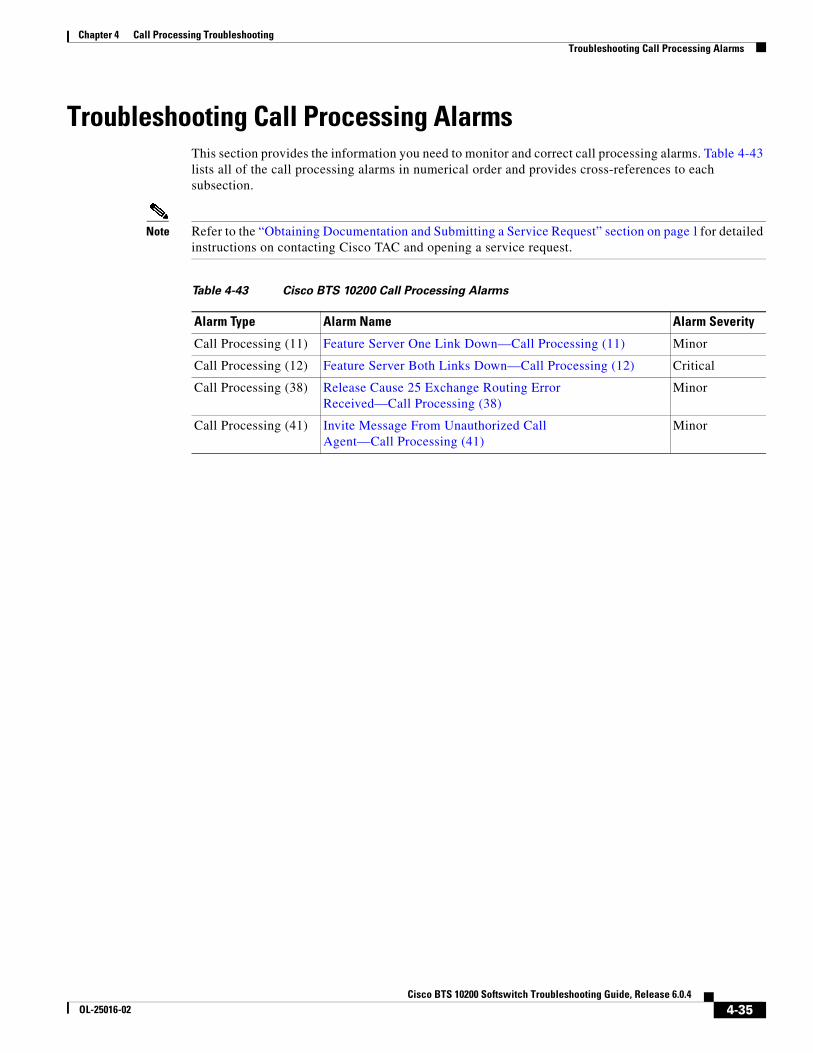
Troubleshooting Call Processing AlarmsThis section provides the information you need to monitor and correct call processing alarms. Table 4-43 lists all of the call processing alarms in numerical order and provides cross-references to each subsection.
Note Refer to the “Obtaining Documentation and Submitting a Service Request” section on page l for detailed instructions on contacting Cisco TAC and opening a service request.
Table 4-43 Cisco BTS 10200 Call Processing Alarms
Alarm Type Alarm Name Alarm Severity
Call Processing (11) Feature Server One Link Down—Call Processing (11) Minor
Call Processing (12) Feature Server Both Links Down—Call Processing (12) Critical
Call Processing (38) Release Cause 25 Exchange Routing Error Received—Call Processing (38)
Minor
Call Processing (41) Invite Message From Unauthorized Call Agent—Call Processing (41)
Minor
4-35Cisco BTS 10200 Softswitch Troubleshooting Guide, Release 6.0.4
OL-25016-02

Chapter 4 Call Processing TroubleshootingTroubleshooting Call Processing Alarms
Feature Server One Link Down—Call Processing (11)The Feature Server One Link Down alarm (minor) indicates that one link to the feature server is down. The primary cause of the alarm is that the link interface hardware is broken. To correct the primary cause of the alarm, check the link interface hardware and, if necessary, reconnect or replace. The secondary cause of the alarm is the that the link interface state is operationally down. To correct the secondary cause of the alarm, check the operational state of the link.
To check the operational state of the interface link and the physical condition of the interface link. Proceed as follows:
Step 1 Check status of the interface using one of the methods below. (If the kstat command in Example 1 does not provide an output, try the ndd commands in example 2.)
Example 1:
mssol-ca0-a# kstat hme:0:hme0:link_upmodule: hme instance: 0name: hme0 class: net link_up 1
mssol-ca0-a# kstat qfe:0:qfe0:link*module: qfe instance: 0name: qfe0 class: net link_duplex 2 link_up 1
mssol-ca0-a# kstat qfe:0:qfe0:ifspe*module: qfe instance: 0name: qfe0 class: net ifspeed 100000000
Example 2:
# ndd -set /dev/eri instance 0# ndd -get /dev/eri link_status1# ndd -get /dev/eri link_mode1# ndd -get /dev/eri link_speed1
Step 2 Verify the following settings:
• Duplex should be 1 (full duplex)
• Link_up or link_status should be 1 (operational)
• Link mode should be 1 (no auto negotiation).
Step 3 Verify call agent and switch interfaces are both set to full duplex no auto negotiation.
Step 4 Verify link speed is hard-coded to the same value on both ends.
Step 5 Check for any errors pertaining to the interface in /var/adm/messages* file.
Step 6 Check operational status of Ethernet interface(s) on switch side as follows:
admin up /line protocol up
4-36Cisco BTS 10200 Softswitch Troubleshooting Guide, Release 6.0.4
OL-25016-02

Chapter 4 Call Processing TroubleshootingTroubleshooting Call Processing Alarms
Step 7 Check statistics for Ethernet interface(s) on the call agent side while looking for any abnormal queue/input/output errors/collisions. For example, to check stats on bge0 interface:
# netstat -i -I bge0
Ipkts Ierrs Opkts Oerrs Collis Queue
Note The packets queued (Queue) that cannot be transmitted should be 0. If not, it is possible that a cable or Ethernet interface is defective.
Note The input errors (Ierrs) and the output errors (Oerrs) should be close to 0. High input errors could indicate that the network is saturated, host overload, or physical network problem. High output errors could indicate a saturated local network or a bad physical connection.
Step 8 Check statistics for ethernet interface(s) on the switch side. Look for abnormal input/output errors, cyclic redundancy check (CRC), frame errors. For a description of the output of “show interface fast ethernet”, refer to:
http://www.cisco.com/en/US/customer/docs/ios/12_2/interface/command/reference/irfshoin.html
Step 9 Paste the output of “show interfaces” to the Cisco output interpreter for further analysis of the interfaces.
https://www.cisco.com/cgi-bin/Support/OutputInterpreter/home.pl
Step 10 Check the physical cable, the cable connectors, and the cable connections.
4-37Cisco BTS 10200 Softswitch Troubleshooting Guide, Release 6.0.4
OL-25016-02
Chapter 4 Call Processing TroubleshootingTroubleshooting Call Processing Alarms
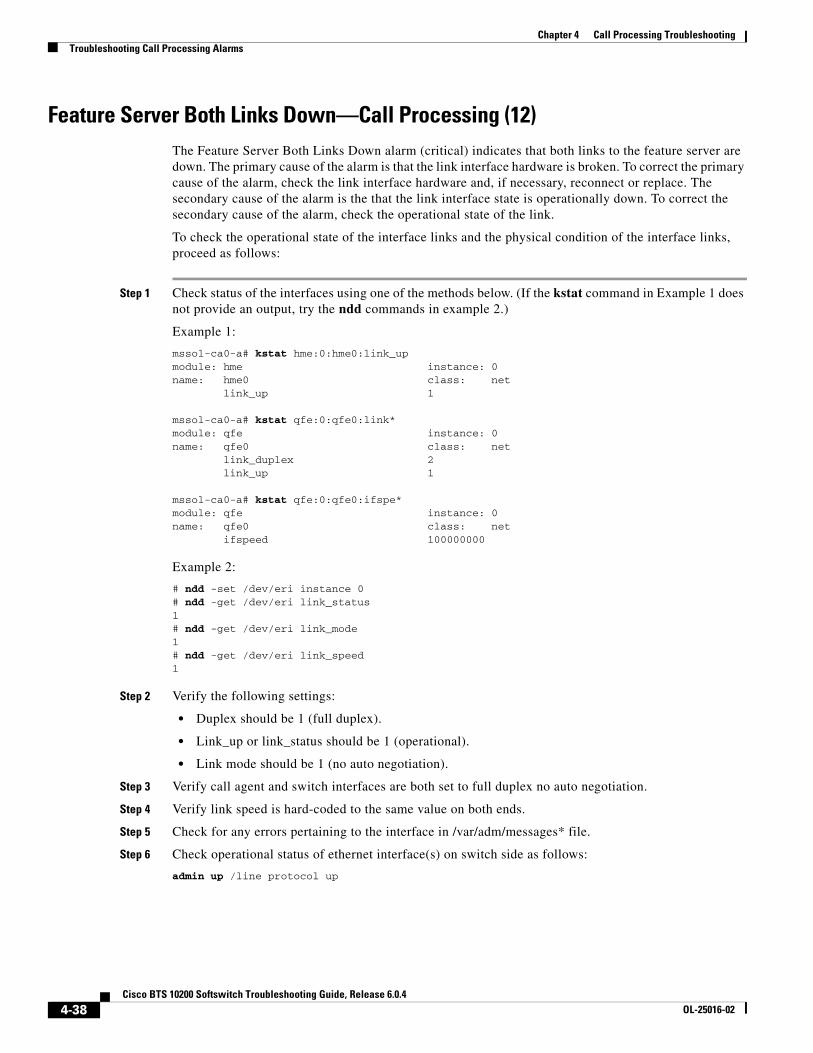
Feature Server Both Links Down—Call Processing (12)The Feature Server Both Links Down alarm (critical) indicates that both links to the feature server are down. The primary cause of the alarm is that the link interface hardware is broken. To correct the primary cause of the alarm, check the link interface hardware and, if necessary, reconnect or replace. The secondary cause of the alarm is the that the link interface state is operationally down. To correct the secondary cause of the alarm, check the operational state of the link.
To check the operational state of the interface links and the physical condition of the interface links, proceed as follows:
Step 1 Check status of the interfaces using one of the methods below. (If the kstat command in Example 1 does not provide an output, try the ndd commands in example 2.)
Example 1:
mssol-ca0-a# kstat hme:0:hme0:link_upmodule: hme instance: 0name: hme0 class: net link_up 1
mssol-ca0-a# kstat qfe:0:qfe0:link*module: qfe instance: 0name: qfe0 class: net link_duplex 2 link_up 1
mssol-ca0-a# kstat qfe:0:qfe0:ifspe*module: qfe instance: 0name: qfe0 class: net ifspeed 100000000
Example 2:
# ndd -set /dev/eri instance 0# ndd -get /dev/eri link_status1# ndd -get /dev/eri link_mode1# ndd -get /dev/eri link_speed1
Step 2 Verify the following settings:
• Duplex should be 1 (full duplex).
• Link_up or link_status should be 1 (operational).
• Link mode should be 1 (no auto negotiation).
Step 3 Verify call agent and switch interfaces are both set to full duplex no auto negotiation.
Step 4 Verify link speed is hard-coded to the same value on both ends.
Step 5 Check for any errors pertaining to the interface in /var/adm/messages* file.
Step 6 Check operational status of ethernet interface(s) on switch side as follows:
admin up /line protocol up
4-38Cisco BTS 10200 Softswitch Troubleshooting Guide, Release 6.0.4
OL-25016-02

Chapter 4 Call Processing TroubleshootingTroubleshooting Call Processing Alarms
Step 7 Check statistics for ethernet interface(s) on the call agent side while looking for any abnormal queue/input/output errors/collisions. For example, to check stats on bge0 interface:
# netstat -i -I bge0
Ipkts Ierrs Opkts Oerrs Collis Queue
Note The packets queued (Queue) that cannot be transmitted should be 0. If not, it is possible that a cable or ethernet interface is defective.
Note The input errors (Ierrs) and the output errors (Oerrs) should be close to 0. High input errors could indicate that the network is saturated, host overload, or physical network problem. High output errors could indicate a saturated local network or a bad physical connection.
Step 8 Check statistics for ethernet interface(s) on the switch side. Look for abnormal input/output errors, CRC, frame errors. For a description of the output of “show interface fast ethernet”, refer to:
http://www.cisco.com/en/US/customer/docs/ios/12_2/interface/command/reference/irfshoin.html
Step 9 Paste the output of “show interfaces” to the Cisco output interpreter for further analysis of the interfaces.
https://www.cisco.com/cgi-bin/Support/OutputInterpreter/home.pl
Step 10 Check the physical cable, the cable connectors, and the cable connections.
Release Cause 25 Exchange Routing Error Received—Call Processing (38)The Release Cause 25 Exchange Routing Error Received alarm (minor) indicates that a release with cause number 25 occurred because an exchange routing error was received. The primary cause of the alarm is that a REL message with cause number 25 was received. To correct the primary cause of the alarm, log and map the cause. Refer to “Call Authorization Failure—Call Processing (31)” section on page 4-31 for additional troubleshooting information.
Invite Message From Unauthorized Call Agent—Call Processing (41)The Invite Message From Unauthorized Call Agent alarm (minor) indicates that an invite message was received from an unauthorized CA. The primary cause of the alarm is that the Call-Agent Table is not configured properly. To correct the primary cause of the alarm, reconfigure the Call-Agent table to have the authorized CA listed. The secondary cause of the alarm is that a potential intrusion occurred if the Network-ID mismatch is from the local-network. To correct the secondary cause of the alarm, configure the network to block this unauthorized Network-ID.
4-39Cisco BTS 10200 Softswitch Troubleshooting Guide, Release 6.0.4
OL-25016-02

Chapter 4 Call Processing TroubleshootingTroubleshooting Call Processing Alarms
4-40Cisco BTS 10200 Softswitch Troubleshooting Guide, Release 6.0.4
OL-25016-02