Embed Size (px)
Citation preview
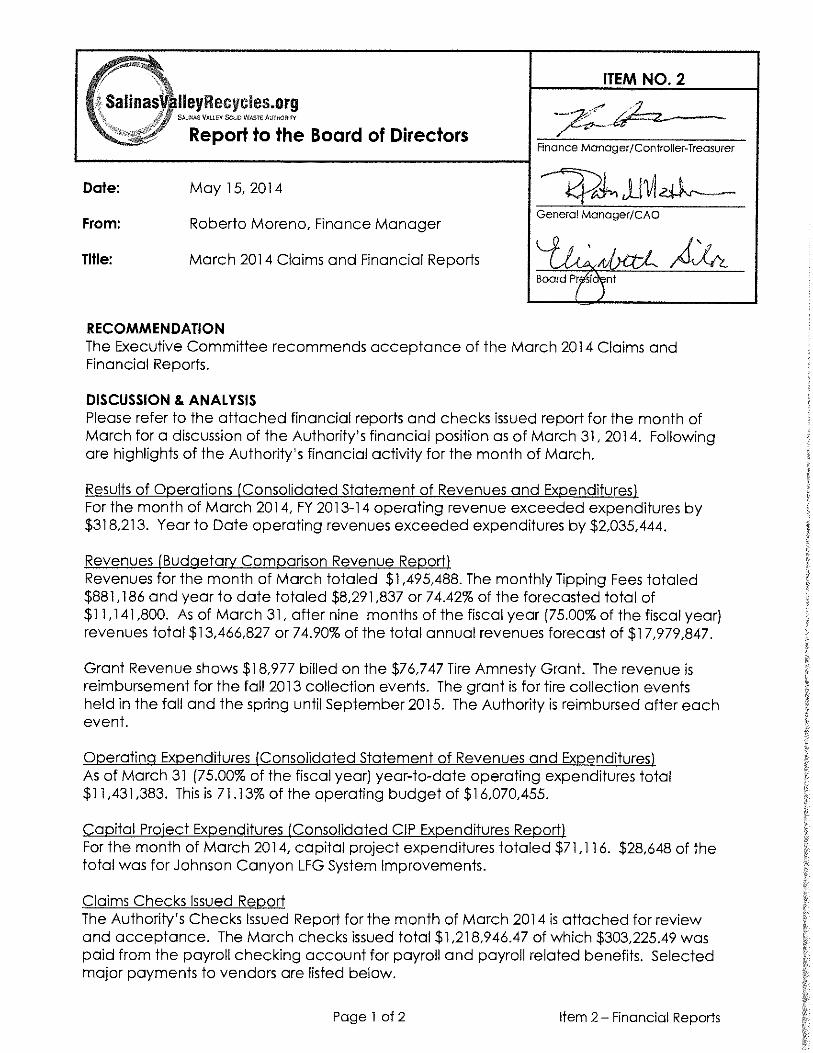
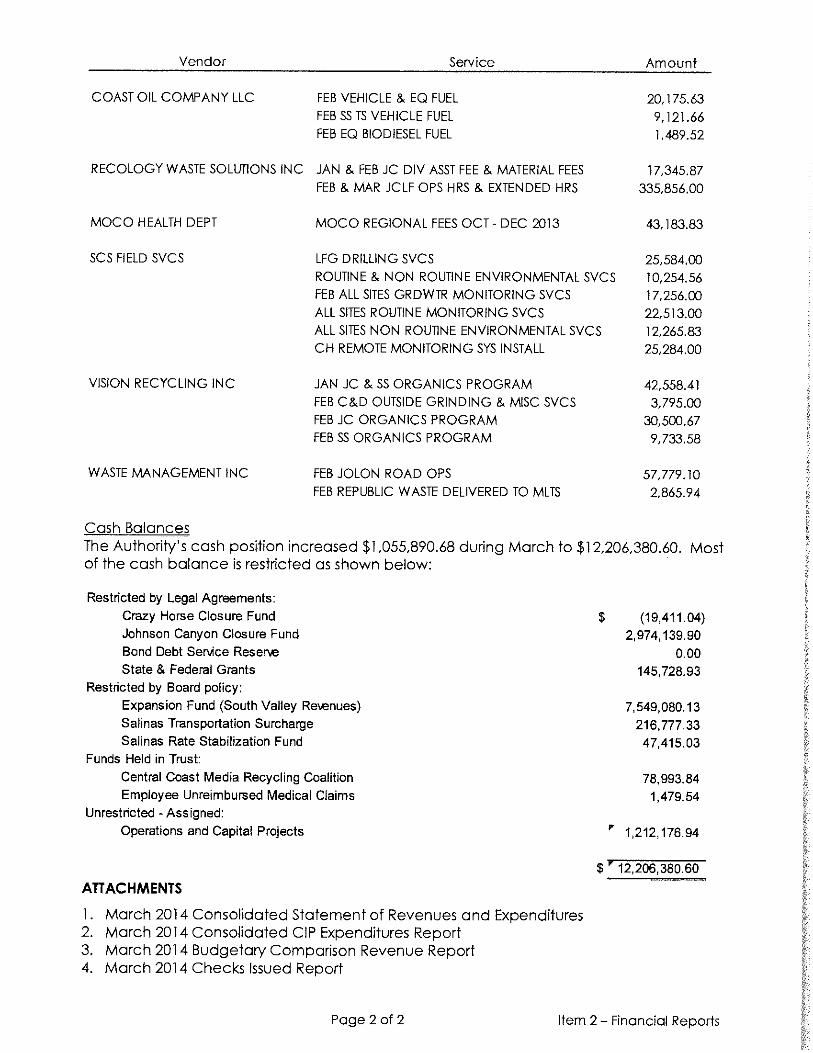
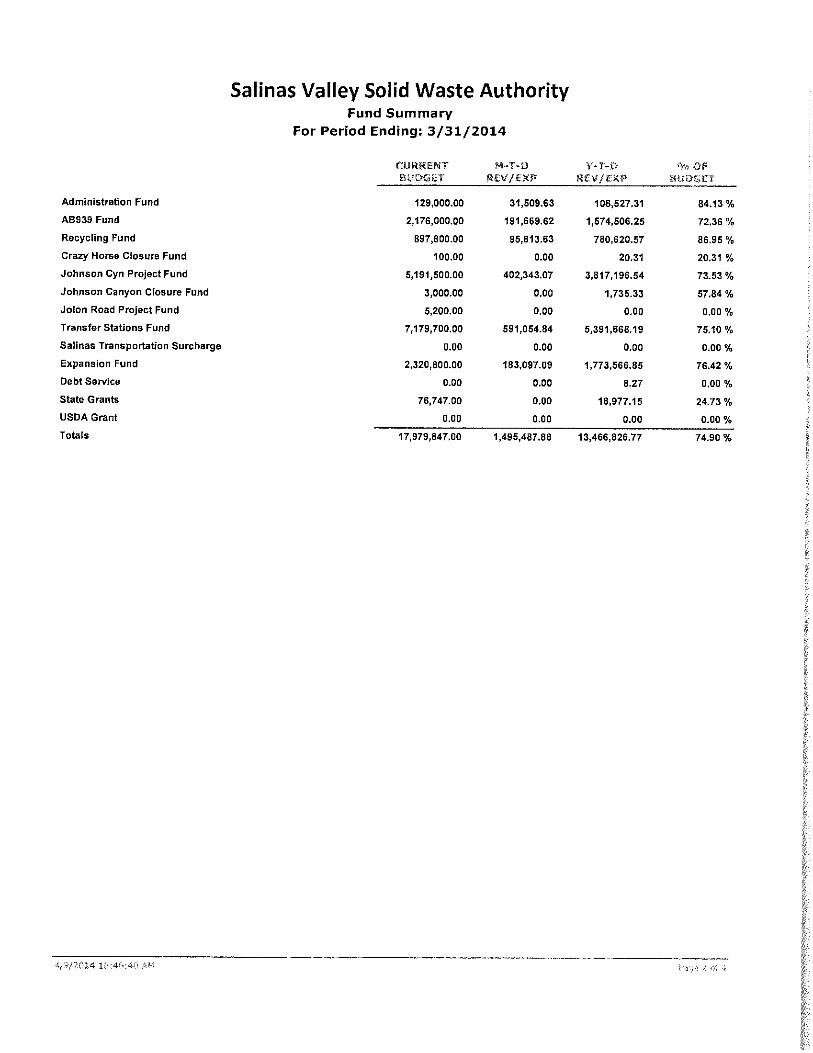
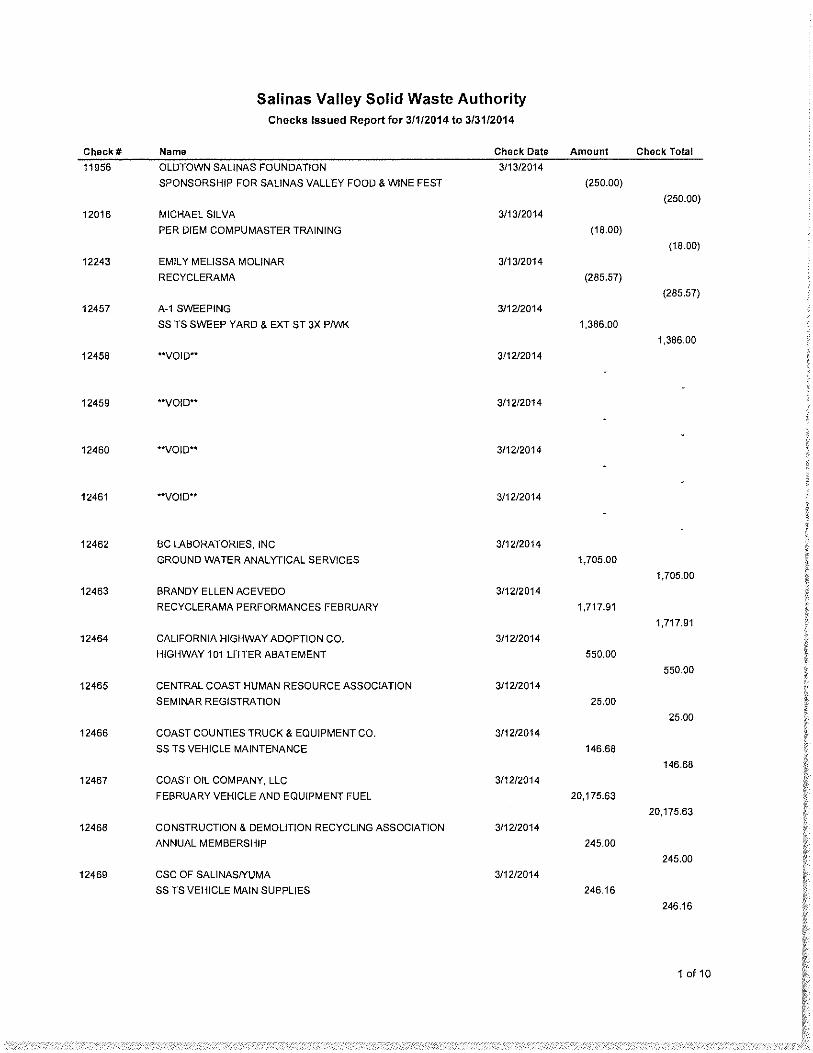
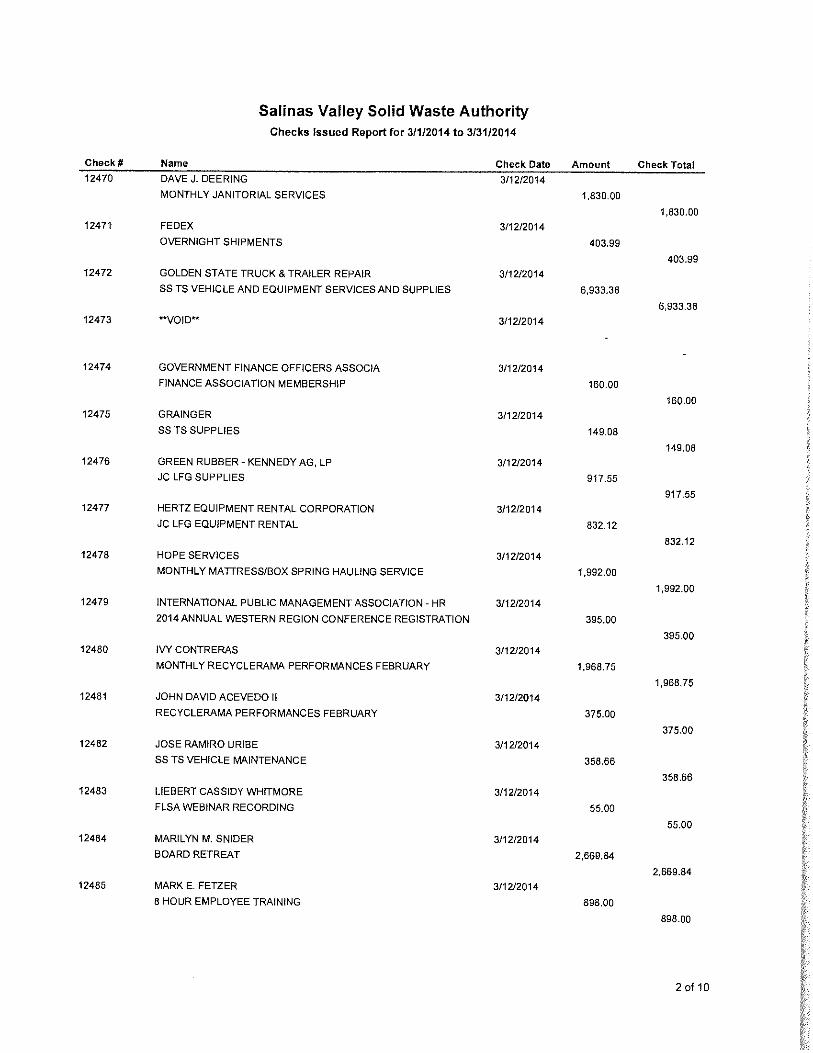
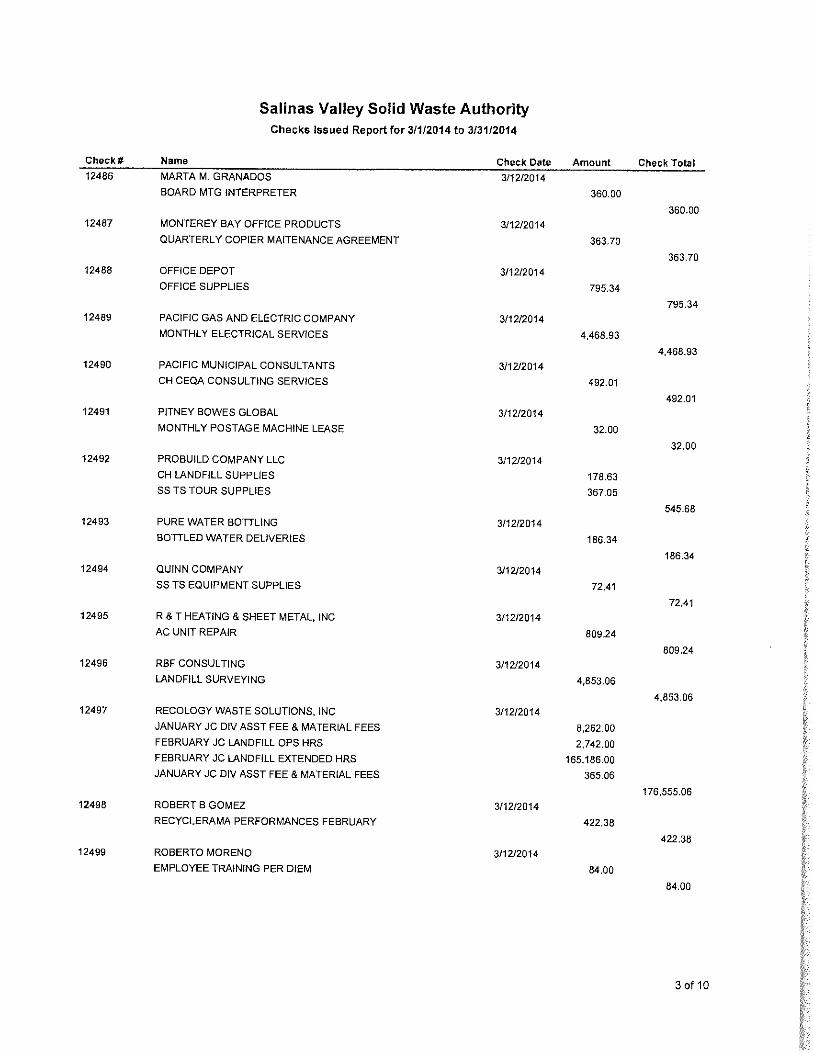
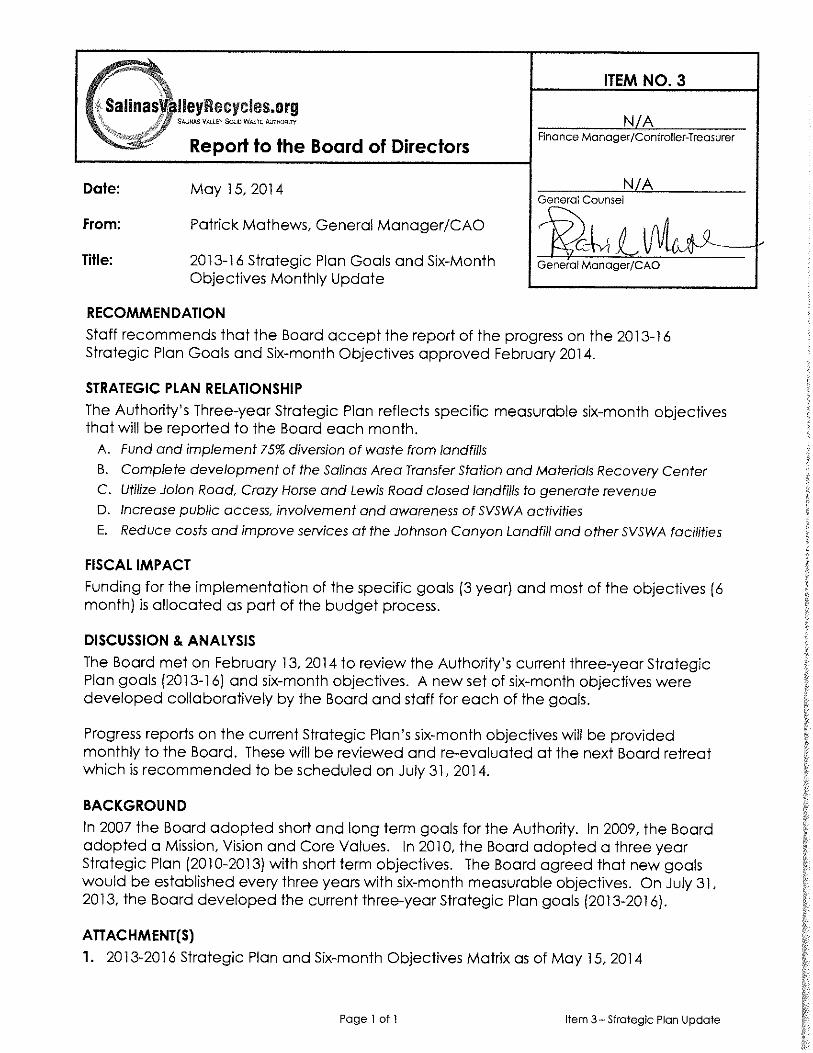
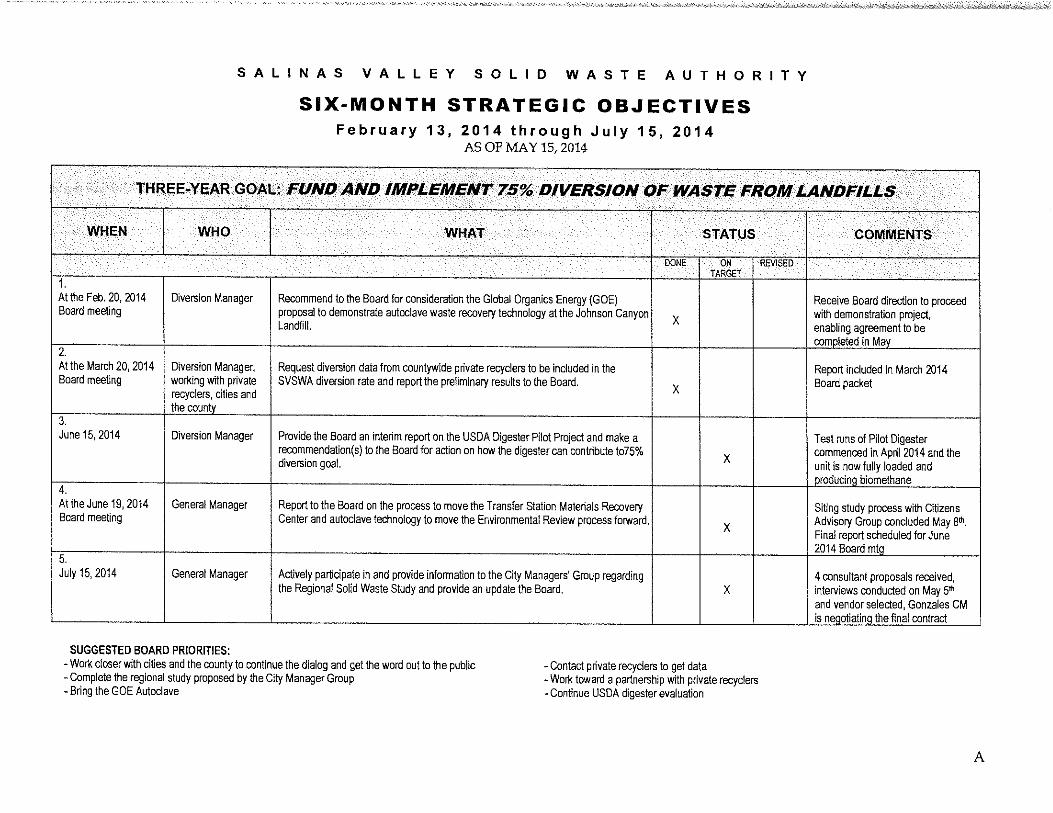
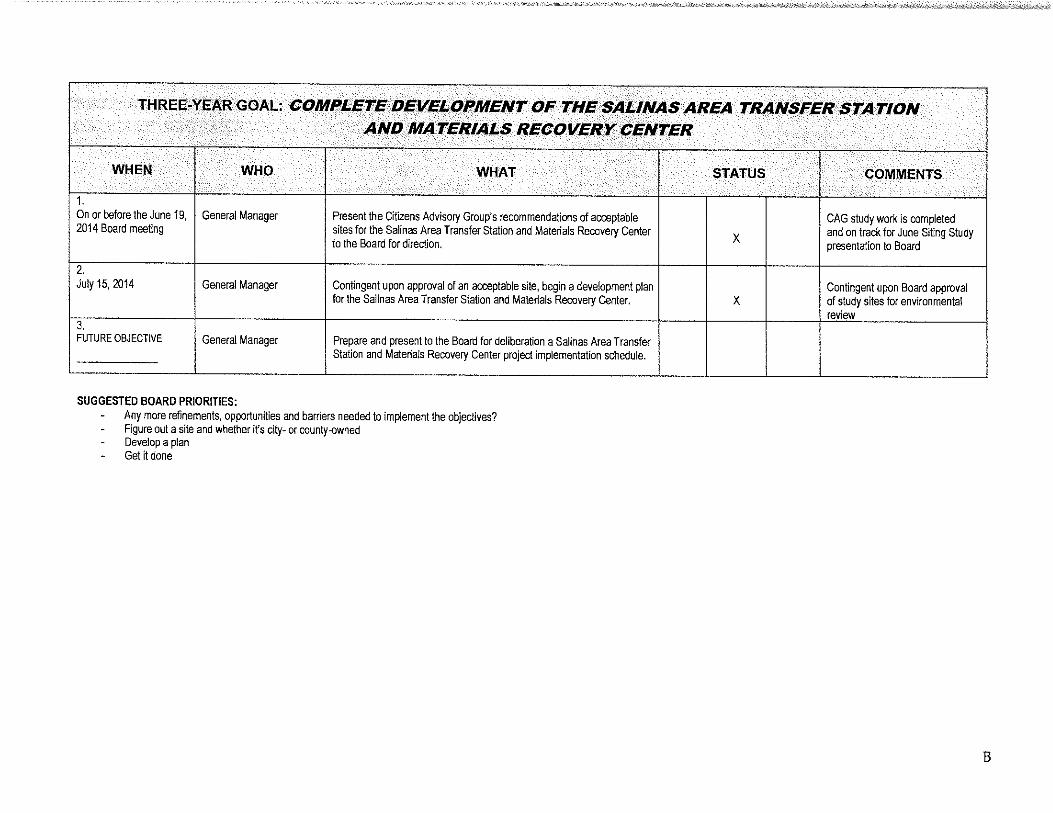
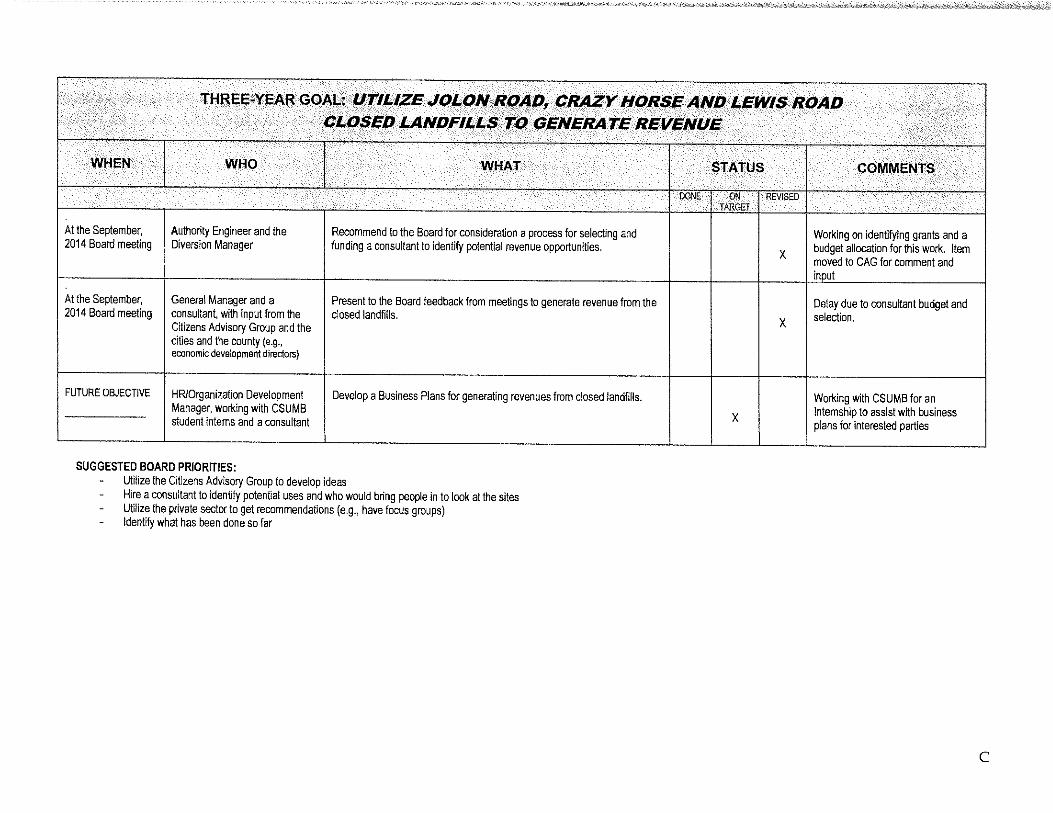
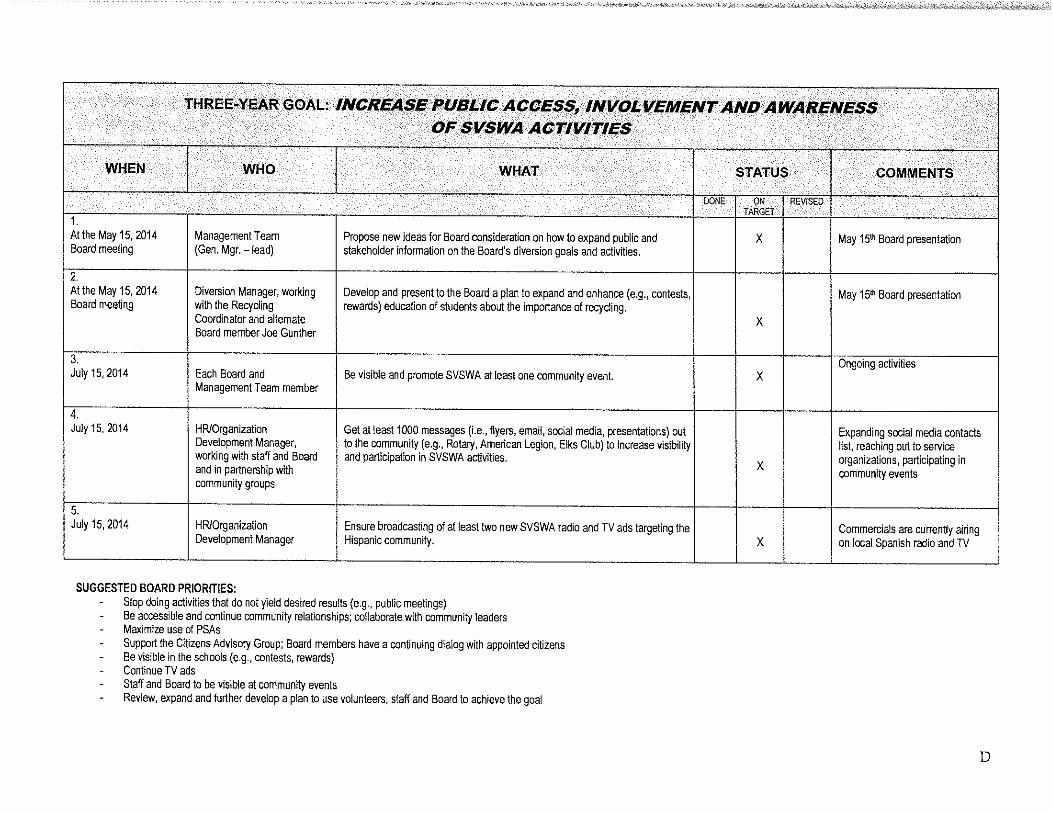
Page 1 of 3 Board of Directors May 15, 2014
A G E N D A Regular Meeting
BBOOAARRDD OOFF DDIIRREECCTTOORRSS
Thursday, May 15, 2014, 6:00 p.m. Gonzales City Council Chambers
117 Fourth Street, Gonzales, California
CALL TO ORDER TRANSLATION SERVICES AND OTHER MEETING ANNOUNCEMENTS PLEDGE OF ALLEGIANCE ROLL CALL Board Directors Alternate Directors County: Fernando L. Armenta County: Louis R. Calcagno County: Simon Salinas, Alternate Vice President Salinas: Joseph D. Gunter Salinas: Gloria De La Rosa Gonzales: Scott Funk Salinas: Jyl Lutes, Vice President Soledad: Christopher K. Bourke Salinas: Tony R. Barrera Greenfield: Raul C. Rodriguez Gonzales: Elizabeth Silva, President King City: Carlos R. Victoria Soledad: Richard J. Perez Greenfield: Annie Moreno King City: Robert S. Cullen GENERAL MANAGER/CAO COMMENTS DEPARTMENT MANAGER COMMENTS BOARD DIRECTOR COMMENTS PUBLIC COMMENT Receive public comment from audience on items which are not on the agenda. The public may comment on scheduled agenda items as the Board considers them. Speakers are limited to three minutes at the discretion of the Chair. CONSENT AGENDA: All matters listed under the Consent Agenda may be enacted by one motion unless a member of the Board, a citizen, or a staff member requests discussion or a separate vote. 1. Minutes of April 17, 2014, Meeting 2. March 2014 Claims and Financial Reports 3. Strategic Plan Monthly Progress Report 4. Tonnage and Diversion Report for the Quarter Ended March 31, 2014 5. A Resolution Approving a Two-Year Professional Services Agreement with
AdManor, Inc. for Marketing Services in an Amount Not to Exceed $100,000 per year
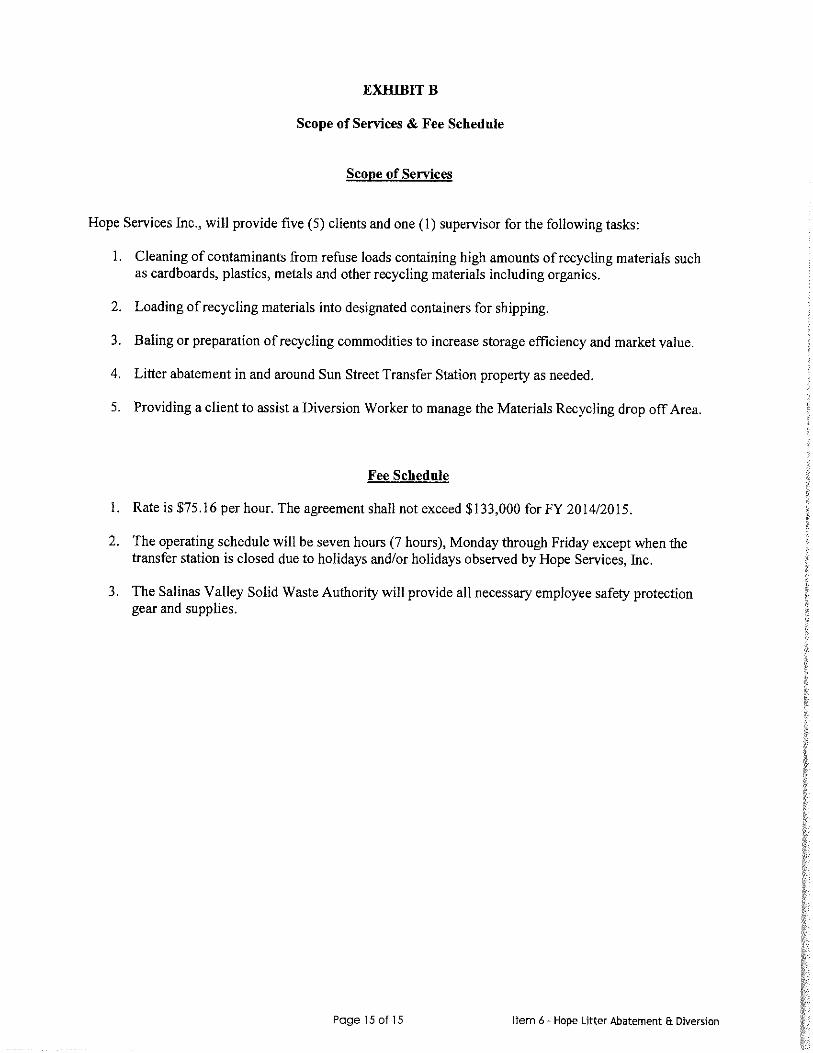
6. A Resolution Approving a Services Agreement with Hope Services Inc. for Materials Processing and Litter Abatement at the Sun Street Transfer Station for an Amount not to Exceed $133,000
Page 2 of 3 Board of Directors May 15, 2014
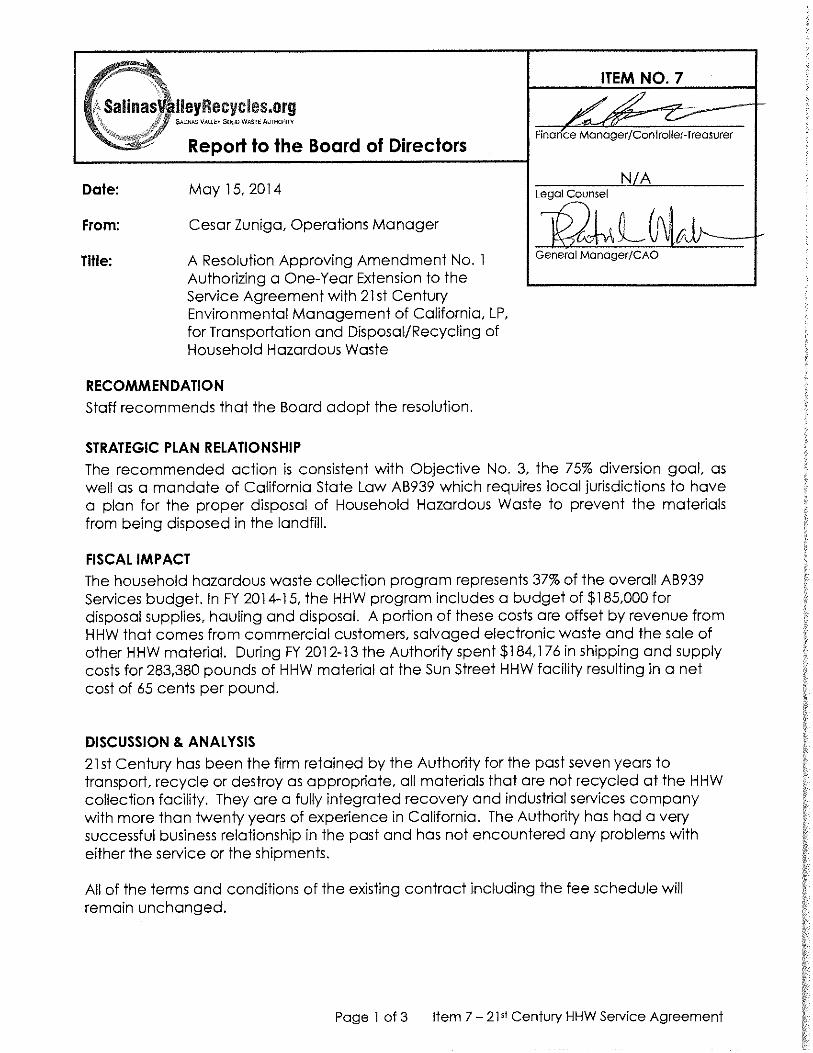
7. A Resolution Approving Amendment No. 1 Authorizing a One-Year Extension to the Service Agreement with 21st Century Environmental Management of California, LP, for Transportation and Disposal/Recycling of Household Hazardous Waste
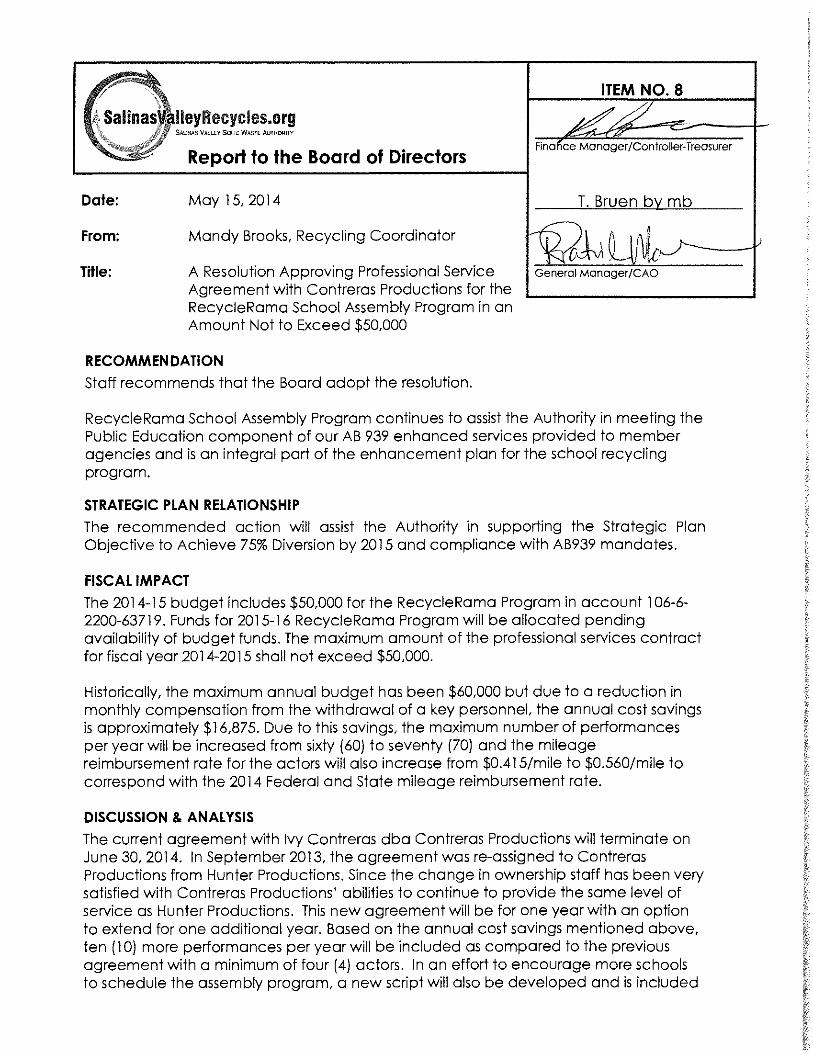
8. A Resolution Approving Professional Service Agreement with Contreras Productions for the RecycleRama School Assembly Program in an Amount Not to Exceed $50,000
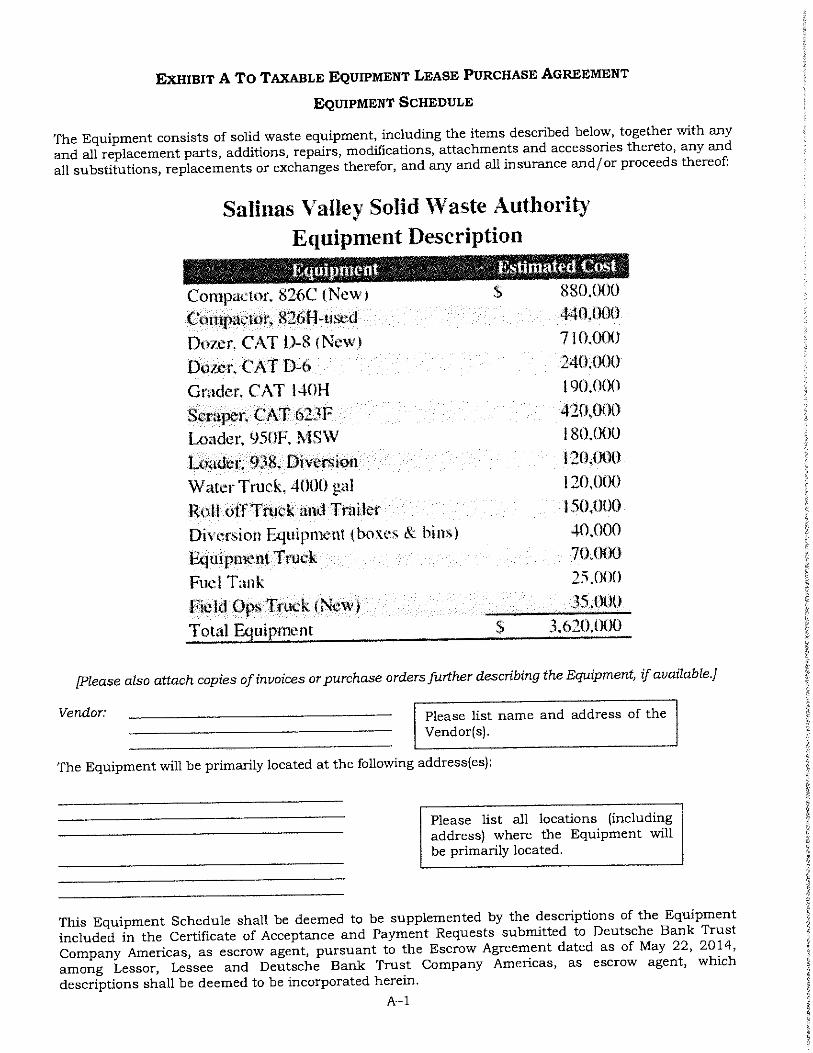
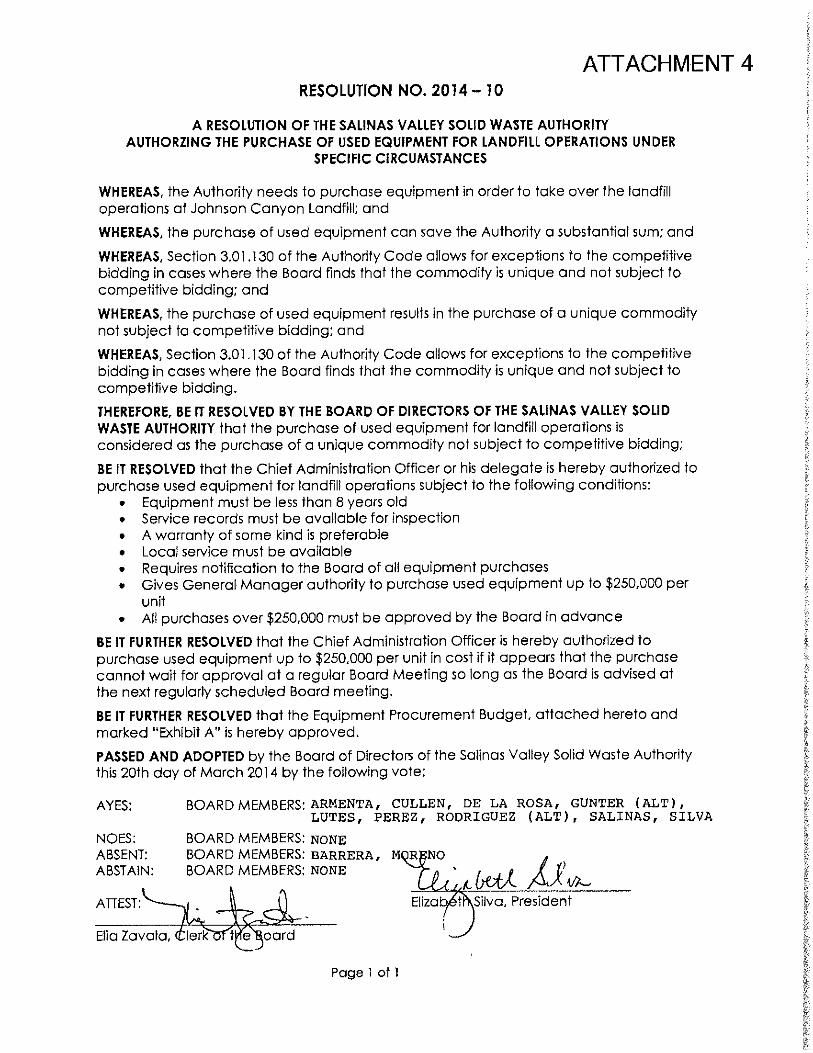
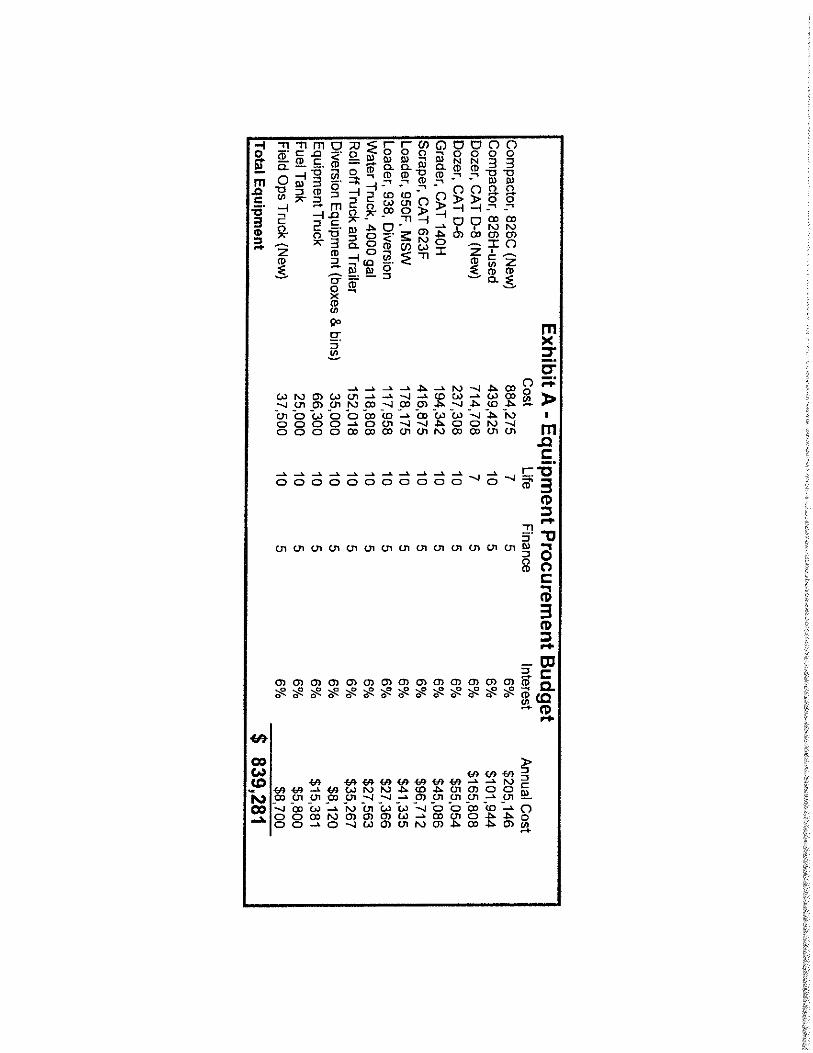
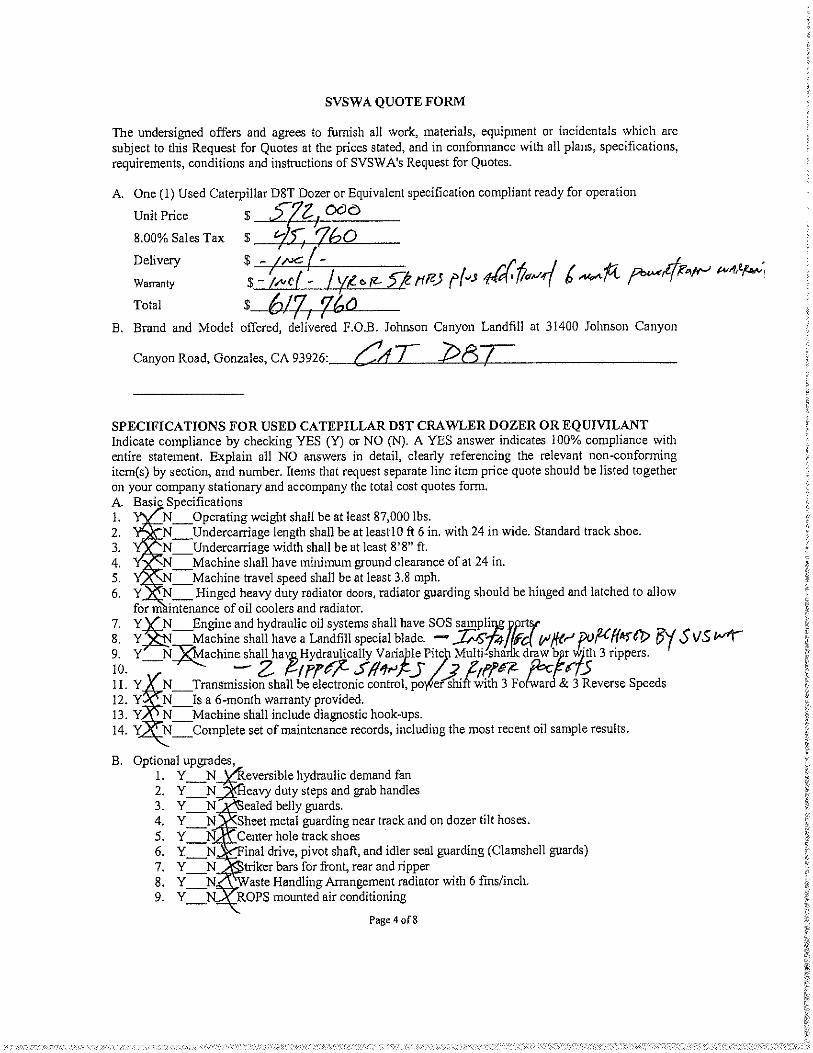
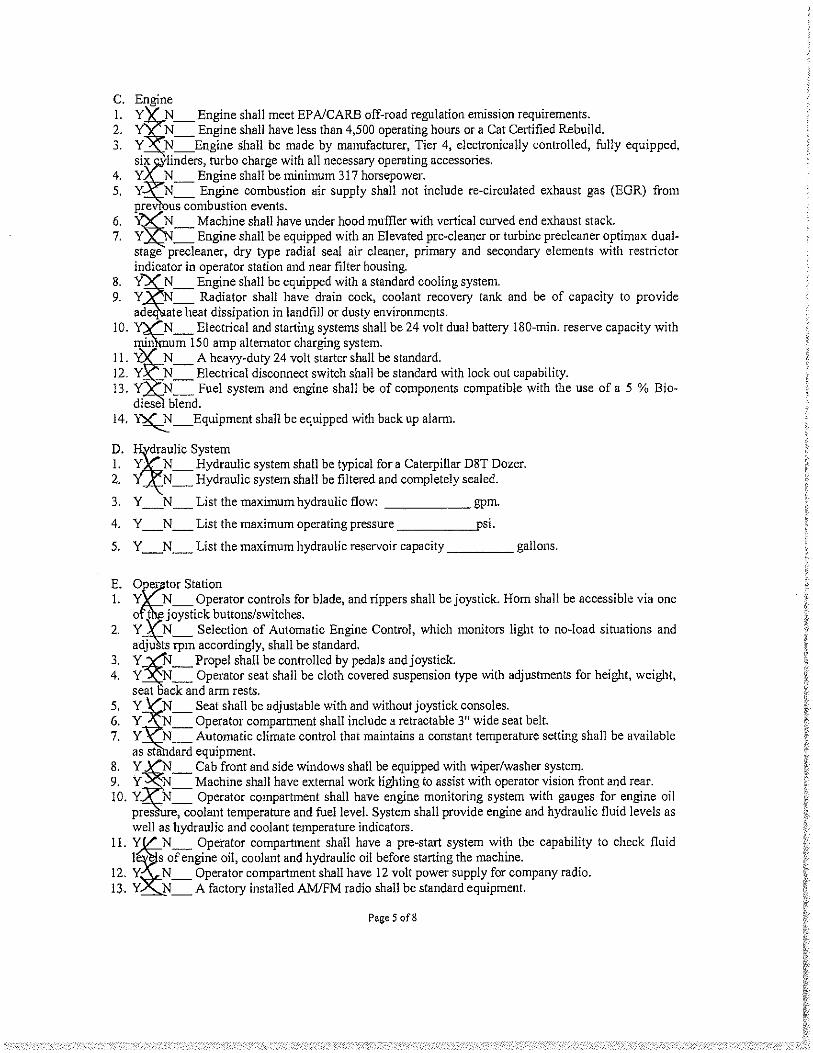
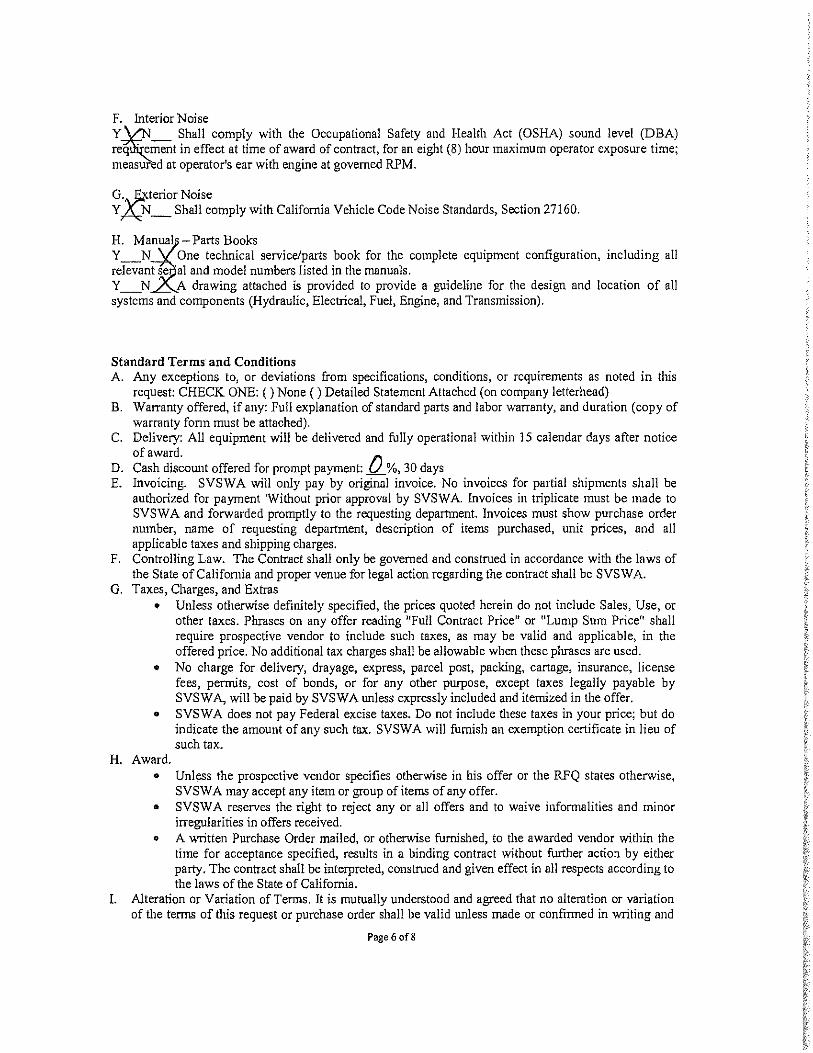
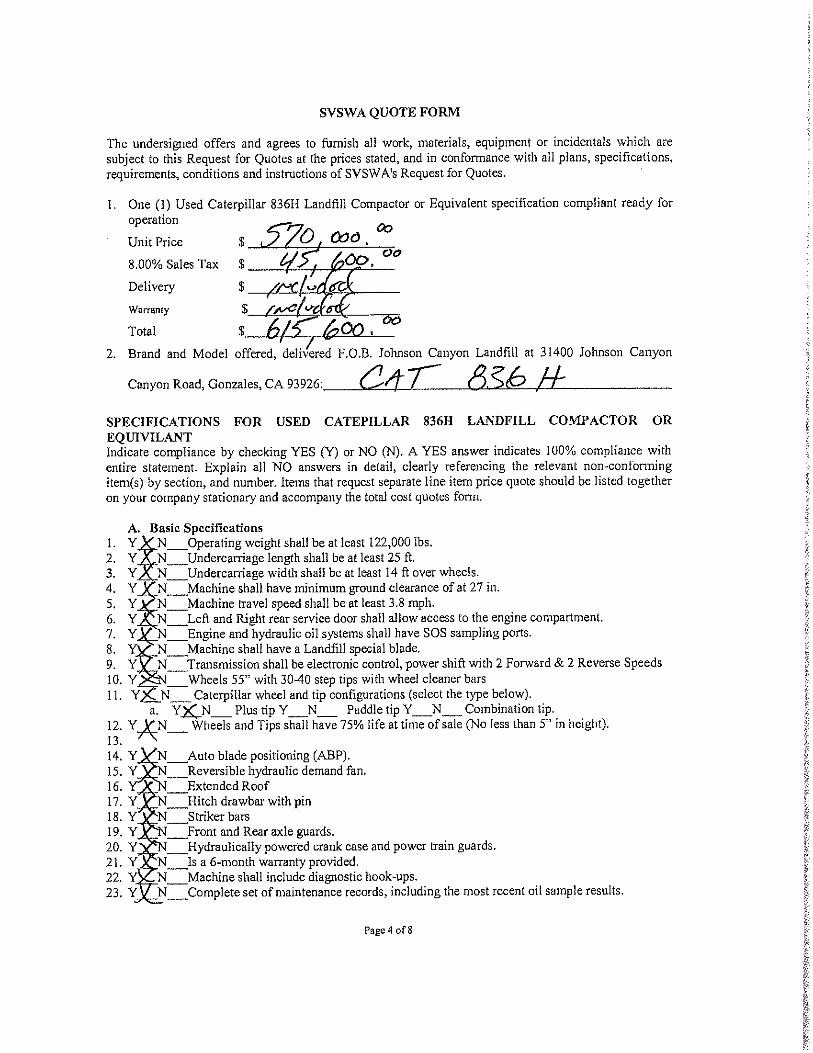
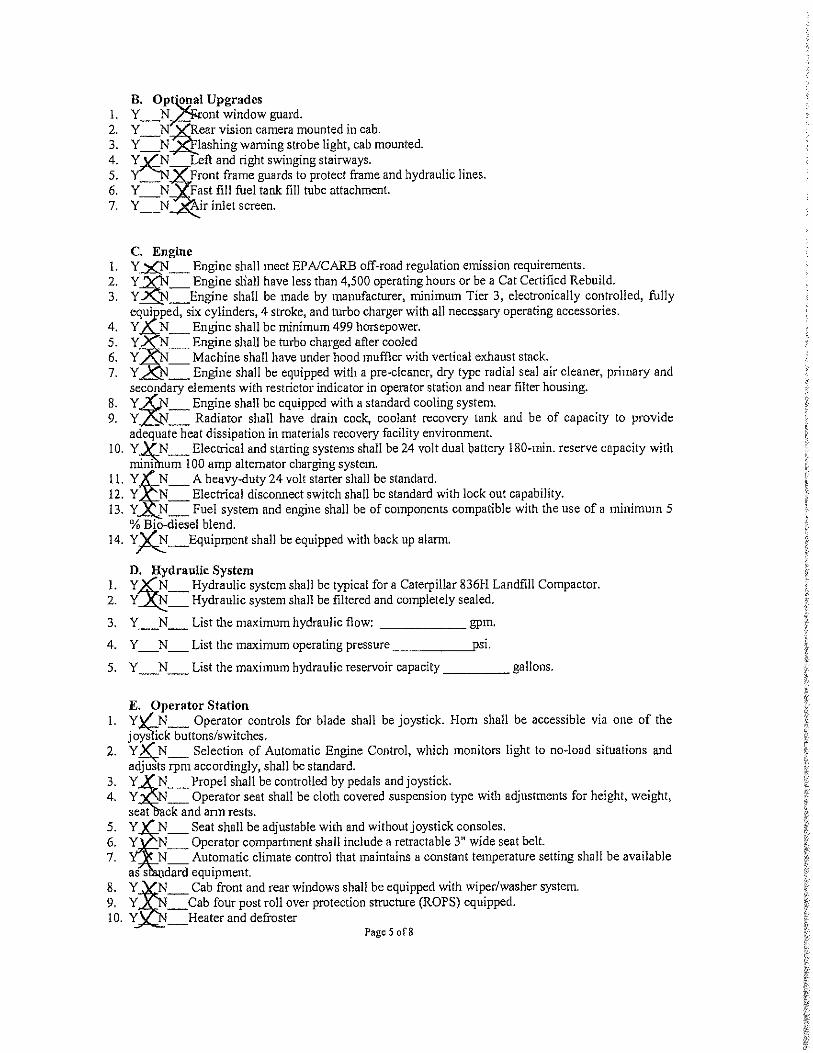
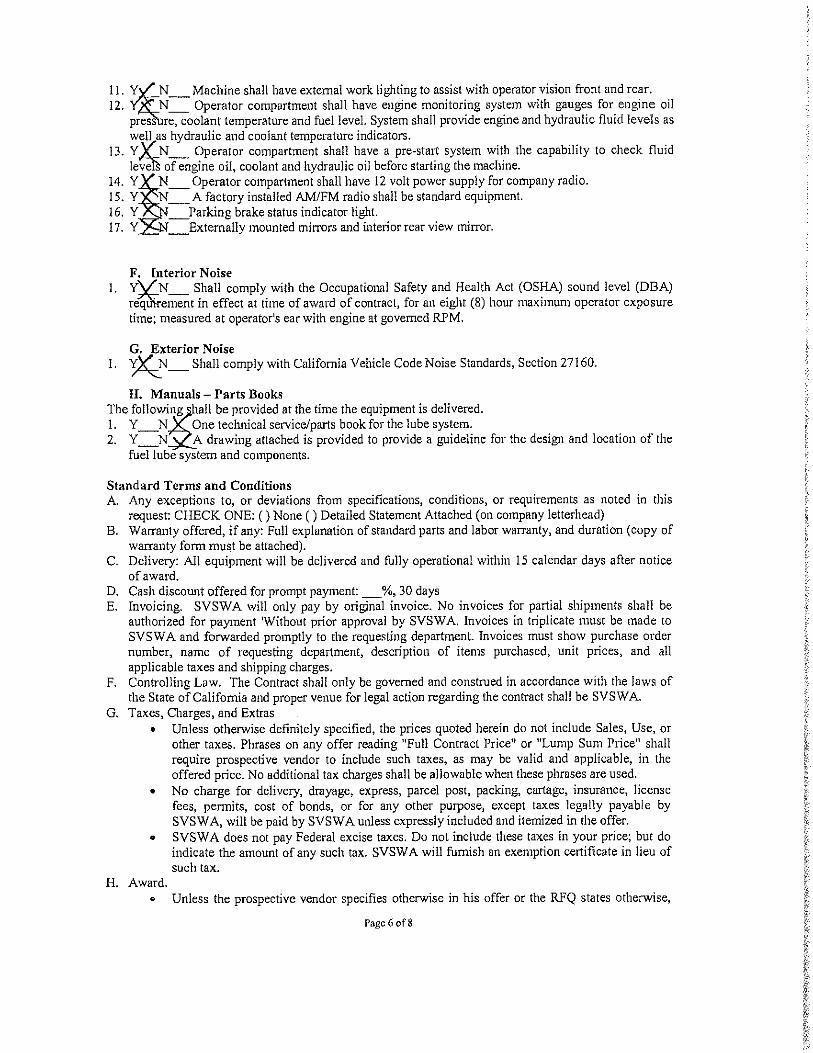
9. A Resolution Authorizing the Purchase of one used Caterpillar 836H Landfill Compactor and one used Caterpillar D8T Dozer from Quinn Caterpillar for a Total Amount of $1,233,360
PRESENTATION 10. New Ideas for Public and Stakeholder Outreach
A. Receive Report from HR/Organizational Dev. Manager Rose Gill B. Public Comment C. Board Discussion D. Recommended Action – None, Informational Only
11. Expanded/Enhanced Student Recycling Education Plan A. Receive Report from Recycling Coordinator Mandy Brooks B. Public Comment C. Board Discussion D. Recommended Action – None, Informational Only
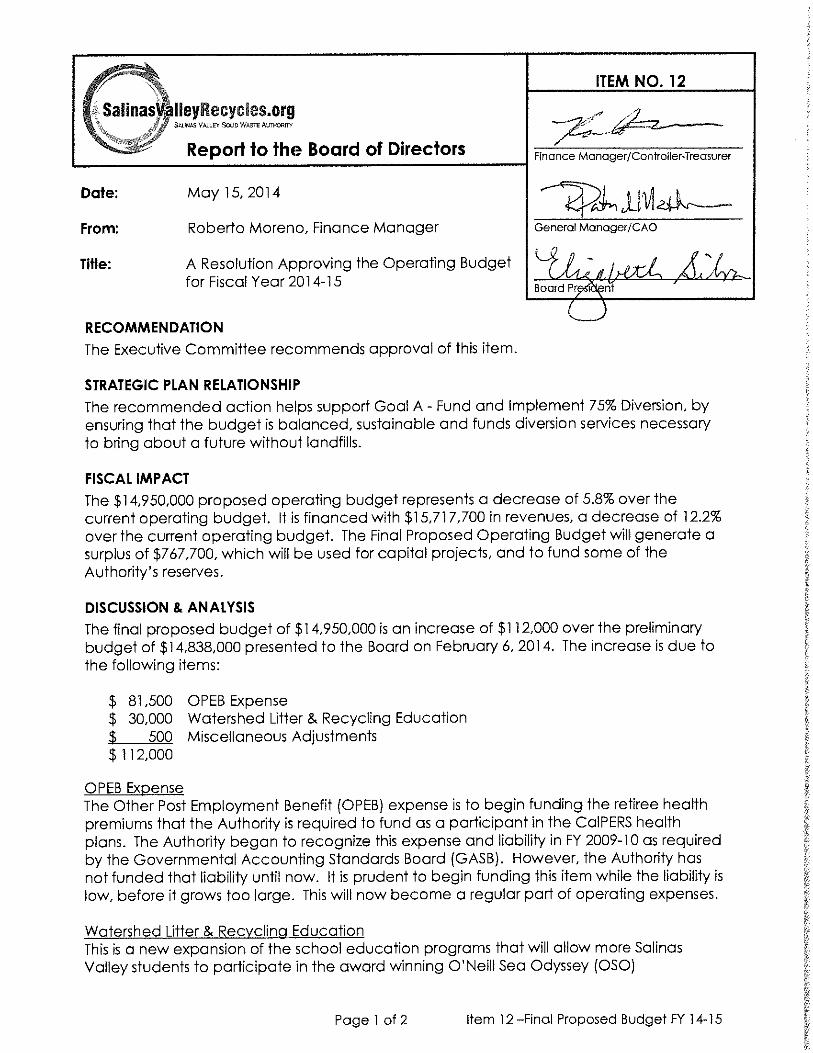
CONSIDERATION 12. A Resolution Approving the Operating Budget for Fiscal Year 2014-15
A. Receive Report from Finance Manager Roberto Moreno B. Public Comment C. Board Discussion D. Recommended Action – Adopt Resolution
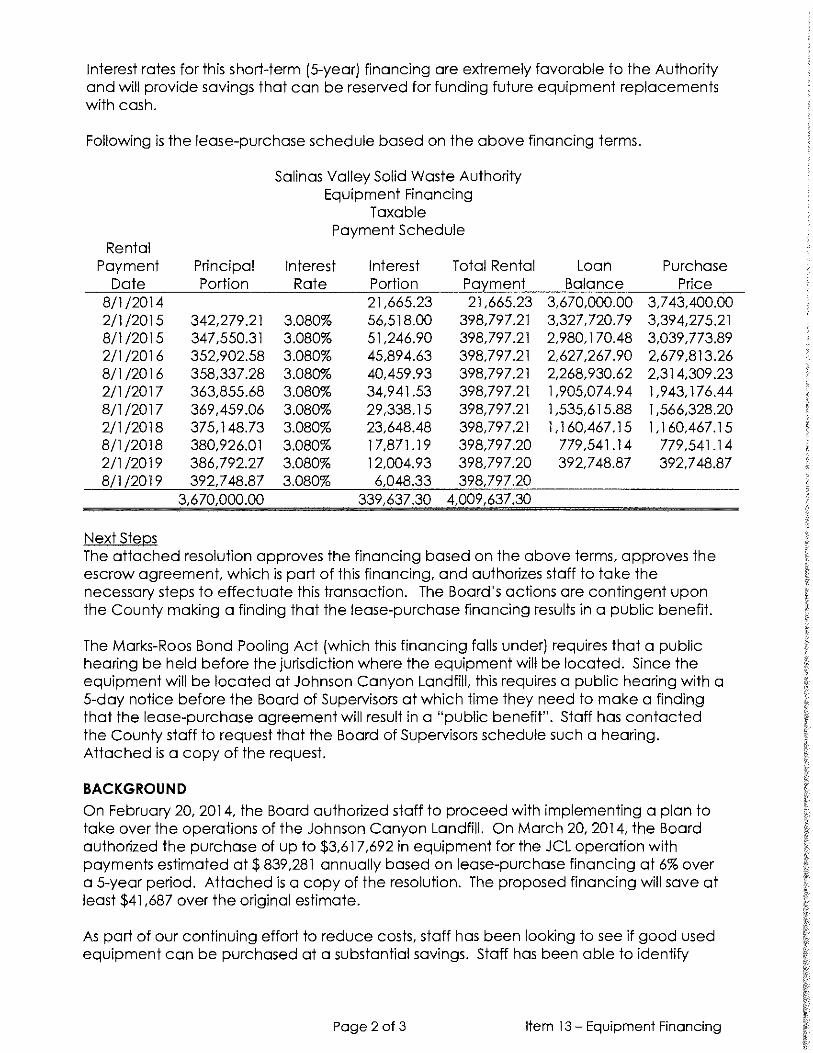
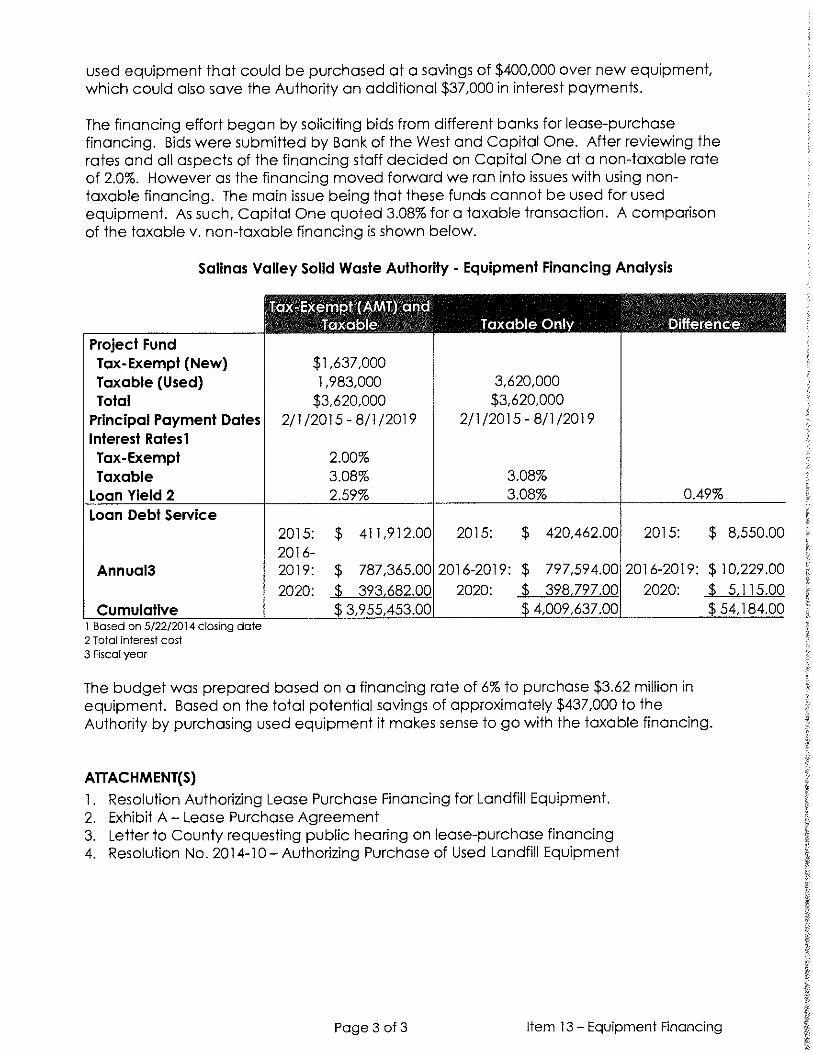
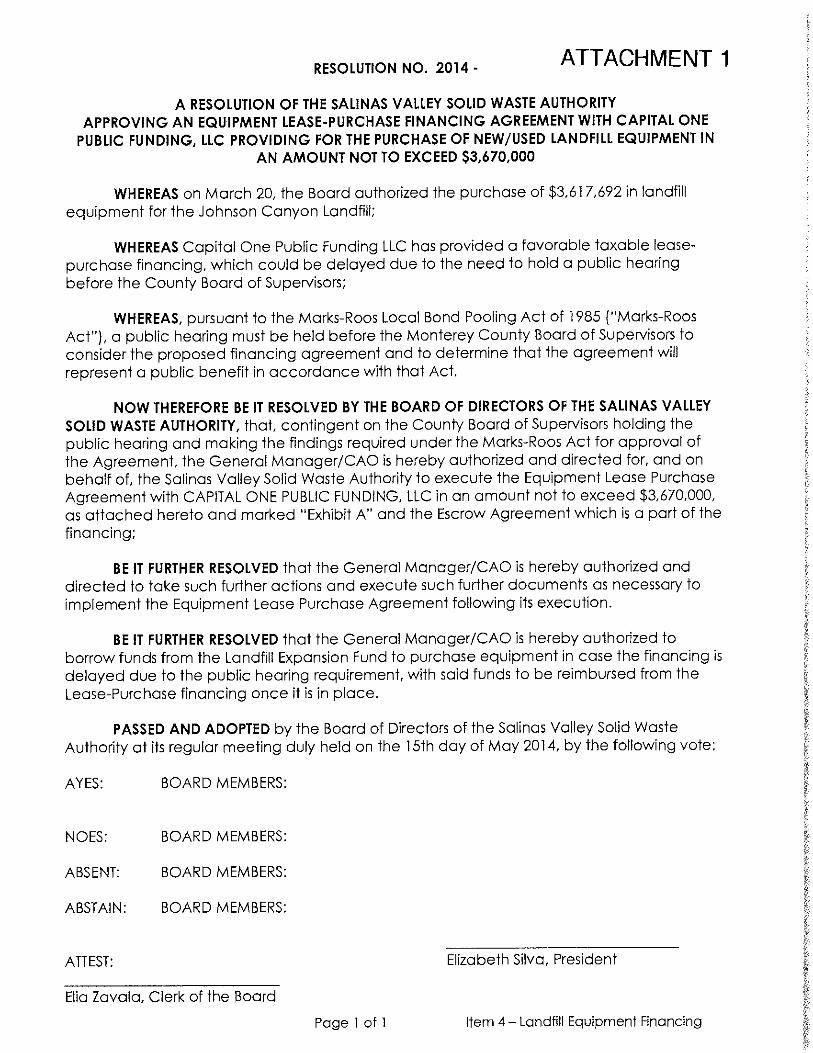
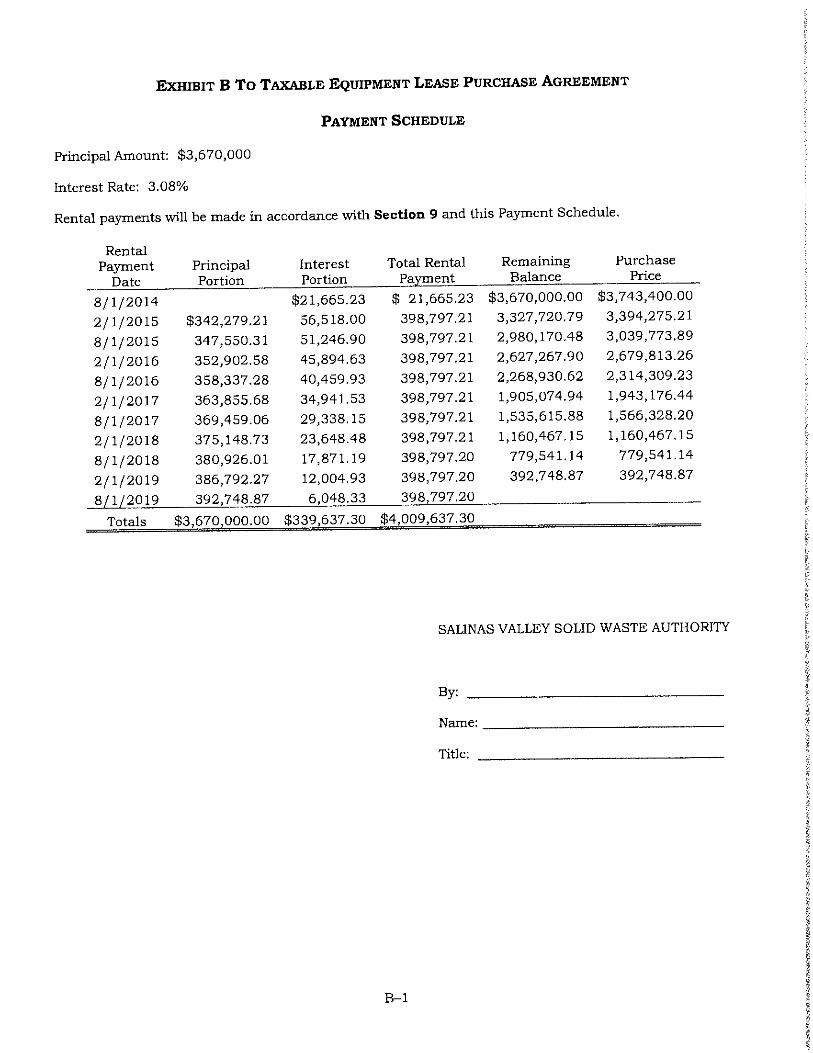
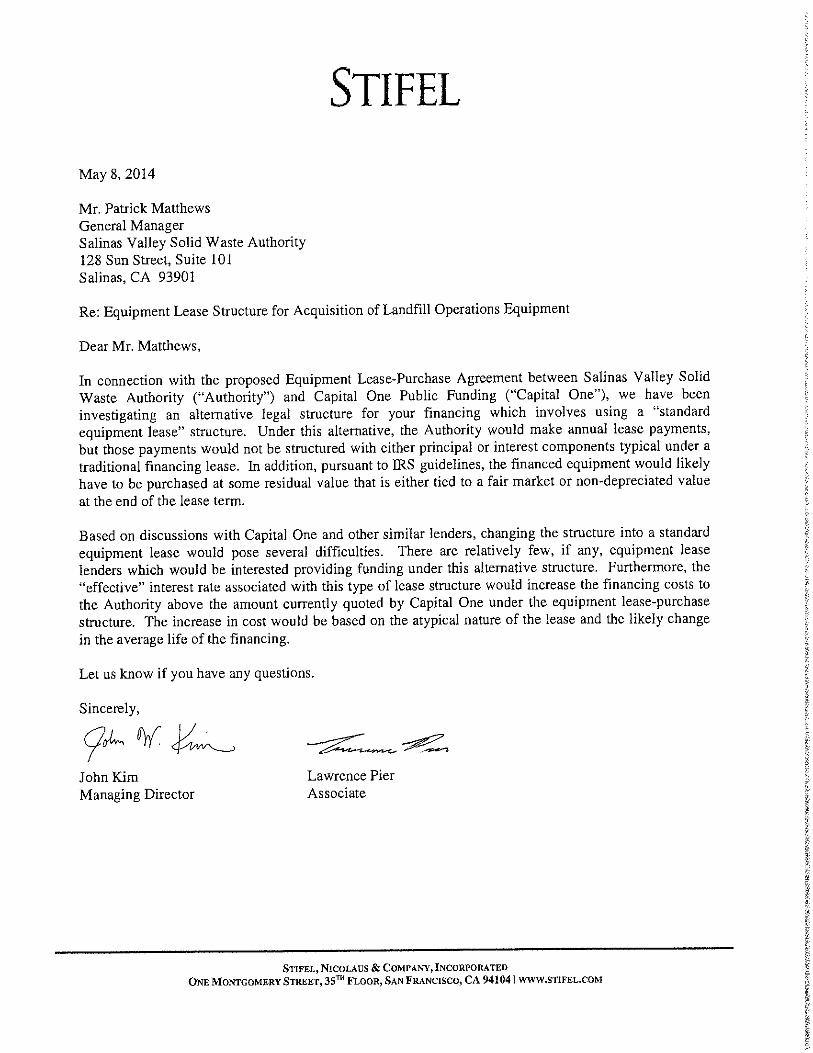
13. A Resolution Approving an Equipment Lease-Purchase Financing Agreement with Capital One Public Funding LLC Providing for the Purchase of New/Used Landfill Equipment in an Amount Not to Exceed $3,670,000 A. Receive Report from Finance Manager Roberto Moreno B. Public Comment C. Board Discussion D. Recommended Action – Make Appointments
14. Appointments to the Citizens Advisory Group A. Receive Report from Authority General Manager/CAO Patrick Mathews B. Public Comment C. Board Discussion D. Recommended Action – Make Appointments
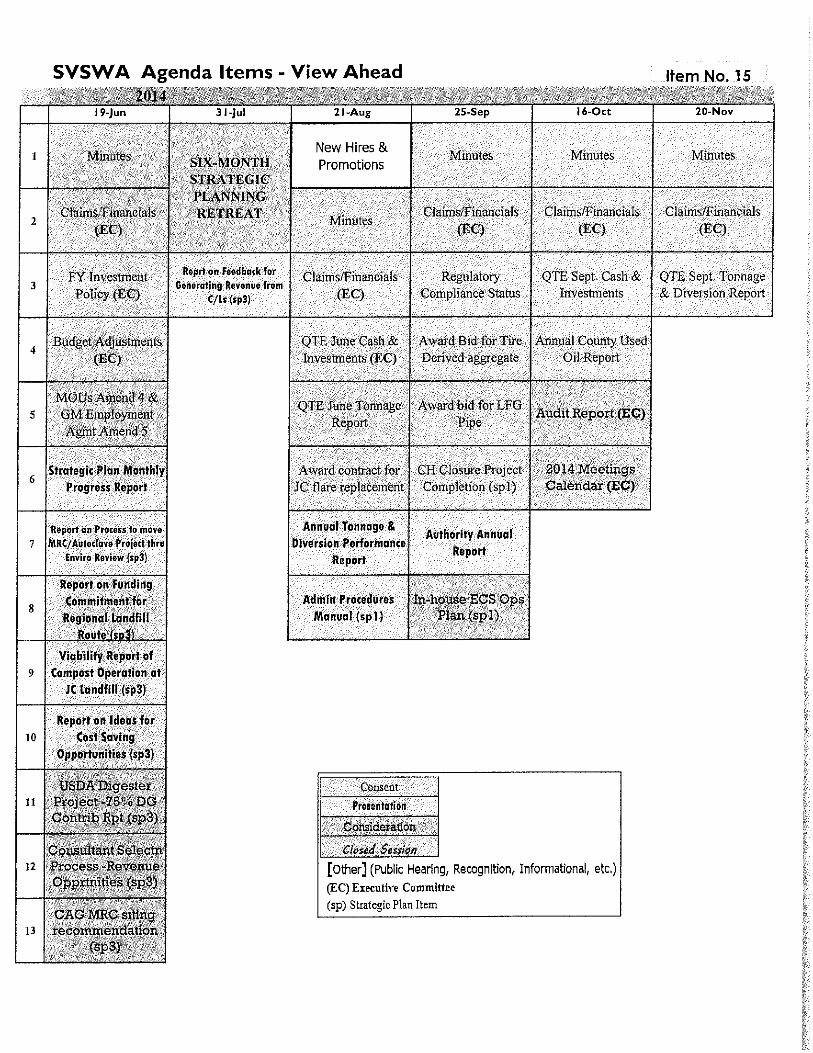
FUTURE AGENDA ITEMS 15. Agenda Items – View Ahead Schedule CLOSED SESSION 16. Pursuant to Government Code Section 54957.6 to provide instruction to General
Manager /CAO to negotiate salaries and benefits with SVSWA employees - management and non-management.
RECONVENE
Page 3 of 3 Board of Directors May 15, 2014
ADJOURNMENT This agenda was posted at the Administration Office of the Salinas Valley Solid Waste Authority, 128 Sun Street, Suite 101, Salinas, and on the Gonzales Council Chambers Bulletin Board, 117 Fourth Street, Gonzales, Friday, May 9, 2014. The Salinas Valley Solid Waste Authority Board will next meet on Thursday, June 19, 2014. Staff reports for the Authority Board meetings are available for review at: Salinas Valley Solid Waste Authority: 128 Sun Street, Ste. 101, Salinas, CA 93901, Phone 831-775-3000 Web Site: www.salinasvalleyrecycles.org Public Library Branches in Gonzales, Prunedale and Soledad City Halls of Salinas, Gonzales, Greenfield, King City & Soledad In compliance with the Americans with Disabilities Act, if you need special assistance to participate in the meeting, please contact Elia Zavala, Clerk of the Board at 831-775-3000. Notification 48 hours prior to the meeting will enable the Authority to make reasonable arrangements to ensure accessibility to this meeting (28 CFR 35.102-35.104 ADA Title II). Spanish interpretation will be provided at the meeting. Se proporcionará interpretación a Español.


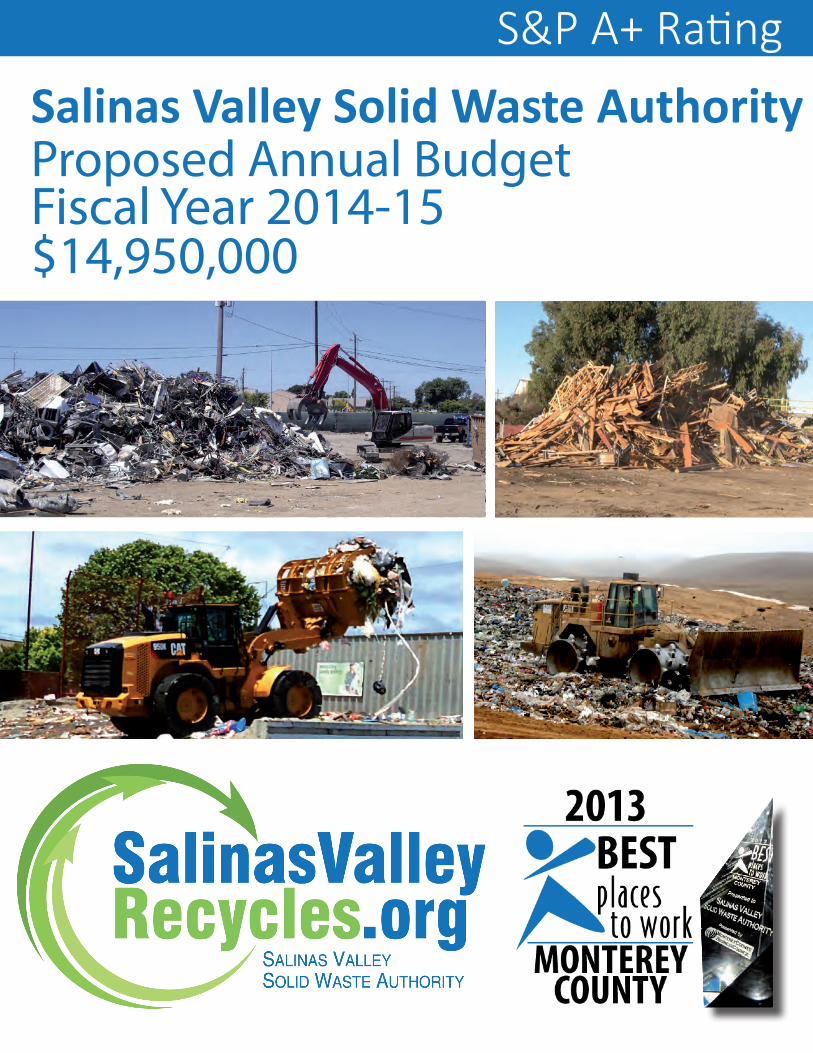
Fiscal Year 2014-15 $14,950,000
Salinas Valley Solid Waste Authority S&P A+ Rating
Proposed Annual Budget

This page intentionally left blank
SALINAS VALLEY SOLID WASTE AUTHORITY
Proposed Budget Fiscal Year 2014-2015
Prepared by:
The Authority’s Finance Division
Roberto Moreno Finance Manager/Treasurer
PO Box 2159 Salinas, CA 93902-2159
128 Sun St., Suite 101
Salinas, CA 93901-3751

This page intentionally left blank
SALINAS VALLEY SOLID WASTE AUTHORITY Proposed Budget
FY 2014-2015 Table of Contents
Page
BUDGET MESSAGE .................................................................................................... 01
LIST OF PRINCIPAL OFFICIALS ................................................................................ 17
SALINAS VALLEY SOLID WASTE AUTHORITY SERVICE AREA ............................ 18
ORGANIZATION CHART ............................................................................................. 19
BUDGET SUMMARIES
TWO-YEAR BUDGET COMPARISON ................................................................................. 21 BUDGET BY CATEGORY ................................................................................................. 23 BUDGET BY PROGRAM .................................................................................................. 25 FULL COST OF SERVICES BY MAJOR CATEGORIES ........................................................... 27 FULL COST OF SERVICES BY PROGRAM .......................................................................... 29 BUDGET BY CATEGORY WITH LINE ITEM DETAIL ............................................................... 31
PROPOSED OPERATING BUDGET WORKSHEETS
EXECUTIVE ADMINISTRATION (1110) .............................................................................. 35 ADMINISTRATIVE SUPPORT (1120) ................................................................................. 35 HUMAN RESOURCES ADMINISTRATION (1130) ................................................................ 36 CLERK OF THE BOARD (1140)........................................................................................ 37 FINANCE ADMINISTRATION (1200) .................................................................................. 38 OPERATIONS ADMINISTRATION (1300) ........................................................................... 39 SCALEHOUSE OPERATIONS (3100) ................................................................................ 40 RESOURCE RECOVERY (2100) ...................................................................................... 41 MARKETING (2150) ....................................................................................................... 42 PUBLIC EDUCATION (2200) ........................................................................................... 42 HOUSEHOLD HAZARDOUS WASTE (2300) ....................................................................... 42 SUN STREET RECYCLING OPERATIONS (3730) ............................................................... 43 C&D DIVERSION (2400) ................................................................................................ 43 ORGANICS DIVERSION (2500) ....................................................................................... 43 DIVERSION SERVICES (2600) ........................................................................................ 44 CRAZY HORSE POSTCLOSURE (5300) ............................................................................ 44 LEWIS ROAD POSTCLOSURE (5400) ............................................................................... 45 JOHNSON CANYON LANDFILL OPERATIONS (4500) .......................................................... 46 JOHNSON CANYON LANDFILL ENVIRONMENTAL CONTROL SYSTEMS (5500) ...................... 47 CLOSURE SET-ASIDE (6605) ......................................................................................... 47 JOLON ROAD POSTCLOSURE (5600) .............................................................................. 47 JOLON ROAD TRANSFER STATION (3600) ....................................................................... 48 MADISON LANE TRANSFER STATION (3650) .................................................................... 48 SUN STREET DISPOSAL OPERATIONS (3710) .................................................................. 48 SUN STREET TRANSFER OPERATIONS (3720) ................................................................. 50 SUN STREET ENVIRONMENT CONTROL SYSTEMS (5700) ................................................. 50 EXPANSION FUND (180) ................................................................................................ 51 DEBT SERVICE FUND (190) ........................................................................................... 51
SALINAS VALLEY SOLID WASTE AUTHORITY Proposed Budget
FY 2014-2015 Table of Contents
Page APPENDICES
A. RESOLUTION 2014-11 FINANCIAL POLICIES 04/17/14 .............................................. 53 B. RESOLUTION 2014-07 APPROVING FEES AND RATES EFFECTIVE 07/1/14 ................. 77 C. DRAFT RESOLUTION APPROVING FY 2014-15 BUDGET ........................................... 83 D. RECOLOGY CONTRACT RATES 01/01/14 ................................................................ 85 E. PERSONNEL ALLOCATION 03/20/14 ........................................................................ 87 F. SALARY SCHEDULE 03/20/14 ................................................................................ 89 G. DEBT SERVICE SCHEDULE - REVENUE BONDS, SERIES 2014A ............................... 101 H. DEBT SERVICE SCHEDULE - REVENUE BONDS, SERIES 2014B ............................... 103 I. LANDFILLED TONNAGE HISTORY ........................................................................... 105 J. PROJECTED LANDFILLED TONNAGE ...................................................................... 107 K. BOND DEBT COVERAGE RATIO ............................................................................. 109
May 15, 2014 Salinas Valley Solid Waste Authority Board Members: We are pleased to present for your consideration the Proposed Operating Budget for fiscal year 2014-15. The $14,950,000 operating budget represents a 5.8% decrease over the FY 2013-14 budget. This decrease is due primarily to the $1,220,800 reduction in debt service payments as a result of the 2014 Refunding Revenue Bonds. The budget is financed by $15,717,700 in operating revenues, which will generate an operating surplus of $767,700. The operating surplus will be used to finance $675,000 in new Capital Improvements. The current Capital Improvement Budget appropriations will carry over to FY 2014-15 per the Authority’s financial policies until such projects are completed. This will leave a year-end surplus at June 30, 2014 of $92,700, which will be used to fund the Authority’s reserves in accordance with the Authority’s financial policies. Achieving a Balanced Budget – A Long-Term Process The achievement of a balanced budget with a year-end surplus in a budget year with no rate increases and with the loss of $2.1 million in revenue from ending the importation of waste from Recology South Valley is the result of a lot of planning. The Board’s decisions to implement an AB939 Fee of $1.7 million effective July 1, 2013, and to end the funding of operations with revenues from the importation of waste from South Santa Clara Valley, was followed by the Board’s decision to refinance the 2002 revenue bonds and the Crazy Horse Installment Purchase Agreement. These decisions have put the Authority on a path to sustainable revenues, and being financially sound. To achieve a balanced budget this document incorporates the following items: No increase in tipping fees. Increase the Salinas Transportation Surcharge by $3.00 per ton to $14.00. This allows the
Authority to slowly get out of subsidizing the transfer of Salinas franchise garbage. Minimize operating budget increases by maintaining a status quo budget. Budget increases
where necessary are primarily for costs beyond the Authority’s control. Making more efficient use of Sun Street Transfer Station has allowed the Authority to absorb increased regulatory costs.
Beginning on the next page is a summary of the proposed budget followed by a discussion of how it was developed. Thereafter the budget summaries analyze the budget in various ways.
Page 1 of 110
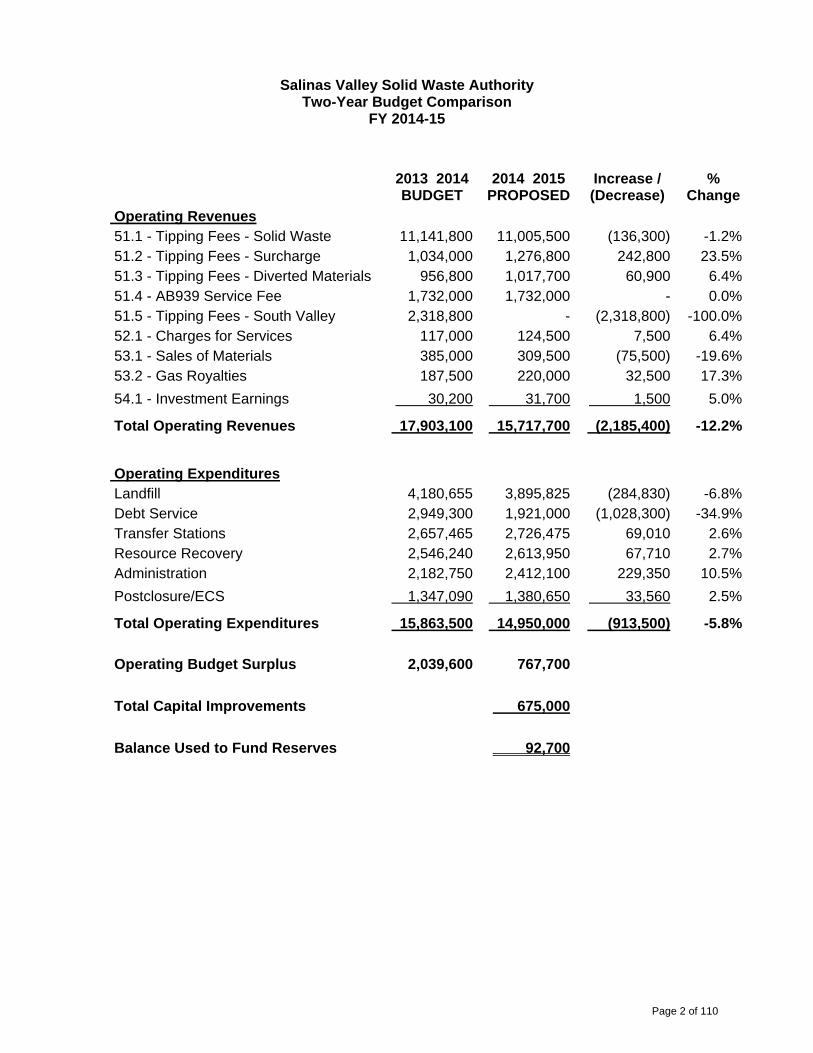
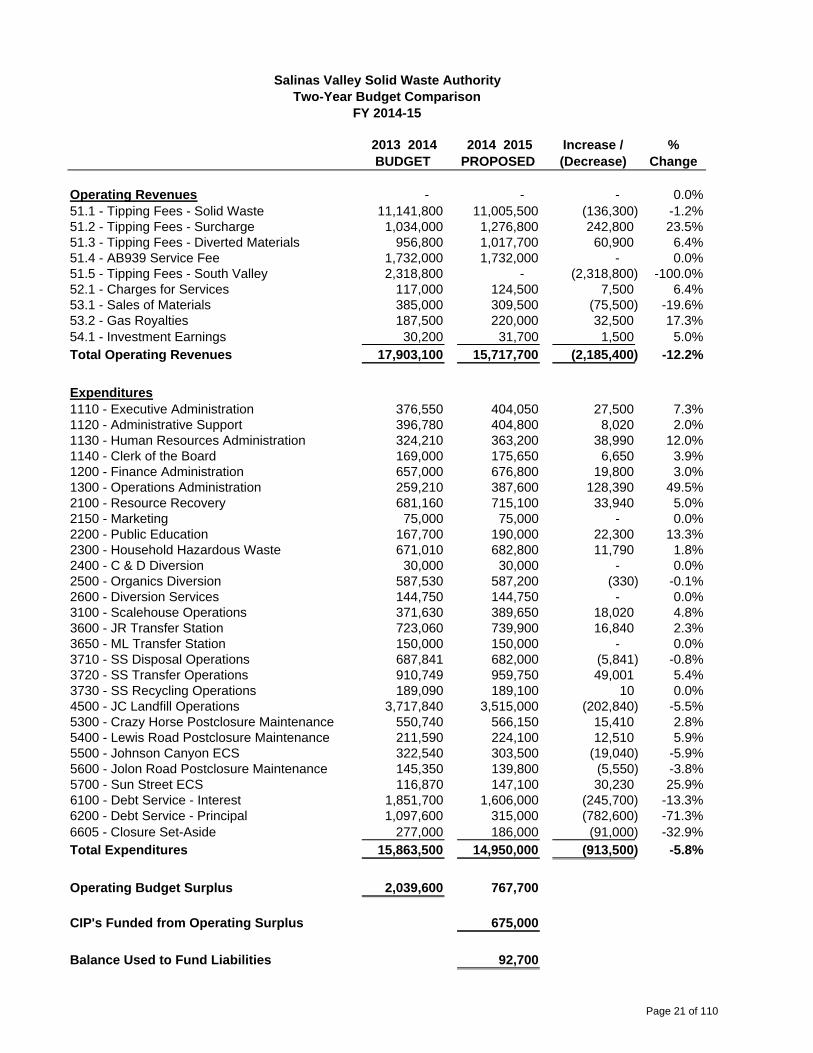
Salinas Valley Solid Waste Authority Two-Year Budget Comparison
FY 2014-15
2013 2014 BUDGET
2014 2015 PROPOSED
Increase / (Decrease)
% Change
Operating Revenues 51.1 - Tipping Fees - Solid Waste 11,141,800 11,005,500 (136,300) -1.2% 51.2 - Tipping Fees - Surcharge 1,034,000 1,276,800 242,800 23.5% 51.3 - Tipping Fees - Diverted Materials 956,800 1,017,700 60,900 6.4% 51.4 - AB939 Service Fee 1,732,000 1,732,000 - 0.0% 51.5 - Tipping Fees - South Valley 2,318,800 - (2,318,800) -100.0% 52.1 - Charges for Services 117,000 124,500 7,500 6.4% 53.1 - Sales of Materials 385,000 309,500 (75,500) -19.6% 53.2 - Gas Royalties 187,500 220,000 32,500 17.3%
54.1 - Investment Earnings 30,200 31,700 1,500 5.0%
Total Operating Revenues 17,903,100 15,717,700 (2,185,400) -12.2%
Operating Expenditures Landfill 4,180,655 3,895,825 (284,830) -6.8% Debt Service 2,949,300 1,921,000 (1,028,300) -34.9% Transfer Stations 2,657,465 2,726,475 69,010 2.6% Resource Recovery 2,546,240 2,613,950 67,710 2.7% Administration 2,182,750 2,412,100 229,350 10.5%
Postclosure/ECS 1,347,090 1,380,650 33,560 2.5%
Total Operating Expenditures 15,863,500 14,950,000 (913,500) -5.8%
Operating Budget Surplus 2,039,600 767,700
Total Capital Improvements 675,000
Balance Used to Fund Reserves 92,700
Page 2 of 110
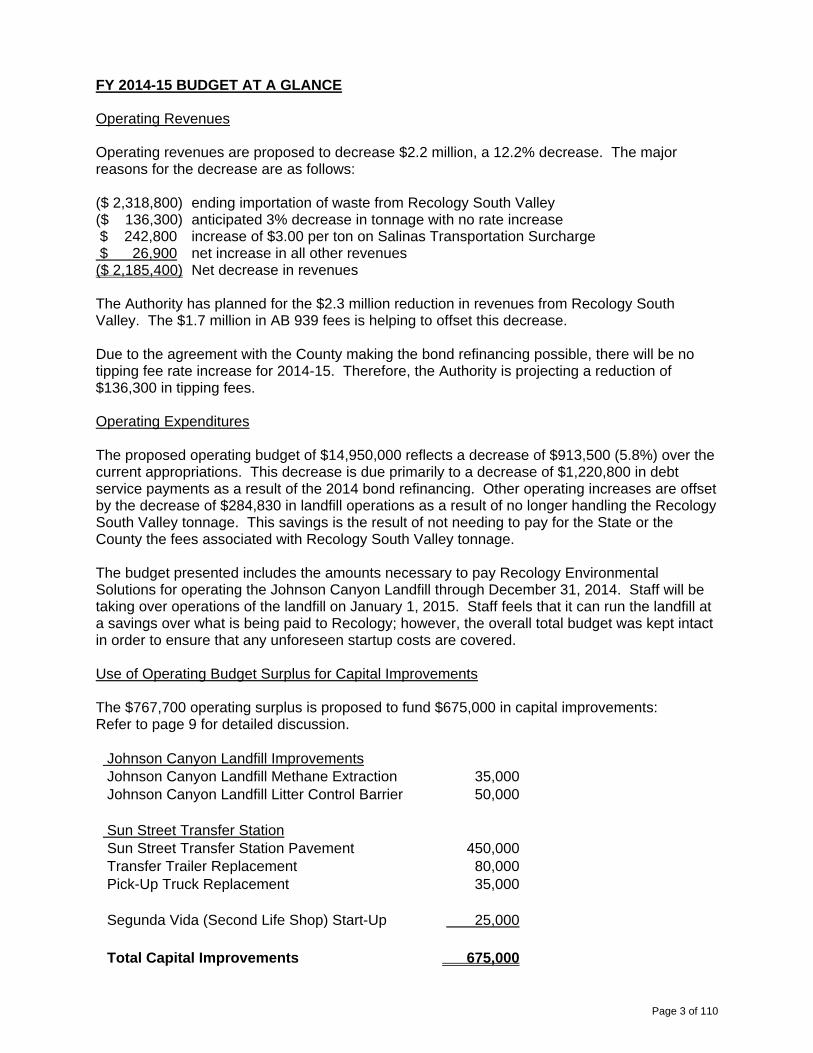
FY 2014-15 BUDGET AT A GLANCE Operating Revenues Operating revenues are proposed to decrease $2.2 million, a 12.2% decrease. The major reasons for the decrease are as follows: ($ 2,318,800) ending importation of waste from Recology South Valley ($ 136,300) anticipated 3% decrease in tonnage with no rate increase $ 242,800 increase of $3.00 per ton on Salinas Transportation Surcharge $ 26,900 net increase in all other revenues ($ 2,185,400) Net decrease in revenues The Authority has planned for the $2.3 million reduction in revenues from Recology South Valley. The $1.7 million in AB 939 fees is helping to offset this decrease. Due to the agreement with the County making the bond refinancing possible, there will be no tipping fee rate increase for 2014-15. Therefore, the Authority is projecting a reduction of $136,300 in tipping fees. Operating Expenditures The proposed operating budget of $14,950,000 reflects a decrease of $913,500 (5.8%) over the current appropriations. This decrease is due primarily to a decrease of $1,220,800 in debt service payments as a result of the 2014 bond refinancing. Other operating increases are offset by the decrease of $284,830 in landfill operations as a result of no longer handling the Recology South Valley tonnage. This savings is the result of not needing to pay for the State or the County the fees associated with Recology South Valley tonnage. The budget presented includes the amounts necessary to pay Recology Environmental Solutions for operating the Johnson Canyon Landfill through December 31, 2014. Staff will be taking over operations of the landfill on January 1, 2015. Staff feels that it can run the landfill at a savings over what is being paid to Recology; however, the overall total budget was kept intact in order to ensure that any unforeseen startup costs are covered. Use of Operating Budget Surplus for Capital Improvements The $767,700 operating surplus is proposed to fund $675,000 in capital improvements: Refer to page 9 for detailed discussion. Johnson Canyon Landfill Improvements Johnson Canyon Landfill Methane Extraction 35,000 Johnson Canyon Landfill Litter Control Barrier 50,000 Sun Street Transfer Station Sun Street Transfer Station Pavement 450,000 Transfer Trailer Replacement 80,000 Pick-Up Truck Replacement 35,000 Segunda Vida (Second Life Shop) Start-Up 25,000 Total Capital Improvements 675,000
Page 3 of 110
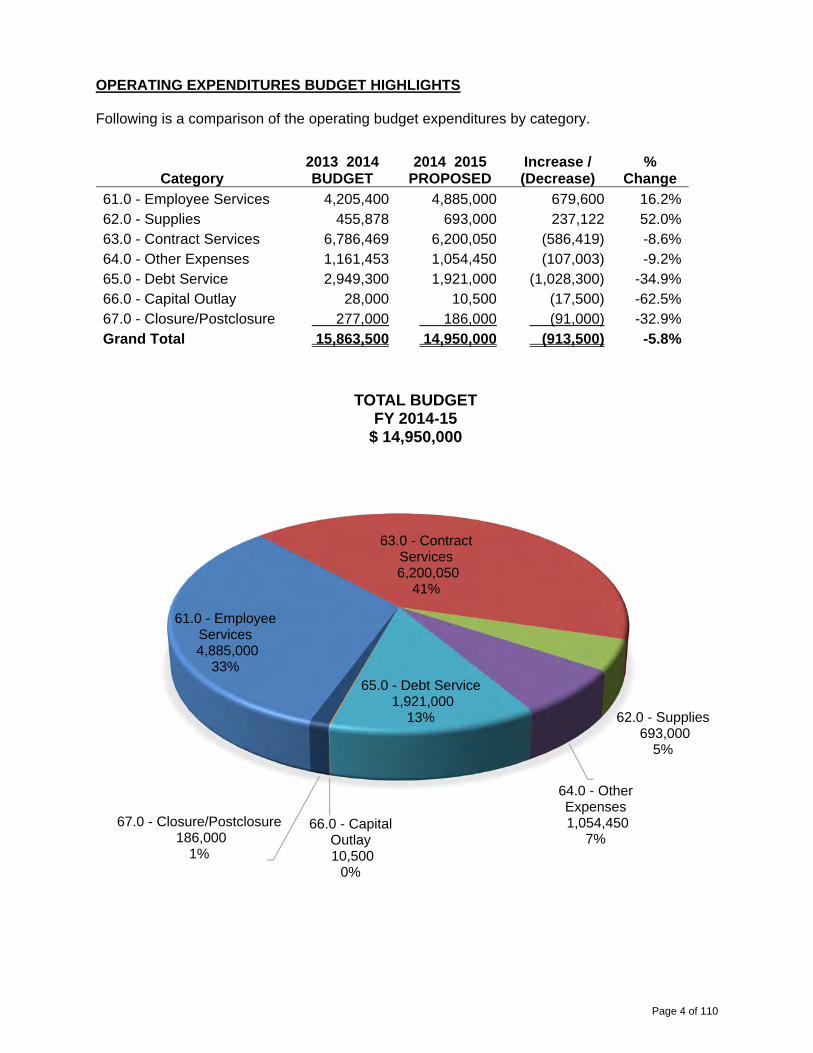
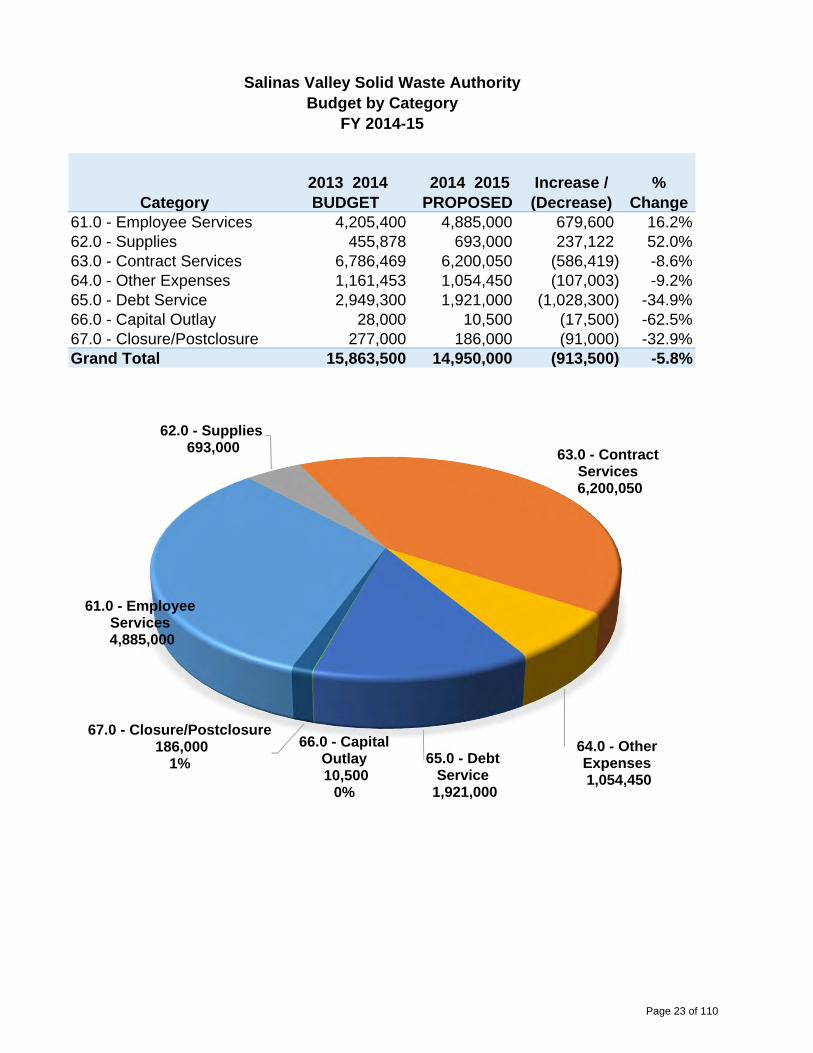
OPERATING EXPENDITURES BUDGET HIGHLIGHTS Following is a comparison of the operating budget expenditures by category.
Category 2013 2014 BUDGET
2014 2015 PROPOSED
Increase / (Decrease)
% Change
61.0 - Employee Services 4,205,400 4,885,000 679,600 16.2%62.0 - Supplies 455,878 693,000 237,122 52.0%63.0 - Contract Services 6,786,469 6,200,050 (586,419) -8.6%64.0 - Other Expenses 1,161,453 1,054,450 (107,003) -9.2%65.0 - Debt Service 2,949,300 1,921,000 (1,028,300) -34.9%66.0 - Capital Outlay 28,000 10,500 (17,500) -62.5%67.0 - Closure/Postclosure 277,000 186,000 (91,000) -32.9%Grand Total 15,863,500 14,950,000 (913,500) -5.8%
61.0 - Employee Services4,885,000
33%
63.0 - Contract Services6,200,050
41%
62.0 - Supplies693,000
5%
64.0 - Other Expenses1,054,450
7%
65.0 - Debt Service1,921,000
13%
66.0 - Capital Outlay10,500
0%
67.0 - Closure/Postclosure186,000
1%
TOTAL BUDGETFY 2014-15
$ 14,950,000
Page 4 of 110
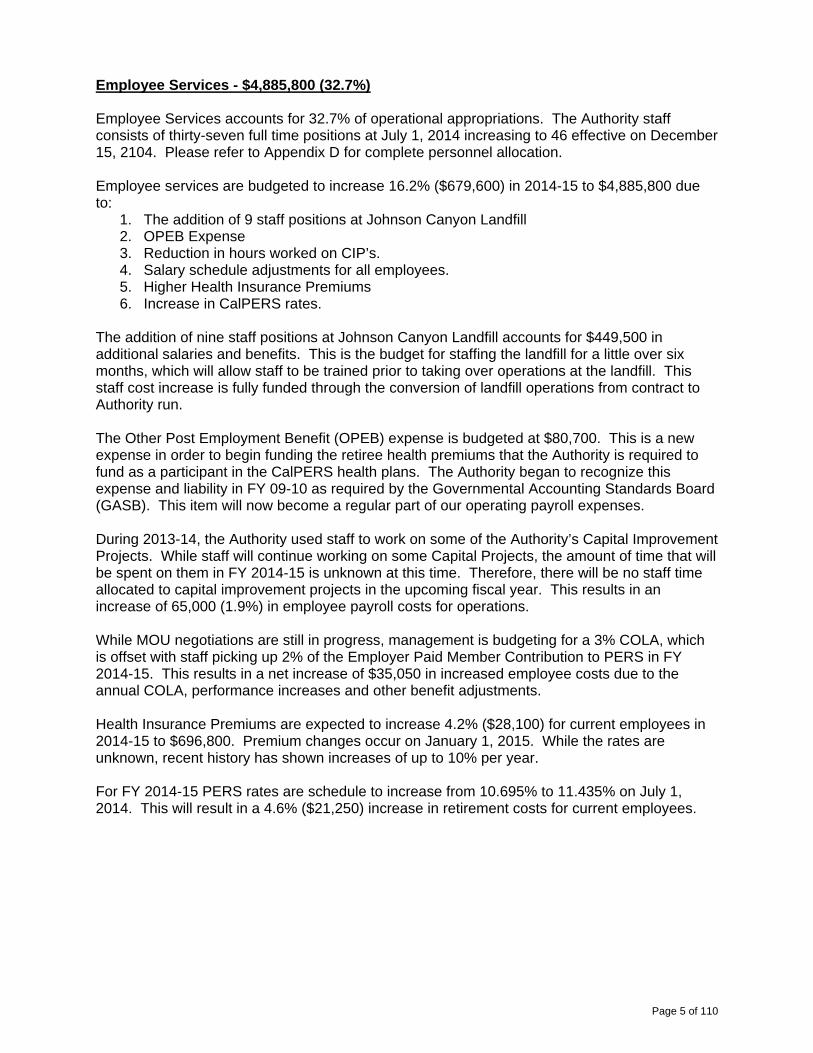
Employee Services - $4,885,800 (32.7%) Employee Services accounts for 32.7% of operational appropriations. The Authority staff consists of thirty-seven full time positions at July 1, 2014 increasing to 46 effective on December 15, 2104. Please refer to Appendix D for complete personnel allocation. Employee services are budgeted to increase 16.2% ($679,600) in 2014-15 to $4,885,800 due to:
1. The addition of 9 staff positions at Johnson Canyon Landfill 2. OPEB Expense 3. Reduction in hours worked on CIP’s. 4. Salary schedule adjustments for all employees. 5. Higher Health Insurance Premiums 6. Increase in CalPERS rates.
The addition of nine staff positions at Johnson Canyon Landfill accounts for $449,500 in additional salaries and benefits. This is the budget for staffing the landfill for a little over six months, which will allow staff to be trained prior to taking over operations at the landfill. This staff cost increase is fully funded through the conversion of landfill operations from contract to Authority run. The Other Post Employment Benefit (OPEB) expense is budgeted at $80,700. This is a new expense in order to begin funding the retiree health premiums that the Authority is required to fund as a participant in the CalPERS health plans. The Authority began to recognize this expense and liability in FY 09-10 as required by the Governmental Accounting Standards Board (GASB). This item will now become a regular part of our operating payroll expenses. During 2013-14, the Authority used staff to work on some of the Authority’s Capital Improvement Projects. While staff will continue working on some Capital Projects, the amount of time that will be spent on them in FY 2014-15 is unknown at this time. Therefore, there will be no staff time allocated to capital improvement projects in the upcoming fiscal year. This results in an increase of 65,000 (1.9%) in employee payroll costs for operations. While MOU negotiations are still in progress, management is budgeting for a 3% COLA, which is offset with staff picking up 2% of the Employer Paid Member Contribution to PERS in FY 2014-15. This results in a net increase of $35,050 in increased employee costs due to the annual COLA, performance increases and other benefit adjustments. Health Insurance Premiums are expected to increase 4.2% ($28,100) for current employees in 2014-15 to $696,800. Premium changes occur on January 1, 2015. While the rates are unknown, recent history has shown increases of up to 10% per year. For FY 2014-15 PERS rates are schedule to increase from 10.695% to 11.435% on July 1, 2014. This will result in a 4.6% ($21,250) increase in retirement costs for current employees.
Page 5 of 110
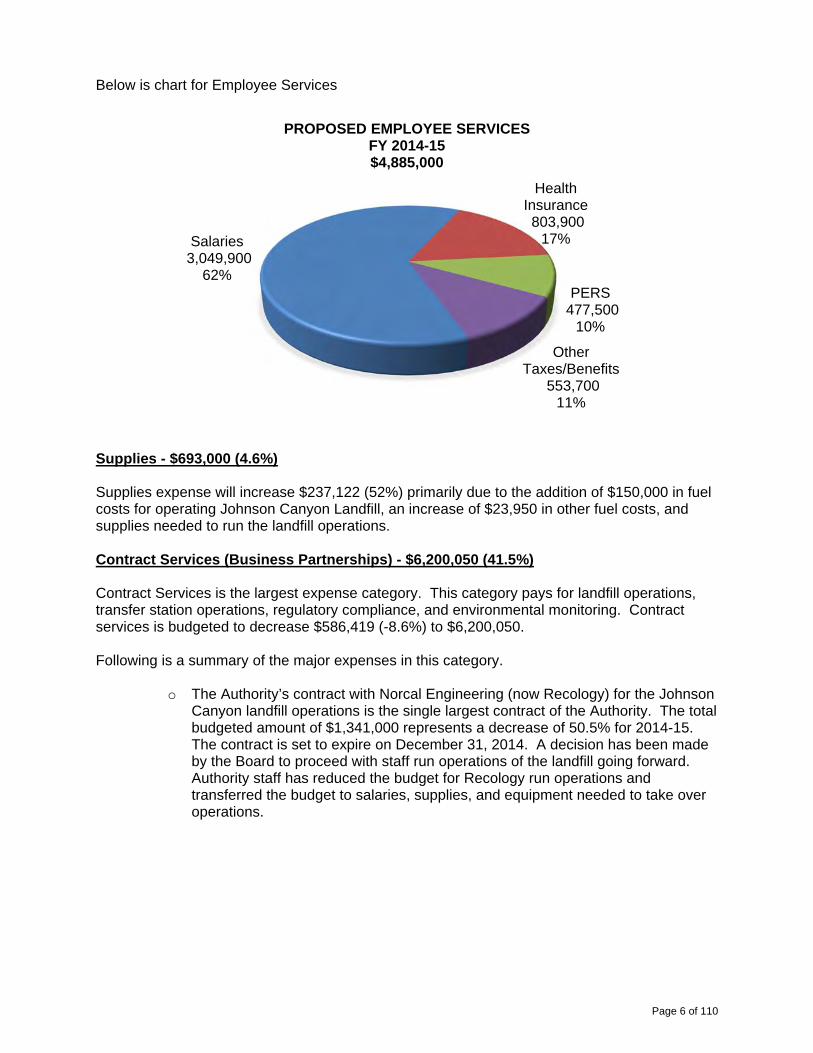
Below is chart for Employee Services
Supplies - $693,000 (4.6%) Supplies expense will increase $237,122 (52%) primarily due to the addition of $150,000 in fuel costs for operating Johnson Canyon Landfill, an increase of $23,950 in other fuel costs, and supplies needed to run the landfill operations. Contract Services (Business Partnerships) - $6,200,050 (41.5%) Contract Services is the largest expense category. This category pays for landfill operations, transfer station operations, regulatory compliance, and environmental monitoring. Contract services is budgeted to decrease $586,419 (-8.6%) to $6,200,050. Following is a summary of the major expenses in this category.
o The Authority’s contract with Norcal Engineering (now Recology) for the Johnson Canyon landfill operations is the single largest contract of the Authority. The total budgeted amount of $1,341,000 represents a decrease of 50.5% for 2014-15. The contract is set to expire on December 31, 2014. A decision has been made by the Board to proceed with staff run operations of the landfill going forward. Authority staff has reduced the budget for Recology run operations and transferred the budget to salaries, supplies, and equipment needed to take over operations.
Salaries3,049,900
62%
Health Insurance803,900
17%
PERS477,500
10%
Other Taxes/Benefits
553,700 11%
PROPOSED EMPLOYEE SERVICESFY 2014-15$4,885,000
Page 6 of 110
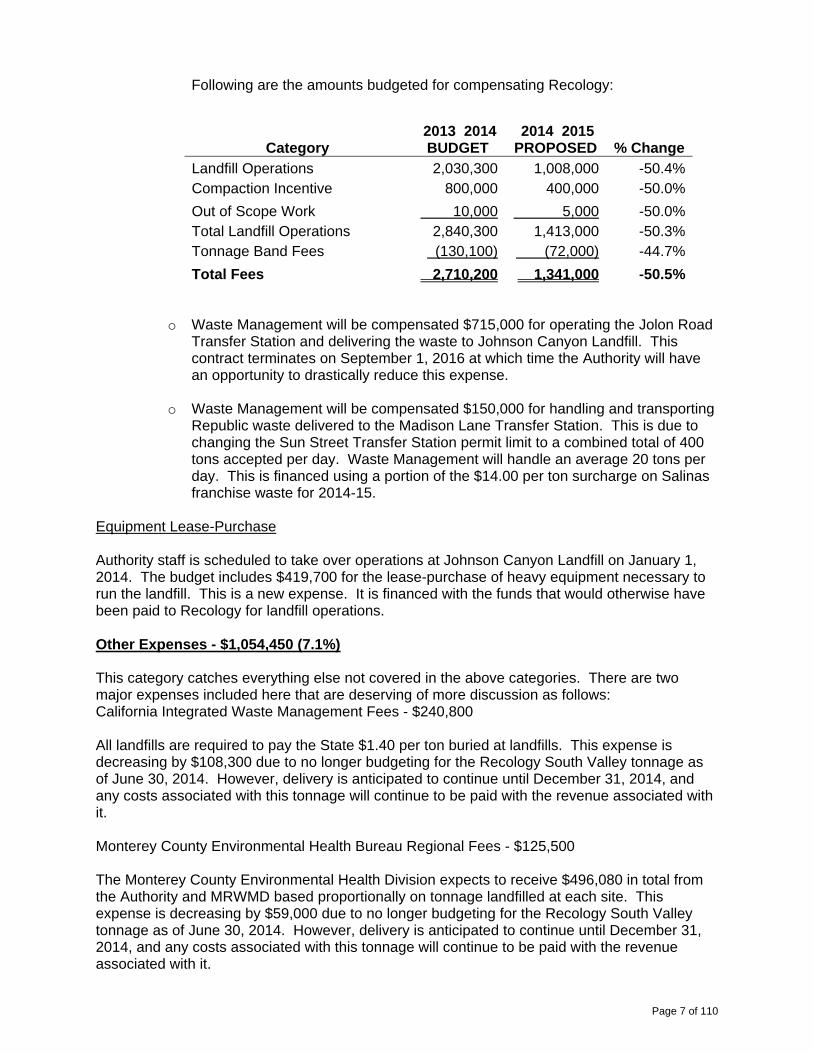
Following are the amounts budgeted for compensating Recology:
Category 2013 2014 BUDGET
2014 2015 PROPOSED % Change
Landfill Operations 2,030,300 1,008,000 -50.4%Compaction Incentive 800,000 400,000 -50.0%
Out of Scope Work 10,000 5,000 -50.0%Total Landfill Operations 2,840,300 1,413,000 -50.3%Tonnage Band Fees (130,100) (72,000) -44.7%
Total Fees 2,710,200 1,341,000 -50.5%
o Waste Management will be compensated $715,000 for operating the Jolon Road Transfer Station and delivering the waste to Johnson Canyon Landfill. This contract terminates on September 1, 2016 at which time the Authority will have an opportunity to drastically reduce this expense.
o Waste Management will be compensated $150,000 for handling and transporting Republic waste delivered to the Madison Lane Transfer Station. This is due to changing the Sun Street Transfer Station permit limit to a combined total of 400 tons accepted per day. Waste Management will handle an average 20 tons per day. This is financed using a portion of the $14.00 per ton surcharge on Salinas franchise waste for 2014-15.
Equipment Lease-Purchase Authority staff is scheduled to take over operations at Johnson Canyon Landfill on January 1, 2014. The budget includes $419,700 for the lease-purchase of heavy equipment necessary to run the landfill. This is a new expense. It is financed with the funds that would otherwise have been paid to Recology for landfill operations.
Other Expenses - $1,054,450 (7.1%) This category catches everything else not covered in the above categories. There are two major expenses included here that are deserving of more discussion as follows: California Integrated Waste Management Fees - $240,800 All landfills are required to pay the State $1.40 per ton buried at landfills. This expense is decreasing by $108,300 due to no longer budgeting for the Recology South Valley tonnage as of June 30, 2014. However, delivery is anticipated to continue until December 31, 2014, and any costs associated with this tonnage will continue to be paid with the revenue associated with it. Monterey County Environmental Health Bureau Regional Fees - $125,500 The Monterey County Environmental Health Division expects to receive $496,080 in total from the Authority and MRWMD based proportionally on tonnage landfilled at each site. This expense is decreasing by $59,000 due to no longer budgeting for the Recology South Valley tonnage as of June 30, 2014. However, delivery is anticipated to continue until December 31, 2014, and any costs associated with this tonnage will continue to be paid with the revenue associated with it.
Page 7 of 110
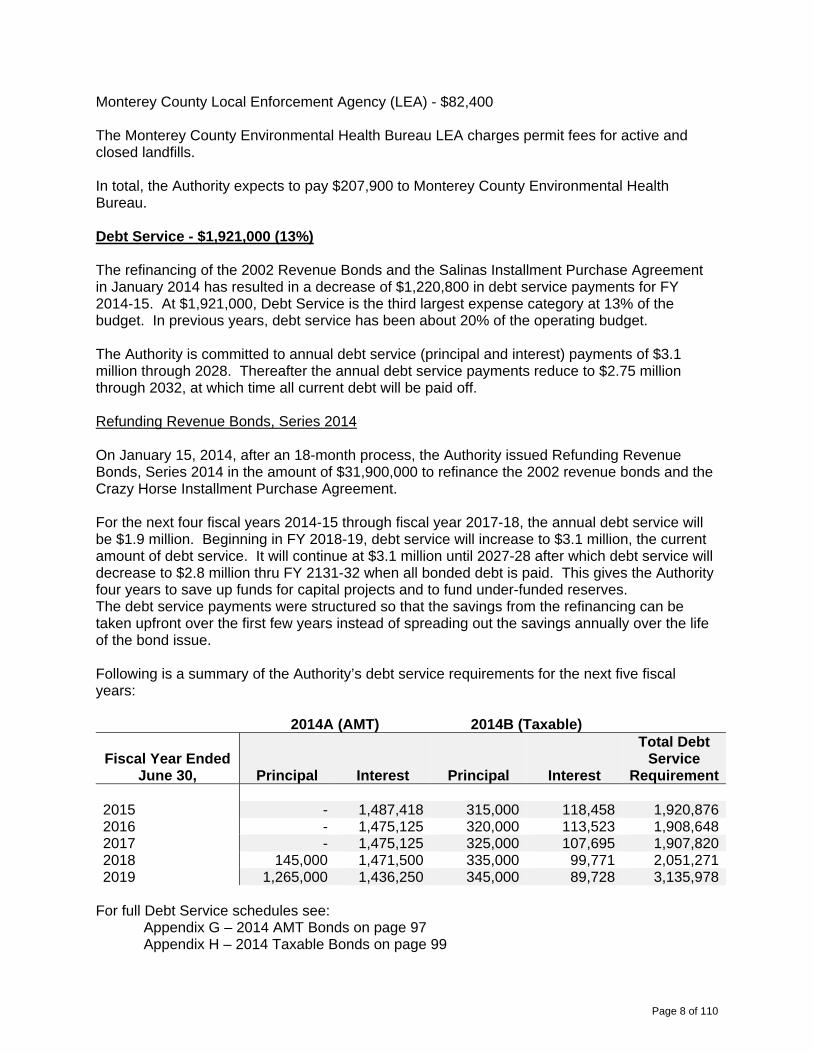
Monterey County Local Enforcement Agency (LEA) - $82,400 The Monterey County Environmental Health Bureau LEA charges permit fees for active and closed landfills. In total, the Authority expects to pay $207,900 to Monterey County Environmental Health Bureau. Debt Service - $1,921,000 (13%) The refinancing of the 2002 Revenue Bonds and the Salinas Installment Purchase Agreement in January 2014 has resulted in a decrease of $1,220,800 in debt service payments for FY 2014-15. At $1,921,000, Debt Service is the third largest expense category at 13% of the budget. In previous years, debt service has been about 20% of the operating budget. The Authority is committed to annual debt service (principal and interest) payments of $3.1 million through 2028. Thereafter the annual debt service payments reduce to $2.75 million through 2032, at which time all current debt will be paid off. Refunding Revenue Bonds, Series 2014 On January 15, 2014, after an 18-month process, the Authority issued Refunding Revenue Bonds, Series 2014 in the amount of $31,900,000 to refinance the 2002 revenue bonds and the Crazy Horse Installment Purchase Agreement. For the next four fiscal years 2014-15 through fiscal year 2017-18, the annual debt service will be $1.9 million. Beginning in FY 2018-19, debt service will increase to $3.1 million, the current amount of debt service. It will continue at $3.1 million until 2027-28 after which debt service will decrease to $2.8 million thru FY 2131-32 when all bonded debt is paid. This gives the Authority four years to save up funds for capital projects and to fund under-funded reserves. The debt service payments were structured so that the savings from the refinancing can be taken upfront over the first few years instead of spreading out the savings annually over the life of the bond issue. Following is a summary of the Authority’s debt service requirements for the next five fiscal years:
2014A (AMT) 2014B (Taxable)
Fiscal Year Ended June 30, Principal Interest Principal Interest
Total Debt Service
Requirement
2015 - 1,487,418 315,000 118,458 1,920,876 2016 - 1,475,125 320,000 113,523 1,908,648 2017 - 1,475,125 325,000 107,695 1,907,820 2018 145,000 1,471,500 335,000 99,771 2,051,271 2019 1,265,000 1,436,250 345,000 89,728 3,135,978
For full Debt Service schedules see:
Appendix G – 2014 AMT Bonds on page 97 Appendix H – 2014 Taxable Bonds on page 99
Page 8 of 110
Capital Outlay - $10,500 Capital Outlay includes a budget for minor equipment purchases in the HHW and the office. Closure Set Aside - $186,000 (1%) Due to the ending of the importation of waste, closure funding will be reduced to $186,000. Closure funding is on a per ton basis of $1.15 per ton. The calculation of closure and postclosure amounts is based on Governmental Accounting Standards Board Statement No. 18 (GASB 18). GASB 18 states very clearly how the costs of closure and postclosure maintenance are calculated and allocated to accounting periods. The Authority uses GASB 18 methodology to determine the budget amount for closure costs. The funding of liabilities for closure and postclosure are governed by the California Department of Resources Recycling and Recovery (CalRecycle). Closure Funding Requirement By the time a landfill stops accepting waste it is required to have set-aside sufficient funds to pay for the closure of the landfill. Closure costs are determined and funded annually based on landfill capacity used. Even though the funds will not be spent until the landfill is closed, the annual required funding amount is considered an expense for the period when the landfill capacity was used. The Authority therefore budgets to set-aside sufficient funds to cover the expense of closure for the fiscal year. Closure Funding Calculations The calculation of closure funding is based on a per ton basis. The Johnson Canyon Landfill (JCL) Closure amount is calculated at $1.15 per ton based on the unfunded liability as of June 30, 2013. Capital Improvements The following Projects need to be budgeted in FY 2014-15 $450,000 Sun Street Transfer Station Pavement Replacement $ 80,000 Sun Street Transfer Station Equipment Replacement (Transfer Trailer) $ 50,000 Johnson Canyon Landfill Litter Control Barrier $ 35,000 Johnson Canyon Landfill Methane Extraction Wells $ 35,000 Pick-up Truck Replacement $650,000 Total Sun Street Transfer Station Pavement Replacement For FY 2014-15 the tipping pad and a large pavement area at Sun Street Transfer Station will have to be replaced at an estimated cost of $450,000. Sun Street started operation in January 2005 to operate at 100 tons per day while a larger facility was developed. The transfer station currently handles close to 400 tons per day. Initially, the facility was designed for a lot fewer trucks. After 10 years, the pavement and concrete pad are showing significant distress and need to be replaced.
Page 9 of 110
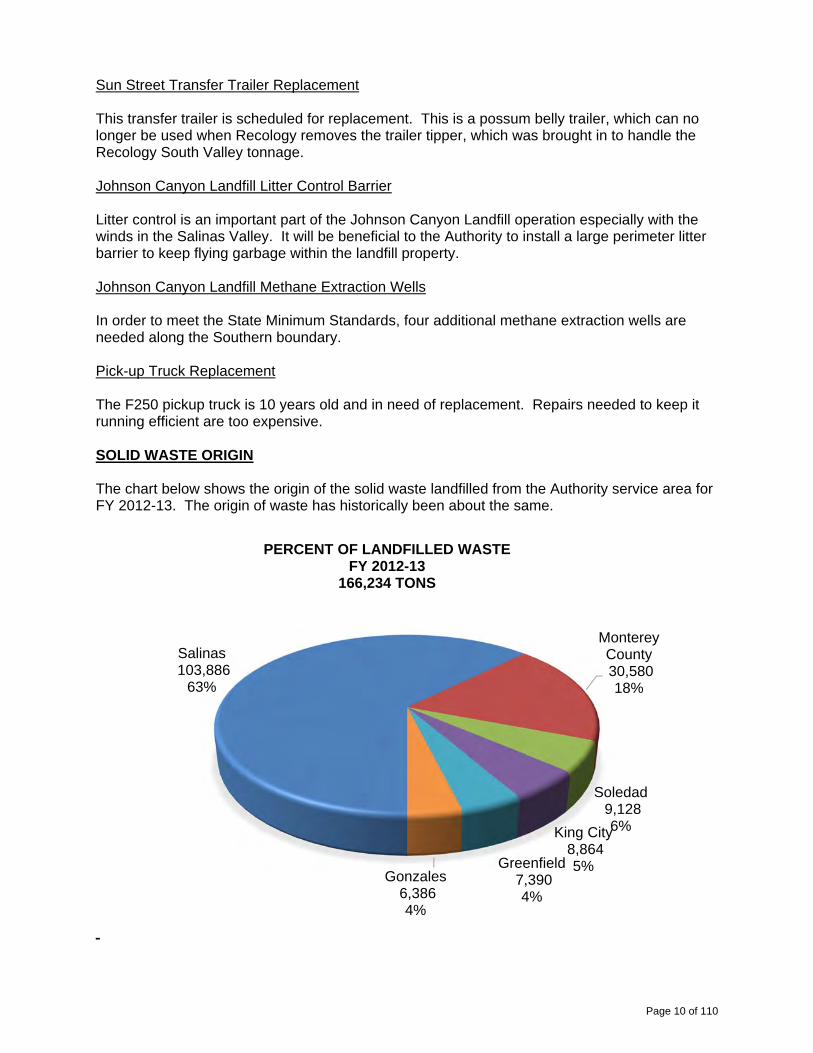
Sun Street Transfer Trailer Replacement This transfer trailer is scheduled for replacement. This is a possum belly trailer, which can no longer be used when Recology removes the trailer tipper, which was brought in to handle the Recology South Valley tonnage. Johnson Canyon Landfill Litter Control Barrier Litter control is an important part of the Johnson Canyon Landfill operation especially with the winds in the Salinas Valley. It will be beneficial to the Authority to install a large perimeter litter barrier to keep flying garbage within the landfill property. Johnson Canyon Landfill Methane Extraction Wells In order to meet the State Minimum Standards, four additional methane extraction wells are needed along the Southern boundary. Pick-up Truck Replacement The F250 pickup truck is 10 years old and in need of replacement. Repairs needed to keep it running efficient are too expensive. SOLID WASTE ORIGIN The chart below shows the origin of the solid waste landfilled from the Authority service area for FY 2012-13. The origin of waste has historically been about the same.
Salinas103,886
63%
Monterey County30,580 18%
Soledad9,128 6%King City
8,864 5%Greenfield
7,390 4%
Gonzales6,386 4%
PERCENT OF LANDFILLED WASTEFY 2012-13
166,234 TONS
Page 10 of 110
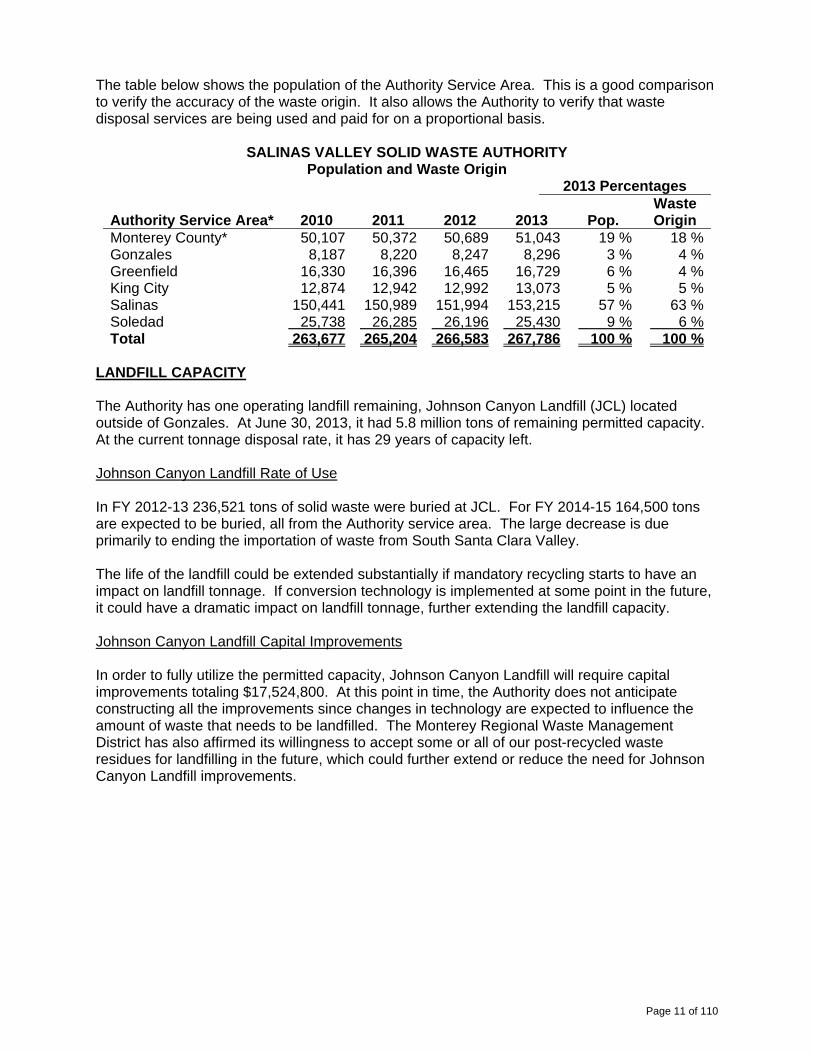
The table below shows the population of the Authority Service Area. This is a good comparison to verify the accuracy of the waste origin. It also allows the Authority to verify that waste disposal services are being used and paid for on a proportional basis.
SALINAS VALLEY SOLID WASTE AUTHORITY Population and Waste Origin
2013 Percentages Waste
Authority Service Area* 2010 2011 2012 2013 Pop. Origin Monterey County* 50,107 50,372 50,689 51,043 19 % 18 %Gonzales 8,187 8,220 8,247 8,296 3 % 4 %Greenfield 16,330 16,396 16,465 16,729 6 % 4 %King City 12,874 12,942 12,992 13,073 5 % 5 %Salinas 150,441 150,989 151,994 153,215 57 % 63 %Soledad 25,738 26,285 26,196 25,430 9 % 6 %Total 263,677 265,204 266,583 267,786 100 % 100 %
LANDFILL CAPACITY The Authority has one operating landfill remaining, Johnson Canyon Landfill (JCL) located outside of Gonzales. At June 30, 2013, it had 5.8 million tons of remaining permitted capacity. At the current tonnage disposal rate, it has 29 years of capacity left. Johnson Canyon Landfill Rate of Use In FY 2012-13 236,521 tons of solid waste were buried at JCL. For FY 2014-15 164,500 tons are expected to be buried, all from the Authority service area. The large decrease is due primarily to ending the importation of waste from South Santa Clara Valley. The life of the landfill could be extended substantially if mandatory recycling starts to have an impact on landfill tonnage. If conversion technology is implemented at some point in the future, it could have a dramatic impact on landfill tonnage, further extending the landfill capacity. Johnson Canyon Landfill Capital Improvements In order to fully utilize the permitted capacity, Johnson Canyon Landfill will require capital improvements totaling $17,524,800. At this point in time, the Authority does not anticipate constructing all the improvements since changes in technology are expected to influence the amount of waste that needs to be landfilled. The Monterey Regional Waste Management District has also affirmed its willingness to accept some or all of our post-recycled waste residues for landfilling in the future, which could further extend or reduce the need for Johnson Canyon Landfill improvements.
Page 11 of 110
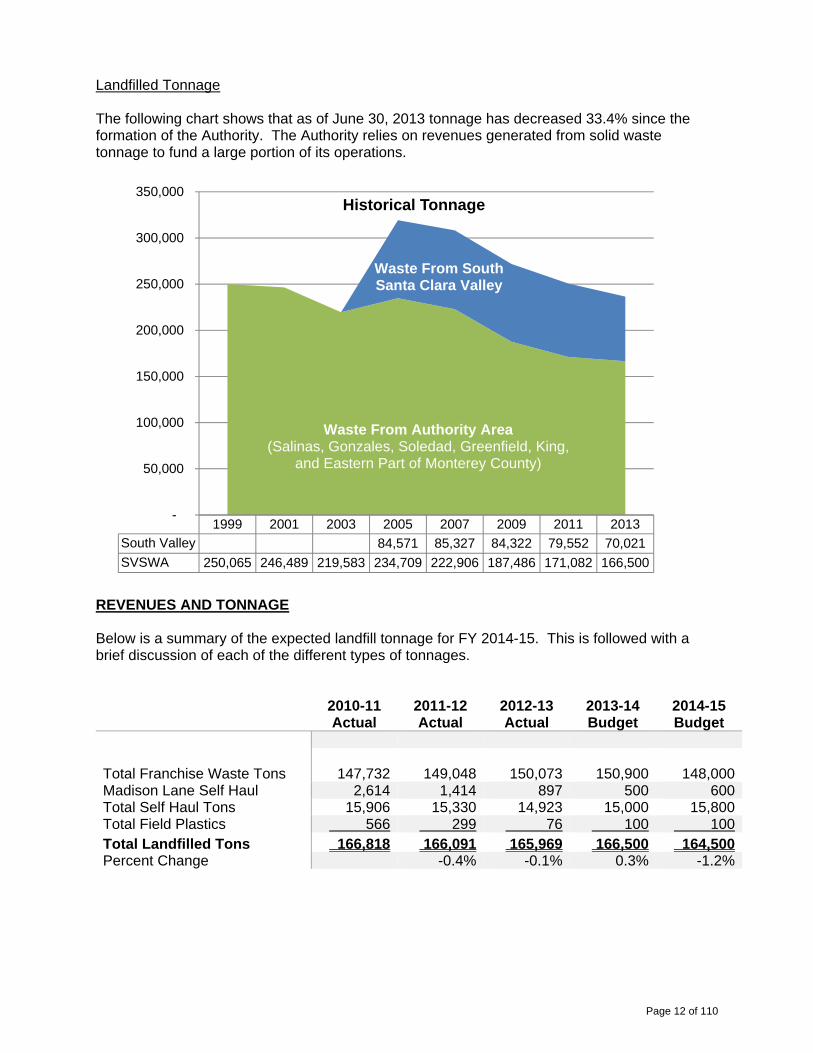
Landfilled Tonnage The following chart shows that as of June 30, 2013 tonnage has decreased 33.4% since the formation of the Authority. The Authority relies on revenues generated from solid waste tonnage to fund a large portion of its operations.
REVENUES AND TONNAGE Below is a summary of the expected landfill tonnage for FY 2014-15. This is followed with a brief discussion of each of the different types of tonnages.
2010-11 Actual
2011-12 Actual
2012-13 Actual
2013-14 Budget
2014-15 Budget
Total Franchise Waste Tons
147,732
149,048
150,073
150,900 148,000 Madison Lane Self Haul 2,614 1,414 897 500 600 Total Self Haul Tons 15,906 15,330 14,923 15,000 15,800 Total Field Plastics 566 299 76 100 100 Total Landfilled Tons 166,818 166,091 165,969 166,500 164,500 Percent Change -0.4% -0.1% 0.3% -1.2%
1999 2001 2003 2005 2007 2009 2011 2013
South Valley 84,571 85,327 84,322 79,552 70,021
SVSWA 250,065 246,489 219,583 234,709 222,906 187,486 171,082 166,500
-
50,000
100,000
150,000
200,000
250,000
300,000
350,000Historical Tonnage
Waste From Authority Area(Salinas, Gonzales, Soledad, Greenfield, King,
and Eastern Part of Monterey County)
Waste From SouthSanta Clara Valley
Page 12 of 110
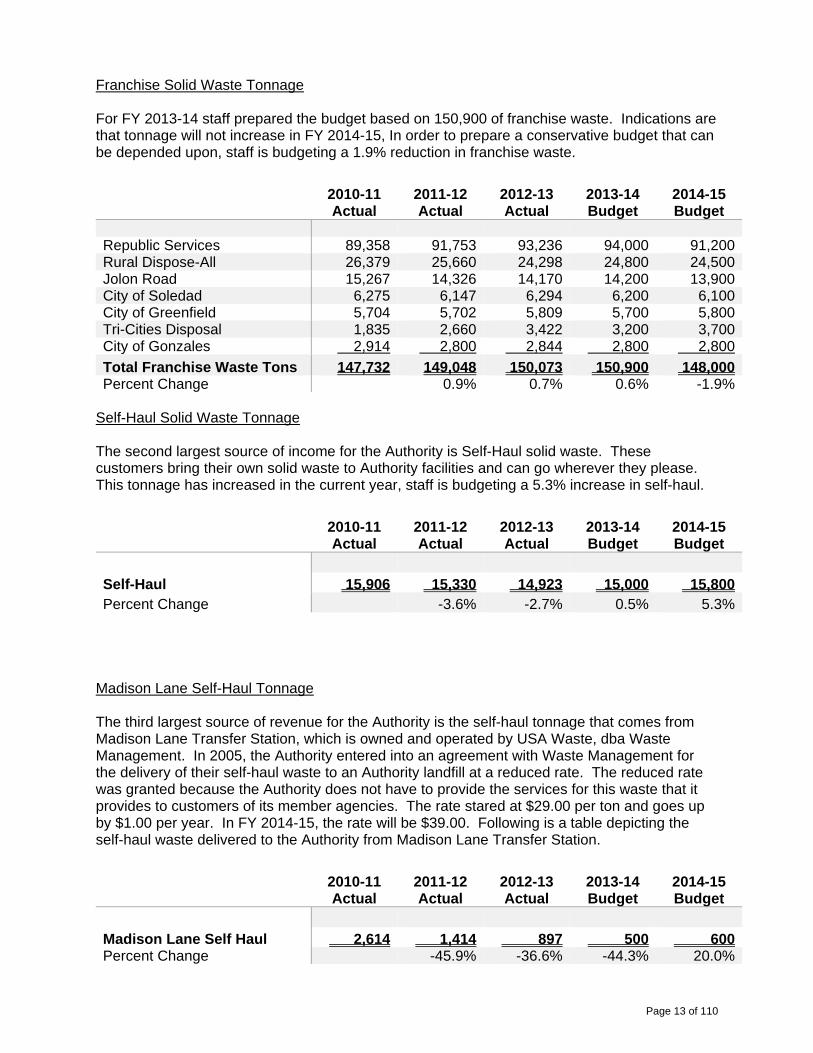
Franchise Solid Waste Tonnage For FY 2013-14 staff prepared the budget based on 150,900 of franchise waste. Indications are that tonnage will not increase in FY 2014-15, In order to prepare a conservative budget that can be depended upon, staff is budgeting a 1.9% reduction in franchise waste.
2010-11 Actual
2011-12 Actual
2012-13 Actual
2013-14 Budget
2014-15 Budget
Republic Services 89,358 91,753 93,236 94,000 91,200 Rural Dispose-All 26,379 25,660 24,298 24,800 24,500 Jolon Road 15,267 14,326 14,170 14,200 13,900 City of Soledad 6,275 6,147 6,294 6,200 6,100 City of Greenfield 5,704 5,702 5,809 5,700 5,800 Tri-Cities Disposal 1,835 2,660 3,422 3,200 3,700 City of Gonzales 2,914 2,800 2,844 2,800 2,800
Total Franchise Waste Tons 147,732 149,048 150,073 150,900 148,000 Percent Change 0.9% 0.7% 0.6% -1.9%
Self-Haul Solid Waste Tonnage The second largest source of income for the Authority is Self-Haul solid waste. These customers bring their own solid waste to Authority facilities and can go wherever they please. This tonnage has increased in the current year, staff is budgeting a 5.3% increase in self-haul.
2010-11 Actual
2011-12 Actual
2012-13 Actual
2013-14 Budget
2014-15 Budget
Self-Haul 15,906 15,330 14,923 15,000 15,800 Percent Change -3.6% -2.7% 0.5% 5.3%
Madison Lane Self-Haul Tonnage The third largest source of revenue for the Authority is the self-haul tonnage that comes from Madison Lane Transfer Station, which is owned and operated by USA Waste, dba Waste Management. In 2005, the Authority entered into an agreement with Waste Management for the delivery of their self-haul waste to an Authority landfill at a reduced rate. The reduced rate was granted because the Authority does not have to provide the services for this waste that it provides to customers of its member agencies. The rate stared at $29.00 per ton and goes up by $1.00 per year. In FY 2014-15, the rate will be $39.00. Following is a table depicting the self-haul waste delivered to the Authority from Madison Lane Transfer Station.
2010-11 Actual
2011-12 Actual
2012-13 Actual
2013-14 Budget
2014-15 Budget
Madison Lane Self Haul 2,614 1,414 897 500 600 Percent Change -45.9% -36.6% -44.3% 20.0%
Page 13 of 110
Field Plastic Tonnage After the closure of Crazy Horse, the Authority lost all field plastic that was being delivered to Crazy Horse. The vast majority of it is now recycled directly in the field by outside recyclers. Salinas Transportation Surcharge The Salinas Transportation Surcharge is used to pay for the handling and transporting of Republic waste to Johnson Canyon Landfill from Madison Lane and Sun Street Transfer Stations. The surcharge was originally $6.00 per ton in FY 2009-10. It decreased to $5.00 per ton in FY 2010-11 to offset a $1.00 per ton tipping fee increase. In FY 2012-13, the surcharge was increased by $3.00 to $8.00 per ton. In FY 2013-14 it increased another $3.00 to $11.00 per ton. In order to eventually pay for the entire cost of transferring Salinas waste through the Republic surcharge, the surcharge is being increased in FY 2014-15 by $3.00 per ton. The $14.00 per ton surcharge will result in $1,276,800 in tipping fees that will be used to cover the cost of using Madison Lane Transfer Station and a portion of Sun Street Transfer Station for the transporting of Republic Services waste from Salinas to Johnson Canyon Landfill in Gonzales. EXPANSION FUND – (RECOLOGY SOUTH VALLEY TONNAGE) The Expansion Fund is used to account for revenue from the sale of landfill capacity to Recology South Santa Clara Valley Disposal (Recology South Valley). Revenue from this contract is not being budgeted past June 30, 2014; however, the contract remains in place through December 31, 2014, and any costs associated with this tonnage will continue to be paid with the revenue associated with it. The Authority has chosen to end the importation of solid waste as a means to finance operation. At June 30, 2014, the Expansion Fund is projected to have an available fund balance of $7,519,332 if all appropriations are spent as budgeted. The Authority still needs to repay $376,000 to this fund, which were used for the Johnson Canyon Landfill Ameresco Energy Plant. When these funds were used for that purpose, it was planned that the funds would be repaid from the gas royalties. The Expansion Fund, per Board policy, is to be used for developing 50 years of sustainable landfill capacity. During FY 2014-15 the Board will be asked to decide how these funds will be used in the future to support advanced waste recovery technologies.
Page 14 of 110
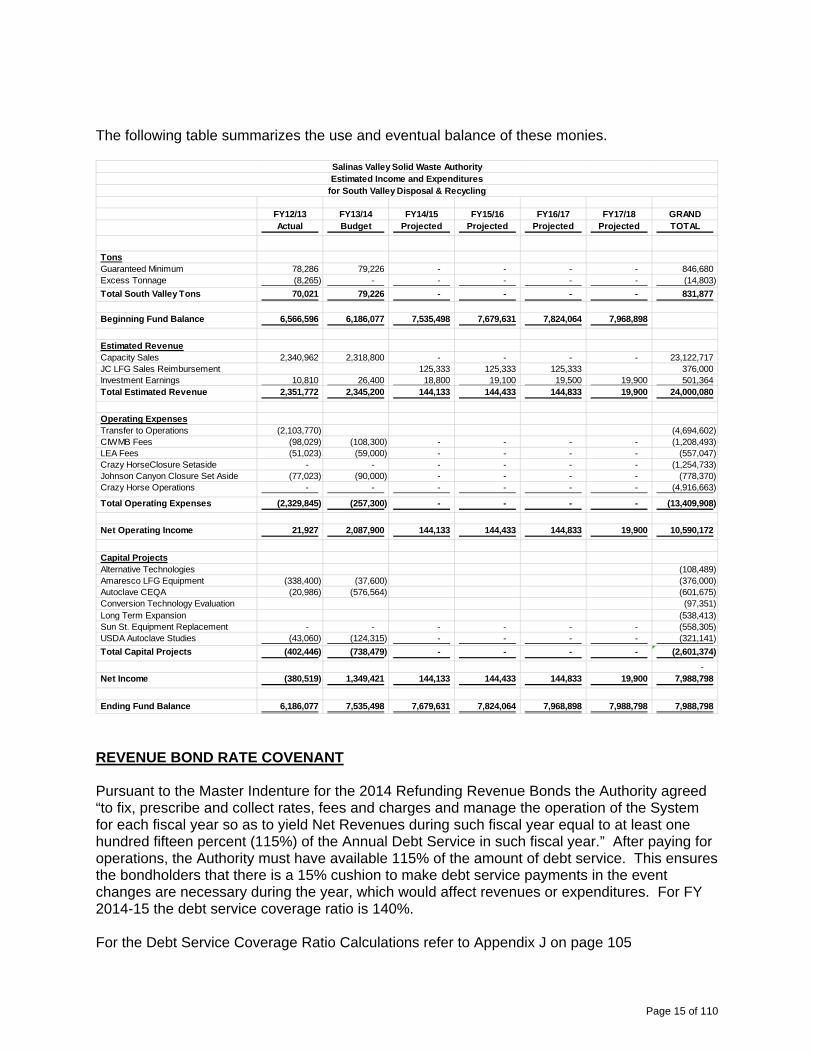
The following table summarizes the use and eventual balance of these monies.
REVENUE BOND RATE COVENANT Pursuant to the Master Indenture for the 2014 Refunding Revenue Bonds the Authority agreed “to fix, prescribe and collect rates, fees and charges and manage the operation of the System for each fiscal year so as to yield Net Revenues during such fiscal year equal to at least one hundred fifteen percent (115%) of the Annual Debt Service in such fiscal year.” After paying for operations, the Authority must have available 115% of the amount of debt service. This ensures the bondholders that there is a 15% cushion to make debt service payments in the event changes are necessary during the year, which would affect revenues or expenditures. For FY 2014-15 the debt service coverage ratio is 140%. For the Debt Service Coverage Ratio Calculations refer to Appendix J on page 105
FY12/13 FY13/14 FY14/15 FY15/16 FY16/17 FY17/18 GRANDActual Budget Projected Projected Projected Projected TOTAL
TonsGuaranteed Minimum 78,286 79,226 - - - - 846,680 Excess Tonnage (8,265) - - - - - (14,803)
Total South Valley Tons 70,021 79,226 - - - - 831,877
Beginning Fund Balance 6,566,596 6,186,077 7,535,498 7,679,631 7,824,064 7,968,898
Estimated RevenueCapacity Sales 2,340,962 2,318,800 - - - - 23,122,717 JC LFG Sales Reimbursement 125,333 125,333 125,333 376,000 Investment Earnings 10,810 26,400 18,800 19,100 19,500 19,900 501,364 Total Estimated Revenue 2,351,772 2,345,200 144,133 144,433 144,833 19,900 24,000,080
Operating ExpensesTransfer to Operations (2,103,770) (4,694,602) CIWMB Fees (98,029) (108,300) - - - - (1,208,493) LEA Fees (51,023) (59,000) - - - - (557,047) Crazy HorseClosure Setaside - - - - - - (1,254,733) Johnson Canyon Closure Set Aside (77,023) (90,000) - - - - (778,370) Crazy Horse Operations - - - - - - (4,916,663)
Total Operating Expenses (2,329,845) (257,300) - - - - (13,409,908)
Net Operating Income 21,927 2,087,900 144,133 144,433 144,833 19,900 10,590,172
Capital ProjectsAlternative Technologies (108,489) Amaresco LFG Equipment (338,400) (37,600) (376,000) Autoclave CEQA (20,986) (576,564) (601,675) Conversion Technology Evaluation (97,351) Long Term Expansion (538,413) Sun St. Equipment Replacement - - - - - - (558,305) USDA Autoclave Studies (43,060) (124,315) - - - - (321,141)
Total Capital Projects (402,446) (738,479) - - - - (2,601,374)
- Net Income (380,519) 1,349,421 144,133 144,433 144,833 19,900 7,988,798
Ending Fund Balance 6,186,077 7,535,498 7,679,631 7,824,064 7,968,898 7,988,798 7,988,798
Salinas Valley Solid Waste AuthorityEstimated Income and Expenditures
for South Valley Disposal & Recycling
Page 15 of 110
CONCLUSION The budget as presented covers all required operating expenditures, debt service payments, and transfers leaving an operating net income of $767,700, which will be used to fund necessary capital improvements. The budget is a never-ending cycle. During FY 2014-15 staff will be working on planning how best to use the savings that will be achieved through June 30, 2018, after which, debt service will return to $3.1 million. The Board’s approval of refinancing the 2002 Revenue Bonds and the Crazy Horse Installment Purchase Agreement are allowing the Authority to generate an operating surplus of $767,700 in spite of giving up $2.3 million in revenue from ending the importation of waste from South Santa Clara Valley. This will allow the Authority to use FY 2014-15 to develop more efficient operations as we continue to work on ways to handle the solid waste disposal needs of the Salinas Valley in a “Future Without Landfills.” Respectfully submitted, Patrick Mathews Roberto Moreno General Manager/CAO Finance Manager/Treasurer
Page 16 of 110
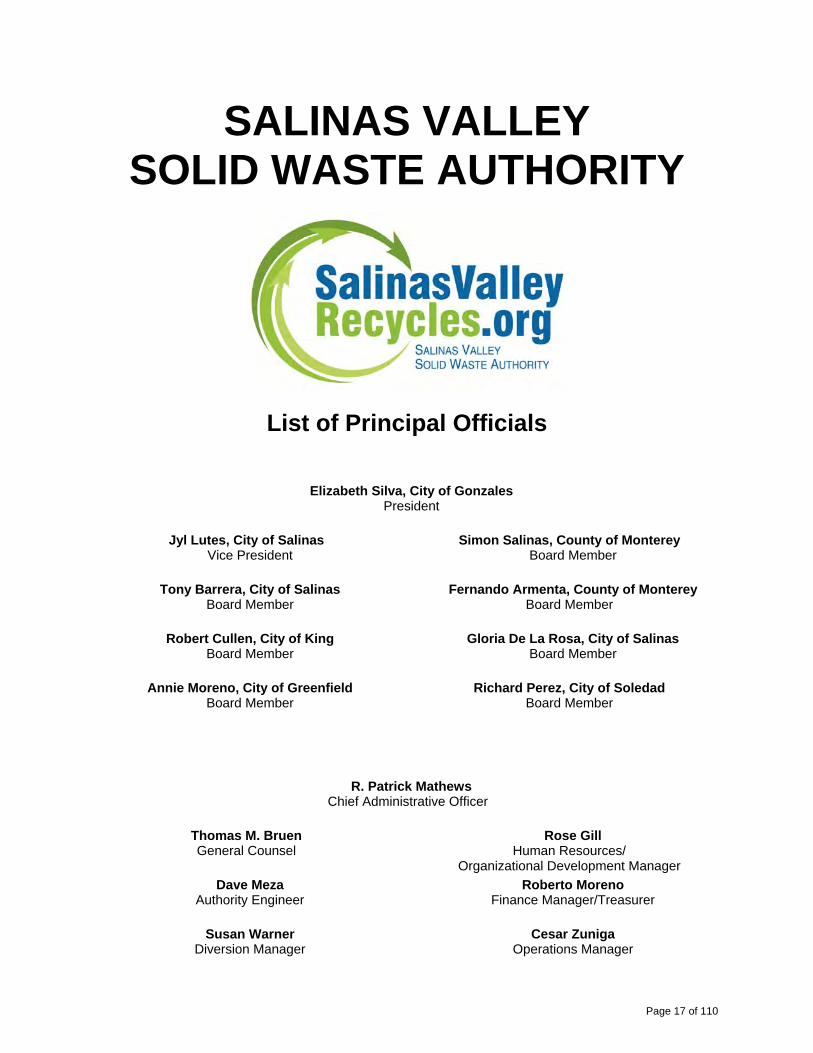
SALINAS VALLEY SOLID WASTE AUTHORITY
List of Principal Officials
Elizabeth Silva, City of Gonzales President
Jyl Lutes, City of Salinas Vice President
Simon Salinas, County of Monterey Board Member
Tony Barrera, City of Salinas Board Member
Fernando Armenta, County of Monterey Board Member
Robert Cullen, City of King Board Member
Gloria De La Rosa, City of Salinas Board Member
Annie Moreno, City of Greenfield Board Member
Richard Perez, City of Soledad Board Member
R. Patrick Mathews Chief Administrative Officer
Thomas M. Bruen General Counsel
Rose Gill Human Resources/
Organizational Development Manager
Dave Meza Authority Engineer
Roberto Moreno Finance Manager/Treasurer
Susan Warner Diversion Manager
Cesar Zuniga Operations Manager
Page 17 of 110
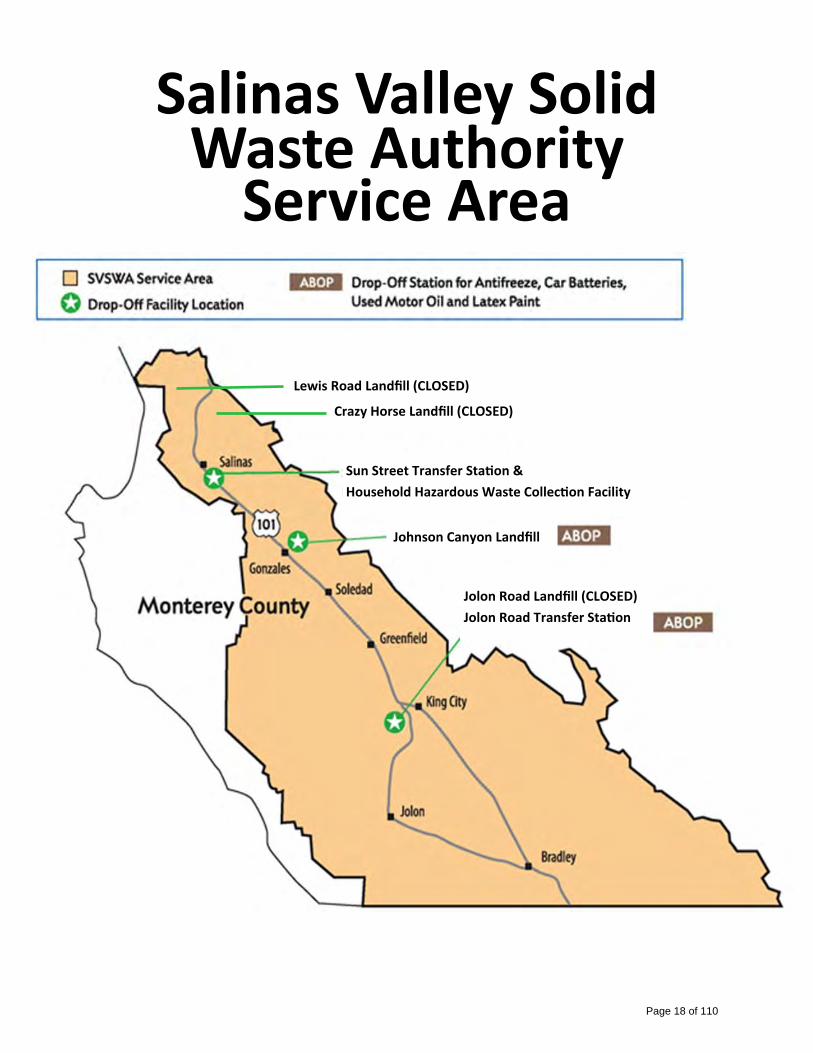
Crazy Horse Landfill (CLOSED)
Lewis Road Landfill (CLOSED)
Jolon Road Landfill (CLOSED)
Jolon Road Transfer Sta on
Sun Street Transfer Sta on &
Household Hazardous Waste Collec on Facility
Johnson Canyon Landfill
Salinas Valley Solid
Waste Authority
Service Area
Page 18 of 110
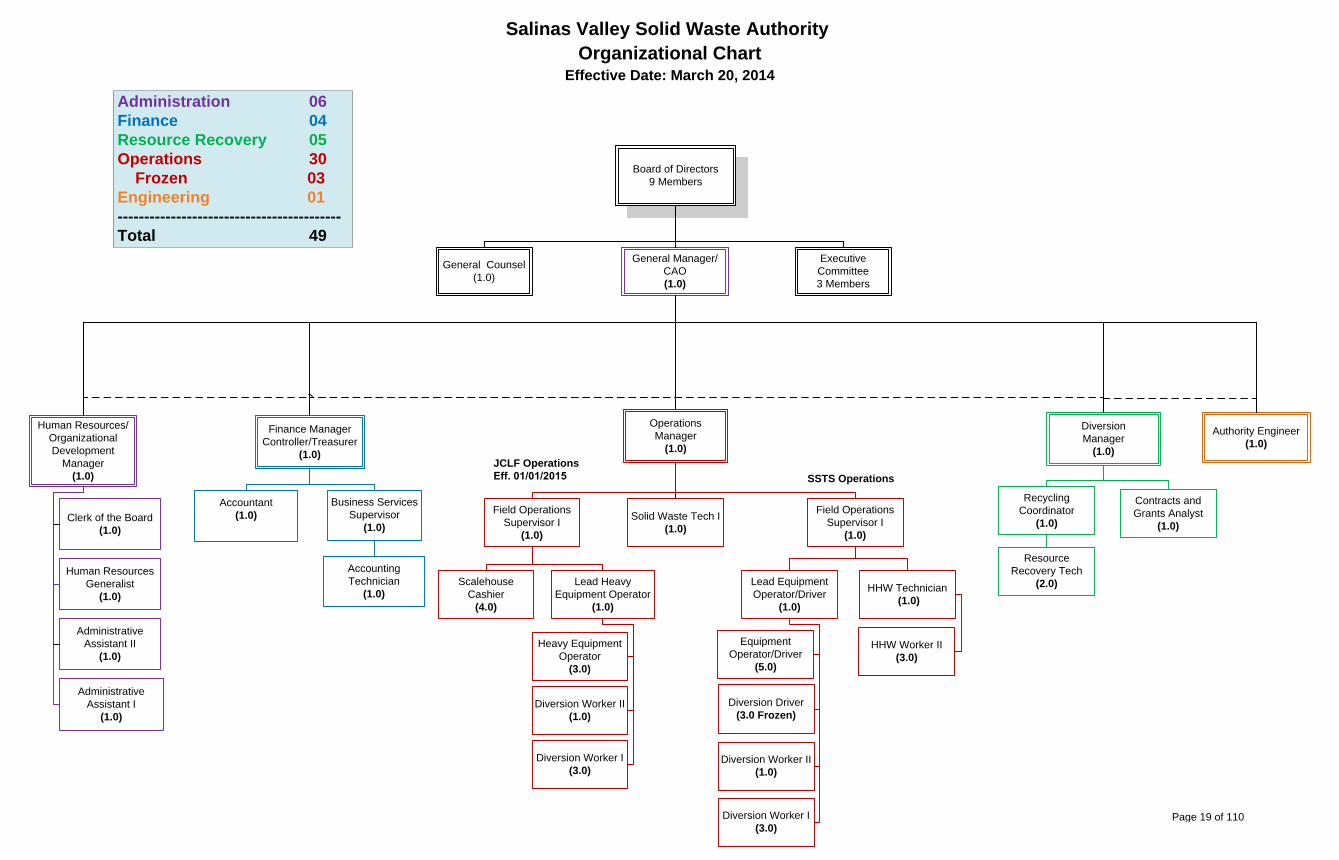
Board of Directors9 Members
General Manager/CAO(1.0)
Executive Committee3 Members
General Counsel(1.0)
Human Resources/Organizational Development
Manager(1.0)
Diversion Manager
(1.0)
Finance ManagerController/Treasurer
(1.0)
Accountant(1.0)
Business Services Supervisor
(1.0)
Accounting Technician
(1.0)
Clerk of the Board(1.0)
Human Resources Generalist
(1.0)
Administrative Assistant II
(1.0)
Administrative Assistant I
(1.0)
Contracts and Grants Analyst
(1.0)
HHW Technician (1.0)
Recycling Coordinator
(1.0)
Resource Recovery Tech
(2.0)
HHW Worker II(3.0)
Authority Engineer(1.0)
Operations Manager
(1.0)
Lead Heavy Equipment Operator
(1.0)
Heavy Equipment Operator
(3.0)
Diversion Driver(3.0 Frozen)
Diversion Worker I(3.0)
Administration 06
Finance 04
Resource Recovery 05
Operations 30
Frozen 03
Engineering 01
------------------------------------------
Total 49
Scalehouse Cashier
(4.0)
Diversion Worker II(1.0)
Salinas Valley Solid Waste Authority
Organizational ChartEffective Date: March 20, 2014
Solid Waste Tech I(1.0)
Field Operations Supervisor I
(1.0)
Field Operations Supervisor I
(1.0)
JCLF Operations
Eff. 01/01/2015 SSTS Operations
Lead Equipment Operator/Driver
(1.0)
Equipment Operator/Driver
(5.0)
Diversion Worker II(1.0)
Diversion Worker I(3.0)
Page 19 of 110

This page intentionally left blank
Page 20 of 110
2013 2014 BUDGET
2014 2015 PROPOSED
Increase / (Decrease)
% Change
Operating Revenues - - - 0.0%51.1 - Tipping Fees - Solid Waste 11,141,800 11,005,500 (136,300) -1.2%51.2 - Tipping Fees - Surcharge 1,034,000 1,276,800 242,800 23.5%51.3 - Tipping Fees - Diverted Materials 956,800 1,017,700 60,900 6.4%51.4 - AB939 Service Fee 1,732,000 1,732,000 - 0.0%51.5 - Tipping Fees - South Valley 2,318,800 - (2,318,800) -100.0%52.1 - Charges for Services 117,000 124,500 7,500 6.4%53.1 - Sales of Materials 385,000 309,500 (75,500) -19.6%53.2 - Gas Royalties 187,500 220,000 32,500 17.3%54.1 - Investment Earnings 30,200 31,700 1,500 5.0%Total Operating Revenues 17,903,100 15,717,700 (2,185,400) -12.2%
Expenditures1110 - Executive Administration 376,550 404,050 27,500 7.3%1120 - Administrative Support 396,780 404,800 8,020 2.0%1130 - Human Resources Administration 324,210 363,200 38,990 12.0%1140 - Clerk of the Board 169,000 175,650 6,650 3.9%1200 - Finance Administration 657,000 676,800 19,800 3.0%1300 - Operations Administration 259,210 387,600 128,390 49.5%2100 - Resource Recovery 681,160 715,100 33,940 5.0%2150 - Marketing 75,000 75,000 - 0.0%2200 - Public Education 167,700 190,000 22,300 13.3%2300 - Household Hazardous Waste 671,010 682,800 11,790 1.8%2400 - C & D Diversion 30,000 30,000 - 0.0%2500 - Organics Diversion 587,530 587,200 (330) -0.1%2600 - Diversion Services 144,750 144,750 - 0.0%3100 - Scalehouse Operations 371,630 389,650 18,020 4.8%3600 - JR Transfer Station 723,060 739,900 16,840 2.3%3650 - ML Transfer Station 150,000 150,000 - 0.0%3710 - SS Disposal Operations 687,841 682,000 (5,841) -0.8%3720 - SS Transfer Operations 910,749 959,750 49,001 5.4%3730 - SS Recycling Operations 189,090 189,100 10 0.0%4500 - JC Landfill Operations 3,717,840 3,515,000 (202,840) -5.5%5300 - Crazy Horse Postclosure Maintenance 550,740 566,150 15,410 2.8%5400 - Lewis Road Postclosure Maintenance 211,590 224,100 12,510 5.9%5500 - Johnson Canyon ECS 322,540 303,500 (19,040) -5.9%5600 - Jolon Road Postclosure Maintenance 145,350 139,800 (5,550) -3.8%5700 - Sun Street ECS 116,870 147,100 30,230 25.9%6100 - Debt Service - Interest 1,851,700 1,606,000 (245,700) -13.3%6200 - Debt Service - Principal 1,097,600 315,000 (782,600) -71.3%6605 - Closure Set-Aside 277,000 186,000 (91,000) -32.9%Total Expenditures 15,863,500 14,950,000 (913,500) -5.8%
Operating Budget Surplus 2,039,600 767,700
CIP's Funded from Operating Surplus 675,000
Balance Used to Fund Liabilities 92,700
Salinas Valley Solid Waste AuthorityTwo-Year Budget Comparison
FY 2014-15
Page 21 of 110

This page intentionally left blank
Page 22 of 110
Category 2013 2014 BUDGET
2014 2015 PROPOSED
Increase / (Decrease)
% Change
61.0 - Employee Services 4,205,400 4,885,000 679,600 16.2%62.0 - Supplies 455,878 693,000 237,122 52.0%63.0 - Contract Services 6,786,469 6,200,050 (586,419) -8.6%64.0 - Other Expenses 1,161,453 1,054,450 (107,003) -9.2%65.0 - Debt Service 2,949,300 1,921,000 (1,028,300) -34.9%66.0 - Capital Outlay 28,000 10,500 (17,500) -62.5%67.0 - Closure/Postclosure 277,000 186,000 (91,000) -32.9%Grand Total 15,863,500 14,950,000 (913,500) -5.8%
Salinas Valley Solid Waste AuthorityBudget by Category
FY 2014-15
61.0 - Employee Services4,885,000
62.0 - Supplies693,000 63.0 - Contract
Services6,200,050
64.0 - Other Expenses1,054,450
65.0 - Debt Service
1,921,000
66.0 - Capital Outlay10,500
0%
67.0 - Closure/Postclosure186,000
1%
Page 23 of 110
This page intentionally left blank
Page 24 of 110
Category 2013 2014 BUDGET
2014 2015 PROPOSED
Increase / (Decrease)
% Change
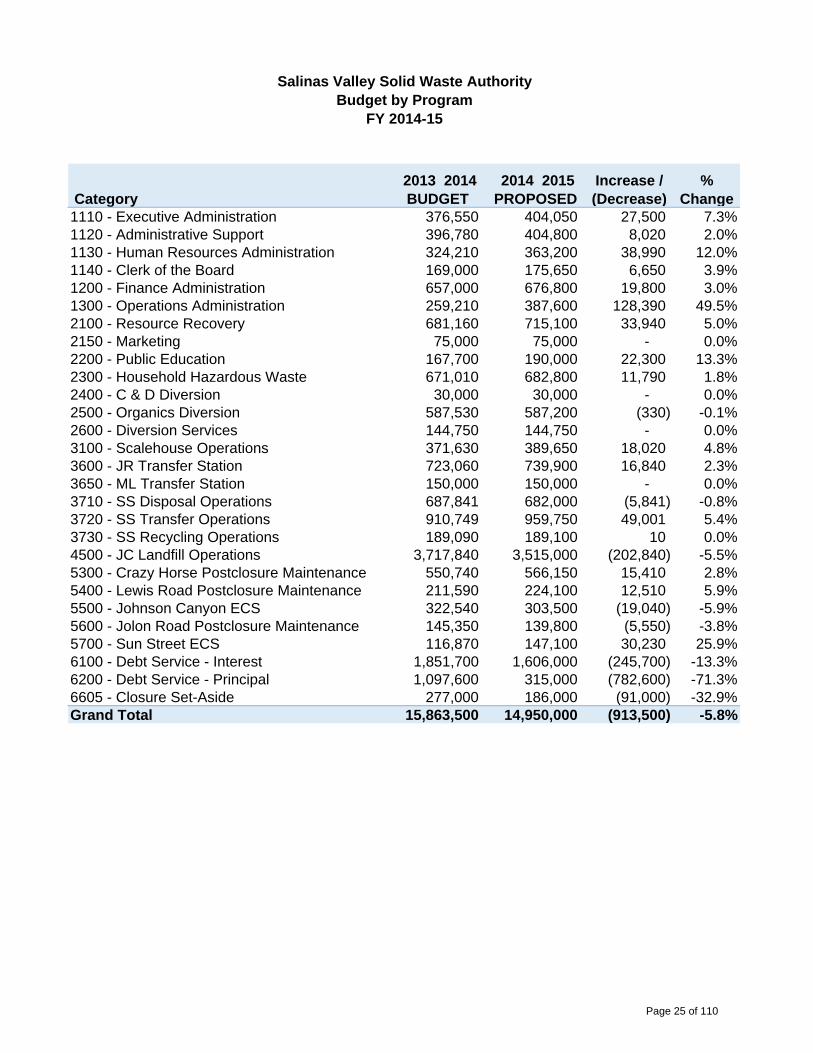
1110 - Executive Administration 376,550 404,050 27,500 7.3%1120 - Administrative Support 396,780 404,800 8,020 2.0%1130 - Human Resources Administration 324,210 363,200 38,990 12.0%1140 - Clerk of the Board 169,000 175,650 6,650 3.9%1200 - Finance Administration 657,000 676,800 19,800 3.0%1300 - Operations Administration 259,210 387,600 128,390 49.5%2100 - Resource Recovery 681,160 715,100 33,940 5.0%2150 - Marketing 75,000 75,000 - 0.0%2200 - Public Education 167,700 190,000 22,300 13.3%2300 - Household Hazardous Waste 671,010 682,800 11,790 1.8%2400 - C & D Diversion 30,000 30,000 - 0.0%2500 - Organics Diversion 587,530 587,200 (330) -0.1%2600 - Diversion Services 144,750 144,750 - 0.0%3100 - Scalehouse Operations 371,630 389,650 18,020 4.8%3600 - JR Transfer Station 723,060 739,900 16,840 2.3%3650 - ML Transfer Station 150,000 150,000 - 0.0%3710 - SS Disposal Operations 687,841 682,000 (5,841) -0.8%3720 - SS Transfer Operations 910,749 959,750 49,001 5.4%3730 - SS Recycling Operations 189,090 189,100 10 0.0%4500 - JC Landfill Operations 3,717,840 3,515,000 (202,840) -5.5%5300 - Crazy Horse Postclosure Maintenance 550,740 566,150 15,410 2.8%5400 - Lewis Road Postclosure Maintenance 211,590 224,100 12,510 5.9%5500 - Johnson Canyon ECS 322,540 303,500 (19,040) -5.9%5600 - Jolon Road Postclosure Maintenance 145,350 139,800 (5,550) -3.8%5700 - Sun Street ECS 116,870 147,100 30,230 25.9%6100 - Debt Service - Interest 1,851,700 1,606,000 (245,700) -13.3%6200 - Debt Service - Principal 1,097,600 315,000 (782,600) -71.3%6605 - Closure Set-Aside 277,000 186,000 (91,000) -32.9%Grand Total 15,863,500 14,950,000 (913,500) -5.8%
Salinas Valley Solid Waste AuthorityBudget by Program
FY 2014-15
Page 25 of 110

This page intentionally left blank
Page 26 of 110
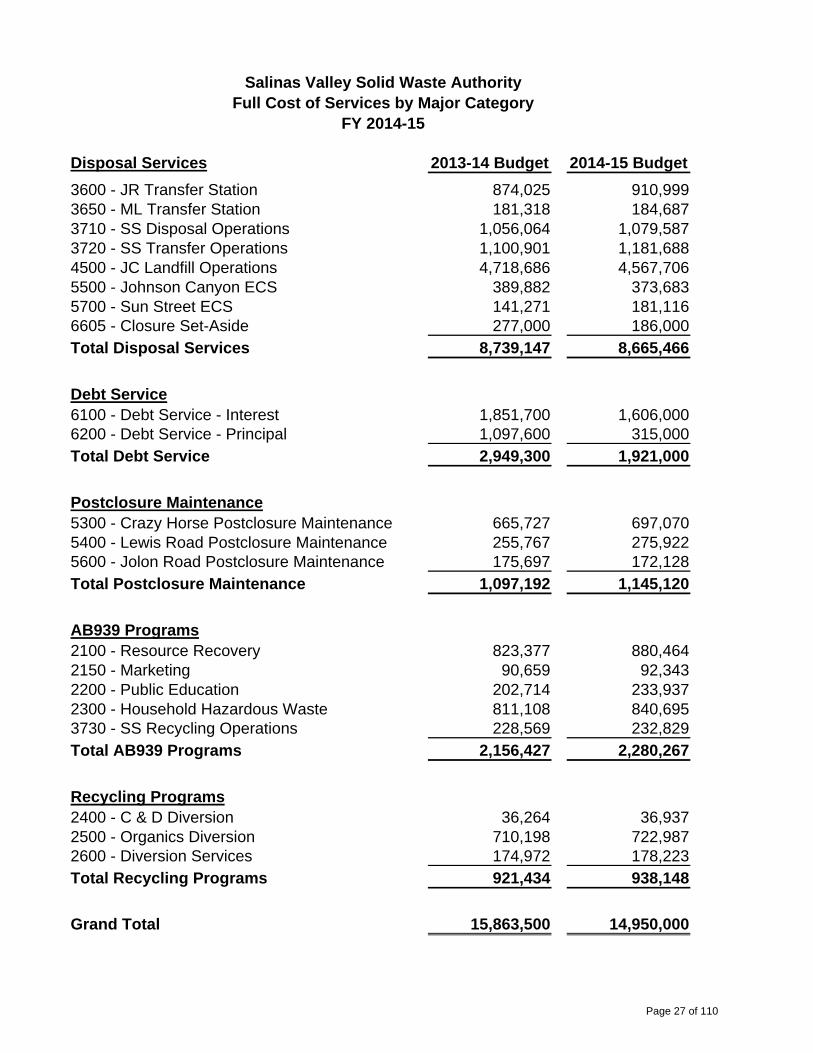
Disposal Services 2013-14 Budget 2014-15 Budget
3600 - JR Transfer Station 874,025 910,999 3650 - ML Transfer Station 181,318 184,687 3710 - SS Disposal Operations 1,056,064 1,079,587 3720 - SS Transfer Operations 1,100,901 1,181,688 4500 - JC Landfill Operations 4,718,686 4,567,706 5500 - Johnson Canyon ECS 389,882 373,683 5700 - Sun Street ECS 141,271 181,116 6605 - Closure Set-Aside 277,000 186,000 Total Disposal Services 8,739,147 8,665,466
Debt Service6100 - Debt Service - Interest 1,851,700 1,606,000 6200 - Debt Service - Principal 1,097,600 315,000 Total Debt Service 2,949,300 1,921,000
Postclosure Maintenance5300 - Crazy Horse Postclosure Maintenance 665,727 697,070 5400 - Lewis Road Postclosure Maintenance 255,767 275,922 5600 - Jolon Road Postclosure Maintenance 175,697 172,128 Total Postclosure Maintenance 1,097,192 1,145,120
AB939 Programs2100 - Resource Recovery 823,377 880,464 2150 - Marketing 90,659 92,343 2200 - Public Education 202,714 233,937 2300 - Household Hazardous Waste 811,108 840,695 3730 - SS Recycling Operations 228,569 232,829 Total AB939 Programs 2,156,427 2,280,267
Recycling Programs2400 - C & D Diversion 36,264 36,937 2500 - Organics Diversion 710,198 722,987 2600 - Diversion Services 174,972 178,223 Total Recycling Programs 921,434 938,148
Grand Total 15,863,500 14,950,000
Salinas Valley Solid Waste AuthorityFull Cost of Services by Major Category
FY 2014-15
Page 27 of 110

This page intentionally left blank
Page 28 of 110
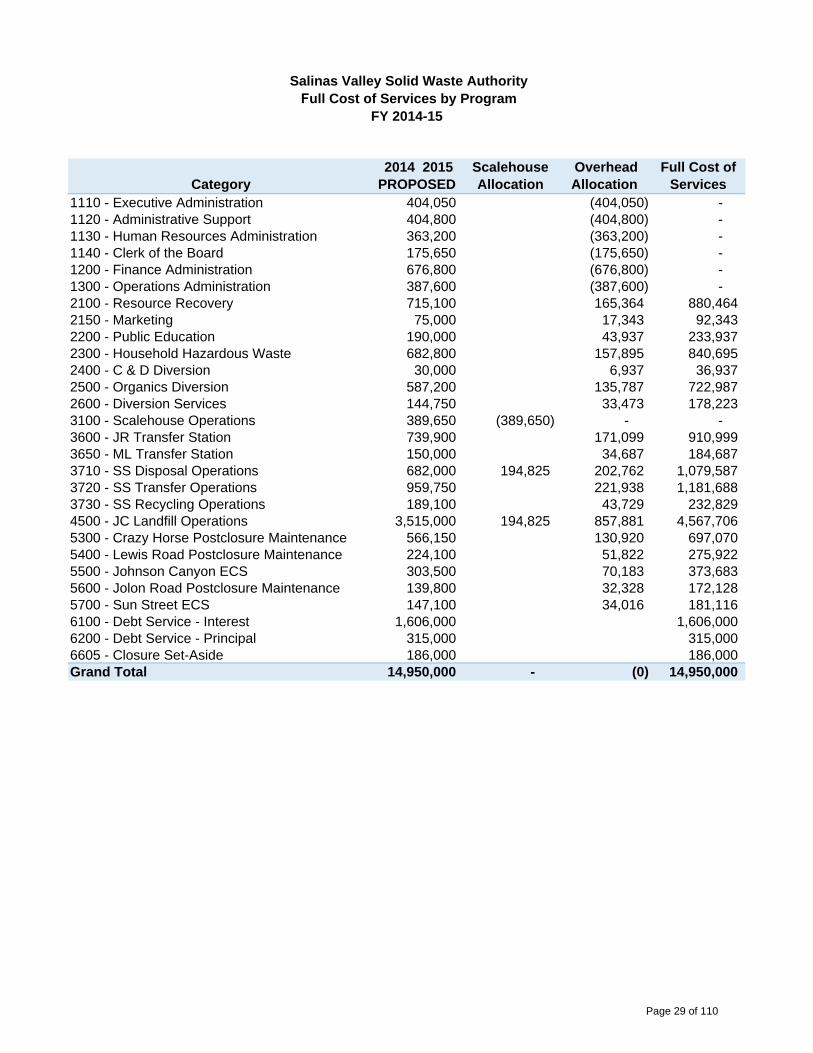
Category 2014 2015 PROPOSED
Scalehouse Allocation
Overhead Allocation
Full Cost of Services
1110 - Executive Administration 404,050 (404,050) - 1120 - Administrative Support 404,800 (404,800) - 1130 - Human Resources Administration 363,200 (363,200) - 1140 - Clerk of the Board 175,650 (175,650) - 1200 - Finance Administration 676,800 (676,800) - 1300 - Operations Administration 387,600 (387,600) - 2100 - Resource Recovery 715,100 165,364 880,464 2150 - Marketing 75,000 17,343 92,343 2200 - Public Education 190,000 43,937 233,937 2300 - Household Hazardous Waste 682,800 157,895 840,695 2400 - C & D Diversion 30,000 6,937 36,937 2500 - Organics Diversion 587,200 135,787 722,987 2600 - Diversion Services 144,750 33,473 178,223 3100 - Scalehouse Operations 389,650 (389,650) - - 3600 - JR Transfer Station 739,900 171,099 910,999 3650 - ML Transfer Station 150,000 34,687 184,687 3710 - SS Disposal Operations 682,000 194,825 202,762 1,079,587 3720 - SS Transfer Operations 959,750 221,938 1,181,688 3730 - SS Recycling Operations 189,100 43,729 232,829 4500 - JC Landfill Operations 3,515,000 194,825 857,881 4,567,706 5300 - Crazy Horse Postclosure Maintenance 566,150 130,920 697,070 5400 - Lewis Road Postclosure Maintenance 224,100 51,822 275,922 5500 - Johnson Canyon ECS 303,500 70,183 373,683 5600 - Jolon Road Postclosure Maintenance 139,800 32,328 172,128 5700 - Sun Street ECS 147,100 34,016 181,116 6100 - Debt Service - Interest 1,606,000 1,606,000 6200 - Debt Service - Principal 315,000 315,000 6605 - Closure Set-Aside 186,000 186,000 Grand Total 14,950,000 - (0) 14,950,000
Salinas Valley Solid Waste Authority Full Cost of Services by Program
FY 2014-15
Page 29 of 110

This page intentionally left blank
Page 30 of 110
Category2013 2014 BUDGET
2014 2015 PROPOSED
Increase / (Decrease) % Change
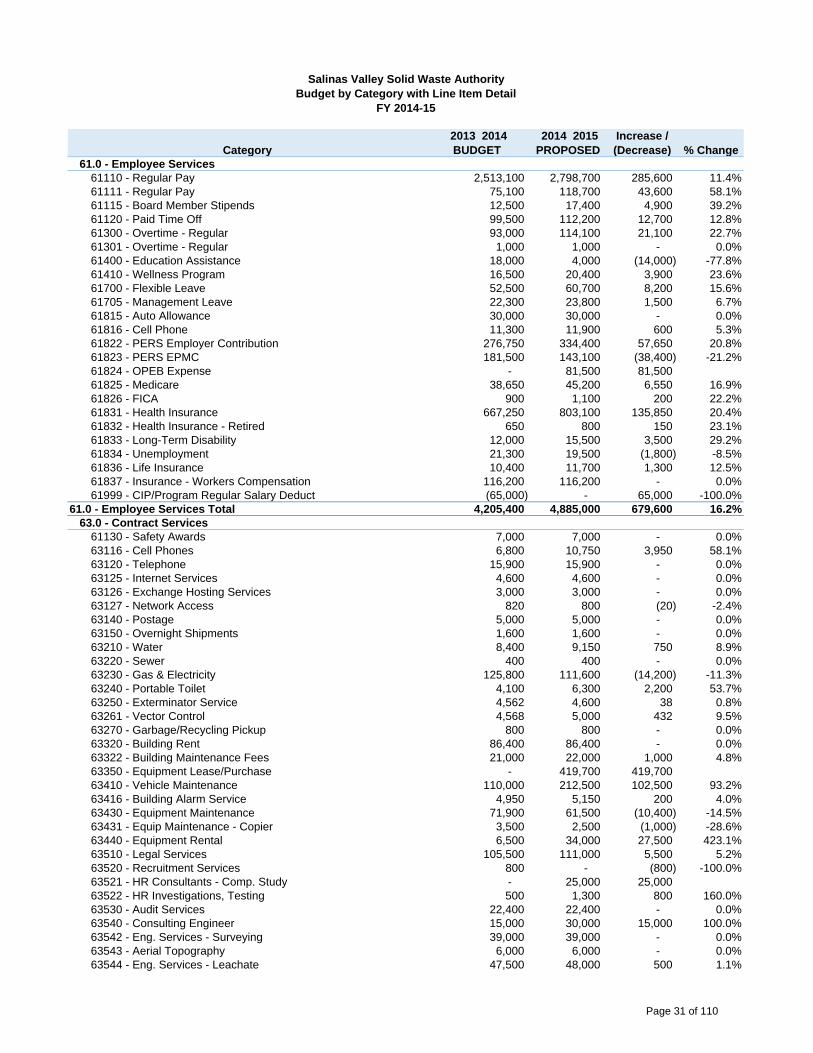
61.0 - Employee Services61110 - Regular Pay 2,513,100 2,798,700 285,600 11.4%61111 - Regular Pay 75,100 118,700 43,600 58.1%61115 - Board Member Stipends 12,500 17,400 4,900 39.2%61120 - Paid Time Off 99,500 112,200 12,700 12.8%61300 - Overtime - Regular 93,000 114,100 21,100 22.7%61301 - Overtime - Regular 1,000 1,000 - 0.0%61400 - Education Assistance 18,000 4,000 (14,000) -77.8%61410 - Wellness Program 16,500 20,400 3,900 23.6%61700 - Flexible Leave 52,500 60,700 8,200 15.6%61705 - Management Leave 22,300 23,800 1,500 6.7%61815 - Auto Allowance 30,000 30,000 - 0.0%61816 - Cell Phone 11,300 11,900 600 5.3%61822 - PERS Employer Contribution 276,750 334,400 57,650 20.8%61823 - PERS EPMC 181,500 143,100 (38,400) -21.2%61824 - OPEB Expense - 81,500 81,500 61825 - Medicare 38,650 45,200 6,550 16.9%61826 - FICA 900 1,100 200 22.2%61831 - Health Insurance 667,250 803,100 135,850 20.4%61832 - Health Insurance - Retired 650 800 150 23.1%61833 - Long-Term Disability 12,000 15,500 3,500 29.2%61834 - Unemployment 21,300 19,500 (1,800) -8.5%61836 - Life Insurance 10,400 11,700 1,300 12.5%61837 - Insurance - Workers Compensation 116,200 116,200 - 0.0%61999 - CIP/Program Regular Salary Deduct (65,000) - 65,000 -100.0%
61.0 - Employee Services Total 4,205,400 4,885,000 679,600 16.2%63.0 - Contract Services
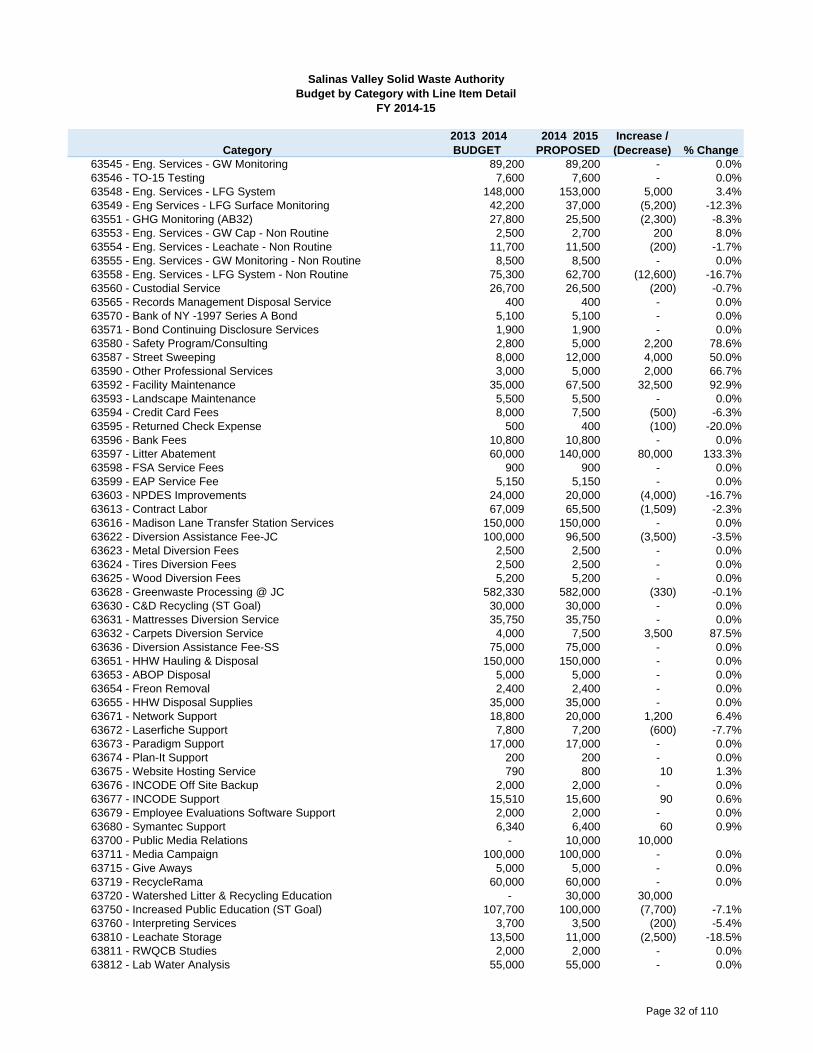
61130 - Safety Awards 7,000 7,000 - 0.0%63116 - Cell Phones 6,800 10,750 3,950 58.1%63120 - Telephone 15,900 15,900 - 0.0%63125 - Internet Services 4,600 4,600 - 0.0%63126 - Exchange Hosting Services 3,000 3,000 - 0.0%63127 - Network Access 820 800 (20) -2.4%63140 - Postage 5,000 5,000 - 0.0%63150 - Overnight Shipments 1,600 1,600 - 0.0%63210 - Water 8,400 9,150 750 8.9%63220 - Sewer 400 400 - 0.0%63230 - Gas & Electricity 125,800 111,600 (14,200) -11.3%63240 - Portable Toilet 4,100 6,300 2,200 53.7%63250 - Exterminator Service 4,562 4,600 38 0.8%63261 - Vector Control 4,568 5,000 432 9.5%63270 - Garbage/Recycling Pickup 800 800 - 0.0%63320 - Building Rent 86,400 86,400 - 0.0%63322 - Building Maintenance Fees 21,000 22,000 1,000 4.8%63350 - Equipment Lease/Purchase - 419,700 419,700 63410 - Vehicle Maintenance 110,000 212,500 102,500 93.2%63416 - Building Alarm Service 4,950 5,150 200 4.0%63430 - Equipment Maintenance 71,900 61,500 (10,400) -14.5%63431 - Equip Maintenance - Copier 3,500 2,500 (1,000) -28.6%63440 - Equipment Rental 6,500 34,000 27,500 423.1%63510 - Legal Services 105,500 111,000 5,500 5.2%63520 - Recruitment Services 800 - (800) -100.0%63521 - HR Consultants - Comp. Study - 25,000 25,000 63522 - HR Investigations, Testing 500 1,300 800 160.0%63530 - Audit Services 22,400 22,400 - 0.0%63540 - Consulting Engineer 15,000 30,000 15,000 100.0%63542 - Eng. Services - Surveying 39,000 39,000 - 0.0%63543 - Aerial Topography 6,000 6,000 - 0.0%63544 - Eng. Services - Leachate 47,500 48,000 500 1.1%
Salinas Valley Solid Waste AuthorityBudget by Category with Line Item Detail
FY 2014-15
Page 31 of 110
Category2013 2014 BUDGET
2014 2015 PROPOSED
Increase / (Decrease) % Change
Salinas Valley Solid Waste AuthorityBudget by Category with Line Item Detail
FY 2014-15
63545 - Eng. Services - GW Monitoring 89,200 89,200 - 0.0%63546 - TO-15 Testing 7,600 7,600 - 0.0%63548 - Eng. Services - LFG System 148,000 153,000 5,000 3.4%63549 - Eng Services - LFG Surface Monitoring 42,200 37,000 (5,200) -12.3%63551 - GHG Monitoring (AB32) 27,800 25,500 (2,300) -8.3%63553 - Eng. Services - GW Cap - Non Routine 2,500 2,700 200 8.0%63554 - Eng. Services - Leachate - Non Routine 11,700 11,500 (200) -1.7%63555 - Eng. Services - GW Monitoring - Non Routine 8,500 8,500 - 0.0%63558 - Eng. Services - LFG System - Non Routine 75,300 62,700 (12,600) -16.7%63560 - Custodial Service 26,700 26,500 (200) -0.7%63565 - Records Management Disposal Service 400 400 - 0.0%63570 - Bank of NY -1997 Series A Bond 5,100 5,100 - 0.0%63571 - Bond Continuing Disclosure Services 1,900 1,900 - 0.0%63580 - Safety Program/Consulting 2,800 5,000 2,200 78.6%63587 - Street Sweeping 8,000 12,000 4,000 50.0%63590 - Other Professional Services 3,000 5,000 2,000 66.7%63592 - Facility Maintenance 35,000 67,500 32,500 92.9%63593 - Landscape Maintenance 5,500 5,500 - 0.0%63594 - Credit Card Fees 8,000 7,500 (500) -6.3%63595 - Returned Check Expense 500 400 (100) -20.0%63596 - Bank Fees 10,800 10,800 - 0.0%63597 - Litter Abatement 60,000 140,000 80,000 133.3%63598 - FSA Service Fees 900 900 - 0.0%63599 - EAP Service Fee 5,150 5,150 - 0.0%63603 - NPDES Improvements 24,000 20,000 (4,000) -16.7%63613 - Contract Labor 67,009 65,500 (1,509) -2.3%63616 - Madison Lane Transfer Station Services 150,000 150,000 - 0.0%63622 - Diversion Assistance Fee-JC 100,000 96,500 (3,500) -3.5%63623 - Metal Diversion Fees 2,500 2,500 - 0.0%63624 - Tires Diversion Fees 2,500 2,500 - 0.0%63625 - Wood Diversion Fees 5,200 5,200 - 0.0%63628 - Greenwaste Processing @ JC 582,330 582,000 (330) -0.1%63630 - C&D Recycling (ST Goal) 30,000 30,000 - 0.0%63631 - Mattresses Diversion Service 35,750 35,750 - 0.0%63632 - Carpets Diversion Service 4,000 7,500 3,500 87.5%63636 - Diversion Assistance Fee-SS 75,000 75,000 - 0.0%63651 - HHW Hauling & Disposal 150,000 150,000 - 0.0%63653 - ABOP Disposal 5,000 5,000 - 0.0%63654 - Freon Removal 2,400 2,400 - 0.0%63655 - HHW Disposal Supplies 35,000 35,000 - 0.0%63671 - Network Support 18,800 20,000 1,200 6.4%63672 - Laserfiche Support 7,800 7,200 (600) -7.7%63673 - Paradigm Support 17,000 17,000 - 0.0%63674 - Plan-It Support 200 200 - 0.0%63675 - Website Hosting Service 790 800 10 1.3%63676 - INCODE Off Site Backup 2,000 2,000 - 0.0%63677 - INCODE Support 15,510 15,600 90 0.6%63679 - Employee Evaluations Software Support 2,000 2,000 - 0.0%63680 - Symantec Support 6,340 6,400 60 0.9%63700 - Public Media Relations - 10,000 10,000 63711 - Media Campaign 100,000 100,000 - 0.0%63715 - Give Aways 5,000 5,000 - 0.0%63719 - RecycleRama 60,000 60,000 - 0.0%63720 - Watershed Litter & Recycling Education - 30,000 30,000 63750 - Increased Public Education (ST Goal) 107,700 100,000 (7,700) -7.1%63760 - Interpreting Services 3,700 3,500 (200) -5.4%63810 - Leachate Storage 13,500 11,000 (2,500) -18.5%63811 - RWQCB Studies 2,000 2,000 - 0.0%63812 - Lab Water Analysis 55,000 55,000 - 0.0%
Page 32 of 110
Category2013 2014 BUDGET
2014 2015 PROPOSED
Increase / (Decrease) % Change
Salinas Valley Solid Waste AuthorityBudget by Category with Line Item Detail
FY 2014-15
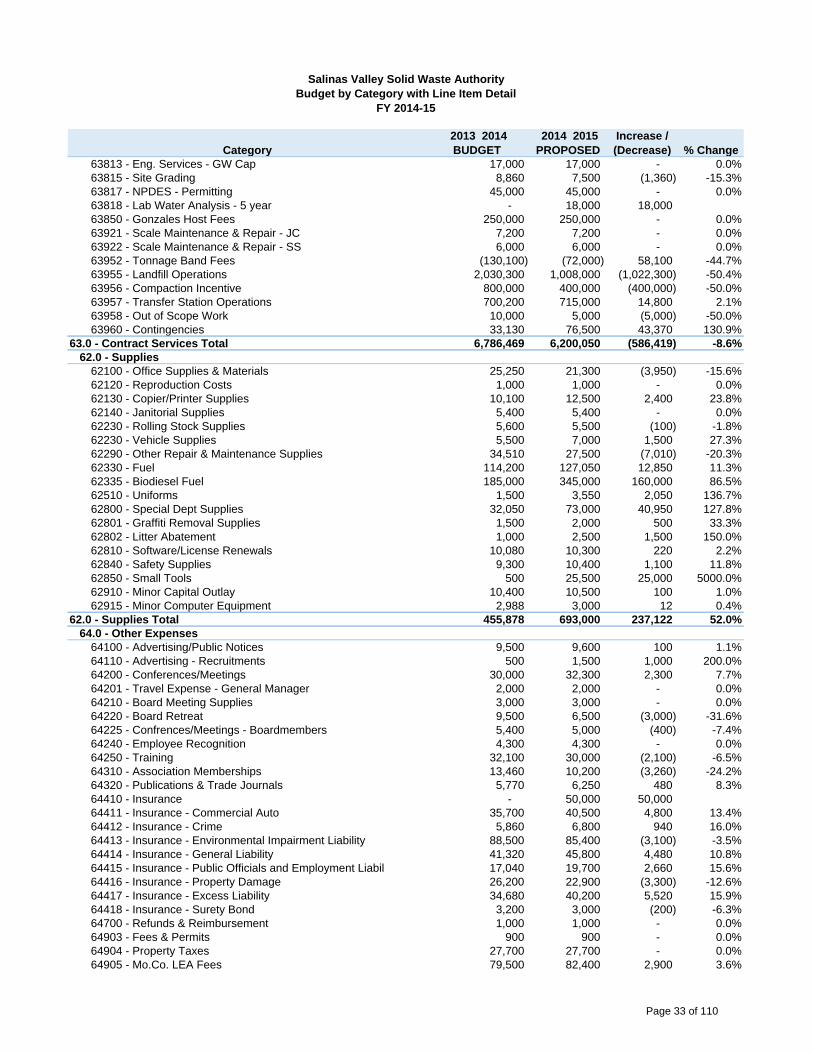
63813 - Eng. Services - GW Cap 17,000 17,000 - 0.0%63815 - Site Grading 8,860 7,500 (1,360) -15.3%63817 - NPDES - Permitting 45,000 45,000 - 0.0%63818 - Lab Water Analysis - 5 year - 18,000 18,000 63850 - Gonzales Host Fees 250,000 250,000 - 0.0%63921 - Scale Maintenance & Repair - JC 7,200 7,200 - 0.0%63922 - Scale Maintenance & Repair - SS 6,000 6,000 - 0.0%63952 - Tonnage Band Fees (130,100) (72,000) 58,100 -44.7%63955 - Landfill Operations 2,030,300 1,008,000 (1,022,300) -50.4%63956 - Compaction Incentive 800,000 400,000 (400,000) -50.0%63957 - Transfer Station Operations 700,200 715,000 14,800 2.1%63958 - Out of Scope Work 10,000 5,000 (5,000) -50.0%63960 - Contingencies 33,130 76,500 43,370 130.9%
63.0 - Contract Services Total 6,786,469 6,200,050 (586,419) -8.6%62.0 - Supplies
62100 - Office Supplies & Materials 25,250 21,300 (3,950) -15.6%62120 - Reproduction Costs 1,000 1,000 - 0.0%62130 - Copier/Printer Supplies 10,100 12,500 2,400 23.8%62140 - Janitorial Supplies 5,400 5,400 - 0.0%62230 - Rolling Stock Supplies 5,600 5,500 (100) -1.8%62230 - Vehicle Supplies 5,500 7,000 1,500 27.3%62290 - Other Repair & Maintenance Supplies 34,510 27,500 (7,010) -20.3%62330 - Fuel 114,200 127,050 12,850 11.3%62335 - Biodiesel Fuel 185,000 345,000 160,000 86.5%62510 - Uniforms 1,500 3,550 2,050 136.7%62800 - Special Dept Supplies 32,050 73,000 40,950 127.8%62801 - Graffiti Removal Supplies 1,500 2,000 500 33.3%62802 - Litter Abatement 1,000 2,500 1,500 150.0%62810 - Software/License Renewals 10,080 10,300 220 2.2%62840 - Safety Supplies 9,300 10,400 1,100 11.8%62850 - Small Tools 500 25,500 25,000 5000.0%62910 - Minor Capital Outlay 10,400 10,500 100 1.0%62915 - Minor Computer Equipment 2,988 3,000 12 0.4%
62.0 - Supplies Total 455,878 693,000 237,122 52.0%64.0 - Other Expenses
64100 - Advertising/Public Notices 9,500 9,600 100 1.1%64110 - Advertising - Recruitments 500 1,500 1,000 200.0%64200 - Conferences/Meetings 30,000 32,300 2,300 7.7%64201 - Travel Expense - General Manager 2,000 2,000 - 0.0%64210 - Board Meeting Supplies 3,000 3,000 - 0.0%64220 - Board Retreat 9,500 6,500 (3,000) -31.6%64225 - Confrences/Meetings - Boardmembers 5,400 5,000 (400) -7.4%64240 - Employee Recognition 4,300 4,300 - 0.0%64250 - Training 32,100 30,000 (2,100) -6.5%64310 - Association Memberships 13,460 10,200 (3,260) -24.2%64320 - Publications & Trade Journals 5,770 6,250 480 8.3%64410 - Insurance - 50,000 50,000 64411 - Insurance - Commercial Auto 35,700 40,500 4,800 13.4%64412 - Insurance - Crime 5,860 6,800 940 16.0%64413 - Insurance - Environmental Impairment Liability 88,500 85,400 (3,100) -3.5%64414 - Insurance - General Liability 41,320 45,800 4,480 10.8%64415 - Insurance - Public Officials and Employment Liabil 17,040 19,700 2,660 15.6%64416 - Insurance - Property Damage 26,200 22,900 (3,300) -12.6%64417 - Insurance - Excess Liability 34,680 40,200 5,520 15.9%64418 - Insurance - Surety Bond 3,200 3,000 (200) -6.3%64700 - Refunds & Reimbursement 1,000 1,000 - 0.0%64903 - Fees & Permits 900 900 - 0.0%64904 - Property Taxes 27,700 27,700 - 0.0%64905 - Mo.Co. LEA Fees 79,500 82,400 2,900 3.6%
Page 33 of 110
Category2013 2014 BUDGET
2014 2015 PROPOSED
Increase / (Decrease) % Change
Salinas Valley Solid Waste AuthorityBudget by Category with Line Item Detail
FY 2014-15
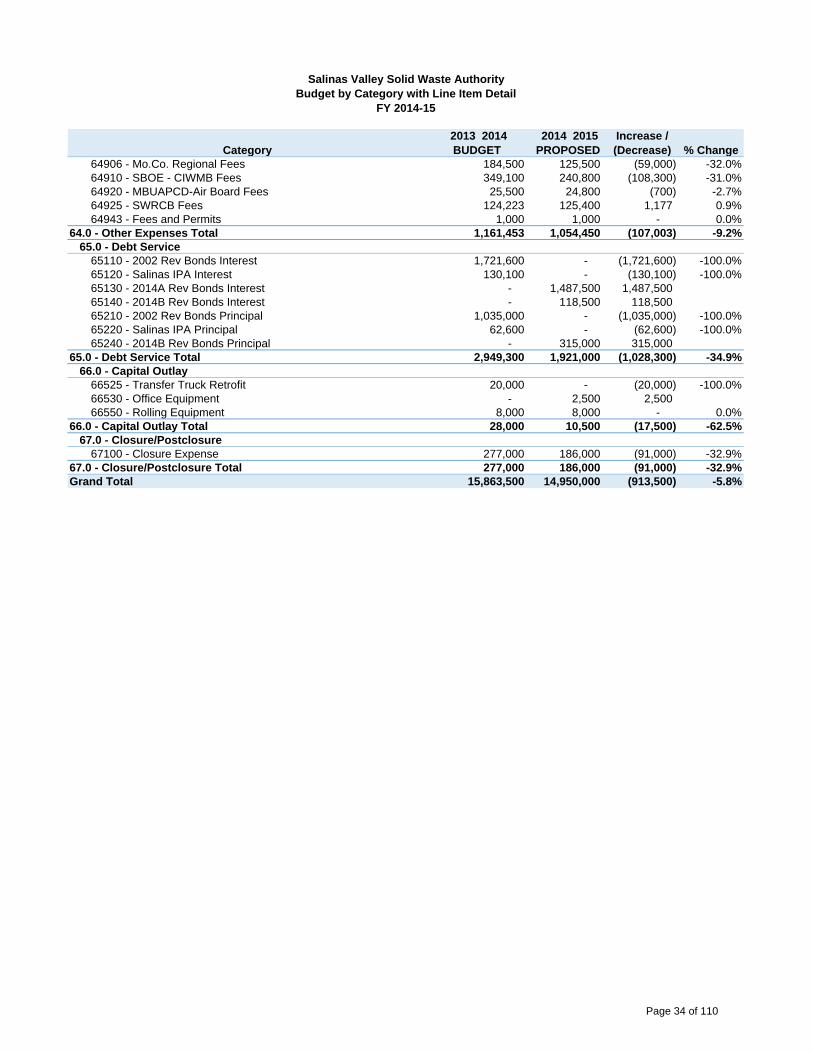
64906 - Mo.Co. Regional Fees 184,500 125,500 (59,000) -32.0%64910 - SBOE - CIWMB Fees 349,100 240,800 (108,300) -31.0%64920 - MBUAPCD-Air Board Fees 25,500 24,800 (700) -2.7%64925 - SWRCB Fees 124,223 125,400 1,177 0.9%64943 - Fees and Permits 1,000 1,000 - 0.0%
64.0 - Other Expenses Total 1,161,453 1,054,450 (107,003) -9.2%65.0 - Debt Service
65110 - 2002 Rev Bonds Interest 1,721,600 - (1,721,600) -100.0%65120 - Salinas IPA Interest 130,100 - (130,100) -100.0%65130 - 2014A Rev Bonds Interest - 1,487,500 1,487,500 65140 - 2014B Rev Bonds Interest - 118,500 118,500 65210 - 2002 Rev Bonds Principal 1,035,000 - (1,035,000) -100.0%65220 - Salinas IPA Principal 62,600 - (62,600) -100.0%65240 - 2014B Rev Bonds Principal - 315,000 315,000
65.0 - Debt Service Total 2,949,300 1,921,000 (1,028,300) -34.9%66.0 - Capital Outlay
66525 - Transfer Truck Retrofit 20,000 - (20,000) -100.0%66530 - Office Equipment - 2,500 2,500 66550 - Rolling Equipment 8,000 8,000 - 0.0%
66.0 - Capital Outlay Total 28,000 10,500 (17,500) -62.5%67.0 - Closure/Postclosure
67100 - Closure Expense 277,000 186,000 (91,000) -32.9%67.0 - Closure/Postclosure Total 277,000 186,000 (91,000) -32.9%Grand Total 15,863,500 14,950,000 (913,500) -5.8%
Page 34 of 110

Category 2013 2014 BUDGET
2014 2015 PROPOSED
Increase / (Decrease)
% Change
105 - Administration Fund1110 - Executive Administration
61.0 - Employee Services61110 - Regular Pay 176,500 185,300 8,800 5.0%61120 - Paid Time Off 6,900 7,200 300 4.3%61705 - Management Leave 5,100 5,400 300 5.9%61815 - Auto Allowance 6,000 6,000 - 0.0%61816 - Cell Phone 1,200 1,400 200 16.7%61822 - PERS Employer Contribution 18,900 21,200 2,300 12.2%61823 - PERS EPMC 12,400 5,600 (6,800) -54.8%61824 - OPEB Expense - 5,600 5,600 61825 - Medicare 2,600 2,700 100 3.8%61831 - Health Insurance 23,400 24,200 800 3.4%61833 - Long-Term Disability 800 900 100 12.5%61834 - Unemployment 500 400 (100) -20.0%61836 - Life Insurance 700 700 - 0.0%61837 - Insurance - Workers Compensation 1,300 900 (400) -30.8%61999 - CIP/Program Regular Salary Deduct (5,000) - 5,000 -100.0%
61.0 - Employee Services Total 251,300 267,500 16,200 6.4%63.0 - Contract Services
63116 - Cell Phones 600 600 - 0.0%63510 - Legal Services 85,000 85,000 - 0.0%63540 - Consulting Engineer 15,000 25,000 10,000 66.7%63590 - Other Professional Services 3,000 5,000 2,000 66.7%63598 - FSA Service Fees 100 100 - 0.0%63599 - EAP Service Fee 150 150 - 0.0%
63.0 - Contract Services Total 103,850 115,850 12,000 11.6%62.0 - Supplies
62810 - Software/License Renewals 400 400 - 0.0%62915 - Minor Computer Equipment 500 500 - 0.0%
62.0 - Supplies Total 900 900 - 0.0%64.0 - Other Expenses
64200 - Conferences/Meetings 3,500 5,000 1,500 42.9%64201 - Travel Expense - General Manager 2,000 2,000 - 0.0%64250 - Training 1,400 2,000 600 42.9%64310 - Association Memberships 7,100 5,000 (2,100) -29.6%64320 - Publications & Trade Journals 2,000 2,000 - 0.0%64412 - Insurance - Crime 500 200 (300) -60.0%64415 - Insurance - Public Officials and Employment Liabil 800 600 (200) -25.0%64418 - Insurance - Surety Bond 3,200 3,000 (200) -6.3%
64.0 - Other Expenses Total 20,500 19,800 (700) -3.4%1110 - Executive Administration Total 376,550 404,050 27,500 7.3%
1120 - Administrative Support61.0 - Employee Services
61110 - Regular Pay 112,000 105,400 (6,600) -5.9%61120 - Paid Time Off 4,400 4,100 (300) -6.8%61300 - Overtime - Regular 500 500 - 0.0%61400 - Education Assistance 1,000 - (1,000) -100.0%61410 - Wellness Program 1,000 1,000 - 0.0%61700 - Flexible Leave 3,300 3,100 (200) -6.1%61822 - PERS Employer Contribution 12,000 12,100 100 0.8%61823 - PERS EPMC 7,900 5,300 (2,600) -32.9%61824 - OPEB Expense - 3,200 3,200 61825 - Medicare 1,700 1,600 (100) -5.9%61831 - Health Insurance 29,300 44,000 14,700 50.2%61833 - Long-Term Disability 500 600 100 20.0%
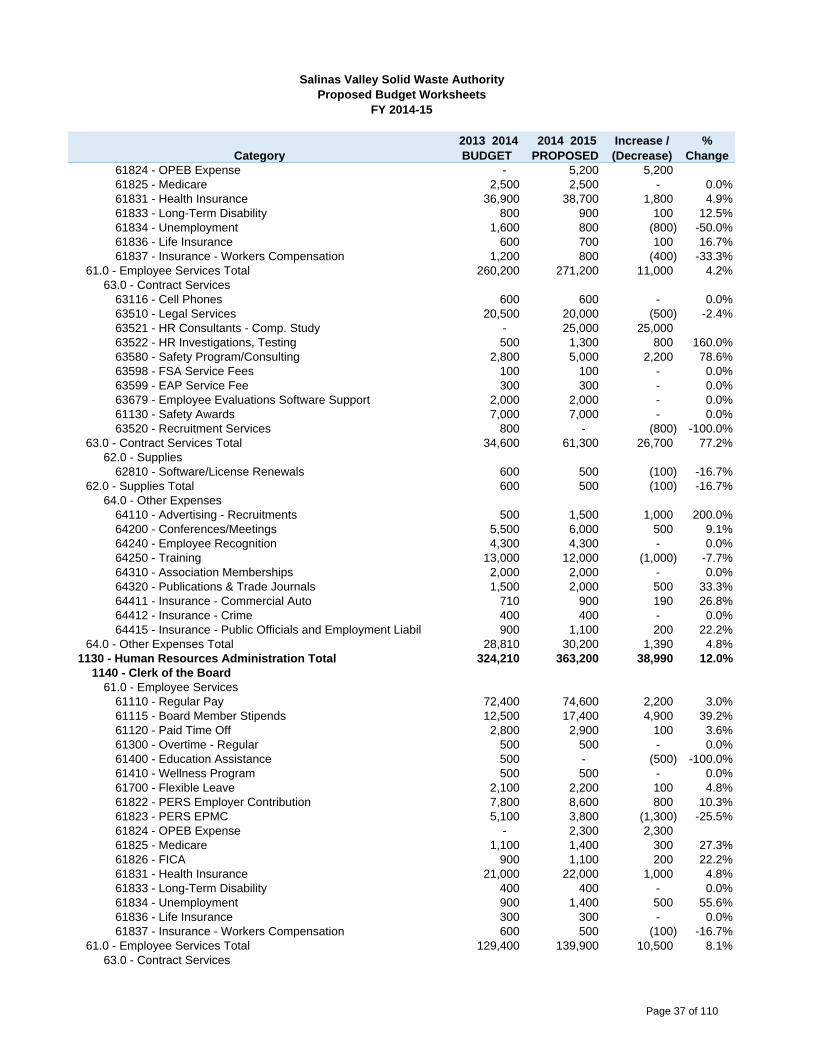
Salinas Valley Solid Waste AuthorityProposed Budget Worksheets
FY 2014-15
Page 35 of 110
Category 2013 2014 BUDGET
2014 2015 PROPOSED
Increase / (Decrease)
% Change
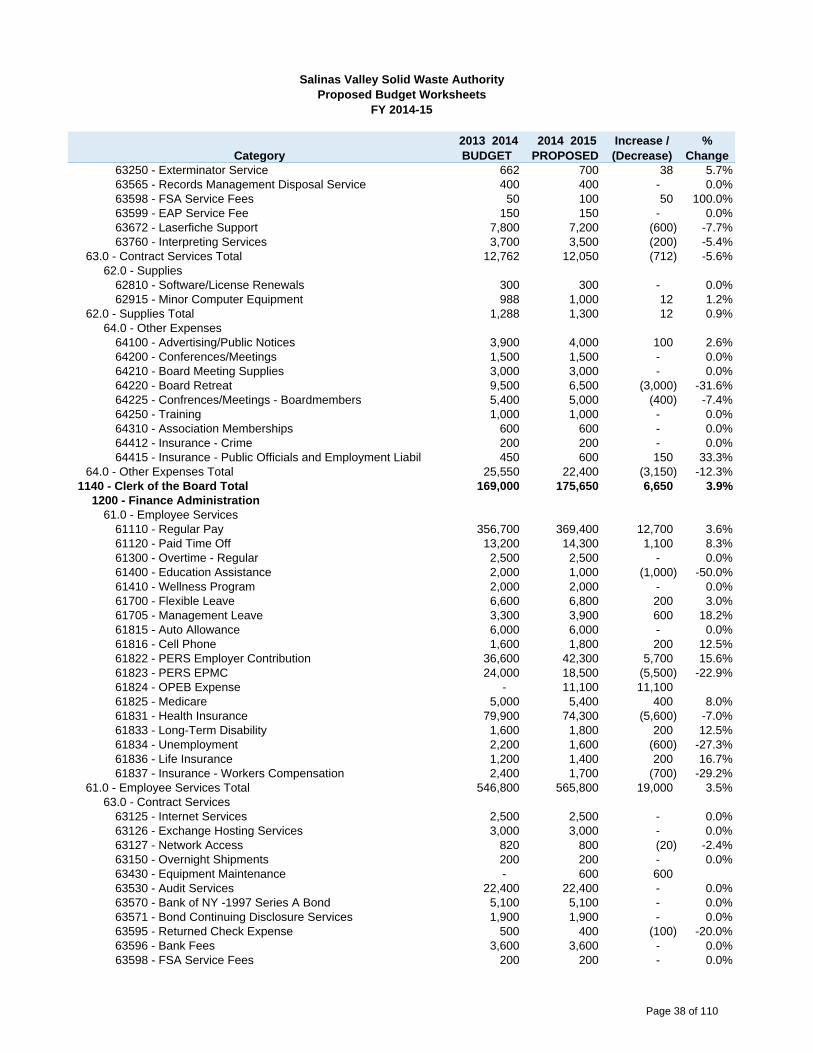
Salinas Valley Solid Waste AuthorityProposed Budget Worksheets
FY 2014-15
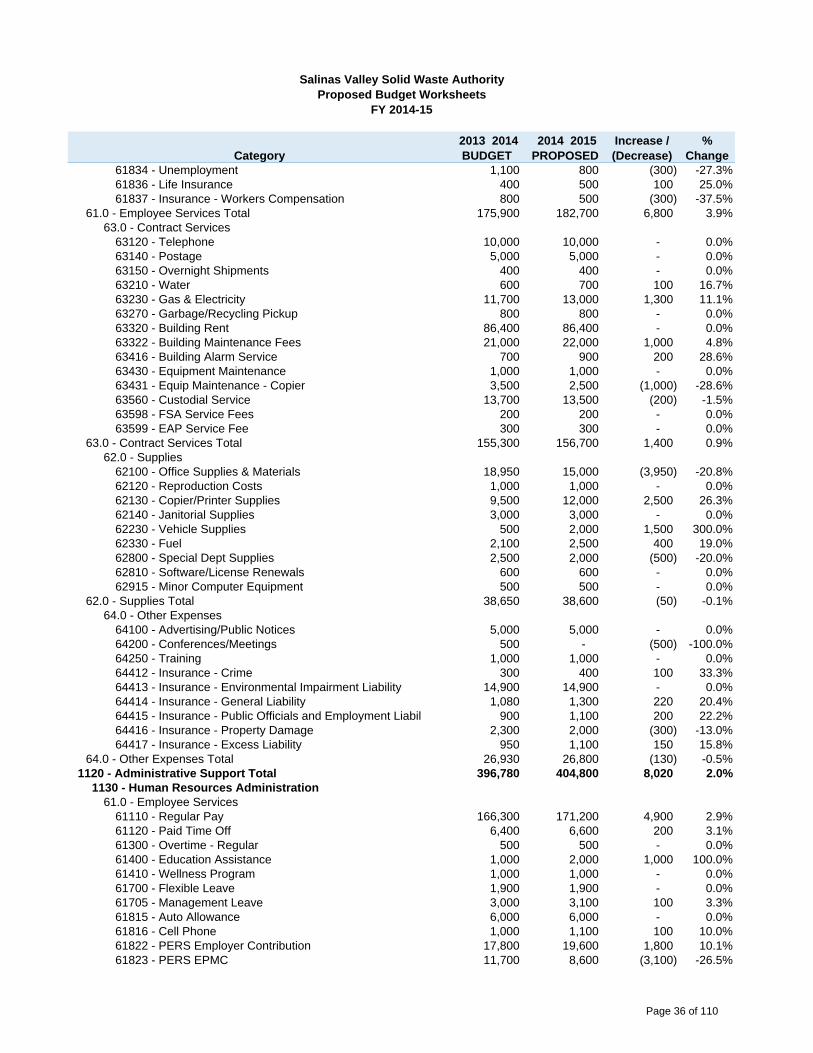
61834 - Unemployment 1,100 800 (300) -27.3%61836 - Life Insurance 400 500 100 25.0%61837 - Insurance - Workers Compensation 800 500 (300) -37.5%
61.0 - Employee Services Total 175,900 182,700 6,800 3.9%63.0 - Contract Services
63120 - Telephone 10,000 10,000 - 0.0%63140 - Postage 5,000 5,000 - 0.0%63150 - Overnight Shipments 400 400 - 0.0%63210 - Water 600 700 100 16.7%63230 - Gas & Electricity 11,700 13,000 1,300 11.1%63270 - Garbage/Recycling Pickup 800 800 - 0.0%63320 - Building Rent 86,400 86,400 - 0.0%63322 - Building Maintenance Fees 21,000 22,000 1,000 4.8%63416 - Building Alarm Service 700 900 200 28.6%63430 - Equipment Maintenance 1,000 1,000 - 0.0%63431 - Equip Maintenance - Copier 3,500 2,500 (1,000) -28.6%63560 - Custodial Service 13,700 13,500 (200) -1.5%63598 - FSA Service Fees 200 200 - 0.0%63599 - EAP Service Fee 300 300 - 0.0%
63.0 - Contract Services Total 155,300 156,700 1,400 0.9%62.0 - Supplies
62100 - Office Supplies & Materials 18,950 15,000 (3,950) -20.8%62120 - Reproduction Costs 1,000 1,000 - 0.0%62130 - Copier/Printer Supplies 9,500 12,000 2,500 26.3%62140 - Janitorial Supplies 3,000 3,000 - 0.0%62230 - Vehicle Supplies 500 2,000 1,500 300.0%62330 - Fuel 2,100 2,500 400 19.0%62800 - Special Dept Supplies 2,500 2,000 (500) -20.0%62810 - Software/License Renewals 600 600 - 0.0%62915 - Minor Computer Equipment 500 500 - 0.0%
62.0 - Supplies Total 38,650 38,600 (50) -0.1%64.0 - Other Expenses
64100 - Advertising/Public Notices 5,000 5,000 - 0.0%64200 - Conferences/Meetings 500 - (500) -100.0%64250 - Training 1,000 1,000 - 0.0%64412 - Insurance - Crime 300 400 100 33.3%64413 - Insurance - Environmental Impairment Liability 14,900 14,900 - 0.0%64414 - Insurance - General Liability 1,080 1,300 220 20.4%64415 - Insurance - Public Officials and Employment Liabil 900 1,100 200 22.2%64416 - Insurance - Property Damage 2,300 2,000 (300) -13.0%64417 - Insurance - Excess Liability 950 1,100 150 15.8%
64.0 - Other Expenses Total 26,930 26,800 (130) -0.5%1120 - Administrative Support Total 396,780 404,800 8,020 2.0%
1130 - Human Resources Administration61.0 - Employee Services
61110 - Regular Pay 166,300 171,200 4,900 2.9%61120 - Paid Time Off 6,400 6,600 200 3.1%61300 - Overtime - Regular 500 500 - 0.0%61400 - Education Assistance 1,000 2,000 1,000 100.0%61410 - Wellness Program 1,000 1,000 - 0.0%61700 - Flexible Leave 1,900 1,900 - 0.0%61705 - Management Leave 3,000 3,100 100 3.3%61815 - Auto Allowance 6,000 6,000 - 0.0%61816 - Cell Phone 1,000 1,100 100 10.0%61822 - PERS Employer Contribution 17,800 19,600 1,800 10.1%61823 - PERS EPMC 11,700 8,600 (3,100) -26.5%
Page 36 of 110
Category 2013 2014 BUDGET
2014 2015 PROPOSED
Increase / (Decrease)
% Change
Salinas Valley Solid Waste AuthorityProposed Budget Worksheets
FY 2014-15
61824 - OPEB Expense - 5,200 5,200 61825 - Medicare 2,500 2,500 - 0.0%61831 - Health Insurance 36,900 38,700 1,800 4.9%61833 - Long-Term Disability 800 900 100 12.5%61834 - Unemployment 1,600 800 (800) -50.0%61836 - Life Insurance 600 700 100 16.7%61837 - Insurance - Workers Compensation 1,200 800 (400) -33.3%
61.0 - Employee Services Total 260,200 271,200 11,000 4.2%63.0 - Contract Services
63116 - Cell Phones 600 600 - 0.0%63510 - Legal Services 20,500 20,000 (500) -2.4%63521 - HR Consultants - Comp. Study - 25,000 25,000 63522 - HR Investigations, Testing 500 1,300 800 160.0%63580 - Safety Program/Consulting 2,800 5,000 2,200 78.6%63598 - FSA Service Fees 100 100 - 0.0%63599 - EAP Service Fee 300 300 - 0.0%63679 - Employee Evaluations Software Support 2,000 2,000 - 0.0%61130 - Safety Awards 7,000 7,000 - 0.0%63520 - Recruitment Services 800 - (800) -100.0%
63.0 - Contract Services Total 34,600 61,300 26,700 77.2%62.0 - Supplies
62810 - Software/License Renewals 600 500 (100) -16.7%62.0 - Supplies Total 600 500 (100) -16.7%
64.0 - Other Expenses64110 - Advertising - Recruitments 500 1,500 1,000 200.0%64200 - Conferences/Meetings 5,500 6,000 500 9.1%64240 - Employee Recognition 4,300 4,300 - 0.0%64250 - Training 13,000 12,000 (1,000) -7.7%64310 - Association Memberships 2,000 2,000 - 0.0%64320 - Publications & Trade Journals 1,500 2,000 500 33.3%64411 - Insurance - Commercial Auto 710 900 190 26.8%64412 - Insurance - Crime 400 400 - 0.0%64415 - Insurance - Public Officials and Employment Liabil 900 1,100 200 22.2%
64.0 - Other Expenses Total 28,810 30,200 1,390 4.8%1130 - Human Resources Administration Total 324,210 363,200 38,990 12.0%
1140 - Clerk of the Board61.0 - Employee Services
61110 - Regular Pay 72,400 74,600 2,200 3.0%61115 - Board Member Stipends 12,500 17,400 4,900 39.2%61120 - Paid Time Off 2,800 2,900 100 3.6%61300 - Overtime - Regular 500 500 - 0.0%61400 - Education Assistance 500 - (500) -100.0%61410 - Wellness Program 500 500 - 0.0%61700 - Flexible Leave 2,100 2,200 100 4.8%61822 - PERS Employer Contribution 7,800 8,600 800 10.3%61823 - PERS EPMC 5,100 3,800 (1,300) -25.5%61824 - OPEB Expense - 2,300 2,300 61825 - Medicare 1,100 1,400 300 27.3%61826 - FICA 900 1,100 200 22.2%61831 - Health Insurance 21,000 22,000 1,000 4.8%61833 - Long-Term Disability 400 400 - 0.0%61834 - Unemployment 900 1,400 500 55.6%61836 - Life Insurance 300 300 - 0.0%61837 - Insurance - Workers Compensation 600 500 (100) -16.7%
61.0 - Employee Services Total 129,400 139,900 10,500 8.1%63.0 - Contract Services
Page 37 of 110
Category 2013 2014 BUDGET
2014 2015 PROPOSED
Increase / (Decrease)
% Change
Salinas Valley Solid Waste AuthorityProposed Budget Worksheets
FY 2014-15
63250 - Exterminator Service 662 700 38 5.7%63565 - Records Management Disposal Service 400 400 - 0.0%63598 - FSA Service Fees 50 100 50 100.0%63599 - EAP Service Fee 150 150 - 0.0%63672 - Laserfiche Support 7,800 7,200 (600) -7.7%63760 - Interpreting Services 3,700 3,500 (200) -5.4%
63.0 - Contract Services Total 12,762 12,050 (712) -5.6%62.0 - Supplies
62810 - Software/License Renewals 300 300 - 0.0%62915 - Minor Computer Equipment 988 1,000 12 1.2%
62.0 - Supplies Total 1,288 1,300 12 0.9%64.0 - Other Expenses
64100 - Advertising/Public Notices 3,900 4,000 100 2.6%64200 - Conferences/Meetings 1,500 1,500 - 0.0%64210 - Board Meeting Supplies 3,000 3,000 - 0.0%64220 - Board Retreat 9,500 6,500 (3,000) -31.6%64225 - Confrences/Meetings - Boardmembers 5,400 5,000 (400) -7.4%64250 - Training 1,000 1,000 - 0.0%64310 - Association Memberships 600 600 - 0.0%64412 - Insurance - Crime 200 200 - 0.0%64415 - Insurance - Public Officials and Employment Liabil 450 600 150 33.3%
64.0 - Other Expenses Total 25,550 22,400 (3,150) -12.3%1140 - Clerk of the Board Total 169,000 175,650 6,650 3.9%
1200 - Finance Administration61.0 - Employee Services
61110 - Regular Pay 356,700 369,400 12,700 3.6%61120 - Paid Time Off 13,200 14,300 1,100 8.3%61300 - Overtime - Regular 2,500 2,500 - 0.0%61400 - Education Assistance 2,000 1,000 (1,000) -50.0%61410 - Wellness Program 2,000 2,000 - 0.0%61700 - Flexible Leave 6,600 6,800 200 3.0%61705 - Management Leave 3,300 3,900 600 18.2%61815 - Auto Allowance 6,000 6,000 - 0.0%61816 - Cell Phone 1,600 1,800 200 12.5%61822 - PERS Employer Contribution 36,600 42,300 5,700 15.6%61823 - PERS EPMC 24,000 18,500 (5,500) -22.9%61824 - OPEB Expense - 11,100 11,100 61825 - Medicare 5,000 5,400 400 8.0%61831 - Health Insurance 79,900 74,300 (5,600) -7.0%61833 - Long-Term Disability 1,600 1,800 200 12.5%61834 - Unemployment 2,200 1,600 (600) -27.3%61836 - Life Insurance 1,200 1,400 200 16.7%61837 - Insurance - Workers Compensation 2,400 1,700 (700) -29.2%
61.0 - Employee Services Total 546,800 565,800 19,000 3.5%63.0 - Contract Services
63125 - Internet Services 2,500 2,500 - 0.0%63126 - Exchange Hosting Services 3,000 3,000 - 0.0%63127 - Network Access 820 800 (20) -2.4%63150 - Overnight Shipments 200 200 - 0.0%63430 - Equipment Maintenance - 600 600 63530 - Audit Services 22,400 22,400 - 0.0%63570 - Bank of NY -1997 Series A Bond 5,100 5,100 - 0.0%63571 - Bond Continuing Disclosure Services 1,900 1,900 - 0.0%63595 - Returned Check Expense 500 400 (100) -20.0%63596 - Bank Fees 3,600 3,600 - 0.0%63598 - FSA Service Fees 200 200 - 0.0%
Page 38 of 110
Category 2013 2014 BUDGET
2014 2015 PROPOSED
Increase / (Decrease)
% Change
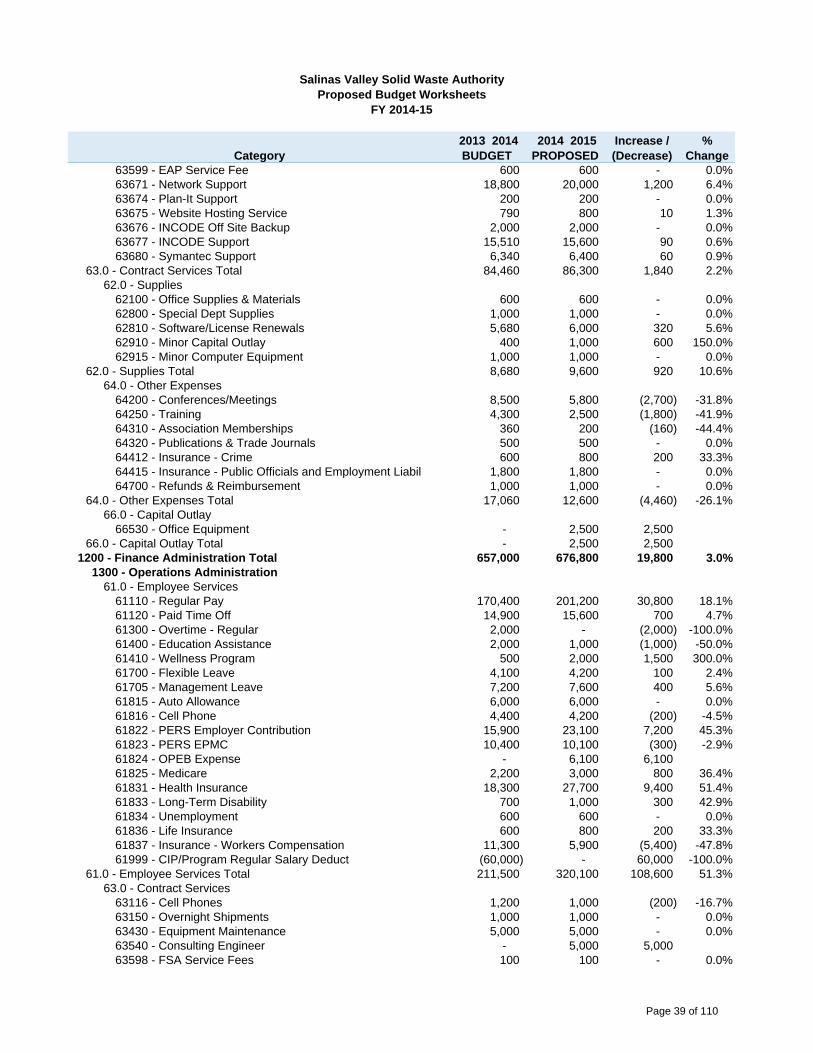
Salinas Valley Solid Waste AuthorityProposed Budget Worksheets
FY 2014-15
63599 - EAP Service Fee 600 600 - 0.0%63671 - Network Support 18,800 20,000 1,200 6.4%63674 - Plan-It Support 200 200 - 0.0%63675 - Website Hosting Service 790 800 10 1.3%63676 - INCODE Off Site Backup 2,000 2,000 - 0.0%63677 - INCODE Support 15,510 15,600 90 0.6%63680 - Symantec Support 6,340 6,400 60 0.9%
63.0 - Contract Services Total 84,460 86,300 1,840 2.2%62.0 - Supplies
62100 - Office Supplies & Materials 600 600 - 0.0%62800 - Special Dept Supplies 1,000 1,000 - 0.0%62810 - Software/License Renewals 5,680 6,000 320 5.6%62910 - Minor Capital Outlay 400 1,000 600 150.0%62915 - Minor Computer Equipment 1,000 1,000 - 0.0%
62.0 - Supplies Total 8,680 9,600 920 10.6%64.0 - Other Expenses
64200 - Conferences/Meetings 8,500 5,800 (2,700) -31.8%64250 - Training 4,300 2,500 (1,800) -41.9%64310 - Association Memberships 360 200 (160) -44.4%64320 - Publications & Trade Journals 500 500 - 0.0%64412 - Insurance - Crime 600 800 200 33.3%64415 - Insurance - Public Officials and Employment Liabil 1,800 1,800 - 0.0%64700 - Refunds & Reimbursement 1,000 1,000 - 0.0%
64.0 - Other Expenses Total 17,060 12,600 (4,460) -26.1%66.0 - Capital Outlay
66530 - Office Equipment - 2,500 2,500 66.0 - Capital Outlay Total - 2,500 2,500
1200 - Finance Administration Total 657,000 676,800 19,800 3.0%1300 - Operations Administration
61.0 - Employee Services61110 - Regular Pay 170,400 201,200 30,800 18.1%61120 - Paid Time Off 14,900 15,600 700 4.7%61300 - Overtime - Regular 2,000 - (2,000) -100.0%61400 - Education Assistance 2,000 1,000 (1,000) -50.0%61410 - Wellness Program 500 2,000 1,500 300.0%61700 - Flexible Leave 4,100 4,200 100 2.4%61705 - Management Leave 7,200 7,600 400 5.6%61815 - Auto Allowance 6,000 6,000 - 0.0%61816 - Cell Phone 4,400 4,200 (200) -4.5%61822 - PERS Employer Contribution 15,900 23,100 7,200 45.3%61823 - PERS EPMC 10,400 10,100 (300) -2.9%61824 - OPEB Expense - 6,100 6,100 61825 - Medicare 2,200 3,000 800 36.4%61831 - Health Insurance 18,300 27,700 9,400 51.4%61833 - Long-Term Disability 700 1,000 300 42.9%61834 - Unemployment 600 600 - 0.0%61836 - Life Insurance 600 800 200 33.3%61837 - Insurance - Workers Compensation 11,300 5,900 (5,400) -47.8%61999 - CIP/Program Regular Salary Deduct (60,000) - 60,000 -100.0%
61.0 - Employee Services Total 211,500 320,100 108,600 51.3%63.0 - Contract Services
63116 - Cell Phones 1,200 1,000 (200) -16.7%63150 - Overnight Shipments 1,000 1,000 - 0.0%63430 - Equipment Maintenance 5,000 5,000 - 0.0%63540 - Consulting Engineer - 5,000 5,000 63598 - FSA Service Fees 100 100 - 0.0%
Page 39 of 110
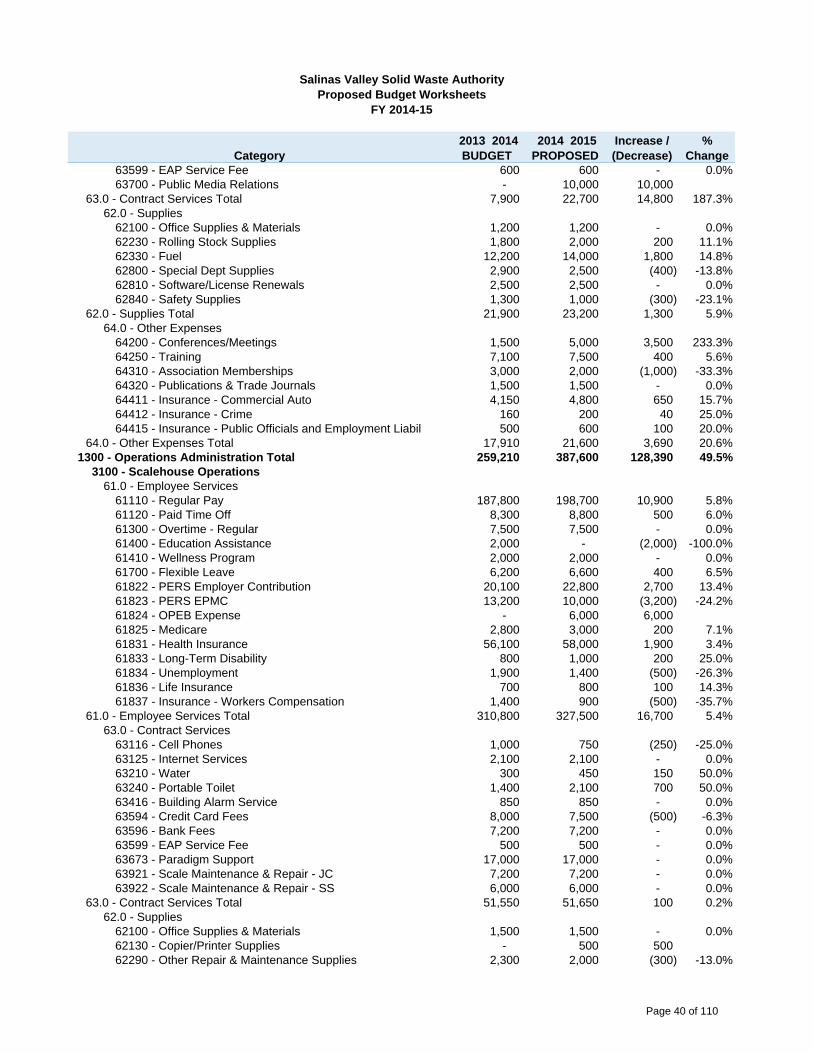
Category 2013 2014 BUDGET
2014 2015 PROPOSED
Increase / (Decrease)
% Change
Salinas Valley Solid Waste AuthorityProposed Budget Worksheets
FY 2014-15
63599 - EAP Service Fee 600 600 - 0.0%63700 - Public Media Relations - 10,000 10,000
63.0 - Contract Services Total 7,900 22,700 14,800 187.3%62.0 - Supplies
62100 - Office Supplies & Materials 1,200 1,200 - 0.0%62230 - Rolling Stock Supplies 1,800 2,000 200 11.1%62330 - Fuel 12,200 14,000 1,800 14.8%62800 - Special Dept Supplies 2,900 2,500 (400) -13.8%62810 - Software/License Renewals 2,500 2,500 - 0.0%62840 - Safety Supplies 1,300 1,000 (300) -23.1%
62.0 - Supplies Total 21,900 23,200 1,300 5.9%64.0 - Other Expenses
64200 - Conferences/Meetings 1,500 5,000 3,500 233.3%64250 - Training 7,100 7,500 400 5.6%64310 - Association Memberships 3,000 2,000 (1,000) -33.3%64320 - Publications & Trade Journals 1,500 1,500 - 0.0%64411 - Insurance - Commercial Auto 4,150 4,800 650 15.7%64412 - Insurance - Crime 160 200 40 25.0%64415 - Insurance - Public Officials and Employment Liabil 500 600 100 20.0%
64.0 - Other Expenses Total 17,910 21,600 3,690 20.6%1300 - Operations Administration Total 259,210 387,600 128,390 49.5%
3100 - Scalehouse Operations61.0 - Employee Services
61110 - Regular Pay 187,800 198,700 10,900 5.8%61120 - Paid Time Off 8,300 8,800 500 6.0%61300 - Overtime - Regular 7,500 7,500 - 0.0%61400 - Education Assistance 2,000 - (2,000) -100.0%61410 - Wellness Program 2,000 2,000 - 0.0%61700 - Flexible Leave 6,200 6,600 400 6.5%61822 - PERS Employer Contribution 20,100 22,800 2,700 13.4%61823 - PERS EPMC 13,200 10,000 (3,200) -24.2%61824 - OPEB Expense - 6,000 6,000 61825 - Medicare 2,800 3,000 200 7.1%61831 - Health Insurance 56,100 58,000 1,900 3.4%61833 - Long-Term Disability 800 1,000 200 25.0%61834 - Unemployment 1,900 1,400 (500) -26.3%61836 - Life Insurance 700 800 100 14.3%61837 - Insurance - Workers Compensation 1,400 900 (500) -35.7%
61.0 - Employee Services Total 310,800 327,500 16,700 5.4%63.0 - Contract Services
63116 - Cell Phones 1,000 750 (250) -25.0%63125 - Internet Services 2,100 2,100 - 0.0%63210 - Water 300 450 150 50.0%63240 - Portable Toilet 1,400 2,100 700 50.0%63416 - Building Alarm Service 850 850 - 0.0%63594 - Credit Card Fees 8,000 7,500 (500) -6.3%63596 - Bank Fees 7,200 7,200 - 0.0%63599 - EAP Service Fee 500 500 - 0.0%63673 - Paradigm Support 17,000 17,000 - 0.0%63921 - Scale Maintenance & Repair - JC 7,200 7,200 - 0.0%63922 - Scale Maintenance & Repair - SS 6,000 6,000 - 0.0%
63.0 - Contract Services Total 51,550 51,650 100 0.2%62.0 - Supplies
62100 - Office Supplies & Materials 1,500 1,500 - 0.0%62130 - Copier/Printer Supplies - 500 500 62290 - Other Repair & Maintenance Supplies 2,300 2,000 (300) -13.0%
Page 40 of 110
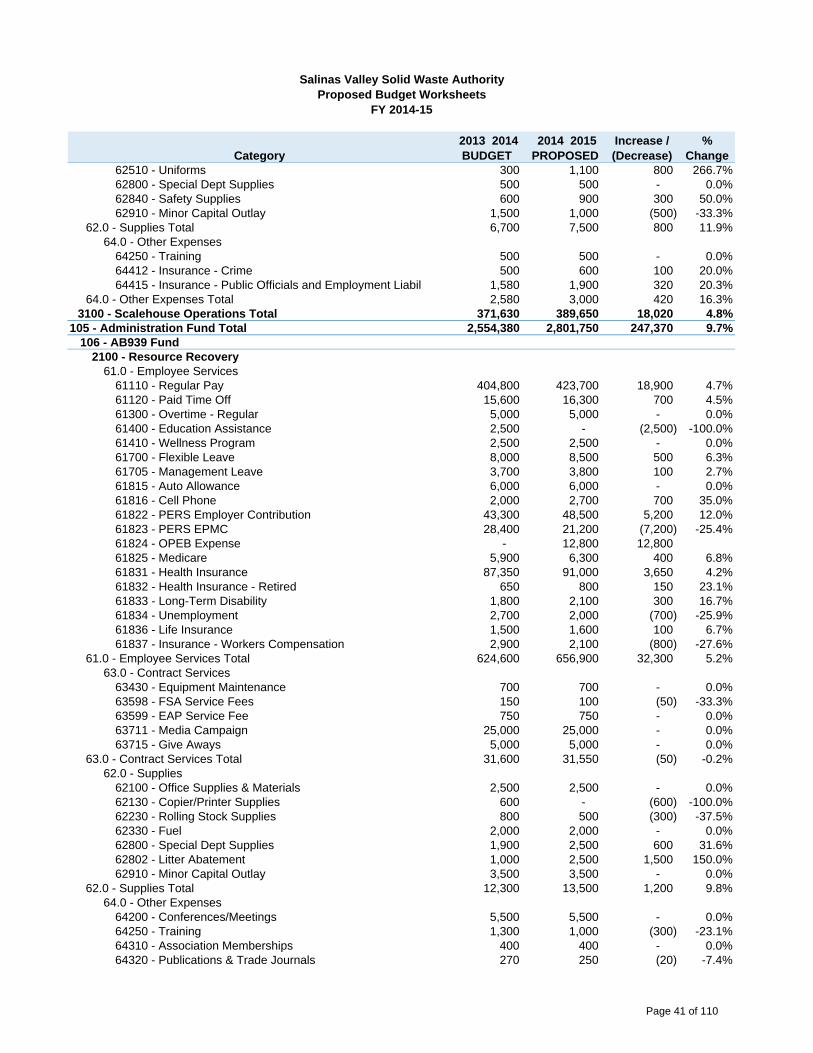
Category 2013 2014 BUDGET
2014 2015 PROPOSED
Increase / (Decrease)
% Change
Salinas Valley Solid Waste AuthorityProposed Budget Worksheets
FY 2014-15
62510 - Uniforms 300 1,100 800 266.7%62800 - Special Dept Supplies 500 500 - 0.0%62840 - Safety Supplies 600 900 300 50.0%62910 - Minor Capital Outlay 1,500 1,000 (500) -33.3%
62.0 - Supplies Total 6,700 7,500 800 11.9%64.0 - Other Expenses
64250 - Training 500 500 - 0.0%64412 - Insurance - Crime 500 600 100 20.0%64415 - Insurance - Public Officials and Employment Liabil 1,580 1,900 320 20.3%
64.0 - Other Expenses Total 2,580 3,000 420 16.3%3100 - Scalehouse Operations Total 371,630 389,650 18,020 4.8%
105 - Administration Fund Total 2,554,380 2,801,750 247,370 9.7%106 - AB939 Fund
2100 - Resource Recovery61.0 - Employee Services
61110 - Regular Pay 404,800 423,700 18,900 4.7%61120 - Paid Time Off 15,600 16,300 700 4.5%61300 - Overtime - Regular 5,000 5,000 - 0.0%61400 - Education Assistance 2,500 - (2,500) -100.0%61410 - Wellness Program 2,500 2,500 - 0.0%61700 - Flexible Leave 8,000 8,500 500 6.3%61705 - Management Leave 3,700 3,800 100 2.7%61815 - Auto Allowance 6,000 6,000 - 0.0%61816 - Cell Phone 2,000 2,700 700 35.0%61822 - PERS Employer Contribution 43,300 48,500 5,200 12.0%61823 - PERS EPMC 28,400 21,200 (7,200) -25.4%61824 - OPEB Expense - 12,800 12,800 61825 - Medicare 5,900 6,300 400 6.8%61831 - Health Insurance 87,350 91,000 3,650 4.2%61832 - Health Insurance - Retired 650 800 150 23.1%61833 - Long-Term Disability 1,800 2,100 300 16.7%61834 - Unemployment 2,700 2,000 (700) -25.9%61836 - Life Insurance 1,500 1,600 100 6.7%61837 - Insurance - Workers Compensation 2,900 2,100 (800) -27.6%
61.0 - Employee Services Total 624,600 656,900 32,300 5.2%63.0 - Contract Services
63430 - Equipment Maintenance 700 700 - 0.0%63598 - FSA Service Fees 150 100 (50) -33.3%63599 - EAP Service Fee 750 750 - 0.0%63711 - Media Campaign 25,000 25,000 - 0.0%63715 - Give Aways 5,000 5,000 - 0.0%
63.0 - Contract Services Total 31,600 31,550 (50) -0.2%62.0 - Supplies
62100 - Office Supplies & Materials 2,500 2,500 - 0.0%62130 - Copier/Printer Supplies 600 - (600) -100.0%62230 - Rolling Stock Supplies 800 500 (300) -37.5%62330 - Fuel 2,000 2,000 - 0.0%62800 - Special Dept Supplies 1,900 2,500 600 31.6%62802 - Litter Abatement 1,000 2,500 1,500 150.0%62910 - Minor Capital Outlay 3,500 3,500 - 0.0%
62.0 - Supplies Total 12,300 13,500 1,200 9.8%64.0 - Other Expenses
64200 - Conferences/Meetings 5,500 5,500 - 0.0%64250 - Training 1,300 1,000 (300) -23.1%64310 - Association Memberships 400 400 - 0.0%64320 - Publications & Trade Journals 270 250 (20) -7.4%
Page 41 of 110
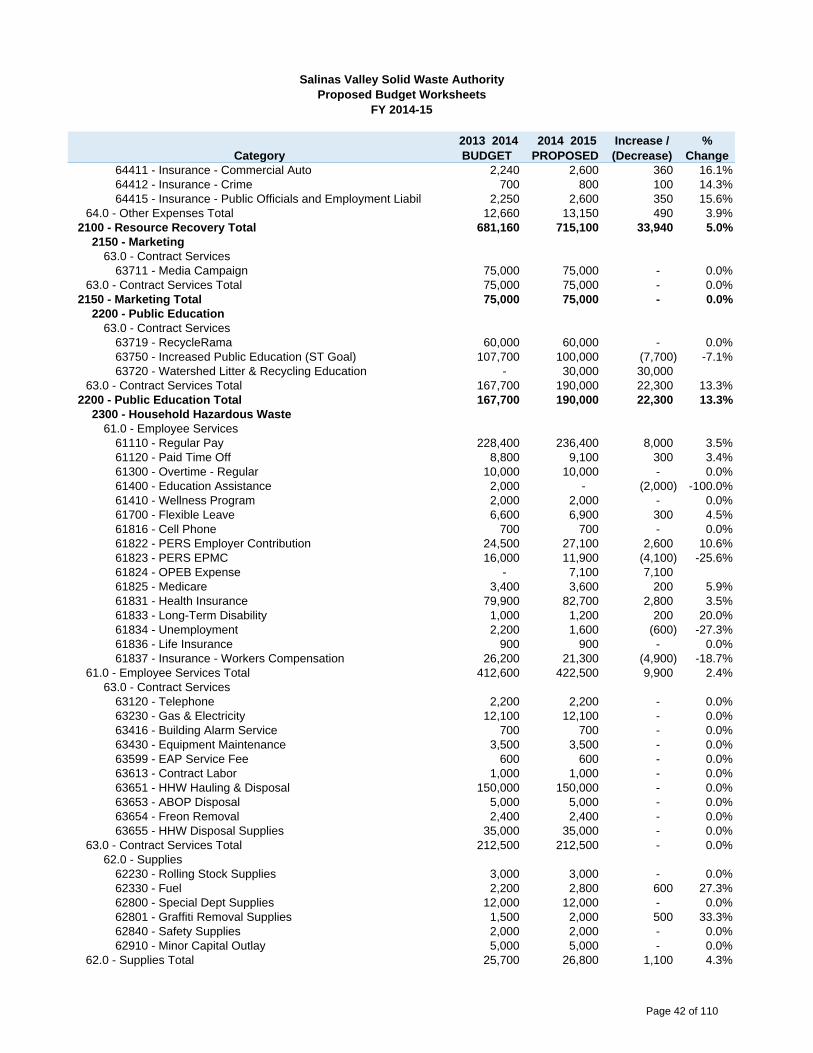
Category 2013 2014 BUDGET
2014 2015 PROPOSED
Increase / (Decrease)
% Change
Salinas Valley Solid Waste AuthorityProposed Budget Worksheets
FY 2014-15
64411 - Insurance - Commercial Auto 2,240 2,600 360 16.1%64412 - Insurance - Crime 700 800 100 14.3%64415 - Insurance - Public Officials and Employment Liabil 2,250 2,600 350 15.6%
64.0 - Other Expenses Total 12,660 13,150 490 3.9%2100 - Resource Recovery Total 681,160 715,100 33,940 5.0%
2150 - Marketing63.0 - Contract Services
63711 - Media Campaign 75,000 75,000 - 0.0%63.0 - Contract Services Total 75,000 75,000 - 0.0%
2150 - Marketing Total 75,000 75,000 - 0.0%2200 - Public Education
63.0 - Contract Services63719 - RecycleRama 60,000 60,000 - 0.0%63750 - Increased Public Education (ST Goal) 107,700 100,000 (7,700) -7.1%63720 - Watershed Litter & Recycling Education - 30,000 30,000
63.0 - Contract Services Total 167,700 190,000 22,300 13.3%2200 - Public Education Total 167,700 190,000 22,300 13.3%
2300 - Household Hazardous Waste61.0 - Employee Services
61110 - Regular Pay 228,400 236,400 8,000 3.5%61120 - Paid Time Off 8,800 9,100 300 3.4%61300 - Overtime - Regular 10,000 10,000 - 0.0%61400 - Education Assistance 2,000 - (2,000) -100.0%61410 - Wellness Program 2,000 2,000 - 0.0%61700 - Flexible Leave 6,600 6,900 300 4.5%61816 - Cell Phone 700 700 - 0.0%61822 - PERS Employer Contribution 24,500 27,100 2,600 10.6%61823 - PERS EPMC 16,000 11,900 (4,100) -25.6%61824 - OPEB Expense - 7,100 7,100 61825 - Medicare 3,400 3,600 200 5.9%61831 - Health Insurance 79,900 82,700 2,800 3.5%61833 - Long-Term Disability 1,000 1,200 200 20.0%61834 - Unemployment 2,200 1,600 (600) -27.3%61836 - Life Insurance 900 900 - 0.0%61837 - Insurance - Workers Compensation 26,200 21,300 (4,900) -18.7%
61.0 - Employee Services Total 412,600 422,500 9,900 2.4%63.0 - Contract Services
63120 - Telephone 2,200 2,200 - 0.0%63230 - Gas & Electricity 12,100 12,100 - 0.0%63416 - Building Alarm Service 700 700 - 0.0%63430 - Equipment Maintenance 3,500 3,500 - 0.0%63599 - EAP Service Fee 600 600 - 0.0%63613 - Contract Labor 1,000 1,000 - 0.0%63651 - HHW Hauling & Disposal 150,000 150,000 - 0.0%63653 - ABOP Disposal 5,000 5,000 - 0.0%63654 - Freon Removal 2,400 2,400 - 0.0%63655 - HHW Disposal Supplies 35,000 35,000 - 0.0%
63.0 - Contract Services Total 212,500 212,500 - 0.0%62.0 - Supplies
62230 - Rolling Stock Supplies 3,000 3,000 - 0.0%62330 - Fuel 2,200 2,800 600 27.3%62800 - Special Dept Supplies 12,000 12,000 - 0.0%62801 - Graffiti Removal Supplies 1,500 2,000 500 33.3%62840 - Safety Supplies 2,000 2,000 - 0.0%62910 - Minor Capital Outlay 5,000 5,000 - 0.0%
62.0 - Supplies Total 25,700 26,800 1,100 4.3%
Page 42 of 110
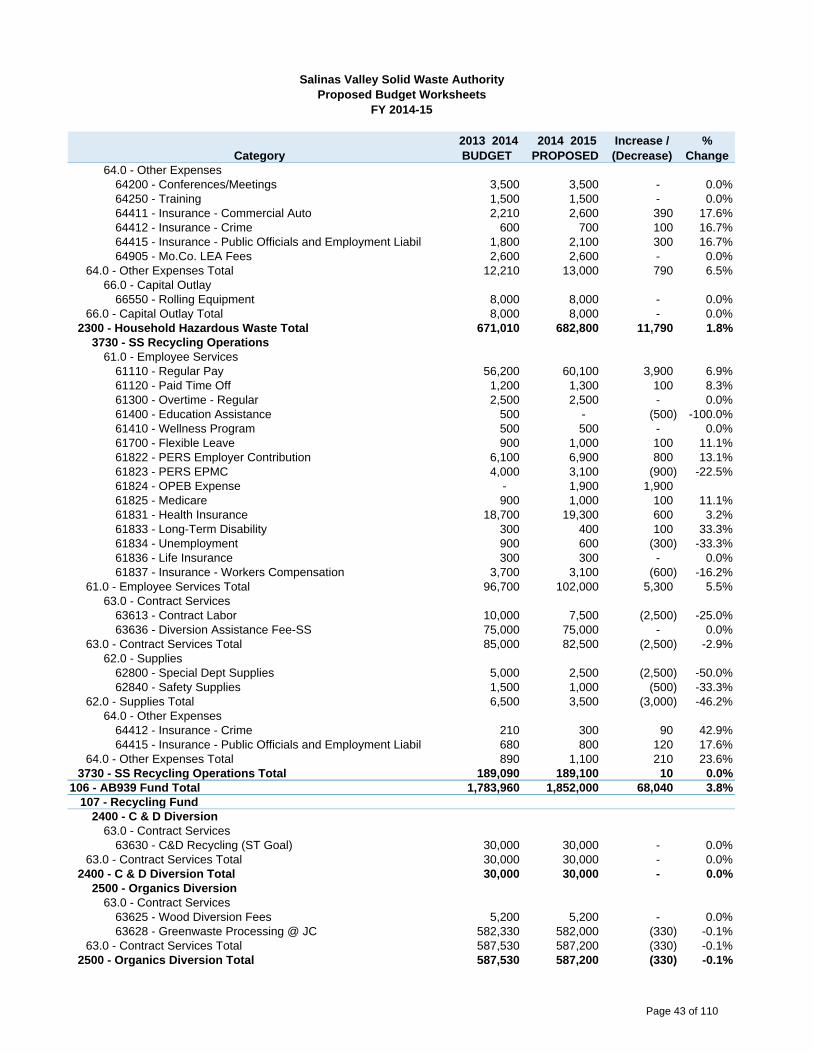
Category 2013 2014 BUDGET
2014 2015 PROPOSED
Increase / (Decrease)
% Change
Salinas Valley Solid Waste AuthorityProposed Budget Worksheets
FY 2014-15
64.0 - Other Expenses64200 - Conferences/Meetings 3,500 3,500 - 0.0%64250 - Training 1,500 1,500 - 0.0%64411 - Insurance - Commercial Auto 2,210 2,600 390 17.6%64412 - Insurance - Crime 600 700 100 16.7%64415 - Insurance - Public Officials and Employment Liabil 1,800 2,100 300 16.7%64905 - Mo.Co. LEA Fees 2,600 2,600 - 0.0%
64.0 - Other Expenses Total 12,210 13,000 790 6.5%66.0 - Capital Outlay
66550 - Rolling Equipment 8,000 8,000 - 0.0%66.0 - Capital Outlay Total 8,000 8,000 - 0.0%
2300 - Household Hazardous Waste Total 671,010 682,800 11,790 1.8%3730 - SS Recycling Operations
61.0 - Employee Services61110 - Regular Pay 56,200 60,100 3,900 6.9%61120 - Paid Time Off 1,200 1,300 100 8.3%61300 - Overtime - Regular 2,500 2,500 - 0.0%61400 - Education Assistance 500 - (500) -100.0%61410 - Wellness Program 500 500 - 0.0%61700 - Flexible Leave 900 1,000 100 11.1%61822 - PERS Employer Contribution 6,100 6,900 800 13.1%61823 - PERS EPMC 4,000 3,100 (900) -22.5%61824 - OPEB Expense - 1,900 1,900 61825 - Medicare 900 1,000 100 11.1%61831 - Health Insurance 18,700 19,300 600 3.2%61833 - Long-Term Disability 300 400 100 33.3%61834 - Unemployment 900 600 (300) -33.3%61836 - Life Insurance 300 300 - 0.0%61837 - Insurance - Workers Compensation 3,700 3,100 (600) -16.2%
61.0 - Employee Services Total 96,700 102,000 5,300 5.5%63.0 - Contract Services
63613 - Contract Labor 10,000 7,500 (2,500) -25.0%63636 - Diversion Assistance Fee-SS 75,000 75,000 - 0.0%
63.0 - Contract Services Total 85,000 82,500 (2,500) -2.9%62.0 - Supplies
62800 - Special Dept Supplies 5,000 2,500 (2,500) -50.0%62840 - Safety Supplies 1,500 1,000 (500) -33.3%
62.0 - Supplies Total 6,500 3,500 (3,000) -46.2%64.0 - Other Expenses
64412 - Insurance - Crime 210 300 90 42.9%64415 - Insurance - Public Officials and Employment Liabil 680 800 120 17.6%
64.0 - Other Expenses Total 890 1,100 210 23.6%3730 - SS Recycling Operations Total 189,090 189,100 10 0.0%
106 - AB939 Fund Total 1,783,960 1,852,000 68,040 3.8%107 - Recycling Fund
2400 - C & D Diversion63.0 - Contract Services
63630 - C&D Recycling (ST Goal) 30,000 30,000 - 0.0%63.0 - Contract Services Total 30,000 30,000 - 0.0%
2400 - C & D Diversion Total 30,000 30,000 - 0.0%2500 - Organics Diversion
63.0 - Contract Services63625 - Wood Diversion Fees 5,200 5,200 - 0.0%63628 - Greenwaste Processing @ JC 582,330 582,000 (330) -0.1%
63.0 - Contract Services Total 587,530 587,200 (330) -0.1%2500 - Organics Diversion Total 587,530 587,200 (330) -0.1%
Page 43 of 110
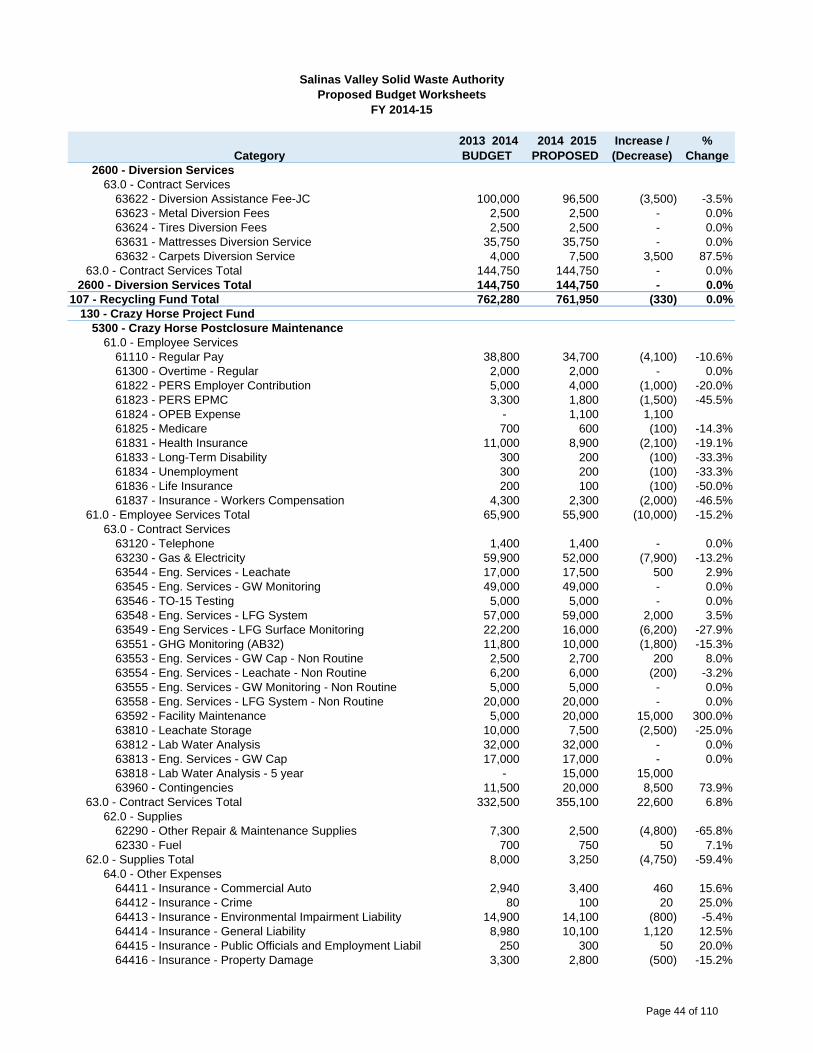
Category 2013 2014 BUDGET
2014 2015 PROPOSED
Increase / (Decrease)
% Change
Salinas Valley Solid Waste AuthorityProposed Budget Worksheets
FY 2014-15
2600 - Diversion Services63.0 - Contract Services
63622 - Diversion Assistance Fee-JC 100,000 96,500 (3,500) -3.5%63623 - Metal Diversion Fees 2,500 2,500 - 0.0%63624 - Tires Diversion Fees 2,500 2,500 - 0.0%63631 - Mattresses Diversion Service 35,750 35,750 - 0.0%63632 - Carpets Diversion Service 4,000 7,500 3,500 87.5%
63.0 - Contract Services Total 144,750 144,750 - 0.0%2600 - Diversion Services Total 144,750 144,750 - 0.0%
107 - Recycling Fund Total 762,280 761,950 (330) 0.0%130 - Crazy Horse Project Fund
5300 - Crazy Horse Postclosure Maintenance61.0 - Employee Services
61110 - Regular Pay 38,800 34,700 (4,100) -10.6%61300 - Overtime - Regular 2,000 2,000 - 0.0%61822 - PERS Employer Contribution 5,000 4,000 (1,000) -20.0%61823 - PERS EPMC 3,300 1,800 (1,500) -45.5%61824 - OPEB Expense - 1,100 1,100 61825 - Medicare 700 600 (100) -14.3%61831 - Health Insurance 11,000 8,900 (2,100) -19.1%61833 - Long-Term Disability 300 200 (100) -33.3%61834 - Unemployment 300 200 (100) -33.3%61836 - Life Insurance 200 100 (100) -50.0%61837 - Insurance - Workers Compensation 4,300 2,300 (2,000) -46.5%
61.0 - Employee Services Total 65,900 55,900 (10,000) -15.2%63.0 - Contract Services
63120 - Telephone 1,400 1,400 - 0.0%63230 - Gas & Electricity 59,900 52,000 (7,900) -13.2%63544 - Eng. Services - Leachate 17,000 17,500 500 2.9%63545 - Eng. Services - GW Monitoring 49,000 49,000 - 0.0%63546 - TO-15 Testing 5,000 5,000 - 0.0%63548 - Eng. Services - LFG System 57,000 59,000 2,000 3.5%63549 - Eng Services - LFG Surface Monitoring 22,200 16,000 (6,200) -27.9%63551 - GHG Monitoring (AB32) 11,800 10,000 (1,800) -15.3%63553 - Eng. Services - GW Cap - Non Routine 2,500 2,700 200 8.0%63554 - Eng. Services - Leachate - Non Routine 6,200 6,000 (200) -3.2%63555 - Eng. Services - GW Monitoring - Non Routine 5,000 5,000 - 0.0%63558 - Eng. Services - LFG System - Non Routine 20,000 20,000 - 0.0%63592 - Facility Maintenance 5,000 20,000 15,000 300.0%63810 - Leachate Storage 10,000 7,500 (2,500) -25.0%63812 - Lab Water Analysis 32,000 32,000 - 0.0%63813 - Eng. Services - GW Cap 17,000 17,000 - 0.0%63818 - Lab Water Analysis - 5 year - 15,000 15,000 63960 - Contingencies 11,500 20,000 8,500 73.9%
63.0 - Contract Services Total 332,500 355,100 22,600 6.8%62.0 - Supplies
62290 - Other Repair & Maintenance Supplies 7,300 2,500 (4,800) -65.8%62330 - Fuel 700 750 50 7.1%
62.0 - Supplies Total 8,000 3,250 (4,750) -59.4%64.0 - Other Expenses
64411 - Insurance - Commercial Auto 2,940 3,400 460 15.6%64412 - Insurance - Crime 80 100 20 25.0%64413 - Insurance - Environmental Impairment Liability 14,900 14,100 (800) -5.4%64414 - Insurance - General Liability 8,980 10,100 1,120 12.5%64415 - Insurance - Public Officials and Employment Liabil 250 300 50 20.0%64416 - Insurance - Property Damage 3,300 2,800 (500) -15.2%
Page 44 of 110
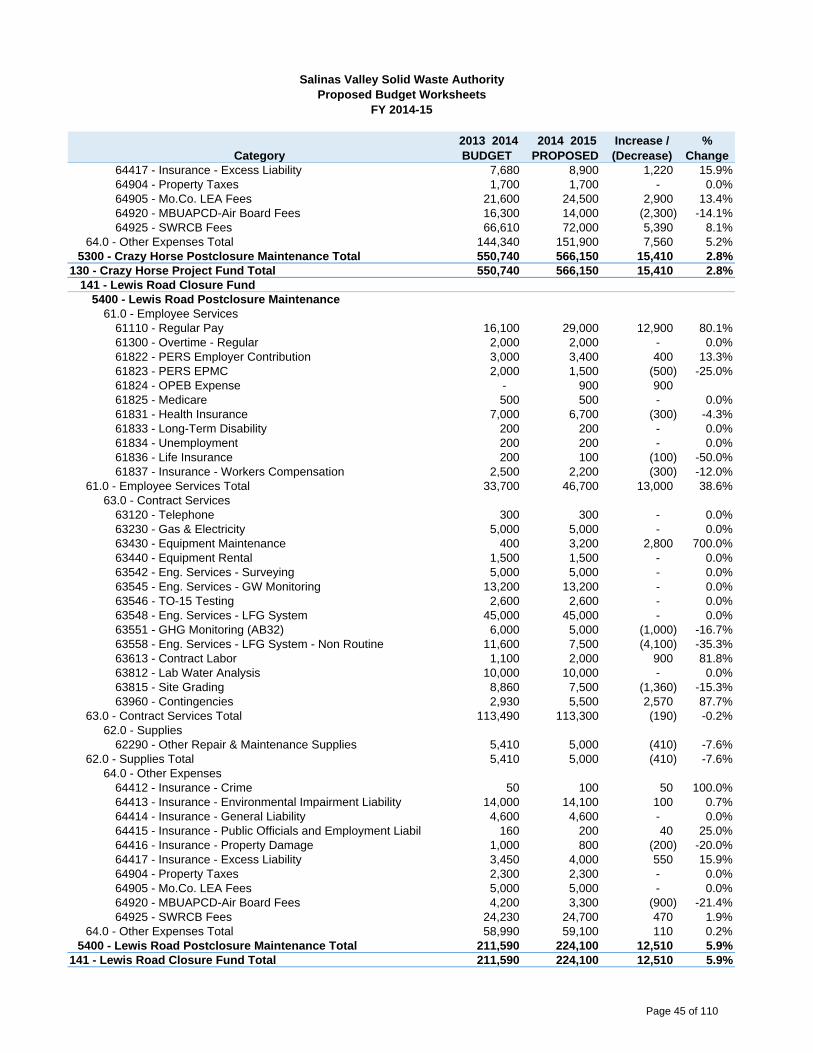
Category 2013 2014 BUDGET
2014 2015 PROPOSED
Increase / (Decrease)
% Change
Salinas Valley Solid Waste AuthorityProposed Budget Worksheets
FY 2014-15
64417 - Insurance - Excess Liability 7,680 8,900 1,220 15.9%64904 - Property Taxes 1,700 1,700 - 0.0%64905 - Mo.Co. LEA Fees 21,600 24,500 2,900 13.4%64920 - MBUAPCD-Air Board Fees 16,300 14,000 (2,300) -14.1%64925 - SWRCB Fees 66,610 72,000 5,390 8.1%
64.0 - Other Expenses Total 144,340 151,900 7,560 5.2%5300 - Crazy Horse Postclosure Maintenance Total 550,740 566,150 15,410 2.8%
130 - Crazy Horse Project Fund Total 550,740 566,150 15,410 2.8%141 - Lewis Road Closure Fund
5400 - Lewis Road Postclosure Maintenance61.0 - Employee Services
61110 - Regular Pay 16,100 29,000 12,900 80.1%61300 - Overtime - Regular 2,000 2,000 - 0.0%61822 - PERS Employer Contribution 3,000 3,400 400 13.3%61823 - PERS EPMC 2,000 1,500 (500) -25.0%61824 - OPEB Expense - 900 900 61825 - Medicare 500 500 - 0.0%61831 - Health Insurance 7,000 6,700 (300) -4.3%61833 - Long-Term Disability 200 200 - 0.0%61834 - Unemployment 200 200 - 0.0%61836 - Life Insurance 200 100 (100) -50.0%61837 - Insurance - Workers Compensation 2,500 2,200 (300) -12.0%
61.0 - Employee Services Total 33,700 46,700 13,000 38.6%63.0 - Contract Services
63120 - Telephone 300 300 - 0.0%63230 - Gas & Electricity 5,000 5,000 - 0.0%63430 - Equipment Maintenance 400 3,200 2,800 700.0%63440 - Equipment Rental 1,500 1,500 - 0.0%63542 - Eng. Services - Surveying 5,000 5,000 - 0.0%63545 - Eng. Services - GW Monitoring 13,200 13,200 - 0.0%63546 - TO-15 Testing 2,600 2,600 - 0.0%63548 - Eng. Services - LFG System 45,000 45,000 - 0.0%63551 - GHG Monitoring (AB32) 6,000 5,000 (1,000) -16.7%63558 - Eng. Services - LFG System - Non Routine 11,600 7,500 (4,100) -35.3%63613 - Contract Labor 1,100 2,000 900 81.8%63812 - Lab Water Analysis 10,000 10,000 - 0.0%63815 - Site Grading 8,860 7,500 (1,360) -15.3%63960 - Contingencies 2,930 5,500 2,570 87.7%
63.0 - Contract Services Total 113,490 113,300 (190) -0.2%62.0 - Supplies
62290 - Other Repair & Maintenance Supplies 5,410 5,000 (410) -7.6%62.0 - Supplies Total 5,410 5,000 (410) -7.6%
64.0 - Other Expenses64412 - Insurance - Crime 50 100 50 100.0%64413 - Insurance - Environmental Impairment Liability 14,000 14,100 100 0.7%64414 - Insurance - General Liability 4,600 4,600 - 0.0%64415 - Insurance - Public Officials and Employment Liabil 160 200 40 25.0%64416 - Insurance - Property Damage 1,000 800 (200) -20.0%64417 - Insurance - Excess Liability 3,450 4,000 550 15.9%64904 - Property Taxes 2,300 2,300 - 0.0%64905 - Mo.Co. LEA Fees 5,000 5,000 - 0.0%64920 - MBUAPCD-Air Board Fees 4,200 3,300 (900) -21.4%64925 - SWRCB Fees 24,230 24,700 470 1.9%
64.0 - Other Expenses Total 58,990 59,100 110 0.2%5400 - Lewis Road Postclosure Maintenance Total 211,590 224,100 12,510 5.9%
141 - Lewis Road Closure Fund Total 211,590 224,100 12,510 5.9%
Page 45 of 110
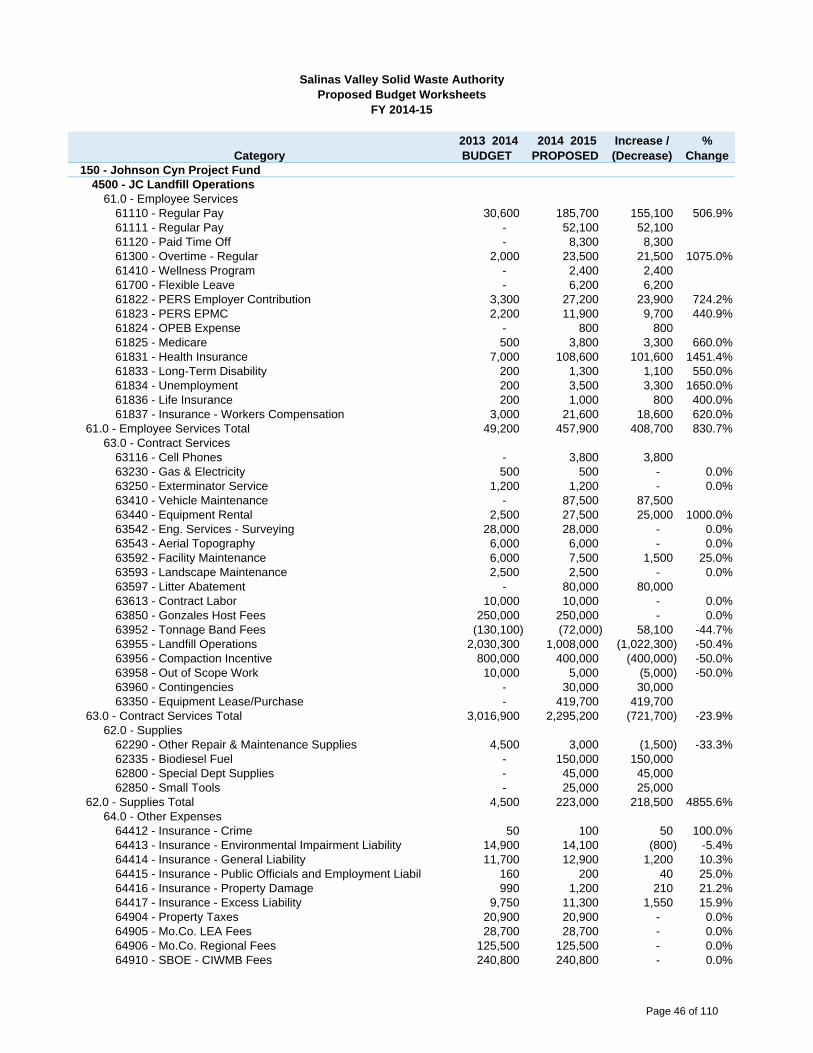
Category 2013 2014 BUDGET
2014 2015 PROPOSED
Increase / (Decrease)
% Change
Salinas Valley Solid Waste AuthorityProposed Budget Worksheets
FY 2014-15
150 - Johnson Cyn Project Fund4500 - JC Landfill Operations
61.0 - Employee Services61110 - Regular Pay 30,600 185,700 155,100 506.9%61111 - Regular Pay - 52,100 52,100 61120 - Paid Time Off - 8,300 8,300 61300 - Overtime - Regular 2,000 23,500 21,500 1075.0%61410 - Wellness Program - 2,400 2,400 61700 - Flexible Leave - 6,200 6,200 61822 - PERS Employer Contribution 3,300 27,200 23,900 724.2%61823 - PERS EPMC 2,200 11,900 9,700 440.9%61824 - OPEB Expense - 800 800 61825 - Medicare 500 3,800 3,300 660.0%61831 - Health Insurance 7,000 108,600 101,600 1451.4%61833 - Long-Term Disability 200 1,300 1,100 550.0%61834 - Unemployment 200 3,500 3,300 1650.0%61836 - Life Insurance 200 1,000 800 400.0%61837 - Insurance - Workers Compensation 3,000 21,600 18,600 620.0%
61.0 - Employee Services Total 49,200 457,900 408,700 830.7%63.0 - Contract Services
63116 - Cell Phones - 3,800 3,800 63230 - Gas & Electricity 500 500 - 0.0%63250 - Exterminator Service 1,200 1,200 - 0.0%63410 - Vehicle Maintenance - 87,500 87,500 63440 - Equipment Rental 2,500 27,500 25,000 1000.0%63542 - Eng. Services - Surveying 28,000 28,000 - 0.0%63543 - Aerial Topography 6,000 6,000 - 0.0%63592 - Facility Maintenance 6,000 7,500 1,500 25.0%63593 - Landscape Maintenance 2,500 2,500 - 0.0%63597 - Litter Abatement - 80,000 80,000 63613 - Contract Labor 10,000 10,000 - 0.0%63850 - Gonzales Host Fees 250,000 250,000 - 0.0%63952 - Tonnage Band Fees (130,100) (72,000) 58,100 -44.7%63955 - Landfill Operations 2,030,300 1,008,000 (1,022,300) -50.4%63956 - Compaction Incentive 800,000 400,000 (400,000) -50.0%63958 - Out of Scope Work 10,000 5,000 (5,000) -50.0%63960 - Contingencies - 30,000 30,000 63350 - Equipment Lease/Purchase - 419,700 419,700
63.0 - Contract Services Total 3,016,900 2,295,200 (721,700) -23.9%62.0 - Supplies
62290 - Other Repair & Maintenance Supplies 4,500 3,000 (1,500) -33.3%62335 - Biodiesel Fuel - 150,000 150,000 62800 - Special Dept Supplies - 45,000 45,000 62850 - Small Tools - 25,000 25,000
62.0 - Supplies Total 4,500 223,000 218,500 4855.6%64.0 - Other Expenses
64412 - Insurance - Crime 50 100 50 100.0%64413 - Insurance - Environmental Impairment Liability 14,900 14,100 (800) -5.4%64414 - Insurance - General Liability 11,700 12,900 1,200 10.3%64415 - Insurance - Public Officials and Employment Liabil 160 200 40 25.0%64416 - Insurance - Property Damage 990 1,200 210 21.2%64417 - Insurance - Excess Liability 9,750 11,300 1,550 15.9%64904 - Property Taxes 20,900 20,900 - 0.0%64905 - Mo.Co. LEA Fees 28,700 28,700 - 0.0%64906 - Mo.Co. Regional Fees 125,500 125,500 - 0.0%64910 - SBOE - CIWMB Fees 240,800 240,800 - 0.0%
Page 46 of 110
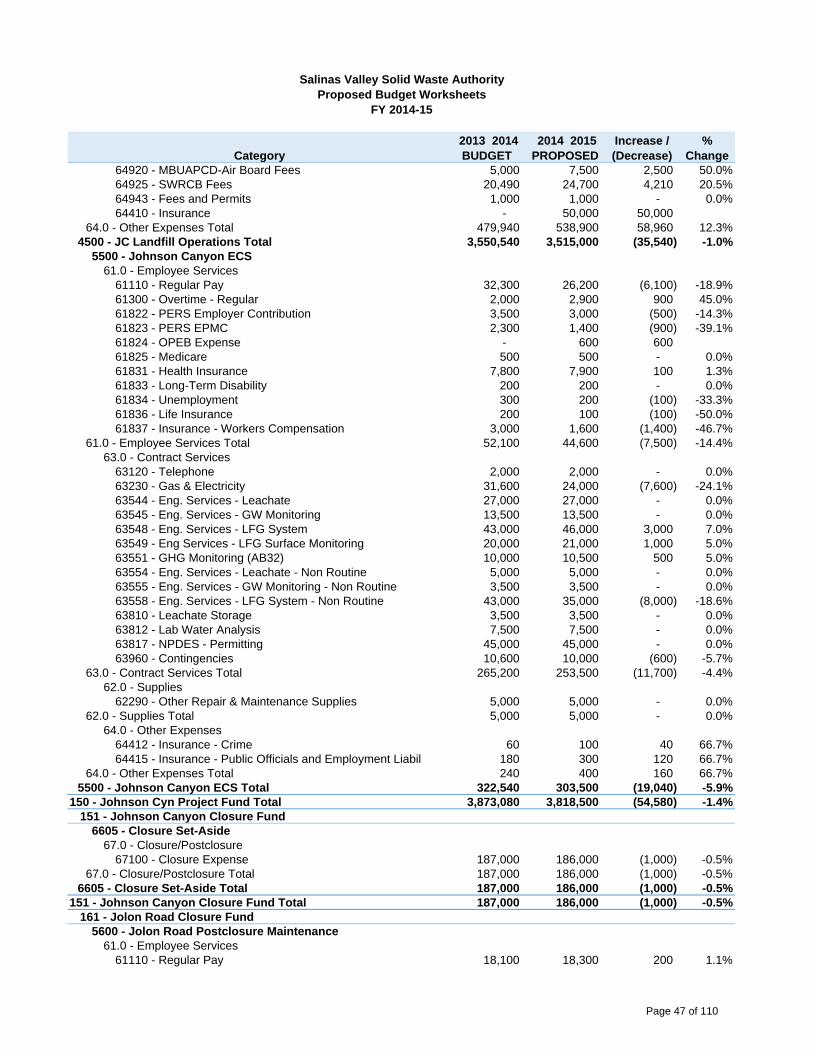
Category 2013 2014 BUDGET
2014 2015 PROPOSED
Increase / (Decrease)
% Change
Salinas Valley Solid Waste AuthorityProposed Budget Worksheets
FY 2014-15
64920 - MBUAPCD-Air Board Fees 5,000 7,500 2,500 50.0%64925 - SWRCB Fees 20,490 24,700 4,210 20.5%64943 - Fees and Permits 1,000 1,000 - 0.0%64410 - Insurance - 50,000 50,000
64.0 - Other Expenses Total 479,940 538,900 58,960 12.3%4500 - JC Landfill Operations Total 3,550,540 3,515,000 (35,540) -1.0%
5500 - Johnson Canyon ECS61.0 - Employee Services
61110 - Regular Pay 32,300 26,200 (6,100) -18.9%61300 - Overtime - Regular 2,000 2,900 900 45.0%61822 - PERS Employer Contribution 3,500 3,000 (500) -14.3%61823 - PERS EPMC 2,300 1,400 (900) -39.1%61824 - OPEB Expense - 600 600 61825 - Medicare 500 500 - 0.0%61831 - Health Insurance 7,800 7,900 100 1.3%61833 - Long-Term Disability 200 200 - 0.0%61834 - Unemployment 300 200 (100) -33.3%61836 - Life Insurance 200 100 (100) -50.0%61837 - Insurance - Workers Compensation 3,000 1,600 (1,400) -46.7%
61.0 - Employee Services Total 52,100 44,600 (7,500) -14.4%63.0 - Contract Services
63120 - Telephone 2,000 2,000 - 0.0%63230 - Gas & Electricity 31,600 24,000 (7,600) -24.1%63544 - Eng. Services - Leachate 27,000 27,000 - 0.0%63545 - Eng. Services - GW Monitoring 13,500 13,500 - 0.0%63548 - Eng. Services - LFG System 43,000 46,000 3,000 7.0%63549 - Eng Services - LFG Surface Monitoring 20,000 21,000 1,000 5.0%63551 - GHG Monitoring (AB32) 10,000 10,500 500 5.0%63554 - Eng. Services - Leachate - Non Routine 5,000 5,000 - 0.0%63555 - Eng. Services - GW Monitoring - Non Routine 3,500 3,500 - 0.0%63558 - Eng. Services - LFG System - Non Routine 43,000 35,000 (8,000) -18.6%63810 - Leachate Storage 3,500 3,500 - 0.0%63812 - Lab Water Analysis 7,500 7,500 - 0.0%63817 - NPDES - Permitting 45,000 45,000 - 0.0%63960 - Contingencies 10,600 10,000 (600) -5.7%
63.0 - Contract Services Total 265,200 253,500 (11,700) -4.4%62.0 - Supplies
62290 - Other Repair & Maintenance Supplies 5,000 5,000 - 0.0%62.0 - Supplies Total 5,000 5,000 - 0.0%
64.0 - Other Expenses64412 - Insurance - Crime 60 100 40 66.7%64415 - Insurance - Public Officials and Employment Liabil 180 300 120 66.7%
64.0 - Other Expenses Total 240 400 160 66.7%5500 - Johnson Canyon ECS Total 322,540 303,500 (19,040) -5.9%
150 - Johnson Cyn Project Fund Total 3,873,080 3,818,500 (54,580) -1.4%151 - Johnson Canyon Closure Fund
6605 - Closure Set-Aside67.0 - Closure/Postclosure
67100 - Closure Expense 187,000 186,000 (1,000) -0.5%67.0 - Closure/Postclosure Total 187,000 186,000 (1,000) -0.5%
6605 - Closure Set-Aside Total 187,000 186,000 (1,000) -0.5%151 - Johnson Canyon Closure Fund Total 187,000 186,000 (1,000) -0.5%
161 - Jolon Road Closure Fund5600 - Jolon Road Postclosure Maintenance
61.0 - Employee Services61110 - Regular Pay 18,100 18,300 200 1.1%
Page 47 of 110
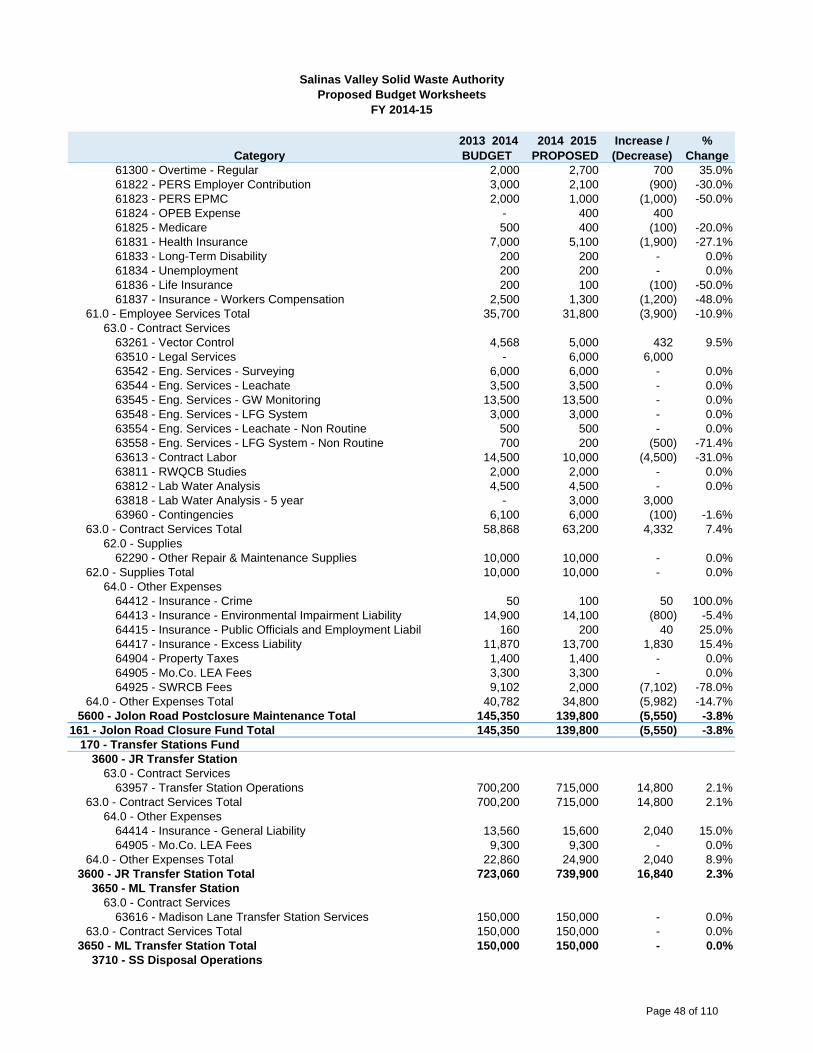
Category 2013 2014 BUDGET
2014 2015 PROPOSED
Increase / (Decrease)
% Change
Salinas Valley Solid Waste AuthorityProposed Budget Worksheets
FY 2014-15
61300 - Overtime - Regular 2,000 2,700 700 35.0%61822 - PERS Employer Contribution 3,000 2,100 (900) -30.0%61823 - PERS EPMC 2,000 1,000 (1,000) -50.0%61824 - OPEB Expense - 400 400 61825 - Medicare 500 400 (100) -20.0%61831 - Health Insurance 7,000 5,100 (1,900) -27.1%61833 - Long-Term Disability 200 200 - 0.0%61834 - Unemployment 200 200 - 0.0%61836 - Life Insurance 200 100 (100) -50.0%61837 - Insurance - Workers Compensation 2,500 1,300 (1,200) -48.0%
61.0 - Employee Services Total 35,700 31,800 (3,900) -10.9%63.0 - Contract Services
63261 - Vector Control 4,568 5,000 432 9.5%63510 - Legal Services - 6,000 6,000 63542 - Eng. Services - Surveying 6,000 6,000 - 0.0%63544 - Eng. Services - Leachate 3,500 3,500 - 0.0%63545 - Eng. Services - GW Monitoring 13,500 13,500 - 0.0%63548 - Eng. Services - LFG System 3,000 3,000 - 0.0%63554 - Eng. Services - Leachate - Non Routine 500 500 - 0.0%63558 - Eng. Services - LFG System - Non Routine 700 200 (500) -71.4%63613 - Contract Labor 14,500 10,000 (4,500) -31.0%63811 - RWQCB Studies 2,000 2,000 - 0.0%63812 - Lab Water Analysis 4,500 4,500 - 0.0%63818 - Lab Water Analysis - 5 year - 3,000 3,000 63960 - Contingencies 6,100 6,000 (100) -1.6%
63.0 - Contract Services Total 58,868 63,200 4,332 7.4%62.0 - Supplies
62290 - Other Repair & Maintenance Supplies 10,000 10,000 - 0.0%62.0 - Supplies Total 10,000 10,000 - 0.0%
64.0 - Other Expenses64412 - Insurance - Crime 50 100 50 100.0%64413 - Insurance - Environmental Impairment Liability 14,900 14,100 (800) -5.4%64415 - Insurance - Public Officials and Employment Liabil 160 200 40 25.0%64417 - Insurance - Excess Liability 11,870 13,700 1,830 15.4%64904 - Property Taxes 1,400 1,400 - 0.0%64905 - Mo.Co. LEA Fees 3,300 3,300 - 0.0%64925 - SWRCB Fees 9,102 2,000 (7,102) -78.0%
64.0 - Other Expenses Total 40,782 34,800 (5,982) -14.7%5600 - Jolon Road Postclosure Maintenance Total 145,350 139,800 (5,550) -3.8%
161 - Jolon Road Closure Fund Total 145,350 139,800 (5,550) -3.8%170 - Transfer Stations Fund
3600 - JR Transfer Station63.0 - Contract Services
63957 - Transfer Station Operations 700,200 715,000 14,800 2.1%63.0 - Contract Services Total 700,200 715,000 14,800 2.1%
64.0 - Other Expenses64414 - Insurance - General Liability 13,560 15,600 2,040 15.0%64905 - Mo.Co. LEA Fees 9,300 9,300 - 0.0%
64.0 - Other Expenses Total 22,860 24,900 2,040 8.9%3600 - JR Transfer Station Total 723,060 739,900 16,840 2.3%
3650 - ML Transfer Station63.0 - Contract Services
63616 - Madison Lane Transfer Station Services 150,000 150,000 - 0.0%63.0 - Contract Services Total 150,000 150,000 - 0.0%
3650 - ML Transfer Station Total 150,000 150,000 - 0.0%3710 - SS Disposal Operations
Page 48 of 110
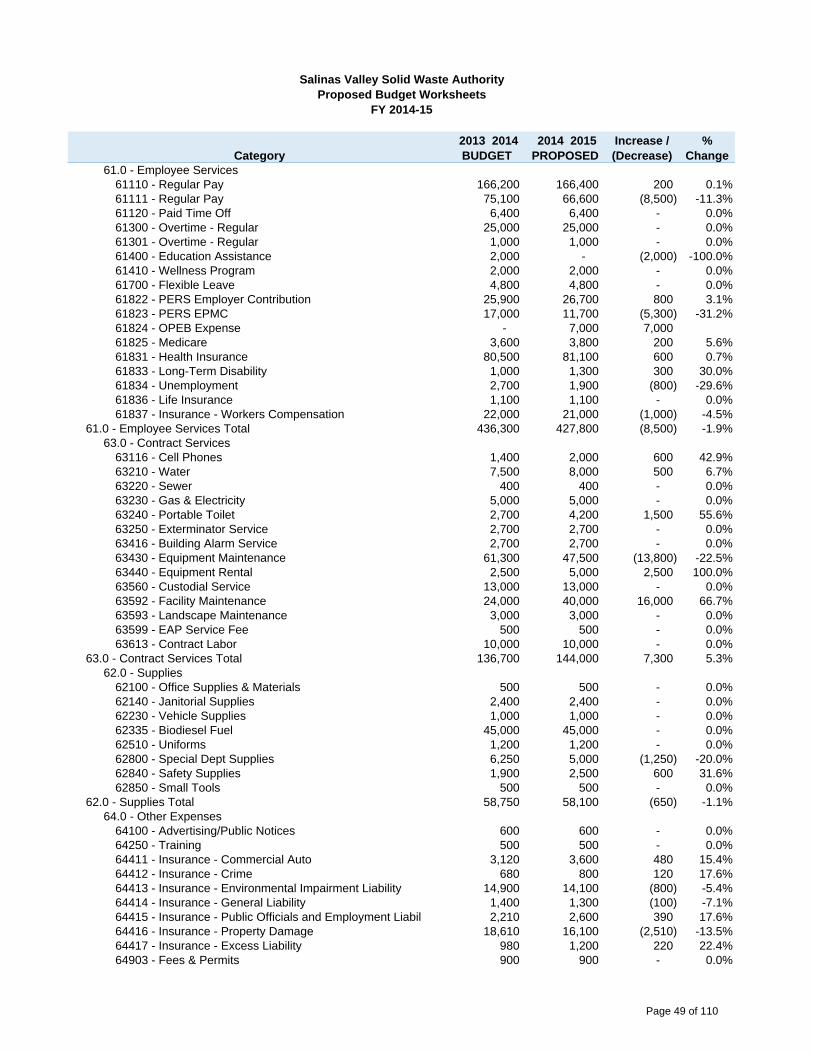
Category 2013 2014 BUDGET
2014 2015 PROPOSED
Increase / (Decrease)
% Change
Salinas Valley Solid Waste AuthorityProposed Budget Worksheets
FY 2014-15
61.0 - Employee Services61110 - Regular Pay 166,200 166,400 200 0.1%61111 - Regular Pay 75,100 66,600 (8,500) -11.3%61120 - Paid Time Off 6,400 6,400 - 0.0%61300 - Overtime - Regular 25,000 25,000 - 0.0%61301 - Overtime - Regular 1,000 1,000 - 0.0%61400 - Education Assistance 2,000 - (2,000) -100.0%61410 - Wellness Program 2,000 2,000 - 0.0%61700 - Flexible Leave 4,800 4,800 - 0.0%61822 - PERS Employer Contribution 25,900 26,700 800 3.1%61823 - PERS EPMC 17,000 11,700 (5,300) -31.2%61824 - OPEB Expense - 7,000 7,000 61825 - Medicare 3,600 3,800 200 5.6%61831 - Health Insurance 80,500 81,100 600 0.7%61833 - Long-Term Disability 1,000 1,300 300 30.0%61834 - Unemployment 2,700 1,900 (800) -29.6%61836 - Life Insurance 1,100 1,100 - 0.0%61837 - Insurance - Workers Compensation 22,000 21,000 (1,000) -4.5%
61.0 - Employee Services Total 436,300 427,800 (8,500) -1.9%63.0 - Contract Services
63116 - Cell Phones 1,400 2,000 600 42.9%63210 - Water 7,500 8,000 500 6.7%63220 - Sewer 400 400 - 0.0%63230 - Gas & Electricity 5,000 5,000 - 0.0%63240 - Portable Toilet 2,700 4,200 1,500 55.6%63250 - Exterminator Service 2,700 2,700 - 0.0%63416 - Building Alarm Service 2,700 2,700 - 0.0%63430 - Equipment Maintenance 61,300 47,500 (13,800) -22.5%63440 - Equipment Rental 2,500 5,000 2,500 100.0%63560 - Custodial Service 13,000 13,000 - 0.0%63592 - Facility Maintenance 24,000 40,000 16,000 66.7%63593 - Landscape Maintenance 3,000 3,000 - 0.0%63599 - EAP Service Fee 500 500 - 0.0%63613 - Contract Labor 10,000 10,000 - 0.0%
63.0 - Contract Services Total 136,700 144,000 7,300 5.3%62.0 - Supplies
62100 - Office Supplies & Materials 500 500 - 0.0%62140 - Janitorial Supplies 2,400 2,400 - 0.0%62230 - Vehicle Supplies 1,000 1,000 - 0.0%62335 - Biodiesel Fuel 45,000 45,000 - 0.0%62510 - Uniforms 1,200 1,200 - 0.0%62800 - Special Dept Supplies 6,250 5,000 (1,250) -20.0%62840 - Safety Supplies 1,900 2,500 600 31.6%62850 - Small Tools 500 500 - 0.0%
62.0 - Supplies Total 58,750 58,100 (650) -1.1%64.0 - Other Expenses
64100 - Advertising/Public Notices 600 600 - 0.0%64250 - Training 500 500 - 0.0%64411 - Insurance - Commercial Auto 3,120 3,600 480 15.4%64412 - Insurance - Crime 680 800 120 17.6%64413 - Insurance - Environmental Impairment Liability 14,900 14,100 (800) -5.4%64414 - Insurance - General Liability 1,400 1,300 (100) -7.1%64415 - Insurance - Public Officials and Employment Liabil 2,210 2,600 390 17.6%64416 - Insurance - Property Damage 18,610 16,100 (2,510) -13.5%64417 - Insurance - Excess Liability 980 1,200 220 22.4%64903 - Fees & Permits 900 900 - 0.0%
Page 49 of 110
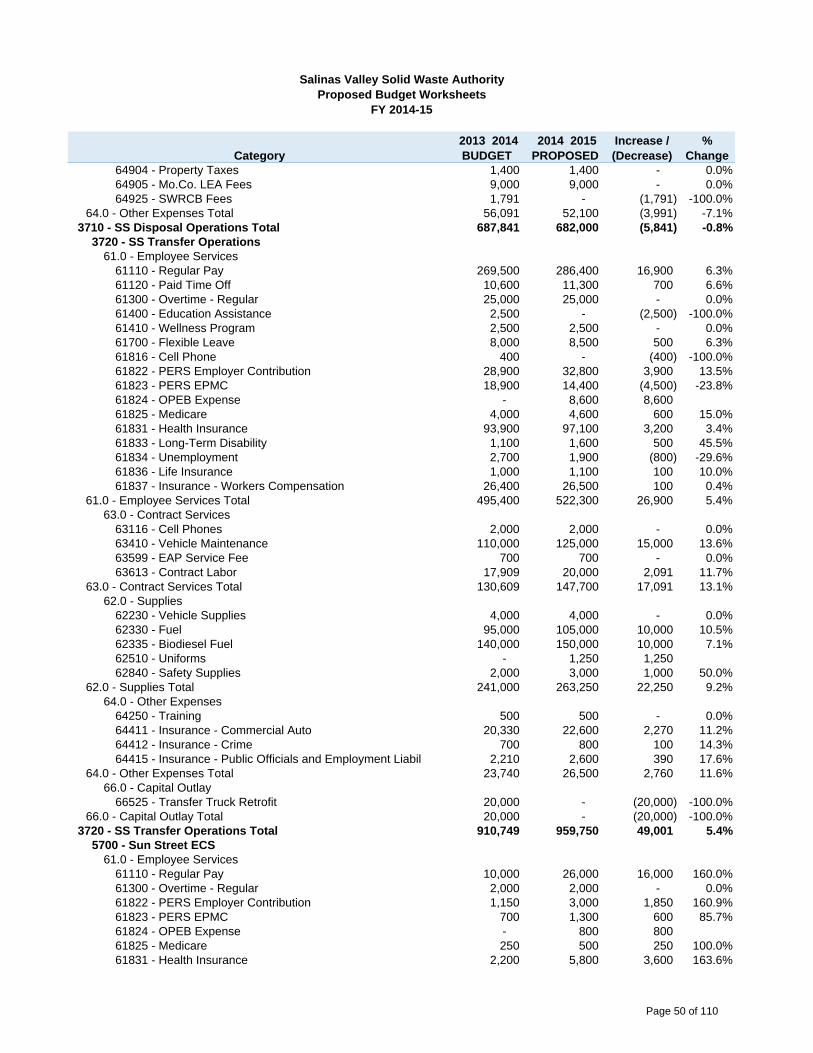
Category 2013 2014 BUDGET
2014 2015 PROPOSED
Increase / (Decrease)
% Change
Salinas Valley Solid Waste AuthorityProposed Budget Worksheets
FY 2014-15
64904 - Property Taxes 1,400 1,400 - 0.0%64905 - Mo.Co. LEA Fees 9,000 9,000 - 0.0%64925 - SWRCB Fees 1,791 - (1,791) -100.0%
64.0 - Other Expenses Total 56,091 52,100 (3,991) -7.1%3710 - SS Disposal Operations Total 687,841 682,000 (5,841) -0.8%
3720 - SS Transfer Operations61.0 - Employee Services
61110 - Regular Pay 269,500 286,400 16,900 6.3%61120 - Paid Time Off 10,600 11,300 700 6.6%61300 - Overtime - Regular 25,000 25,000 - 0.0%61400 - Education Assistance 2,500 - (2,500) -100.0%61410 - Wellness Program 2,500 2,500 - 0.0%61700 - Flexible Leave 8,000 8,500 500 6.3%61816 - Cell Phone 400 - (400) -100.0%61822 - PERS Employer Contribution 28,900 32,800 3,900 13.5%61823 - PERS EPMC 18,900 14,400 (4,500) -23.8%61824 - OPEB Expense - 8,600 8,600 61825 - Medicare 4,000 4,600 600 15.0%61831 - Health Insurance 93,900 97,100 3,200 3.4%61833 - Long-Term Disability 1,100 1,600 500 45.5%61834 - Unemployment 2,700 1,900 (800) -29.6%61836 - Life Insurance 1,000 1,100 100 10.0%61837 - Insurance - Workers Compensation 26,400 26,500 100 0.4%
61.0 - Employee Services Total 495,400 522,300 26,900 5.4%63.0 - Contract Services
63116 - Cell Phones 2,000 2,000 - 0.0%63410 - Vehicle Maintenance 110,000 125,000 15,000 13.6%63599 - EAP Service Fee 700 700 - 0.0%63613 - Contract Labor 17,909 20,000 2,091 11.7%
63.0 - Contract Services Total 130,609 147,700 17,091 13.1%62.0 - Supplies
62230 - Vehicle Supplies 4,000 4,000 - 0.0%62330 - Fuel 95,000 105,000 10,000 10.5%62335 - Biodiesel Fuel 140,000 150,000 10,000 7.1%62510 - Uniforms - 1,250 1,250 62840 - Safety Supplies 2,000 3,000 1,000 50.0%
62.0 - Supplies Total 241,000 263,250 22,250 9.2%64.0 - Other Expenses
64250 - Training 500 500 - 0.0%64411 - Insurance - Commercial Auto 20,330 22,600 2,270 11.2%64412 - Insurance - Crime 700 800 100 14.3%64415 - Insurance - Public Officials and Employment Liabil 2,210 2,600 390 17.6%
64.0 - Other Expenses Total 23,740 26,500 2,760 11.6%66.0 - Capital Outlay
66525 - Transfer Truck Retrofit 20,000 - (20,000) -100.0%66.0 - Capital Outlay Total 20,000 - (20,000) -100.0%
3720 - SS Transfer Operations Total 910,749 959,750 49,001 5.4%5700 - Sun Street ECS
61.0 - Employee Services61110 - Regular Pay 10,000 26,000 16,000 160.0%61300 - Overtime - Regular 2,000 2,000 - 0.0%61822 - PERS Employer Contribution 1,150 3,000 1,850 160.9%61823 - PERS EPMC 700 1,300 600 85.7%61824 - OPEB Expense - 800 800 61825 - Medicare 250 500 250 100.0%61831 - Health Insurance 2,200 5,800 3,600 163.6%
Page 50 of 110
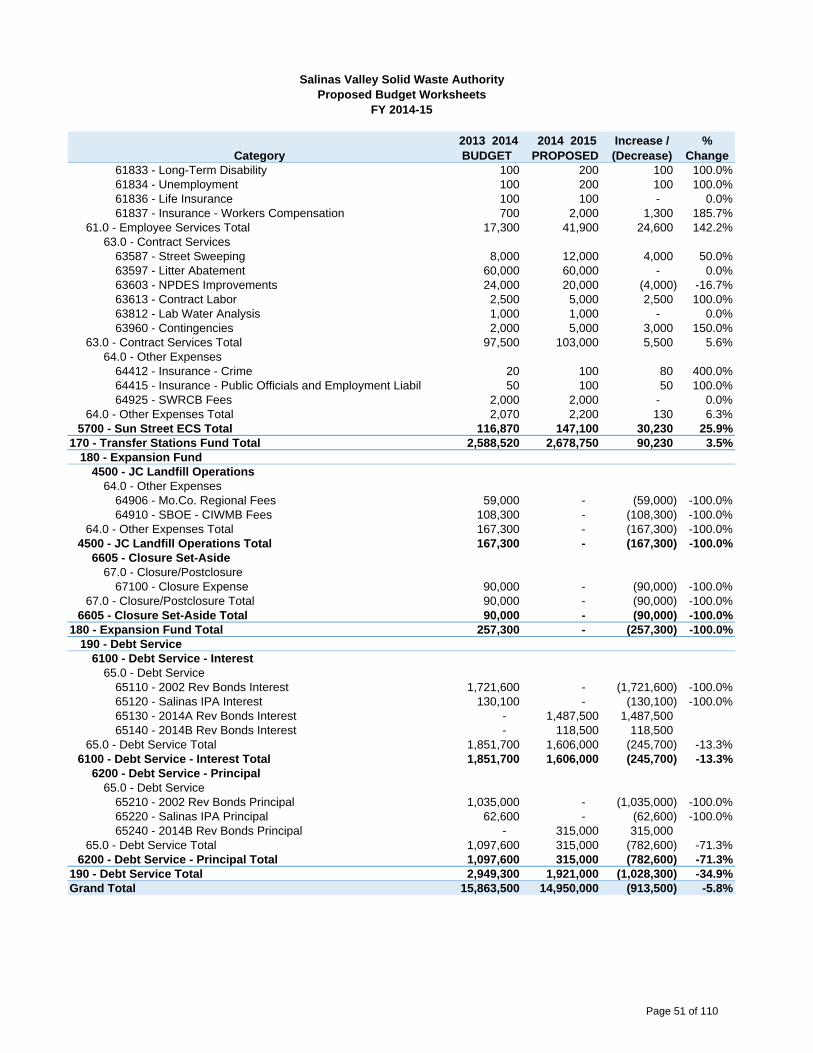
Category 2013 2014 BUDGET
2014 2015 PROPOSED
Increase / (Decrease)
% Change
Salinas Valley Solid Waste AuthorityProposed Budget Worksheets
FY 2014-15
61833 - Long-Term Disability 100 200 100 100.0%61834 - Unemployment 100 200 100 100.0%61836 - Life Insurance 100 100 - 0.0%61837 - Insurance - Workers Compensation 700 2,000 1,300 185.7%
61.0 - Employee Services Total 17,300 41,900 24,600 142.2%63.0 - Contract Services
63587 - Street Sweeping 8,000 12,000 4,000 50.0%63597 - Litter Abatement 60,000 60,000 - 0.0%63603 - NPDES Improvements 24,000 20,000 (4,000) -16.7%63613 - Contract Labor 2,500 5,000 2,500 100.0%63812 - Lab Water Analysis 1,000 1,000 - 0.0%63960 - Contingencies 2,000 5,000 3,000 150.0%
63.0 - Contract Services Total 97,500 103,000 5,500 5.6%64.0 - Other Expenses
64412 - Insurance - Crime 20 100 80 400.0%64415 - Insurance - Public Officials and Employment Liabil 50 100 50 100.0%64925 - SWRCB Fees 2,000 2,000 - 0.0%
64.0 - Other Expenses Total 2,070 2,200 130 6.3%5700 - Sun Street ECS Total 116,870 147,100 30,230 25.9%
170 - Transfer Stations Fund Total 2,588,520 2,678,750 90,230 3.5%180 - Expansion Fund
4500 - JC Landfill Operations64.0 - Other Expenses
64906 - Mo.Co. Regional Fees 59,000 - (59,000) -100.0%64910 - SBOE - CIWMB Fees 108,300 - (108,300) -100.0%
64.0 - Other Expenses Total 167,300 - (167,300) -100.0%4500 - JC Landfill Operations Total 167,300 - (167,300) -100.0%
6605 - Closure Set-Aside67.0 - Closure/Postclosure
67100 - Closure Expense 90,000 - (90,000) -100.0%67.0 - Closure/Postclosure Total 90,000 - (90,000) -100.0%
6605 - Closure Set-Aside Total 90,000 - (90,000) -100.0%180 - Expansion Fund Total 257,300 - (257,300) -100.0%
190 - Debt Service6100 - Debt Service - Interest
65.0 - Debt Service65110 - 2002 Rev Bonds Interest 1,721,600 - (1,721,600) -100.0%65120 - Salinas IPA Interest 130,100 - (130,100) -100.0%65130 - 2014A Rev Bonds Interest - 1,487,500 1,487,500 65140 - 2014B Rev Bonds Interest - 118,500 118,500
65.0 - Debt Service Total 1,851,700 1,606,000 (245,700) -13.3%6100 - Debt Service - Interest Total 1,851,700 1,606,000 (245,700) -13.3%
6200 - Debt Service - Principal65.0 - Debt Service
65210 - 2002 Rev Bonds Principal 1,035,000 - (1,035,000) -100.0%65220 - Salinas IPA Principal 62,600 - (62,600) -100.0%65240 - 2014B Rev Bonds Principal - 315,000 315,000
65.0 - Debt Service Total 1,097,600 315,000 (782,600) -71.3%6200 - Debt Service - Principal Total 1,097,600 315,000 (782,600) -71.3%
190 - Debt Service Total 2,949,300 1,921,000 (1,028,300) -34.9%Grand Total 15,863,500 14,950,000 (913,500) -5.8%
Page 51 of 110

This page intentionally left blank
Page 52 of 110
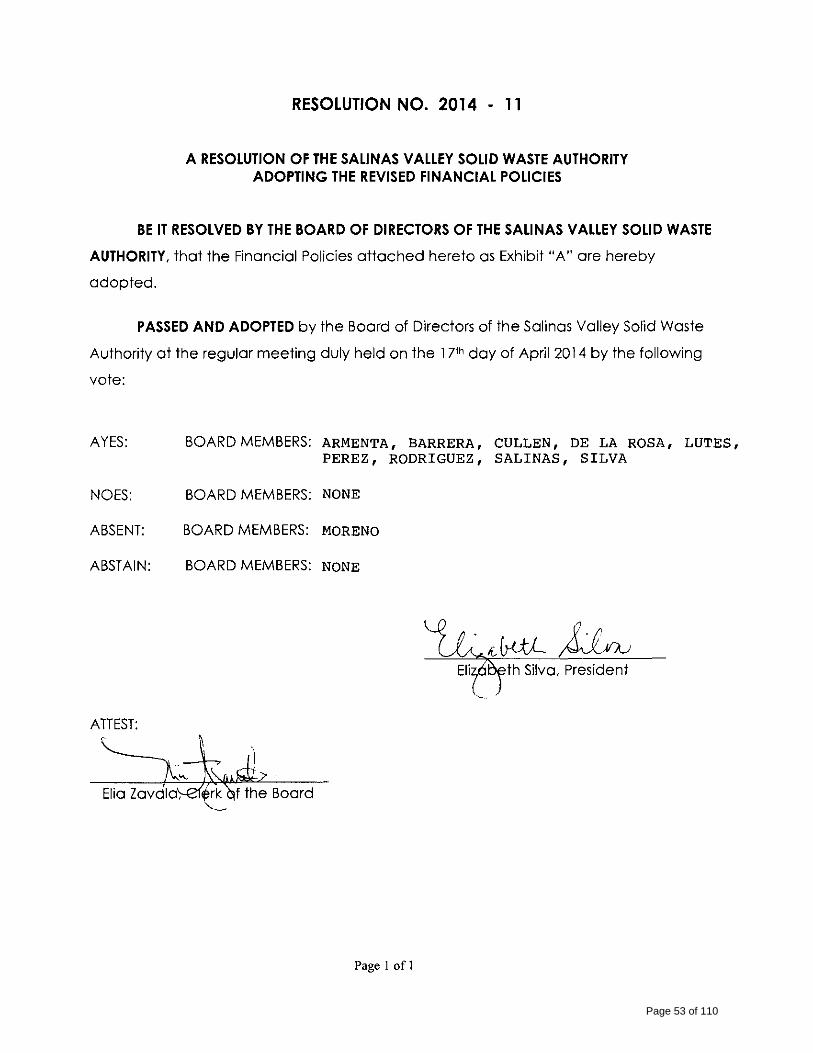
RESOLUTION NO. 2014 - 11
A RESOLUTION OF THE SALINAS VALLEY SOLID WASTE AUTHORITY ADOPTING THE REVISED FINANCIAL POLICIES
BE IT RESOLVED BY THE BOARD OF DIRECTORS OF THE SALINAS VALLEY SOLID WASTE
AUTHORITY, that the Financial Policies attached hereto as Exhibit "A" are hereby
adopted.
PASSED AND ADOPTED by the Board of Directors of the Salinas Valley Solid Waste
Authority at the regular meeting duly held on the l 71h day of April 2014 by the following
vote:
AYES:
NOES:
ABSENT:
ABSTAIN:
ATIEST:
BOARD MEMBERS: ARMENTA, BARRERA, CULLEN, DE LA ROSA, LUTES, PEREZ, RODRIGUEZ, SALINAS, SILVA
BOARD MEMBERS: NONE
BOARD MEMBERS: MORENO
BOARD MEMBERS: NONE
th Silva, President
Page I of 1
Page 53 of 110
Salinas Valley Solid Waste Authority Financial Policies
Revised April 17, 2014
SUMMARY The SVSWA Board of Directors recognizes their fiduciary responsibility by virtue of their appointment to the Board. In an effort to promote transparency in the fiscal affairs of the Authority and to promote fiscal accountability, it hereby adopts the following financial policies to guide the Authority’s finances:
1. Revenues: The Authority will maintain a revenue system that will assure a reliable, equitable, predictable revenue stream to support Authority services.
2. Expenditures: The Authority shall assure fiscal stability and the effective and efficient delivery of services, through the identification of necessary services, establishment of appropriate service levels, and careful administration of the expenditure of available resources.
3. Fund Balance/Reserves: The Authority shall maintain a fund balance at a level sufficient to protect the Authority's creditworthiness as well as its financial position from unforeseeable occurrences or emergencies.
4. Capital Expenditures and Improvements: The Authority shall annually review the state of its capital assets, setting priorities for its replacement and renovation based on needs, funding, alternatives and availability of resources.
5. Debt: The Authority shall utilize debt financing only to provide needed capital equipment and improvements while minimizing the impact of debt payments on current revenues.
6. Investments: The Authority's cash will be invested in such a manner so as to ensure the absolute safety of principal and interest, meet the liquidity needs of the Authority, and achieve the highest possible yield.
7. Grants: The Authority shall seek, apply for and effectively administer federal, state and foundation grants that address the Authority's current priorities and policy objectives.
8. Closure Funding: The Authority shall properly fund all closure and postclosure costs in accordance with California Integrated Waste Management Board (CIWMB) requirements.
9. Fiscal Monitoring: Authority staff shall prepare and present to the Board regular reports
that analyze, evaluate and forecast the Authority's financial performance and economic condition.
10. Accounting, Auditing and Financial Reporting: The Authority’s accounting, auditing and financial reporting shall comply with prevailing local, state, and federal regulations, as well as current professional principles and practices as promulgated by authoritative bodies.
Page 54 of 110
Salinas Valley Solid Waste Authority Financial Policies
Revised April 17, 2014
11. Internal Controls: The Authority shall establish and maintain an internal control structure designed to provide reasonable assurance that Authority assets are safeguarded and that the possibilities for material errors in the Authority's financial records are minimized.
12. Operating Budget: The Authority’s operating budget will implement the policy decisions of
the Board. It will provide a clear picture of the Authority’s resources and their use.
13. Capital Assets: The Authority will capitalize all capital assets in accordance with Generally Accepted Accounting Principles so as to maintain proper control of all capital assets.
Page 55 of 110
Salinas Valley Solid Waste Authority Financial Policies
Revised April 17, 2014
1 - REVENUES
The Authority will maintain a revenue system that will assure a reliable, equitable, predictable revenue stream to support Authority services.
A. User Fees
The Authority shall establish and collect fees to recover the costs of handling specific items that benefit only specific users. The Authority Board shall determine the appropriate cost recovery level and establish the fees. Where feasible and desirable, the Authority shall seek to recover full direct and indirect costs. User fees shall be reviewed on a regular basis to calculate their full cost recovery levels, to compare them to the current fee structure, and to recommend adjustments where necessary.
B. Tipping Fees
Tipping fees shall be set at levels sufficient to cover operating expenditures, meet debt obligations, provide additional funding for capital improvements, and provide adequate levels of working capital. Tipping Fees are not expected to cover depreciation/depletion.
C. One Time Revenues
One-time revenues shall be used only for one-time expenditures.
D. Revenue Estimates
The Authority shall use a conservative, objective, and analytical approach when preparing revenue estimates. The process shall include analysis of probable economic changes and their impacts on revenues, historical collection rates, and trends in revenues. This approach should reduce the likelihood of actual revenues falling short of budget estimates during the year and thus avoid mid-year service reductions.
E. Revenue Collection and Administration
The Authority shall pursue to the full extent allowed by state law all delinquent ratepayers and others overdue in payments to the Authority. Since a revenue should exceed the cost of producing it, the Authority shall strive to control and reduce administrative collection costs.
Page 56 of 110
Salinas Valley Solid Waste Authority Financial Policies
Revised April 17, 2014
2 - EXPENDITURES
The Authority shall assure fiscal stability and the effective and efficient delivery of services, through the identification of necessary services, establishment of appropriate service levels, and careful administration of the expenditure of available resources.
A. Current Funding Basis
The Authority shall operate on a current funding basis. Expenditures shall be budgeted and controlled so as not to exceed current revenues.
B. Avoidance of Operating Deficits
The Authority shall take immediate corrective actions if at any time during the fiscal year expenditure and revenue estimates are such that an operating deficit (i.e., projected expenditures in excess of projected revenues) is projected at year-end. Corrective actions can include a hiring freeze, expenditure reductions, fee increases, or use of fund balance within the Fund Balance/Reserves Policy. Expenditure deferrals into the following fiscal year, short-term loans, or use of one-time revenue sources shall be avoided to balance the budget.
C. Maintenance of Capital Assets
Within the resources available each fiscal year, the Authority shall maintain capital assets and infrastructure at a sufficient level to protect the Authority's investment, to minimize future replacement and maintenance costs, and to continue current service levels.
D. Periodic Program Reviews
The General Manager shall undertake periodic staff and third-party reviews of Authority programs for both efficiency and effectiveness. Privatization and contracting with other governmental agencies will be evaluated as alternative approaches to service delivery. Programs which are determined to be inefficient and/or ineffective shall be reduced in scope or eliminated.
E. Purchasing
The Authority shall make every effort to maximize any discounts offered by creditors/vendors. Staff shall use competitive bidding whenever possible to attain the best possible price on goods and services.
Page 57 of 110
Salinas Valley Solid Waste Authority Financial Policies
Revised April 17, 2014
3 - FUND BALANCE/RESERVES
The Authority shall maintain a fund balance at a level sufficient to protect the Authority's creditworthiness as well as its financial position from unforeseeable emergencies.
A. Operating Reserve
The Authority shall strive to maintain an Operating Reserve equal to fifteen percent (15%) of the current year operating expenditures, to provide sufficient reserves for unforeseen occurrences and revenue shortfalls. Operating expenditures for reserve purposes is defined as the total budget less capital project expenditures.
B. Funding the Reserves
After completion of the annual audit, any undesignated fund balance will be allocated to reserves using the following methodology:
1. Operating Reserve (20%) 2. Capital Projects Reserve (60%) 3. Environmental Impairment Reserve (20%)
Any allocation outside of the prescribed methodology or transfers between reserves must be approved by the Board.
C. Capital Projects Reserve
Due to the capital intensive nature of the Authority’s landfill operations the Authority will develop a Capital Projects Reserve for the purpose of funding future capital projects and replacement of existing capital infrastructure in accordance with the Capital Improvements Financial Policies. The target amount of the reserve will be based on the capital needs of the Authority.
E. Use of Operating Reserve
The Operating Reserve shall be used only for its designated purpose - emergencies, non-recurring expenditures, or major capital purchases that can not be accommodated through current year savings. Should such use reduce the balance below the appropriate level set as the objective, restoration recommendations will accompany the decision to utilize said reserve.
F. Environmental Impairment Reserve
Page 58 of 110
Salinas Valley Solid Waste Authority Financial Policies
Revised April 17, 2014
Due to the potential release of contaminants that exists with all Municipal Solid Waste landfills, the Authority will strive to fund an Environmental Impairment Reserve for the purpose of responding to a release in a timely manner. The funds can also be used for mitigation or corrective action measures required by CalRecycle.
G. Annual Review of Reserves
As part of the annual budget process, the Authority will review the target amount and the status of each of the reserves. This will be taken into account as part of the budget development. The goal is to reach the Operating and Environmental Impairment Reserve amounts within a five year period but in no case later than 10 years.
Page 59 of 110
Salinas Valley Solid Waste Authority Financial Policies
Revised April 17, 2014
4 - CAPITAL EXPENDITURES AND IMPROVEMENTS
The Authority shall annually review the state of its capital assets, setting priorities for their replacement and renovation based on needs, funding, alternatives and availability of resources.
A. Capital Improvement Plan
The Authority shall prepare a 10-Year Capital Improvement Plan (CIP) which will detail the Authority’s capital needs financing requirements. The CIP will be reviewed and approved every two (2) years before discussions of the operating budget take place. It will include budget financing for the first two years. The CAO will develop guidelines for what projects to include in the CIP. All projects, ongoing and proposed, shall be prioritized based on an analysis of current needs and resource availability. For every capital project, all operation, maintenance and replacement costs shall be fully disclosed. The CIP will be in conformance with and support the Authority’s major planning documents and 3-year Strategic Plans..
B. Capital Improvement Budget
The CIP will be the basis for which projects will be included in the following year’s budget. Appropriations will be approved annually using the following criteria:
1. Linkage with needs identified in the Authority’s planning documents. 2. Cost/benefit analysis identifying all economic or financial impacts of the project. 3. Identification of available funding resources.
CIP funding will be based on the following priorities:
1. Projects that comply with regulatory requirements. 2. Projects that maintain health and safety standards.
3. Projects that maintain and preserve existing facilities. 4. Projects that replace existing facilities that can no longer be maintained. 5. Projects that improve operations.
C. Capital Expenditure Financing
Projects will be financed using the following preferred order:
1. Use current revenues; 2. Use the Capital Projects Reserve; 3. Borrow money through debt issuance.
Debt financing includes revenue bonds, certificates of obligation, lease/purchase agreements, and other obligations permitted to be issued or incurred under California law. Guidelines for assuming debt are set forth in the Debt Policy Statements.
D. Capital Projects Reserve Fund
Page 60 of 110
Salinas Valley Solid Waste Authority Financial Policies
Revised April 17, 2014
A Capital Projects Reserve Fund shall be established and maintained to accumulate funds transferred from the undesignated fund balance. This fund shall only be used to pay for non-routine and one-time capital expenditures such as land and building purchases or construction and maintenance projects with a 10-year life. Expenditures from this Fund shall be aimed at protecting the health and safety of residents, employees and the environment, and protecting the existing assets of the Authority.
E. Capital Projects Management
The Authority will fund and manage its capital projects in a phased approach. The project phases will become a framework for appropriate decision points and reporting. The phasing will consist of:
1. Conceptual/schematic proposal 2. Preliminary design and cost estimate 3. Engineering and final design 4. Bid administration 5. Acquisition/construction 6. Project closeout
Each project will have a project manager who will prepare the project proposal, ensure that required phases are completed on schedule, authorize all project expenditures, ensure that all regulations and laws are observed, periodically report project status and track project expenditures.
Page 61 of 110
Salinas Valley Solid Waste Authority Financial Policies
Revised April 17, 2014
5 - DEBT
The Authority shall utilize debt financing only to provide needed capital equipment and improvements while minimizing the impact of debt payments on current revenues.
A. Use of Debt Financing .
The issuance of long-term debt will be only for the acquisition of land, capital improvements or equipment. Debt financing is not considered appropriate for current operations, maintenance expenses, or for any recurring purposes.
B. Conditions for Debt Issuance The Authority may use long-term debt to finance major equipment acquisition or capital project only if it is established through a cost/benefit analysis that the financial and community benefits of the financing exceed the financing costs. Benefits would include, but not be limited to, the following:
1. Present value benefit: The current cost plus the financing cost is less than the future cost of the project. 2. Maintenance value benefit: The financing cost is less than the maintenance cost
of deferring the project. 3. Equity benefit: Financing provides a method of spreading the cost of a facility
back to the users of the facility over time. 4. Community benefit: Debt financing of the project enables the Authority to meet an
immediate community need. Debt financing will be used only when project revenues or other identified revenue
sources are sufficient to service the debt.
C. Debt Structure
The Authority’s preference is to issue fixed-rate, long-term debt with level debt service, but variable rate debt or other debt service structure may be considered if an economic advantage is identified for a particular project.
Bond proceeds, for debt service, will be held by an independent bank acting as trustee or paying agent.
Page 62 of 110

Salinas Valley Solid Waste Authority Financial Policies
Revised April 17, 2014
The Authority's minimum bond rating objective for all debt issues is a Moody's and Standard & Poor's rating of A (upper medium grade). Credit enhancements will be used to achieve higher ratings when there is an economic benefit.
The Authority may retain the following contract advisors for the issuance of debt:
1. Financial Advisor - To be selected, when appropriate, by negotiation to provide financial analysis and advice related to the feasibility and structure of the proposed debt.
2. Bond Counsel - To be selected by negotiation for each debt issue.
3. Underwriters - To be selected by negotiation or competitive bid for each bond issue
based upon the proposed structure for each issue.
D. Call Provisions
Call provisions for bond issues shall be made as short as possible consistent with the lowest interest cost to the Authority. When possible, all bonds shall be callable only at par.
E. Debt Refunding
Authority staff and the financial advisor shall monitor the municipal bond market for opportunities to obtain interest savings by refunding outstanding debt. As a general rule, the present value savings of a particular refunding should exceed 3.5% of the refunded maturities.
F. Interest Earnings
Interest earnings received on the investment of bond proceeds shall be used to assist in paying the interest due on bond issues, to the extent permitted by law.
G. Lease/Purchase Agreements
Over the lifetime of a lease, the total cost to the Authority will generally be higher than purchasing the asset outright. As a result, the use of lease/purchase agreements and certificates of participation in the acquisition of vehicles, equipment and other capital assets shall generally be avoided, particularly if smaller quantities of the capital asset(s) can be purchased on a "pay-as-you-go" basis.
Page 63 of 110
Salinas Valley Solid Waste Authority Financial Policies
Revised April 17, 2014
6 - INVESTMENTS
The Authority's cash will be invested in such a manner so as to insure the absolute safety of principal and interest, meet the liquidity needs of the Authority, and achieve the highest possible yield after meeting the first two requirements.
A. Investment Policy
The Authority Treasurer is both authorized and required to promulgate a written Statement of Investment Policy which shall be presented to the Board annually.
B. Interest Earnings
Interest earned from investments shall be distributed to the operating funds from which the money was provided, with the exception that interest earnings received on the investment of bond proceeds shall be attributed and allocated to those debt service funds responsible for paying the principal and interest due on the particular bond issue.
.
Page 64 of 110
Salinas Valley Solid Waste Authority Financial Policies
Revised April 17, 2014
7 - GRANTS
The Authority shall seek, apply for and effectively administer federal, state and foundation grants-in-aid that address the Authority's current priorities and policy objectives.
A. Grant Guidelines
The Authority shall apply, and facilitate the application by others, for only those grants that are consistent with the objectives and high priority needs previously identified by the Board. The potential for incurring ongoing costs, to include the assumption of support for grant-funded positions from local revenues, will be considered prior to applying for a grant.
B. Indirect Costs
The Authority shall recover full indirect costs unless the funding agency does not permit it. The Authority may waive or reduce indirect costs if doing so will significantly increase the effectiveness of the grant.
C. Grant Review
All grant submittals shall be reviewed for their cash match requirements, their potential impact on the operating budget, and the extent to which they meet the Authority's policy objectives. Departments shall seek Board approval prior to submission of a grant application. Should time constraints under the grant program make this impossible, the department shall obtain approval to submit an application from the CAO and then, at the earliest feasible time, seek formal Board approval. If there are cash match requirements, the source of funding shall be identified prior to application. An annual report on the status of grant programs and their effectiveness shall also be prepared.
D. Grant Program Termination
The Authority shall terminate grant-funded programs and associated positions when grant funds are no longer available unless alternate funding is identified.
Page 65 of 110
Salinas Valley Solid Waste Authority Financial Policies
Revised April 17, 2014
8 - CLOSURE FUNDING
The Authority shall properly fund all closure and postclosure costs in accordance with CIWMB requirements.
A. Closure Funding
In accordance with CIWMB requirements, the Authority shall annually set aside sufficient funds to fully fund all accrued closure costs liability. These funds will be held in a separate Closure Fund restricted specifically for this purpose.
B. Postclosure Funding
In accordance with the Financial Assurances, the Authority shall fund postclosure costs from future revenues when those costs are incurred. The Authority will not pre-fund postclosure costs in its operating budget. The Authority has entered into Pledge of Revenue with the CIWMB for this purpose.
C. Closure Funding Calculations The Authority shall, as part of the budget process, annually recalculate the closure costs on a per ton basis. Funds will be transferred on a monthly basis to the Closure funds based on tonnage land-filled. Post closure expense incurred as a result of current fiscal year solid waste disposal will be recorded as an expense on the Authority’s financial statements with a corresponding liability.
Page 66 of 110
Salinas Valley Solid Waste Authority Financial Policies
Revised April 17, 2014
9 - FISCAL MONITORING
Authority staff shall prepare and present to the Board regular reports that analyze, evaluate and forecast the Authority's financial performance and economic condition.
A. Financial Status and Performance Reports
Monthly reports comparing expenditures and revenues to current budget, noting the status of fund balances, and outlining any remedial actions necessary to maintain the Authority's financial position shall be prepared for review by the Board.
B. Five-year Forecast of Revenues and Expenditures
A five-year forecast of revenues and expenditures, to include a discussion of major trends affecting the Authority's financial position, shall be prepared in anticipation of the annual budget process. The forecast shall also examine critical issues facing the Authority, economic conditions, and the outlook for the upcoming budget year. The document shall provide insight into the Authority's financial position and alert the Board to potential problem areas requiring attention.
C. Semi-Annual Status Report on Capital Projects
A summary report on the contracts awarded, capital projects completed and the status of the Authority's various capital projects will be prepared at least semi-annually and presented to the Board.
D. Compliance with Board Policy Statements
The Financial Policies will be reviewed annually by the Board and updated, revised or refined as deemed necessary. Policy statements adopted by the Board are guidelines, and occasionally, exceptions may be appropriate and required. However, exceptions to stated policies will be specifically identified, and the need for the exception will be documented and fully explained.
Page 67 of 110
Salinas Valley Solid Waste Authority Financial Policies
Revised April 17, 2014
10 - ACCOUNTING, AUDITING, AND FINANCIAL REPORTING
The Authority’s accounting, auditing and financial reporting shall comply with prevailing local, state, and federal regulations, as well as current professional principles and practices as promulgated by authoritative bodies.
A. Conformance to Accounting Principles
The Authority's accounting practices and financial reporting shall conform to generally accepted accounting principles (GAAP) as promulgated by the Governmental Accounting Standards Board (GASB), the American Institute of Certified Public Accountants (AICPA), and the Government Finance Officers Association (GFOA).
B. Popular Reporting
In addition to issuing a comprehensive annual financial report (CAFR) in conformity with GAAP, the Authority shall supplement its CAFR with a simpler, "popular" report designed to assist those residents who need or desire a less detailed overview of the Authority's financial activities. This report should be issued no later than six months after the close of the fiscal year.
Page 68 of 110
Salinas Valley Solid Waste Authority Financial Policies
Revised April 17, 2014
11 - INTERNAL CONTROLS
The Authority shall establish and maintain an internal control structure designed to provide reasonable assurance that Authority assets are safeguarded and that the possibilities for material errors in the Authority's financial records are minimized.
A. Proper Authorizations
Procedures shall be designed, implemented and maintained to ensure that financial transactions and activities are properly reviewed and authorized.
B. Separation of Duties
Job duties will be adequately separated to reduce, to an acceptable level, the opportunities for any person to be in a position to both perpetrate and conceal errors or irregularities in the normal course of assigned duties.
C. Proper Recording
Procedures shall be developed and maintained that will ensure financial transactions and events are properly recorded and that all financial reports may be relied upon as accurate, complete and up-to-date.
D. Access to Assets and Records
Procedures shall be designed and maintained to ensure that adequate safeguards exist over the access to and use of financial assets and records.
E. Independent Checks
Independent checks and audits will be made on staff performance to ensure compliance with established procedures and proper valuation of recorded amounts.
F. Costs and Benefits
Internal control systems and procedures must have an apparent benefit in terms of reducing and/or preventing losses. The cost of implementing and maintaining any control system should be evaluated against the expected benefits to be derived from that system.
Page 69 of 110
Salinas Valley Solid Waste Authority Financial Policies
Revised April 17, 2014
12 - OPERATING BUDGET
The Authority’s operating budget will implement the policy decisions of the Board. It will provide a clear picture of the Authority’s resources and their use.
A. Budget Format
The budget shall provide a complete financial plan of all Authority funds and activities for the ensuing fiscal year and shall be in such form as the Chief Administrative Officer deems desirable or that the Board may require. The budget shall begin with a clear general summary of its contents. It shall show in detail all estimated revenues, all carry-over fund balances and reserves, and all proposed expenditures, including debt service, for the ensuing fiscal year. The total of proposed expenditures shall not exceed the total of estimated revenues plus the un-appropriated fund balance, exclusive of reserves, for any fund. The budget will be organized on a program/service level format. The budget development process will include the identification and evaluation of policy options for increasing and decreasing service levels.
B. Estimated Revenues
The Authority will annually update its revenue forecast to enhance the budgetary decision-making process. In its budget projections, the Authority will attempt to match current expense to current revenue. If it becomes apparent that revenue shortfalls will create a deficit, efforts will be made first to reduce the deficiency through budgetary reductions. If appropriate reductions are insufficient, the Board may decide, on an exception basis, to use an appropriate existing reserve, which is in excess of minimum reserve requirements.
C. Appropriations
In evaluating the level of appropriations for program enhancements, or reductions, the Authority will apply the following principles in the priority order given:
1. Essential services, which provide for the health and safety of residents will be
funded to maintain current dollar levels.
2. The budget will provide for adequate ongoing maintenance of facilities and equipment.
3. Appropriations for program enhancements or reductions will be evaluated on a
case-by-case basis rather than across the board.
Page 70 of 110
Salinas Valley Solid Waste Authority Financial Policies
Revised April 17, 2014
4. When reductions in personnel are necessary to reduce expenditures, they shall be
consistent with the Authority Board's established service level priorities and, when possible, shall be accomplished through normal attrition.
5. Programs, which are self-supported by special revenues or fees, shall be
separately evaluated. Prior to the Authority Board making any supplemental appropriation, the CAO or Finance Manager shall certify that funds in excess of those estimated in the budget are available for appropriation. Any such supplemental appropriations shall be made for the fiscal year by Board action up to the amount of any excess.
Appropriations may be reduced any time during the fiscal year by the Authority Board upon recommendation of the CAO. When appropriation reductions are recommended, the CAO shall provide specific recommendations to the Board, indicating the estimated amount of the reduction, any remedial actions taken, and recommendations as to any other steps to be taken.
The CAO may transfer appropriations between divisions, and division managers may transfer appropriations between programs and accounts within their individual divisions, but only the Board by resolution may appropriate funds from reserves or fund balances.
All appropriations, except for Capital Improvement Program and Grant Programs appropriations, shall lapse at the end of the fiscal year to the extent that they have not been expended or encumbered. An appropriation in the Capital Improvement Program shall continue in force until expended, revised, or cancelled.
The Authority will endeavor to budget an appropriated contingency account in all Divisions operating budget equal to one percent of the total Operating Budget to meet changing operational requirements during the fiscal year.
Page 71 of 110
Salinas Valley Solid Waste Authority Financial Policies
Revised April 17, 2014
13 - CAPITAL ASSETS
The Authority will capitalize all capital assets in accordance with Generally Accepted Accounting Principles so as to maintain proper control of all capital assets. A. Overview – The Finance Division will maintain a capital asset management system that
will meet external financial reporting requirements and the needs of the Authority in line with these policies.
1. Capital assets are recorded as expenditures in governmental funds at the time the assets are received and the liability is incurred. These assets will be capitalized at cost on the government wide financial statements. Enterprise fixed assets are recorded as assets within the fund when purchased and a liability is incurred.
i. GASB 34 defines Capital Assets as land, improvements to land, easements, buildings, building improvements, vehicles, machinery, equipment, works of art and historical treasures, infrastructure, and all other tangible or intangible assets that are used in operations and that have initial useful lives extending beyond a single reporting period.
ii. GASB 34 defines Infrastructure Assets as long-lived capital assets that normally are stationary in nature and normally can be preserved for a significantly greater number of years than most capital assets. Examples include roads, bridges, tunnels, drainage systems, water and sewer systems, dams and lighting systems. Buildings that are an ancillary part of a network of infrastructure assets are included.
The Authority uses the most current edition of GOVERNMENTAL ACCOUNTING, AUDITING, AND FINANCIAL REPORTING (GAAFR) published by the Government Finance Officers Association (GFOA) as its authoritative guide in setting policy and establishing accounting procedures regarding capital assets.
B. Capitalization – Generally all capital assets with an original cost of $25,000 or more will be capitalized (recorded as an asset on the balance sheet versus expensing the item). Infrastructure Assets with an original cost of $150,000 or more will be capitalized. This capitalization policy addresses financial reporting, not control. The Authority follows the GFOA recommended practices for establishing capitalization thresholds. Specific capitalization requirements are described as follows:
1. The asset must cost $25,000 or more.
2. The asset must have a useful life of two (2) or more years.
3. The capitalization threshold is applied to individual units of capital assets rather than groups. For example, ten items purchased for $10,000 each will not be capitalized even though the total ($100,000) exceeds the threshold of $25,000.
4. For purposes of capitalization, the threshold will generally not be applied to components of capital assets. For example a keyboard, monitor and central processing unit purchased as components of a computer system will not be evaluated individually against the capitalization threshold. The entire computer system will be treated as a single asset. The capitalization threshold will be applied to a network if all component parts are required to make the asset
Page 72 of 110
Salinas Valley Solid Waste Authority Financial Policies
Revised April 17, 2014
functional.
5. Repairs to existing capital assets will generally not be subject to capitalization unless the repair extends the useful life of the asset. In this case the repair represents an improvement and is subject to the requirements described number 6 below.
6. Improvements to existing capital assets will be presumed by definition to extend the useful life of the related capital asset and therefore will be subject to capitalization if the cost exceeds $5,000.
7. Capital projects will be capitalized as “construction in progress” until completed. Personal computers will not be capitalized:
C. Leased Assets-
Operating leased assets are usually short term and cancelable at anytime. The recording of an operating lease as a fixed asset is not required because the item is not purchased.
Capital leases will be capitalized if one or more of the following criteria are met and the chance of cancellation is low:
a. Ownership is transferred by the end of the lease term b. The lease contains a bargain purchase option
c. The lease term is greater than or equal to 75 percent of the asset’s service life
d. The present value of the minimum lease payment is greater than or equal to ninety percent (90%) of the fair market value of the asset at the inception of the lease.
Capital lease items are capitalized at the beginning of the lease period, regardless of when the title transfers. Capital leases are recorded at net present value of lease payments.
D. Capital Asset Recording - It is the responsibility of the Finance Division to record, monitor and inventory all fixed assets. Each division will assign appropriate staff members to respond to verification, inventories, and filling out the necessary forms for recording transfers, dispositions or retired fixed assets.
E. Acquisition of Capital Assets - Fixed assets may be acquired through direct purchase, lease-purchase or capital lease, construction, eminent domain, donations, and gifts.
When a capital asset is acquired the funding source will be identified.
If funds are provided by a specific funding source, a record will be made of that specific source such as:
Bond Proceeds State Grants
F. Measuring the Cost and/or Value - Capital assets are recorded at their “historical cost”, which is the original cost of the assets. Donations accepted by the Authority will be valued at the fair market value at the time of donation. Costs include purchase price (less discounts) and any other reasonable and necessary costs incurred to place the asset in its intended location and prepare it for service. Costs could include the following:
Page 73 of 110
Salinas Valley Solid Waste Authority Financial Policies
Revised April 17, 2014
Sales Tax Freight charges Legal and title fees Closing costs Appraisal and negotiation fees Surveying fees Land-preparation costs Demolition costs Relocation costs Architect and accounting fees Insurance premiums and interest costs during construction
G. Establishing Cost in the Absence of Historical Records - According to the GASB 34, an estimate of the original cost is allowable. Standard costing is one method of estimating historical cost using a known average installed cost for a like unit at the estimated date of acquisition. Another recognized method is normal costing wherein an estimate of historical cost is based on current cost of reproduction new indexed by a reciprocal factor of the price increase of a specific item or classification from the appraisal date to the estimated date acquired. When necessary the Authority will use whichever method gives the most reasonable amount based on available information.
H. Recording Costs Incurred After Acquisition - Expenditures/expenses for replacing a component part of an asset are not capitalized. However, expenditures/expenses that either enhance a capital asset’s functionality (effectiveness or efficiency), or that extend a capital asset’s expected useful life are capitalized. For example, periodically slurry sealing a street would be treated as a repair (the cost would not be capitalized), while an overlay or reconstruction would be capitalized. Adding a new lane constitutes an addition and would therefore also be capitalized.
I. Disposition or Retirement of Fixed Assets - It is the Authority’s policy that divisions wishing to dispose of surplus, damaged or inoperative equipment must notify the Finance Division.
The Authority will conduct public auctions, as necessary, for the purpose of disposing of surplus property. Auctions will be conducted by the Finance Division. The original cost less depreciation will then be removed from the Authority’s capital asset management system.
J. Transfer of Assets - The transfer of fixed assets between divisions requires notification to the Finance Department.
K. Depreciation - In accordance with GASB Statement No. 34 the Authority will record depreciation expense on all capital assets, except for inexhaustible assets.
The Authority will use straight-line depreciation using the half-year convention or mid month as appropriate. Depreciation will be calculated for half a year in the year of acquisition and the year of disposition. Depreciation will be calculated over the estimated useful life of the asset.
L. Recommended Lives - The Authority follows GFOA Recommended Practices when establishing recommended lives for capitalized assets. In accordance with GASB 34 the Authority will rely on “general guidelines obtained from professional or industry organizations.” In particular the Authority will rely on estimated useful lives published by GFOA. If the life of a particular asset is estimated to be different than these guidelines, it
Page 74 of 110
Salinas Valley Solid Waste Authority Financial Policies
Revised April 17, 2014
may be changed. The following is a summary for the estimated useful lives:
Asset Class Useful Life Buildings 20 to 50 years Improvements 15 to 45 years Infrastructure 20 to 50 years Equipment and Machinery 5 to 20 years
M. Control of Assets – In accordance with GFOA Recommended Practice the Authority will exercise control over the non-capitalized tangible capital-type items by establishing and maintaining adequate control procedures at the division level. The Authority’s capitalization threshold of $5,000 meets financial reporting needs and is not designed for nor particularly suited to maintain control over lower cost capital assets. It is the responsibility of each division to maintain inventories of lower-cost capital assets to ensure adequate control and safekeeping of these assets.
N. Maintenance Schedules - The Authority shall develop and implement maintenance and replacement schedules with a goal of maximizing the useful life of all assets. The schedules shall include estimates of annual maintenance and/or replacement funding required for each asset.
O. Maintenance Funding - The Authority shall identify specific sources of funds for the annual maintenance or replacement of each asset. Whenever possible, the maintenance or replacement funding shall be identified from a source other than the Authority General Fund. The Authority shall endeavor to set aside, on an annual basis, one and one-half percent (1½%) of its Operating Budget to provide for on-going maintenance and required replacement of assets that cannot be reasonably funded from other sources.
Q. Inventorying – The Authority will follow the GFOA recommended practice of performing a physical inventory of its capitalized capital assets, either simultaneously or on a rotating basis, so that all capital assets are physically accounted for at least once every five years.
R. Tagging – The Authority will tag only moveable equipment with a value of $5,000 or higher. Rolling stock items will not be tagged. They will be identified by the VIN number. The Finance department will be responsible for tagging equipment.
Page 75 of 110

This page intentionally left blank
Page 76 of 110
Page 77 of 110
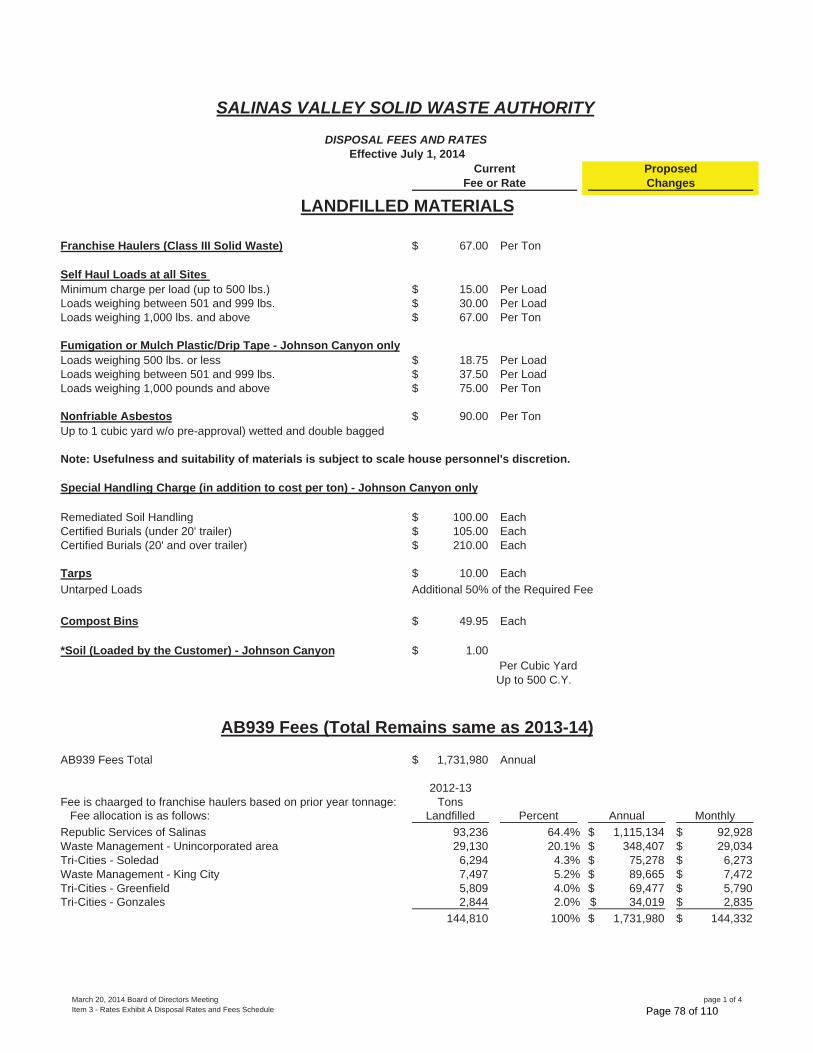
Franchise Haulers (Class III Solid Waste) 67.00$ Per Ton
Self Haul Loads at all Sites Minimum charge per load (up to 500 lbs.) 15.00$ Per LoadLoads weighing between 501 and 999 lbs. 30.00$ Per LoadLoads weighing 1,000 lbs. and above 67.00$ Per Ton
Fumigation or Mulch Plastic/Drip Tape - Johnson Canyon onlyLoads weighing 500 lbs. or less 18.75$ Per LoadLoads weighing between 501 and 999 lbs. 37.50$ Per LoadLoads weighing 1,000 pounds and above 75.00$ Per Ton
Nonfriable Asbestos 90.00$ Per TonUp to 1 cubic yard w/o pre-approval) wetted and double bagged
Note: Usefulness and suitability of materials is subject to scale house personnel's discretion.
Special Handling Charge (in addition to cost per ton) - Johnson Canyon only
Remediated Soil Handling 100.00$ EachCertified Burials (under 20' trailer) 105.00$ EachCertified Burials (20' and over trailer) 210.00$ Each
Tarps 10.00$ Each
Untarped Loads Additional 50% of the Required Fee
Compost Bins 49.95$ Each
*Soil (Loaded by the Customer) - Johnson Canyon 1.00$
AB939 Fees Total 1,731,980$ Annual
2012-13Fee is chaarged to franchise haulers based on prior year tonnage: Tons Fee allocation is as follows: Landfilled Percent Annual Monthly
Republic Services of Salinas 93,236 64.4% 1,115,134$ 92,928$Waste Management - Unincorporated area 29,130 20.1% 348,407$ 29,034$Tri-Cities - Soledad 6,294 4.3% 75,278$ 6,273$Waste Management - King City 7,497 5.2% 89,665$ 7,472$Tri-Cities - Greenfield 5,809 4.0% 69,477$ 5,790$Tri-Cities - Gonzales 2,844 2.0% 34,019$ 2,835$
144,810 100% 1,731,980$ 144,332$
SALINAS VALLEY SOLID WASTE AUTHORITY
DISPOSAL FEES AND RATESEffective July 1, 2014
Current Proposed
AB939 Fees (Total Remains same as 2013-14)
Fee or Rate Changes
LANDFILLED MATERIALS
Per Cubic Yard Up to 500 C.Y.
March 20, 2014 Board of Directors MeetingItem 3 - Rates Exhibit A Disposal Rates and Fees Schedule
page 1 of 4
Page 78 of 110
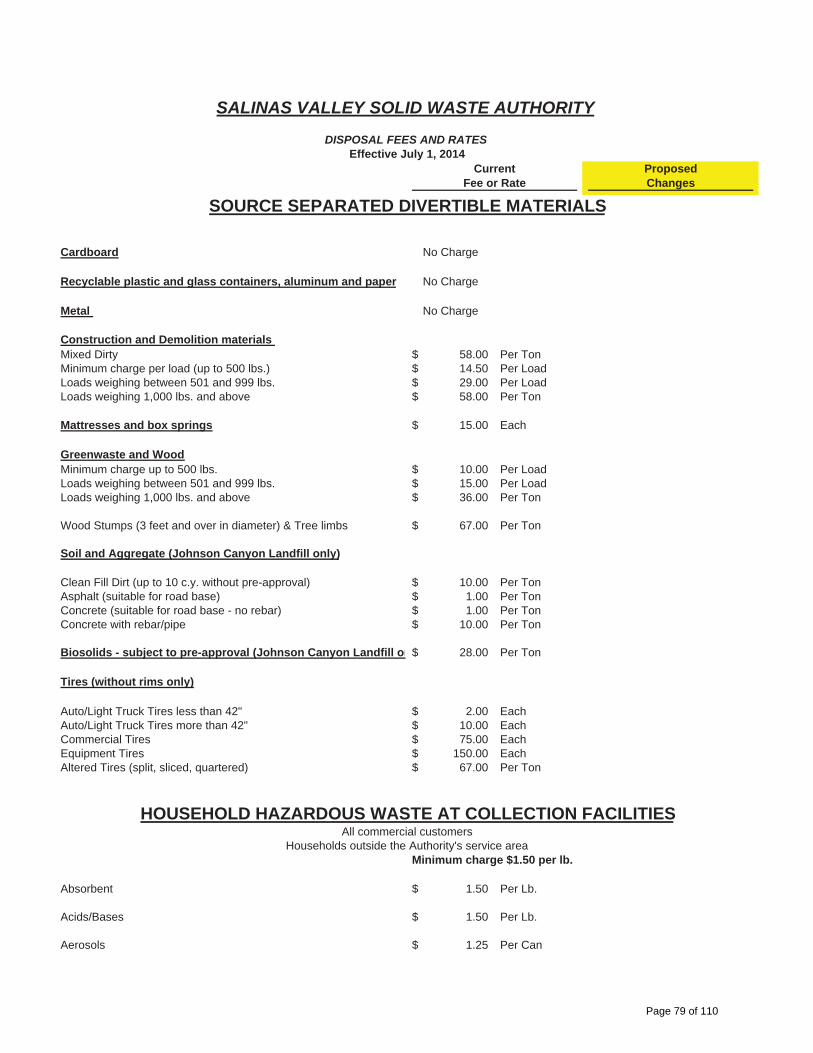
SALINAS VALLEY SOLID WASTE AUTHORITY
DISPOSAL FEES AND RATESEffective July 1, 2014
Current ProposedFee or Rate Changes
Cardboard No Charge
Recyclable plastic and glass containers, aluminum and paper No Charge
Metal No Charge
Construction and Demolition materials Mixed Dirty 58.00$ Per TonMinimum charge per load (up to 500 lbs.) 14.50$ Per LoadLoads weighing between 501 and 999 lbs. 29.00$ Per LoadLoads weighing 1,000 lbs. and above 58.00$ Per Ton
Mattresses and box springs 15.00$ Each
Greenwaste and WoodMinimum charge up to 500 lbs. 10.00$ Per LoadLoads weighing between 501 and 999 lbs. 15.00$ Per LoadLoads weighing 1,000 lbs. and above 36.00$ Per Ton
Wood Stumps (3 feet and over in diameter) & Tree limbs 67.00$ Per Ton
Soil and Aggregate (Johnson Canyon Landfill only)
Clean Fill Dirt (up to 10 c.y. without pre-approval) 10.00$ Per TonAsphalt (suitable for road base) 1.00$ Per TonConcrete (suitable for road base - no rebar) 1.00$ Per TonConcrete with rebar/pipe 10.00$ Per Ton
Biosolids - subject to pre-approval (Johnson Canyon Landfill on 28.00$ Per Ton
Tires (without rims only)
Auto/Light Truck Tires less than 42" 2.00$ EachAuto/Light Truck Tires more than 42" 10.00$ EachCommercial Tires 75.00$ EachEquipment Tires 150.00$ EachAltered Tires (split, sliced, quartered) 67.00$ Per Ton
Minimum charge $1.50 per lb.
Absorbent 1.50$ Per Lb.
Acids/Bases 1.50$ Per Lb.
Aerosols 1.25$ Per Can
Households outside the Authority's service area
SOURCE SEPARATED DIVERTIBLE MATERIALS
HOUSEHOLD HAZARDOUS WASTE AT COLLECTION FACILITIESAll commercial customers
Page 79 of 110
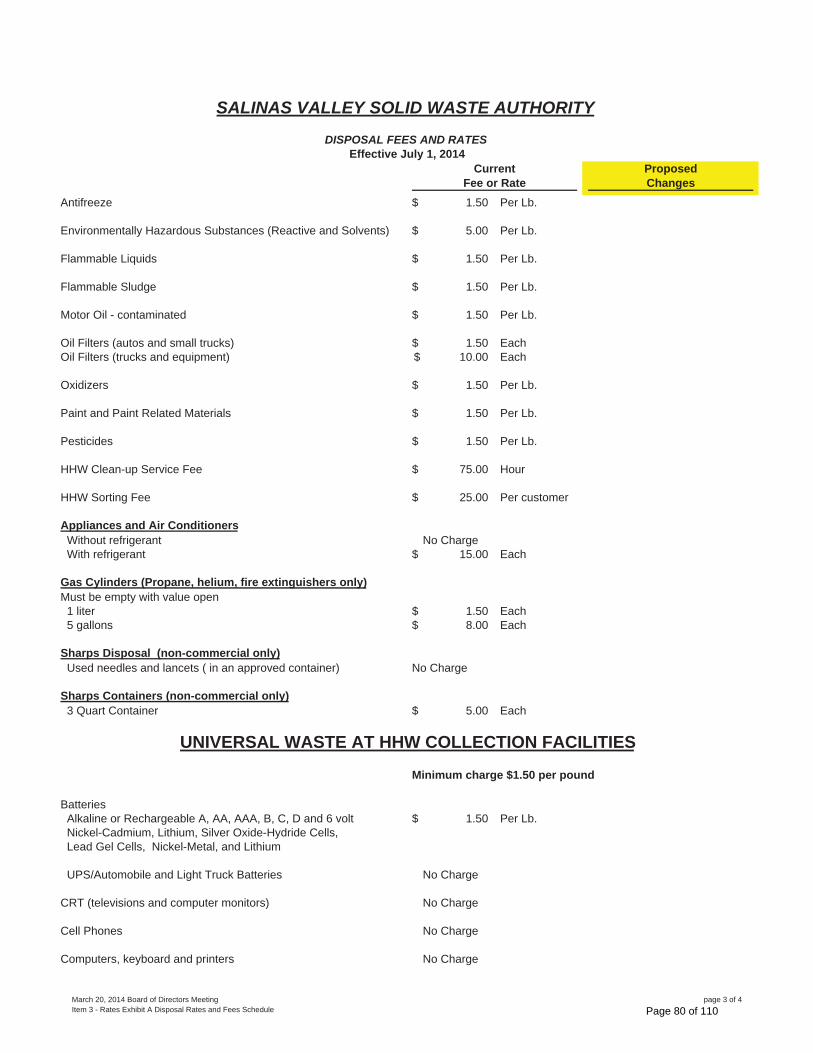
SALINAS VALLEY SOLID WASTE AUTHORITY
DISPOSAL FEES AND RATESEffective July 1, 2014
Current ProposedFee or Rate Changes
Antifreeze 1.50$ Per Lb.
Environmentally Hazardous Substances (Reactive and Solvents) 5.00$ Per Lb.
Flammable Liquids 1.50$ Per Lb.
Flammable Sludge 1.50$ Per Lb.
Motor Oil - contaminated 1.50$ Per Lb.
Oil Filters (autos and small trucks) 1.50$ EachOil Filters (trucks and equipment) 10.00$ Each
Oxidizers 1.50$ Per Lb.
Paint and Paint Related Materials 1.50$ Per Lb.
Pesticides 1.50$ Per Lb.
HHW Clean-up Service Fee 75.00$ Hour
HHW Sorting Fee 25.00$ Per customer
Appliances and Air Conditioners Without refrigerant No Charge With refrigerant 15.00$ Each
Gas Cylinders (Propane, helium, fire extinguishers only)Must be empty with value open 1 liter 1.50$ Each 5 gallons 8.00$ Each
Sharps Disposal (non-commercial only) Used needles and lancets ( in an approved container) No Charge
Sharps Containers (non-commercial only) 3 Quart Container 5.00$ Each
Minimum charge $1.50 per pound
Batteries Alkaline or Rechargeable A, AA, AAA, B, C, D and 6 volt 1.50$ Per Lb. Nickel-Cadmium, Lithium, Silver Oxide-Hydride Cells, Lead Gel Cells, Nickel-Metal, and Lithium
UPS/Automobile and Light Truck Batteries No Charge
CRT (televisions and computer monitors) No Charge
Cell Phones No Charge
Computers, keyboard and printers No Charge
UNIVERSAL WASTE AT HHW COLLECTION FACILITIES
March 20, 2014 Board of Directors MeetingItem 3 - Rates Exhibit A Disposal Rates and Fees Schedule
page 3 of 4
Page 80 of 110
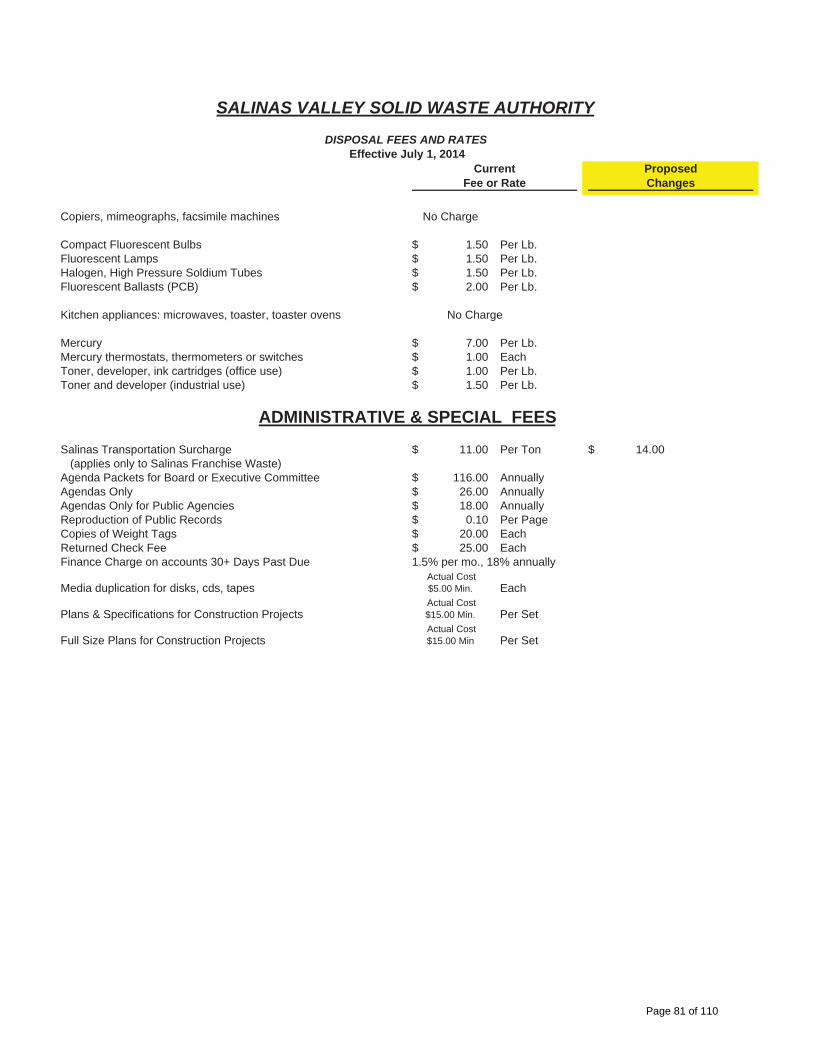
SALINAS VALLEY SOLID WASTE AUTHORITY
DISPOSAL FEES AND RATESEffective July 1, 2014
Current ProposedFee or Rate Changes
Copiers, mimeographs, facsimile machines No Charge
Compact Fluorescent Bulbs 1.50$ Per Lb.Fluorescent Lamps 1.50$ Per Lb.Halogen, High Pressure Soldium Tubes 1.50$ Per Lb.Fluorescent Ballasts (PCB) 2.00$ Per Lb.
Kitchen appliances: microwaves, toaster, toaster ovens No Charge
Mercury 7.00$ Per Lb.Mercury thermostats, thermometers or switches 1.00$ EachToner, developer, ink cartridges (office use) 1.00$ Per Lb.Toner and developer (industrial use) 1.50$ Per Lb.
Salinas Transportation Surcharge 11.00$ Per Ton 14.00$ (applies only to Salinas Franchise Waste)Agenda Packets for Board or Executive Committee 116.00$ AnnuallyAgendas Only 26.00$ AnnuallyAgendas Only for Public Agencies 18.00$ AnnuallyReproduction of Public Records 0.10$ Per PageCopies of Weight Tags 20.00$ EachReturned Check Fee 25.00$ EachFinance Charge on accounts 30+ Days Past Due 1.5% per mo., 18% annually
Media duplication for disks, cds, tapes Actual Cost$5.00 Min. Each
Plans & Specifications for Construction Projects Actual Cost$15.00 Min. Per Set
Full Size Plans for Construction Projects Actual Cost$15.00 Min Per Set
ADMINISTRATIVE & SPECIAL FEES
Page 81 of 110

This page intentionally left blank
Page 82 of 110
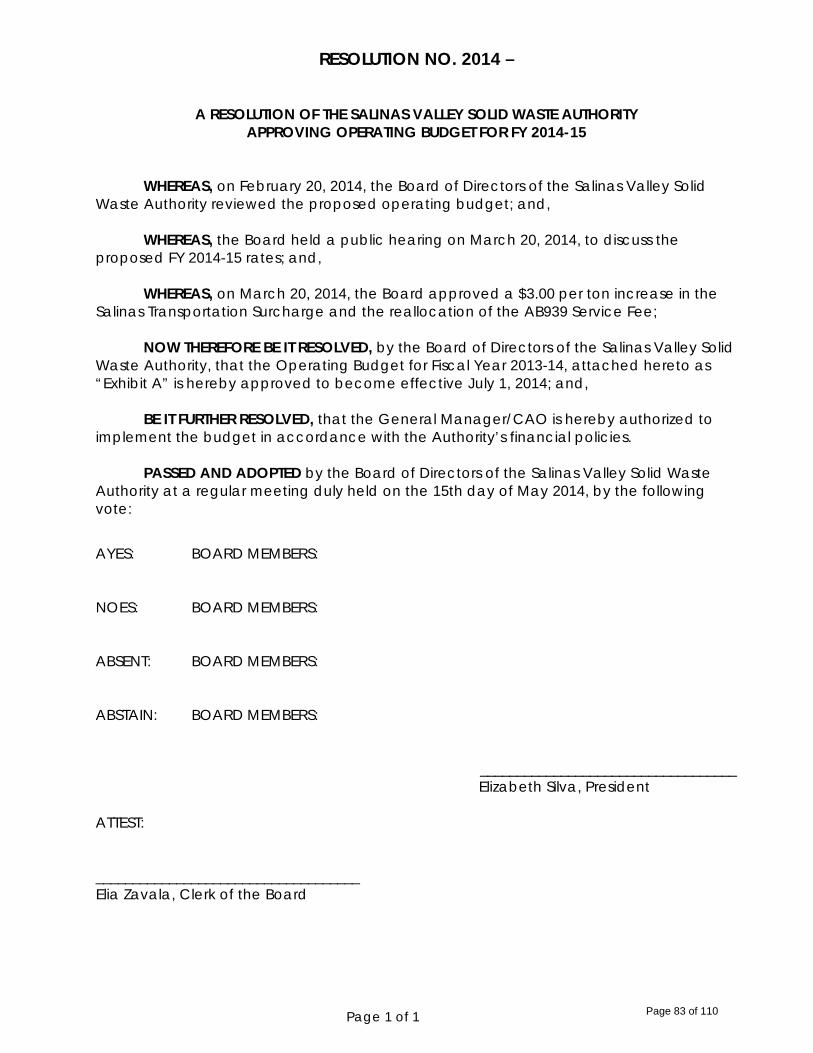
Page 1 of 1
RESOLUTION NO. 2014 –
A RESOLUTION OF THE SALINAS VALLEY SOLID WASTE AUTHORITY APPROVING OPERATING BUDGET FOR FY 2014-15
WHEREAS, on February 20, 2014, the Board of Directors of the Salinas Valley Solid Waste Authority reviewed the proposed operating budget; and,
WHEREAS, the Board held a public hearing on March 20, 2014, to discuss the
proposed FY 2014-15 rates; and,
WHEREAS, on March 20, 2014, the Board approved a $3.00 per ton increase in the Salinas Transportation Surcharge and the reallocation of the AB939 Service Fee;
NOW THEREFORE BE IT RESOLVED, by the Board of Directors of the Salinas Valley Solid
Waste Authority, that the Operating Budget for Fiscal Year 2013-14, attached hereto as “Exhibit A” is hereby approved to become effective July 1, 2014; and,
BE IT FURTHER RESOLVED, that the General Manager/CAO is hereby authorized to implement the budget in accordance with the Authority’s financial policies.
PASSED AND ADOPTED by the Board of Directors of the Salinas Valley Solid Waste Authority at a regular meeting duly held on the 15th day of May 2014, by the following vote:
AYES: BOARD MEMBERS: NOES: BOARD MEMBERS: ABSENT: BOARD MEMBERS: ABSTAIN: BOARD MEMBERS:
___________________________________ Elizabeth Silva, President ATTEST: ____________________________________ Elia Zavala, Clerk of the Board
Page 83 of 110

This page intentionally left blank
Page 84 of 110
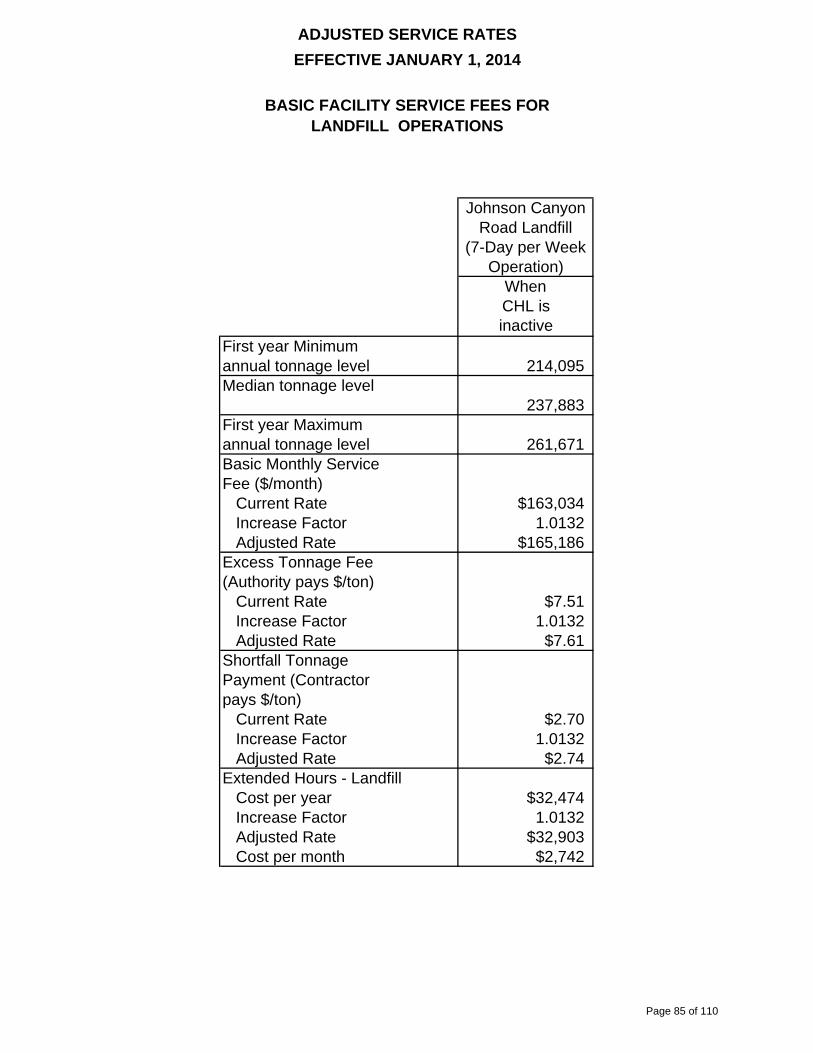
ADJUSTED SERVICE RATES EFFECTIVE JANUARY 1, 2014
BASIC FACILITY SERVICE FEES FOR LANDFILL OPERATIONS
Johnson CanyonRoad Landfill
(7-Day per WeekOperation)
WhenCHL isinactive
First year Minimumannual tonnage level 214,095 Median tonnage level
237,883 First year Maximumannual tonnage level 261,671 Basic Monthly ServiceFee ($/month)
Current Rate $163,034Increase Factor 1.0132 Adjusted Rate $165,186
Excess Tonnage Fee(Authority pays $/ton)
Current Rate $7.51Increase Factor 1.0132 Adjusted Rate $7.61
Shortfall TonnagePayment (Contractorpays $/ton)
Current Rate $2.70Increase Factor 1.0132 Adjusted Rate $2.74
Extended Hours - LandfillCost per year $32,474Increase Factor 1.0132 Adjusted Rate $32,903Cost per month $2,742
Page 85 of 110

This page intentionally left blank
Page 86 of 110
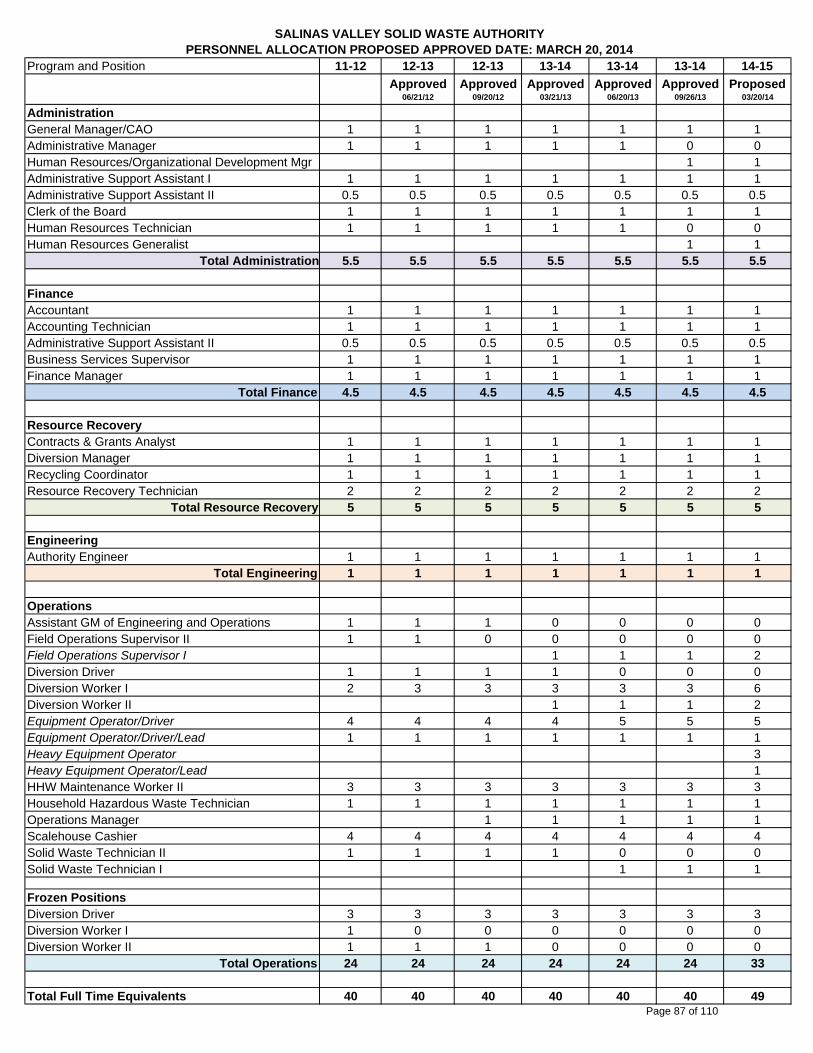
Program and Position 11-12 12-13 12-13 13-14 13-14 13-14 14-15
Approved06/21/12
Approved09/20/12
Approved03/21/13
Approved06/20/13
Approved09/26/13
Proposed03/20/14
AdministrationGeneral Manager/CAO 1 1 1 1 1 1 1Administrative Manager 1 1 1 1 1 0 0Human Resources/Organizational Development Mgr 1 1Administrative Support Assistant I 1 1 1 1 1 1 1Administrative Support Assistant II 0.5 0.5 0.5 0.5 0.5 0.5 0.5Clerk of the Board 1 1 1 1 1 1 1Human Resources Technician 1 1 1 1 1 0 0Human Resources Generalist 1 1
Total Administration 5.5 5.5 5.5 5.5 5.5 5.5 5.5
FinanceAccountant 1 1 1 1 1 1 1Accounting Technician 1 1 1 1 1 1 1Administrative Support Assistant II 0.5 0.5 0.5 0.5 0.5 0.5 0.5Business Services Supervisor 1 1 1 1 1 1 1Finance Manager 1 1 1 1 1 1 1
Total Finance 4.5 4.5 4.5 4.5 4.5 4.5 4.5
Resource RecoveryContracts & Grants Analyst 1 1 1 1 1 1 1Diversion Manager 1 1 1 1 1 1 1Recycling Coordinator 1 1 1 1 1 1 1Resource Recovery Technician 2 2 2 2 2 2 2
Total Resource Recovery 5 5 5 5 5 5 5
EngineeringAuthority Engineer 1 1 1 1 1 1 1
Total Engineering 1 1 1 1 1 1 1
OperationsAssistant GM of Engineering and Operations 1 1 1 0 0 0 0Field Operations Supervisor II 1 1 0 0 0 0 0Field Operations Supervisor I 1 1 1 2Diversion Driver 1 1 1 1 0 0 0Diversion Worker I 2 3 3 3 3 3 6Diversion Worker II 1 1 1 2Equipment Operator/Driver 4 4 4 4 5 5 5Equipment Operator/Driver/Lead 1 1 1 1 1 1 1Heavy Equipment Operator 3Heavy Equipment Operator/Lead 1HHW Maintenance Worker II 3 3 3 3 3 3 3Household Hazardous Waste Technician 1 1 1 1 1 1 1Operations Manager 1 1 1 1 1Scalehouse Cashier 4 4 4 4 4 4 4Solid Waste Technician II 1 1 1 1 0 0 0Solid Waste Technician I 1 1 1
Frozen PositionsDiversion Driver 3 3 3 3 3 3 3Diversion Worker I 1 0 0 0 0 0 0Diversion Worker II 1 1 1 0 0 0 0
Total Operations 24 24 24 24 24 24 33
Total Full Time Equivalents 40 40 40 40 40 40 49
PERSONNEL ALLOCATION PROPOSED APPROVED DATE: MARCH 20, 2014SALINAS VALLEY SOLID WASTE AUTHORITY
Page 87 of 110

This page intentionally left blank
Page 88 of 110
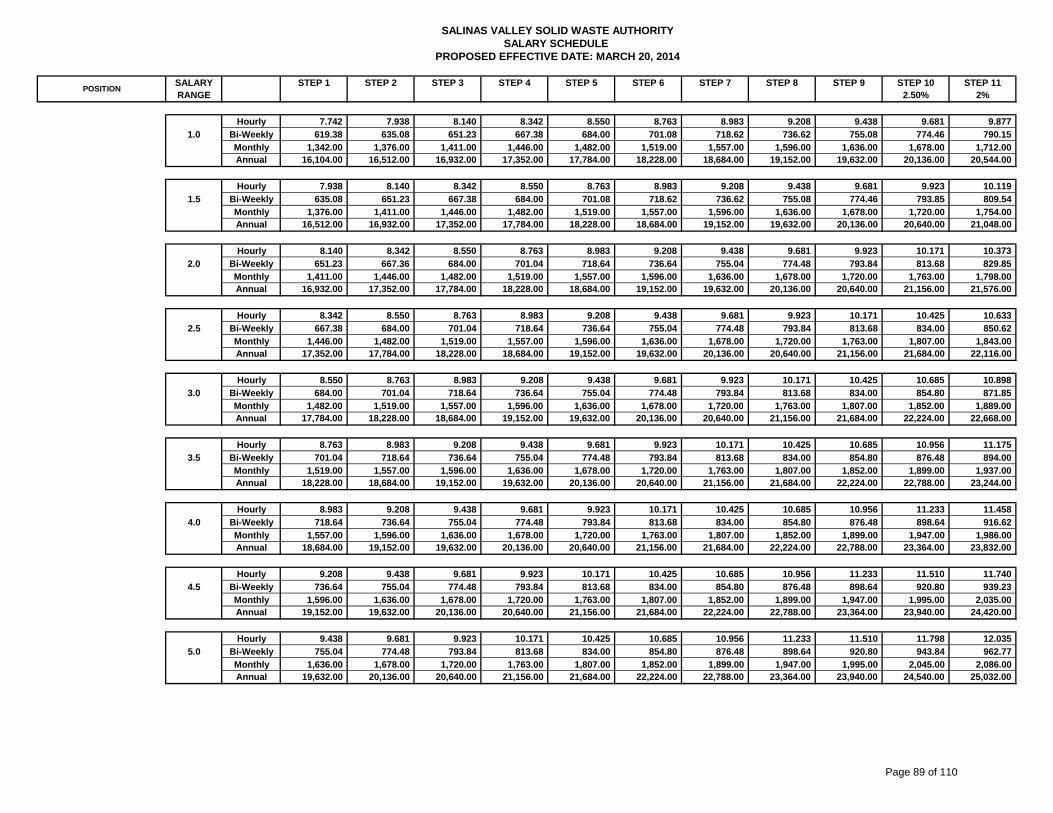
SALARY STEP 1 STEP 2 STEP 3 STEP 4 STEP 5 STEP 6 STEP 7 STEP 8 STEP 9 STEP 10 STEP 11RANGE 2.50% 2%
Hourly 7.742 7.938 8.140 8.342 8.550 8.763 8.983 9.208 9.438 9.681 9.877
1.0 Bi-Weekly 619.38 635.08 651.23 667.38 684.00 701.08 718.62 736.62 755.08 774.46 790.15
Monthly 1,342.00 1,376.00 1,411.00 1,446.00 1,482.00 1,519.00 1,557.00 1,596.00 1,636.00 1,678.00 1,712.00 Annual 16,104.00 16,512.00 16,932.00 17,352.00 17,784.00 18,228.00 18,684.00 19,152.00 19,632.00 20,136.00 20,544.00
Hourly 7.938 8.140 8.342 8.550 8.763 8.983 9.208 9.438 9.681 9.923 10.119
1.5 Bi-Weekly 635.08 651.23 667.38 684.00 701.08 718.62 736.62 755.08 774.46 793.85 809.54
Monthly 1,376.00 1,411.00 1,446.00 1,482.00 1,519.00 1,557.00 1,596.00 1,636.00 1,678.00 1,720.00 1,754.00 Annual 16,512.00 16,932.00 17,352.00 17,784.00 18,228.00 18,684.00 19,152.00 19,632.00 20,136.00 20,640.00 21,048.00
Hourly 8.140 8.342 8.550 8.763 8.983 9.208 9.438 9.681 9.923 10.171 10.373
2.0 Bi-Weekly 651.23 667.36 684.00 701.04 718.64 736.64 755.04 774.48 793.84 813.68 829.85
Monthly 1,411.00 1,446.00 1,482.00 1,519.00 1,557.00 1,596.00 1,636.00 1,678.00 1,720.00 1,763.00 1,798.00 Annual 16,932.00 17,352.00 17,784.00 18,228.00 18,684.00 19,152.00 19,632.00 20,136.00 20,640.00 21,156.00 21,576.00
Hourly 8.342 8.550 8.763 8.983 9.208 9.438 9.681 9.923 10.171 10.425 10.633
2.5 Bi-Weekly 667.38 684.00 701.04 718.64 736.64 755.04 774.48 793.84 813.68 834.00 850.62
Monthly 1,446.00 1,482.00 1,519.00 1,557.00 1,596.00 1,636.00 1,678.00 1,720.00 1,763.00 1,807.00 1,843.00 Annual 17,352.00 17,784.00 18,228.00 18,684.00 19,152.00 19,632.00 20,136.00 20,640.00 21,156.00 21,684.00 22,116.00
Hourly 8.550 8.763 8.983 9.208 9.438 9.681 9.923 10.171 10.425 10.685 10.898
3.0 Bi-Weekly 684.00 701.04 718.64 736.64 755.04 774.48 793.84 813.68 834.00 854.80 871.85
Monthly 1 482 00 1 519 00 1 557 00 1 596 00 1 636 00 1 678 00 1 720 00 1 763 00 1 807 00 1 852 00 1 889 00
SALINAS VALLEY SOLID WASTE AUTHORITYSALARY SCHEDULE
PROPOSED EFFECTIVE DATE: MARCH 20, 2014
POSITION
Monthly 1,482.00 1,519.00 1,557.00 1,596.00 1,636.00 1,678.00 1,720.00 1,763.00 1,807.00 1,852.00 1,889.00 Annual 17,784.00 18,228.00 18,684.00 19,152.00 19,632.00 20,136.00 20,640.00 21,156.00 21,684.00 22,224.00 22,668.00
Hourly 8.763 8.983 9.208 9.438 9.681 9.923 10.171 10.425 10.685 10.956 11.175
3.5 Bi-Weekly 701.04 718.64 736.64 755.04 774.48 793.84 813.68 834.00 854.80 876.48 894.00
Monthly 1,519.00 1,557.00 1,596.00 1,636.00 1,678.00 1,720.00 1,763.00 1,807.00 1,852.00 1,899.00 1,937.00 Annual 18,228.00 18,684.00 19,152.00 19,632.00 20,136.00 20,640.00 21,156.00 21,684.00 22,224.00 22,788.00 23,244.00
Hourly 8.983 9.208 9.438 9.681 9.923 10.171 10.425 10.685 10.956 11.233 11.458
4.0 Bi-Weekly 718.64 736.64 755.04 774.48 793.84 813.68 834.00 854.80 876.48 898.64 916.62
Monthly 1,557.00 1,596.00 1,636.00 1,678.00 1,720.00 1,763.00 1,807.00 1,852.00 1,899.00 1,947.00 1,986.00 Annual 18,684.00 19,152.00 19,632.00 20,136.00 20,640.00 21,156.00 21,684.00 22,224.00 22,788.00 23,364.00 23,832.00
Hourly 9.208 9.438 9.681 9.923 10.171 10.425 10.685 10.956 11.233 11.510 11.740
4.5 Bi-Weekly 736.64 755.04 774.48 793.84 813.68 834.00 854.80 876.48 898.64 920.80 939.23
Monthly 1,596.00 1,636.00 1,678.00 1,720.00 1,763.00 1,807.00 1,852.00 1,899.00 1,947.00 1,995.00 2,035.00 Annual 19,152.00 19,632.00 20,136.00 20,640.00 21,156.00 21,684.00 22,224.00 22,788.00 23,364.00 23,940.00 24,420.00
Hourly 9.438 9.681 9.923 10.171 10.425 10.685 10.956 11.233 11.510 11.798 12.035
5.0 Bi-Weekly 755.04 774.48 793.84 813.68 834.00 854.80 876.48 898.64 920.80 943.84 962.77
Monthly 1,636.00 1,678.00 1,720.00 1,763.00 1,807.00 1,852.00 1,899.00 1,947.00 1,995.00 2,045.00 2,086.00 Annual 19,632.00 20,136.00 20,640.00 21,156.00 21,684.00 22,224.00 22,788.00 23,364.00 23,940.00 24,540.00 25,032.00
Page 89 of 110
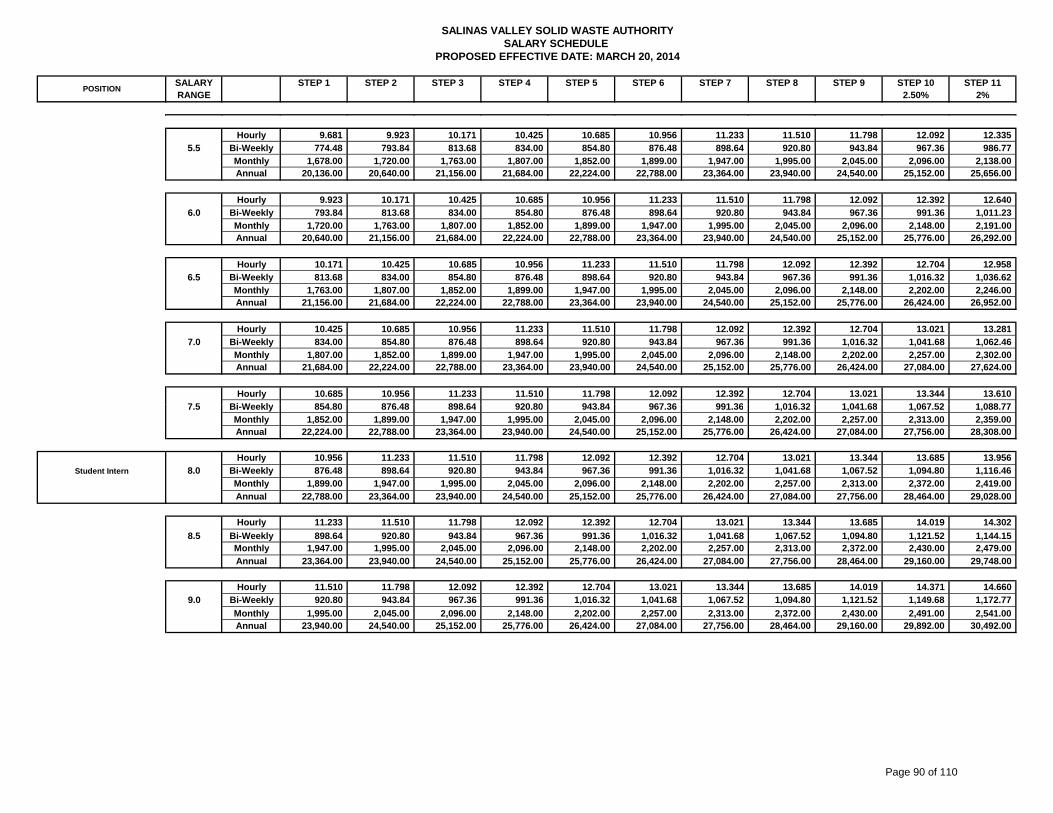
SALARY STEP 1 STEP 2 STEP 3 STEP 4 STEP 5 STEP 6 STEP 7 STEP 8 STEP 9 STEP 10 STEP 11RANGE 2.50% 2%
SALINAS VALLEY SOLID WASTE AUTHORITYSALARY SCHEDULE
PROPOSED EFFECTIVE DATE: MARCH 20, 2014
POSITION
Hourly 9.681 9.923 10.171 10.425 10.685 10.956 11.233 11.510 11.798 12.092 12.335
5.5 Bi-Weekly 774.48 793.84 813.68 834.00 854.80 876.48 898.64 920.80 943.84 967.36 986.77
Monthly 1,678.00 1,720.00 1,763.00 1,807.00 1,852.00 1,899.00 1,947.00 1,995.00 2,045.00 2,096.00 2,138.00 Annual 20,136.00 20,640.00 21,156.00 21,684.00 22,224.00 22,788.00 23,364.00 23,940.00 24,540.00 25,152.00 25,656.00
Hourly 9.923 10.171 10.425 10.685 10.956 11.233 11.510 11.798 12.092 12.392 12.640
6.0 Bi-Weekly 793.84 813.68 834.00 854.80 876.48 898.64 920.80 943.84 967.36 991.36 1,011.23
Monthly 1,720.00 1,763.00 1,807.00 1,852.00 1,899.00 1,947.00 1,995.00 2,045.00 2,096.00 2,148.00 2,191.00 Annual 20,640.00 21,156.00 21,684.00 22,224.00 22,788.00 23,364.00 23,940.00 24,540.00 25,152.00 25,776.00 26,292.00
Hourly 10.171 10.425 10.685 10.956 11.233 11.510 11.798 12.092 12.392 12.704 12.958
6.5 Bi-Weekly 813.68 834.00 854.80 876.48 898.64 920.80 943.84 967.36 991.36 1,016.32 1,036.62
Monthly 1,763.00 1,807.00 1,852.00 1,899.00 1,947.00 1,995.00 2,045.00 2,096.00 2,148.00 2,202.00 2,246.00 Annual 21,156.00 21,684.00 22,224.00 22,788.00 23,364.00 23,940.00 24,540.00 25,152.00 25,776.00 26,424.00 26,952.00
Hourly 10.425 10.685 10.956 11.233 11.510 11.798 12.092 12.392 12.704 13.021 13.281
7.0 Bi-Weekly 834.00 854.80 876.48 898.64 920.80 943.84 967.36 991.36 1,016.32 1,041.68 1,062.46
Monthly 1,807.00 1,852.00 1,899.00 1,947.00 1,995.00 2,045.00 2,096.00 2,148.00 2,202.00 2,257.00 2,302.00 Annual 21,684.00 22,224.00 22,788.00 23,364.00 23,940.00 24,540.00 25,152.00 25,776.00 26,424.00 27,084.00 27,624.00
Hourly 10.685 10.956 11.233 11.510 11.798 12.092 12.392 12.704 13.021 13.344 13.610
7 5 Bi W kl 854 80 876 48 898 64 920 80 943 84 967 36 991 36 1 016 32 1 041 68 1 067 52 1 088 777.5 Bi-Weekly 854.80 876.48 898.64 920.80 943.84 967.36 991.36 1,016.32 1,041.68 1,067.52 1,088.77
Monthly 1,852.00 1,899.00 1,947.00 1,995.00 2,045.00 2,096.00 2,148.00 2,202.00 2,257.00 2,313.00 2,359.00 Annual 22,224.00 22,788.00 23,364.00 23,940.00 24,540.00 25,152.00 25,776.00 26,424.00 27,084.00 27,756.00 28,308.00
Hourly 10.956 11.233 11.510 11.798 12.092 12.392 12.704 13.021 13.344 13.685 13.956 Student Intern 8.0 Bi-Weekly 876.48 898.64 920.80 943.84 967.36 991.36 1,016.32 1,041.68 1,067.52 1,094.80 1,116.46
Monthly 1,899.00 1,947.00 1,995.00 2,045.00 2,096.00 2,148.00 2,202.00 2,257.00 2,313.00 2,372.00 2,419.00
Annual 22,788.00 23,364.00 23,940.00 24,540.00 25,152.00 25,776.00 26,424.00 27,084.00 27,756.00 28,464.00 29,028.00
Hourly 11.233 11.510 11.798 12.092 12.392 12.704 13.021 13.344 13.685 14.019 14.302
8.5 Bi-Weekly 898.64 920.80 943.84 967.36 991.36 1,016.32 1,041.68 1,067.52 1,094.80 1,121.52 1,144.15 Monthly 1,947.00 1,995.00 2,045.00 2,096.00 2,148.00 2,202.00 2,257.00 2,313.00 2,372.00 2,430.00 2,479.00
Annual 23,364.00 23,940.00 24,540.00 25,152.00 25,776.00 26,424.00 27,084.00 27,756.00 28,464.00 29,160.00 29,748.00
Hourly 11.510 11.798 12.092 12.392 12.704 13.021 13.344 13.685 14.019 14.371 14.660
9.0 Bi-Weekly 920.80 943.84 967.36 991.36 1,016.32 1,041.68 1,067.52 1,094.80 1,121.52 1,149.68 1,172.77
Monthly 1,995.00 2,045.00 2,096.00 2,148.00 2,202.00 2,257.00 2,313.00 2,372.00 2,430.00 2,491.00 2,541.00 Annual 23,940.00 24,540.00 25,152.00 25,776.00 26,424.00 27,084.00 27,756.00 28,464.00 29,160.00 29,892.00 30,492.00
Page 90 of 110
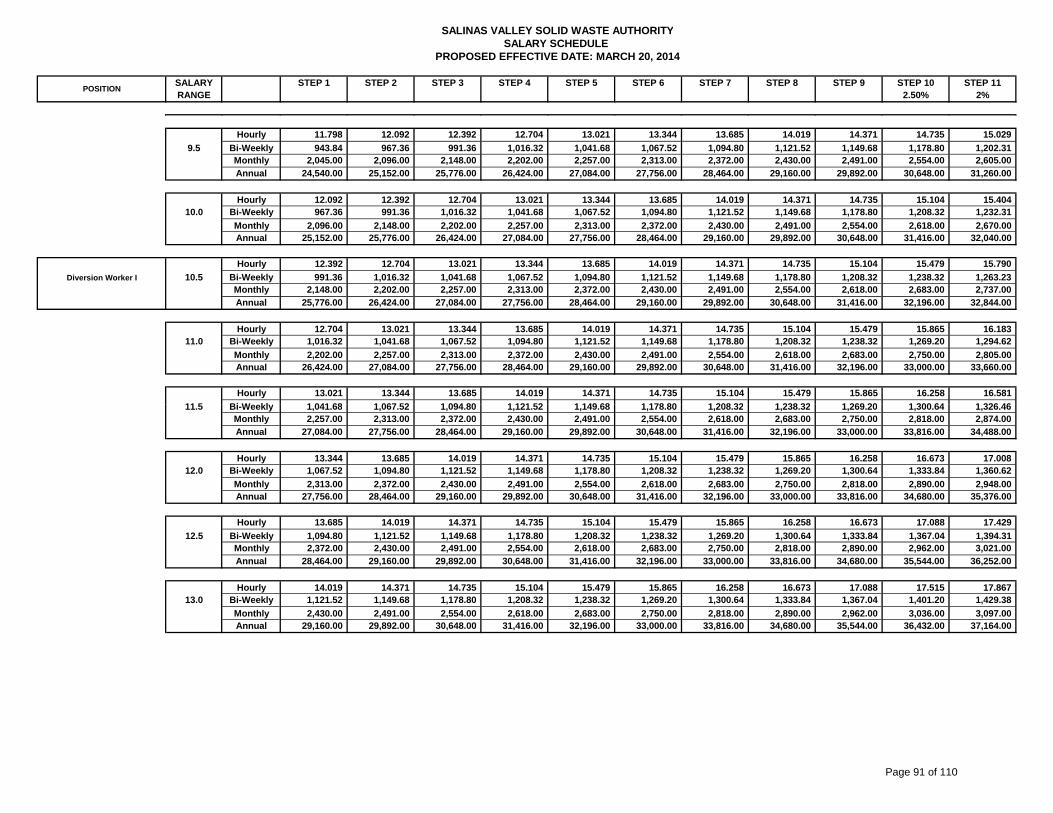
SALARY STEP 1 STEP 2 STEP 3 STEP 4 STEP 5 STEP 6 STEP 7 STEP 8 STEP 9 STEP 10 STEP 11RANGE 2.50% 2%
SALINAS VALLEY SOLID WASTE AUTHORITYSALARY SCHEDULE
PROPOSED EFFECTIVE DATE: MARCH 20, 2014
POSITION
Hourly 11.798 12.092 12.392 12.704 13.021 13.344 13.685 14.019 14.371 14.735 15.029
9.5 Bi-Weekly 943.84 967.36 991.36 1,016.32 1,041.68 1,067.52 1,094.80 1,121.52 1,149.68 1,178.80 1,202.31 Monthly 2,045.00 2,096.00 2,148.00 2,202.00 2,257.00 2,313.00 2,372.00 2,430.00 2,491.00 2,554.00 2,605.00
Annual 24,540.00 25,152.00 25,776.00 26,424.00 27,084.00 27,756.00 28,464.00 29,160.00 29,892.00 30,648.00 31,260.00
Hourly 12.092 12.392 12.704 13.021 13.344 13.685 14.019 14.371 14.735 15.104 15.404 10.0 Bi-Weekly 967.36 991.36 1,016.32 1,041.68 1,067.52 1,094.80 1,121.52 1,149.68 1,178.80 1,208.32 1,232.31
Monthly 2,096.00 2,148.00 2,202.00 2,257.00 2,313.00 2,372.00 2,430.00 2,491.00 2,554.00 2,618.00 2,670.00 Annual 25,152.00 25,776.00 26,424.00 27,084.00 27,756.00 28,464.00 29,160.00 29,892.00 30,648.00 31,416.00 32,040.00
Hourly 12.392 12.704 13.021 13.344 13.685 14.019 14.371 14.735 15.104 15.479 15.790
Diversion Worker I 10.5 Bi-Weekly 991.36 1,016.32 1,041.68 1,067.52 1,094.80 1,121.52 1,149.68 1,178.80 1,208.32 1,238.32 1,263.23 Monthly 2,148.00 2,202.00 2,257.00 2,313.00 2,372.00 2,430.00 2,491.00 2,554.00 2,618.00 2,683.00 2,737.00
Annual 25,776.00 26,424.00 27,084.00 27,756.00 28,464.00 29,160.00 29,892.00 30,648.00 31,416.00 32,196.00 32,844.00
Hourly 12.704 13.021 13.344 13.685 14.019 14.371 14.735 15.104 15.479 15.865 16.183 11.0 Bi-Weekly 1,016.32 1,041.68 1,067.52 1,094.80 1,121.52 1,149.68 1,178.80 1,208.32 1,238.32 1,269.20 1,294.62
Monthly 2,202.00 2,257.00 2,313.00 2,372.00 2,430.00 2,491.00 2,554.00 2,618.00 2,683.00 2,750.00 2,805.00 Annual 26,424.00 27,084.00 27,756.00 28,464.00 29,160.00 29,892.00 30,648.00 31,416.00 32,196.00 33,000.00 33,660.00
Hourly 13.021 13.344 13.685 14.019 14.371 14.735 15.104 15.479 15.865 16.258 16.581
11 5 Bi W kl 1 041 68 1 067 52 1 094 80 1 121 52 1 149 68 1 178 80 1 208 32 1 238 32 1 269 20 1 300 64 1 326 4611.5 Bi-Weekly 1,041.68 1,067.52 1,094.80 1,121.52 1,149.68 1,178.80 1,208.32 1,238.32 1,269.20 1,300.64 1,326.46 Monthly 2,257.00 2,313.00 2,372.00 2,430.00 2,491.00 2,554.00 2,618.00 2,683.00 2,750.00 2,818.00 2,874.00
Annual 27,084.00 27,756.00 28,464.00 29,160.00 29,892.00 30,648.00 31,416.00 32,196.00 33,000.00 33,816.00 34,488.00
Hourly 13.344 13.685 14.019 14.371 14.735 15.104 15.479 15.865 16.258 16.673 17.008 12.0 Bi-Weekly 1,067.52 1,094.80 1,121.52 1,149.68 1,178.80 1,208.32 1,238.32 1,269.20 1,300.64 1,333.84 1,360.62
Monthly 2,313.00 2,372.00 2,430.00 2,491.00 2,554.00 2,618.00 2,683.00 2,750.00 2,818.00 2,890.00 2,948.00 Annual 27,756.00 28,464.00 29,160.00 29,892.00 30,648.00 31,416.00 32,196.00 33,000.00 33,816.00 34,680.00 35,376.00
Hourly 13.685 14.019 14.371 14.735 15.104 15.479 15.865 16.258 16.673 17.088 17.429
12.5 Bi-Weekly 1,094.80 1,121.52 1,149.68 1,178.80 1,208.32 1,238.32 1,269.20 1,300.64 1,333.84 1,367.04 1,394.31 Monthly 2,372.00 2,430.00 2,491.00 2,554.00 2,618.00 2,683.00 2,750.00 2,818.00 2,890.00 2,962.00 3,021.00
Annual 28,464.00 29,160.00 29,892.00 30,648.00 31,416.00 32,196.00 33,000.00 33,816.00 34,680.00 35,544.00 36,252.00
Hourly 14.019 14.371 14.735 15.104 15.479 15.865 16.258 16.673 17.088 17.515 17.867 13.0 Bi-Weekly 1,121.52 1,149.68 1,178.80 1,208.32 1,238.32 1,269.20 1,300.64 1,333.84 1,367.04 1,401.20 1,429.38
Monthly 2,430.00 2,491.00 2,554.00 2,618.00 2,683.00 2,750.00 2,818.00 2,890.00 2,962.00 3,036.00 3,097.00 Annual 29,160.00 29,892.00 30,648.00 31,416.00 32,196.00 33,000.00 33,816.00 34,680.00 35,544.00 36,432.00 37,164.00
Page 91 of 110
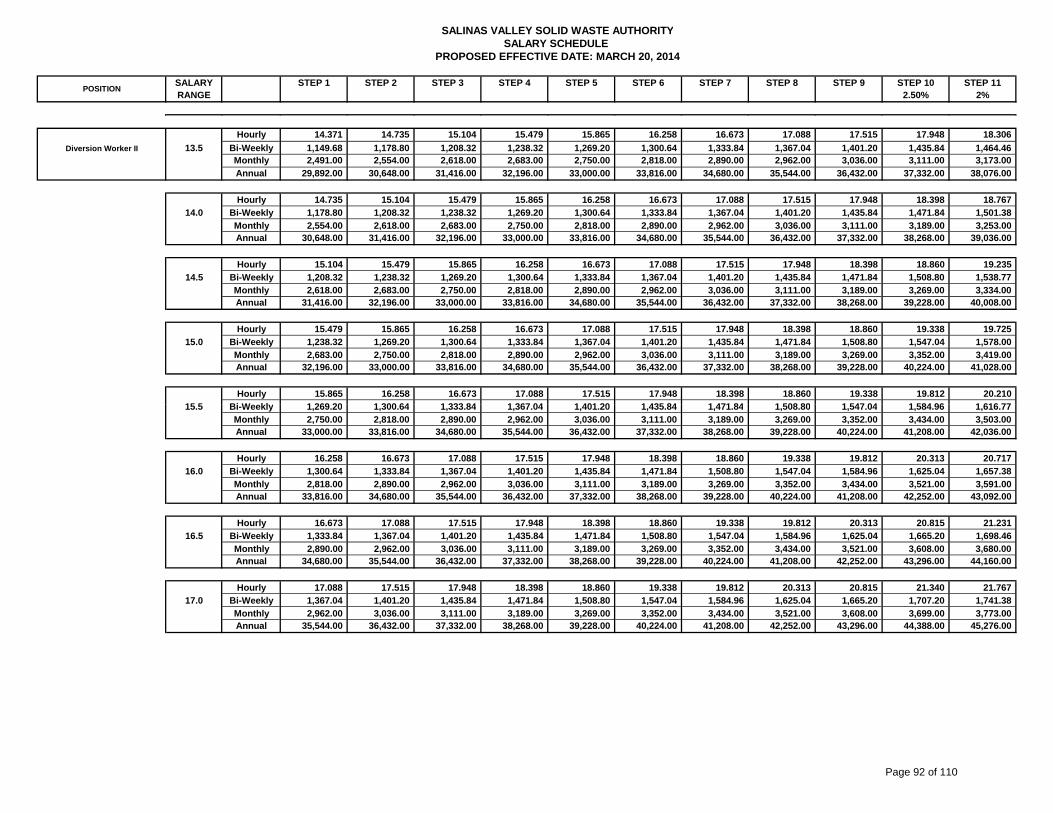
SALARY STEP 1 STEP 2 STEP 3 STEP 4 STEP 5 STEP 6 STEP 7 STEP 8 STEP 9 STEP 10 STEP 11RANGE 2.50% 2%
SALINAS VALLEY SOLID WASTE AUTHORITYSALARY SCHEDULE
PROPOSED EFFECTIVE DATE: MARCH 20, 2014
POSITION
Hourly 14.371 14.735 15.104 15.479 15.865 16.258 16.673 17.088 17.515 17.948 18.306
Diversion Worker II 13.5 Bi-Weekly 1,149.68 1,178.80 1,208.32 1,238.32 1,269.20 1,300.64 1,333.84 1,367.04 1,401.20 1,435.84 1,464.46 Monthly 2,491.00 2,554.00 2,618.00 2,683.00 2,750.00 2,818.00 2,890.00 2,962.00 3,036.00 3,111.00 3,173.00
Annual 29,892.00 30,648.00 31,416.00 32,196.00 33,000.00 33,816.00 34,680.00 35,544.00 36,432.00 37,332.00 38,076.00
Hourly 14.735 15.104 15.479 15.865 16.258 16.673 17.088 17.515 17.948 18.398 18.767
14.0 Bi-Weekly 1,178.80 1,208.32 1,238.32 1,269.20 1,300.64 1,333.84 1,367.04 1,401.20 1,435.84 1,471.84 1,501.38
Monthly 2,554.00 2,618.00 2,683.00 2,750.00 2,818.00 2,890.00 2,962.00 3,036.00 3,111.00 3,189.00 3,253.00 Annual 30,648.00 31,416.00 32,196.00 33,000.00 33,816.00 34,680.00 35,544.00 36,432.00 37,332.00 38,268.00 39,036.00
Hourly 15.104 15.479 15.865 16.258 16.673 17.088 17.515 17.948 18.398 18.860 19.235
14.5 Bi-Weekly 1,208.32 1,238.32 1,269.20 1,300.64 1,333.84 1,367.04 1,401.20 1,435.84 1,471.84 1,508.80 1,538.77
Monthly 2,618.00 2,683.00 2,750.00 2,818.00 2,890.00 2,962.00 3,036.00 3,111.00 3,189.00 3,269.00 3,334.00 Annual 31,416.00 32,196.00 33,000.00 33,816.00 34,680.00 35,544.00 36,432.00 37,332.00 38,268.00 39,228.00 40,008.00
Hourly 15.479 15.865 16.258 16.673 17.088 17.515 17.948 18.398 18.860 19.338 19.725
15.0 Bi-Weekly 1,238.32 1,269.20 1,300.64 1,333.84 1,367.04 1,401.20 1,435.84 1,471.84 1,508.80 1,547.04 1,578.00
Monthly 2,683.00 2,750.00 2,818.00 2,890.00 2,962.00 3,036.00 3,111.00 3,189.00 3,269.00 3,352.00 3,419.00 Annual 32,196.00 33,000.00 33,816.00 34,680.00 35,544.00 36,432.00 37,332.00 38,268.00 39,228.00 40,224.00 41,028.00
Hourly 15.865 16.258 16.673 17.088 17.515 17.948 18.398 18.860 19.338 19.812 20.210 15 5 Bi W kl 1 269 20 1 300 64 1 333 84 1 367 04 1 401 20 1 435 84 1 471 84 1 508 80 1 547 04 1 584 96 1 616 7715.5 Bi-Weekly 1,269.20 1,300.64 1,333.84 1,367.04 1,401.20 1,435.84 1,471.84 1,508.80 1,547.04 1,584.96 1,616.77
Monthly 2,750.00 2,818.00 2,890.00 2,962.00 3,036.00 3,111.00 3,189.00 3,269.00 3,352.00 3,434.00 3,503.00 Annual 33,000.00 33,816.00 34,680.00 35,544.00 36,432.00 37,332.00 38,268.00 39,228.00 40,224.00 41,208.00 42,036.00
Hourly 16.258 16.673 17.088 17.515 17.948 18.398 18.860 19.338 19.812 20.313 20.717
16.0 Bi-Weekly 1,300.64 1,333.84 1,367.04 1,401.20 1,435.84 1,471.84 1,508.80 1,547.04 1,584.96 1,625.04 1,657.38
Monthly 2,818.00 2,890.00 2,962.00 3,036.00 3,111.00 3,189.00 3,269.00 3,352.00 3,434.00 3,521.00 3,591.00 Annual 33,816.00 34,680.00 35,544.00 36,432.00 37,332.00 38,268.00 39,228.00 40,224.00 41,208.00 42,252.00 43,092.00
Hourly 16.673 17.088 17.515 17.948 18.398 18.860 19.338 19.812 20.313 20.815 21.231
16.5 Bi-Weekly 1,333.84 1,367.04 1,401.20 1,435.84 1,471.84 1,508.80 1,547.04 1,584.96 1,625.04 1,665.20 1,698.46
Monthly 2,890.00 2,962.00 3,036.00 3,111.00 3,189.00 3,269.00 3,352.00 3,434.00 3,521.00 3,608.00 3,680.00 Annual 34,680.00 35,544.00 36,432.00 37,332.00 38,268.00 39,228.00 40,224.00 41,208.00 42,252.00 43,296.00 44,160.00
Hourly 17.088 17.515 17.948 18.398 18.860 19.338 19.812 20.313 20.815 21.340 21.767
17.0 Bi-Weekly 1,367.04 1,401.20 1,435.84 1,471.84 1,508.80 1,547.04 1,584.96 1,625.04 1,665.20 1,707.20 1,741.38
Monthly 2,962.00 3,036.00 3,111.00 3,189.00 3,269.00 3,352.00 3,434.00 3,521.00 3,608.00 3,699.00 3,773.00 Annual 35,544.00 36,432.00 37,332.00 38,268.00 39,228.00 40,224.00 41,208.00 42,252.00 43,296.00 44,388.00 45,276.00
Page 92 of 110
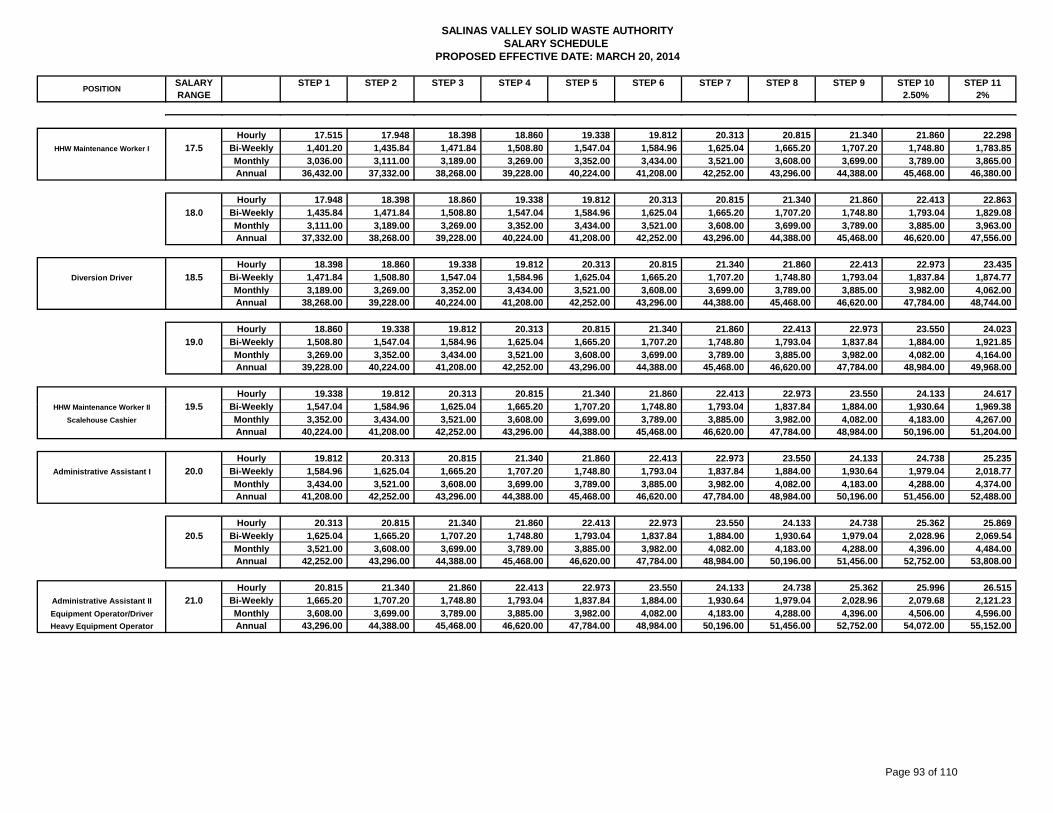
SALARY STEP 1 STEP 2 STEP 3 STEP 4 STEP 5 STEP 6 STEP 7 STEP 8 STEP 9 STEP 10 STEP 11RANGE 2.50% 2%
SALINAS VALLEY SOLID WASTE AUTHORITYSALARY SCHEDULE
PROPOSED EFFECTIVE DATE: MARCH 20, 2014
POSITION
Hourly 17.515 17.948 18.398 18.860 19.338 19.812 20.313 20.815 21.340 21.860 22.298
HHW Maintenance Worker I 17.5 Bi-Weekly 1,401.20 1,435.84 1,471.84 1,508.80 1,547.04 1,584.96 1,625.04 1,665.20 1,707.20 1,748.80 1,783.85
Monthly 3,036.00 3,111.00 3,189.00 3,269.00 3,352.00 3,434.00 3,521.00 3,608.00 3,699.00 3,789.00 3,865.00 Annual 36,432.00 37,332.00 38,268.00 39,228.00 40,224.00 41,208.00 42,252.00 43,296.00 44,388.00 45,468.00 46,380.00
Hourly 17.948 18.398 18.860 19.338 19.812 20.313 20.815 21.340 21.860 22.413 22.863
18.0 Bi-Weekly 1,435.84 1,471.84 1,508.80 1,547.04 1,584.96 1,625.04 1,665.20 1,707.20 1,748.80 1,793.04 1,829.08
Monthly 3,111.00 3,189.00 3,269.00 3,352.00 3,434.00 3,521.00 3,608.00 3,699.00 3,789.00 3,885.00 3,963.00 Annual 37,332.00 38,268.00 39,228.00 40,224.00 41,208.00 42,252.00 43,296.00 44,388.00 45,468.00 46,620.00 47,556.00
Hourly 18.398 18.860 19.338 19.812 20.313 20.815 21.340 21.860 22.413 22.973 23.435 Diversion Driver 18.5 Bi-Weekly 1,471.84 1,508.80 1,547.04 1,584.96 1,625.04 1,665.20 1,707.20 1,748.80 1,793.04 1,837.84 1,874.77
Monthly 3,189.00 3,269.00 3,352.00 3,434.00 3,521.00 3,608.00 3,699.00 3,789.00 3,885.00 3,982.00 4,062.00 Annual 38,268.00 39,228.00 40,224.00 41,208.00 42,252.00 43,296.00 44,388.00 45,468.00 46,620.00 47,784.00 48,744.00
Hourly 18.860 19.338 19.812 20.313 20.815 21.340 21.860 22.413 22.973 23.550 24.023
19.0 Bi-Weekly 1,508.80 1,547.04 1,584.96 1,625.04 1,665.20 1,707.20 1,748.80 1,793.04 1,837.84 1,884.00 1,921.85
Monthly 3,269.00 3,352.00 3,434.00 3,521.00 3,608.00 3,699.00 3,789.00 3,885.00 3,982.00 4,082.00 4,164.00 Annual 39,228.00 40,224.00 41,208.00 42,252.00 43,296.00 44,388.00 45,468.00 46,620.00 47,784.00 48,984.00 49,968.00
Hourly 19.338 19.812 20.313 20.815 21.340 21.860 22.413 22.973 23.550 24.133 24.617 19 5 Bi W kl 1 547 04 1 584 96 1 625 04 1 665 20 1 707 20 1 748 80 1 793 04 1 837 84 1 884 00 1 930 64 1 969 38HHW Maintenance Worker II 19.5 Bi-Weekly 1,547.04 1,584.96 1,625.04 1,665.20 1,707.20 1,748.80 1,793.04 1,837.84 1,884.00 1,930.64 1,969.38
Scalehouse Cashier Monthly 3,352.00 3,434.00 3,521.00 3,608.00 3,699.00 3,789.00 3,885.00 3,982.00 4,082.00 4,183.00 4,267.00 Annual 40,224.00 41,208.00 42,252.00 43,296.00 44,388.00 45,468.00 46,620.00 47,784.00 48,984.00 50,196.00 51,204.00
Hourly 19.812 20.313 20.815 21.340 21.860 22.413 22.973 23.550 24.133 24.738 25.235
Administrative Assistant I 20.0 Bi-Weekly 1,584.96 1,625.04 1,665.20 1,707.20 1,748.80 1,793.04 1,837.84 1,884.00 1,930.64 1,979.04 2,018.77
Monthly 3,434.00 3,521.00 3,608.00 3,699.00 3,789.00 3,885.00 3,982.00 4,082.00 4,183.00 4,288.00 4,374.00 Annual 41,208.00 42,252.00 43,296.00 44,388.00 45,468.00 46,620.00 47,784.00 48,984.00 50,196.00 51,456.00 52,488.00
Hourly 20.313 20.815 21.340 21.860 22.413 22.973 23.550 24.133 24.738 25.362 25.869
20.5 Bi-Weekly 1,625.04 1,665.20 1,707.20 1,748.80 1,793.04 1,837.84 1,884.00 1,930.64 1,979.04 2,028.96 2,069.54
Monthly 3,521.00 3,608.00 3,699.00 3,789.00 3,885.00 3,982.00 4,082.00 4,183.00 4,288.00 4,396.00 4,484.00 Annual 42,252.00 43,296.00 44,388.00 45,468.00 46,620.00 47,784.00 48,984.00 50,196.00 51,456.00 52,752.00 53,808.00
Hourly 20.815 21.340 21.860 22.413 22.973 23.550 24.133 24.738 25.362 25.996 26.515 Administrative Assistant II 21.0 Bi-Weekly 1,665.20 1,707.20 1,748.80 1,793.04 1,837.84 1,884.00 1,930.64 1,979.04 2,028.96 2,079.68 2,121.23
Equipment Operator/Driver Monthly 3,608.00 3,699.00 3,789.00 3,885.00 3,982.00 4,082.00 4,183.00 4,288.00 4,396.00 4,506.00 4,596.00 Heavy Equipment Operator Annual 43,296.00 44,388.00 45,468.00 46,620.00 47,784.00 48,984.00 50,196.00 51,456.00 52,752.00 54,072.00 55,152.00
Page 93 of 110
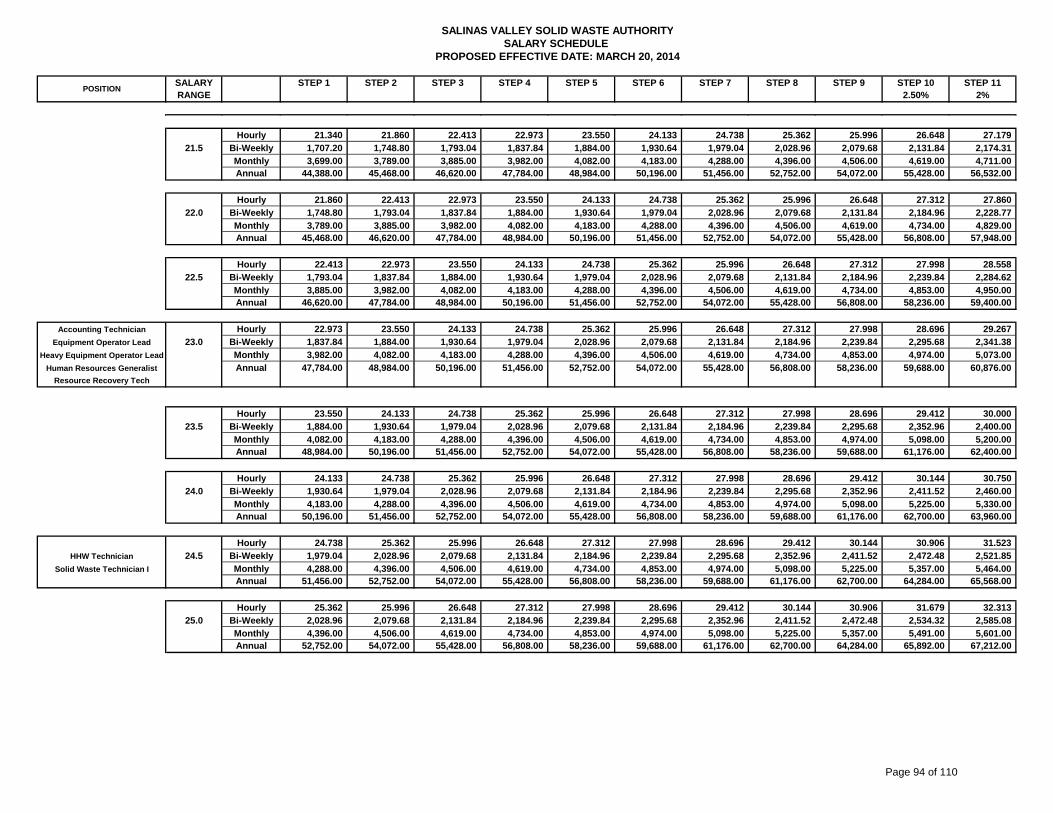
SALARY STEP 1 STEP 2 STEP 3 STEP 4 STEP 5 STEP 6 STEP 7 STEP 8 STEP 9 STEP 10 STEP 11RANGE 2.50% 2%
SALINAS VALLEY SOLID WASTE AUTHORITYSALARY SCHEDULE
PROPOSED EFFECTIVE DATE: MARCH 20, 2014
POSITION
Hourly 21.340 21.860 22.413 22.973 23.550 24.133 24.738 25.362 25.996 26.648 27.179
21.5 Bi-Weekly 1,707.20 1,748.80 1,793.04 1,837.84 1,884.00 1,930.64 1,979.04 2,028.96 2,079.68 2,131.84 2,174.31
Monthly 3,699.00 3,789.00 3,885.00 3,982.00 4,082.00 4,183.00 4,288.00 4,396.00 4,506.00 4,619.00 4,711.00 Annual 44,388.00 45,468.00 46,620.00 47,784.00 48,984.00 50,196.00 51,456.00 52,752.00 54,072.00 55,428.00 56,532.00
Hourly 21.860 22.413 22.973 23.550 24.133 24.738 25.362 25.996 26.648 27.312 27.860
22.0 Bi-Weekly 1,748.80 1,793.04 1,837.84 1,884.00 1,930.64 1,979.04 2,028.96 2,079.68 2,131.84 2,184.96 2,228.77
Monthly 3,789.00 3,885.00 3,982.00 4,082.00 4,183.00 4,288.00 4,396.00 4,506.00 4,619.00 4,734.00 4,829.00 Annual 45,468.00 46,620.00 47,784.00 48,984.00 50,196.00 51,456.00 52,752.00 54,072.00 55,428.00 56,808.00 57,948.00
Hourly 22.413 22.973 23.550 24.133 24.738 25.362 25.996 26.648 27.312 27.998 28.558
22.5 Bi-Weekly 1,793.04 1,837.84 1,884.00 1,930.64 1,979.04 2,028.96 2,079.68 2,131.84 2,184.96 2,239.84 2,284.62
Monthly 3,885.00 3,982.00 4,082.00 4,183.00 4,288.00 4,396.00 4,506.00 4,619.00 4,734.00 4,853.00 4,950.00 Annual 46,620.00 47,784.00 48,984.00 50,196.00 51,456.00 52,752.00 54,072.00 55,428.00 56,808.00 58,236.00 59,400.00
Accounting Technician Hourly 22.973 23.550 24.133 24.738 25.362 25.996 26.648 27.312 27.998 28.696 29.267
Equipment Operator Lead 23.0 Bi-Weekly 1,837.84 1,884.00 1,930.64 1,979.04 2,028.96 2,079.68 2,131.84 2,184.96 2,239.84 2,295.68 2,341.38
Heavy Equipment Operator Lead Monthly 3,982.00 4,082.00 4,183.00 4,288.00 4,396.00 4,506.00 4,619.00 4,734.00 4,853.00 4,974.00 5,073.00
Human Resources Generalist Annual 47,784.00 48,984.00 50,196.00 51,456.00 52,752.00 54,072.00 55,428.00 56,808.00 58,236.00 59,688.00 60,876.00 Resource Recovery Tech
Hourly 23.550 24.133 24.738 25.362 25.996 26.648 27.312 27.998 28.696 29.412 30.000
23.5 Bi-Weekly 1,884.00 1,930.64 1,979.04 2,028.96 2,079.68 2,131.84 2,184.96 2,239.84 2,295.68 2,352.96 2,400.00
Monthly 4,082.00 4,183.00 4,288.00 4,396.00 4,506.00 4,619.00 4,734.00 4,853.00 4,974.00 5,098.00 5,200.00 Annual 48,984.00 50,196.00 51,456.00 52,752.00 54,072.00 55,428.00 56,808.00 58,236.00 59,688.00 61,176.00 62,400.00
Hourly 24.133 24.738 25.362 25.996 26.648 27.312 27.998 28.696 29.412 30.144 30.750
24.0 Bi-Weekly 1,930.64 1,979.04 2,028.96 2,079.68 2,131.84 2,184.96 2,239.84 2,295.68 2,352.96 2,411.52 2,460.00
Monthly 4,183.00 4,288.00 4,396.00 4,506.00 4,619.00 4,734.00 4,853.00 4,974.00 5,098.00 5,225.00 5,330.00 Annual 50,196.00 51,456.00 52,752.00 54,072.00 55,428.00 56,808.00 58,236.00 59,688.00 61,176.00 62,700.00 63,960.00
Hourly 24.738 25.362 25.996 26.648 27.312 27.998 28.696 29.412 30.144 30.906 31.523
HHW Technician 24.5 Bi-Weekly 1,979.04 2,028.96 2,079.68 2,131.84 2,184.96 2,239.84 2,295.68 2,352.96 2,411.52 2,472.48 2,521.85
Solid Waste Technician I Monthly 4,288.00 4,396.00 4,506.00 4,619.00 4,734.00 4,853.00 4,974.00 5,098.00 5,225.00 5,357.00 5,464.00 Annual 51,456.00 52,752.00 54,072.00 55,428.00 56,808.00 58,236.00 59,688.00 61,176.00 62,700.00 64,284.00 65,568.00
Hourly 25.362 25.996 26.648 27.312 27.998 28.696 29.412 30.144 30.906 31.679 32.313
25.0 Bi-Weekly 2,028.96 2,079.68 2,131.84 2,184.96 2,239.84 2,295.68 2,352.96 2,411.52 2,472.48 2,534.32 2,585.08
Monthly 4,396.00 4,506.00 4,619.00 4,734.00 4,853.00 4,974.00 5,098.00 5,225.00 5,357.00 5,491.00 5,601.00 Annual 52,752.00 54,072.00 55,428.00 56,808.00 58,236.00 59,688.00 61,176.00 62,700.00 64,284.00 65,892.00 67,212.00
Page 94 of 110
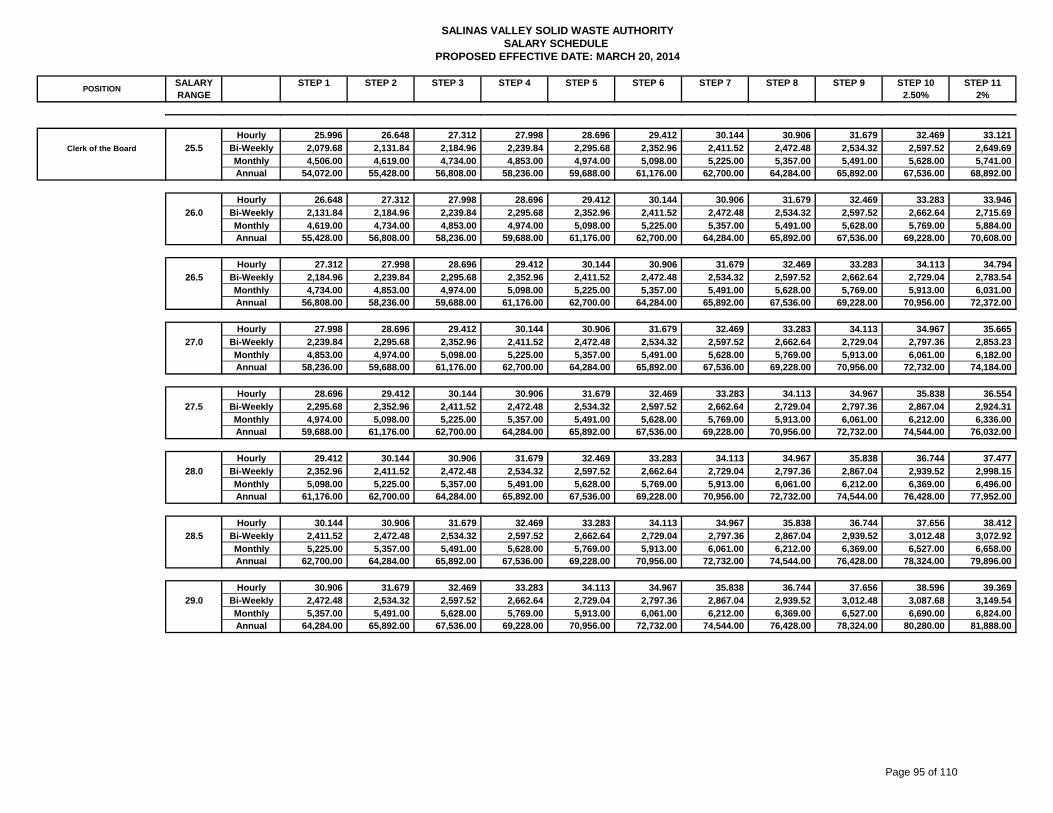
SALARY STEP 1 STEP 2 STEP 3 STEP 4 STEP 5 STEP 6 STEP 7 STEP 8 STEP 9 STEP 10 STEP 11RANGE 2.50% 2%
SALINAS VALLEY SOLID WASTE AUTHORITYSALARY SCHEDULE
PROPOSED EFFECTIVE DATE: MARCH 20, 2014
POSITION
Hourly 25.996 26.648 27.312 27.998 28.696 29.412 30.144 30.906 31.679 32.469 33.121
Clerk of the Board 25.5 Bi-Weekly 2,079.68 2,131.84 2,184.96 2,239.84 2,295.68 2,352.96 2,411.52 2,472.48 2,534.32 2,597.52 2,649.69
Monthly 4,506.00 4,619.00 4,734.00 4,853.00 4,974.00 5,098.00 5,225.00 5,357.00 5,491.00 5,628.00 5,741.00 Annual 54,072.00 55,428.00 56,808.00 58,236.00 59,688.00 61,176.00 62,700.00 64,284.00 65,892.00 67,536.00 68,892.00
Hourly 26.648 27.312 27.998 28.696 29.412 30.144 30.906 31.679 32.469 33.283 33.946
26.0 Bi-Weekly 2,131.84 2,184.96 2,239.84 2,295.68 2,352.96 2,411.52 2,472.48 2,534.32 2,597.52 2,662.64 2,715.69
Monthly 4,619.00 4,734.00 4,853.00 4,974.00 5,098.00 5,225.00 5,357.00 5,491.00 5,628.00 5,769.00 5,884.00 Annual 55,428.00 56,808.00 58,236.00 59,688.00 61,176.00 62,700.00 64,284.00 65,892.00 67,536.00 69,228.00 70,608.00
Hourly 27.312 27.998 28.696 29.412 30.144 30.906 31.679 32.469 33.283 34.113 34.794
26.5 Bi-Weekly 2,184.96 2,239.84 2,295.68 2,352.96 2,411.52 2,472.48 2,534.32 2,597.52 2,662.64 2,729.04 2,783.54
Monthly 4,734.00 4,853.00 4,974.00 5,098.00 5,225.00 5,357.00 5,491.00 5,628.00 5,769.00 5,913.00 6,031.00 Annual 56,808.00 58,236.00 59,688.00 61,176.00 62,700.00 64,284.00 65,892.00 67,536.00 69,228.00 70,956.00 72,372.00
Hourly 27.998 28.696 29.412 30.144 30.906 31.679 32.469 33.283 34.113 34.967 35.665
27.0 Bi-Weekly 2,239.84 2,295.68 2,352.96 2,411.52 2,472.48 2,534.32 2,597.52 2,662.64 2,729.04 2,797.36 2,853.23
Monthly 4,853.00 4,974.00 5,098.00 5,225.00 5,357.00 5,491.00 5,628.00 5,769.00 5,913.00 6,061.00 6,182.00 Annual 58,236.00 59,688.00 61,176.00 62,700.00 64,284.00 65,892.00 67,536.00 69,228.00 70,956.00 72,732.00 74,184.00
Hourly 28.696 29.412 30.144 30.906 31.679 32.469 33.283 34.113 34.967 35.838 36.554 27 5 Bi W kl 2 295 68 2 352 96 2 411 52 2 472 48 2 534 32 2 597 52 2 662 64 2 729 04 2 797 36 2 867 04 2 924 3127.5 Bi-Weekly 2,295.68 2,352.96 2,411.52 2,472.48 2,534.32 2,597.52 2,662.64 2,729.04 2,797.36 2,867.04 2,924.31
Monthly 4,974.00 5,098.00 5,225.00 5,357.00 5,491.00 5,628.00 5,769.00 5,913.00 6,061.00 6,212.00 6,336.00 Annual 59,688.00 61,176.00 62,700.00 64,284.00 65,892.00 67,536.00 69,228.00 70,956.00 72,732.00 74,544.00 76,032.00
Hourly 29.412 30.144 30.906 31.679 32.469 33.283 34.113 34.967 35.838 36.744 37.477
28.0 Bi-Weekly 2,352.96 2,411.52 2,472.48 2,534.32 2,597.52 2,662.64 2,729.04 2,797.36 2,867.04 2,939.52 2,998.15
Monthly 5,098.00 5,225.00 5,357.00 5,491.00 5,628.00 5,769.00 5,913.00 6,061.00 6,212.00 6,369.00 6,496.00 Annual 61,176.00 62,700.00 64,284.00 65,892.00 67,536.00 69,228.00 70,956.00 72,732.00 74,544.00 76,428.00 77,952.00
Hourly 30.144 30.906 31.679 32.469 33.283 34.113 34.967 35.838 36.744 37.656 38.412
28.5 Bi-Weekly 2,411.52 2,472.48 2,534.32 2,597.52 2,662.64 2,729.04 2,797.36 2,867.04 2,939.52 3,012.48 3,072.92
Monthly 5,225.00 5,357.00 5,491.00 5,628.00 5,769.00 5,913.00 6,061.00 6,212.00 6,369.00 6,527.00 6,658.00 Annual 62,700.00 64,284.00 65,892.00 67,536.00 69,228.00 70,956.00 72,732.00 74,544.00 76,428.00 78,324.00 79,896.00
Hourly 30.906 31.679 32.469 33.283 34.113 34.967 35.838 36.744 37.656 38.596 39.369
29.0 Bi-Weekly 2,472.48 2,534.32 2,597.52 2,662.64 2,729.04 2,797.36 2,867.04 2,939.52 3,012.48 3,087.68 3,149.54
Monthly 5,357.00 5,491.00 5,628.00 5,769.00 5,913.00 6,061.00 6,212.00 6,369.00 6,527.00 6,690.00 6,824.00 Annual 64,284.00 65,892.00 67,536.00 69,228.00 70,956.00 72,732.00 74,544.00 76,428.00 78,324.00 80,280.00 81,888.00
Page 95 of 110
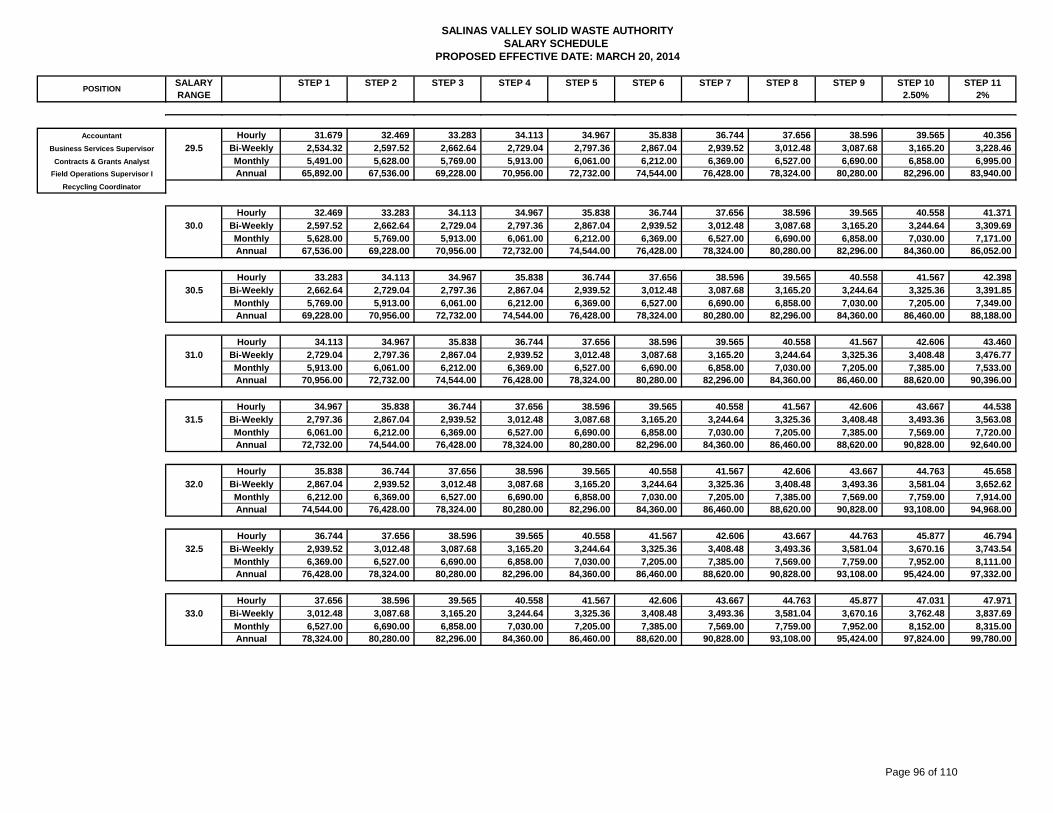
SALARY STEP 1 STEP 2 STEP 3 STEP 4 STEP 5 STEP 6 STEP 7 STEP 8 STEP 9 STEP 10 STEP 11RANGE 2.50% 2%
SALINAS VALLEY SOLID WASTE AUTHORITYSALARY SCHEDULE
PROPOSED EFFECTIVE DATE: MARCH 20, 2014
POSITION
Accountant Hourly 31.679 32.469 33.283 34.113 34.967 35.838 36.744 37.656 38.596 39.565 40.356
Business Services Supervisor 29.5 Bi-Weekly 2,534.32 2,597.52 2,662.64 2,729.04 2,797.36 2,867.04 2,939.52 3,012.48 3,087.68 3,165.20 3,228.46
Contracts & Grants Analyst Monthly 5,491.00 5,628.00 5,769.00 5,913.00 6,061.00 6,212.00 6,369.00 6,527.00 6,690.00 6,858.00 6,995.00 Field Operations Supervisor I Annual 65,892.00 67,536.00 69,228.00 70,956.00 72,732.00 74,544.00 76,428.00 78,324.00 80,280.00 82,296.00 83,940.00
Recycling Coordinator
Hourly 32.469 33.283 34.113 34.967 35.838 36.744 37.656 38.596 39.565 40.558 41.371
30.0 Bi-Weekly 2,597.52 2,662.64 2,729.04 2,797.36 2,867.04 2,939.52 3,012.48 3,087.68 3,165.20 3,244.64 3,309.69
Monthly 5,628.00 5,769.00 5,913.00 6,061.00 6,212.00 6,369.00 6,527.00 6,690.00 6,858.00 7,030.00 7,171.00 Annual 67,536.00 69,228.00 70,956.00 72,732.00 74,544.00 76,428.00 78,324.00 80,280.00 82,296.00 84,360.00 86,052.00
Hourly 33.283 34.113 34.967 35.838 36.744 37.656 38.596 39.565 40.558 41.567 42.398
30.5 Bi-Weekly 2,662.64 2,729.04 2,797.36 2,867.04 2,939.52 3,012.48 3,087.68 3,165.20 3,244.64 3,325.36 3,391.85
Monthly 5,769.00 5,913.00 6,061.00 6,212.00 6,369.00 6,527.00 6,690.00 6,858.00 7,030.00 7,205.00 7,349.00 Annual 69,228.00 70,956.00 72,732.00 74,544.00 76,428.00 78,324.00 80,280.00 82,296.00 84,360.00 86,460.00 88,188.00
Hourly 34.113 34.967 35.838 36.744 37.656 38.596 39.565 40.558 41.567 42.606 43.460
31.0 Bi-Weekly 2,729.04 2,797.36 2,867.04 2,939.52 3,012.48 3,087.68 3,165.20 3,244.64 3,325.36 3,408.48 3,476.77
Monthly 5,913.00 6,061.00 6,212.00 6,369.00 6,527.00 6,690.00 6,858.00 7,030.00 7,205.00 7,385.00 7,533.00 Annual 70,956.00 72,732.00 74,544.00 76,428.00 78,324.00 80,280.00 82,296.00 84,360.00 86,460.00 88,620.00 90,396.00
H l 34 967 35 838 36 744 37 656 38 596 39 565 40 558 41 567 42 606 43 667 44 538Hourly 34.967 35.838 36.744 37.656 38.596 39.565 40.558 41.567 42.606 43.667 44.538
31.5 Bi-Weekly 2,797.36 2,867.04 2,939.52 3,012.48 3,087.68 3,165.20 3,244.64 3,325.36 3,408.48 3,493.36 3,563.08
Monthly 6,061.00 6,212.00 6,369.00 6,527.00 6,690.00 6,858.00 7,030.00 7,205.00 7,385.00 7,569.00 7,720.00 Annual 72,732.00 74,544.00 76,428.00 78,324.00 80,280.00 82,296.00 84,360.00 86,460.00 88,620.00 90,828.00 92,640.00
Hourly 35.838 36.744 37.656 38.596 39.565 40.558 41.567 42.606 43.667 44.763 45.658
32.0 Bi-Weekly 2,867.04 2,939.52 3,012.48 3,087.68 3,165.20 3,244.64 3,325.36 3,408.48 3,493.36 3,581.04 3,652.62
Monthly 6,212.00 6,369.00 6,527.00 6,690.00 6,858.00 7,030.00 7,205.00 7,385.00 7,569.00 7,759.00 7,914.00 Annual 74,544.00 76,428.00 78,324.00 80,280.00 82,296.00 84,360.00 86,460.00 88,620.00 90,828.00 93,108.00 94,968.00
Hourly 36.744 37.656 38.596 39.565 40.558 41.567 42.606 43.667 44.763 45.877 46.794
32.5 Bi-Weekly 2,939.52 3,012.48 3,087.68 3,165.20 3,244.64 3,325.36 3,408.48 3,493.36 3,581.04 3,670.16 3,743.54
Monthly 6,369.00 6,527.00 6,690.00 6,858.00 7,030.00 7,205.00 7,385.00 7,569.00 7,759.00 7,952.00 8,111.00 Annual 76,428.00 78,324.00 80,280.00 82,296.00 84,360.00 86,460.00 88,620.00 90,828.00 93,108.00 95,424.00 97,332.00
Hourly 37.656 38.596 39.565 40.558 41.567 42.606 43.667 44.763 45.877 47.031 47.971
33.0 Bi-Weekly 3,012.48 3,087.68 3,165.20 3,244.64 3,325.36 3,408.48 3,493.36 3,581.04 3,670.16 3,762.48 3,837.69
Monthly 6,527.00 6,690.00 6,858.00 7,030.00 7,205.00 7,385.00 7,569.00 7,759.00 7,952.00 8,152.00 8,315.00 Annual 78,324.00 80,280.00 82,296.00 84,360.00 86,460.00 88,620.00 90,828.00 93,108.00 95,424.00 97,824.00 99,780.00
Page 96 of 110
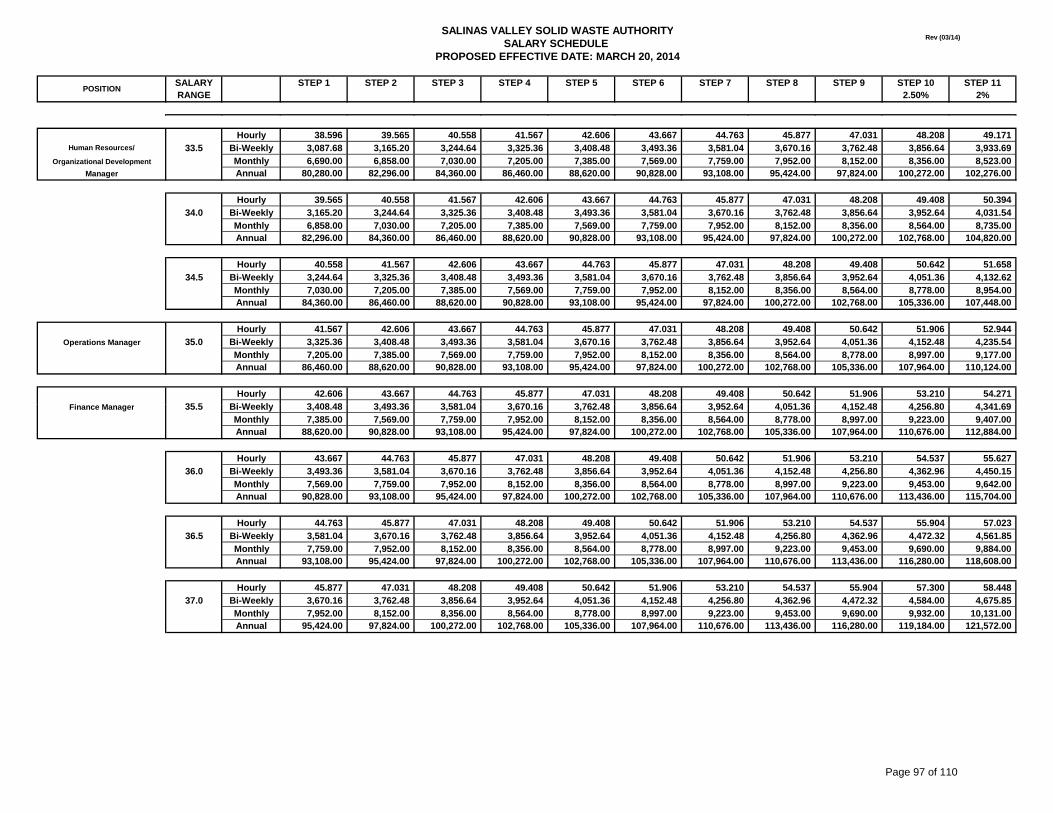
SALARY STEP 1 STEP 2 STEP 3 STEP 4 STEP 5 STEP 6 STEP 7 STEP 8 STEP 9 STEP 10 STEP 11RANGE 2.50% 2%
SALINAS VALLEY SOLID WASTE AUTHORITYSALARY SCHEDULE
PROPOSED EFFECTIVE DATE: MARCH 20, 2014
POSITION
Rev (03/14)
Hourly 38.596 39.565 40.558 41.567 42.606 43.667 44.763 45.877 47.031 48.208 49.171 Human Resources/ 33.5 Bi-Weekly 3,087.68 3,165.20 3,244.64 3,325.36 3,408.48 3,493.36 3,581.04 3,670.16 3,762.48 3,856.64 3,933.69
Organizational Development Monthly 6,690.00 6,858.00 7,030.00 7,205.00 7,385.00 7,569.00 7,759.00 7,952.00 8,152.00 8,356.00 8,523.00 Manager Annual 80,280.00 82,296.00 84,360.00 86,460.00 88,620.00 90,828.00 93,108.00 95,424.00 97,824.00 100,272.00 102,276.00
Hourly 39.565 40.558 41.567 42.606 43.667 44.763 45.877 47.031 48.208 49.408 50.394
34.0 Bi-Weekly 3,165.20 3,244.64 3,325.36 3,408.48 3,493.36 3,581.04 3,670.16 3,762.48 3,856.64 3,952.64 4,031.54
Monthly 6,858.00 7,030.00 7,205.00 7,385.00 7,569.00 7,759.00 7,952.00 8,152.00 8,356.00 8,564.00 8,735.00 Annual 82,296.00 84,360.00 86,460.00 88,620.00 90,828.00 93,108.00 95,424.00 97,824.00 100,272.00 102,768.00 104,820.00
Hourly 40.558 41.567 42.606 43.667 44.763 45.877 47.031 48.208 49.408 50.642 51.658
34.5 Bi-Weekly 3,244.64 3,325.36 3,408.48 3,493.36 3,581.04 3,670.16 3,762.48 3,856.64 3,952.64 4,051.36 4,132.62
Monthly 7,030.00 7,205.00 7,385.00 7,569.00 7,759.00 7,952.00 8,152.00 8,356.00 8,564.00 8,778.00 8,954.00 Annual 84,360.00 86,460.00 88,620.00 90,828.00 93,108.00 95,424.00 97,824.00 100,272.00 102,768.00 105,336.00 107,448.00
Hourly 41.567 42.606 43.667 44.763 45.877 47.031 48.208 49.408 50.642 51.906 52.944
Operations Manager 35.0 Bi-Weekly 3,325.36 3,408.48 3,493.36 3,581.04 3,670.16 3,762.48 3,856.64 3,952.64 4,051.36 4,152.48 4,235.54
Monthly 7,205.00 7,385.00 7,569.00 7,759.00 7,952.00 8,152.00 8,356.00 8,564.00 8,778.00 8,997.00 9,177.00 Annual 86,460.00 88,620.00 90,828.00 93,108.00 95,424.00 97,824.00 100,272.00 102,768.00 105,336.00 107,964.00 110,124.00
Hourly 42.606 43.667 44.763 45.877 47.031 48.208 49.408 50.642 51.906 53.210 54.271 Fi M 35 5 Bi W kl 3 408 48 3 493 36 3 581 04 3 670 16 3 762 48 3 856 64 3 952 64 4 051 36 4 152 48 4 256 80 4 341 69Finance Manager 35.5 Bi-Weekly 3,408.48 3,493.36 3,581.04 3,670.16 3,762.48 3,856.64 3,952.64 4,051.36 4,152.48 4,256.80 4,341.69
Monthly 7,385.00 7,569.00 7,759.00 7,952.00 8,152.00 8,356.00 8,564.00 8,778.00 8,997.00 9,223.00 9,407.00 Annual 88,620.00 90,828.00 93,108.00 95,424.00 97,824.00 100,272.00 102,768.00 105,336.00 107,964.00 110,676.00 112,884.00
Hourly 43.667 44.763 45.877 47.031 48.208 49.408 50.642 51.906 53.210 54.537 55.627
36.0 Bi-Weekly 3,493.36 3,581.04 3,670.16 3,762.48 3,856.64 3,952.64 4,051.36 4,152.48 4,256.80 4,362.96 4,450.15
Monthly 7,569.00 7,759.00 7,952.00 8,152.00 8,356.00 8,564.00 8,778.00 8,997.00 9,223.00 9,453.00 9,642.00 Annual 90,828.00 93,108.00 95,424.00 97,824.00 100,272.00 102,768.00 105,336.00 107,964.00 110,676.00 113,436.00 115,704.00
Hourly 44.763 45.877 47.031 48.208 49.408 50.642 51.906 53.210 54.537 55.904 57.023
36.5 Bi-Weekly 3,581.04 3,670.16 3,762.48 3,856.64 3,952.64 4,051.36 4,152.48 4,256.80 4,362.96 4,472.32 4,561.85
Monthly 7,759.00 7,952.00 8,152.00 8,356.00 8,564.00 8,778.00 8,997.00 9,223.00 9,453.00 9,690.00 9,884.00 Annual 93,108.00 95,424.00 97,824.00 100,272.00 102,768.00 105,336.00 107,964.00 110,676.00 113,436.00 116,280.00 118,608.00
Hourly 45.877 47.031 48.208 49.408 50.642 51.906 53.210 54.537 55.904 57.300 58.448
37.0 Bi-Weekly 3,670.16 3,762.48 3,856.64 3,952.64 4,051.36 4,152.48 4,256.80 4,362.96 4,472.32 4,584.00 4,675.85
Monthly 7,952.00 8,152.00 8,356.00 8,564.00 8,778.00 8,997.00 9,223.00 9,453.00 9,690.00 9,932.00 10,131.00 Annual 95,424.00 97,824.00 100,272.00 102,768.00 105,336.00 107,964.00 110,676.00 113,436.00 116,280.00 119,184.00 121,572.00
Page 97 of 110
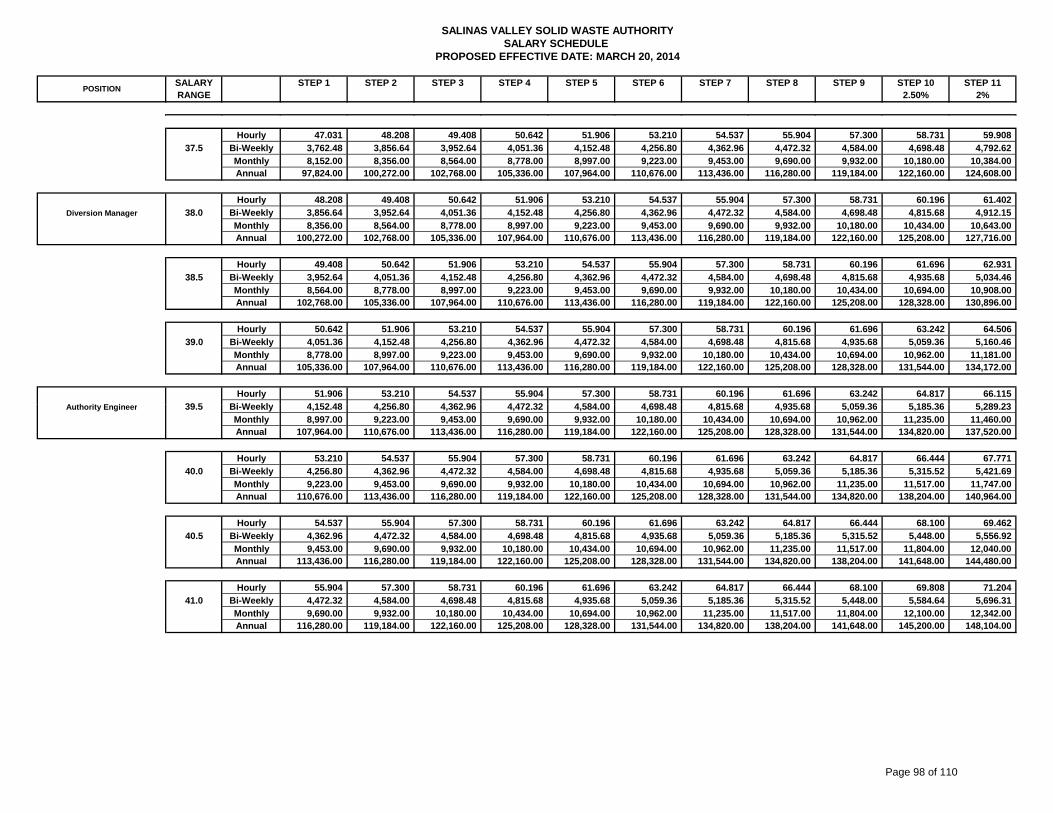
SALARY STEP 1 STEP 2 STEP 3 STEP 4 STEP 5 STEP 6 STEP 7 STEP 8 STEP 9 STEP 10 STEP 11RANGE 2.50% 2%
SALINAS VALLEY SOLID WASTE AUTHORITYSALARY SCHEDULE
PROPOSED EFFECTIVE DATE: MARCH 20, 2014
POSITION
Hourly 47.031 48.208 49.408 50.642 51.906 53.210 54.537 55.904 57.300 58.731 59.908
37.5 Bi-Weekly 3,762.48 3,856.64 3,952.64 4,051.36 4,152.48 4,256.80 4,362.96 4,472.32 4,584.00 4,698.48 4,792.62
Monthly 8,152.00 8,356.00 8,564.00 8,778.00 8,997.00 9,223.00 9,453.00 9,690.00 9,932.00 10,180.00 10,384.00 Annual 97,824.00 100,272.00 102,768.00 105,336.00 107,964.00 110,676.00 113,436.00 116,280.00 119,184.00 122,160.00 124,608.00
Hourly 48.208 49.408 50.642 51.906 53.210 54.537 55.904 57.300 58.731 60.196 61.402 Diversion Manager 38.0 Bi-Weekly 3,856.64 3,952.64 4,051.36 4,152.48 4,256.80 4,362.96 4,472.32 4,584.00 4,698.48 4,815.68 4,912.15
Monthly 8,356.00 8,564.00 8,778.00 8,997.00 9,223.00 9,453.00 9,690.00 9,932.00 10,180.00 10,434.00 10,643.00 Annual 100,272.00 102,768.00 105,336.00 107,964.00 110,676.00 113,436.00 116,280.00 119,184.00 122,160.00 125,208.00 127,716.00
Hourly 49.408 50.642 51.906 53.210 54.537 55.904 57.300 58.731 60.196 61.696 62.931
38.5 Bi-Weekly 3,952.64 4,051.36 4,152.48 4,256.80 4,362.96 4,472.32 4,584.00 4,698.48 4,815.68 4,935.68 5,034.46
Monthly 8,564.00 8,778.00 8,997.00 9,223.00 9,453.00 9,690.00 9,932.00 10,180.00 10,434.00 10,694.00 10,908.00 Annual 102,768.00 105,336.00 107,964.00 110,676.00 113,436.00 116,280.00 119,184.00 122,160.00 125,208.00 128,328.00 130,896.00
Hourly 50.642 51.906 53.210 54.537 55.904 57.300 58.731 60.196 61.696 63.242 64.506
39.0 Bi-Weekly 4,051.36 4,152.48 4,256.80 4,362.96 4,472.32 4,584.00 4,698.48 4,815.68 4,935.68 5,059.36 5,160.46
Monthly 8,778.00 8,997.00 9,223.00 9,453.00 9,690.00 9,932.00 10,180.00 10,434.00 10,694.00 10,962.00 11,181.00 Annual 105,336.00 107,964.00 110,676.00 113,436.00 116,280.00 119,184.00 122,160.00 125,208.00 128,328.00 131,544.00 134,172.00
Hourly 51.906 53.210 54.537 55.904 57.300 58.731 60.196 61.696 63.242 64.817 66.115 A th it E i 39 5 Bi W kl 4 152 48 4 256 80 4 362 96 4 472 32 4 584 00 4 698 48 4 815 68 4 935 68 5 059 36 5 185 36 5 289 23Authority Engineer 39.5 Bi-Weekly 4,152.48 4,256.80 4,362.96 4,472.32 4,584.00 4,698.48 4,815.68 4,935.68 5,059.36 5,185.36 5,289.23
Monthly 8,997.00 9,223.00 9,453.00 9,690.00 9,932.00 10,180.00 10,434.00 10,694.00 10,962.00 11,235.00 11,460.00 Annual 107,964.00 110,676.00 113,436.00 116,280.00 119,184.00 122,160.00 125,208.00 128,328.00 131,544.00 134,820.00 137,520.00
Hourly 53.210 54.537 55.904 57.300 58.731 60.196 61.696 63.242 64.817 66.444 67.771
40.0 Bi-Weekly 4,256.80 4,362.96 4,472.32 4,584.00 4,698.48 4,815.68 4,935.68 5,059.36 5,185.36 5,315.52 5,421.69
Monthly 9,223.00 9,453.00 9,690.00 9,932.00 10,180.00 10,434.00 10,694.00 10,962.00 11,235.00 11,517.00 11,747.00 Annual 110,676.00 113,436.00 116,280.00 119,184.00 122,160.00 125,208.00 128,328.00 131,544.00 134,820.00 138,204.00 140,964.00
Hourly 54.537 55.904 57.300 58.731 60.196 61.696 63.242 64.817 66.444 68.100 69.462
40.5 Bi-Weekly 4,362.96 4,472.32 4,584.00 4,698.48 4,815.68 4,935.68 5,059.36 5,185.36 5,315.52 5,448.00 5,556.92
Monthly 9,453.00 9,690.00 9,932.00 10,180.00 10,434.00 10,694.00 10,962.00 11,235.00 11,517.00 11,804.00 12,040.00 Annual 113,436.00 116,280.00 119,184.00 122,160.00 125,208.00 128,328.00 131,544.00 134,820.00 138,204.00 141,648.00 144,480.00
Hourly 55.904 57.300 58.731 60.196 61.696 63.242 64.817 66.444 68.100 69.808 71.204
41.0 Bi-Weekly 4,472.32 4,584.00 4,698.48 4,815.68 4,935.68 5,059.36 5,185.36 5,315.52 5,448.00 5,584.64 5,696.31
Monthly 9,690.00 9,932.00 10,180.00 10,434.00 10,694.00 10,962.00 11,235.00 11,517.00 11,804.00 12,100.00 12,342.00 Annual 116,280.00 119,184.00 122,160.00 125,208.00 128,328.00 131,544.00 134,820.00 138,204.00 141,648.00 145,200.00 148,104.00
Page 98 of 110
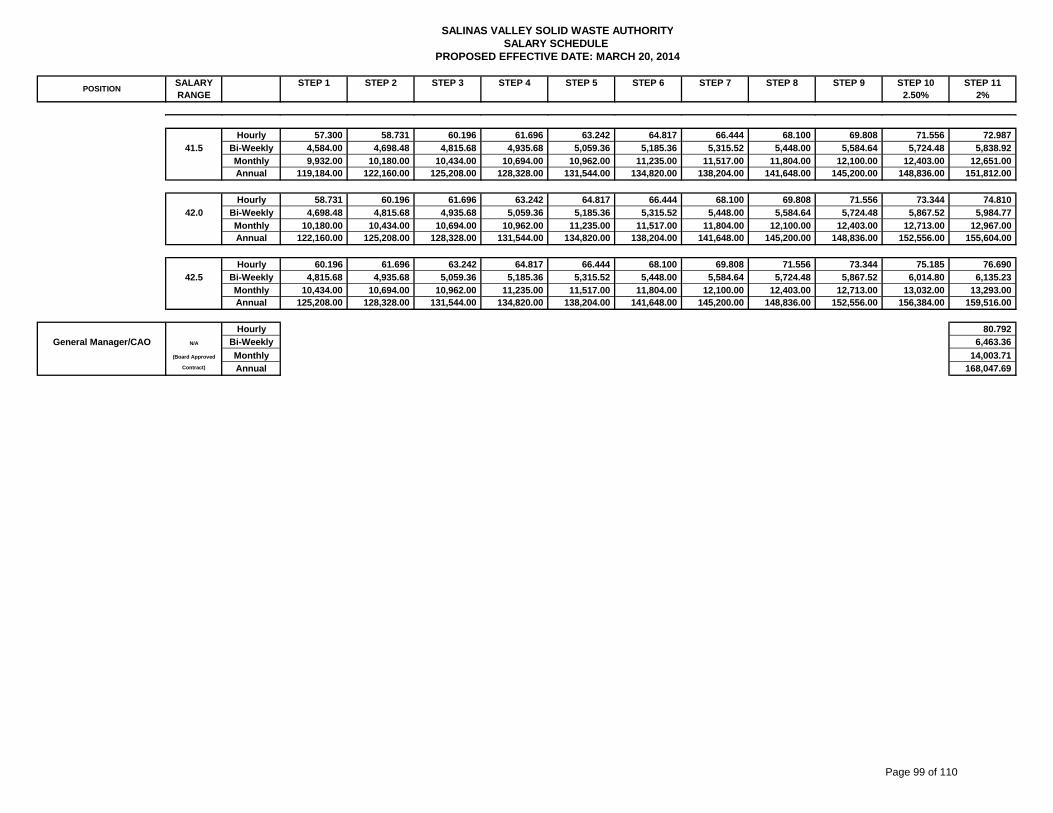
SALARY STEP 1 STEP 2 STEP 3 STEP 4 STEP 5 STEP 6 STEP 7 STEP 8 STEP 9 STEP 10 STEP 11RANGE 2.50% 2%
SALINAS VALLEY SOLID WASTE AUTHORITYSALARY SCHEDULE
PROPOSED EFFECTIVE DATE: MARCH 20, 2014
POSITION
Hourly 57.300 58.731 60.196 61.696 63.242 64.817 66.444 68.100 69.808 71.556 72.987
41.5 Bi-Weekly 4,584.00 4,698.48 4,815.68 4,935.68 5,059.36 5,185.36 5,315.52 5,448.00 5,584.64 5,724.48 5,838.92
Monthly 9,932.00 10,180.00 10,434.00 10,694.00 10,962.00 11,235.00 11,517.00 11,804.00 12,100.00 12,403.00 12,651.00 Annual 119,184.00 122,160.00 125,208.00 128,328.00 131,544.00 134,820.00 138,204.00 141,648.00 145,200.00 148,836.00 151,812.00
Hourly 58.731 60.196 61.696 63.242 64.817 66.444 68.100 69.808 71.556 73.344 74.810
42.0 Bi-Weekly 4,698.48 4,815.68 4,935.68 5,059.36 5,185.36 5,315.52 5,448.00 5,584.64 5,724.48 5,867.52 5,984.77
Monthly 10,180.00 10,434.00 10,694.00 10,962.00 11,235.00 11,517.00 11,804.00 12,100.00 12,403.00 12,713.00 12,967.00 Annual 122,160.00 125,208.00 128,328.00 131,544.00 134,820.00 138,204.00 141,648.00 145,200.00 148,836.00 152,556.00 155,604.00
Hourly 60.196 61.696 63.242 64.817 66.444 68.100 69.808 71.556 73.344 75.185 76.690
42.5 Bi-Weekly 4,815.68 4,935.68 5,059.36 5,185.36 5,315.52 5,448.00 5,584.64 5,724.48 5,867.52 6,014.80 6,135.23
Monthly 10,434.00 10,694.00 10,962.00 11,235.00 11,517.00 11,804.00 12,100.00 12,403.00 12,713.00 13,032.00 13,293.00 Annual 125,208.00 128,328.00 131,544.00 134,820.00 138,204.00 141,648.00 145,200.00 148,836.00 152,556.00 156,384.00 159,516.00
Hourly 80.792
General Manager/CAO N/A Bi-Weekly 6,463.36
(Board Approved Monthly 14,003.71 Contract) Annual 168,047.69
Page 99 of 110

This page intentionally left blank
Page 100 of 110
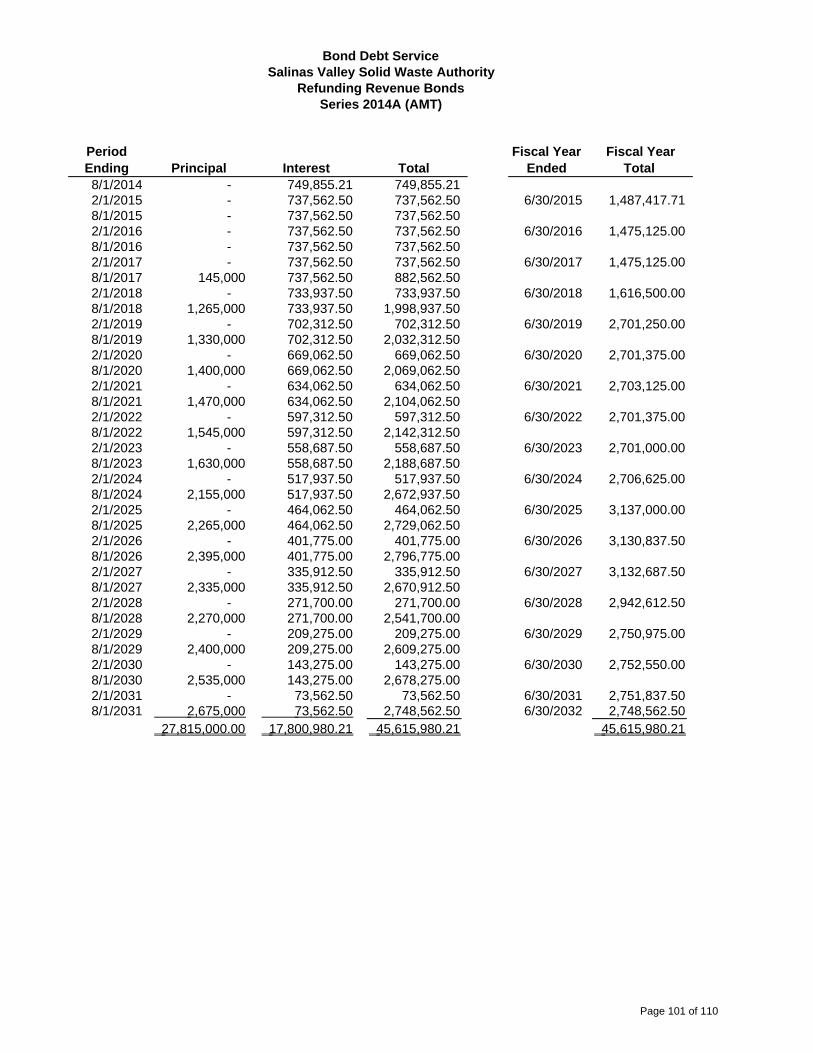
Period Ending Principal Interest Total
Fiscal Year Ended
Fiscal Year Total
8/1/2014 - 749,855.21 749,855.21 2/1/2015 - 737,562.50 737,562.50 6/30/2015 1,487,417.71 8/1/2015 - 737,562.50 737,562.50 2/1/2016 - 737,562.50 737,562.50 6/30/2016 1,475,125.00 8/1/2016 - 737,562.50 737,562.50 2/1/2017 - 737,562.50 737,562.50 6/30/2017 1,475,125.00 8/1/2017 145,000 737,562.50 882,562.50 2/1/2018 - 733,937.50 733,937.50 6/30/2018 1,616,500.00 8/1/2018 1,265,000 733,937.50 1,998,937.50 2/1/2019 - 702,312.50 702,312.50 6/30/2019 2,701,250.00 8/1/2019 1,330,000 702,312.50 2,032,312.50 2/1/2020 - 669,062.50 669,062.50 6/30/2020 2,701,375.00 8/1/2020 1,400,000 669,062.50 2,069,062.50 2/1/2021 - 634,062.50 634,062.50 6/30/2021 2,703,125.00 8/1/2021 1,470,000 634,062.50 2,104,062.50 2/1/2022 - 597,312.50 597,312.50 6/30/2022 2,701,375.00 8/1/2022 1,545,000 597,312.50 2,142,312.50 2/1/2023 - 558,687.50 558,687.50 6/30/2023 2,701,000.00 8/1/2023 1,630,000 558,687.50 2,188,687.50 2/1/2024 - 517,937.50 517,937.50 6/30/2024 2,706,625.00 8/1/2024 2,155,000 517,937.50 2,672,937.50 2/1/2025 - 464,062.50 464,062.50 6/30/2025 3,137,000.00 8/1/2025 2,265,000 464,062.50 2,729,062.50 2/1/2026 - 401,775.00 401,775.00 6/30/2026 3,130,837.50 8/1/2026 2,395,000 401,775.00 2,796,775.00 2/1/2027 - 335,912.50 335,912.50 6/30/2027 3,132,687.50 8/1/2027 2,335,000 335,912.50 2,670,912.50 2/1/2028 - 271,700.00 271,700.00 6/30/2028 2,942,612.50 8/1/2028 2,270,000 271,700.00 2,541,700.00 2/1/2029 - 209,275.00 209,275.00 6/30/2029 2,750,975.00 8/1/2029 2,400,000 209,275.00 2,609,275.00 2/1/2030 - 143,275.00 143,275.00 6/30/2030 2,752,550.00 8/1/2030 2,535,000 143,275.00 2,678,275.00 2/1/2031 - 73,562.50 73,562.50 6/30/2031 2,751,837.50 8/1/2031 2,675,000 73,562.50 2,748,562.50 6/30/2032 2,748,562.50
27,815,000.00 17,800,980.21 45,615,980.21 45,615,980.21
Bond Debt ServiceSalinas Valley Solid Waste Authority
Series 2014A (AMT)Refunding Revenue Bonds
Page 101 of 110

This page intentionally left blank
Page 102 of 110
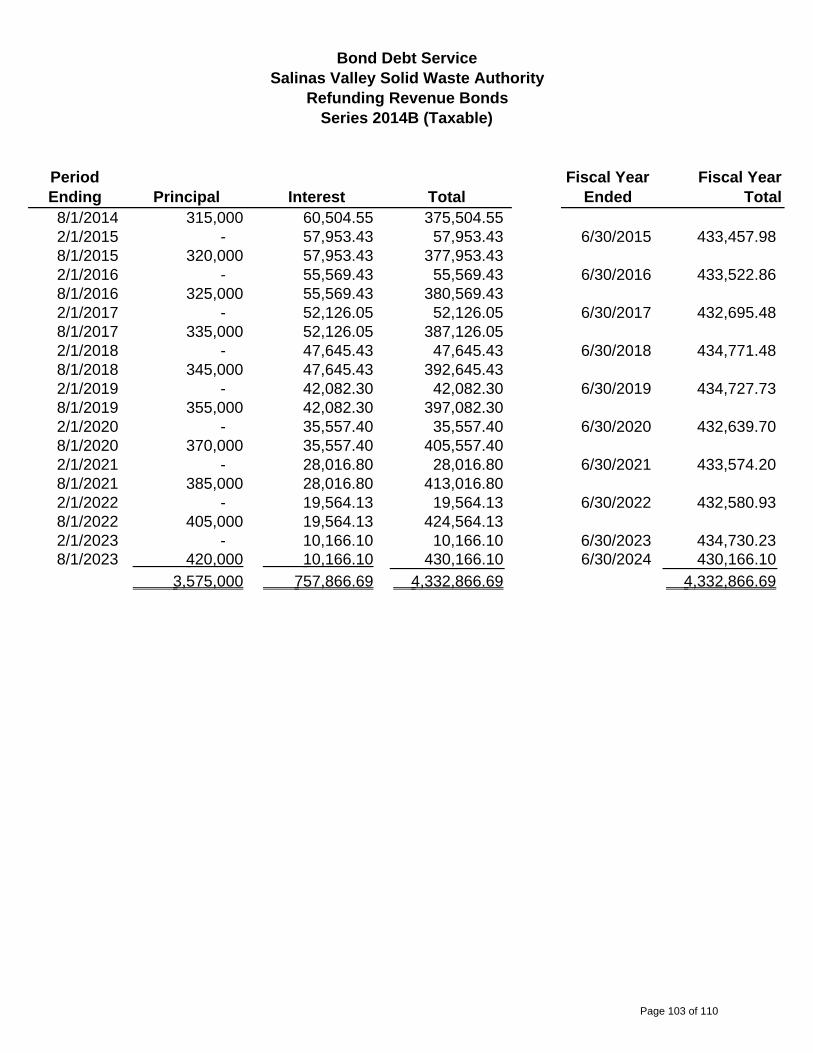
Period Ending Principal Interest Total
Fiscal Year Ended
Fiscal Year Total
8/1/2014 315,000 60,504.55 375,504.55 2/1/2015 - 57,953.43 57,953.43 6/30/2015 433,457.98 8/1/2015 320,000 57,953.43 377,953.43 2/1/2016 - 55,569.43 55,569.43 6/30/2016 433,522.86 8/1/2016 325,000 55,569.43 380,569.43 2/1/2017 - 52,126.05 52,126.05 6/30/2017 432,695.48 8/1/2017 335,000 52,126.05 387,126.05 2/1/2018 - 47,645.43 47,645.43 6/30/2018 434,771.48 8/1/2018 345,000 47,645.43 392,645.43 2/1/2019 - 42,082.30 42,082.30 6/30/2019 434,727.73 8/1/2019 355,000 42,082.30 397,082.30 2/1/2020 - 35,557.40 35,557.40 6/30/2020 432,639.70 8/1/2020 370,000 35,557.40 405,557.40 2/1/2021 - 28,016.80 28,016.80 6/30/2021 433,574.20 8/1/2021 385,000 28,016.80 413,016.80 2/1/2022 - 19,564.13 19,564.13 6/30/2022 432,580.93 8/1/2022 405,000 19,564.13 424,564.13 2/1/2023 - 10,166.10 10,166.10 6/30/2023 434,730.23 8/1/2023 420,000 10,166.10 430,166.10 6/30/2024 430,166.10
3,575,000 757,866.69 4,332,866.69 4,332,866.69
Bond Debt ServiceSalinas Valley Solid Waste Authority
Series 2014B (Taxable)Refunding Revenue Bonds
Page 103 of 110

This page intentionally left blank
Page 104 of 110
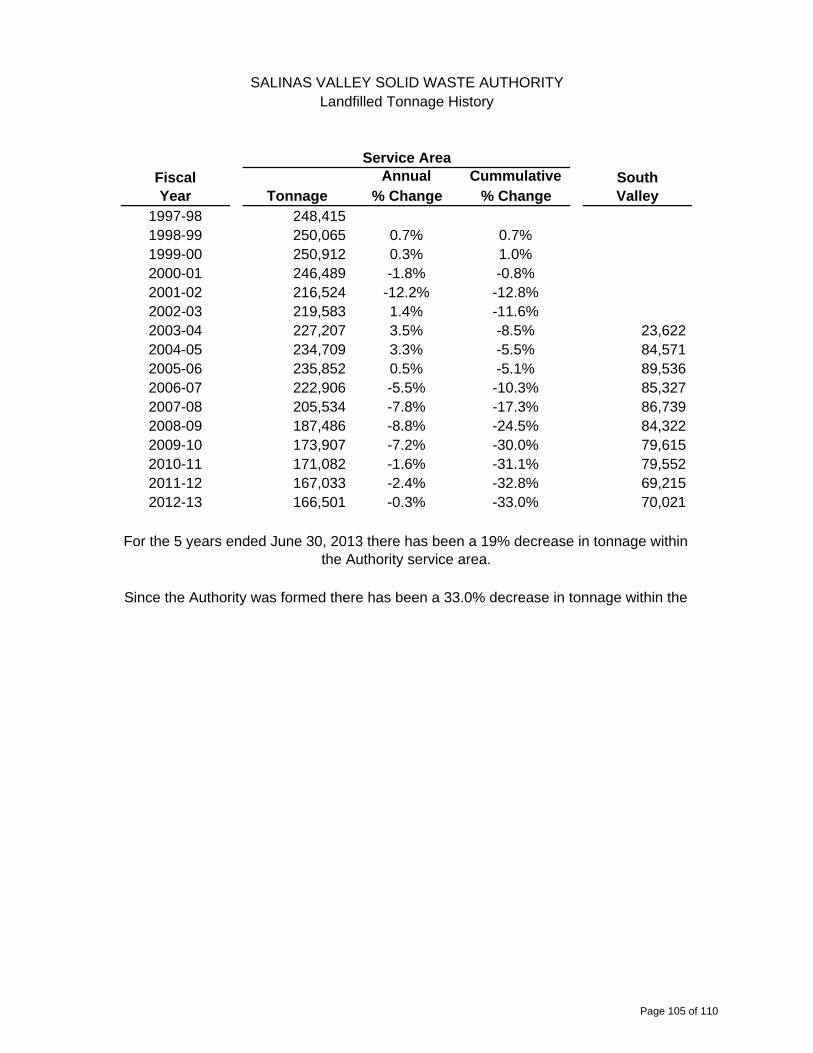
Annual Cummulative% Change % Change
1997-98 248,415 1998-99 250,065 0.7% 0.7%1999-00 250,912 0.3% 1.0%2000-01 246,489 -1.8% -0.8%2001-02 216,524 -12.2% -12.8%2002-03 219,583 1.4% -11.6%2003-04 227,207 3.5% -8.5% 23,622 2004-05 234,709 3.3% -5.5% 84,571 2005-06 235,852 0.5% -5.1% 89,536 2006-07 222,906 -5.5% -10.3% 85,327 2007-08 205,534 -7.8% -17.3% 86,739 2008-09 187,486 -8.8% -24.5% 84,322 2009-10 173,907 -7.2% -30.0% 79,615 2010-11 171,082 -1.6% -31.1% 79,552 2011-12 167,033 -2.4% -32.8% 69,215 2012-13 166,501 -0.3% -33.0% 70,021
SALINAS VALLEY SOLID WASTE AUTHORITY
FiscalYear
Landfilled Tonnage History
For the 5 years ended June 30, 2013 there has been a 19% decrease in tonnage within the Authority service area.
Since the Authority was formed there has been a 33.0% decrease in tonnage within the
SouthValleyTonnage
Service Area
Page 105 of 110

This page intentionally left blank
Page 106 of 110
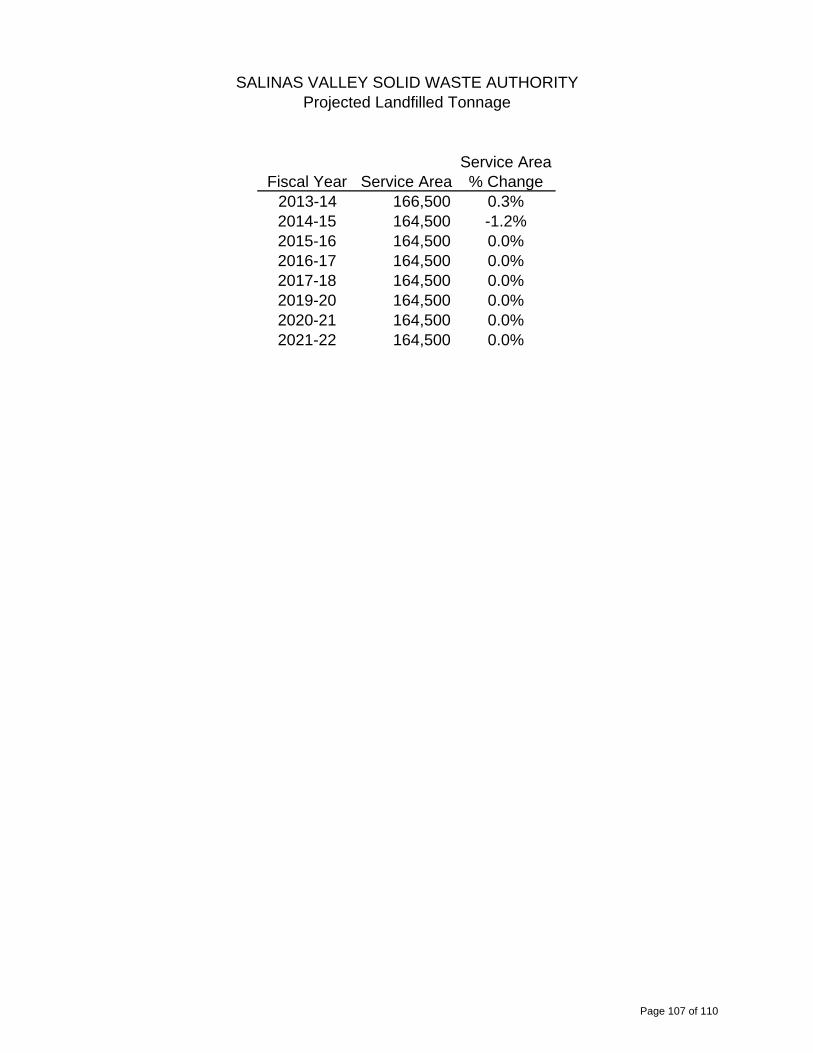
Fiscal Year Service AreaService Area % Change
2013-14 166,500 0.3%2014-15 164,500 -1.2%2015-16 164,500 0.0%2016-17 164,500 0.0%2017-18 164,500 0.0%2019-20 164,500 0.0%2020-21 164,500 0.0%2021-22 164,500 0.0%
SALINAS VALLEY SOLID WASTE AUTHORITYProjected Landfilled Tonnage
Page 107 of 110

This page intentionally left blank
Page 108 of 110
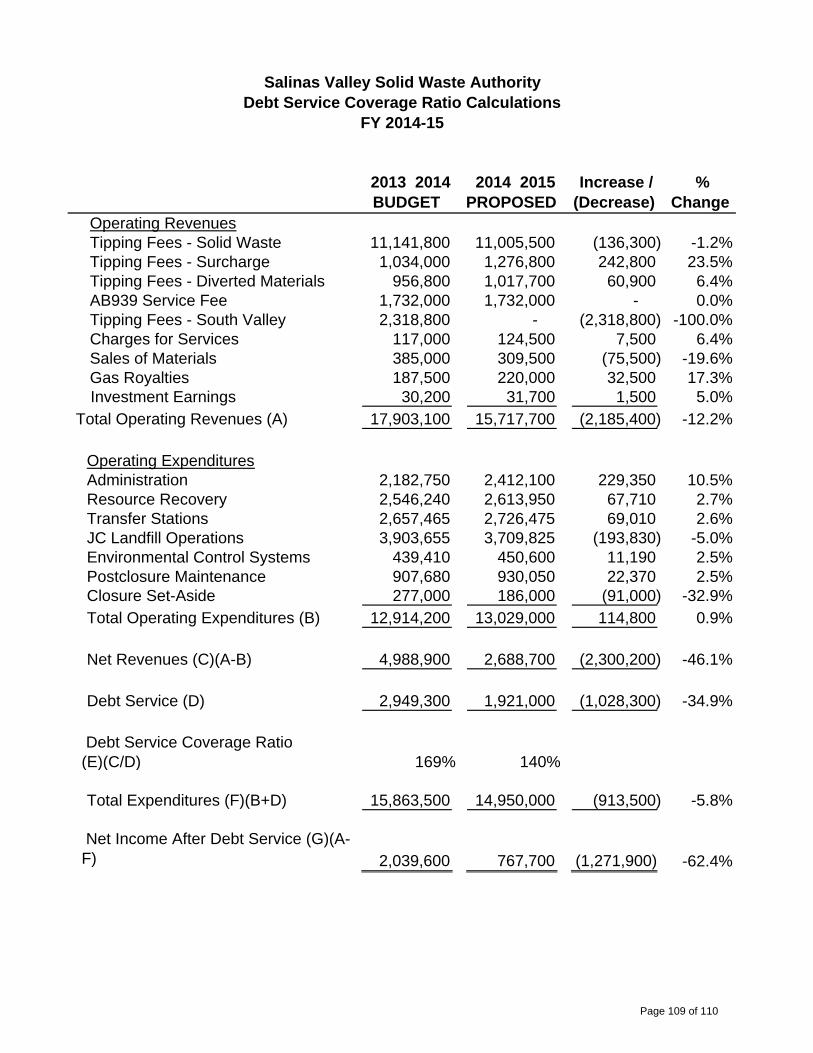
2013 2014
BUDGET 2014 2015 PROPOSED
Increase / (Decrease)
% Change
Operating RevenuesTipping Fees - Solid Waste 11,141,800 11,005,500 (136,300) -1.2%Tipping Fees - Surcharge 1,034,000 1,276,800 242,800 23.5%Tipping Fees - Diverted Materials 956,800 1,017,700 60,900 6.4%AB939 Service Fee 1,732,000 1,732,000 - 0.0%Tipping Fees - South Valley 2,318,800 - (2,318,800) -100.0%Charges for Services 117,000 124,500 7,500 6.4%Sales of Materials 385,000 309,500 (75,500) -19.6%Gas Royalties 187,500 220,000 32,500 17.3%Investment Earnings 30,200 31,700 1,500 5.0%
Total Operating Revenues (A) 17,903,100 15,717,700 (2,185,400) -12.2%
Operating ExpendituresAdministration 2,182,750 2,412,100 229,350 10.5%Resource Recovery 2,546,240 2,613,950 67,710 2.7%Transfer Stations 2,657,465 2,726,475 69,010 2.6%JC Landfill Operations 3,903,655 3,709,825 (193,830) -5.0%Environmental Control Systems 439,410 450,600 11,190 2.5%Postclosure Maintenance 907,680 930,050 22,370 2.5%Closure Set-Aside 277,000 186,000 (91,000) -32.9%Total Operating Expenditures (B) 12,914,200 13,029,000 114,800 0.9%
Net Revenues (C)(A-B) 4,988,900 2,688,700 (2,300,200) -46.1%
Debt Service (D) 2,949,300 1,921,000 (1,028,300) -34.9%
Debt Service Coverage Ratio (E)(C/D) 169% 140%
Total Expenditures (F)(B+D) 15,863,500 14,950,000 (913,500) -5.8%
Net Income After Debt Service (G)(A-F) 2,039,600 767,700 (1,271,900) -62.4%
Salinas Valley Solid Waste AuthorityDebt Service Coverage Ratio Calculations
FY 2014-15
Page 109 of 110

This page intentionally left blank
Page 110 of 110

This page intentionally left blank
Email Us [email protected]
Call Us (831)775-3000
SalinasValleyRecycles
SalinasValleyRecycles
SalinasValleyRecycles
Mail Us 128 Sun Street, Suite 101Salinas, CA 93901
SalinasValleyRecycles.org/ pdf/finance/budgetdoc2014_15.pdf
Promoting a Future Without Landfills