Embed Size (px)
Citation preview

Calpuff Analysis of
Current PSD Class I Increment Consumption
in North Dakota and Eastern Montana
Using Actual Annual Average SO2 Emission Rates
Draft
April 2002
North Dakota Department of Health
Division of Air Quality
1200 Missouri Avenue
Bismarck, ND 58506

2
Table of Contents
Page
1. Introduction . . . . . . . . . . . . . . . . . . . . . . . 5
2. Meteorological Data Processing - Calmet . . . . . . . . . 9
2.1 Modeling Domain . . . . . . . . . . . . . . . . . . . 92.2 Meteorological Data . . . . . . . . . . . . . . . . 11
2.2.1 Surface Data . . . . . . . . . . . . . . 112.2.2 Upper-Air Data . . . . . . . . . . . . . 132.2.3. Precipitation Data . . . . . . . . . . . 16
2.3 Geophysical Data . . . . . . . . . . . . . . . . . 162.4 Calmet Code Revision . . . . . . . . . . . . . . . 192.5 Calmet Control File Settings . . . . . . . . . . . 20
3. Calpuff Input Data . . . . . . . . . . . . . . . . . . . 25
3.1 Emission Inventory . . . . . . . . . . . . . . . . 253.1.1 Current Inventory . . . . . . . . . . . . 263.1.2 Baseline Inventory . . . . . . . . . . . 30
3.2 Ozone Data . . . . . . . . . . . . . . . . . . . . 343.3 Receptor Locations . . . . . . . . . . . . . . . . 343.4 Calpuff Control File Settings . . . . . . . . . . . 37
4. Calpuff Application and Results . . . . . . . . . . . . 41
4.1 Calpuff Application . . . . . . . . . . . . . . . . 414.2 Results . . . . . . . . . . . . . . . . . . . . . . 46
5. Summary . . . . . . . . . . . . . . . . . . . . . . . . 50
Appendix A Calmet Code ChangesAppendix B Calpuff Performance EvaluationAppendix C IWAQM Recommendations for Calmet Control FileAppendix D IWAQM Recommendations for Calpuff Control File

3
List of Tables
Page
2-1 Calmet Control File Settings - Group B . . . . . . . . . 232-2 Non-IWAQM Group A Settings Used by NDDH
in Calmet Control File . . . . . . . . . . . . . . . . 24
3-1 Current Inventory . . . . . . . . . . . . . . . . . . . 283-2 Calpuff Input Data for Current Source Inventory . . . . 293-3 Baseline Source Inventory . . . . . . . . . . . . . . . 323-4 Calpuff Input Data for Baseline Source Inventory . . . . 333-5 Calpuff Control File Settings - Group B . . . . . . . . 383-6 Non-IWAQM Group A Settings Used by NDDH
in Calpuff Control File . . . . . . . . . . . . . . . . 40
4-1 Calpuff Class I Increment Results - TRNP South Unit . . 474-2 Calpuff Class I Increment Results - TRNP North Unit . . 474-3 Calpuff Class I Increment Results - TRNP Elkhorn Ranch
Unit . . . . . . . . . . . . . . . . . . . . . . . . . 484-4 Calpuff Class I Increment Results - Lostwood Wilderness
Area . . . . . . . . . . . . . . . . . . . . . . . . . 484-5 Calpuff Class I Increment Results - Medicine Lake
Wilderness Area . . . . . . . . . . . . . . . . . . . . 494-6 Calpuff Class I Increment Results - Fort Peck
Reservation . . . . . . . . . . . . . . . . . . . . . . 49

4
List of Figures
Page
1-1 Class I Areas and Increment-AffectingSource Locations . . . . . . . . . . . . . . . . . . . . 7
2-1 Location of Meteorological Gridand Class I Areas . . . . . . . . . . . . . . . . . . . 10
2-2 Surface/Upper-Air Meteorological Stations . . . . . . . 122-3 Surface Met. Data Preparation . . . . . . . . . . . . . 142-4 Upper-Air Met. Data Preparation . . . . . . . . . . . . 172-5 Precipitation Stations . . . . . . . . . . . . . . . . . 18
3-1 Receptor Locations - North Dakota Class I Areas . . . . 353-2 Receptor Locations - Montana Class I Areas . . . . . . . 36
4-1 Illustration of MAAL Determination for TRNP South Unit . 444-2 Illustration of MAAL Compliance for TRNP South Unit . . 45

1NDDH, 2001. March 13 letter from Francis Schwindt, North DakotaDepartment of Health to Richard Long, EPA Region VIII.
2EPA, 1998. IWAQM Phase 2 Summary Report and Recommendations forModeling Long Range Transport Impacts. Publication No. EPA-454/R-98-019, Office of Air Quality Planning and Standards, Research TrianglePark, North Carolina 27711.
3Earth Tech, Inc., 2000. A User’s Guide for the CalmetMeteorological Model (Version 5). Earth Tech, Inc., Concord, MA01742.
4Earth Tech, Inc., 2000. A User’s Guide for the CalpuffDispersion Model (Version 5). Earth Tech, Inc., Concord, MA 01742.
5CFR, 1999. EPA Guideline on Air Quality Models. 40 CFR (Codeof Federal Regulations) Part 51, Appendix W.
5
1. Introduction
The North Dakota Department of Health (NDDH) has conducted an airquality modeling analysis to determine the current status ofPrevention of Significant Deterioration (PSD) Class I incrementconsumption for SO2 in North Dakota and eastern Montana. Thepurpose of this analysis was to determine the current level of PSDClass I increment consumption, including the use of actual emissionrates. Completion of this analysis satisfies a commitment made toEPA on March 13, 20011.
PSD Class I areas in North Dakota and eastern Montana are depictedin Figure 1-1. These include the Theodore Roosevelt National Park(TRNP) and Lostwood Wilderness Area in North Dakota, and theMedicine Lake Wilderness Area and Fort Peck Indian Reservation inMontana. The TRNP is divided into three geographically separatedunits: North Unit, South Unit, and Elkhorn Ranch Unit. All ofthese Class I areas were addressed in the NDDH modeling analysis.
Consistent with current Interagency Workgroup for Air QualityModeling (IWAQM) guidance2, the Calpuff long-range modeling system3,4
was used for the NDDH analysis. EPA has proposed inclusion ofCalpuff in the Guideline on Air Quality Models5 as a refinedmodeling technique for general use in evaluating long-rangetransport of pollutants. The Calpuff modeling system has been

6
widely applied by States, EPA, and the National Park Service (NPS)to evaluate PSD increments and Air Quality Related Values (AQRV’s)in PSD Class I areas.
The NDDH emission inventory for PSD Class I increment analysisincluded generally the actual SO2 emissions associated with allmajor SO2 sources located within 250 km, and all minor SO2 sourceslocated within 50 km of subject Class I areas. Source locationsare also shown in Figure 1-1. To more accurately determine thecurrent status of Class I increment consumption, the NDDH emissioninventory was derived from hourly CEM (continuous emission monitor)data, when available.
The NDDH implementation of the Calpuff model followed IWAQMguidance, including the use of five years of conventionalmeteorological data. The NDDH used a non-traditional approach inthe interpretation of model output to determine Class I incrementcompliance. Complete emission inventories for the baseline periodand for the current period (2000-2001) were developed. Incrementconsumption was then determined as a function of the difference inmodel output for these two inventories. The NDDH approach alsoincorporated the use of receptor averaging to provide a uniformprediction for each Class I area. This interpretation of modeloutput is described fully in Section 4.0.
Implementation of the Calpuff modeling system by NDDH included useof the Calmet meteorological model (Version 5.2), the Calpuffdispersion model (Version 5.4), and the Calpost postprocessingprogram (Version 5.2). Earth Tech (Earth Tech, Inc., Concord, MA),the primary model developer, also provides several utility programsto accommodate pre-processing of meteorological and geophysicaldata for Calmet. To the extent possible, the NDDH used theutilities provided by Earth Tech. But several additional softwareprograms, developed by NDDH, were necessary to accommodate formatconversions and substitutions for missing data. None of theprograms developed by NDDH affected the integrity of the originaldata.
As part of the Class I area increment analysis, the NDDH conducteda model performance evaluation (described in Appendix B) to

7
10
1112
13
14 15
16
1
23
456
7
89
km
Figure 1-1: Class I Areas and Increment-Affecting Source Locations
0 100 200 300 400
Key
1 Milton R Young Station2 Coal Creek Station3 Antelope Valley Station/
Great Plains Synfuels Plant4 Coyote Station5 Leland Olds Station/
Great River Energy Stanton Station6 Little Knife Gas Plant7 Grasslands Gas Plant8 Colstrip Station9 CELP Boiler
10 Tioga Gas Plant11 Neal Station12 Flying J Refinery13 Beulah Station14 Royal Oak Briquetting15 Heskett Station/
Mandan Refinery16 Lignite Gas Plant
Major SourceIncrement-Expanding Source
Fort PeckReservation
LostwoodWilderness Area
TRNP South Unit
TRNP North Unit
TRNP Elkhorn Ranch Unit
Medicine LakeWilderness Area
PSD Class I Area
Bismarck
8
determine the effectiveness of Calpuff in reproducing SO2concentrations observed at monitoring sites in North Dakota. Theperformance evaluation also served as the basis to “tune” modelinput (control file) settings to provide optimal agreement betweenpredictions and observations. As a result of the evaluation andtuning process, some of the input settings utilized by NDDH differfrom those recommended by IWAQM.
The NDDH analysis of Class I increment consumption of SO2 reflectsa work in progress because the baseline emission inventory for oiland gas related facilities has not yet been fully developed.Results of the current iteration, however, demonstrate compliancewith PSD Class I increments for SO2.
This report is organized into three additional sections and fourappendices. Section 2 describes the preparation and processing ofmeteorological data using Calmet and supporting software. Section3 describes the preparation of input data for Calpuff. Applicationof Calpuff, and model results are discussed in Section 4. AppendixA documents NDDH code changes to Calmet. The NDDH report onCalpuff performance evaluation is included as Appendix B. Thecomplete list of IWAQM-recommended settings for Calmet inputcontrol file is provided in Appendix C, and the complete list ofIWAQM-recommended settings for Calpuff control file is provided inAppendix D.

9
2. Meteorological Data Processing - Calmet
Execution of the Calmet meteorological model requires establishmentof the modeling domain (meteorological grid), preprocessing andquality assuring meteorological and geophysical input data, anddetermination of appropriate control file settings. Meteorologicalinput data include surface, upper-air, and precipitation data.Geophysical input data include terrain and land-use data.Meteorological data were obtained from the National Climatic DataCenter (NCDC), and geophysical data were acquired from the UnitedStates Geological Survey (USGS).
The NDDH processed five years of conventional meteorological datato use with Calpuff.
2.1 Modeling Domain
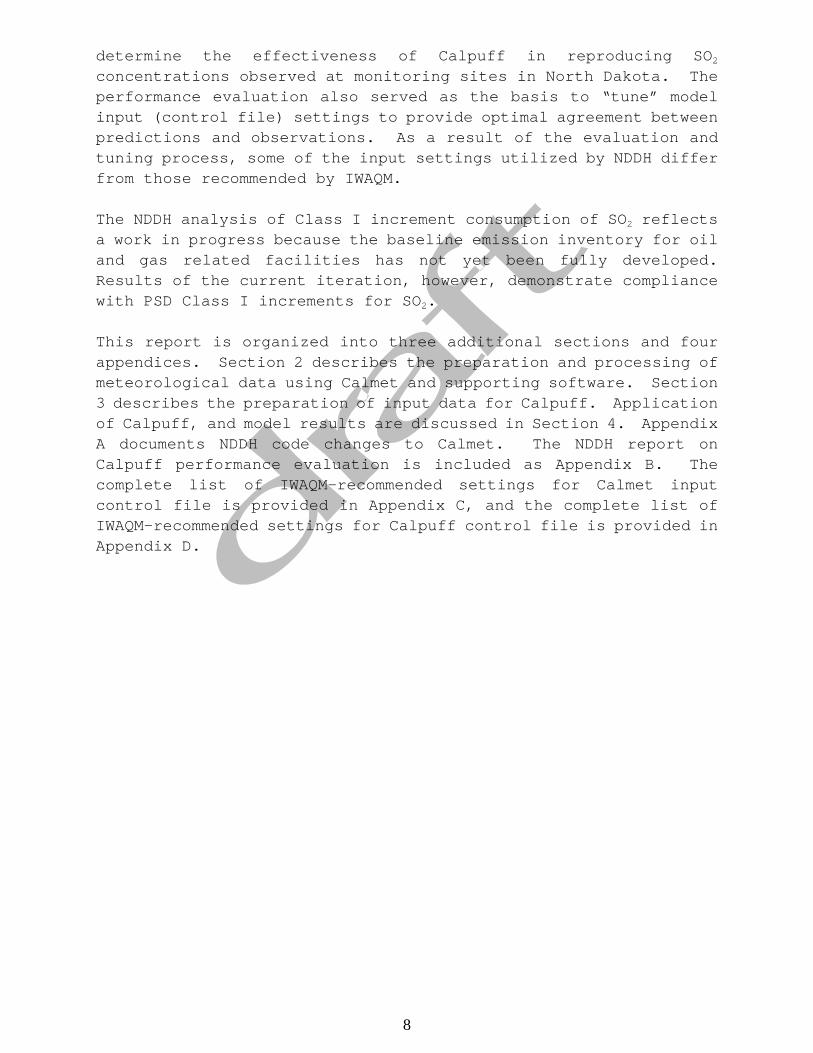
The NDDH meteorological grid was designed to provide a modelingdomain which would encompass all SO2 sources located up to 250 kmaway from any North Dakota Class I area. The dimensions of thegrid are 640 km east-west by 460 km north-south. The extent ofNDDH Calmet grid, with respect to PSD Class I areas, is illustratedin Figure 2-1.
Selection of grid cell size reflects a compromise between thedesire to define meteorological and geophysical variations on avery small scale, and the computer time and resources necessary todo so. The NDDH elected to set grid cell size to 10 km, which hasprecedent in other PSD Class I analyses (involving long rangetransport) conducted nationally. Given the gently rolling natureof North Dakota terrain, relatively uniform land-usecharacteristics, and the general lack of terrain features or waterbodies large enough to cause persistent, strong local-scale flows,the NDDH believes the 10 km resolution is reasonable. Grid cellsize is also depicted in Figure 2-1.
In the vertical, the NDDH meteorological grid is defined by eightvertical layers. Cell face heights are set at 22, 50, 100, 250,500, 1000, 2000, and 4000 meters above-ground level (AGL). Again,the use of eight layers is consistent with guidance provided forthe modeling system, and with other PSD Class I analyses conductednationally.
Because the NDDH Calmet domain is large, the grid system,meteorological data, and geophysical data were fit to Lambertconformal mapping to account for the earth’s curvature.
10
km
Figure 2-1: Location of Meteorological Grid and Class I Areas
0 100 200 300 400
6Atkinson, Dennis and Russell F. Lee, 1992. Procedures forSubstituting Values for Missing MWS meteorological Data for Usein Regulatory Air Quality Models.
7EPA, 1987. On-Site Meteorological Program Guidance forRegulatory Modeling Application. Office of Air Quality Planningand Standards, Research Triangle Park, North Carolina 27711.
11
2.2. Meteorological Data
2.2.1 Surface Meteorological Data
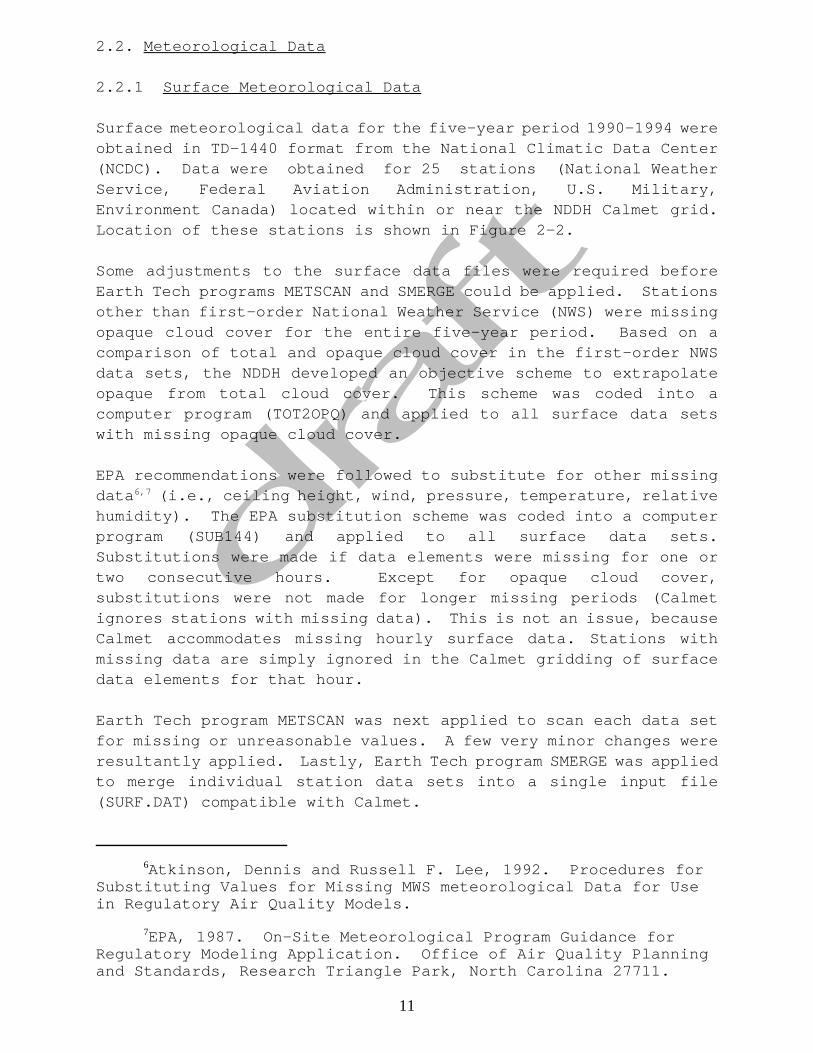
Surface meteorological data for the five-year period 1990-1994 wereobtained in TD-1440 format from the National Climatic Data Center(NCDC). Data were obtained for 25 stations (National WeatherService, Federal Aviation Administration, U.S. Military,Environment Canada) located within or near the NDDH Calmet grid.Location of these stations is shown in Figure 2-2.
Some adjustments to the surface data files were required beforeEarth Tech programs METSCAN and SMERGE could be applied. Stationsother than first-order National Weather Service (NWS) were missingopaque cloud cover for the entire five-year period. Based on acomparison of total and opaque cloud cover in the first-order NWSdata sets, the NDDH developed an objective scheme to extrapolateopaque from total cloud cover. This scheme was coded into acomputer program (TOT2OPQ) and applied to all surface data setswith missing opaque cloud cover.
EPA recommendations were followed to substitute for other missingdata6,7 (i.e., ceiling height, wind, pressure, temperature, relativehumidity). The EPA substitution scheme was coded into a computerprogram (SUB144) and applied to all surface data sets.Substitutions were made if data elements were missing for one ortwo consecutive hours. Except for opaque cloud cover,substitutions were not made for longer missing periods (Calmetignores stations with missing data). This is not an issue, becauseCalmet accommodates missing hourly surface data. Stations withmissing data are simply ignored in the Calmet gridding of surfacedata elements for that hour.
Earth Tech program METSCAN was next applied to scan each data setfor missing or unreasonable values. A few very minor changes wereresultantly applied. Lastly, Earth Tech program SMERGE was appliedto merge individual station data sets into a single input file(SURF.DAT) compatible with Calmet.
12
Figure 2-2: Surface / Upper-air Meteorological Stations
Surface Station
Surface + Upper-air Station

13
The NDDH procedure for preparation of surface meteorological datais depicted schematically in Figure 2-3.
The occurrence of missing data elements in the TD-1440 data setswas generally very limited, and within the tolerances suggested byEPA. Note that none of the missing data substitution proceduresapplied by NDDH affected the integrity of the original, raw data.
2.2.2 Upper-Air Meteorological Data
Upper-air meteorological data for 1990 through 1994 were obtainedin TD-6201 format from NCDC. Data were obtained for six upper-airstations located within or near the NDDH Calmet grid. Thelocations of these stations are shown in Figure 2-2.
Because of Calmet’s fairly strict requirements on the completenessof upper-air data records and the frequency of missing upper-airdata, it was desirable to automate the upper-air data processingwith computer programs as much as possible. Since Earth Tech’sprogram READ62 did not correct errors or fill in for missing data,much of the upper-air data processing was accomplished by runningprograms written by NDDH staff, along with a fair amount of manualfile editing. The procedure consisted of preparing the TD-6201 datafile for Earth Tech’s program READ62, execution of a modifiedversion of READ62, execution of two NDDH programs to fill in somemissing data, and some manual editing to handle more complicatedproblems or fill in extended missing periods.
The first NDDH upper-air data program (DEL62) input the TD-6201sounding data for one station for one year, made the hours ofobservation consistent at 00Z and 12Z (hours GMT or UTC), and outputonly the first line of data (lowest 79 sounding levels) for eachsounding. Then, program READ62 was executed to convert upper-airdata to the format Calmet requires and output only the desiredvariables pressure, height above mean sea level (MSL), temperature,and wind at sounding levels up to the top level desired, 500 mb inthis case. Calmet requires sounding data at levels up to thecalculated mixing height for all hours processed. It was necessaryto extract data up to 500 mb to accommodate mixing heights up toapproximately 4000 meters AGL at stations as high as Rapid City,South Dakota (elevation 966 m MSL).
Since program READ62 only flags missing soundings but does not fillin any missing data, the rest of the data preparation and missingdata substitution is left up to the user. In addition, READ62(version available in 1996-97) created some problems that were

14
1440 NCDC File
PROGRAMFILL144
BIS91.FIL
PROGRAMTOT2OPQ
BIS91.OPQ
PROGRAMSUB144
BIS91.SUB
PROGRAMMETSCAN
BIS91.SCN PROGRAMSMERGE
SURF.DAT
Figure 2-3Surface Met Data
Preparation

15
corrected in later NDDH programs or by modifying READ62. READ62rejected some surface data records because they were coded as havingbeen substituted for missing data by NCDC. Since surface data mustbe complete (in upper-air data files) and the NCDC substitutionslooked reasonable, READ62 was modified to accept this type of data.Also, READ62 overlooked some occurrences of two consecutive missingsoundings and did not code missing temperatures correctly for Calmetinput, which were remedied in a later NDDH program. Most of theseREAD62 problems were corrected by Earth Tech in a more recentversion, but these NDDH modifications were necessary becausepreprocessing of raw data was performed in 1997.
Two NDDH programs (FIXR62 and FILLSHRT) performed much of theremaining upper-air data preprocessing. The first program copiedsoundings at the beginning and end of the year, when necessary, toensure that upper-air data bracketed the entire calendar year ofsurface data, as required by Calmet. Since Calmet requires thesurface level and top level to be present and complete for allsoundings, the program either filled in the missing data or outputinformative messages indicating where manual substitution wasrequired. Following EPA guidance6,7, missing data at the top orsurface level were interpolated in time from the same station’s datafor one or two consecutive missing observations and were substitutedfrom a nearby station’s data at the same time for three or moreconsecutive missing observations.
Unlike the requirements for surface meteorological data, Calmetrequires soundings to be present for every standard 12-hourobservation time. Since no soundings may be left missing, periodswith completely missing soundings were filled in either by executionof the NDDH program FILLSHRT or manual substitution. For periodswith one or two consecutive missing soundings, the program filledin the missing soundings from adjacent soundings in time for thesame station. The substitutions were designed to retain appropriaterepresentative diurnal variations in the substituted soundings. Forperiods with three or more consecutive missing soundings, themissing soundings were substituted by copying soundings from arepresentative nearby station for the same times using a texteditor. Some editing of the substituted soundings was required toadjust the new soundings to the new station and its differentelevation. Program FIXR62 also found missing temperatures, whichwere converted incorrectly in READ62, and replaced them with thecorrect code (in the correct units). The result was a file for eachupper-air station and year containing sounding data in Calmet-readyformat for every 12-hour observation.

16
The NDDH procedure for preparation of upper-air meteorological datais depicted schematically in Figure 2-4.
2.2.3 Precipitation Data
Hourly precipitation data for the five-year period 1990-1994 wereobtained from Earth Info, Incorporated (Boulder, CO). Data wereincluded for 96 stations located in North Dakota, eastern Montana,northern South Dakota, and western Minnesota. Location of thesestations is shown in Figure 2-5.
Software provided with the Earth Info distribution allowedextraction of hourly precipitation data in TD-3240 variable recordlength format. The Earth Tech program for processing precipitationdata (PXTRACT) requires data in TD-3240 fixed record length format.Therefore, the NDDH prepared a program (CONV3240) to convertprecipitation files from variable to fixed record length format.
Earth Tech program PXTRACT was executed to extract individualstation precipitation data from the TD-3240 files, and PMERGE wasexecuted to consolidate individual station data into the single filerequired by Calmet (PRECIP.DAT). No substitutions were made formissing data (i.e., Calmet substitutes internally from nearestavailable station).
2.3 Geophysical Data
Most of the terrain elevation and land use data required by Calmetwere downloaded from the United States Geological Survey (USGS)internet web site. Grid cell terrain elevations were derived from1:250,000-Scale Digital Elevation Models (DEM) and land use datawere derived from 1:250,000-Scale Land Use and Land Cover (LULC)files. The LULC coding of land use categories is equivalent to thatrequired by Calmet.
The NDDH Calmet grid extends into Canada, which is not covered byUSGS DEM’s or LULC files. Terrain elevations for Canada wereobtained from DEM’s included with the EPA CD distribution “Calmet,Calpuff, and Calpost Modeling System Version 1.0". Because of therelative homogeneity of land use in northeastern Montana andnorthern North Dakota, land use categories for grid cells locatedin Canada were simply extrapolated from adjoining Montana and NorthDakota grid cells.
Current Earth Tech programs for processing terrain elevation andland use data, and creating the GEO.DAT file required by Calmet were

17
6201 NCDC File
PROGRAMDEL62
BIS915.DEL
PROGRAMREAD62ND
BIS915.R62
PROGRAMFIXR62
BIS915.FIX
PROGRAMFILLSHRT
BIS915.TIM
If addit ional errors or mo re miss ingdata, edit R62 fi le.
If 3 or more soundings in a ro w aremissin g, copy su bsti tute so undingsfrom nearby stat ions fi le.
Nearby stationsR62 file
Figure 2-4Upper-Air Met Data
Preparation

18
Figure 2-5: Precipitation Stations
19
not available at the time the NDDH developed geophysical data. Forterrain elevation processing, the NDDH developed software toallocate DEM data values to appropriate Calmet grid cells (TERSUM),and then average over all allocated values to determine thecomposite elevation for each cell (TERAVG).
Land use processing commenced with allocating LULC data values tocorresponding Calmet grid cells (via NDDH program TERSUM). For eachgrid cell, a composite land use type was assigned based on the mostfrequently allocated value. Other land-use-related parametersrequired for the GEO.DAT file include surface roughness length (Zo),albedo, Bowen ratio, soil heat flux, and leaf area index. Valuesfor these parameters are related to land use type as shown in theCalmet User’s Guide. The distribution of land use types within eachgrid cell was used to establish composite values for theseparameters. For example, if half of the LULC land use data valuesallocated to a grid cell were type 10 (Bowen ratio = 1.5) and theother half type 20 (Bowen ratio = 1.0), the composite Bowen ratiofor the cell was set to 1.25. In the case of Zo, the compositevalue reflects the log-weighted average. NDDH coded the aboveprocedure into program LANDAVG. Coding is consistent with thecurrent Earth Tech program, MAKEGEO.
The resultant fields of terrain elevation, land use type, Zo,albedo, Bowen ratio, soil heat flux, and leaf area index were editedinto the GEO.DAT file for processing with Calmet.
2.4 Calmet Code Revision
Based on a thorough examination of plotted wind fields generatedfrom Calmet processing of 1990-1994 meteorological data sets, theNDDH noted a chronic discontinuity between surface and upper windlevels. To mitigate this problem, the Calmet option to extrapolatesurface wind observations to upper layers was deployed, usingsimilarity theory (Option 4) and layer-dependent bias settings.Calmet Version 5.x extrapolates surface winds both for setting theinitial guess field, and for introducing observations in the Step2 wind field procedure. Unfortunately, the model utilizes the biasfactors for the initial guess field, only. The Step 2 verticalextrapolation has equal effect through all upper layers. The NDDHconsidered this unrealistic because resultant upper-layer windfields reflected localized surface-layer (low-level) perturbationsconsistently, upward through all upper levels, even in the top layer(4000 m). It was believed that such low-level features shoulddampen with height and not extend up into the middle troposphere.In other words, the Step 2 vertical extrapolation essentially undid

20
the effective Step 1 (dampened) vertical extrapolation of the windfields.
To address this problem, the NDDH modified the Calmet code to simplyeliminate the vertical extrapolation in the Step 2 wind fieldprocedure, resulting in a more realistic transition from surface toupper layers. This modification was made with concurrence from JoeScire (Earth Tech) and John Vimont (National Park Service). NDDHchanges to Calmet code are documented in Appendix A. The modifiedCalmet version was used to process 1990-1994 data.
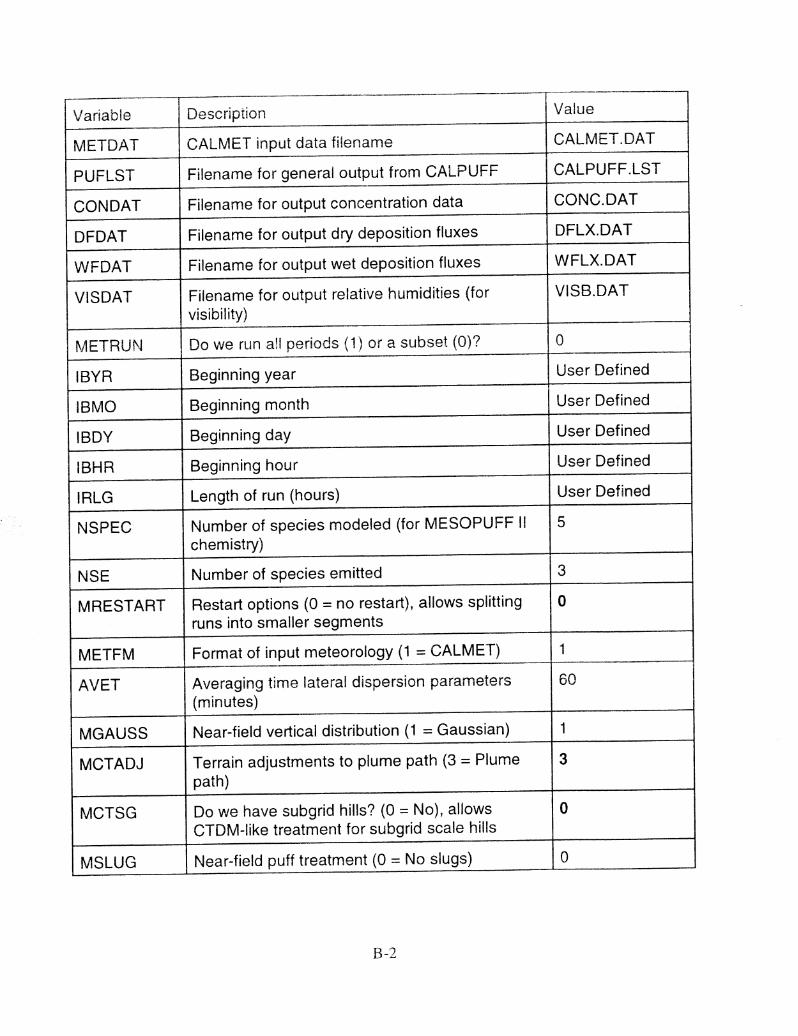
2.5 Calmet Control File Settings
Calmet control file settings utilized in the processing of 1990-1994data were generally consistent with guidance from the InteragencyWorkgroup on Air Quality Modeling (IWAQM)2. However, extensivetesting of Calmet output, with visual feedback (plotted 2-D fields),suggested that adjustment to a limited number of IWAQM settings wasrequired to achieve reasonable representations of wind and mixingheight fields. Further, the adjustment of a limited number ofadditional settings was found to provide better agreement withmonitored observations based on a Calmet/Calpuff performanceevaluation conducted by NDDH (Appendix B) and such changes werejudged to be scientifically consistent.
IWAQM recommendations for Calmet control file settings fall into twocategories. Group A (NDDH terminology) includes those variables forwhich IWAQM provides a default value as a general recommendation forall analyses. Group B includes those variables where IWAQMrecognizes the value will need to be tailored for a givenapplication, and default values are therefore not provided.
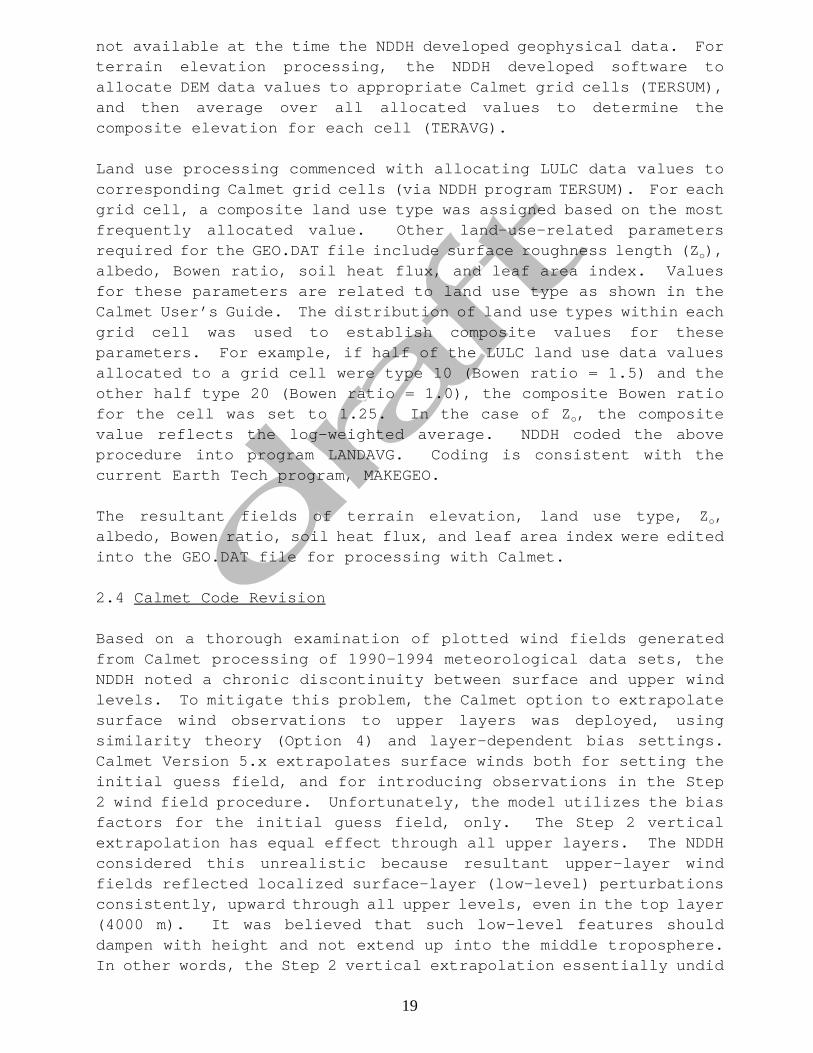
The Group B settings utilized by NDDH for Calmet processing of 1990-1994 data are summarized in Table 2-1. Most of these settingsinvolve straightforward variables, related to the Calmet/Calpuffmeteorological grid, which have been previously discussed. Theremaining Group B variables (RMAX1, RMAX2, RMAX3, TERRAD, R1, R2)control the influence of station observations and terrain featuresin development of the final wind field. Initial values for theselatter variables were based on guidance from the National ParkService. The NDDH then tuned the initial values to optimum settingsusing iterative testing with visual feedback.
NDDH settings for Group A variables were based both on the iterativetesting process described above, and on a model performanceevaluation. Initial iterative testing ensured that Calmet settings

21
provided a reasonable appearance of wind and mixing height fields.Then a model performance evaluation was conducted by NDDH toestablish optimum and final Calmet/Calpuff control file settings.The performance evaluation was based on a comparison of observationsand model predications at two monitoring sites, one located at theTRNP South Unit. The evaluation proceeded in an iterative mannerto determine the effect of adjustments to settings in the Calmet andCalpuff input control files on model skill. The NDDH performanceevaluation is described in Appendix B.
As a result of the iterative testing process and performanceevaluation, the NDDH elected to modify IWAQM values for a limitednumber of Calmet Group A control file settings. Non-IWAQM settingsutilized by the NDDH for the Calmet control file, and which providedoptimum agreement with monitored observations, are listed in Table2-2. These non-IWAQM Group A settings are discussed below.
IKINE - The inclusion of kinematic effects providedsignificantly better agreement of Calpuff results withmonitored observations. From a scientific standpoint, itappears there is no consensus on use of kinematic effects.
BIAS(NZ) - NDDH bias settings were developed through iterativetesting with visual feedback. The IWAQM recommendationprovides neutral bias (between surface and upper-air data) forall vertical layers. In light of its testing, the NDDH doesnot believe it is reasonable to assume equal weighting ofupper-air wind data with surface data at the lowest level, andto assume equal weighting of surface data with upper-air attop levels.
LVARY - Given the size of the meteorological grid, the NDDHfelt it necessary to deploy this option (varying radius ofinfluence) to ensure that at least one station would beavailable for wind field interpolation.
ZUPWIND(2) - The NDDH was concerned that IWAQM wasrecommending a value of 1000 m while the model (Earth Tech)default is 2500 m, thus prompting the NDDH compromise value of2000 m. But regardless of the selected value for this initialguess wind field input, subsequent wind field developmentshould converge to the same result.
MNMDAV/ILEVZI - The NDDH found that IWAQM default values forthese parameters, relating to spatial averaging of mixingheights, produced entirely unacceptable results for the mixing

8Holzworth, 1972. Mixing Heights, Wind Speeds, andPotential throughout the Contiguous United States. EPAPublication No. AP-101, Office of Air Programs.
22
height field. Severe gradients (bull’s eyes) in mixing heightwere observed in the immediate vicinity of meteorologicalstations, and a significant increase in the value of theseinput parameters was required to mitigate the anomaly. TheNDDH notes that because MNMDAV is a function of grid cellsize, IWAQM should not specify an absolute default value forthis parameter.
ZIMAX/ZIMAXW - Because the NDDH Calmet/Calpuff grid extendsinto the western part of the upper Great Plains, maximummixing height was increased to 4000 m to be consistent withmaximum mixing heights reported for this region (Holzworth,1972)8.
The complete list of IWAQM-recommended settings for the Calmetcontrol file is included as Appendix C.
23
Table 2-1
Calmet Control File Settings - Group B
Variable Description Value
NSSTA No. of surface stations 24
NUSTA No. of upper-air stations 6
NPSTA No. of precipitation stations 96
NX No. of east-west grid cells 64
NY No. of north-south grid cells 46
DGRIDKM Grid spacing (km) 10
XORIGKM Southwest grid cell X coordinate -380
YORIGKM Southwest grid cell Y coordinate 140
LLCONF Lambert conformal coordinates T
XLAT1 Latitude of 1st standard parallel 46.0
XLAT2 Latitude of 2nd standard parallel 48.5
RLON0 Reference longitude 102
RLAT0 Origin latitude 44
NZ No. vertical layers 8
RMAX1 Max surface over-land extrapolation radius (km) 300
RMAX2 Max aloft over-land extrapolation radius (km) 1200
RMAX3 Max over-water extrapolation radius (km) 500
TERRAD Radius of influence of terrain features (km) 100
R1 Relative weight at surface of Step 1 field &observation
125
R2 Relative weight aloft of Step 1 field & observation 100
ISURFT Surface station to use for surface temperature 1*
IUPT Station for lapse rates 1*
* Represents Bismarck NWS

24
Table 2-2
Non-IWAQM Group A Settings Used by NDDHin Calmet Control File
Variable IWAQM NDDH
IKINE
BIAS(NZ)
LVARY
ZUPWIND(2)
MNMDAV
ILEVZI
ZIMAX
ZIMAXW
0
0,0,0,0,0,0,0,0,
F
1000 m
1
1
3000 m
3000 m
1
-1.0, -0.9, -0.7, 0.0,0.5, 1.0, 1.0, 1.0
T
2000 m
8
4
4000 m
4000 m
25
3. Calpuff Input Data
Along with the Calmet-processed meteorological data, Calpuffrequires the user to provide an emissions inventory, receptorlocations, input control file settings, and (optionally) hourlyozone data before the model can be executed.
3.1 Emission Inventory
To address Class I increment consumption, the NDDH developed asource inventory for current (Year 2000/2001) SO2 emissions, andanother source inventory for baseline SO2 emissions. Net incrementconsumption was determined as a function of the difference in modelresults for these two inventories (i.e., current inventory minusbaseline inventory). The baseline inventory included sources whichno longer existed in Year 2000, or which had reduced emissions byYear 2000, and therefore had the effect of expanding increment.Sources whose emissions remained essentially unchanged from thebaseline to Year 2000 were not included in the analysis.
SO2 increment-affecting sources located in the vicinity of the sixsubject Class I areas were shown in Figure 1-1. These sourcesinclude primarily electrical generating stations, natural gasprocessing plants, and well-site facilities (not shown in thefigure) related to oil and gas production. With the exception ofwell-site oil and gas facilities, all sources located within 250 kmof subject Class I areas were included in the emission inventories(current and baseline). Because well-site oil and gas facilitiesare numerous and generally have very small SO2 emissions, theirinclusion was limited to a distance of 50 km from Class I areas.These distance limits are consistent with previous NDDH PSD ClassI modeling analyses.
Even though numerous oil and gas production facilities are found inthe vicinity of Medicine Lake and Fort Peck Class I areas,emission/stack data were not obtainable for such facilities locatedin Montana. Therefore, the local well-site oil and gas facilitycontribution was not accounted for in Calpuff modeling for MontanaClass I areas, and model predictions for these areas may accordinglybe misrepresented.
Annual average SO2 emission rates, expressed as the total actualannual emission divided by the annual hours of operation, wereutilized in the NDDH baseline and current emission inventories. Use

9NDDH, 2002. Summary of legal Issues Relating toAdministration of the Prevention of Significant Deterioration(PSD) Provisions of North Dakota’s State Implementation Plan(SIP). North Dakota Department of Health, Bismarck, North Dakota58506.
26
of the annual average is based on the state’s legal review of theAir Pollution Control Rules.9
3.1.1 Current Inventory
Annual-average SO2 emission rates and dynamic stack operatingparameters (exit velocity and temperature) for the current inventorywere derived from Continuous Emission Monitoring (CEM) hourly datafor years 2000 and 2001, where available. The annual average wascalculated as the average for all non-zero hours. CEM hourly datafor emission rates and flow rates (exit velocity) for electricalgenerating stations (larger than 25 megawatts) were available anddownloaded from the EPA Acid Rain Web Site on the internet. Year2001 data were available for the first three quarters, only. AllCEM hourly data for other sources (Year 2000 only), as well as thehourly stack exit temperature for electrical generating stations,were obtained directly from the plant operators. Values for fixedstack parameters (stack height and diameter) were obtained from NDDHrecords/permits. Basically, CEM hourly data were available for allelectrical generating stations, and for most natural gas processingplants.
For sources with no hourly data, total annual emissions andoperating hours were obtained from Annual Emission Inventory Reportsfor Year 2000. Stack exit velocity and temperature were obtainedfrom recent stack test data. Stack height and diameter wereobtained from NDDH records/permits.
Year 2000 actual emission rates reflecting annual average operationfor oil and gas production sources (treaters and flares) werederived from the ND State Industrial Commission’s (SIC) Oil and Gasdata base. The data base includes information on gas production(flared and lease-use), and the H2S content of the gas, such thatSO2 emission rates for well-site flares and treaters can becalculated. Dynamic stack operating parameters for oil and gasproduction sources were derived from the calculated heat ofcombustion using procedures described in the “Williston Basin

10NDDH, 1990. Williston Basin Regional Air Quality Study.North Dakota Department of Health, Bismarck, ND 58506.
11EPA, 1995. SCREEN3 Model User’s Guide. Publication No. EPA-454/B-95-004, Office of Air Quality Planning and Standards, ResearchTriangle Park, North Carolina, 27711.
27
Regional Air Quality Study”10, and modified using SCREEN311 (EPAscreening model) adjustments for effective flare plume height andradiational heat loss. Flare and treater stack height were obtaineddirectly from the SIC data base.
In summary, the current emissions inventory was grouped into non oiland gas sources with annual averages derived from CEMs hourly stackdata, non oil and gas sources with annual averages derived fromAnnual Emission Inventory Reports, and oil and gas sources withannual averages derived from the SIC Oil and Gas data base. In allcases, the annual average SO2 represents total actual annualemissions divided by hours (or days) of operation. The emissioncharacterization for each current inventory source is provided inTable 3-1.
It should be noted that the Great Plains Synfuels Plant and theLittle Knife Gas Processing Plant, which have been included inprevious NDDH analyses of Class I increment consumption, were notincluded in the current emissions inventory for the presentanalysis. Based on the state’s legal review, it was concluded thatall emissions from these facilities are exempt from incrementconsumption, because Class I variances were granted for majormodifications at both facilities.
The complete current emissions inventory for non oil and gassources, including all information required by Calpuff, is providedas Table 3-2. Current inventory information for the numerous oiland gas sources can be provided on computer media if requested.Source locations in Table 3-2, provided in Lambert coordinates, wereobtained from NDDH permits. Stack base elevations were derived fromUSGS digital elevation models (DEM).

28
Table 3-1
Current Source Inventory
Source
Emission
Characterization
Status
Figure 1-1
Loc. KeyPSD/
Baseline
Inc. Consuming/
Expanding
Antelope Valley Station Average - Hrs Operation PSD Consuming 3
Coal Creek Station Average - Hrs Operation PSD Consuming 2
Coyote Station Average - Hrs Operation PSD Consuming 4
Grasslands Gas Plant Average - Hrs Operation PSD Consuming 7
Colstrip Station (3&4) Average - Hrs Operation PSD Consuming 8
CELP Boiler Average - Hrs Operation PSD Consuming 9
Leland Olds Station Average - Hrs Operation Baseline Consuming 5
Stanton Station Average - Hrs Operation Baseline Consuming 5
Milton R. Young Station Average - Hrs Operation Baseline Consuming 1
Heskett Station Average - Hrs Operation Baseline Expanding 15
Mandan Refinery Average - Hrs Operation Baseline Expanding 15
Lignite Gas Plant Average - Hrs Operation Baseline Expanding 16
Tioga Gas Plant Average - Hrs Operation Baseline Expanding 10
Oil & Gas Related* Average - Days Operation Both Both -
* All facilities located within 50 km of Class I areas.

29
Table 3-2
Calpuff Input Data for Current Source Inventory
Source X Y Stack Base Stack Exit Exit Bldg. EmissionNo. Coordinate Coordinate Height Elevation Diameter Vel. Temp. Dwash Rate
(km) (km) (m) (m) (m) (m/s) (deg. K) (g/s)------ ---------- ---------- ------ ------ -------- ----- -------- ----- --------
1 ! SRCNAM = Antelope Valley Station 1 !1 ! X = 12.459, 374.908, 182.9, 588.3, 7.0, 19.0, 358.2, 0., 199.9, ! !END!2 ! SRCNAM = Antelope Valley Station 2 !2 ! X = 12.459, 374.908, 182.9, 588.3, 7.0, 19.1, 356.7, 0., 187.3, ! !END!3 ! SRCNAM = Coal Creek Station 1 !3 ! X = 63.487, 375.784, 201.0, 602.0, 6.7, 25.9, 358.5, 0., 430.2, ! !END!4 ! SRCNAM = Coal Creek Station 2 !4 ! X = 63.487, 375.784, 201.0, 602.0, 6.7, 24.9, 354.5, 0., 376.5, ! !END!5 ! SRCNAM = Coyote Station !5 ! X = 13.513, 357.842, 152.0, 556.9, 6.4, 25.4, 370.7, 0., 487.7, ! !END!6 ! SRCNAM = Grasslands Gas Plant !6 ! X = -149.696, 401.234, 65.0, 615.9, 0.86, 15.1, 571.9, 0., 14.3, ! !END!7 ! SRCNAM = Colstrip Station 3 !7 ! X = -357.648, 220.211, 210.9, 988.7, 7.3, 26.9, 361.3, 0., 93.6, ! !END!8 ! SRCNAM = Colstrip Station 4 !8 ! X = -357.648, 220.211, 210.9, 988.7, 7.3, 27.6, 362.7, 0., 90.6, ! !END!9 ! SRCNAM = CELP Boiler !9 ! X = -359.424, 230.411, 61.0, 945.1, 2.5, 22.6, 433.2, 0., 52.9, ! !END!10 ! SRCNAM = Leland Olds Station 1 !10 ! X = 51.326, 365.208, 106.7, 518.3, 5.3, 19.7, 450.0, 0., 525.4, ! !END!11 ! SRCNAM = Leland Olds Station 2 !11 ! X = 51.326, 365.208, 152.4, 518.3, 6.7, 25.0, 448.6, 0., 1060.5, ! !END!12 ! SRCNAM = Stanton Station !12 ! X = 50.407, 365.773, 77.7, 518.3, 4.6, 19.9, 411.1, 0., 305.8, ! !END!13 ! SRCNAM = Milton R Young Station 1 !13 ! X = 59.519, 341.409, 91.4, 597.4, 5.8, 18.5, 449.1, 0., 644.6, ! !END!14 ! SRCNAM = Milton R Young Station 2 !14 ! X = 59.519, 341.409, 167.6, 597.4, 7.6, 19.2, 361.8, 0., 573.1, ! !END!15 ! SRCNAM = Heskett Station 1 !15 ! X = 84.794, 319.565, 91.44, 514.8, 2.2, 20.67, 461.7, 0., 31.1, ! !END!16 ! SRCNAM = Heskett Station 2 !16 ! X = 84.794, 319.565, 91.44, 514.8, 3.65, 17.37, 419.7, 0., 74.5, ! !END!17 ! SRCNAM = Mandan Refinery - Boilers !17 ! X = 85.215, 317.679, 31.8, 518.3, 1.7, 12.5, 424.7, 0., 17.8, ! !END!18 ! SRCNAM = MR - FCU/CO !18 ! X = 85.215, 317.679, 60.7, 518.3, 3.4, 9.9, 547.0, 0., 133.2, ! !END!19 ! SRCNAM = MR - Alky Furnace !19 ! X = 85.215, 317.679, 53.0, 518.3, 2.0, 6.1, 447.0, 0., 0.9, ! !END!20 ! SRCNAM = MR - Ultra Furnace !20 ! X = 85.215, 317.679, 29.1, 518.3, 1.3, 5.9, 530.8, 0., 1.9, ! !END!21 ! SRCNAM = MR - SRU !21 ! X = 85.215, 317.679, 60.8, 518.3, 0.6, 5.7, 589.0, 0., 5.3, ! !END!22 ! SRCNAM = Lignite Gas Plant !22 ! X = -38.885, 541.932, 38.1, 598.0, 0.4, 19.9, 893.0, 0., 13.2, ! !END!23 ! SRCNAM = Tioga Gas Plant !23 ! X = -67.762, 489.627, 50.3, 686.0, 0.91, 7.7, 782.0, 0., 37.3, ! !END!

12NDDH, 2002. Prevention of Significant Deterioration SulfurDioxide Baseline Emission Rates. North Dakota Department of Health,Bismarck, ND 58506
30
3.1.2 Baseline Inventory
SO2 emission rates for baseline sources were computed as totalactual emissions for the baseline period, divided by actual hoursof operation for the period. The baseline period reflects the two-year period prior to the western North Dakota minor-source baselinedate (December 19, 1977), or a different period representative of“normal” operation, as determined by the NDDH.
For electrical generating stations, total emissions for the baselineperiod were calculated as a function of mine-average sulfur contentand actual coal usage. For natural gas processing plants, totalemissions for the baseline period were taken from Annual EmissionInventory Reports, or calculated from raw gas volume and H2Scontent. Actual hours of baseline period operation for bothelectrical generating stations and natural gas processing plantswere obtained from Annual Emission Inventory Reports.
Baseline period emissions for well-site oil and gas productionsources (treaters and flares) were derived from the SIC Oil and Gasdata base information on gas production and H2S content. Becausethe SIC had reservations about the quality and quantity of gasproduction data contained in the data base for the baseline period(1976-1977), the NDDH elected to extrapolate (in time) productiondata from the period of the “Williston Basin Regional Air QualityStudy” (i.e., the period 1987-1988). According to SIC, this latterperiod represents the approximate earliest point in the chronologyof the data base that consistent confidence can be placed in thecompleteness and reliability of the gas production data. Days ofproduction were also extrapolated from this period.
A complete description of the NDDH methodology for determiningbaseline emission rates is contained in “Prevention of SignificantDeterioration Sulfur Dioxide Baseline Emission Rates (Draft).”12
The extrapolation of oil and gas data from the Williston Basin Studyis also discussed.
For electrical generating stations and natural gas processingplants, dynamic stack operating parameters for the baselineinventory were derived from stack test reports. Stack height anddiameter were taken from NDDH records/permits. For oil and gassources, dynamic stack parameters (as well as stack diameter) were

31
derived from calculated heat of combustion, as described in Section3.1.1. Flare and treater stack height were obtained directly fromthe SIC data base.
The status of each baseline inventory source is summarized in Table3-3. The complete baseline emission inventory for non oil and gassources, including all data required by Calpuff, is provided asTable 3-4. Baseline inventory information for oil and gas sourcescan be provided on computer media if requested. Source locationsin Table 3-4, based on Lambert coordinates, were obtained from NDDHpermits. Stack base elevations were derived from USGS digitalelevation models (DEM).
It should be noted that the referenced baseline inventory for oiland gas related sources reflects a “first cut”, as incorporated inthis analysis, because a number of issues related to its developmenthave not been (and may not be) resolved. These issues include:
C It may not be possible to determine exactly which wells weretied into gas gathering systems as of the minor-sourcebaseline date (December 19, 1977).
C How to define “normal operation” for oil and gas wells.
C Whether the baseline emission rate (representing two yearsprior to the baseline date) should be calculated as theaverage over the actual hours of operation, or as a trueannual average (average over all hours in a year), given theintermittent operation of many of the wells.
C If an oil and gas well should be given full credit for itsbaseline emissions, when it appears (from modeling) that thoseemissions may have caused an exceedance of National AmbientAir Quality Standards (NAAQS).

32
Table 3-3
Baseline Source Inventory
Source Inc. Consuming/Expanding
Figure 1-1
Loc. Key
Leland Olds Station Consuming 5
Stanton Station Consuming 5
Milton R. Young Station Consuming 1
Heskett Station Expanding 15
Mandan Refinery Expanding 15
Lignite Gas Plant Expanding 16
Tioga Gas Plant Expanding 10
Beulah Station (shut down) Expanding 13
Neal Station (shut down) Expanding 11
Flying J Refinery (shut down) Expanding 12
Royal Oak Briquetting (shut down) Expanding 14
Oil & Gas Related * Both -
* All facilities located within 50 km of Class I areas.

33
Table 3-4
Calpuff Input Data for Baseline Source Inventory
Source X Y Stack Base Stack Exit Exit Bldg. EmissionNo. Coordinate Coordinate Height Elevation Diameter Vel. Temp. Dwash Rate
(km) (km) (m) (m) (m) (m/s) (deg. K) (g/s)------ ---------- ---------- ------ ------ -------- ----- -------- ----- --------
1 ! SRCNAM = Leland Olds Station 1 !1 ! X = 51.326, 365.208, 106.7, 518.3, 5.3, 19.7, 450.0, 0., 407.6, ! !END!2 ! SRCNAM = Leland Olds Station 2 !2 ! X = 51.326, 365.208, 152.4, 518.3, 6.7, 25.0, 448.6, 0., 766.0, ! !END!3 ! SRCNAM = Stanton Station !3 ! X = 50.407, 365.773, 77.7, 518.3, 4.6, 19.9, 411.1, 0., 268.6, ! !END!4 ! SRCNAM = Milton R Young Station 1 !4 ! X = 59.519, 341.409, 91.4, 597.4, 5.8, 18.5, 449.1, 0., 585.9, ! !END!5 ! SRCNAM = Milton R Young Station 2 !5 ! X = 59.519, 341.409, 167.6, 597.4, 7.6, 19.2, 361.8, 0., 618.1, ! !END!6 ! SRCNAM = Heskett Station 1 !6 ! X = 84.794, 319.565, 91.44, 514.8, 2.2, 20.67, 461.7, 0., 65.2, ! !END!7 ! SRCNAM = Heskett Station 2 !7 ! X = 84.794, 319.565, 91.44, 514.8, 3.65, 17.37, 419.7, 0., 152.2, ! !END!8 ! SRCNAM = Mandan Refinery - Boilers !8 ! X = 85.215, 317.679, 31.8, 518.3, 1.7, 12.5, 424.7, 0., 78.4, ! !END!9 ! SRCNAM = MR - FCU/CO !9 ! X = 85.215, 317.679, 60.7, 518.3, 3.4, 9.9, 547.0, 0., 212.4, ! !END!10 ! SRCNAM = MR - Alky Furnace !10 ! X = 85.215, 317.679, 53.0, 518.3, 2.0, 6.1, 447.0, 0., 20.2, ! !END!11 ! SRCNAM = MR - Ultra Furnace !11 ! X = 85.215, 317.679, 29.1, 518.3, 1.3, 5.9, 530.8, 0., 1.9, ! !END!12 ! SRCNAM = Lignite Gas Plant !12 ! X = -38.885, 541.932, 38.1, 598.0, 0.4, 19.9, 893.0, 0., 36.0, ! !END!13 ! SRCNAM = Tioga Gas Plant !13 ! X = -67.762, 489.627, 30.5, 686.0, 1.7, 7.7, 782.0, 0., 135.3, ! !END!14 ! SRCNAM = Beulah Station 1+2 !14 ! X = 17.404, 362.995, 23.0, 567.0, 1.7, 7.6, 477.0, 0., 17.27, ! !END!15 ! SRCNAM = Beulah Station 3-5 !15 ! X = 17.404, 362.995, 30.5, 567.0, 2.1, 14.6, 527.0, 0., 28.29, ! !END!16 ! SRCNAM = Neal Station 1+2 !16 ! X = 82.646, 447.977, 42.4, 488.0, 1.8, 25.0, 470.0, 0., 44.7, ! !END!17 ! SRCNAM = Flying J Refin - Heaters + Boiler 2 !17 ! X = -117.411, 462.238, 17.3, 575.0, 0.9, 3.2, 700.0, 0., 3.19, ! !END!18 ! SRCNAM = Flying J Refin - Boiler 1 !18 ! X = -117.411, 462.238, 30.2, 575.0, 1.2, 3.4, 464.0, 0., 1.32, ! !END!19 ! SRCNAM = Flying J Refin - Boiler 3 !19 ! X = -117.411, 462.238, 9.1, 575.0, 0.8, 6.3, 464.0, 0., 1.89, ! !END!20 ! SRCNAM = Royal Oak - Boilers 1-3 !20 ! X = -53.232, 318.050, 19.2, 751.0, 1.4, 9.8, 520.0, 0., 21.7, ! !END!21 ! SRCNAM = Royal Oak - ACC !21 ! X = -53.232, 318.050, 26.2, 751.0, 3.35, 9.35, 1172.0, 0., 200.5, ! !END!

34
C Whether the inventory should be limited to wells within 50 kmof Class I areas (also an issue for current (Year 2000) oiland gas inventory).
In addition, the NDDH has determined that reliable production dataare available for a limited number of oil and gas wells in the SICdata base for the baseline period. The NDDH is currently in theprocess of replacing SO2 values estimated from the Williston BasinStudy with the actual baseline values.
3.2 Ozone Data
Calpuff requires background ozone values. The NDDH elected toutilize the option of providing an input file of hourly ozonevalues, rather than assume the constant default value in Calpuff.Hourly ozone data were obtained from a NDDH monitoring site locatedabout 140 km east of TRNP Elkhorn Ranch Unit. This places the sitewithin the corridor of primary plume transport between majorgenerating stations and Theodore Roosevelt National Park. Ozonedata were concurrent with Calmet meteorological data (i.e., 1990-1994).
3.3 Receptor Locations
Receptor locations for the Class I Calpuff analysis are shown inFigures 3-1 and 3-2. Figure 3-1 identifies receptor locations forNorth Dakota Class I areas and Figure 3-2 depicts receptor locationsfor Montana Class I areas. Numbers in the figures correspond to thereceptor numbering convention employed in Calpuff input/outputfiles. Receptor coverage includes 22 receptors (Nos. 1-22) at TRNPSouth Unit, 16 receptors (Nos. 23-38) at TRNP North Unit, 1 receptor(No. 39) at TRNP Elkhorn Ranch Unit, 5 receptors (Nos. 40-44) atLostwood Wilderness Area, 1 receptor (No. 45) at Medicine LakeWilderness Area, and 4 receptors (Nos. 46-49) at Fort PeckReservation.
Maximum receptor spacing in North Dakota Class I areas is on theorder of 4-5 kilometers. Given the distance of the largest-contributing sources from Class I areas (150-200 km), concentrationgradients in the vicinity of Class I areas were not expected to besignificant. Based on subsequent model execution which confirmedthis expectation, receptor coverage was deemed sufficient.

35
39
1 2 3
4 5 6
7 8
9 10
11
12
13
14
15
1617
1819
20
21
22
23 24
25 26
27 28
29
30 31
32
3334
3536
37
38
40
41 42
43
44
Figure 3-1: Receptor Locations - North Dakota Class I Areas
LostwoodWilderness Area
TRNP North Unit
TRNP Elkhorn Ranch Unit
TRNP South Unit
0 5 10 15 20 km

36
Figure 3-2: Receptor Locations - Montana Class I Areas
45
46 47
48
49
0 10 20 30 40
Fort PeckReservation(east half)
Medicine LakeWilderness Area
km

37
Receptor coverage for Medicine Lake and Fort Peck Class I areas waslimited because they are located even farther fromlargest-contributing sources, and (as indicated in Section 3.1) thelocal minor-source contribution could not be accounted for. Mostof Fort Peck is located more than 300 km from major North Dakotasources. Also, some compromise in receptor resolution was necessaryto achieve practical Calpuff execution times.
The receptor network depicted in Figures 3-1 and 3-2 was utilizedfor both the present and previous NDDH Calpuff analyses. As partof the hearing process the NDDH is seeking input regarding theadequacy of the receptor grid.
3.4 Calpuff Control File Settings
Calpuff control file settings for the NDDH Class I incrementanalysis were generally consistent with IWAQM guidance. However,the adjustment of a limited number of settings was found to providebetter agreement with monitored observations based on aCalmet/Calpuff performance evaluation conducted by NDDH (AppendixB), and such changes were judged to be scientifically viable.
IWAQM recommendations for Calpuff control file settings fall intotwo categories. Group A (NDDH terminology) includes those variableswhere IWAQM provides a default value as a general recommendation forall analyses. Group B includes those variables where IWAQMrecognizes the value will need to be tailored for a givenapplication, and default values are therefore not provided.
The Group B settings utilized by NDDH are summarized in Table 3-5.These settings are straightforward, involving variables related todefining the meteorological and computational grids, and the use ofdefault values for dry and wet deposition parameterization. Notethat the computational grid utilized by Calpuff can be designateda subset of the meteorological grid produced by Calmet. But asshown in Table 3-5, NDDH set the computational grid equivalent tothe full meteorological grid.

38
Table 3-5
Calpuff Control File Settings - Group B
Variable Description Value
CSPEC Names of species modeled (MESOPUFF II = SO2, SO4, NOx,HNO3, NO3)
MESOPUFF II
NX No. of east-west grids in met. data 64
NY No. of north-south grids in met. data 46
NZ No. of vertical layers in met. data 8
DGRIDKM Grid spacing (km) 10
XORIGKM Southwest corner of met. data grid (X) -380
YORIGKM Southwest corner of met. data grid (Y) 140
XLAT Latitude of center of met. domain 47
XLONG Longitude of center of met. domain 102
XTZ Base time zone of meteorology 7
IBCOMP Southwest X-index of computational domain 1
JBCOMP Northwest Y-index of computational domain 1
IECOMP Northeast X-index of computational domain 64
JECOMP Northeast Y-index of computational domain 46
Dry Gas Dep Chemical parameters of gaseous deposition species Model defaults
Dry Part Dep Chemical parameters of particulate deposition species Model defaults
Wet Dep Wet deposition parameters Model defaults
IRESPLIT Hours when puff is eligible for split (1-24) 18-23
NREC Number of discrete receptors 49

39
NDDH settings for Calpuff Group A variables were largely consistentwith IWAQM recommendations, but included adjustments to a limitednumber of variables based on the model performance evaluation. Asdiscussed in Section 2.5, the performance evaluation was based ona comparison of observations and predictions at two monitoringsites, and proceeded in an iterative manner to determine the effectof adjustments to control file settings on model skill. The NDDHperformance evaluation is described in Appendix B.
As a result of the performance evaluation, the NDDH chose to modifya limited number of IWAQM Group A control file settings. Non-IWAQMsettings utilized by the NDDH for the Calpuff control file, andwhich provided optimum agreement with monitored observations, areshown in Table 3-6. These non-IWAQM Group A settings are discussedbelow.
MSPLIT - The option for puff splitting was recommended by JohnIrwin (EPA) when modeling source-receptor distances of 200 kmor more, because of the tendency for Calpuff to otherwiseoverpredict at these distances. Deployment of this optionalso provided better agreement with observations.
MDISP - Use of dispersion coefficient option 2 providedsignificantly better agreement with observations. The NDDHalso believes this selection is more consistent with the“state-of-the-art” in air quality modeling.
BCKO3 - Though the NDDH utilized the hourly file option forozone background, the BCKO3 value is substituted by Calpuffwhen hourly data are missing. Based on local monitoring data,NDDH judged the IWAQM value of 80 ppb to be much higher thantypical for North Dakota, and therefore reset the value to 30ppb.
BCKNH3 - The NDDH value of 2 ppb reflects the annual averageof local, unbiased monitoring data.
XSAMLEN - The NDDH set this value lower than the IWAQMrecommendation, but notes that the only consequence for doingso would be extra computer time due to more puffs on the grid.The goal was to improve model resolution by increasing thenumber of puffs and decreasing mass per puff. Again, because

40
Table 3-6
Non-IWAQM Group A Settings Used by NDDH
in Calpuff Control File
Variable IWAQM NDDH
MSPLIT* 0 1
MDISP 3 2
BCKO3 80 ppb 30 ppb
BCKNH3 10 ppb 2 ppb
XSAMLEN 1.0 0.5
XMAXZI 3000 m 4000 m
* Puff splitting was not deployed in Calpuff control file foroil and gas sources. This concession to model execution timeis reasonable, because puffs would not grow vary large giventhe maximum 50 km source-receptor distance.

41
this parameter is a function of grid cell size, the NDDHbelieves IWAQM should not have provided a default value.
XMAXZI - Value was increased to 4000 m for consistency withZIMAX/ZIMAXW setting in Calmet.
The complete list of IWAQM-recommended settings for the Calpuffcontrol file is included as Appendix D.

42
4. Calpuff Application and Results
4.1 Calpuff Application
Calpuff was executed using meteorological data processed asdescribed in Section 2, and the emission inventories and other inputdata discussed in Section 3. The model was applied to the current(Year 2000/2001) source inventory (Table 3-2), and then to thebaseline source inventory (Table 3-4).
To determine increment consumption in the traditional manner, theCalpuff (hourly) results for the baseline source inventory would besubtracted from the results for the current source inventory, andthe difference (summarized with Calpost) would be compared toallowable Class I increments (i.e., 25 Fg/m3 for 3-hour and 5 Fg/m3
for 24-hr average). As a result of the state’s legal review, theNDDH elected to employ an alternative interpretation of incrementconsumption. This approach involves determining a fixed modeledbaseline concentration, adding the allowable increment (i.e., 25Fg/m3 for 3-hour, 5 Fg/m3 for 24-hour) to the baseline concentrationto establish a MAAL (Maximum Allowable Ambient Level), and thencomparing the modeled results for the current source inventoryagainst the MAAL. The NDDH approach was implemented as follows:
1) Calpuff was applied for the current (Year 2000/2001) sourceinventory (Table 3-2), and then for the baseline sourceinventory (Table 3-4). Calpuff was applied separately foreach year of meteorological data (1990-1994).
2) Receptor averaging was performed to derive uniform predictionsover each Class I area. To implement receptor averaging, theNDDH developed the Calavg software program. Calavg wasapplied to the Calpuff (hourly) output for baseline inventorysources, and then to the Calpuff output for current inventorysources. All receptors identified in Figures 3-1 and 3-2 wereincluded in the averaging procedure. Execution of Calavgresulted in revised Calpuff-compatible files (for baseline andcurrent source inventories) which included one centralreceptor for each Class I area.
3) Calpost (Earth Tech) was applied to the averaged baseline fileand then to the averaged current file to provide summaryresults for 3-hour and 24-hour averages. Calpost provided thehigh and the second-high prediction (3-hour and 24-hour) foreach Class I area.

43
4) Using results from Step 3, the second-high baseline predictionwas used to determine the MAAL for each averaging period foreach Class I area. That is, the MAAL equals the second-highprediction plus conventional allowable increment (25 Fg/m3 for3-hour averages and 5 Fg/m3 for 24-hour averages). MAAL’s weredetermined independently for each year of modeledmeteorological data and for each Class I area.
5) Finally, the second-high prediction for the current sourceinventory (Step 3) was used to determine compliance with theMAAL for each averaging period for each Class I area.Compliance was assumed if the second-high prediction was lowerthan the MAAL. Compliance was determined independently foreach year of modeled meteorological data and for each Class Iarea.
The NDDH variable-increment approach is illustrated in Figures 4-1and 4-2. This illustration demonstrates the application of theprocedure to the Theodore Roosevelt National Park (TRNP) South Unitfor 24-hour averages for 1990 meteorological data.
Determination of the MAAL is illustrated in Figure 4-1. Block 24-hour baseline predictions (averaged over receptors) are plotted asa function of time for 1990 meteorological data. The second-highprediction of 8.9 Fg/m3 is represented by the lower dashed line inthe Figure. Upon adding the conventional allowable 24-hourincrement of 5 Fg/m3 to the second-high prediction, one obtains theMAAL of 13.9 Fg/m3, which is represented by the upper dashed line inthe Figure.
Compliance with the MAAL is illustrated in Figure 4-2. Block 24-hour current-inventory predictions (averaged over receptors) areplotted as a function of time for 1990 meteorological data. Thepreviously determined MAAL (13.9 Fg/m3) is also represented inFigure 4-2. The second-high prediction of 13.7 Fg/m3, representedby the lower dashed line, is less than the MAAL and, therefore,demonstrates compliance under this approach.

44
Figure 4-1: Illustration of MAAL Determination for TRNP South Unit
0
3
6
9
12
151 11 21 31 41 51 61 71 81 91 101
111
121
131
141
151
161
171
181
191
201
211
221
231
241
251
261
271
281
291
301
311
321
331
341
351
361
Meteorological Day (1990)
24-h
rB
asel
ine
Pre
dic
tio
n(u
g/m
3)
Second-high Prediction for Baseline Source Inventory
MAAL (Second-high Prediction + 5 ug/m3)

45
Figure 4-2: Illustration of MAAL Compliance for TRNP South Unit
0
3
6
9
12
151 11 21 31 41 51 61 71 81 91 101
111
121
131
141
151
161
171
181
191
201
211
221
231
241
251
261
271
281
291
301
311
321
331
341
351
361
Meteorological Day (1990)
24-h
rC
urr
ent
Pre
dic
tio
n(u
g/m
3)
Second-high Prediction for Current Source Inventory
MAAL

46
4.2 Results
Results of the Calpuff SO2 modeling analysis for current Class Iincrement consumption in North Dakota and eastern Montana Class I areasare summarized in Tables 4-1 through 4-6. A separate table is providedfor each Class I area. The tables provide the MAAL and the second-highest model prediction (for the current source inventory) for 3-hourand 24-hour averages for each year of meteorological data. Alsoincluded is the number of predicted exceedances of the MAAL (using thecurrent source inventory). MAAL’s and second-high predictions areprovided in units of micrograms per cubic meter (Fg/m3).
As shown in Tables 4-1 through 4-6, the modeling analysis demonstratescompliance with increments at all Class I areas. Though singleexceedances of the MAAL were found for some meteorological years atsome Class I areas, one exceedance per year is allowed under the rules,thus, these single exceedances do not constitute violations.

47
Table 4-1Calpuff Class I Increment Results for SO2
TRNP South Unit(Fg/m3)
1990 1991 1992 1993 1994
3-hr AverageMAAL2nd High Current PredictionNo. of Exceedances of MAAL
45.334.40
46.231.20
44.724.80
45.928.90
43.821.70
24-hr AverageMAAL2nd High Current PredictionNo. of Exceedances of MAAL
13.913.70
14.512.01
12.16.40
12.07.80
13.29.70
Table 4-2Calpuff Class I Increment Results for SO2
TRNP North Unit(Fg/m3)
1990 1991 1992 1993 1994
3-hr AverageMAAL2nd High Current PredictionNo. of Exceedances of MAAL
73.725.70
80.533.60
72.726.50
81.623.00
85.823.50
24-hr AverageMAAL2nd High Current PredictionNo. of Exceedances of MAAL
26.510.60
25.512.60
22.27.60
23.29.00
26.29.20

48
Table 4-3Calpuff Class I Increment Results for SO2
TRNP Elkhorn Ranch Unit(Fg/m3)
1990 1991 1992 1993 1994
3-hr AverageMAAL2nd High Current PredictionNo. of Exceedances of MAAL
94.020.70
79.526.10
65.121.60
80.125.60
75.720.60
24-hr AverageMAAL2nd High Current PredictionNo. of Exceedances of MAAL
23.89.70
25.311.70
23.17.10
26.59.00
22.513.40
Table 4-4Calpuff Class I Increment Results for SO2
Lostwood Wilderness Area(Fg/m3)
1990 1991 1992 1993 1994
3-hr AverageMAAL2nd High Current PredictionNo. of Exceedances of MAAL
46.026.30
47.828.50
45.728.70
47.327.80
49.526.70
24-hr AverageMAAL2nd High Current PredictionNo. of Exceedances of MAAL
14.012.00
14.710.91
13.59.90
14.28.10
11.48.40

49
Table 4-5Calpuff Class I Increment Results for SO2
Medicine Lake Wilderness Area(Fg/m3)
1990 1991 1992 1993 1994
3-hr AverageMAAL2nd High Current PredictionNo. of Exceedances of MAAL
43.927.50
38.216.70
38.519.80
38.720.90
36.218.30
24-hr AverageMAAL2nd High Current PredictionNo. of Exceedances of MAAL
11.47.60
8.74.70
10.58.01
11.29.00
10.58.70
Table 4-6Calpuff Class I Increment Results for SO2
Fort Peck Reservation(Fg/m3)
1990 1991 1992 1993 1994
3-hr AverageMAAL2nd High Current PredictionNo. of Exceedances of MAAL
39.922.50
34.712.90
35.715.70
36.817.60
35.113.80
24-hr AverageMAAL2nd High Current PredictionNo. of Exceedances of MAAL
9.35.51
8.85.20
9.57.70
9.36.10
9.25.80

50
5. Summary
The Calpuff modeling system has been applied to determine the currentstatus of PSD Class I increment consumption for SO2 in North Dakota andeastern Montana. Based on the state’s legal review, a non-conventionalapproach was applied to the interpretation of model results. Thisapproach included the use of receptor averaging, and the establishmentof a modeled baseline concentration for the 3-hour and 24-houraveraging periods. Results of the increment analysis revealedcompliance at all Class I areas.

51
Appendix ACalmet Code Changes

52
To defeat vertical extrapolation in Step 2 wind field development (whileleaving in for initial guess), the following section of Calmet (Version 5.0,Level 970825) Subroutine DIAGNO was changed from:
52 IF(ICALC.LT.0) GO TO 850CC EXTRAPOLATE SURFACE WINDSC EXTRAPOLATION OPTIONS:C 1) IF IABS(IEXTRP)=1, THEN DO NOT EXTRAPOLATE FROM SURFACE DATAC 2) IF IABS(IEXTRP)=2, THEN USE POWER LAWC 3) IF IABS(IEXTRP)=3, THEN USE FEXTRP MULTIPLIERC 4) IF IEXTRP=4, THEN USE SIMILARITY THEORYC 5) IF IEXTRP<=0, THEN DO NOT USE LEVEL 1 DATA FROM UA WINDSC
IF(IABS(IEXTRP).EQ.1) GO TO 91
to:
52 IF(ICALC.LT.0) GO TO 850CC EXTRAPOLATE SURFACE WINDSC EXTRAPOLATION OPTIONS:C 1) IF IABS(IEXTRP)=1, THEN DO NOT EXTRAPOLATE FROM SURFACE DATAC 2) IF IABS(IEXTRP)=2, THEN USE POWER LAWC 3) IF IABS(IEXTRP)=3, THEN USE FEXTRP MULTIPLIERC 4) IF IEXTRP=4, THEN USE SIMILARITY THEORYC 5) IF IEXTRP<=0, THEN DO NOT USE LEVEL 1 DATA FROM UA WINDSC
go to 91

53
Appendix BCalpuff Performance Evaluation

54
Evaluation of
Calpuff Model Performance
Using Year 2000 Data
November 2001
North Dakota Department of Health1200 Missouri AvenueBismarck, ND 58506

55
Introduction
Performance of the Calpuff model (Version 5.4, Level 000602_1), asimplemented by the North Dakota Department of Health (NDDH) for Year2000 data, was evaluated using SO2 observations from the NDDH DunnCenter and Theodore Roosevelt National Park (TRNP) South Unitmonitoring sites. Meteorological input data for Calpuff were developedusing the Calmet meteorological model (Version 5.2, Level 000602a).Source emission rates were based on CEM’s hourly data (where available)or annual average emission for Year 2000.
The performance evaluation proceeded in an iterative manner todetermine the effect of adjustments to settings in the Calmet andCalpuff input control files on model skill. The majority of thesesettings were left equivalent to recommendations in “IWAQM Phase 2Summary Report and Recommendations for Modeling Long Range TransportImpacts,” 1998. But changes to a limited number of settings werejudged to be scientifically advantageous for the region of modelapplication, and resulted in improved model agreement withobservations. A single Calpuff receptor was included for eachmonitoring site.
The iterative procedure resulted in a final set of Calmet/Calpuff inputconditions which yielded very good agreement with observations. All ofthe predicted/observed ratios fell within the factor-of-two criteriasuggested by EPA.
Source Inventory
The evaluation analysis accounted for all SO2 sources located within areasonable distance of the two monitoring sites, and which operatedduring Year 2000. The inventory included all significant SO2 sourceswithin 250 km of the sites. Oil and gas production sources (i.e.,treaters and flares) were also included. But because of their greaternumber and smaller size, the modeled inventory of oil and gas sourceswas limited to those located within 50 km of each monitoring site.
SO2 sources included in the evaluation analysis are identified in Table1. Source locations with respect to monitoring sites are depicted inFigure 1 (oil and gas source locations not shown).
SO2 emission rates and stack operating parameters (i.e., exit velocityand temperature) were based on CEM’s hourly data for Year 2000 whereavailable. For significant sources with no CEM’s data, constantemission rates and operating parameters reflecting annual average

56
operation for Year 2000 were utilized. Annual average stack data foroil and gas production sources were derived from monthly productiondata for Year 2000. The emission characterization for each source isindicated in Table 1. As shown in Table 1, hourly emissions data wereavailable for a majority of significant sources, and for most of thelargest sources.
Emission rates for oil and gas production sources were derived from theND State Industrial Commission’s Oil and Gas data base. The oil andgas sources were screened to eliminate those with zero or minimalemissions. Stack operating parameters for oil and gas productionsources were derived using procedures described in the “Williston BasinRegional Air Quality Study” (1990), and modified using SCREEN3 (EPAscreening model) adjustments for effective flare plume height andradiational heat loss.
Calmet Input Data
The location of the 10 km computational grid utilized by the NDDH forthe Year 2000 analysis is represented in Figure 1. The grid is definedby eight vertical layers. Meteorological input data for Calmet wasbased on 32 surface stations, 5 upper-air stations, and 89precipitation stations located in or near the computational grid. GOESASOS satellite data were used to supplement surface observations forceiling height and sky cover. All meteorologicaldata were obtained from the National Climatic Data Center (surface andprecipitation data), or Forecast Systems Laboratory (upper-air data).Geophysical data were developed using the USGS GTOPO30 data set forterrain elevations and the USGS Global data set for land use.
Processing of meteorological data relied on Earth Tech software, aswell as supplemental software developed by NDDH for format conversionsand missing data substitution. Methodology for meteorological datapreparation is generally consistent with that described in “CalpuffClass I Area Analysis for Milton R. Young Generating Station” (Draft),1999. That methodology was modified for the Year 2000 analysis largelybecause of the inclusion of GOES ASOS satellite data. Methodologyspecific to the Year 2000 analysis has been informally described, andwill be formally documented in a future report. Note that thepossibility/effect of alternative approaches to meteorological datapreparation was not considered in the performance evaluation.
Processing of terrain and land use data was strictly objective, andrelied exclusively on Earth Tech software. Note that the seasonalscheme for land use related parameters, which has been informally

57
documented, is not incorporated in the final iteration of theperformance evaluation, which provided the best agreement withobservations. Rather, Calmet default parameters were assumed for theentire year.
Calmet/Calpuff Control File Settings
For the most part, Calmet and Calpuff input control file settings, asimplemented by the NDDH, were consistent with IWAQM recommendations.However, extensive testing of Calmet output, with visual feedback(plotted data), suggested that adjustment to a limited number of IWQAMsettings was required to achieve reasonable results for wind and mixingheight fields. Further, the adjustment of a limited number ofadditional settings was found to provide better agreement withobservations in the performance evaluation, and such changes werejudged to be scientifically consistent.
Non-IWAQM settings utilized by the NDDH for Calmet and Calpuff controlfiles, and which provided optimum agreement with monitoredobservations, are listed in Table 2. These Non-IWAQM settings arediscussed below.
Calmet
IKINE - The inclusion of kinematic effects provided significantlybetter agreement of Calpuff results with monitored observations.From a scientific standpoint, it seems inconsistent for IWAQM torecommend wind adjustment using Froude number effects (IFRADJ),and not kinematic effects.
BIAS(NZ) - NDDH bias settings were developed through significanttesting with visual feedback. The IWAQM recommendation providesneutral bias (between surface and upper-air data) for all verticallayers. In light of its testing, the NDDH does not believe it isreasonable to assume equal weighting of upper-air wind data withsurface data at the lowest level, and to assume equal weighting ofsurface data with upper-air data at top levels.
LVARY - The NDDH felt it necessary to deploy this option to ensurethat at least one station would always be available.
ZUPWND(2) - The NDDH was concerned that IWAQM was recommending avalue of 1000 m while the model (Earth Tech) default is 2500 m,thus prompting the NDDH compromise value of 2000 m. Butregardless of the selected value for this initial guess wind field

58
input, subsequent wind field development should converge to thesame result.
MNMDAV/ILEVZI - The NDDH found that IWAQM default values for theseparameters, relating to spatial averaging of mixing heights,produced entirely unacceptable results for the mixing heightfield. Severe gradients (bull’s eyes) in mixing height wereobserved in the immediate vicinity of meteorological stations, anda significant increase in the value of these input parameters wasrequired to mitigate the anomaly. The NDDH notes that becauseMNMDAV is a function of grid cell size, IWAQM should specify “UserDefines” for this parameter.
ZIMAX/ZIMAXW - Because the NDDH Calmet/Calpuff grid extends intothe western part of the upper Great Plains, maximum mixing heightwas increased to 4000 m to be consistent with maximum mixingheights reported for this region (Holzworth, 1972).
Calpuff
MSPLIT - The option for puff splitting was recommended by JohnIrwin (EPA) when modeling source-receptor distances of 200 km ormore, because of the tendency for Calpuff to otherwise overpredictat these distances. Deployment of this option also providedbetter agreement with observations.
MDISP - Use of dispersion coefficient option 2 providedsignificantly better agreement with observations. The NDDH alsobelieves this selection is more consistent with the “state-of-the-art” in air quality modeling.
BCKO3 - Though the NDDH is utilizing the hourly file option forozone background, the BCKO3 value is substituted by Calpuff whenhourly data are missing. Based on local monitoring data, NDDHjudged the IWQAM value of 80 ppb to be much higher than typicalfor North Dakota, and therefore reset the value to 30 ppb.
BCKNH3 - The NDDH value of 2 ppb reflects the annual average oflocal, unbiased monitoring data.
XSAMLEN - The NDDH set this value lower than the IWAQMrecommendation, but notes that the only consequence for doing sowould be extra computer time due to more puffs on the grid. Thegoal was to improve model resolution by increasing the number ofpuffs and decreasing mass per puff. Again, because this parameter

59
is a function of grid cell size, the NDDH believes the recommendedXSAMLEN value should be “User Defined”.
XMAXZI - Value was increased to 4000 m for consistency withZIMAX/ZIMAXW setting in Calmet.
Some other deviations from IWAQM guidance, which had no consequence formodel predictions, were also involved in the NDDH implementation.These related to printed output options and parameters for the Lambertconformal map projection used by the NDDH.
Results
Results of the performance evaluation are summarized in Figure 2 forthe Dunn Center monitoring site, and in Figure 3 for the TRNP Southmonitoring site. The Figures include quantile-quantile plots of thehighest 50 predictions and observations for 3-hour and 24-houraveraging times. The plots include “factor-of-two” curves forassessing performance. Note that these results represent the finaliteration of the performance evaluation process, as reflected by thecontrol file settings in Table 2.
Inspection of the quantile-quantile plots in Figures 2 and 3 revealsthat the capability of the NDDH Calpuff modeling system to reproduceobserved SO2 concentrations is very good. All predicted-to-observedratios fall within the factor-of-two criteria suggested by EPA, and inmost cases are much better. Though some of the 50 highest 24-houraverages at both monitoring sites were underpredicted, it appears themodeling system produces no systematic bias toward underprediction onoverprediction when considering the ensemble results.
One caveat regarding these results in that TRNP South Unit monitoringdata for Year 2000 included extensive missing periods (about 700 hourstotal). Therefore, maximum observations may be under-represented inthe comparative analysis, moving the bias more toward underprediction,particularly for 24-hour averages.
Conclusions
The evaluation of Calpuff performance for Year 2000 data at Dunn Centerand TRNP South Unit monitoring sites indicates the modeling systemperforms well, when implemented using IWAQM control file settings asmodified by NDDH (Table 2). Predicted-to-observed ratios for the fiftyhighest predicted/observed concentrations fell within the factor-of-twocriteria suggested by EPA, and did not exhibit systematic bias toward

60
underprediction or overprediction. Therefore, the NDDH implementationof the Calpuff modeling system, using currently processedmeteorological/geophysical data and IWAQM control file settings asmodified by NDDH, should be acceptable for regulatory Class I areamodeling in North Dakota.
The NDDH recognizes that minor improvement in model performance isstill possible. But the implication of these performance evaluationresults is that caution must attend any suggested changes to input ormethodology. Changing all control file settings to IWAQM-recommendedvalues, for example, would likely move some predicted-to-observedratios outside of the factor-of-two window.

61
Table 1
Source Inventory (SO2)
Source
Emission
Characterization
Figure 1
Loc. Key
Coal Creek Station Actual Hourly 1
Antelope Valley Station Actual Hourly 2
Coyote Station Actual Hourly 3
Leland Olds Station Actual Hourly 4
Milton R. Young Station Actual Hourly 5
Heskett Station Actual Hourly 6
Stanton Station Actual Hourly 4
Great Plains Synfuels Plant Actual Hourly* 2
Little Knife Gas Plant Actual Hourly 7
Grasslands Gas Plant Actual Hourly 8
Tioga Gas Plant Annual Average 9
Lignite Gas Plant Annual Average 10
Mandan Refinery Annual Average 6
Boundary Dam Station Annual Average 11
Shand Station Annual Average 12
Colstrip Station Actual Hourly 13
CELP Boiler Annual Average 14
Sidney Station Annual Average 15
Oil & Gas Related** Annual Average —
* Hourly CEM’s data were available for GPSP main stack only. Annualaverage emission assumed for other three units.
** All facilities located within 50 km of monitoring sites.

62
Table 2
Non-IWAQM Settings Used by NDDH
in Calmet/Calpuff Control Files
Parameter IWAQM NDDH
Calmet
IKINE
BIAS(NZ)
0
0,0,0,0,0,0,0,0
1
-1.0, -0.9, -0.7, 0.0,0.5, 1.0, 1.0, 1.0
LVARY
ZUPWND(2)
MNMDAV
ILEVZI
ZIMAX
ZIMAXW
F
1000 m
1
1
3000 m
3000 m
T
2000 m
8
4
4000 m
4000 m
Calpuff
MSPLIT*
MDISP
BCKO3
BCKNH3
XSAMLEN
XMAXZI
0
3
80 ppb
10 ppb
1.0
3000 m
1
2
30 ppb
2 ppb
0.5
4000 m
* Puff splitting was not deployed in Calpuff control file for oil andgas sources. This concession to model execution time is reasonable,because puffs would not grow very large given the maximum 50 km source-receptor distance.

63
123 4
5
6
7
8
9
10
1112
1314
15
0 100 200 300 400
Figure 1: Monitor and Source Locations
Kilometers
= Significant SO2 Source
= PSD Class I Area= Extent of Calpuff computational/meteorological grid
North DakotaSouth Dakota
MontanaWyoming
Canada
Dunn Center Monitoring Site
TRNP South Monitoring Site

64
10 100
Observed
2
3
4
5
6
7
8
9
10
100
Pre
dict
ed
20
30
40
50
60
70
80
90
20 30 40 50 60 70 80 90 100
Calpuff Predicted vs Dunn Center Observed50 Highest 3-hour (ug/m3)
3 4 5 6 7 8 9 2 310Observed
3
4
5
6
7
8
9
2
3
10
Pre
dict
ed
Calpuff Predicted vs Dunn Center Observed50 Highest 24-hour (ug/m3)
20
30
20 30
Figure 2

65
5 6 7 8 9 2 3 4 510
Observed
5
6
7
8
9
2
3
4
5
10
Pre
dict
ed
20
30
40
50
Calpuff Predicted vs TR South Observed50 Highest 3-hour (ug/m3)
20 30 40 50 2 3 4 5 6 7 8 9 210Observed
2
3
4
5
6
7
8
9
2
10
Pre
dict
ed
Calpuff Predicted vs TR South Observed50 Highest 24-hour (ug/m3)
20
20
Figure 3