Embed Size (px)
Citation preview

1
CALRECYCLE ORGANICS INITIATIVECAPCOA Enforcement, Engineering, and Toxics
Symposium 2017November 7-8, 2017
Folsom, CA
Dr. Crystal Reul-Chen – CalRecycle
Brian Clerico - ARB

Questions answered today
What does implementation of SB1383 mean for air district facility permitting efforts?
What are some potential considerations to address VOC emissions?
2

3
What does this mean for air district permitting efforts?

4
Permitting issues and considerations Number of advanced technology facilities to permit?
Covered aerated static pile compost In-vessel digestion (anaerobic digestion/WWTPs)
Number of VOC offsets needed? Movement of organic materials Emission factors NSR thresholds/facility sizes Emission reduction credits Essential public service designation
What other permitting issues exist? PM2.5/PM10
Toxic air contaminants Odors

SB 1383 proposed landfill diversion
regulation draft definition
Organic Waste:
"Organic Waste" means solid wastes containing material originated from living organisms and their metabolic waste products, including but not limited to food, green waste, landscape and pruning waste, applicable textiles and carpets, wood, lumber, fiber, manure, biosolids, digestate and sludges.
5

Paper, 17.4%
Glass, 2.5%
Metal, 3.1%
Plastic, 10.4%
Electronics, 0.9%
Food, 18.1%
Other Organic, 19.3%
Lumber, 11.9%
Inerts and Other, 8.0%
HHW, 0.4%Special Waste, 5.0% Mixed Residue, 3.0%
2014 disposal stream Organic waste >20 million tons disposed of at landfills
2/3rds of the total 2014 waste stream
6
*From CalRecycle’s Waste Characterization Study (2015). Does not include biosolids or alternative daily cover at landfills.

7
Organic waste disposal analysis Based on CalRecycle’s 2014 Waste Characterization Study
disposal rates Projected population/disposal growth to 2025 by air district
Organic materials capable of being composted or going to anaerobic digestion facilities Food recovery – 2.5% rescued; 25% to composting; 75% to in-vessel
Yard waste – 100% to composting
Manure – 50% to composting; 50% to in-vessel
Digestate from anaerobic facilities to composting
Need to divert approximately 4 million tpy to anaerobic digestion and over 5 million tpy to compost

8
How many additional total statewide compost and anaerobic digestion facilities needed?
About 90 compost facilities (60,000 tpy throughput)
Roughly 50 anaerobic digestion facilities (75,000 tpythroughput)

Possible movement of materials across air district boundaries scenario
9
Departing County (Air District)Receiving County (Air District)
Northern California San Joaquin(SJVUAPCD)
Stanislaus(SJVUAPCD)
Merced(SJVUAPCD)
Stay in County
Contra Costa (BAAQMD) 25% - - 75%
Alameda (BAAQMD) 25% 25% - 50%
Santa Clara (BAAQMD) - 25% 25% 50%
Southern California Kern (Eastern Kern APCD)
San Bernardino (Mojave Desert
AQMD)
Riverside (Mojave Desert
AQMD)
Imperial (Imperial
APCD)
Stay in County
Los Angeles (SCAQMD/Antelope Valley)
25% 25% 25% 25%
Orange (SCAQMD) 10% 25% 25% 10% 30%
SDUAPCD (SDUAPCD) - - 25% 25% 50%

10
Compost facilities needed by air district –Two possible scenarios
Number of additional compost facilities needed keeping organic waste within air district boundaries
Number of additional compost facilities needed moving organic waste across air district boundaries
10

11
Air District
Within air district boundaries scenario
Across air district boundaries scenario
Organic material diverted (tpy)
Number of additional facilities
neededOrganic material
diverted (tpy)
Number of additional
facilities needed
Bay Area 885,000 15 727,000 12
Imperial 43,000 1 201,000 3
Mojave Desert 35,000 1 138,000 2
Sacramento Metro 226,000 4 226,000 4
San Diego 593,000 10 390,000 6
San Joaquin Valley 283,000 5 701,000 12
South Coast 2,620,000 44 2,290,000 38
Ventura 145,000 3 145,000 3
All other air districts 466,000 8 485,000 8
Grand total 5,296,000 89 5,303,000 88

12
How many VOC offsets might be needed? Understanding each air district’s unique air
quality issues Ozone attainment status
NSR offset threshold for VOCs
How each air district draws boundaries around these stationary source and determines emission factors
ERC banks and availability within those banks
Do sufficient emissions reduction credits exist?

Which emissions factor (EF) should be used?
Potential to emit (PTE) for 60,000 tpy throughput SJVAPCD - 23.5 tpy VOC emissions actual permitted facility
SCAQMD - 35 tpy VOC emissions based on 75% control of emissions
BAAQMD - 56 tpy VOC emissions based on actual permitted facility
What affects the EF behind the PTE? Material type
Where the boundary around the facility is drawn
How many data points are gathered to derive the EF
Should digestate be included in EF? Assume digestate doesn’t add to compost VOC emissions
13

Where do these EFs come from?
14

Baseline (uncontrolled) EF Generally accepted EF(s)* vs. operator specific
SCAQMD, SJVAPCD, ARB (EI) have published EFs
Feedstock composition (green, food, biosolids, manure)
Variability (EF range among accepted tests 0.85 to 10 lb-VOC/ton)
NSR implications
BACT most likely will be triggered
~120 to 190 ton uncontrolled windrow(s) in active phase > 25 lb-VOC/day
BACT technology and control % (What is the class/category? What is the achieved-in-practice performance standard?)
Offsets?
Title V applicability (fugitive vs. non-fugitive)
*https://www.arb.ca.gov/ei/areasrc/Composting%20Emissions%20Inventory%20Methodology%20Final%20Combined.pdf
15

Source testing Compliance demonstration
BACT or rule performance standard (% Reduction over baseline)
Offsets <-> Throughput
Testing considerations Cost: ~$30,000 to $100,000+
Minimum ~ 3 piles different ages: 2 active phase; 1 curing phase (= 3 points on the “curve”)
Pile age selection? VOC emission rate correlates with pile temperature.
With less testing, more of the curve is formed by linear interpolation.
Ammonia emissions lag VOC in the cycle (i.e. peaks are not coincident).
Frequency? Seasonal variation
Stand alone or cumulative average?
16

17
timeDensityPileVolumePile
AreaSurfacePiletimearea
massFlux
tonVOClbEF ×
×
×
⋅=
−
Plot from 2013 TAP Study for Solar Powered ASP (SJVAPCD)
EF= area under the curve

Potential BMPs to minimize VOC emissions
Compost pile monitoring options Process variables (e.g. oxygen, moisture, C:N ratio) - conduct stability
tests
Feedstock type and throughput – keep records
Integrity of cover(s) – visual inspection; VOC portable analyzer – possible utility for “leak” detection, but not emissions
Olfactory (HSC sec. 41705, 1st of two, subdivisions (a)-(c)) – odor nuisance enforcement not delegated to air districts, but strong odors can indicate anaerobic conditions, old feedstock stockpiles, poor management, malfunctioning equipment
Other pile monitoring options
18
19
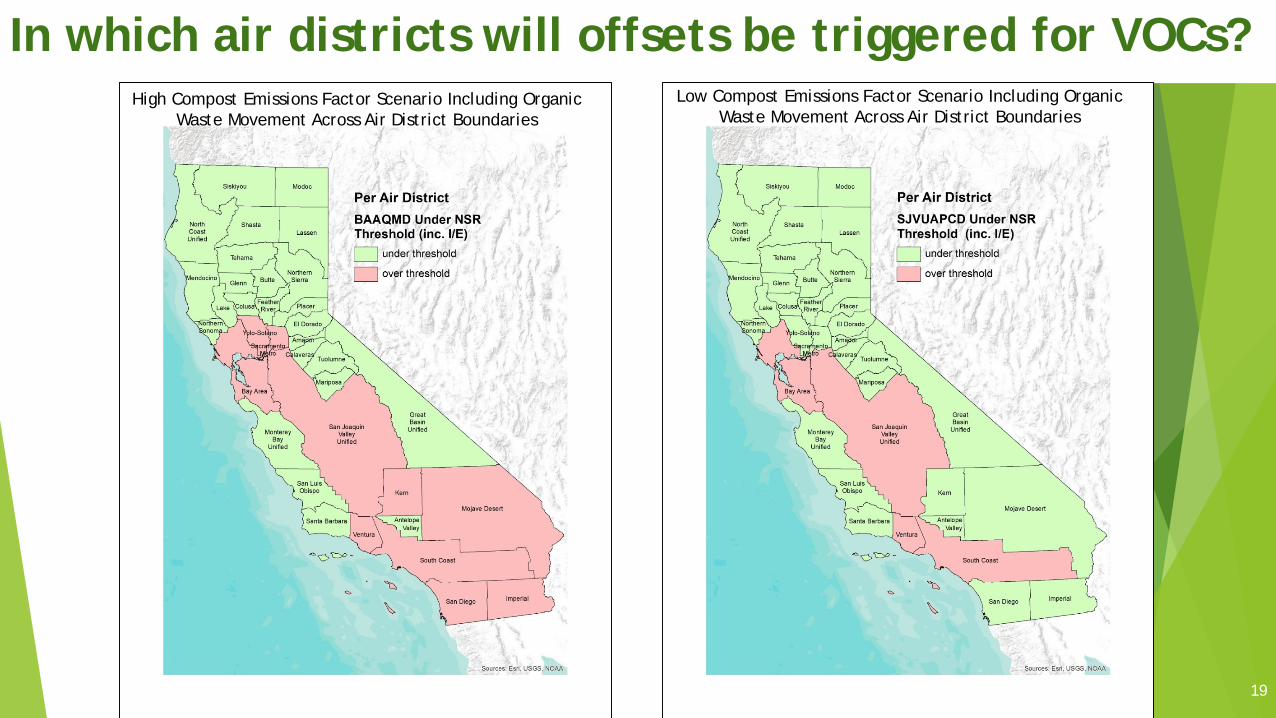
In which air districts will offsets be triggered for VOCs?High Compost Emissions Factor Scenario Including Organic
Waste Movement Across Air District BoundariesLow Compost Emissions Factor Scenario Including Organic
Waste Movement Across Air District Boundaries
19

20
Air Districts
Air District New Compost Facility Survey Results (Distributed by Yolo-Solano Spring 2017)
VOC offset threshold/majorsource threshold (tpy) Total VOC ERCs in the general bank (tons)
Antelope Valley 25 0.16Bay Area 10 3147Butte 25 or 40 85.6Feather River 25 or 100 273.8 Non-Fed; 69.8155 Fed
Lake County ~25 No offset programMojave Desert 25 or 40 105.24 All FedMonterey Bay ~25 94.206No. Sonoma N/A 0Placer County 25 120
Sacramento Metro 25 Community/ Military: 494; Private ERCs: 318
San Diego 25 or 50 281.54San Joaquin Valley 10 5000San Luis Obispo 25 55.4Santa Barbara 25 106Shasta 25 360.5South Coast 4 (10, 25, 100) 98.89Ventura 15 593.8Yolo-Solano 25 196.3

21
Do sufficient ERCs exist to permit additional compost facilities?High Compost Emissions Factor Scenario Including Organic
Waste Movement Across Air District BoundariesLow Compost Emissions Factor Scenario Including Organic
Waste Movement Across Air District Boundaries

22
SCAQMDair basins example 38 - 44 compost facilities
560 – 1650 VOC tpy emitted (exempt digestate emissions)
99 ERCs available in basin
Rule 1133 caveats Size matters (>5000 tpy)
Materials matter (food waste)
Fugitive versus equipment emissions

23
Main results
The majority of air districts should have sufficient VOC ERCs or not need VOC ERCs to meet SB 1383
Smaller throughput facilities may not need VOC offsets
Where the boundaries are drawn around a facility matters
Where a facility is located in an air district may be important
ERCs appear to exist, but are they readily available for purchase, and do other industries need them too?

What are some potential considerations to address VOC emissions?
24
25
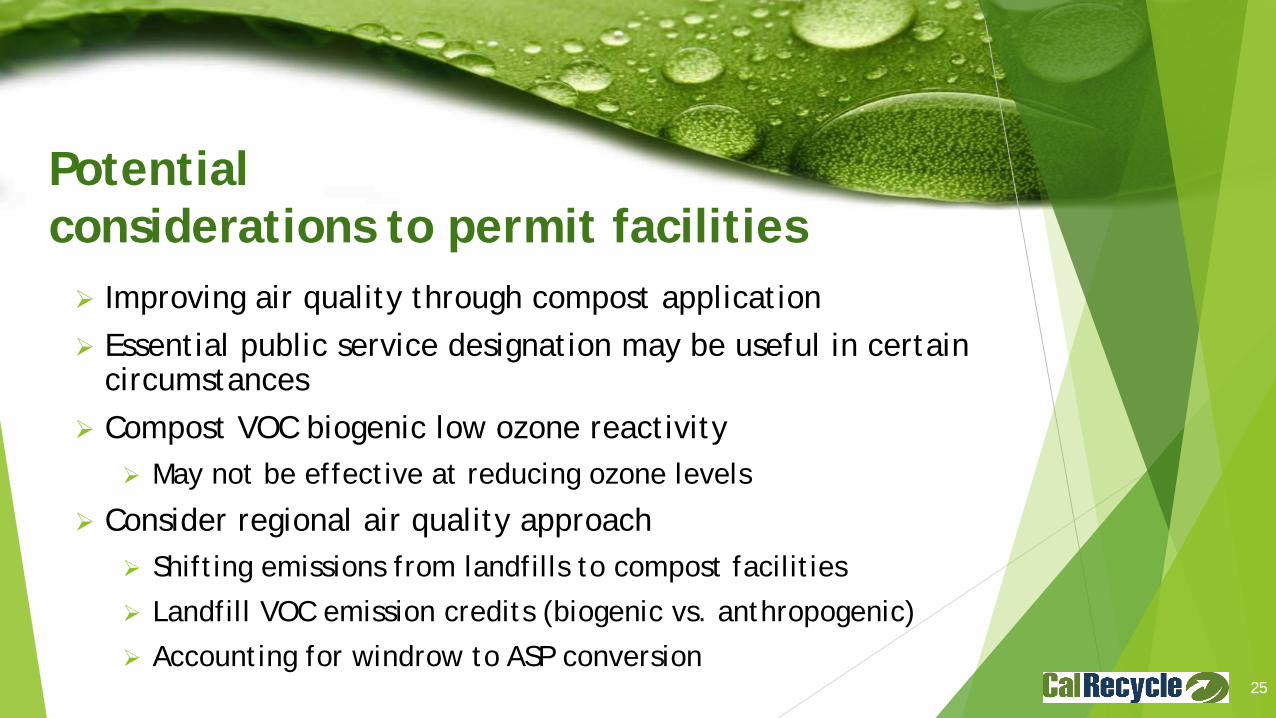
Potential considerations to permit facilities Improving air quality through compost application Essential public service designation may be useful in certain
circumstances Compost VOC biogenic low ozone reactivity
May not be effective at reducing ozone levels
Consider regional air quality approach Shifting emissions from landfills to compost facilities Landfill VOC emission credits (biogenic vs. anthropogenic) Accounting for windrow to ASP conversion

Achieving SB 1383’s landfill diversion goal can improve air quality Compost and mulch application as a part of a systems
approach to natural working lands management can reduce criteria air pollutant emissions PM10 (PM2.5) emissions from degraded soils
VOC emissions by reducing need for pesticide application
NOx emissions by reducing need for synthetic fertilizer application
Reduce emissions associated with irrigation by decreasing irrigated water (~30%) needs
Reduce GHG emissions directly and indirectly Reduce methane emissions from landfills Sequester carbon in roots and surrounding soil through
increasing soil organic matter and enhancing plant growth from compost addition
26

27
Essential public service designation
Compost facilities would become similar to landfills and WWTPs (since the waste can’t go to landfills anymore, it needs to go somewhere). 21 out of 35 air districts have EPS definitions
12 include landfills (2, only if publicly-owned and operated)
17 include WWTPs (12, only if publicly-owned and operated)
Not universally useful
May open up access to small community ERC banks
May give some leeway by creating a higher threshold for emissions

28
Air Districts
Air District New Compost Facility Survey Results (Distributed by Yolo-Solano)Total VOC ERCs in the general bank (tons)
ERC bank for EPS?
Size ERC VOC EPS bank (tpy)
Compost eligible for EPS ERC Bank?
Antelope Valley 0.16 No N/A N/ABay Area 3147 No 195 NoButte 85.6 Yes 60 No
Feather River273.8 Non-Fed69.8155 Fed
Yes 14.48 No
Lake County No offset programMojave Desert 105.24 All Fed NoMonterey Bay 94.206 Yes 43.69 YesNo. Sonoma 0 No n/a n/aPlacer County 120 Yes 32 No
Sacramento MetroCommunity/ Military: 494;
Private ERCs: 318Yes 20.3 No
San Diego 281.54 No N/A N/ASan Joaquin Valley 5000 No N/A N/A
San Luis Obispo 55.4 Yes 31.9 APCO discretion
Santa Barbara 106 No n/a n/aShasta 360.5 No n/a n/aSouth Coast 98.89 Yes 22.8 NoVentura 593.8 Yes 198 NoYolo-Solano 196.3 Yes 17.1 No

29
Biogenic VOC reactivity variesVolatile Organic Compound MIR % VOC EmissionsAcetone 0.36 0.47%Camphor 0.49 1.18%Isopropyl alcohol 0.61 42.31%Undecane 0.61 0.20%Methyl alcohol 0.67 12.79%Acetic acid 0.68 5.94%Methyl butylacetate 1.09 0.14%Methyl propionic acid 1.2 0.26%Propionic acid 1.22 0.53%Ethyl alcohol 1.53 18.16%Butanoic acid 1.82 1.35%2 Butanol 2.4 0.39%Naphthalene 3.34 0.50%Pinene Isomers 3.52 0.60%3 Methyl butanoic acid 4.23 0.28%Alpha pinene 4.51 1.36%Camphene 4.51 0.24%Limonene 4.55 2.27%Terpineol 4.63 0.35%Isovaleraldhyde 4.97 0.15%
1 Methyl, 3-1-methyl ethyl benzene 5.49 0.23%2 Methyl 1-propene 6.29 0.41%Acetaldehyde 6.54 0.14%Propene 11.66 0.22%2 Butene 14.24 0.17%Others N.A. 9.36%
100%
90 percent of VOCs emitted in first week of composting (Kumar et al., 2011) and can be well controlled through CASP systems
About 82% of compost emissions have MIR < 1.53
Non-aerated degradation (landfills?) of organic materials emit more highly reactive monoterpene VOCs (Burger et al., 2015) in the 4 – 5 MIR range
VOC emissions not controlled from active face landfills
By permitting advanced technology compost facilities we should be reducing VOC emissions

30
Regional air quality approach
Do regional emissions modeling Movement of the same material from one place to another
Not entirely “new” emissions
Create credits for landfill emissions reductions for new compost facilities to use?
Landfill LANDGEM issues
CalPoly SLO study looking at GHG/VOC emissions

LANDGEM emissions measured versus natural degradation of organic materials
31
18%
0%1%
81%
Biogenic Compost VOC Emissions Captured in LANDGEM 3.02
Ethyl alcohol (Ethanol)
Ethylbenzene
Acetone
Other
Anthropogenic versus biogenic VOC emissions measured CFCs, BTEX, etc.
Different timeframe from organic material VOC emissions Emissions accounted for once steady-
state achieved Intermediate cover (two plus years after
most emissions from organic materials have occurred)
Non-aerated degradation of organic materials emits more highly reactive VOCs (Burger at al., 2015)
31

Summary
Not an easy lift
Each air district has unique air quality challenges Many considerations (VOCs, offsets, ERCs)
Research may be needed to better define new approaches Emission factors
Quantify VOCs further for regional modeling approach
32

Working together
CAPCOA white paper
CalRecycle and ARB want to work with air districts by Providing technical assistance
Supporting efforts to meet air quality goals
Developing materials and information to support district air quality permitting activities
Other assistance needed to help facilitate the permitting of organic materials management facilities
Regional modeling
33

34
Contact us!
David Mallory, Manager, ARB Climate Change Policy Section
[email protected]; 916–445-8316
Hank Brady, Manager, SB 1383 Regulation, CalRecycle
[email protected]; 916-341-6250
Brian Clerico, Air Resources Engineer, ARB Industrial Strategies Branch [email protected]; 916-327-7843
Dr. Crystal Reul-Chen, Senior Environmental Scientist, CalRecycle Statewide Technical Assistance Branch
[email protected]; 916-341-6026