Embed Size (px)
Citation preview
CAMBIOS FISICOS Y TERMODINAMICOS OBSERVADOS EN EL YACIMIENTO GEOTERMICO DE CERRO PRIETO
F J Bermejo M C Cortez A y A Arag6n A Comision Federal de Electricidad Mexicali Baja California Mexico
La Comision Federal de Eleetrieidad inieio la generaeion de eleetrieidad en la Planta Geotermoeleetriea de Cerro Prieto en abril de 1973 empleando dos turbinas acopladas a generadores de 375 MW para 10 cual liza vapor en una cantidad de 730 Tonhr
El vapor utilizado para el movimiento de las turbinas es proporcionado por pozos - shygeotermicos los euales extraen del yaei-shymiento una mezcla agua-vapor en diferentes proporciones que una vez en la superficie es separado el r del agua por medio de equipo de separac centrffugo tipo Webre y eonducido por medio de tuberias de difeshyrentes diametros a la planta de generacion El flujo de vapor es medido a trav~s de - shyorificios instalados en estas tuberfas - shy(Fig 1) el agua que resulta de la seprashycion es introducida en un silenciador vershytical el cual descarga a un canal en donshyde esta instalado un vertedor que nos sir shyve para medir el gasto de agua El numero de pozos utilizados para produccion de va-
NOMENCLATURA1--------------- PQZO
I _ ESTRATOS PRDOUCTORES ARENAS Y MiENlstAS CON OIHR(Nshy
TES CON$ISTENCtAS
2_ TUBERIA iANURAOA I ZONA pRQOUCTORA J
3 _ Tl)IJERIA ot RECUSRIMJENTO
4 _ TuSERIA CONDuCTORA
~ _ tONTRAPOZO
6_ PRESION CASEZAL
1 _ ARSOl Of NAtOAO
8_ LINEA DE OESCARGA DE VAPOR SEPARAOO
9_ A(iUA $EPARAOA A LA PRESION DE SEPARAtiON
I o~ DISCO DE ROMPIMIENTO IfL KlIcm~ 20Sot
I I w AGUA Sf PARADA A LA PRESION ATMOSFpoundR1CA L l2 _INDltAOOR De NIVeL OE AGuA HI EL SEPARADOR
1I_ VALVULA De SEGufilOAO
I _ VALVULA OE ESFERA
IS bull CARRETE OE EXPANSION I a 900 A N S I
16_ CA8EZAL
17_ I4ANOMETAO OIF(AENCIAl
XBL 7811-13116
Figura 1 Arreglo tfpico de instalaciones superfi shycia1es de un pozo geotermico en Cerro Prieto
300
por necesario para mover las turbinas ha shysido de 13 a 17 pozos
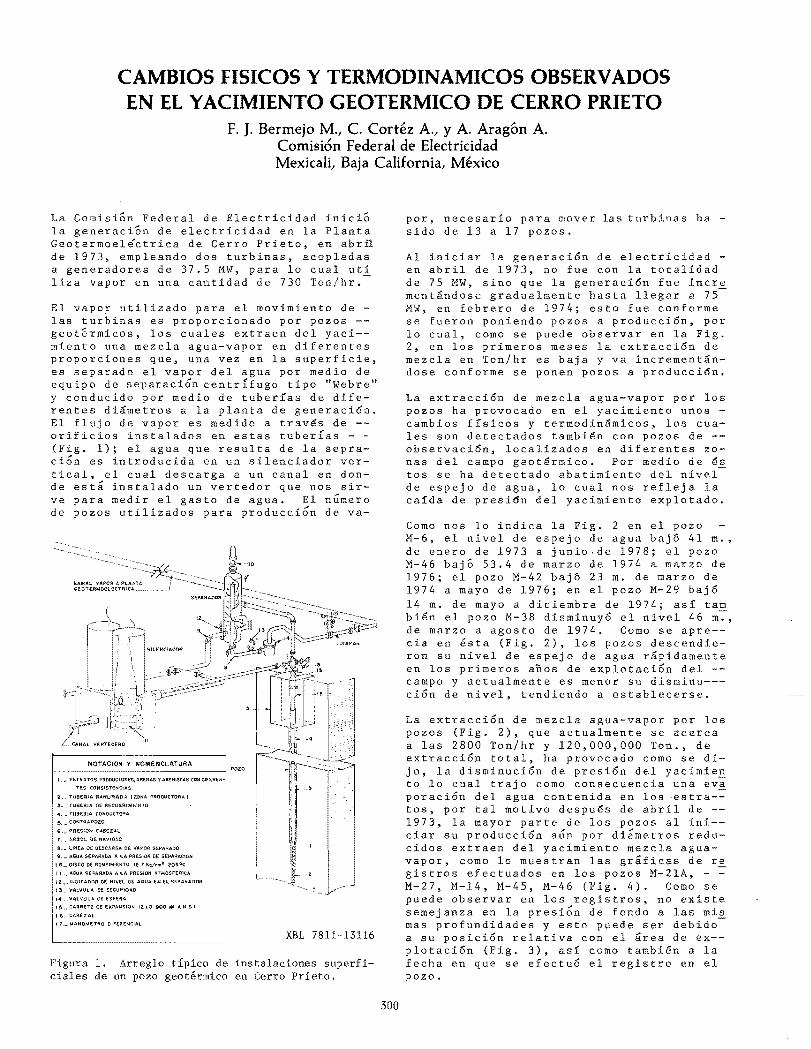
Al iniciar la generacion de e1ectricidad shyen abril de 1973 no fue con 1a tota1idad de 75 MW sino que la generaci6n fue incre mentandose gradualmente hasta 11egar a 75shyMW en febrero de 1974 esto fue conforme se fueron poniendo pozos a produccion por 10 eual como se puede observar en 1a Fig 2 en los primeros meses la extracci6n de mezcla en Tonhr es baja y va incrementanshydose conforme se ponen pozos a producci6n
La extraccion de mezc1a agua-vapor por los pozos ha provocado en e1 yacimiento unos shycambios fisicos y termodinamicos los cuashy1es son detectados tambi~n con pozos de observaci6n localizados en diferentes zoshynas del campo geotermico Por medio de tos se ha detectado abatimiento del nive de espejo de agua 10 cua1 nos refleja 1a cafda de presi6n del yacimiento explotado
Como nos 10 indica la Fig 2 en e1 pozo M-6 e1 nivel de espejo de agua bajo 41 m de enero de 1973 a juniode 1978 el pozo M-46 bajo 534 de marzo de 1974 a marzo de 1976 el pozo M-42 bajo 23 m de marzo de 1974 a mayo de 1976 en e1 pozo M-29 bajo 14 m de mayo a diciembre de 1974 as tam bien el pozo M-38 disminuyo el nive1 46 m~ de marzo a osto de 1974 Como se apre-shycia en esta ig 2) los pozos descendieshyron su nivel de espejo de agua rapidamente en los primeros anos de exp10tacion del - shycampo y actua1mente es menor su disminu--shycion de nive1 tendiendo a estab1ecerse
La extraccion de mezela agua-vapor por los pozos (Fig 2) que actua1mente se acerca a las 2800 Tonhr y 120000000 Ton de extraccion total ha provocado como se dishyjo la disminuei6n de presion del yacimien to 10 cua1 trajo como consecuencia una eva poracion del agua contenida en los middotestra-= tos por tal motivo despu~s de abri1 de - shy1973 la mayor parte de los pozos a1 ini- shyciar su produccion aun por diametros redushycidos extraen del yacimiento mezcla aguashyvapor como 10 muestran las graficas de re gistros efectuados en los pozos M-21A shyM-27 M-14 M-45 M-46 (Fig 4) Como se puede observar en los registros no existe semejanza en 1a presion de fondo a las mas profundidades y esto puede ser debido a su posicion relativa con e1 area de ex-shyplotacion (Fig 3) as como tambien a la fecha en que se efectuo el registro en e1 pozo
301
20 u-2 1 I
I
shy U-2 - U-2 -I -2 -I I AI II I~~ T R IA~ 1shy r+i 1raquoshy
~ gt0shy I I J_
110shy MEZCLA AWAIVJPOR I ~IO()- 2
k 17 fT jPfpt ESL (TONH) I
00shy 11-46 II II If rI
0ltgtshy l L k I roshy t 2 n II Ii IJ -r ~ II li 1 I I( I~
~IO- ~2
I
111000shy ~ IV fJ 3ltgtshy shy ~ IV
co 0shy ct
11-6
~ 0shy ~ iV
~o- ~I ~ 0shy ~ -shy i 10 11-29 -
t
~3ltgt- t t lt0shy
~ II
-IOshy ~ I~ 1 11-42 ~ bullr- 0shy
l iI - shy --00shy t 11-38- -100shy
1 20
Ii -0shy ~- r
i-3ltgtshy
l
eo -ISOshy
bWmN1I ~ o~ EnI F raquot nJul 0cI Nor Ole ftklIAgD J JI DlcEIIIlb ~ Julsp r -JulAvo I 9 7 3 19 7 4 I 9 7 5 I 9 7 6 I 9 7 7 I 9 7 8
XBL 7811-13146
Figura 2 Cerro Prieto produccion de mezc1a vapor-agua y variacion del nive1 de agua en pozos de observacion
80 120 60 200 20 280 320 3600Cm I I I I I I I I
20 0 60 80 00 120 140 160KcentTl
~ Mmiddot21
10 shy 1 ~1 ~ l
500
1 f000
1 1 1 100
1 f 1
1000
1100
1 ~M45 ~271 14-14 _ Mshy IA
14-46 1
10
1500
M-bull M-7
bull
14-53bull M-130bull
14-11 14-104
14-38 104010 bull 14-43
M13 reg 104-39 bull M-ISA 14-14middot PLANTA
bull M-5 bull M-15A ~ GEOTERM)ELECTRICA 14-25+ 1420 C ~flI H02
14middot29 bull 14-26 bull M-ZIA
M-9 reg 14-30 14-27 bull
bull bull 14-31 +14-8
14-34+ bull 14-103 M-35
bull14-84 bull 14-45
14-48bull14-181 bullbull
14-105 14-91bull M bullbull
POZO EN OBSERVACION pozo FECHA CONDICIONES DE F LUJO
POZO PROOUCTOR
bull POlO pERFORADO
m 1
14-90bull
140101bull XBL 7811-13145
M-21 A M-27 M-14 M-45 M-46
AGOSTO 1974 ABRI L 1976 JULIO 1976 JULIO 1977 AGOSTO 1977
LINEA PUAGA 1ltgt VA LINEA PUAGA ltgt VA_ LINEA PUAGA yltgt VA LINEA PUAGA ltgt VA LINEA PUAGA ltgt VA
XBL 7811-13154
Figura 3 Distribucion de pozos mica de Cerro Prieto
en e1 campo geotershy Figura 4 Registros de presion M-14 M-4S y M-46
pozos M-21A M-27
302
La disminucion de preS10n del yacimiento shyexp10tado es tambien comprobado a traves de una serie de registros de presion efec tuados en un mismo pozo indicativos de 1a disminucion de la presion del yacimiento shycon respecto al tiempo que lleva en exploshytacion e1 campo
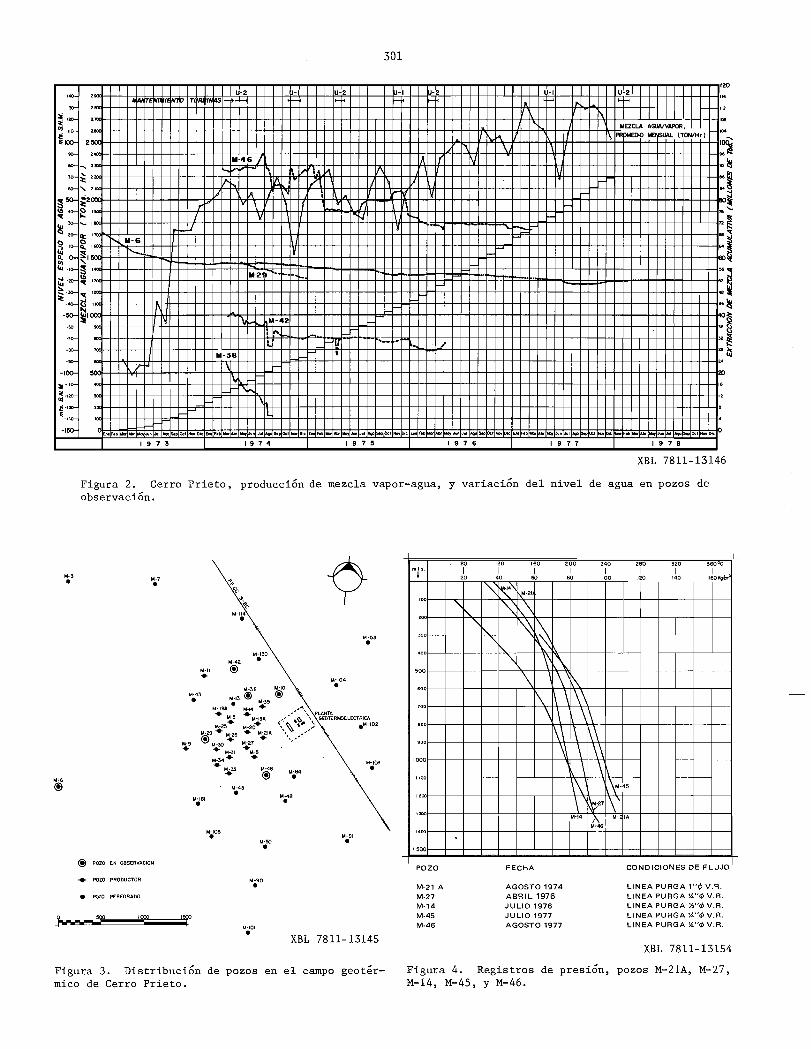
En los registros de presion del pozo M-25 f1uyendo por purga de 20 VR efectuados de mayo de 1973 a marzo de 1976 se apre-shycia una disminuci6n de presi6n de fondo de 248 Kgcm 2 bull En los registros P-6 a1 P-10 descargando e1 pozo por orificio de 30 efectuados de noviembre de 1974 a mayo de 1977 se observa una disminuci6n de pre-shysion de fonda de 223 Kgcm 2 ademas que bajo estas condiciones de f1ujo e1 pozo ex trae mezc1a agua-vapor del yacimiento (Fig 5) bull
En los registros de presion y temperatura efectuados en e1 pozo M-30 fluyendo este por purga de 20 VR 11evados a cabo de noviembre de 1973 a marzo de 1976 corresshypondientes a los registros P-1 a P-4 se shyaprecia una disminucion total de presion shyde 130 Kgcm2 y 9degc de temperatura asi- shymismo en los registros efectuados con desshycarga de 30 11evados a cabo de diciembre de 1974 a marzo de 1976 del P-5 a P-7 se observa una carda de presion total de 55 Kgcm 2 (Fig 6)
80 280m I I
5001-+-t--1rtt-t +--+~_+--+_+-_+-_L-+
IOOCI-+---+-+ttC+t-+
150()
REG I STROS CON pozo FLOYENOO POR LlHEA PURGA Z$ V R
REG I SIRO FrCHA AP (~glcm l ) P- HAVO 1973
360ltt
I 160Kcentm
P-I NOV 1973 18 P-3 NOV 1l7~ 1~2 P-~ OCT 1975 l~ P-5 HARZO 1976 5~
lIP bull 2~8T REGISTROS CON POZO FLUYENOO POR LINEA 6 OROFICIO 3~ P-6 HOV 197~ P-7 KAYO 1975 98 P-8 OCT 1975 67 P- KARZO 1976 31 P-IO KAYO 1977
lIP27
bull 223 XBL 7811-13144 T
Figura 5 Registros de presion pozo M-25
trtt-middot
olt
1000
1100
shy1500
eo 120 160 200 240 280 320
I I I I I I I 20 40 60 eo 100 12O 140
1 T-
l
~ ~ ~ ~ -r-JFf~
1 ~ l I
i ~~ ~~ ~
~ ~
~ ~ _T_
i T-I
~~ -il middot6 middot3
REGISTROS CON POZO FLUYENDO POR LINEA PURGA 2+ vR
REGI SIRO FECIIA LIP (kgcm2) AT (Oe) P-I NOV 1973
~
~
i
--- shy
P-2 T-I NOV 1974 75 P-bull T-2 NOV 1975 34 80 p-4 T-3 KARZO 1976 21 10
APTmiddot 130 ATT bull 90
REGISTROS CON POZO FLUYENDO POR LINEA 6$ ORIFICIO 3$
P-5 DIC 197~ P-6 NOV 1975 P-7 MARZO 1976
XBL 7811-13143
Figura 6 Registros de presion y temperatura pozo M-30
En los registros de presion y temperatura del pozo M-31 efectuados de julio de 1973 a noviembre de 1975 con f1ujo a traves de purga de 20 VR se aprecia una baja de presion de 422 Kgcm 2 y 15degC de temperatu ra observandose ademas que e1 pozo ext rae agua en 1973 y en 1975 extrae mezcla aguashyvapor (Fig 7)
En los registros de presion y temperatura en este mismopozo con descarga a traves de orificio de 30 efectuados de marzo de 1970 a marzo de 1976 se aprecia una caida de presion de fondo de 233 Kgcm2 y 21degC en el flujo extraido observandose tambien que en 1970 e1 pozo extraia agua del yacishymiento y posteriormente extrajo mezc1a agua vapor (Fig 8)
En los registros de presion efectuados en el pozo M-2lA con descarga por orificio shyde 30 se aprecia una disminuci6n de preshysion de fondo de 45 Kgcm2 en abri1 de 1975 a mayo de 1977 (Fig 9)
En 1970 antes de 1a explotacion del campo geotermico existan pozos en los cuales shyera semejante 1a presion de fondo y ademas extra fan agua caliente del yacimiento coshymo 10 muestran los registros efectuados en Vos pozos M-13 y M-5 por f1ujo a traves shy
oe orificio de 2 120 (Fig 10)
303
POlO fluyenltfo por purgo
REGlSTRO FECHA
PmiddotI T-I JvliO de f913
P-Z T-a AbrIl 1975 T-gt No d 1975
2 V R
GP (Kqknf I toT( degC I
400 22
~Pl 4~ ~
gt20 I
40
---1-shy-- shy
-j shy
so 20 60 aoo gt40 8O 320 jCml I I I I I I I 0 40 60 80 DO 120 140 60
_shy r-~ _shy
1shy - - shy I- shy
000 --- shy
_-shy - ~- I
-- _-shy -- shy shy
- shy - ___ - shy
_r--shy - _ _-shy - -- shy -- shy
1000 - shy - shy shy ~
I
3 I
middot2
REGISTlIOS CON POlO FLUYENOO POR LINEA 6$ bull ORIFltlO 3$
REGISTRO FECHA 6P(kgc2j P-l ABRIL 1975 P-2 HOV 1975 30 P-3 KAYO 1977 15
6PT - ~5
XBL 7811-13153 XBL 7811-13151
Figura 7 Registros de presion y temperatura pozo M-31 Figura 9 Registros de presion pozo M-21A
eo 120 60tnIs I I I 20 0 60
~
I ~ bull
00
1 00
1000 I 1 lt0
= i p
500 I
200 0 aso 320 j0OI I I I 80 DO 120 40 160KQtmt
1 1
I
I I
I
11 i -4r Tmiddot
mtt
I
gt0
gt0
00
00
1000
I
I
-=
80 I
20
120 160 aoo 240 280 20 360 I I I I I I OIltotngt40 60 80 ad 120 140
~ P2
_-- shy
~
1 shy~
j
I
REGISTRO FECHA ~~i Ilt (OCi
P-I T-I MeTtO dO 1970 121 1
p2 TmiddotZ AbJi1 Ig75d NoY 1975 4 POlO REGISTRO FEeHA COND I C IIlIlES OE FLUJ 0d
P4T4 Metro de M-13 P-I MAYO J970 LlHEA 6~ ORIFltlO 2 147 0
Gtl 11-5 P-2 ABRIL 1970 LlHEA 6+ ORIFlelO 2 14$
XBL 7811-13152 XBL 7811-13150
Figura 8 Registros de y temperatura Figura 10 Registros de presion pozos M-13 y M-S pozo M-31
304
Asf tambien los registros de presion en el pozo M-8 en 1970 con descarga de 2 120 nos senalan que el pozo extrara agua calien te del yacimiento y posteriormente en 1973~ el registro con flujo a traves de purga shy20 nos indica que el pozo extrae mezcla agua-vapor del yacimiento (Figll)
En la actualidad unicamente los pozos mas alejados de la zona explotada (como por shyejemplo M-53 M-50 M-90 y M-84) extraen agua del yaeimiento como se aprecia en los registros de presion que aunque pudieran ser afectados por la carda de presion aun se llega a extraer mezcla baj6 las condi-shyciones de desearga por purga de 20 (Fig 12) El mas afectado dentro de este grupo (como se aprecia en los registros) que tie ne la evaporaeion de agua mas cercana a l~ zona ranurada es el M-84 quiza por ser el mas eercano a la zona de explotacion Enshylos registros de presion en los pozos M-51 y M-84 efectuados descargando por orifi- shycio de 2 y 30 se aprecia la extraeeion de mezcla agua-vapor del yacimiento (Fig 13) bull
Es conveniente aclarar que la calda de pre sion en la formacion debido a la extracciOn de agua caliente se provoea una evapora-shycion en la vecindad del pozo esto es si shyel punto de equilibrio termodinamico de - shypresion y temperatura estan cercanos en el pozo sin fluir y sera mas la calda de pre sion conforme sea mayor el flujo del pozo~ y la porosidad sea menor en la formacion la eual aumenta la evaporacion del agua en la misma
_ 80
m II 0
00
10 I
41 I
1000
jloo~
shy
1500
tr i
bull-shy120 A 200 240 ~o 320
~I I I I Ilio40 GO ao 100 140
I I I ii i 1~-d=i h I 1 I
1 1
I i L
1 j 1 I I I
r~s I i --lt~ 1---+--1---
PI p
I i
1 j
I 1 I
__ shy
REGISTROS CON POZO FLUYENDO POR LINEA 6jI ORIFICIO 2jI
FECHA ABRIL 1970
REG ISTRO CON POZO FlUYENOO POR LI NEA PURGA 24gt JUN 10 1973
1601ltQbJ
shy
shy
r- shy
REGISTRO P-I
P-2
XBL 7811-13149
Figura 11 Registros de presion pozo M-8
ao 0 160 200 240 290 320 TmlQ I I I I I I Ij 0 40 60 so 100 120 140 160lltotm
MI 50 1
I 1Itmiddot53 MmiddotS4
I~MOO 1
1 I 1
500
ltOIl
1000
raquo
1500
ilf
1
I
1
~~
I I ~ shy
I I 1 tbI
~ i i ~ I i
i
~I I
Ir~ M~
i 1 I ~i 1
[( I
i 0 i i
REG ISTROS DE PRES ION
11lt-8 I i
~
POlO FECHA CONDICIONES DE FLUJO II-SO ABRIL DE 1978 LINEA PURGA DE 2jI VR 11-90 ABRIL DE 1978 LINEA PUR~A DE 2~ VR II-53 HAYO DE 1978 LINEA PUR~A ~E I~ VR 11-84 JUNIO DE 1978 LINEA PURGA DE 14 VR
Figura 12 Registros de presion pozos 11-50 M-90 M-53 y M-84 XBL 7811-13142
p
REGISTRD POlO FECHA P-l 11-90 FEB 1978 P-2 II-51 FEB 197a P-3 II-53 EHE 1975
Figura 13 Registros de presion pozos M-90 M-51 M-53 Y M-84 XBL 7811-13141
COND I C I ONES DE FlUJO LINEA abull ORIFICIO 3 LINEA a ORIFICIO 2igt DOBLE LIHEA 2~
305
En el pozo M-51 no se ha reflejado la cal da de presion como 10 muestran los regis~ tros de 1973 y 1978 (Fig 14) aunque poshydrian estarse afectando unicamente algunos estratos pequenos de su zona de produccion (Fig 15 y 16)
CARACTERISTICAS DE PRODUCCION DE LOS POZOS
Durante el tiempo de produccion de los poshyzos estos se han comportado por 10 general disminuyendo su entalpia y disminuyendo -shylas producciones de vapor y agua tal como se aprecia en la tabla de la Figura 17 la cual se elaboro en base al comportamiento de las curvas de produccion de vapor y agua separados Los pozos en los cuales se - 7 aprecia este comportamiento son M-5 (Fig 18) M-8 (Fig19) M-25 (Fig20) M-30 - shy(Fig 21) M-31 (Fig 22) M-34 (Fig 23) -shyM-35 (Fig 24)
Una ligera variac ion en este comportamienshyto es que en algunos pozos en vez de dis minuir la cantidad de agua esta ha aumen~ tado es decir la disminucion de entalpia ha sido mas considerable que en los pozos anteriores Estos pozos se caracterizan shypor tener al iniciar su produ~cion ental pia bastante elevada como ejemplo tene--shymos los pozos M-21A (Fig25) M-27 (Fig 26) M-45 (Fig29) M-46 (Fig28)
Pozo M6 9 (29) II 31 50 68 19A
100
200
300
400
500
600
700
800
900
1000 C)
1100
1200
1300
~ 1400
1500
1600
1700
1800
1900
2000
2 100
2200
2300
m I
eo I
20
120 160 200 240 2eo 320
I I I I 1 1 40 60 00 100 120 140
3601
IOKgCml
gt0
500
1000
1100
=
1500
PmiddotI Pmiddot2
1
1 l-
I~ r
REGISTRO FECHA CONDICIONES DE FLUJO
P-I Die 1973 LINEA PURGA DE 2~ V R P-2 HARZO 1978 LINEA PURGA DE 2~ VR
XBL 7811-13148 Figura 14 Registros de presion pozo M-51
15A 26 27 14 5 21A 35 13 8 (42
-== - -
- a
= = ii = - -= ~ a ii_ -
= shy - -= = smiddot == - - - - - - - -~ iii ~ - -- - - - -
= ~~~~UC~70N ZONA= RANURADA
XBL 7811-13140 Figura 15 Zonas de produccion de los pozos de Cerro Prieto
306
Pozo M-20 90 101 45 25 (46) 39 30 34 51 130 105 114 84 104 102 53 ~91 __
100
200
300 1
i 400
500 1
600 i
700
800
900
1 000 I
~-1100
== == == ==1200 2
~ = = == ~ a =shy == = 5deg -1300 - - -
~ Is = ~ -- == sect = 55 = S 1400 -== 55= = E == - -1500
ZONA DE -== PRODUCCION == sect
== -1600 = == ~
~ ==I ZONA
1800 = RANURAOA
1900 t sect
5 2 -shy
nOO sect
2200
-2
XBL 7811-13139
Figura 16 Zonas de produccion de los pozos de Cerro Prieto
307
H ENTALPIA KQlem v VAPOR TONHr A_ AGUA SEPARAOA TONHr
Mshy
--~--[
a~
I I~ ~ l~ ~ ~ ~ ~e S hil ts~ ~~ ~~ ~ tl
shy shy shy _il I~ ~ ~- ~ e ~ ~~ e i
f sect~ ~~ ~~ l l h H 340 -I - - 20 -2 0 0 1-32 10
M-5 1-13 V e -I - -a -4 -I - -amp1 54 50 - -12 -5 -4 -IS -I I -a 112
N n a +4 -22 - - 0 -21 II I
I e-7I V 75 - -a -I I 2amp -5 -55 42
142 - -54 -a -40 -2 70 -14 12
N 50a -I 21 e + 2 54 140 III-II 3-73 V 4 -20 a -25 0 I 5a Ie
le2 -54 bull so -a -a --4 -121 3
H 54e -45 -21 e -sa zee
I -14 fI-7 V 71 - 4 -I 5 -24 4 13 +11 +2 - a +2e IU
H 0 - 20 -Ie -2 - -45 2ae III-IIA e-4 V u -52 bull I 2 +13 -a4 28
22 -32 -u -101 - 58 -Ioe 122
N ue 47 -n -5 I +e 0 M-leA 2-5 v ee e -4 - - I - 55
lei -33 +
~T~rmiddot 144
H 50 - - -e -8 420
101-20 e-75 V bullbull -Zi4 -I I -7 - -I -67 bull 188 -71 -52 -e -12 -54 -7 -lee II
H 500 -51 55 -40 -e -172 ne M-2IA e-4 v 100 -10 Ii Ie -I -Uf el
n 25 +44 I +15 +bullbull 151
H 308 +5 - 5 0 +5 5 0 M-25 12-75 V -22 - - -4 - - 41 27
leo -eO - e - 2 -a -112 ee
H I 52e -2 -5 +57 - 75 - - 5 -55 2tS M-2e 1-73 v 2e tl bullbull 7 -12 -e - 5 + 5e 4
sa +3 +5 e +40 bull e - 3 + bullbullbull 205
H 44 - -sa -2 -10 540
101- e- v 55 - -10 - 5 - 25 50
54 +24 bullbull - 1 bull 55
N US 0 -15 a +4 1 ee M-2 5-5 V 14 -D e -e 0 -u e
175 -te 51 - -III -5 12
H 512 -I 0 -2 -4 -a -12 Sao 101-50 12-75 V n -14 - - e -I 4 55 so
221 -al -22 - -I 0 -II 140
H UII +1 +e -14 -10 - -5 2e OiO 101-51 - 75 V ea -4 -e II -a - -2 -58 4
A e5 -e -14 -0 -122 -I a - I I
H 248 0 0 M-34 -n v 23 -2 -e
H-a
A lie -a -ZII
H 54 -4 -5 -2 -25 52 58 3-74 V 120 -14 - 5 -e -10 -4 -50 0
228 -20 -14 -12 -17 - -72 154
H 250 +50 10 -2 +511 2ee 101-4 11- V bullbull - -10 - 54
atO - 44 -e -15 - 175t=t -n H 4e2 - -17 - e4 e v 14 - -4 - 21 24 e -I + 5 28
H 442 -e 5 171 -46 8-77 II sa 0 3e
10 +2 I bullbull
I
bull
I
XBL 7811-13138
Figura 17 Cerro Prieto variac ion durante 1a produccion de los pozos
308
bullbull m I I 4 e I I bullbull 0
10
bull bullbull bull bull bull0 0
XBL 7811-13137
Figura 18 Graficas de produccion pozo M-S
309
1
IIgt ~sectQ -TO 60 -3~O
340 ~--o-
3-20 -~JQ
Igt~o()
jl~O 2_8 270 26fgt 2~~ 0230shy220 2--10shy
f200_ 190(a-o-ITOmiddot 1fiG
14____
12
lO c u
or
CI
o J CI z 111
gtshy() CI z Q
~ Q
t
z 2 o o gt a o a 0
It eshy
XBL 7811-13136
Figura 19 Graficas de producci6n pozo M-8
III
310
ltII(
~ 1-=+++-+ ~ ~~=tttttt1=tt ~
r-=-+-t-+-+-+-Wll-~RfFf r-mm-t+-HiHi+i+H-t+H-t+H-H-++f-t+H-t+-t-H+-HH-t+-H- ~Li ~H+~~++HH++~~~~~H+++Hrttt I---O-t-H-t-+-H-t-H--tl-tII++shy1+-t-H-+1-++++H-+-t-+++-r- [-+-HIHI-+I+H~I++-
dJplusmnplusmn ~2 I 1t-+++-t-+-+-iH-++m+t+t+++-H-H - --- ~
r L omiddot ~ I IIL-L----------~--------J i
XBL 7811-13135
Figura 20 Graficas de producci6n pozo M-25
311
II J
z
DO 80 ~~ 570 380 0 W 00 m aso
11~lIZO ~=-$ro 0-middotaoo
Luo 160 iii= 170 ii~80 250 mR=Fff Zit 140 lao 110I~ ato ~ 110 100 ~~ 1110 I~110 1-1=70 - Inlilt ~rllO
H 14 It II
10 10
bullbull 1- shybull
4
bull a 0 I~
~ ~ aoo r-a-o
1110 140
110
100
180
80 140
110
~~o 0 eo 4Q 10
0
Iii
I I I I I I I
bull -
bullI I I
tttttmI I I
-
~ oW -~gt tici M l -~ I~ c A I~i= l iu AV -~ c 0 iii - -I~Iltf Z 0 2 ZQ 0 ZQ 1973 1974 19711 19741 1977
I
~ -i ~~ ~N -e
z 1
I I~
V PHI
i ~ 0 ~~ ~Z bull 0
1978
540
~~ soo
Q1Ill 40
110
1100 ro lao 40
110
~ 0
fit 40
--Q
0
V 21 o o c () ()
o zc
z ~ o o ) o o ~ II
XBL 7811-13134
Figura 21 Graficas de produccion pozo M-30
312
lIi
a J
Z III
5eo 8ltgt S10 aso 550 40 no S20 alo 500
1100 18ltgt 170 leo no 140 230 no 0 100 180 180 110 leo
U
no
~~I~f ~~~ lao
IS
10
~ ~~~~~1-~~1-~-r+-rt~+shy ~rrr+~~~rrT+~~~rrr+++~~rrt-~~~1 ~+-~4-~4-~~~~+-~4-~~~~~~~~4-~~sect
~ I----++-+-t-t-+-HI-++-I-+OH-t-Hshy ~~~~~~L~~~~~LLLWWW~~~~
540 510
soo a80
allo 0
110 J 00 180
z leo
~ ~~~t=ctJt~~=t~tl=tl=tl~~~~~t~~~~~~tj~~~~~tjtJ~~~~~~t~~~~~~g ~O~deg1-~1-+-~1-+4-+1-rt~+-rt~+-~1-+4-+4-+~-r+-rt~+-~1-~-+1-~-r1-rt~+4-+shy 1+-~~~4-~~~
f ~~~fl~t=~~~=t~~=t1=tl=tl=~=t~=f~~~~~tt~~t1t~~~~~~~~~~~ 10
o
1973 1974 197~ 1978
XBL 7811-13133
Figura 22 Graficas de produccion pozo M-31
313
u
17 80
Iii 140
~
s 10 r 100 i n lit
n 10 0 no 140 0
C I Raolegt Oft bull 110
110 ~ 10010shy ~ 110 j110 riYft rIo r1TO
IUO
~~~~~~~~4-~~~~~~~4-~-+4-~~~~~+1~4-~~-4-~~1~~-r~rt~I~~og
~~~~~~~+-~~~~4-~~+-~~~~+-~~4-~~+-~~~~4-i-1-+4-~~~U4~0 cg ttO O
zz 00 110
z 10 0
140U u 110 Q 100 0 G 0 tIL 80
4~ 40 act I 0 o
19711 974 975 1978 1977 1978
XBL 7811-13132
Figura 23 Gr~ficas de produccion pozo M-34
314
0
shy 0
gtt n
2shyii 180 shyJ 140 gtt
flO O UQZ tl(111
200 - - aoo 190 - voGOshy 80_f7oshy 170
fti~ 0
14
12
gt I~-lii bull z e 2 4i ItIii no
XBL 7811-13131
Figura 24 Graficas de produccion pozo M-3S
315
XBL 7811-13130
Figura 25 Graficas de produccion pozo M-21A
316
iii
i iii I~~+++m~~jtt C(ii 1-4-1--I--l~
J
z
r
z o
~ o
~--II
10
bull m- ttm
f ~~4~~r+-I-~-r~+4~~I-+-+-
I I I I I I I I
I mi-f_1L
- 10
i--shy
fm=m -shyL
JJ I
I I I - IJL
XBL 7811-13129
Figura 26 Graficas de produccion pozo M-27
317
JI_~Q 550 5-40shy
280
c ii I C Z W
8~ ~~_Q570
3S0 -20
r-O 500
11110
270 illo 250 240
rf9210 110 200
r~_o 180
Crro 180
14
r--I 10
bull 8
4
I
0
r-~O ~o
oo 180
~o ~_o
liD
~ ---o ~9 ~ O ---00
80
ltO -shy -Q
---~ III a_e~ z U0-i a_~o _s_ao r SlJ 11 810
15_09 lit
no n 180 1_00 140 lit I~ltgt-_uo 110 100
I_~Ie 170 ~_I
14
~ 10
bull 8
~-I
I 0
S~~ _s~ 11 _uo u
0 _I_~ ltgt _Ll c-shy n 140 n
I_~ 0 z
1_9_9 liD
I 0
I~~ 110 -i
_1_00
10
_f_O 40 -- shy
__ 111
~-
I 7 3 I 1 4 I 1 II I 18 I 9 11 I 918
XBL 7811-13128
Figura 27 Graficas de produccion pozo M-45
I~_~ _II_~
318
so Ull 570 360 560 540
~o 520
r-O ~~ iii) ~o270 260 250 140
~jgtno r~100lee liomiddot fio 160
14 II
10
bull _6
4- shyIt
-0
140 _1I~0
100
u(I
m
l I
t-t~~r+~+-I-+4-+4-+4-~-+-
III
t~
bull
~ -tmiddota~~ 5tO 140iaQ 1I~l
3~~ 1-t-It~I- 89Ishy 110
169
~ I~O nQ
bull III 100
to 811 170 )
-I-~I-JL _-tlL
bullbull 4 It - 0
C
II - 4 Z 1amp1
XBL 7811-13127
Figura 28 Graficas de produccion pozo M-46
Este mismo comportamiento se aprecia en shylos pozos M-14 (Fig29) r M-26 (Fig30) en los cuales se presento una aportacion shydel yacimiento en estratos superiores deshybido a roturas de tuberias 10 cual fue causa de un incremento en el porcentaje de agua extralda
La r la general de comportamiento de disshyminuc de entalpia en los pozos est~ s~
jeta a ciertas excepciones claramente def nidas como son por ejempl0 los pozos M-ll M-19 Y M-20 en los cuales se presenta un aumento de entalpia El pozo M-ll (Fig 31) entro a producir inicialmente con dos zonas abiertas una inferior (1138-1211 m) y otra superior (872-964 m) causa por la cual el pozo se incrusto idamente Se procedio a limpiarlo y obturar la zona sushyperior ademas de una rotura de tuberia en contrada a 750 m Esta operacion se efec=shy
tuo introduciendo tuberia de produccion de 5O con 10 cual el pozo qued6 produciendo de la zona inferior y aunque su producci6n fue menor se incremento su entalpia
El pozo M-19A (Fig 32) inicio su producshycion teniendo obturado con cemento 200 m de la parte inferior de la tuberia ranurashyda a los cinco meses de produccion extra jo dicho cemento aumentardo su produccion de vapor y su ental pia
El pozo M-2~ (Fig 33) despues de 4 anos de produccion e ir disminuyendo lentamente su entalpia y gasto de vapor disminuya bitamente la produccian de vapor y en ma-shyyor proporcion el agua por 10 tanto au-shymenta su entalpia Esto se debia probab mente a la incrustacian rovocada por la entrada de colgadas a
flujo a 850 m l
tr s de las tuberias
319
x
- It~~ml=l+t=p tt+tt+t+II
C II J C ~~ttI~=tHt
14 I II I I
~ 4
-i
~
I
I I I
m ffi I
I I I
1ampmiddotI lIE
tit I i
14 II
10
bull
III 540 5Z0
11 1500 u 10
0 0
~LU c - - n 40 n tto 0
L~ z
I O
XBL 7811-13126
Figura 29 Graficas de produccion pozo M-14
320
C II ~-iH-++shyI c ~ z
~
Z 0 U U ) Q 0 II II
10 leo 140
110 lOCI 10 10
XBL 7811-13125
Figura 30 Graficas de produccion pozo M-26
0
321
14
~lII 10
bullbull bull 4 4 1 It
0 149 ~_O
aoo~ ~al 140
110 ~ ao z lao 0 140U U ItO )
10lt1Q 0 100 II
XBL 7811-13124
Figura 31 Graficas de produccion pozo M-ll
322
1 ~ ~ if
0 IlI80 la70 IlIlIO
14 It 10
bullbull 4 I
0
~~
~ III 110 j
0 bull ao
I I I I I
I I I I 40 ~ Hoi
1100
110
bullbull0
XBL 7811-13123
Figura 32 Graficas de produccion pozo Jgt1-19A
323
C
L I C ~~4ttttttttttttt=1=t=
I ~ ~~t~rt~~~~~ U g Q o II L
to -I -t-r+rt-r+-ri-t+-~-t-t-rr-r+-rIClO
~~~plusmnplusmn=tti-rt1~t-rti-rt-rti-ri=~ _0 40
XBL 7811-13122
Figura 33 Graficas de produccion pozo M-20
D~ntro de los pozos en explotacion tene-shymos algunos que han dec1inado rapidamente su produccion encontrandose en estos inshycrustada la tuberfa de produccion aparenshytemente por invasion de agua de menor temshyperatura Estos pozos son el M-ll (Fig 31) M-9 (Fig 34) M-15A (Fig35) M-39 (Fig 36) el M-29 (Fig 37) antes de reshyperforarlo
OBSERVACIONES GENERALES
Durante la perforacion de pozos geotermi-shycos es muy probable que se tengan mayores y mas frecuentes perdidas de lodos de cirshyculacion siendo estas de mayor proporcion conforme se acerque a la zona mas explotashyda asimismo sera necesario un mayor do durante las cementaciones de las tube-shyrfas debido a la cafda de presion del ya~
cimiento ya que las columnas hidrostaticas que pueda soportar estas seran menores
Dnrante la induccion de pozos sera necesa rio equipo de mayor capacidad ya que la ~ profundidad de los niveles de agua seran mayores esto es cuanto mas cerca ~ste el pozo de la zona explotada mayor sera la pro fundidad de los niveles de equilibrio del shyagua del pozo sin fluir
La correlacion de datos qulmicos para de-shyterrninacion de entalpia deberan ser toma-shydos con reservas ya que no todos los pozos extraen agua del yacimiento sino rnezcla y no sera valida en aquellos pozos en don~ la entalpia sea alta 0 sea es preferente el flujo de vapor al del agua en el yaci-shymiento ya que ademas puede haber un equishylibrio en la fase llquida con depositacion de sales por evaporacion de agua por disshy
324
a40 ao aoo 0 eo 1140
aao
aoo
Ishy lao z leo S ~E tl-ip A 0 0 140 140U ItoU )
100a 0 0II L eo
6 ao
0
XBL 7811~13121
Figura 34 Graficas de produccion pozo M-9
325
CI ltC
~ II Iil 0
z ~
z 2 u u ~ 0 0 0 II
4 II 0
14
_10
bull 4
II
a~ ~_O
aoo no
~ i ~ 1gt
~ ~
XBL 7811-13120
Figura 35 Graficas de produccion pozo M-15A
326
01180 a 1117shy110 ~8 r- z
0 -t II S40 140 ~ ISO ~ ~- II 100
un II 0 no It
It170 noDC 110
1110ii no oJ 140 ri40 CrtTC 110 110 ~ 110 ~
100 180 ~~ 10 shy
170 17shy110
l~ 14 1 ~
10 10 iabull 4 bull et1j[tttijjj~plusmnlJJ~tplusmni~~~tplusmnplusmnplusmnjjtttplusmnij=tttplusmnplusmnjj~~~~~tttj~~tt~~t+~~~++~~~I ~ i~OLLUU~~LLUU~~LLLU~~LLLUUU~~LLLU~~LLLU~~~LLLU~~LLLL~~
140 110
I 110
Ia
0 g c n140 140 n
110 0110 Z ~ 100 100
110 110 Z 180 110 o 140 140
-t110~ ~11~O~~~~~~~~~~~~~middot4-~~~~~+-~~~-+~~~+-~~r~~~-+4-~~+-~~~~~~-+~~~4-~~+-~~ 1001~O~O~~4-~Lf4-~~4-~~~~~~rF4-~~+-~4-~-+4-~~~~~I~Lf4-~~4-~~~~4-~Lf4-~-+4-~-++-~-f~ Z10~ ~~0~~~~-+4-~~4-~~~-+~~~~~~+-~~~-+~~~~~~~-+~+4~4-~~~~~~-+~~-+4-~~+-~-+~ 40~ ~~~oct=tt~~=t~t4~~I-i=tijtt=ttj~~ti=tttt=ttj=tjti=tjjti=tjj~jttj=tj=tt=tijti=tij=tjtj=tj=ti=ti=tt=t~
~-~ ~ 10 0--~ V~~OF 1~dI~~~~~amprt~~~~hh~~~~~~~bh~~~~~
bull c =l cl U - DII -I =1 -p c Ij~ ~ ~ i -~ i -~Il ~ ~ ~ gli I cl 11r c i g bull D 051 fHjlU ~I IH ~ t ~ Ii 1 Ii g
XBL 7811-13119
Figura 36 Graficas de produccion pozo M-39
327
or shy or
ltII
II I ltII III III
shy III
I o
o CI II
IIH ~io 370 3--0 350 3middot~9 ~~O 320
41deg300 299 280
--o --l0 250
f 220
~ ZOO 1amp0middot 180middot 170 180
14 I
10
bull 8
~ bull
~l9 4 CO ~o
C 140
p1 too
~C 80
J~O Ito
~o_ _10
_10 _40 _~1 I
r~ ~~ ~iC
bullm FF ~
S E PU -=mi
i
IGU
I bull i shy -1 I
~~ ~iIl=lg~ ~I~~r~~f I
c I~ ~ 1~Ig~ c tco
173 1974 19715
m
shy
OIV
iiiPOZ ~tlr
I
tbt I
I~middotI ~ll ~~Ilili~ill~ II c ~IZCIW jl-a ~ II~ al~ i oi
1t7e 77
M I(~II
c~t1w S~2 II~ ~ 0 i~ 15178
~UII
~ ~sjo
i~ lIr9 110
~~ 11119
mmiddot 0 I~O 140
~etO aoo 1Ji 109u 14
II
-LshybullL 4 II
0
$~ Iro
1100
1M IU
0
HJ L~
I~140
110
~
t-I -~~
4 _19
I-I
o o c () ()
z
minucion de la presion
XBL 7811-13118
Figura 37 Graficas de produccion pozo M-29
en el yacimiento - shy(Fig38) Por 10 tanto las correlaciones e 1ndices NaK Si Na-K-Ca no coinciden shycon las entalpias medidas
La disminucion de produccion qe vapor de shylos pozos puede ser debido ei parte a la calda de presion de los estratos explota-shydos p~r ser menor la capacidad de aportashycion del yacimiento respecto al fluido ex traldo
La disminucion de entalpia de los pozos - shypuede ser a 1a aportacion de estratos sup~ rio res 0 inferiores de las explotadas de shymenor temperatura y por la ca1da de pre-shysion de los estratos permite su aportacion
La vida util de las tuberlas de produccion se vera acortada debido a que la corrosion y temperatura reducen su capacidad al colaE so 0 rotura que aunado a la caida de preshy
sian dentro del pozo p~r efecto de caida shyde presion del yacimiento se obtienen dishyferenciales de presion entre el interior shydel pozo y los estratos no explotados que trataran de romper dichas tuber1as Aforshytunadamente estos problemas seran princishypalmente en la parte profunda delmiddotpozo
Estos problemas seran menores en los nue-shyvos pozos ya que actualmente se lleva a cabo un programa de instalacion de tube--shyrlas de mayor capacidad a la rotura 0 co-shylapso
Como se ha observado en el comportamiento de los pozos en observacion y explotacion estos estan llegando a un equilibrio en shyel cual las variaciones de nivel produc-shycion y entalpia ya no sufren grandes varia ciones como en el inicio de la explotaci6n del campo len el inicio de produccion del pozo)
328
POZO ENTALPIA MAXIMA
ENTALPIA INICIAL
ENTALPIA ACTUAL
REGISTRO DE FONDO
ENTALPIA TMAX degC
M-5 341 340 308 303 287 M-8 432 336 311 312 293 M-11 342 306 340 308 290 M-14 346 346 288 321 300 M-15A 310 310 265 326 304 M-19A 376 295 310 333 309 M-20 420 310 420 306 289 I M-21A 510 500 328 337 312 M-25 318 305 310 319 300
M-26 380 328 295 323 301 M-27 I 447 447 340 326 304 M-29 286 285 286 290 272 M-30 350 312 300 308 290 M-31 355 338 310 311 292 M-34 255 245 245 337 312 M-35 344 344 321 305 328 M-42 294 250 288 316 296 M-45 452 452 388 342 315 M-46 442 442 373 333 309 M-53 398 398 374 548 342
XBL 7811-13147
Figure 38 Cerro Prieto variacion de enta1pfa (kca1kg) en pozos en produccion
Como se ha mencionado anteriormente los p~
zos tienden a estabi1izarse en sus caracte rlsticas de produccion asl como tambien en los nive1es de los pozos de observacion Doy las gracias a las autoridades de CFE 10 cua1 nos indicarla que el area esta 1 por la invitacion para participar en este gando a un equi1ibrio entre el flujo ext Simposio 10 cua1 es una somera interpret~
do y el aportado por el area circundante cion de los datos de campo asimismo agrashydezco la cooperacion de los Ingenieros de
Los cambios de condiciones de produccion - la Superintendencia de Produccion que sin seran menores conforme localicen los pozos 1a ayuda de ellos no hubiese sido posib1e de produccion a mayor distancia uno de otro la elaboracion del presente trabajo para no sobreexplotar una area reducida La sobreexplotacion provocara mayor cada de preSion en una ~rea confinada 10 que a su vez provocarfa infiltraciones de capas superiores 0 inferiores de menor temperat~ BIBLIOGRAFIA ra
1) Bermejo M FJ Interpretacion de reshyLas cadas de presion tambien seran meno-shy gistros temperatura y presion en po res conforme se lleve a cabo una reinyec-shy zos del campo geotermico Primera ~ cion del agua extrafda al yacimiento Reunion de Intercambio Tecnico San
Felipe BC (1977) Como se ha podido apreciar en el presente trabajo los cambios fsicos y termodinami 2) Bermejo M FJ Primer Curso sobre - shycos detectados son normales y producidos - Geotermia Mexicali BC (1976) principalmente por una sobreexp10tacion shyde una area reducida y no por una dec1inashy 3) Dominguez AB Bermejo M FJ Metoshycion por falta de capacidad del campo geoshy do actual para la apertura e inicio termico Estas variaciones son detectadas de explotacion de pozos en el campo en la mayorfa de los campos geotermicos en geotermico de Cerro Prieto Proc el mundo y no es una particularidad del - shy Second UN Symp Develop and Use shycampo geotermico de Cerro Prieto Geoth Resour pp 1619-1628 (1976)
329
4) Domin~uez AB Vital BF Repara-shy geotermico de Cerro Prieto Archivo cion y Control de Pozos Geotermicos CFE Coordinadora CP Dpto de en Cerro Prieto BC Second UN Produccion Symp Develop and Use Geoth Resour pp 1483-1495 (1976) 6) Navarro FJ EsquerCA Castillo B
F Reportes mediciones agua y vashy5) Cota TJ Castillo BF De la Cruz por de pozos geotermicos de Cerro - shy
F Reportes registros de presion y Prieto BC Archivo CFE Coordi temperatura de los pozos del campo - nadora CP Dpto de Produccion -
PHYSICAL AND THERMODYNAMIC CHANGES OBSERVED IN THE CERRO PRIETO GEOTHERMAL RESERVOIR
In April 1973 the Comisi~n Federal de Electricidad (CFE) began electric power generation at the Cerro Prieto geothermal plant using two turbines coupled to 375-MW generators requiring 730 tonhr of steam
The turbine uses steam from geothermal wells which extrct from the reservoir a water-steam mixture whose proportions vary from well to well At the surface the steam is eparated from the water by means of Webre centrifugal separators and conducted to the generating plant through different diameter pipes The steam flow is measured using orifices installed in these pipes (Figure 1) the water resulting from the centri shyfugal separation is led into a vertical silencer which discharges the water into a channel equipped with a weir to measure the water flow rate From 13 to 17 wells have been used to produced the steam necessary for the operation of the turbines
The full 75 MW were not produced when power generation began in April 1973 but was achieved gradually as wells were integrated into the system A power generating capacity of 75 MW was reached in February 1974 As can be seen in Figure 2 the rate of mixture extraction was rather low during the first few months and increased as more wells went into production
Physical and thermodynamic changes have occurred in the reservoir due to the extraction of the water-steam mixture These changes can also be detected in observation wells located in difshyferent parts of the geothermal field In these wells the drop in water levels has been observed reflecting the pressure reduction in the producing reservoir
In well M-6 (Figure 2) the water level fell 41 m between January 1973 and June 1978 in well M-46 it fell 534 m between March 1974 and March 1976 in well M-42 23 m between March 1974 and May 1976 in well M-29 14 m between May and December 1974 and in well M-38 46 m from March to August 1974 As shown in Figure 2 the water levels in all the wells fell rapidly during the first years of field exploitation but presently
the rate of drawdown has abated and the water level seems to be stabilizing
The production rate of the water-steam mixture from the wells (Figure 2) is now close to 2800 tonhr (total extraction to date is about 120000000 tons) creating a decrease in reservoir pressure which has caused the water in the strata to boil Therefore after the beginning of proshyduction in April 1973 most of the wells extracted a water-steam mixture from the reservoir even through reduced diameters This is indicated by the downhole logs taken in wells M-2lA M-27 M-14 M-45 and M-46 (Figure 4) The logs show there are no similarities in the bottom-hole pressures measured at the same depth This might be because of its position relative to the area under exploitation (Figure 3) and to the date the logs were run
The decrease in pressure in the producing reservoir is documented by a series of pressure logs taken in one well These logs indicate a drop in reservoir pressure since the field has been under production
The pressure logs of well M-25 with fluids flowing through a 2-in-diam regulated valve purger show a decrease of 248 kgcm2 in the bottom-hole pressure (Logs were taken from May 1973 to March 1976) Logs P-6 to P-IO obtained from November 1974 to May 1977 when the discharge was through a 3-in-diam orifice show a decrease of 223 kgcm2 in the bottom pressure In addishytion under these flow conditions the well produces a water-steam mixture from the reservoir (Figure 5)
The temperature and pressure logs (P-l and P-4) obtained for well M-30 (when it flowed through a 2-in-diam regulated valve from November 1973 to March 1976) showed a total presshysure drop of 130 kgcm2 and a temperature reducshytion of 90 C Likewise the logs measured in P-5 to P-7 from December 1974 to March 1976 with a 3-in-diam discharge showed a total pressure drop of 55 kgcm2 (Figure 6)
The pressure and temperature logs of well M-3l show a pressure reduction of 422 kgcm2 and a temperature drop of 15 0 C The logs were taken from July 1973 to November 1975 with the flow through a 2-in-diam regulated valve purger Furthermore in 1973 the well extracted water and in 1975 a water-steam mixture (Figure 7)
In the pressure and temperature logs taken from the same well from March 1970 to March 1976 and while flow was through a 3-in-diam orifice decreases of 233 kgcm2 in bottom-hole pressure and 2loC in temperature of the produced fluids were observed In 1970 this well produced water from the reservoir but later produced a watershysteam mixture (Figure 8)
The pressure logs of well M-21A taken while the well discharged through a 3-in-diam orifice (from April 1975 to May 1977) show a bottom-hole pressure reduction of 45 kgcm2 (Figure 9)
In 1970 before exploitation of the geothermal field had begun there were wells that had similar bottom-hole pressures and extracted hot water from the reservoir as shown in the logs of wells M-13 and M-5 taken when the flow was through a 2 12shyin-diam orifice (Figure 10)
Likewise the pressure logs in well M-8 (with a 2 12-in-diam discharge) show that in 1970 the well produced hot water from the reservoir In 1973 while discharging through a 2-in-diam purger the logs indicated that the well extracted a water-steam mixture from the reservoir (Figure 11)
Presently only the wells that are farthest away from the production area (for example M-53 M-50 M-90 and M-84) extract water from the resershyvoir This can be seen in the pressure logs Although the wells might be affected by the presshysure drop they have not yet extracted the steamshywater mixture when discharging through a 2-inshydiam purger (Figure 12) The most affect well within this group (see ) with water boiling closest to the slotted is M-84--perhaps because it is the nearest to the production area The pressure logs of wells M-5l and M-84 show that when flowed through 2- and 3-in-diam orifices respectively a water-steam mixture 1S produced from the reservoir (Figure 13)
The pressure drop in the formation due to water production brings about boiling near the well provided that under nonflowing conditions the well is near the thermodynamic equilibrium point of pressure and temperature The drop in pressure will increase as the flow becomes greater and the formation porosity decreases thus in-
the boiling in the formation
The pressure drop is not reflected in well M-5l as the 1973 and 1978 pressure logs show (Figure 14) Nevertheless some minor strata in its production zone might be affected (Figures 15 and 16)
WELL PRODUCTION CHARACTERISTICS
During the time the wells were under producshy~ion there has generally been a decrease in
enthalpy and a reduction in water and steam output as shown in 17 which was based on the production curves of separated steam and water The wells that show this decrease are M-5 (Figure 18) M-8 (Figure 19) M-25 20) M-30 (Figure 21) M-31 (Figure 22) M-34 (Figure 23) and M-35 (Figure 24)
In some wells there is a slight variation with respect to the mentioned behavior In them the amount of water has diminished instead of increased Therefore the enthalpy reduction has been larger than in the other wells These wells have rather high enthalpy at the beginning of production for example M-21A (Figure 25) M-27 (Figure 26) M-45 (Figure 29) and M-46 (Figure 28)
This same behavior is evident in wells M-14 (Figure 29) and M-26 (Figure 30) where an inflow from the reservoir in the upper layers occurred through fractures in the casing causing an increase in the percentage of produced water
The general rule of behavior regarding enthalpy reduction in the wells is subject to certain blearly defined exceptions--for instance wells M-ll M-19 and M-20 where an increase in enthalpy is observed Well M-ll (Figure 31) initially produced from two open zones--a lower one (1138-1211 m) and an upper one (872-964 m) This caused rapid scaling of the well The well was cleaned the upper zone was plugged in and a break in the casing at 750 m was repaired This operation was performed by installing a 5-in-diam production casing as a result of which the well continued producing from the lower area Even though the production decreased the enthalpy was increased
Well M-19A (Figure 32) began production with 200 m of the lower section of the slotted casing plugged with cement Five months after the cement was removed the wells steam production and enthalpy were 1
After four years of production and a gradual decrease of enthalpy and steam output well M-20 (Figure 33) suddenly showed a reduction in steam and (to a greater extent) water production resulting in an enthalpy increase This was probably caused by scaling brought about by the inflow through the casing hanging at 850 m l
Among the production wells some have shown a rapid output reduction In these wells scaling in the production was found apparently caused by the invasion lower-temperature water These wells are M-ll 31) M-9 (Figure 34) M-15A (Figure 35) M-39 36) and M-29 (Figure 37) before it was re-drilled l
GENERAL OBSERVATIONS
During drilling of geothermal wells loss of mue circulation is common This generally increases as wells get closer to the most exploited zone Due to the pressure drop in the reservoir it will be necessary to cement the casing with great care since the hydrostatic columns they can withstand will be decrease During the well inducshytion the use of equipment with higher capacity
331
will be necessary since the water level will be deeper depending on the wells proximity to the production area In a nonflowing well the closer the well is to the production area the deeper the static water level will be
The correlation of chemical data to determine enthalpy must be analyzed with caution since not all wells extract water from the reservoir Some wells extract a steam-water mixture so that this correlation will not be valid in those wells where enthalpy is high In other words in the reservoir the steam flow occurs more readily than water flow In addition there might be an equilibrium in the liquid phase with salt deposits due to boiling as a result of a reduction in reservoir pressure (Figure 38) Therefore the correlations and the Na-K-Si and Na-K-Ca indices do not agree with the measured enthalpies
The decrease in steam production might be due in part to the pressure drop in the exploited strata because of lower reservoir fluid production capacity
The enthalpy decrease in the wells could be partly due to the inflow from colder upper or lower strata that are not directly exploited This inflow is possible because of the pressure drop in the producing reservoirs
The life span of the production casings will be shortened because corrosion and high temperature reduce their resistance to collapse and fracture This and the reduction in pressure within the well (due to the drop in reservoir pressure) cause pressure differences between the inside of the well and the nonexploited strata and tend to break the casings Fortunately this will happen mainly in the deeper part of the well
These problems will be reduced in the new wells since a program has been impleshymented to install with higher capacity to withstand fracture and collapse
As the behavior of observation and production wells has shown they are reaching equilibrium When the wells start producing the variations in water level production rate and enthalpy are not as great as they were at the beginning of field exploitation
As already mentioned the production wells tend to stabilize their output characteristics Likewise the water levels stabilize in the obsershyvation wells This would indicate that the area is reaching an equilibrium between the fluid proshyduced and the recharge from the surrounding area
Changes in production conditions will be smaller as wells are drilled at greater distances from each other Over-exploitation in a small area would otherwise occur resulting in large pressure reduction and promoting infiltrations from colder upper or lower strata The pressure drop will also be smaller if the water produced from the is reinjected
SUMMARY
In this paper we have shown that the physical and thermodynamic changes detected are normal and are mainly the result of an over-exploitation of a reduced area and not due to a decline in the capashycity of the geothermal field These variations are found in most geothermal fields throughout the world and are not a peculiarity of the Cerro Prieto system
ACKNOWLEDGMENTS
We wish to thank the authorities of CFE for their kind invitation to participate in this symposium and present our interpretation of the field data We also wish to thank the engineers of the CFE production department for their coopershyation Without their help we would not have been able to prepare this paper
FIGURE CAPTIONS
Figure 1 Typical surface installations at a Cerro Prieto geothermal well
Figure 2 Production of steam-brine mixture and water level changes in observation wells at Cerro Prieto
Figure 3 Location of wells in the Cerro Prieto geothermal field
Figure 4 Downhole pressure logs wells M-2lA M-27 M-14 M-45 and M-46
Figure 5 Downhole pressure logs well M-25
Figure 6 Downhole pressure and temperature logs well M-30
7 Downhole pressure and temperature logs well M-31
8 Downhole pressure and temperature logs well M-3l
9 Downhole pressure logs well M-2IA
Figure 10 Downhole pressure logs wells M-13 and M-5
Figure 11 Downhole pressure logs well ~-8
Figure 12 Downhole pressure logs wells M-50 M-90 M-53 and M-84
Figure 13 Downhole pressure logs wells M-90 M-51 M-53 and M-84
14 Downhole pressure logs well M-51
Figure 15 Producing intervals Cerro Prieto wells
Figure 16 Producing intervals Cerro Prieto wells
332
Figure 17 Changes observed during production Figure 29 Production history well M-14
Figure 18 Production history well M-5 Figure 30 Production history well M-26
Figure 19 Production history well M-8 Figure 3l Production history well M-1l
Figure 20 Production history well M-25 Figure 32 Production history well M-19A
Figure 2l Production history well M-30 Figure 33 Production history well M-20
Figure 22 Production history well M-31 Figure 34 Production history well M-9
Figure 23 Production history well M-34 Figure 35 Production history well M-15A
Figure 24 Production history well M-35 Figure 36 Production history well M-39
Figure 25 Production history well M-2lA Figure 37 Production history well M-29
Figure 26 Production history well M-27 Figure 38 Enthalpy variations (kcalkg) in Cerro Prieto production wells
Figure 27 Production history well M-45
Figure 28 Production history well M-46
301
20 u-2 1 I
I
shy U-2 - U-2 -I -2 -I I AI II I~~ T R IA~ 1shy r+i 1raquoshy
~ gt0shy I I J_
110shy MEZCLA AWAIVJPOR I ~IO()- 2
k 17 fT jPfpt ESL (TONH) I
00shy 11-46 II II If rI
0ltgtshy l L k I roshy t 2 n II Ii IJ -r ~ II li 1 I I( I~
~IO- ~2
I
111000shy ~ IV fJ 3ltgtshy shy ~ IV
co 0shy ct
11-6
~ 0shy ~ iV
~o- ~I ~ 0shy ~ -shy i 10 11-29 -
t
~3ltgt- t t lt0shy
~ II
-IOshy ~ I~ 1 11-42 ~ bullr- 0shy
l iI - shy --00shy t 11-38- -100shy
1 20
Ii -0shy ~- r
i-3ltgtshy
l
eo -ISOshy
bWmN1I ~ o~ EnI F raquot nJul 0cI Nor Ole ftklIAgD J JI DlcEIIIlb ~ Julsp r -JulAvo I 9 7 3 19 7 4 I 9 7 5 I 9 7 6 I 9 7 7 I 9 7 8
XBL 7811-13146
Figura 2 Cerro Prieto produccion de mezc1a vapor-agua y variacion del nive1 de agua en pozos de observacion
80 120 60 200 20 280 320 3600Cm I I I I I I I I
20 0 60 80 00 120 140 160KcentTl
~ Mmiddot21
10 shy 1 ~1 ~ l
500
1 f000
1 1 1 100
1 f 1
1000
1100
1 ~M45 ~271 14-14 _ Mshy IA
14-46 1
10
1500
M-bull M-7
bull
14-53bull M-130bull
14-11 14-104
14-38 104010 bull 14-43
M13 reg 104-39 bull M-ISA 14-14middot PLANTA
bull M-5 bull M-15A ~ GEOTERM)ELECTRICA 14-25+ 1420 C ~flI H02
14middot29 bull 14-26 bull M-ZIA
M-9 reg 14-30 14-27 bull
bull bull 14-31 +14-8
14-34+ bull 14-103 M-35
bull14-84 bull 14-45
14-48bull14-181 bullbull
14-105 14-91bull M bullbull
POZO EN OBSERVACION pozo FECHA CONDICIONES DE F LUJO
POZO PROOUCTOR
bull POlO pERFORADO
m 1
14-90bull
140101bull XBL 7811-13145
M-21 A M-27 M-14 M-45 M-46
AGOSTO 1974 ABRI L 1976 JULIO 1976 JULIO 1977 AGOSTO 1977
LINEA PUAGA 1ltgt VA LINEA PUAGA ltgt VA_ LINEA PUAGA yltgt VA LINEA PUAGA ltgt VA LINEA PUAGA ltgt VA
XBL 7811-13154
Figura 3 Distribucion de pozos mica de Cerro Prieto
en e1 campo geotershy Figura 4 Registros de presion M-14 M-4S y M-46
pozos M-21A M-27
302
La disminucion de preS10n del yacimiento shyexp10tado es tambien comprobado a traves de una serie de registros de presion efec tuados en un mismo pozo indicativos de 1a disminucion de la presion del yacimiento shycon respecto al tiempo que lleva en exploshytacion e1 campo
En los registros de presion del pozo M-25 f1uyendo por purga de 20 VR efectuados de mayo de 1973 a marzo de 1976 se apre-shycia una disminuci6n de presi6n de fondo de 248 Kgcm 2 bull En los registros P-6 a1 P-10 descargando e1 pozo por orificio de 30 efectuados de noviembre de 1974 a mayo de 1977 se observa una disminuci6n de pre-shysion de fonda de 223 Kgcm 2 ademas que bajo estas condiciones de f1ujo e1 pozo ex trae mezc1a agua-vapor del yacimiento (Fig 5) bull
En los registros de presion y temperatura efectuados en e1 pozo M-30 fluyendo este por purga de 20 VR 11evados a cabo de noviembre de 1973 a marzo de 1976 corresshypondientes a los registros P-1 a P-4 se shyaprecia una disminucion total de presion shyde 130 Kgcm2 y 9degc de temperatura asi- shymismo en los registros efectuados con desshycarga de 30 11evados a cabo de diciembre de 1974 a marzo de 1976 del P-5 a P-7 se observa una carda de presion total de 55 Kgcm 2 (Fig 6)
80 280m I I
5001-+-t--1rtt-t +--+~_+--+_+-_+-_L-+
IOOCI-+---+-+ttC+t-+
150()
REG I STROS CON pozo FLOYENOO POR LlHEA PURGA Z$ V R
REG I SIRO FrCHA AP (~glcm l ) P- HAVO 1973
360ltt
I 160Kcentm
P-I NOV 1973 18 P-3 NOV 1l7~ 1~2 P-~ OCT 1975 l~ P-5 HARZO 1976 5~
lIP bull 2~8T REGISTROS CON POZO FLUYENOO POR LINEA 6 OROFICIO 3~ P-6 HOV 197~ P-7 KAYO 1975 98 P-8 OCT 1975 67 P- KARZO 1976 31 P-IO KAYO 1977
lIP27
bull 223 XBL 7811-13144 T
Figura 5 Registros de presion pozo M-25
trtt-middot
olt
1000
1100
shy1500
eo 120 160 200 240 280 320
I I I I I I I 20 40 60 eo 100 12O 140
1 T-
l
~ ~ ~ ~ -r-JFf~
1 ~ l I
i ~~ ~~ ~
~ ~
~ ~ _T_
i T-I
~~ -il middot6 middot3
REGISTROS CON POZO FLUYENDO POR LINEA PURGA 2+ vR
REGI SIRO FECIIA LIP (kgcm2) AT (Oe) P-I NOV 1973
~
~
i
--- shy
P-2 T-I NOV 1974 75 P-bull T-2 NOV 1975 34 80 p-4 T-3 KARZO 1976 21 10
APTmiddot 130 ATT bull 90
REGISTROS CON POZO FLUYENDO POR LINEA 6$ ORIFICIO 3$
P-5 DIC 197~ P-6 NOV 1975 P-7 MARZO 1976
XBL 7811-13143
Figura 6 Registros de presion y temperatura pozo M-30
En los registros de presion y temperatura del pozo M-31 efectuados de julio de 1973 a noviembre de 1975 con f1ujo a traves de purga de 20 VR se aprecia una baja de presion de 422 Kgcm 2 y 15degC de temperatu ra observandose ademas que e1 pozo ext rae agua en 1973 y en 1975 extrae mezcla aguashyvapor (Fig 7)
En los registros de presion y temperatura en este mismopozo con descarga a traves de orificio de 30 efectuados de marzo de 1970 a marzo de 1976 se aprecia una caida de presion de fondo de 233 Kgcm2 y 21degC en el flujo extraido observandose tambien que en 1970 e1 pozo extraia agua del yacishymiento y posteriormente extrajo mezc1a agua vapor (Fig 8)
En los registros de presion efectuados en el pozo M-2lA con descarga por orificio shyde 30 se aprecia una disminuci6n de preshysion de fondo de 45 Kgcm2 en abri1 de 1975 a mayo de 1977 (Fig 9)
En 1970 antes de 1a explotacion del campo geotermico existan pozos en los cuales shyera semejante 1a presion de fondo y ademas extra fan agua caliente del yacimiento coshymo 10 muestran los registros efectuados en Vos pozos M-13 y M-5 por f1ujo a traves shy
oe orificio de 2 120 (Fig 10)
303
POlO fluyenltfo por purgo
REGlSTRO FECHA
PmiddotI T-I JvliO de f913
P-Z T-a AbrIl 1975 T-gt No d 1975
2 V R
GP (Kqknf I toT( degC I
400 22
~Pl 4~ ~
gt20 I
40
---1-shy-- shy
-j shy
so 20 60 aoo gt40 8O 320 jCml I I I I I I I 0 40 60 80 DO 120 140 60
_shy r-~ _shy
1shy - - shy I- shy
000 --- shy
_-shy - ~- I
-- _-shy -- shy shy
- shy - ___ - shy
_r--shy - _ _-shy - -- shy -- shy
1000 - shy - shy shy ~
I
3 I
middot2
REGISTlIOS CON POlO FLUYENOO POR LINEA 6$ bull ORIFltlO 3$
REGISTRO FECHA 6P(kgc2j P-l ABRIL 1975 P-2 HOV 1975 30 P-3 KAYO 1977 15
6PT - ~5
XBL 7811-13153 XBL 7811-13151
Figura 7 Registros de presion y temperatura pozo M-31 Figura 9 Registros de presion pozo M-21A
eo 120 60tnIs I I I 20 0 60
~
I ~ bull
00
1 00
1000 I 1 lt0
= i p
500 I
200 0 aso 320 j0OI I I I 80 DO 120 40 160KQtmt
1 1
I
I I
I
11 i -4r Tmiddot
mtt
I
gt0
gt0
00
00
1000
I
I
-=
80 I
20
120 160 aoo 240 280 20 360 I I I I I I OIltotngt40 60 80 ad 120 140
~ P2
_-- shy
~
1 shy~
j
I
REGISTRO FECHA ~~i Ilt (OCi
P-I T-I MeTtO dO 1970 121 1
p2 TmiddotZ AbJi1 Ig75d NoY 1975 4 POlO REGISTRO FEeHA COND I C IIlIlES OE FLUJ 0d
P4T4 Metro de M-13 P-I MAYO J970 LlHEA 6~ ORIFltlO 2 147 0
Gtl 11-5 P-2 ABRIL 1970 LlHEA 6+ ORIFlelO 2 14$
XBL 7811-13152 XBL 7811-13150
Figura 8 Registros de y temperatura Figura 10 Registros de presion pozos M-13 y M-S pozo M-31
304
Asf tambien los registros de presion en el pozo M-8 en 1970 con descarga de 2 120 nos senalan que el pozo extrara agua calien te del yacimiento y posteriormente en 1973~ el registro con flujo a traves de purga shy20 nos indica que el pozo extrae mezcla agua-vapor del yacimiento (Figll)
En la actualidad unicamente los pozos mas alejados de la zona explotada (como por shyejemplo M-53 M-50 M-90 y M-84) extraen agua del yaeimiento como se aprecia en los registros de presion que aunque pudieran ser afectados por la carda de presion aun se llega a extraer mezcla baj6 las condi-shyciones de desearga por purga de 20 (Fig 12) El mas afectado dentro de este grupo (como se aprecia en los registros) que tie ne la evaporaeion de agua mas cercana a l~ zona ranurada es el M-84 quiza por ser el mas eercano a la zona de explotacion Enshylos registros de presion en los pozos M-51 y M-84 efectuados descargando por orifi- shycio de 2 y 30 se aprecia la extraeeion de mezcla agua-vapor del yacimiento (Fig 13) bull
Es conveniente aclarar que la calda de pre sion en la formacion debido a la extracciOn de agua caliente se provoea una evapora-shycion en la vecindad del pozo esto es si shyel punto de equilibrio termodinamico de - shypresion y temperatura estan cercanos en el pozo sin fluir y sera mas la calda de pre sion conforme sea mayor el flujo del pozo~ y la porosidad sea menor en la formacion la eual aumenta la evaporacion del agua en la misma
_ 80
m II 0
00
10 I
41 I
1000
jloo~
shy
1500
tr i
bull-shy120 A 200 240 ~o 320
~I I I I Ilio40 GO ao 100 140
I I I ii i 1~-d=i h I 1 I
1 1
I i L
1 j 1 I I I
r~s I i --lt~ 1---+--1---
PI p
I i
1 j
I 1 I
__ shy
REGISTROS CON POZO FLUYENDO POR LINEA 6jI ORIFICIO 2jI
FECHA ABRIL 1970
REG ISTRO CON POZO FlUYENOO POR LI NEA PURGA 24gt JUN 10 1973
1601ltQbJ
shy
shy
r- shy
REGISTRO P-I
P-2
XBL 7811-13149
Figura 11 Registros de presion pozo M-8
ao 0 160 200 240 290 320 TmlQ I I I I I I Ij 0 40 60 so 100 120 140 160lltotm
MI 50 1
I 1Itmiddot53 MmiddotS4
I~MOO 1
1 I 1
500
ltOIl
1000
raquo
1500
ilf
1
I
1
~~
I I ~ shy
I I 1 tbI
~ i i ~ I i
i
~I I
Ir~ M~
i 1 I ~i 1
[( I
i 0 i i
REG ISTROS DE PRES ION
11lt-8 I i
~
POlO FECHA CONDICIONES DE FLUJO II-SO ABRIL DE 1978 LINEA PURGA DE 2jI VR 11-90 ABRIL DE 1978 LINEA PUR~A DE 2~ VR II-53 HAYO DE 1978 LINEA PUR~A ~E I~ VR 11-84 JUNIO DE 1978 LINEA PURGA DE 14 VR
Figura 12 Registros de presion pozos 11-50 M-90 M-53 y M-84 XBL 7811-13142
p
REGISTRD POlO FECHA P-l 11-90 FEB 1978 P-2 II-51 FEB 197a P-3 II-53 EHE 1975
Figura 13 Registros de presion pozos M-90 M-51 M-53 Y M-84 XBL 7811-13141
COND I C I ONES DE FlUJO LINEA abull ORIFICIO 3 LINEA a ORIFICIO 2igt DOBLE LIHEA 2~
305
En el pozo M-51 no se ha reflejado la cal da de presion como 10 muestran los regis~ tros de 1973 y 1978 (Fig 14) aunque poshydrian estarse afectando unicamente algunos estratos pequenos de su zona de produccion (Fig 15 y 16)
CARACTERISTICAS DE PRODUCCION DE LOS POZOS
Durante el tiempo de produccion de los poshyzos estos se han comportado por 10 general disminuyendo su entalpia y disminuyendo -shylas producciones de vapor y agua tal como se aprecia en la tabla de la Figura 17 la cual se elaboro en base al comportamiento de las curvas de produccion de vapor y agua separados Los pozos en los cuales se - 7 aprecia este comportamiento son M-5 (Fig 18) M-8 (Fig19) M-25 (Fig20) M-30 - shy(Fig 21) M-31 (Fig 22) M-34 (Fig 23) -shyM-35 (Fig 24)
Una ligera variac ion en este comportamienshyto es que en algunos pozos en vez de dis minuir la cantidad de agua esta ha aumen~ tado es decir la disminucion de entalpia ha sido mas considerable que en los pozos anteriores Estos pozos se caracterizan shypor tener al iniciar su produ~cion ental pia bastante elevada como ejemplo tene--shymos los pozos M-21A (Fig25) M-27 (Fig 26) M-45 (Fig29) M-46 (Fig28)
Pozo M6 9 (29) II 31 50 68 19A
100
200
300
400
500
600
700
800
900
1000 C)
1100
1200
1300
~ 1400
1500
1600
1700
1800
1900
2000
2 100
2200
2300
m I
eo I
20
120 160 200 240 2eo 320
I I I I 1 1 40 60 00 100 120 140
3601
IOKgCml
gt0
500
1000
1100
=
1500
PmiddotI Pmiddot2
1
1 l-
I~ r
REGISTRO FECHA CONDICIONES DE FLUJO
P-I Die 1973 LINEA PURGA DE 2~ V R P-2 HARZO 1978 LINEA PURGA DE 2~ VR
XBL 7811-13148 Figura 14 Registros de presion pozo M-51
15A 26 27 14 5 21A 35 13 8 (42
-== - -
- a
= = ii = - -= ~ a ii_ -
= shy - -= = smiddot == - - - - - - - -~ iii ~ - -- - - - -
= ~~~~UC~70N ZONA= RANURADA
XBL 7811-13140 Figura 15 Zonas de produccion de los pozos de Cerro Prieto
306
Pozo M-20 90 101 45 25 (46) 39 30 34 51 130 105 114 84 104 102 53 ~91 __
100
200
300 1
i 400
500 1
600 i
700
800
900
1 000 I
~-1100
== == == ==1200 2
~ = = == ~ a =shy == = 5deg -1300 - - -
~ Is = ~ -- == sect = 55 = S 1400 -== 55= = E == - -1500
ZONA DE -== PRODUCCION == sect
== -1600 = == ~
~ ==I ZONA
1800 = RANURAOA
1900 t sect
5 2 -shy
nOO sect
2200
-2
XBL 7811-13139
Figura 16 Zonas de produccion de los pozos de Cerro Prieto
307
H ENTALPIA KQlem v VAPOR TONHr A_ AGUA SEPARAOA TONHr
Mshy
--~--[
a~
I I~ ~ l~ ~ ~ ~ ~e S hil ts~ ~~ ~~ ~ tl
shy shy shy _il I~ ~ ~- ~ e ~ ~~ e i
f sect~ ~~ ~~ l l h H 340 -I - - 20 -2 0 0 1-32 10
M-5 1-13 V e -I - -a -4 -I - -amp1 54 50 - -12 -5 -4 -IS -I I -a 112
N n a +4 -22 - - 0 -21 II I
I e-7I V 75 - -a -I I 2amp -5 -55 42
142 - -54 -a -40 -2 70 -14 12
N 50a -I 21 e + 2 54 140 III-II 3-73 V 4 -20 a -25 0 I 5a Ie
le2 -54 bull so -a -a --4 -121 3
H 54e -45 -21 e -sa zee
I -14 fI-7 V 71 - 4 -I 5 -24 4 13 +11 +2 - a +2e IU
H 0 - 20 -Ie -2 - -45 2ae III-IIA e-4 V u -52 bull I 2 +13 -a4 28
22 -32 -u -101 - 58 -Ioe 122
N ue 47 -n -5 I +e 0 M-leA 2-5 v ee e -4 - - I - 55
lei -33 +
~T~rmiddot 144
H 50 - - -e -8 420
101-20 e-75 V bullbull -Zi4 -I I -7 - -I -67 bull 188 -71 -52 -e -12 -54 -7 -lee II
H 500 -51 55 -40 -e -172 ne M-2IA e-4 v 100 -10 Ii Ie -I -Uf el
n 25 +44 I +15 +bullbull 151
H 308 +5 - 5 0 +5 5 0 M-25 12-75 V -22 - - -4 - - 41 27
leo -eO - e - 2 -a -112 ee
H I 52e -2 -5 +57 - 75 - - 5 -55 2tS M-2e 1-73 v 2e tl bullbull 7 -12 -e - 5 + 5e 4
sa +3 +5 e +40 bull e - 3 + bullbullbull 205
H 44 - -sa -2 -10 540
101- e- v 55 - -10 - 5 - 25 50
54 +24 bullbull - 1 bull 55
N US 0 -15 a +4 1 ee M-2 5-5 V 14 -D e -e 0 -u e
175 -te 51 - -III -5 12
H 512 -I 0 -2 -4 -a -12 Sao 101-50 12-75 V n -14 - - e -I 4 55 so
221 -al -22 - -I 0 -II 140
H UII +1 +e -14 -10 - -5 2e OiO 101-51 - 75 V ea -4 -e II -a - -2 -58 4
A e5 -e -14 -0 -122 -I a - I I
H 248 0 0 M-34 -n v 23 -2 -e
H-a
A lie -a -ZII
H 54 -4 -5 -2 -25 52 58 3-74 V 120 -14 - 5 -e -10 -4 -50 0
228 -20 -14 -12 -17 - -72 154
H 250 +50 10 -2 +511 2ee 101-4 11- V bullbull - -10 - 54
atO - 44 -e -15 - 175t=t -n H 4e2 - -17 - e4 e v 14 - -4 - 21 24 e -I + 5 28
H 442 -e 5 171 -46 8-77 II sa 0 3e
10 +2 I bullbull
I
bull
I
XBL 7811-13138
Figura 17 Cerro Prieto variac ion durante 1a produccion de los pozos
308
bullbull m I I 4 e I I bullbull 0
10
bull bullbull bull bull bull0 0
XBL 7811-13137
Figura 18 Graficas de produccion pozo M-S
309
1
IIgt ~sectQ -TO 60 -3~O
340 ~--o-
3-20 -~JQ
Igt~o()
jl~O 2_8 270 26fgt 2~~ 0230shy220 2--10shy
f200_ 190(a-o-ITOmiddot 1fiG
14____
12
lO c u
or
CI
o J CI z 111
gtshy() CI z Q
~ Q
t
z 2 o o gt a o a 0
It eshy
XBL 7811-13136
Figura 19 Graficas de producci6n pozo M-8
III
310
ltII(
~ 1-=+++-+ ~ ~~=tttttt1=tt ~
r-=-+-t-+-+-+-Wll-~RfFf r-mm-t+-HiHi+i+H-t+H-t+H-H-++f-t+H-t+-t-H+-HH-t+-H- ~Li ~H+~~++HH++~~~~~H+++Hrttt I---O-t-H-t-+-H-t-H--tl-tII++shy1+-t-H-+1-++++H-+-t-+++-r- [-+-HIHI-+I+H~I++-
dJplusmnplusmn ~2 I 1t-+++-t-+-+-iH-++m+t+t+++-H-H - --- ~
r L omiddot ~ I IIL-L----------~--------J i
XBL 7811-13135
Figura 20 Graficas de producci6n pozo M-25
311
II J
z
DO 80 ~~ 570 380 0 W 00 m aso
11~lIZO ~=-$ro 0-middotaoo
Luo 160 iii= 170 ii~80 250 mR=Fff Zit 140 lao 110I~ ato ~ 110 100 ~~ 1110 I~110 1-1=70 - Inlilt ~rllO
H 14 It II
10 10
bullbull 1- shybull
4
bull a 0 I~
~ ~ aoo r-a-o
1110 140
110
100
180
80 140
110
~~o 0 eo 4Q 10
0
Iii
I I I I I I I
bull -
bullI I I
tttttmI I I
-
~ oW -~gt tici M l -~ I~ c A I~i= l iu AV -~ c 0 iii - -I~Iltf Z 0 2 ZQ 0 ZQ 1973 1974 19711 19741 1977
I
~ -i ~~ ~N -e
z 1
I I~
V PHI
i ~ 0 ~~ ~Z bull 0
1978
540
~~ soo
Q1Ill 40
110
1100 ro lao 40
110
~ 0
fit 40
--Q
0
V 21 o o c () ()
o zc
z ~ o o ) o o ~ II
XBL 7811-13134
Figura 21 Graficas de produccion pozo M-30
312
lIi
a J
Z III
5eo 8ltgt S10 aso 550 40 no S20 alo 500
1100 18ltgt 170 leo no 140 230 no 0 100 180 180 110 leo
U
no
~~I~f ~~~ lao
IS
10
~ ~~~~~1-~~1-~-r+-rt~+shy ~rrr+~~~rrT+~~~rrr+++~~rrt-~~~1 ~+-~4-~4-~~~~+-~4-~~~~~~~~4-~~sect
~ I----++-+-t-t-+-HI-++-I-+OH-t-Hshy ~~~~~~L~~~~~LLLWWW~~~~
540 510
soo a80
allo 0
110 J 00 180
z leo
~ ~~~t=ctJt~~=t~tl=tl=tl~~~~~t~~~~~~tj~~~~~tjtJ~~~~~~t~~~~~~g ~O~deg1-~1-+-~1-+4-+1-rt~+-rt~+-~1-+4-+4-+~-r+-rt~+-~1-~-+1-~-r1-rt~+4-+shy 1+-~~~4-~~~
f ~~~fl~t=~~~=t~~=t1=tl=tl=~=t~=f~~~~~tt~~t1t~~~~~~~~~~~ 10
o
1973 1974 197~ 1978
XBL 7811-13133
Figura 22 Graficas de produccion pozo M-31
313
u
17 80
Iii 140
~
s 10 r 100 i n lit
n 10 0 no 140 0
C I Raolegt Oft bull 110
110 ~ 10010shy ~ 110 j110 riYft rIo r1TO
IUO
~~~~~~~~4-~~~~~~~4-~-+4-~~~~~+1~4-~~-4-~~1~~-r~rt~I~~og
~~~~~~~+-~~~~4-~~+-~~~~+-~~4-~~+-~~~~4-i-1-+4-~~~U4~0 cg ttO O
zz 00 110
z 10 0
140U u 110 Q 100 0 G 0 tIL 80
4~ 40 act I 0 o
19711 974 975 1978 1977 1978
XBL 7811-13132
Figura 23 Gr~ficas de produccion pozo M-34
314
0
shy 0
gtt n
2shyii 180 shyJ 140 gtt
flO O UQZ tl(111
200 - - aoo 190 - voGOshy 80_f7oshy 170
fti~ 0
14
12
gt I~-lii bull z e 2 4i ItIii no
XBL 7811-13131
Figura 24 Graficas de produccion pozo M-3S
315
XBL 7811-13130
Figura 25 Graficas de produccion pozo M-21A
316
iii
i iii I~~+++m~~jtt C(ii 1-4-1--I--l~
J
z
r
z o
~ o
~--II
10
bull m- ttm
f ~~4~~r+-I-~-r~+4~~I-+-+-
I I I I I I I I
I mi-f_1L
- 10
i--shy
fm=m -shyL
JJ I
I I I - IJL
XBL 7811-13129
Figura 26 Graficas de produccion pozo M-27
317
JI_~Q 550 5-40shy
280
c ii I C Z W
8~ ~~_Q570
3S0 -20
r-O 500
11110
270 illo 250 240
rf9210 110 200
r~_o 180
Crro 180
14
r--I 10
bull 8
4
I
0
r-~O ~o
oo 180
~o ~_o
liD
~ ---o ~9 ~ O ---00
80
ltO -shy -Q
---~ III a_e~ z U0-i a_~o _s_ao r SlJ 11 810
15_09 lit
no n 180 1_00 140 lit I~ltgt-_uo 110 100
I_~Ie 170 ~_I
14
~ 10
bull 8
~-I
I 0
S~~ _s~ 11 _uo u
0 _I_~ ltgt _Ll c-shy n 140 n
I_~ 0 z
1_9_9 liD
I 0
I~~ 110 -i
_1_00
10
_f_O 40 -- shy
__ 111
~-
I 7 3 I 1 4 I 1 II I 18 I 9 11 I 918
XBL 7811-13128
Figura 27 Graficas de produccion pozo M-45
I~_~ _II_~
318
so Ull 570 360 560 540
~o 520
r-O ~~ iii) ~o270 260 250 140
~jgtno r~100lee liomiddot fio 160
14 II
10
bull _6
4- shyIt
-0
140 _1I~0
100
u(I
m
l I
t-t~~r+~+-I-+4-+4-+4-~-+-
III
t~
bull
~ -tmiddota~~ 5tO 140iaQ 1I~l
3~~ 1-t-It~I- 89Ishy 110
169
~ I~O nQ
bull III 100
to 811 170 )
-I-~I-JL _-tlL
bullbull 4 It - 0
C
II - 4 Z 1amp1
XBL 7811-13127
Figura 28 Graficas de produccion pozo M-46
Este mismo comportamiento se aprecia en shylos pozos M-14 (Fig29) r M-26 (Fig30) en los cuales se presento una aportacion shydel yacimiento en estratos superiores deshybido a roturas de tuberias 10 cual fue causa de un incremento en el porcentaje de agua extralda
La r la general de comportamiento de disshyminuc de entalpia en los pozos est~ s~
jeta a ciertas excepciones claramente def nidas como son por ejempl0 los pozos M-ll M-19 Y M-20 en los cuales se presenta un aumento de entalpia El pozo M-ll (Fig 31) entro a producir inicialmente con dos zonas abiertas una inferior (1138-1211 m) y otra superior (872-964 m) causa por la cual el pozo se incrusto idamente Se procedio a limpiarlo y obturar la zona sushyperior ademas de una rotura de tuberia en contrada a 750 m Esta operacion se efec=shy
tuo introduciendo tuberia de produccion de 5O con 10 cual el pozo qued6 produciendo de la zona inferior y aunque su producci6n fue menor se incremento su entalpia
El pozo M-19A (Fig 32) inicio su producshycion teniendo obturado con cemento 200 m de la parte inferior de la tuberia ranurashyda a los cinco meses de produccion extra jo dicho cemento aumentardo su produccion de vapor y su ental pia
El pozo M-2~ (Fig 33) despues de 4 anos de produccion e ir disminuyendo lentamente su entalpia y gasto de vapor disminuya bitamente la produccian de vapor y en ma-shyyor proporcion el agua por 10 tanto au-shymenta su entalpia Esto se debia probab mente a la incrustacian rovocada por la entrada de colgadas a
flujo a 850 m l
tr s de las tuberias
319
x
- It~~ml=l+t=p tt+tt+t+II
C II J C ~~ttI~=tHt
14 I II I I
~ 4
-i
~
I
I I I
m ffi I
I I I
1ampmiddotI lIE
tit I i
14 II
10
bull
III 540 5Z0
11 1500 u 10
0 0
~LU c - - n 40 n tto 0
L~ z
I O
XBL 7811-13126
Figura 29 Graficas de produccion pozo M-14
320
C II ~-iH-++shyI c ~ z
~
Z 0 U U ) Q 0 II II
10 leo 140
110 lOCI 10 10
XBL 7811-13125
Figura 30 Graficas de produccion pozo M-26
0
321
14
~lII 10
bullbull bull 4 4 1 It
0 149 ~_O
aoo~ ~al 140
110 ~ ao z lao 0 140U U ItO )
10lt1Q 0 100 II
XBL 7811-13124
Figura 31 Graficas de produccion pozo M-ll
322
1 ~ ~ if
0 IlI80 la70 IlIlIO
14 It 10
bullbull 4 I
0
~~
~ III 110 j
0 bull ao
I I I I I
I I I I 40 ~ Hoi
1100
110
bullbull0
XBL 7811-13123
Figura 32 Graficas de produccion pozo Jgt1-19A
323
C
L I C ~~4ttttttttttttt=1=t=
I ~ ~~t~rt~~~~~ U g Q o II L
to -I -t-r+rt-r+-ri-t+-~-t-t-rr-r+-rIClO
~~~plusmnplusmn=tti-rt1~t-rti-rt-rti-ri=~ _0 40
XBL 7811-13122
Figura 33 Graficas de produccion pozo M-20
D~ntro de los pozos en explotacion tene-shymos algunos que han dec1inado rapidamente su produccion encontrandose en estos inshycrustada la tuberfa de produccion aparenshytemente por invasion de agua de menor temshyperatura Estos pozos son el M-ll (Fig 31) M-9 (Fig 34) M-15A (Fig35) M-39 (Fig 36) el M-29 (Fig 37) antes de reshyperforarlo
OBSERVACIONES GENERALES
Durante la perforacion de pozos geotermi-shycos es muy probable que se tengan mayores y mas frecuentes perdidas de lodos de cirshyculacion siendo estas de mayor proporcion conforme se acerque a la zona mas explotashyda asimismo sera necesario un mayor do durante las cementaciones de las tube-shyrfas debido a la cafda de presion del ya~
cimiento ya que las columnas hidrostaticas que pueda soportar estas seran menores
Dnrante la induccion de pozos sera necesa rio equipo de mayor capacidad ya que la ~ profundidad de los niveles de agua seran mayores esto es cuanto mas cerca ~ste el pozo de la zona explotada mayor sera la pro fundidad de los niveles de equilibrio del shyagua del pozo sin fluir
La correlacion de datos qulmicos para de-shyterrninacion de entalpia deberan ser toma-shydos con reservas ya que no todos los pozos extraen agua del yacimiento sino rnezcla y no sera valida en aquellos pozos en don~ la entalpia sea alta 0 sea es preferente el flujo de vapor al del agua en el yaci-shymiento ya que ademas puede haber un equishylibrio en la fase llquida con depositacion de sales por evaporacion de agua por disshy
324
a40 ao aoo 0 eo 1140
aao
aoo
Ishy lao z leo S ~E tl-ip A 0 0 140 140U ItoU )
100a 0 0II L eo
6 ao
0
XBL 7811~13121
Figura 34 Graficas de produccion pozo M-9
325
CI ltC
~ II Iil 0
z ~
z 2 u u ~ 0 0 0 II
4 II 0
14
_10
bull 4
II
a~ ~_O
aoo no
~ i ~ 1gt
~ ~
XBL 7811-13120
Figura 35 Graficas de produccion pozo M-15A
326
01180 a 1117shy110 ~8 r- z
0 -t II S40 140 ~ ISO ~ ~- II 100
un II 0 no It
It170 noDC 110
1110ii no oJ 140 ri40 CrtTC 110 110 ~ 110 ~
100 180 ~~ 10 shy
170 17shy110
l~ 14 1 ~
10 10 iabull 4 bull et1j[tttijjj~plusmnlJJ~tplusmni~~~tplusmnplusmnplusmnjjtttplusmnij=tttplusmnplusmnjj~~~~~tttj~~tt~~t+~~~++~~~I ~ i~OLLUU~~LLUU~~LLLU~~LLLUUU~~LLLU~~LLLU~~~LLLU~~LLLL~~
140 110
I 110
Ia
0 g c n140 140 n
110 0110 Z ~ 100 100
110 110 Z 180 110 o 140 140
-t110~ ~11~O~~~~~~~~~~~~~middot4-~~~~~+-~~~-+~~~+-~~r~~~-+4-~~+-~~~~~~-+~~~4-~~+-~~ 1001~O~O~~4-~Lf4-~~4-~~~~~~rF4-~~+-~4-~-+4-~~~~~I~Lf4-~~4-~~~~4-~Lf4-~-+4-~-++-~-f~ Z10~ ~~0~~~~-+4-~~4-~~~-+~~~~~~+-~~~-+~~~~~~~-+~+4~4-~~~~~~-+~~-+4-~~+-~-+~ 40~ ~~~oct=tt~~=t~t4~~I-i=tijtt=ttj~~ti=tttt=ttj=tjti=tjjti=tjj~jttj=tj=tt=tijti=tij=tjtj=tj=ti=ti=tt=t~
~-~ ~ 10 0--~ V~~OF 1~dI~~~~~amprt~~~~hh~~~~~~~bh~~~~~
bull c =l cl U - DII -I =1 -p c Ij~ ~ ~ i -~ i -~Il ~ ~ ~ gli I cl 11r c i g bull D 051 fHjlU ~I IH ~ t ~ Ii 1 Ii g
XBL 7811-13119
Figura 36 Graficas de produccion pozo M-39
327
or shy or
ltII
II I ltII III III
shy III
I o
o CI II
IIH ~io 370 3--0 350 3middot~9 ~~O 320
41deg300 299 280
--o --l0 250
f 220
~ ZOO 1amp0middot 180middot 170 180
14 I
10
bull 8
~ bull
~l9 4 CO ~o
C 140
p1 too
~C 80
J~O Ito
~o_ _10
_10 _40 _~1 I
r~ ~~ ~iC
bullm FF ~
S E PU -=mi
i
IGU
I bull i shy -1 I
~~ ~iIl=lg~ ~I~~r~~f I
c I~ ~ 1~Ig~ c tco
173 1974 19715
m
shy
OIV
iiiPOZ ~tlr
I
tbt I
I~middotI ~ll ~~Ilili~ill~ II c ~IZCIW jl-a ~ II~ al~ i oi
1t7e 77
M I(~II
c~t1w S~2 II~ ~ 0 i~ 15178
~UII
~ ~sjo
i~ lIr9 110
~~ 11119
mmiddot 0 I~O 140
~etO aoo 1Ji 109u 14
II
-LshybullL 4 II
0
$~ Iro
1100
1M IU
0
HJ L~
I~140
110
~
t-I -~~
4 _19
I-I
o o c () ()
z
minucion de la presion
XBL 7811-13118
Figura 37 Graficas de produccion pozo M-29
en el yacimiento - shy(Fig38) Por 10 tanto las correlaciones e 1ndices NaK Si Na-K-Ca no coinciden shycon las entalpias medidas
La disminucion de produccion qe vapor de shylos pozos puede ser debido ei parte a la calda de presion de los estratos explota-shydos p~r ser menor la capacidad de aportashycion del yacimiento respecto al fluido ex traldo
La disminucion de entalpia de los pozos - shypuede ser a 1a aportacion de estratos sup~ rio res 0 inferiores de las explotadas de shymenor temperatura y por la ca1da de pre-shysion de los estratos permite su aportacion
La vida util de las tuberlas de produccion se vera acortada debido a que la corrosion y temperatura reducen su capacidad al colaE so 0 rotura que aunado a la caida de preshy
sian dentro del pozo p~r efecto de caida shyde presion del yacimiento se obtienen dishyferenciales de presion entre el interior shydel pozo y los estratos no explotados que trataran de romper dichas tuber1as Aforshytunadamente estos problemas seran princishypalmente en la parte profunda delmiddotpozo
Estos problemas seran menores en los nue-shyvos pozos ya que actualmente se lleva a cabo un programa de instalacion de tube--shyrlas de mayor capacidad a la rotura 0 co-shylapso
Como se ha observado en el comportamiento de los pozos en observacion y explotacion estos estan llegando a un equilibrio en shyel cual las variaciones de nivel produc-shycion y entalpia ya no sufren grandes varia ciones como en el inicio de la explotaci6n del campo len el inicio de produccion del pozo)
328
POZO ENTALPIA MAXIMA
ENTALPIA INICIAL
ENTALPIA ACTUAL
REGISTRO DE FONDO
ENTALPIA TMAX degC
M-5 341 340 308 303 287 M-8 432 336 311 312 293 M-11 342 306 340 308 290 M-14 346 346 288 321 300 M-15A 310 310 265 326 304 M-19A 376 295 310 333 309 M-20 420 310 420 306 289 I M-21A 510 500 328 337 312 M-25 318 305 310 319 300
M-26 380 328 295 323 301 M-27 I 447 447 340 326 304 M-29 286 285 286 290 272 M-30 350 312 300 308 290 M-31 355 338 310 311 292 M-34 255 245 245 337 312 M-35 344 344 321 305 328 M-42 294 250 288 316 296 M-45 452 452 388 342 315 M-46 442 442 373 333 309 M-53 398 398 374 548 342
XBL 7811-13147
Figure 38 Cerro Prieto variacion de enta1pfa (kca1kg) en pozos en produccion
Como se ha mencionado anteriormente los p~
zos tienden a estabi1izarse en sus caracte rlsticas de produccion asl como tambien en los nive1es de los pozos de observacion Doy las gracias a las autoridades de CFE 10 cua1 nos indicarla que el area esta 1 por la invitacion para participar en este gando a un equi1ibrio entre el flujo ext Simposio 10 cua1 es una somera interpret~
do y el aportado por el area circundante cion de los datos de campo asimismo agrashydezco la cooperacion de los Ingenieros de
Los cambios de condiciones de produccion - la Superintendencia de Produccion que sin seran menores conforme localicen los pozos 1a ayuda de ellos no hubiese sido posib1e de produccion a mayor distancia uno de otro la elaboracion del presente trabajo para no sobreexplotar una area reducida La sobreexplotacion provocara mayor cada de preSion en una ~rea confinada 10 que a su vez provocarfa infiltraciones de capas superiores 0 inferiores de menor temperat~ BIBLIOGRAFIA ra
1) Bermejo M FJ Interpretacion de reshyLas cadas de presion tambien seran meno-shy gistros temperatura y presion en po res conforme se lleve a cabo una reinyec-shy zos del campo geotermico Primera ~ cion del agua extrafda al yacimiento Reunion de Intercambio Tecnico San
Felipe BC (1977) Como se ha podido apreciar en el presente trabajo los cambios fsicos y termodinami 2) Bermejo M FJ Primer Curso sobre - shycos detectados son normales y producidos - Geotermia Mexicali BC (1976) principalmente por una sobreexp10tacion shyde una area reducida y no por una dec1inashy 3) Dominguez AB Bermejo M FJ Metoshycion por falta de capacidad del campo geoshy do actual para la apertura e inicio termico Estas variaciones son detectadas de explotacion de pozos en el campo en la mayorfa de los campos geotermicos en geotermico de Cerro Prieto Proc el mundo y no es una particularidad del - shy Second UN Symp Develop and Use shycampo geotermico de Cerro Prieto Geoth Resour pp 1619-1628 (1976)
329
4) Domin~uez AB Vital BF Repara-shy geotermico de Cerro Prieto Archivo cion y Control de Pozos Geotermicos CFE Coordinadora CP Dpto de en Cerro Prieto BC Second UN Produccion Symp Develop and Use Geoth Resour pp 1483-1495 (1976) 6) Navarro FJ EsquerCA Castillo B
F Reportes mediciones agua y vashy5) Cota TJ Castillo BF De la Cruz por de pozos geotermicos de Cerro - shy
F Reportes registros de presion y Prieto BC Archivo CFE Coordi temperatura de los pozos del campo - nadora CP Dpto de Produccion -
PHYSICAL AND THERMODYNAMIC CHANGES OBSERVED IN THE CERRO PRIETO GEOTHERMAL RESERVOIR
In April 1973 the Comisi~n Federal de Electricidad (CFE) began electric power generation at the Cerro Prieto geothermal plant using two turbines coupled to 375-MW generators requiring 730 tonhr of steam
The turbine uses steam from geothermal wells which extrct from the reservoir a water-steam mixture whose proportions vary from well to well At the surface the steam is eparated from the water by means of Webre centrifugal separators and conducted to the generating plant through different diameter pipes The steam flow is measured using orifices installed in these pipes (Figure 1) the water resulting from the centri shyfugal separation is led into a vertical silencer which discharges the water into a channel equipped with a weir to measure the water flow rate From 13 to 17 wells have been used to produced the steam necessary for the operation of the turbines
The full 75 MW were not produced when power generation began in April 1973 but was achieved gradually as wells were integrated into the system A power generating capacity of 75 MW was reached in February 1974 As can be seen in Figure 2 the rate of mixture extraction was rather low during the first few months and increased as more wells went into production
Physical and thermodynamic changes have occurred in the reservoir due to the extraction of the water-steam mixture These changes can also be detected in observation wells located in difshyferent parts of the geothermal field In these wells the drop in water levels has been observed reflecting the pressure reduction in the producing reservoir
In well M-6 (Figure 2) the water level fell 41 m between January 1973 and June 1978 in well M-46 it fell 534 m between March 1974 and March 1976 in well M-42 23 m between March 1974 and May 1976 in well M-29 14 m between May and December 1974 and in well M-38 46 m from March to August 1974 As shown in Figure 2 the water levels in all the wells fell rapidly during the first years of field exploitation but presently
the rate of drawdown has abated and the water level seems to be stabilizing
The production rate of the water-steam mixture from the wells (Figure 2) is now close to 2800 tonhr (total extraction to date is about 120000000 tons) creating a decrease in reservoir pressure which has caused the water in the strata to boil Therefore after the beginning of proshyduction in April 1973 most of the wells extracted a water-steam mixture from the reservoir even through reduced diameters This is indicated by the downhole logs taken in wells M-2lA M-27 M-14 M-45 and M-46 (Figure 4) The logs show there are no similarities in the bottom-hole pressures measured at the same depth This might be because of its position relative to the area under exploitation (Figure 3) and to the date the logs were run
The decrease in pressure in the producing reservoir is documented by a series of pressure logs taken in one well These logs indicate a drop in reservoir pressure since the field has been under production
The pressure logs of well M-25 with fluids flowing through a 2-in-diam regulated valve purger show a decrease of 248 kgcm2 in the bottom-hole pressure (Logs were taken from May 1973 to March 1976) Logs P-6 to P-IO obtained from November 1974 to May 1977 when the discharge was through a 3-in-diam orifice show a decrease of 223 kgcm2 in the bottom pressure In addishytion under these flow conditions the well produces a water-steam mixture from the reservoir (Figure 5)
The temperature and pressure logs (P-l and P-4) obtained for well M-30 (when it flowed through a 2-in-diam regulated valve from November 1973 to March 1976) showed a total presshysure drop of 130 kgcm2 and a temperature reducshytion of 90 C Likewise the logs measured in P-5 to P-7 from December 1974 to March 1976 with a 3-in-diam discharge showed a total pressure drop of 55 kgcm2 (Figure 6)
The pressure and temperature logs of well M-3l show a pressure reduction of 422 kgcm2 and a temperature drop of 15 0 C The logs were taken from July 1973 to November 1975 with the flow through a 2-in-diam regulated valve purger Furthermore in 1973 the well extracted water and in 1975 a water-steam mixture (Figure 7)
In the pressure and temperature logs taken from the same well from March 1970 to March 1976 and while flow was through a 3-in-diam orifice decreases of 233 kgcm2 in bottom-hole pressure and 2loC in temperature of the produced fluids were observed In 1970 this well produced water from the reservoir but later produced a watershysteam mixture (Figure 8)
The pressure logs of well M-21A taken while the well discharged through a 3-in-diam orifice (from April 1975 to May 1977) show a bottom-hole pressure reduction of 45 kgcm2 (Figure 9)
In 1970 before exploitation of the geothermal field had begun there were wells that had similar bottom-hole pressures and extracted hot water from the reservoir as shown in the logs of wells M-13 and M-5 taken when the flow was through a 2 12shyin-diam orifice (Figure 10)
Likewise the pressure logs in well M-8 (with a 2 12-in-diam discharge) show that in 1970 the well produced hot water from the reservoir In 1973 while discharging through a 2-in-diam purger the logs indicated that the well extracted a water-steam mixture from the reservoir (Figure 11)
Presently only the wells that are farthest away from the production area (for example M-53 M-50 M-90 and M-84) extract water from the resershyvoir This can be seen in the pressure logs Although the wells might be affected by the presshysure drop they have not yet extracted the steamshywater mixture when discharging through a 2-inshydiam purger (Figure 12) The most affect well within this group (see ) with water boiling closest to the slotted is M-84--perhaps because it is the nearest to the production area The pressure logs of wells M-5l and M-84 show that when flowed through 2- and 3-in-diam orifices respectively a water-steam mixture 1S produced from the reservoir (Figure 13)
The pressure drop in the formation due to water production brings about boiling near the well provided that under nonflowing conditions the well is near the thermodynamic equilibrium point of pressure and temperature The drop in pressure will increase as the flow becomes greater and the formation porosity decreases thus in-
the boiling in the formation
The pressure drop is not reflected in well M-5l as the 1973 and 1978 pressure logs show (Figure 14) Nevertheless some minor strata in its production zone might be affected (Figures 15 and 16)
WELL PRODUCTION CHARACTERISTICS
During the time the wells were under producshy~ion there has generally been a decrease in
enthalpy and a reduction in water and steam output as shown in 17 which was based on the production curves of separated steam and water The wells that show this decrease are M-5 (Figure 18) M-8 (Figure 19) M-25 20) M-30 (Figure 21) M-31 (Figure 22) M-34 (Figure 23) and M-35 (Figure 24)
In some wells there is a slight variation with respect to the mentioned behavior In them the amount of water has diminished instead of increased Therefore the enthalpy reduction has been larger than in the other wells These wells have rather high enthalpy at the beginning of production for example M-21A (Figure 25) M-27 (Figure 26) M-45 (Figure 29) and M-46 (Figure 28)
This same behavior is evident in wells M-14 (Figure 29) and M-26 (Figure 30) where an inflow from the reservoir in the upper layers occurred through fractures in the casing causing an increase in the percentage of produced water
The general rule of behavior regarding enthalpy reduction in the wells is subject to certain blearly defined exceptions--for instance wells M-ll M-19 and M-20 where an increase in enthalpy is observed Well M-ll (Figure 31) initially produced from two open zones--a lower one (1138-1211 m) and an upper one (872-964 m) This caused rapid scaling of the well The well was cleaned the upper zone was plugged in and a break in the casing at 750 m was repaired This operation was performed by installing a 5-in-diam production casing as a result of which the well continued producing from the lower area Even though the production decreased the enthalpy was increased
Well M-19A (Figure 32) began production with 200 m of the lower section of the slotted casing plugged with cement Five months after the cement was removed the wells steam production and enthalpy were 1
After four years of production and a gradual decrease of enthalpy and steam output well M-20 (Figure 33) suddenly showed a reduction in steam and (to a greater extent) water production resulting in an enthalpy increase This was probably caused by scaling brought about by the inflow through the casing hanging at 850 m l
Among the production wells some have shown a rapid output reduction In these wells scaling in the production was found apparently caused by the invasion lower-temperature water These wells are M-ll 31) M-9 (Figure 34) M-15A (Figure 35) M-39 36) and M-29 (Figure 37) before it was re-drilled l
GENERAL OBSERVATIONS
During drilling of geothermal wells loss of mue circulation is common This generally increases as wells get closer to the most exploited zone Due to the pressure drop in the reservoir it will be necessary to cement the casing with great care since the hydrostatic columns they can withstand will be decrease During the well inducshytion the use of equipment with higher capacity
331
will be necessary since the water level will be deeper depending on the wells proximity to the production area In a nonflowing well the closer the well is to the production area the deeper the static water level will be
The correlation of chemical data to determine enthalpy must be analyzed with caution since not all wells extract water from the reservoir Some wells extract a steam-water mixture so that this correlation will not be valid in those wells where enthalpy is high In other words in the reservoir the steam flow occurs more readily than water flow In addition there might be an equilibrium in the liquid phase with salt deposits due to boiling as a result of a reduction in reservoir pressure (Figure 38) Therefore the correlations and the Na-K-Si and Na-K-Ca indices do not agree with the measured enthalpies
The decrease in steam production might be due in part to the pressure drop in the exploited strata because of lower reservoir fluid production capacity
The enthalpy decrease in the wells could be partly due to the inflow from colder upper or lower strata that are not directly exploited This inflow is possible because of the pressure drop in the producing reservoirs
The life span of the production casings will be shortened because corrosion and high temperature reduce their resistance to collapse and fracture This and the reduction in pressure within the well (due to the drop in reservoir pressure) cause pressure differences between the inside of the well and the nonexploited strata and tend to break the casings Fortunately this will happen mainly in the deeper part of the well
These problems will be reduced in the new wells since a program has been impleshymented to install with higher capacity to withstand fracture and collapse
As the behavior of observation and production wells has shown they are reaching equilibrium When the wells start producing the variations in water level production rate and enthalpy are not as great as they were at the beginning of field exploitation
As already mentioned the production wells tend to stabilize their output characteristics Likewise the water levels stabilize in the obsershyvation wells This would indicate that the area is reaching an equilibrium between the fluid proshyduced and the recharge from the surrounding area
Changes in production conditions will be smaller as wells are drilled at greater distances from each other Over-exploitation in a small area would otherwise occur resulting in large pressure reduction and promoting infiltrations from colder upper or lower strata The pressure drop will also be smaller if the water produced from the is reinjected
SUMMARY
In this paper we have shown that the physical and thermodynamic changes detected are normal and are mainly the result of an over-exploitation of a reduced area and not due to a decline in the capashycity of the geothermal field These variations are found in most geothermal fields throughout the world and are not a peculiarity of the Cerro Prieto system
ACKNOWLEDGMENTS
We wish to thank the authorities of CFE for their kind invitation to participate in this symposium and present our interpretation of the field data We also wish to thank the engineers of the CFE production department for their coopershyation Without their help we would not have been able to prepare this paper
FIGURE CAPTIONS
Figure 1 Typical surface installations at a Cerro Prieto geothermal well
Figure 2 Production of steam-brine mixture and water level changes in observation wells at Cerro Prieto
Figure 3 Location of wells in the Cerro Prieto geothermal field
Figure 4 Downhole pressure logs wells M-2lA M-27 M-14 M-45 and M-46
Figure 5 Downhole pressure logs well M-25
Figure 6 Downhole pressure and temperature logs well M-30
7 Downhole pressure and temperature logs well M-31
8 Downhole pressure and temperature logs well M-3l
9 Downhole pressure logs well M-2IA
Figure 10 Downhole pressure logs wells M-13 and M-5
Figure 11 Downhole pressure logs well ~-8
Figure 12 Downhole pressure logs wells M-50 M-90 M-53 and M-84
Figure 13 Downhole pressure logs wells M-90 M-51 M-53 and M-84
14 Downhole pressure logs well M-51
Figure 15 Producing intervals Cerro Prieto wells
Figure 16 Producing intervals Cerro Prieto wells
332
Figure 17 Changes observed during production Figure 29 Production history well M-14
Figure 18 Production history well M-5 Figure 30 Production history well M-26
Figure 19 Production history well M-8 Figure 3l Production history well M-1l
Figure 20 Production history well M-25 Figure 32 Production history well M-19A
Figure 2l Production history well M-30 Figure 33 Production history well M-20
Figure 22 Production history well M-31 Figure 34 Production history well M-9
Figure 23 Production history well M-34 Figure 35 Production history well M-15A
Figure 24 Production history well M-35 Figure 36 Production history well M-39
Figure 25 Production history well M-2lA Figure 37 Production history well M-29
Figure 26 Production history well M-27 Figure 38 Enthalpy variations (kcalkg) in Cerro Prieto production wells
Figure 27 Production history well M-45
Figure 28 Production history well M-46
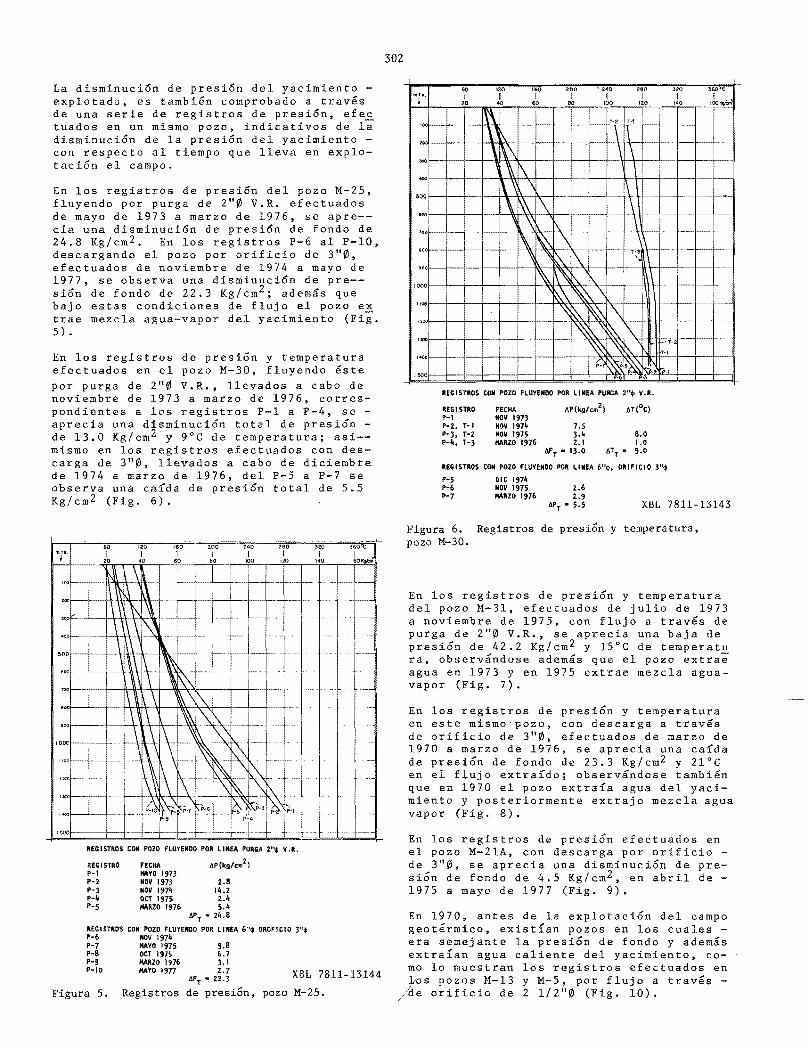
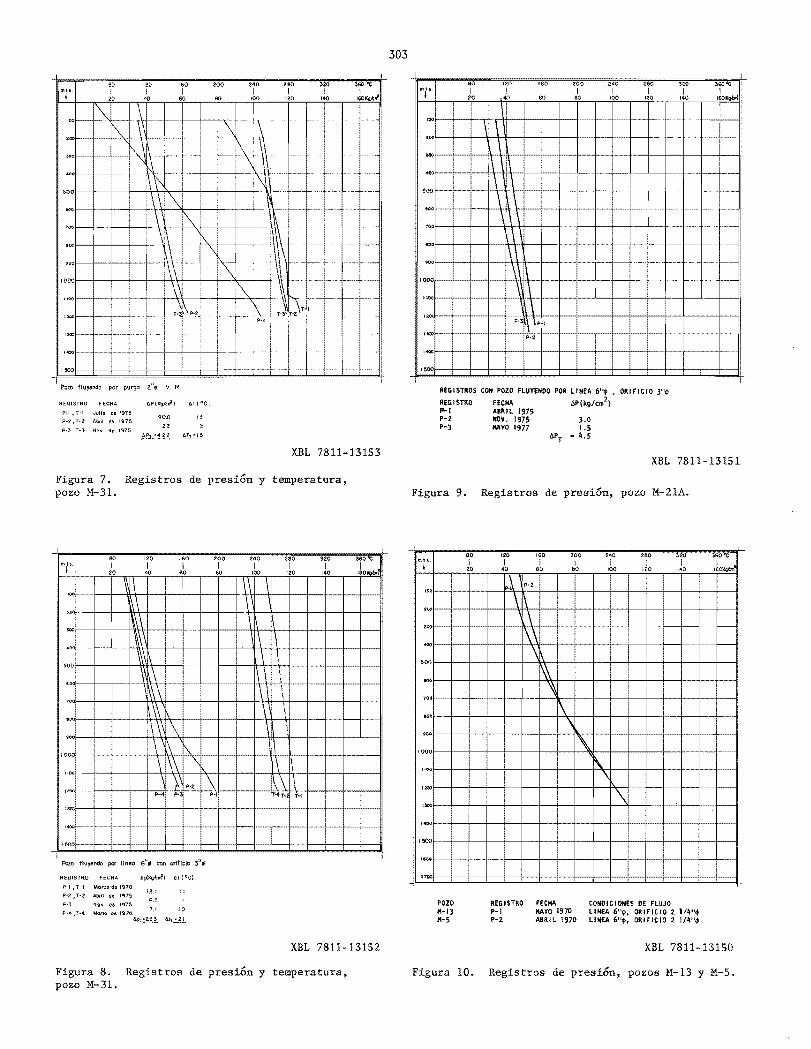
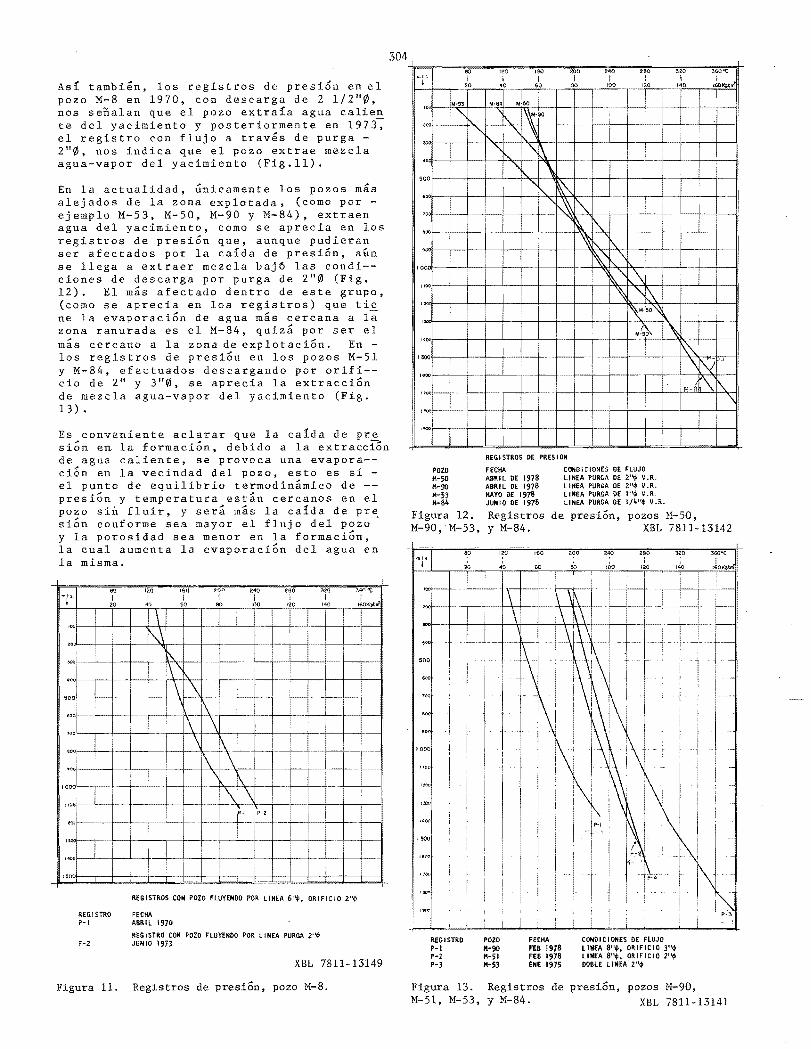
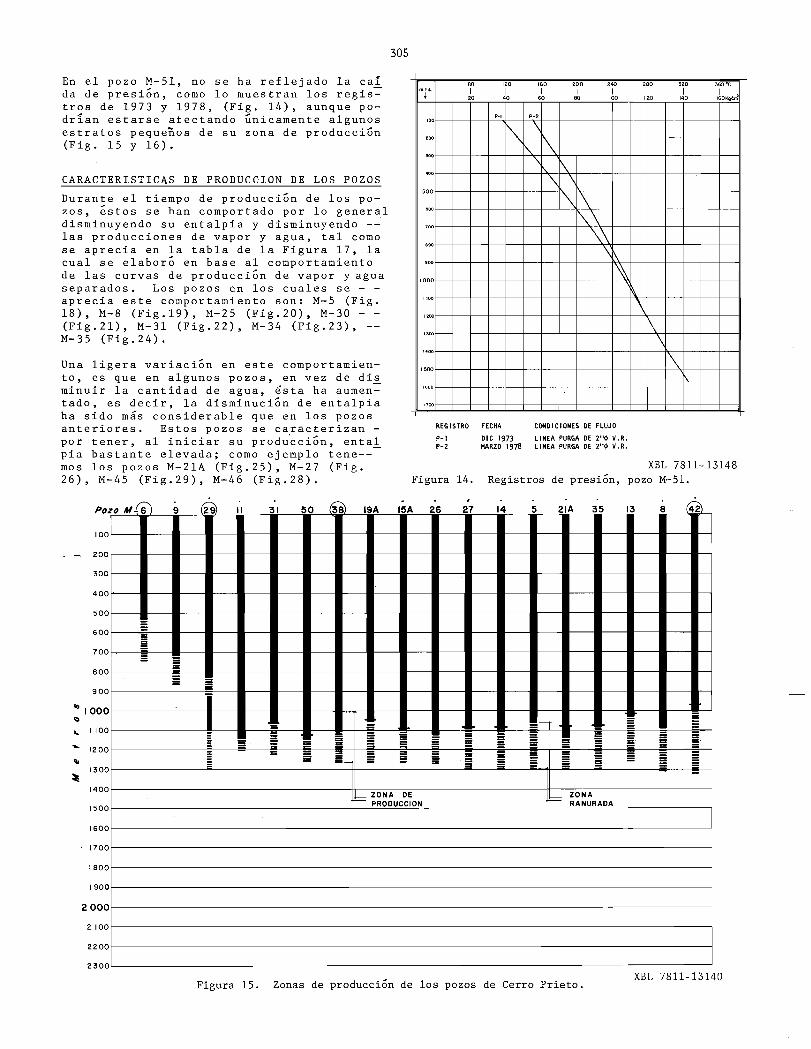
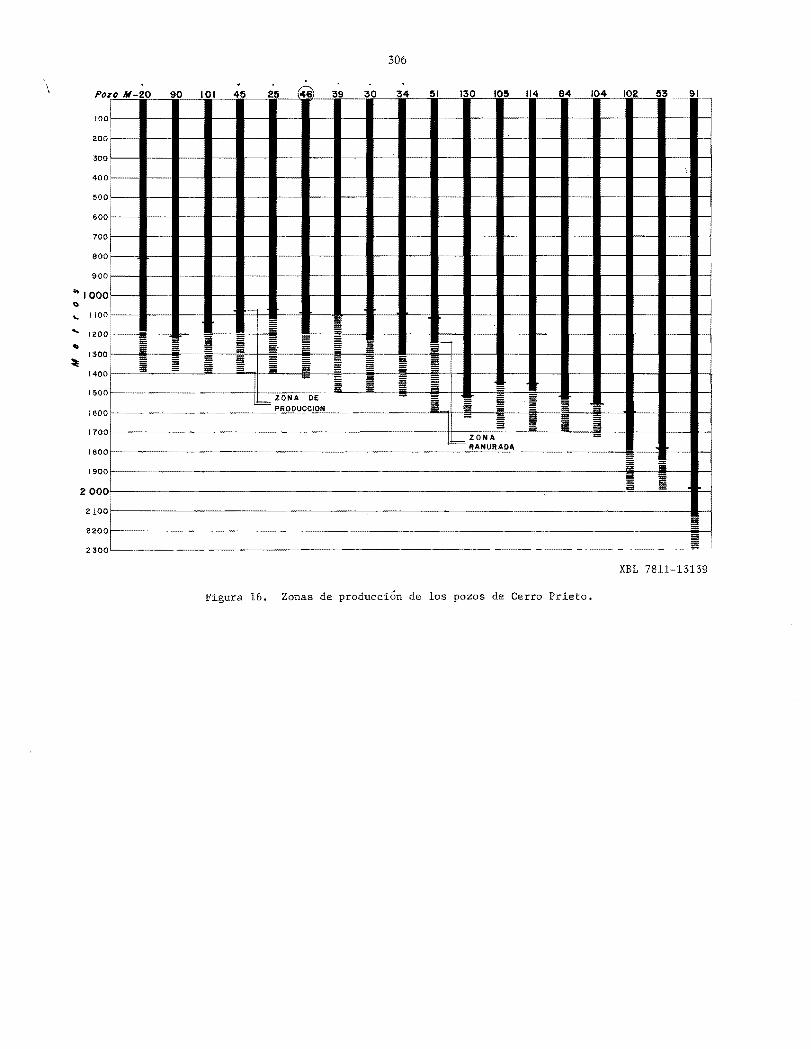
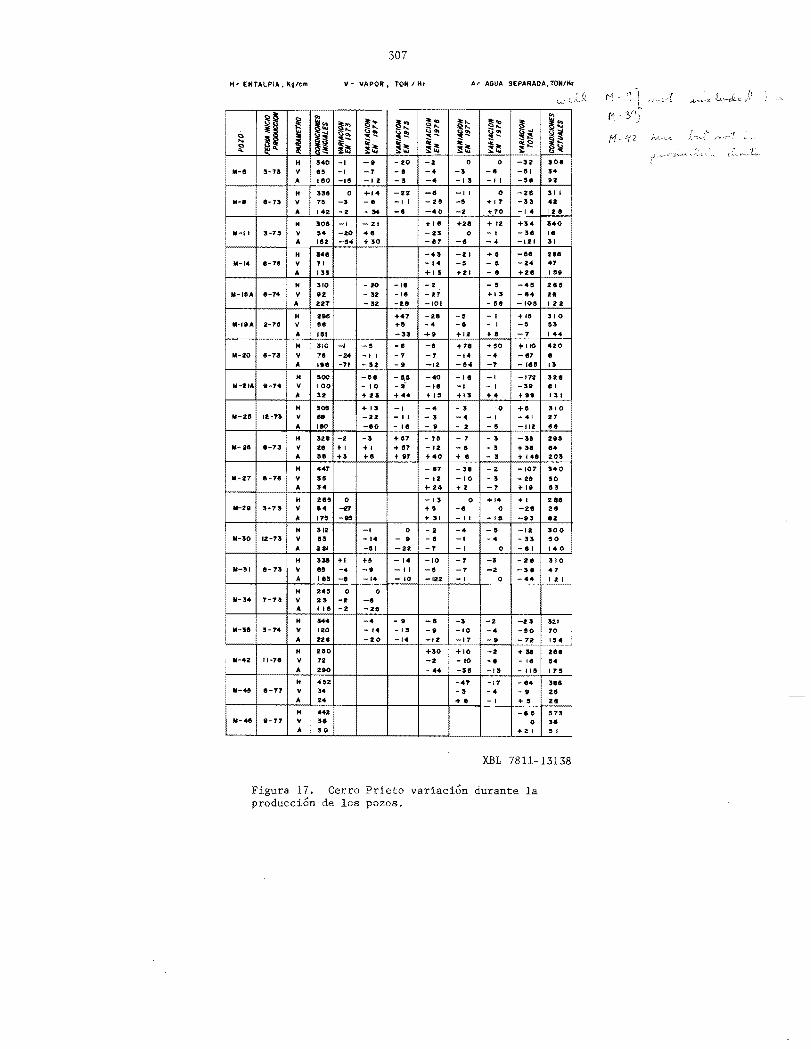
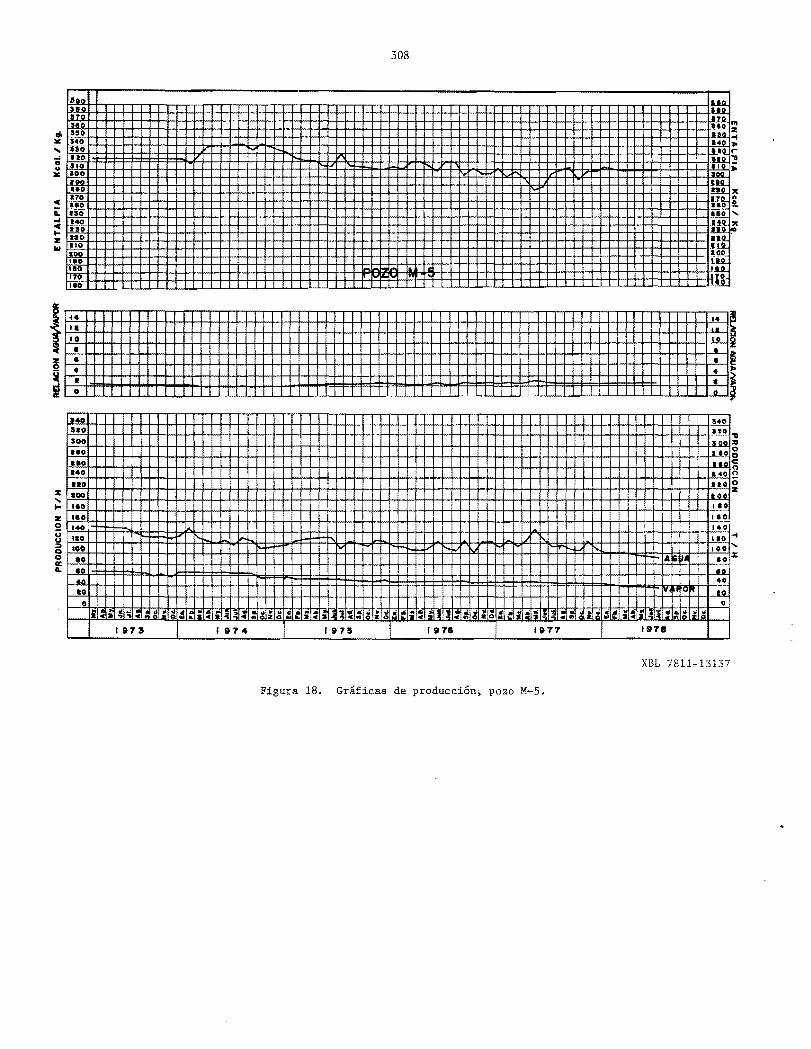
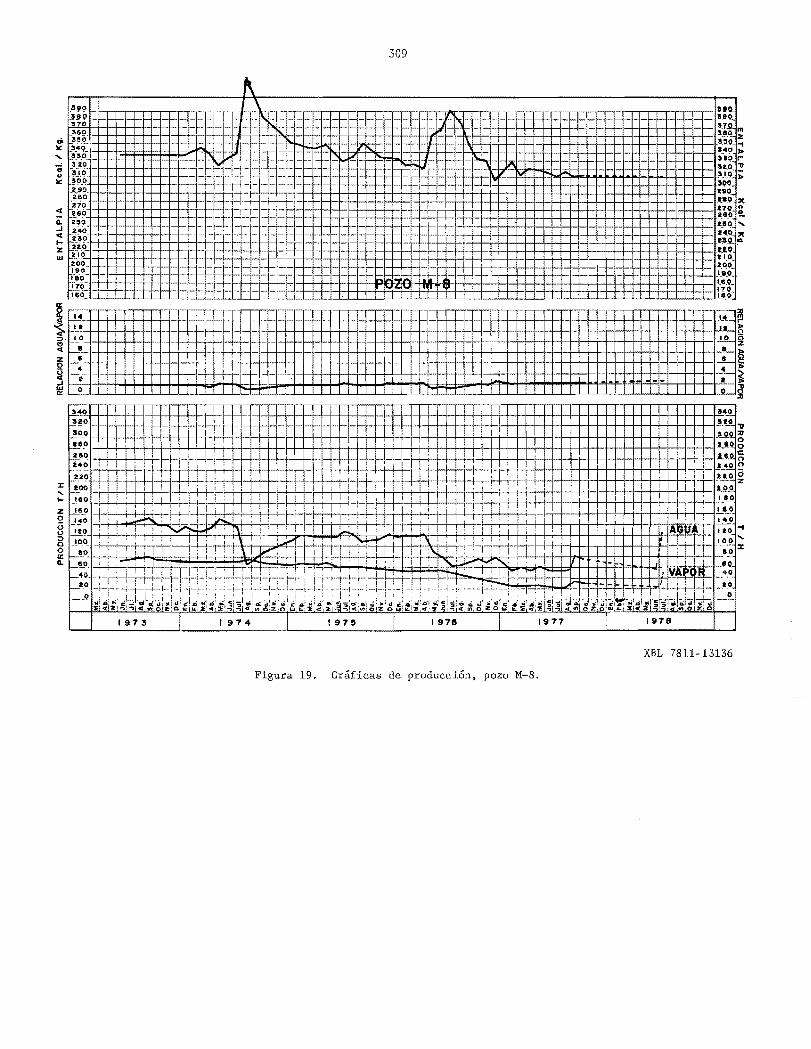
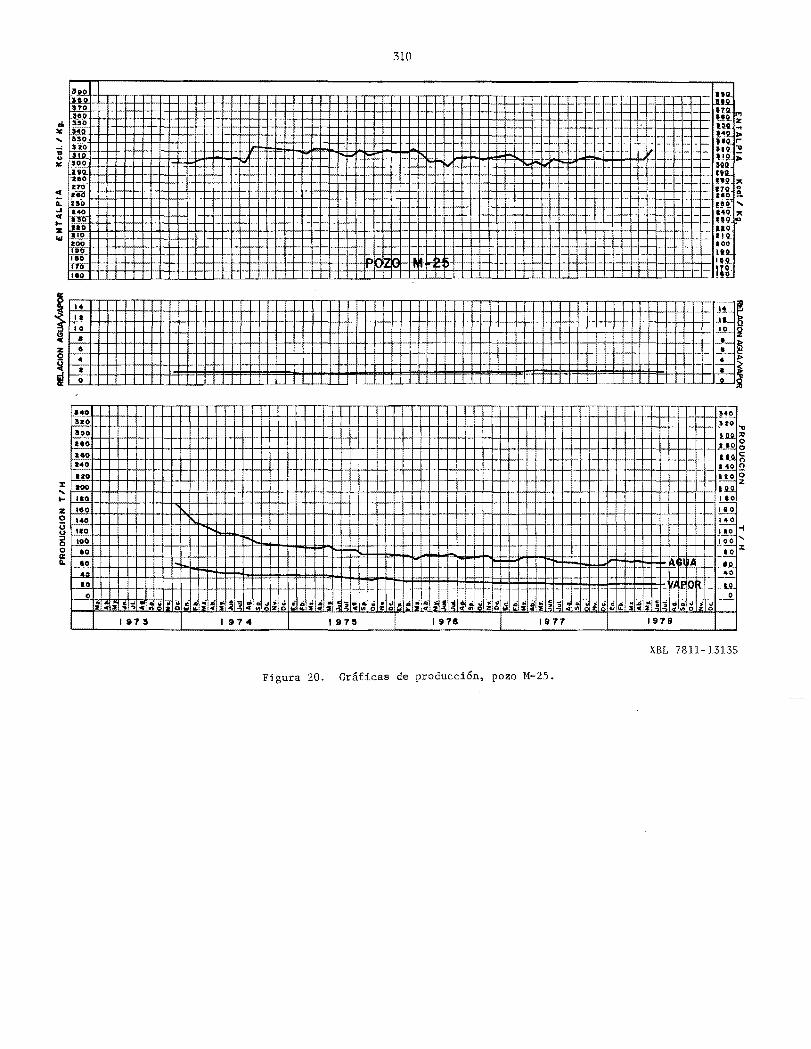
III
310
ltII(
~ 1-=+++-+ ~ ~~=tttttt1=tt ~
r-=-+-t-+-+-+-Wll-~RfFf r-mm-t+-HiHi+i+H-t+H-t+H-H-++f-t+H-t+-t-H+-HH-t+-H- ~Li ~H+~~++HH++~~~~~H+++Hrttt I---O-t-H-t-+-H-t-H--tl-tII++shy1+-t-H-+1-++++H-+-t-+++-r- [-+-HIHI-+I+H~I++-
dJplusmnplusmn ~2 I 1t-+++-t-+-+-iH-++m+t+t+++-H-H - --- ~
r L omiddot ~ I IIL-L----------~--------J i
XBL 7811-13135
Figura 20 Graficas de producci6n pozo M-25
311
II J
z
DO 80 ~~ 570 380 0 W 00 m aso
11~lIZO ~=-$ro 0-middotaoo
Luo 160 iii= 170 ii~80 250 mR=Fff Zit 140 lao 110I~ ato ~ 110 100 ~~ 1110 I~110 1-1=70 - Inlilt ~rllO
H 14 It II
10 10
bullbull 1- shybull
4
bull a 0 I~
~ ~ aoo r-a-o
1110 140
110
100
180
80 140
110
~~o 0 eo 4Q 10
0
Iii
I I I I I I I
bull -
bullI I I
tttttmI I I
-
~ oW -~gt tici M l -~ I~ c A I~i= l iu AV -~ c 0 iii - -I~Iltf Z 0 2 ZQ 0 ZQ 1973 1974 19711 19741 1977
I
~ -i ~~ ~N -e
z 1
I I~
V PHI
i ~ 0 ~~ ~Z bull 0
1978
540
~~ soo
Q1Ill 40
110
1100 ro lao 40
110
~ 0
fit 40
--Q
0
V 21 o o c () ()
o zc
z ~ o o ) o o ~ II
XBL 7811-13134
Figura 21 Graficas de produccion pozo M-30
312
lIi
a J
Z III
5eo 8ltgt S10 aso 550 40 no S20 alo 500
1100 18ltgt 170 leo no 140 230 no 0 100 180 180 110 leo
U
no
~~I~f ~~~ lao
IS
10
~ ~~~~~1-~~1-~-r+-rt~+shy ~rrr+~~~rrT+~~~rrr+++~~rrt-~~~1 ~+-~4-~4-~~~~+-~4-~~~~~~~~4-~~sect
~ I----++-+-t-t-+-HI-++-I-+OH-t-Hshy ~~~~~~L~~~~~LLLWWW~~~~
540 510
soo a80
allo 0
110 J 00 180
z leo
~ ~~~t=ctJt~~=t~tl=tl=tl~~~~~t~~~~~~tj~~~~~tjtJ~~~~~~t~~~~~~g ~O~deg1-~1-+-~1-+4-+1-rt~+-rt~+-~1-+4-+4-+~-r+-rt~+-~1-~-+1-~-r1-rt~+4-+shy 1+-~~~4-~~~
f ~~~fl~t=~~~=t~~=t1=tl=tl=~=t~=f~~~~~tt~~t1t~~~~~~~~~~~ 10
o
1973 1974 197~ 1978
XBL 7811-13133
Figura 22 Graficas de produccion pozo M-31
313
u
17 80
Iii 140
~
s 10 r 100 i n lit
n 10 0 no 140 0
C I Raolegt Oft bull 110
110 ~ 10010shy ~ 110 j110 riYft rIo r1TO
IUO
~~~~~~~~4-~~~~~~~4-~-+4-~~~~~+1~4-~~-4-~~1~~-r~rt~I~~og
~~~~~~~+-~~~~4-~~+-~~~~+-~~4-~~+-~~~~4-i-1-+4-~~~U4~0 cg ttO O
zz 00 110
z 10 0
140U u 110 Q 100 0 G 0 tIL 80
4~ 40 act I 0 o
19711 974 975 1978 1977 1978
XBL 7811-13132
Figura 23 Gr~ficas de produccion pozo M-34
314
0
shy 0
gtt n
2shyii 180 shyJ 140 gtt
flO O UQZ tl(111
200 - - aoo 190 - voGOshy 80_f7oshy 170
fti~ 0
14
12
gt I~-lii bull z e 2 4i ItIii no
XBL 7811-13131
Figura 24 Graficas de produccion pozo M-3S
315
XBL 7811-13130
Figura 25 Graficas de produccion pozo M-21A
316
iii
i iii I~~+++m~~jtt C(ii 1-4-1--I--l~
J
z
r
z o
~ o
~--II
10
bull m- ttm
f ~~4~~r+-I-~-r~+4~~I-+-+-
I I I I I I I I
I mi-f_1L
- 10
i--shy
fm=m -shyL
JJ I
I I I - IJL
XBL 7811-13129
Figura 26 Graficas de produccion pozo M-27
317
JI_~Q 550 5-40shy
280
c ii I C Z W
8~ ~~_Q570
3S0 -20
r-O 500
11110
270 illo 250 240
rf9210 110 200
r~_o 180
Crro 180
14
r--I 10
bull 8
4
I
0
r-~O ~o
oo 180
~o ~_o
liD
~ ---o ~9 ~ O ---00
80
ltO -shy -Q
---~ III a_e~ z U0-i a_~o _s_ao r SlJ 11 810
15_09 lit
no n 180 1_00 140 lit I~ltgt-_uo 110 100
I_~Ie 170 ~_I
14
~ 10
bull 8
~-I
I 0
S~~ _s~ 11 _uo u
0 _I_~ ltgt _Ll c-shy n 140 n
I_~ 0 z
1_9_9 liD
I 0
I~~ 110 -i
_1_00
10
_f_O 40 -- shy
__ 111
~-
I 7 3 I 1 4 I 1 II I 18 I 9 11 I 918
XBL 7811-13128
Figura 27 Graficas de produccion pozo M-45
I~_~ _II_~
318
so Ull 570 360 560 540
~o 520
r-O ~~ iii) ~o270 260 250 140
~jgtno r~100lee liomiddot fio 160
14 II
10
bull _6
4- shyIt
-0
140 _1I~0
100
u(I
m
l I
t-t~~r+~+-I-+4-+4-+4-~-+-
III
t~
bull
~ -tmiddota~~ 5tO 140iaQ 1I~l
3~~ 1-t-It~I- 89Ishy 110
169
~ I~O nQ
bull III 100
to 811 170 )
-I-~I-JL _-tlL
bullbull 4 It - 0
C
II - 4 Z 1amp1
XBL 7811-13127
Figura 28 Graficas de produccion pozo M-46
Este mismo comportamiento se aprecia en shylos pozos M-14 (Fig29) r M-26 (Fig30) en los cuales se presento una aportacion shydel yacimiento en estratos superiores deshybido a roturas de tuberias 10 cual fue causa de un incremento en el porcentaje de agua extralda
La r la general de comportamiento de disshyminuc de entalpia en los pozos est~ s~
jeta a ciertas excepciones claramente def nidas como son por ejempl0 los pozos M-ll M-19 Y M-20 en los cuales se presenta un aumento de entalpia El pozo M-ll (Fig 31) entro a producir inicialmente con dos zonas abiertas una inferior (1138-1211 m) y otra superior (872-964 m) causa por la cual el pozo se incrusto idamente Se procedio a limpiarlo y obturar la zona sushyperior ademas de una rotura de tuberia en contrada a 750 m Esta operacion se efec=shy
tuo introduciendo tuberia de produccion de 5O con 10 cual el pozo qued6 produciendo de la zona inferior y aunque su producci6n fue menor se incremento su entalpia
El pozo M-19A (Fig 32) inicio su producshycion teniendo obturado con cemento 200 m de la parte inferior de la tuberia ranurashyda a los cinco meses de produccion extra jo dicho cemento aumentardo su produccion de vapor y su ental pia
El pozo M-2~ (Fig 33) despues de 4 anos de produccion e ir disminuyendo lentamente su entalpia y gasto de vapor disminuya bitamente la produccian de vapor y en ma-shyyor proporcion el agua por 10 tanto au-shymenta su entalpia Esto se debia probab mente a la incrustacian rovocada por la entrada de colgadas a
flujo a 850 m l
tr s de las tuberias
319
x
- It~~ml=l+t=p tt+tt+t+II
C II J C ~~ttI~=tHt
14 I II I I
~ 4
-i
~
I
I I I
m ffi I
I I I
1ampmiddotI lIE
tit I i
14 II
10
bull
III 540 5Z0
11 1500 u 10
0 0
~LU c - - n 40 n tto 0
L~ z
I O
XBL 7811-13126
Figura 29 Graficas de produccion pozo M-14
320
C II ~-iH-++shyI c ~ z
~
Z 0 U U ) Q 0 II II
10 leo 140
110 lOCI 10 10
XBL 7811-13125
Figura 30 Graficas de produccion pozo M-26
0
321
14
~lII 10
bullbull bull 4 4 1 It
0 149 ~_O
aoo~ ~al 140
110 ~ ao z lao 0 140U U ItO )
10lt1Q 0 100 II
XBL 7811-13124
Figura 31 Graficas de produccion pozo M-ll
322
1 ~ ~ if
0 IlI80 la70 IlIlIO
14 It 10
bullbull 4 I
0
~~
~ III 110 j
0 bull ao
I I I I I
I I I I 40 ~ Hoi
1100
110
bullbull0
XBL 7811-13123
Figura 32 Graficas de produccion pozo Jgt1-19A
323
C
L I C ~~4ttttttttttttt=1=t=
I ~ ~~t~rt~~~~~ U g Q o II L
to -I -t-r+rt-r+-ri-t+-~-t-t-rr-r+-rIClO
~~~plusmnplusmn=tti-rt1~t-rti-rt-rti-ri=~ _0 40
XBL 7811-13122
Figura 33 Graficas de produccion pozo M-20
D~ntro de los pozos en explotacion tene-shymos algunos que han dec1inado rapidamente su produccion encontrandose en estos inshycrustada la tuberfa de produccion aparenshytemente por invasion de agua de menor temshyperatura Estos pozos son el M-ll (Fig 31) M-9 (Fig 34) M-15A (Fig35) M-39 (Fig 36) el M-29 (Fig 37) antes de reshyperforarlo
OBSERVACIONES GENERALES
Durante la perforacion de pozos geotermi-shycos es muy probable que se tengan mayores y mas frecuentes perdidas de lodos de cirshyculacion siendo estas de mayor proporcion conforme se acerque a la zona mas explotashyda asimismo sera necesario un mayor do durante las cementaciones de las tube-shyrfas debido a la cafda de presion del ya~
cimiento ya que las columnas hidrostaticas que pueda soportar estas seran menores
Dnrante la induccion de pozos sera necesa rio equipo de mayor capacidad ya que la ~ profundidad de los niveles de agua seran mayores esto es cuanto mas cerca ~ste el pozo de la zona explotada mayor sera la pro fundidad de los niveles de equilibrio del shyagua del pozo sin fluir
La correlacion de datos qulmicos para de-shyterrninacion de entalpia deberan ser toma-shydos con reservas ya que no todos los pozos extraen agua del yacimiento sino rnezcla y no sera valida en aquellos pozos en don~ la entalpia sea alta 0 sea es preferente el flujo de vapor al del agua en el yaci-shymiento ya que ademas puede haber un equishylibrio en la fase llquida con depositacion de sales por evaporacion de agua por disshy
324
a40 ao aoo 0 eo 1140
aao
aoo
Ishy lao z leo S ~E tl-ip A 0 0 140 140U ItoU )
100a 0 0II L eo
6 ao
0
XBL 7811~13121
Figura 34 Graficas de produccion pozo M-9
325
CI ltC
~ II Iil 0
z ~
z 2 u u ~ 0 0 0 II
4 II 0
14
_10
bull 4
II
a~ ~_O
aoo no
~ i ~ 1gt
~ ~
XBL 7811-13120
Figura 35 Graficas de produccion pozo M-15A
326
01180 a 1117shy110 ~8 r- z
0 -t II S40 140 ~ ISO ~ ~- II 100
un II 0 no It
It170 noDC 110
1110ii no oJ 140 ri40 CrtTC 110 110 ~ 110 ~
100 180 ~~ 10 shy
170 17shy110
l~ 14 1 ~
10 10 iabull 4 bull et1j[tttijjj~plusmnlJJ~tplusmni~~~tplusmnplusmnplusmnjjtttplusmnij=tttplusmnplusmnjj~~~~~tttj~~tt~~t+~~~++~~~I ~ i~OLLUU~~LLUU~~LLLU~~LLLUUU~~LLLU~~LLLU~~~LLLU~~LLLL~~
140 110
I 110
Ia
0 g c n140 140 n
110 0110 Z ~ 100 100
110 110 Z 180 110 o 140 140
-t110~ ~11~O~~~~~~~~~~~~~middot4-~~~~~+-~~~-+~~~+-~~r~~~-+4-~~+-~~~~~~-+~~~4-~~+-~~ 1001~O~O~~4-~Lf4-~~4-~~~~~~rF4-~~+-~4-~-+4-~~~~~I~Lf4-~~4-~~~~4-~Lf4-~-+4-~-++-~-f~ Z10~ ~~0~~~~-+4-~~4-~~~-+~~~~~~+-~~~-+~~~~~~~-+~+4~4-~~~~~~-+~~-+4-~~+-~-+~ 40~ ~~~oct=tt~~=t~t4~~I-i=tijtt=ttj~~ti=tttt=ttj=tjti=tjjti=tjj~jttj=tj=tt=tijti=tij=tjtj=tj=ti=ti=tt=t~
~-~ ~ 10 0--~ V~~OF 1~dI~~~~~amprt~~~~hh~~~~~~~bh~~~~~
bull c =l cl U - DII -I =1 -p c Ij~ ~ ~ i -~ i -~Il ~ ~ ~ gli I cl 11r c i g bull D 051 fHjlU ~I IH ~ t ~ Ii 1 Ii g
XBL 7811-13119
Figura 36 Graficas de produccion pozo M-39
327
or shy or
ltII
II I ltII III III
shy III
I o
o CI II
IIH ~io 370 3--0 350 3middot~9 ~~O 320
41deg300 299 280
--o --l0 250
f 220
~ ZOO 1amp0middot 180middot 170 180
14 I
10
bull 8
~ bull
~l9 4 CO ~o
C 140
p1 too
~C 80
J~O Ito
~o_ _10
_10 _40 _~1 I
r~ ~~ ~iC
bullm FF ~
S E PU -=mi
i
IGU
I bull i shy -1 I
~~ ~iIl=lg~ ~I~~r~~f I
c I~ ~ 1~Ig~ c tco
173 1974 19715
m
shy
OIV
iiiPOZ ~tlr
I
tbt I
I~middotI ~ll ~~Ilili~ill~ II c ~IZCIW jl-a ~ II~ al~ i oi
1t7e 77
M I(~II
c~t1w S~2 II~ ~ 0 i~ 15178
~UII
~ ~sjo
i~ lIr9 110
~~ 11119
mmiddot 0 I~O 140
~etO aoo 1Ji 109u 14
II
-LshybullL 4 II
0
$~ Iro
1100
1M IU
0
HJ L~
I~140
110
~
t-I -~~
4 _19
I-I
o o c () ()
z
minucion de la presion
XBL 7811-13118
Figura 37 Graficas de produccion pozo M-29
en el yacimiento - shy(Fig38) Por 10 tanto las correlaciones e 1ndices NaK Si Na-K-Ca no coinciden shycon las entalpias medidas
La disminucion de produccion qe vapor de shylos pozos puede ser debido ei parte a la calda de presion de los estratos explota-shydos p~r ser menor la capacidad de aportashycion del yacimiento respecto al fluido ex traldo
La disminucion de entalpia de los pozos - shypuede ser a 1a aportacion de estratos sup~ rio res 0 inferiores de las explotadas de shymenor temperatura y por la ca1da de pre-shysion de los estratos permite su aportacion
La vida util de las tuberlas de produccion se vera acortada debido a que la corrosion y temperatura reducen su capacidad al colaE so 0 rotura que aunado a la caida de preshy
sian dentro del pozo p~r efecto de caida shyde presion del yacimiento se obtienen dishyferenciales de presion entre el interior shydel pozo y los estratos no explotados que trataran de romper dichas tuber1as Aforshytunadamente estos problemas seran princishypalmente en la parte profunda delmiddotpozo
Estos problemas seran menores en los nue-shyvos pozos ya que actualmente se lleva a cabo un programa de instalacion de tube--shyrlas de mayor capacidad a la rotura 0 co-shylapso
Como se ha observado en el comportamiento de los pozos en observacion y explotacion estos estan llegando a un equilibrio en shyel cual las variaciones de nivel produc-shycion y entalpia ya no sufren grandes varia ciones como en el inicio de la explotaci6n del campo len el inicio de produccion del pozo)
328
POZO ENTALPIA MAXIMA
ENTALPIA INICIAL
ENTALPIA ACTUAL
REGISTRO DE FONDO
ENTALPIA TMAX degC
M-5 341 340 308 303 287 M-8 432 336 311 312 293 M-11 342 306 340 308 290 M-14 346 346 288 321 300 M-15A 310 310 265 326 304 M-19A 376 295 310 333 309 M-20 420 310 420 306 289 I M-21A 510 500 328 337 312 M-25 318 305 310 319 300
M-26 380 328 295 323 301 M-27 I 447 447 340 326 304 M-29 286 285 286 290 272 M-30 350 312 300 308 290 M-31 355 338 310 311 292 M-34 255 245 245 337 312 M-35 344 344 321 305 328 M-42 294 250 288 316 296 M-45 452 452 388 342 315 M-46 442 442 373 333 309 M-53 398 398 374 548 342
XBL 7811-13147
Figure 38 Cerro Prieto variacion de enta1pfa (kca1kg) en pozos en produccion
Como se ha mencionado anteriormente los p~
zos tienden a estabi1izarse en sus caracte rlsticas de produccion asl como tambien en los nive1es de los pozos de observacion Doy las gracias a las autoridades de CFE 10 cua1 nos indicarla que el area esta 1 por la invitacion para participar en este gando a un equi1ibrio entre el flujo ext Simposio 10 cua1 es una somera interpret~
do y el aportado por el area circundante cion de los datos de campo asimismo agrashydezco la cooperacion de los Ingenieros de
Los cambios de condiciones de produccion - la Superintendencia de Produccion que sin seran menores conforme localicen los pozos 1a ayuda de ellos no hubiese sido posib1e de produccion a mayor distancia uno de otro la elaboracion del presente trabajo para no sobreexplotar una area reducida La sobreexplotacion provocara mayor cada de preSion en una ~rea confinada 10 que a su vez provocarfa infiltraciones de capas superiores 0 inferiores de menor temperat~ BIBLIOGRAFIA ra
1) Bermejo M FJ Interpretacion de reshyLas cadas de presion tambien seran meno-shy gistros temperatura y presion en po res conforme se lleve a cabo una reinyec-shy zos del campo geotermico Primera ~ cion del agua extrafda al yacimiento Reunion de Intercambio Tecnico San
Felipe BC (1977) Como se ha podido apreciar en el presente trabajo los cambios fsicos y termodinami 2) Bermejo M FJ Primer Curso sobre - shycos detectados son normales y producidos - Geotermia Mexicali BC (1976) principalmente por una sobreexp10tacion shyde una area reducida y no por una dec1inashy 3) Dominguez AB Bermejo M FJ Metoshycion por falta de capacidad del campo geoshy do actual para la apertura e inicio termico Estas variaciones son detectadas de explotacion de pozos en el campo en la mayorfa de los campos geotermicos en geotermico de Cerro Prieto Proc el mundo y no es una particularidad del - shy Second UN Symp Develop and Use shycampo geotermico de Cerro Prieto Geoth Resour pp 1619-1628 (1976)
329
4) Domin~uez AB Vital BF Repara-shy geotermico de Cerro Prieto Archivo cion y Control de Pozos Geotermicos CFE Coordinadora CP Dpto de en Cerro Prieto BC Second UN Produccion Symp Develop and Use Geoth Resour pp 1483-1495 (1976) 6) Navarro FJ EsquerCA Castillo B
F Reportes mediciones agua y vashy5) Cota TJ Castillo BF De la Cruz por de pozos geotermicos de Cerro - shy
F Reportes registros de presion y Prieto BC Archivo CFE Coordi temperatura de los pozos del campo - nadora CP Dpto de Produccion -
PHYSICAL AND THERMODYNAMIC CHANGES OBSERVED IN THE CERRO PRIETO GEOTHERMAL RESERVOIR
In April 1973 the Comisi~n Federal de Electricidad (CFE) began electric power generation at the Cerro Prieto geothermal plant using two turbines coupled to 375-MW generators requiring 730 tonhr of steam
The turbine uses steam from geothermal wells which extrct from the reservoir a water-steam mixture whose proportions vary from well to well At the surface the steam is eparated from the water by means of Webre centrifugal separators and conducted to the generating plant through different diameter pipes The steam flow is measured using orifices installed in these pipes (Figure 1) the water resulting from the centri shyfugal separation is led into a vertical silencer which discharges the water into a channel equipped with a weir to measure the water flow rate From 13 to 17 wells have been used to produced the steam necessary for the operation of the turbines
The full 75 MW were not produced when power generation began in April 1973 but was achieved gradually as wells were integrated into the system A power generating capacity of 75 MW was reached in February 1974 As can be seen in Figure 2 the rate of mixture extraction was rather low during the first few months and increased as more wells went into production
Physical and thermodynamic changes have occurred in the reservoir due to the extraction of the water-steam mixture These changes can also be detected in observation wells located in difshyferent parts of the geothermal field In these wells the drop in water levels has been observed reflecting the pressure reduction in the producing reservoir
In well M-6 (Figure 2) the water level fell 41 m between January 1973 and June 1978 in well M-46 it fell 534 m between March 1974 and March 1976 in well M-42 23 m between March 1974 and May 1976 in well M-29 14 m between May and December 1974 and in well M-38 46 m from March to August 1974 As shown in Figure 2 the water levels in all the wells fell rapidly during the first years of field exploitation but presently
the rate of drawdown has abated and the water level seems to be stabilizing
The production rate of the water-steam mixture from the wells (Figure 2) is now close to 2800 tonhr (total extraction to date is about 120000000 tons) creating a decrease in reservoir pressure which has caused the water in the strata to boil Therefore after the beginning of proshyduction in April 1973 most of the wells extracted a water-steam mixture from the reservoir even through reduced diameters This is indicated by the downhole logs taken in wells M-2lA M-27 M-14 M-45 and M-46 (Figure 4) The logs show there are no similarities in the bottom-hole pressures measured at the same depth This might be because of its position relative to the area under exploitation (Figure 3) and to the date the logs were run
The decrease in pressure in the producing reservoir is documented by a series of pressure logs taken in one well These logs indicate a drop in reservoir pressure since the field has been under production
The pressure logs of well M-25 with fluids flowing through a 2-in-diam regulated valve purger show a decrease of 248 kgcm2 in the bottom-hole pressure (Logs were taken from May 1973 to March 1976) Logs P-6 to P-IO obtained from November 1974 to May 1977 when the discharge was through a 3-in-diam orifice show a decrease of 223 kgcm2 in the bottom pressure In addishytion under these flow conditions the well produces a water-steam mixture from the reservoir (Figure 5)
The temperature and pressure logs (P-l and P-4) obtained for well M-30 (when it flowed through a 2-in-diam regulated valve from November 1973 to March 1976) showed a total presshysure drop of 130 kgcm2 and a temperature reducshytion of 90 C Likewise the logs measured in P-5 to P-7 from December 1974 to March 1976 with a 3-in-diam discharge showed a total pressure drop of 55 kgcm2 (Figure 6)
The pressure and temperature logs of well M-3l show a pressure reduction of 422 kgcm2 and a temperature drop of 15 0 C The logs were taken from July 1973 to November 1975 with the flow through a 2-in-diam regulated valve purger Furthermore in 1973 the well extracted water and in 1975 a water-steam mixture (Figure 7)
In the pressure and temperature logs taken from the same well from March 1970 to March 1976 and while flow was through a 3-in-diam orifice decreases of 233 kgcm2 in bottom-hole pressure and 2loC in temperature of the produced fluids were observed In 1970 this well produced water from the reservoir but later produced a watershysteam mixture (Figure 8)
The pressure logs of well M-21A taken while the well discharged through a 3-in-diam orifice (from April 1975 to May 1977) show a bottom-hole pressure reduction of 45 kgcm2 (Figure 9)
In 1970 before exploitation of the geothermal field had begun there were wells that had similar bottom-hole pressures and extracted hot water from the reservoir as shown in the logs of wells M-13 and M-5 taken when the flow was through a 2 12shyin-diam orifice (Figure 10)
Likewise the pressure logs in well M-8 (with a 2 12-in-diam discharge) show that in 1970 the well produced hot water from the reservoir In 1973 while discharging through a 2-in-diam purger the logs indicated that the well extracted a water-steam mixture from the reservoir (Figure 11)
Presently only the wells that are farthest away from the production area (for example M-53 M-50 M-90 and M-84) extract water from the resershyvoir This can be seen in the pressure logs Although the wells might be affected by the presshysure drop they have not yet extracted the steamshywater mixture when discharging through a 2-inshydiam purger (Figure 12) The most affect well within this group (see ) with water boiling closest to the slotted is M-84--perhaps because it is the nearest to the production area The pressure logs of wells M-5l and M-84 show that when flowed through 2- and 3-in-diam orifices respectively a water-steam mixture 1S produced from the reservoir (Figure 13)
The pressure drop in the formation due to water production brings about boiling near the well provided that under nonflowing conditions the well is near the thermodynamic equilibrium point of pressure and temperature The drop in pressure will increase as the flow becomes greater and the formation porosity decreases thus in-
the boiling in the formation
The pressure drop is not reflected in well M-5l as the 1973 and 1978 pressure logs show (Figure 14) Nevertheless some minor strata in its production zone might be affected (Figures 15 and 16)
WELL PRODUCTION CHARACTERISTICS
During the time the wells were under producshy~ion there has generally been a decrease in
enthalpy and a reduction in water and steam output as shown in 17 which was based on the production curves of separated steam and water The wells that show this decrease are M-5 (Figure 18) M-8 (Figure 19) M-25 20) M-30 (Figure 21) M-31 (Figure 22) M-34 (Figure 23) and M-35 (Figure 24)
In some wells there is a slight variation with respect to the mentioned behavior In them the amount of water has diminished instead of increased Therefore the enthalpy reduction has been larger than in the other wells These wells have rather high enthalpy at the beginning of production for example M-21A (Figure 25) M-27 (Figure 26) M-45 (Figure 29) and M-46 (Figure 28)
This same behavior is evident in wells M-14 (Figure 29) and M-26 (Figure 30) where an inflow from the reservoir in the upper layers occurred through fractures in the casing causing an increase in the percentage of produced water
The general rule of behavior regarding enthalpy reduction in the wells is subject to certain blearly defined exceptions--for instance wells M-ll M-19 and M-20 where an increase in enthalpy is observed Well M-ll (Figure 31) initially produced from two open zones--a lower one (1138-1211 m) and an upper one (872-964 m) This caused rapid scaling of the well The well was cleaned the upper zone was plugged in and a break in the casing at 750 m was repaired This operation was performed by installing a 5-in-diam production casing as a result of which the well continued producing from the lower area Even though the production decreased the enthalpy was increased
Well M-19A (Figure 32) began production with 200 m of the lower section of the slotted casing plugged with cement Five months after the cement was removed the wells steam production and enthalpy were 1
After four years of production and a gradual decrease of enthalpy and steam output well M-20 (Figure 33) suddenly showed a reduction in steam and (to a greater extent) water production resulting in an enthalpy increase This was probably caused by scaling brought about by the inflow through the casing hanging at 850 m l
Among the production wells some have shown a rapid output reduction In these wells scaling in the production was found apparently caused by the invasion lower-temperature water These wells are M-ll 31) M-9 (Figure 34) M-15A (Figure 35) M-39 36) and M-29 (Figure 37) before it was re-drilled l
GENERAL OBSERVATIONS
During drilling of geothermal wells loss of mue circulation is common This generally increases as wells get closer to the most exploited zone Due to the pressure drop in the reservoir it will be necessary to cement the casing with great care since the hydrostatic columns they can withstand will be decrease During the well inducshytion the use of equipment with higher capacity
331
will be necessary since the water level will be deeper depending on the wells proximity to the production area In a nonflowing well the closer the well is to the production area the deeper the static water level will be
The correlation of chemical data to determine enthalpy must be analyzed with caution since not all wells extract water from the reservoir Some wells extract a steam-water mixture so that this correlation will not be valid in those wells where enthalpy is high In other words in the reservoir the steam flow occurs more readily than water flow In addition there might be an equilibrium in the liquid phase with salt deposits due to boiling as a result of a reduction in reservoir pressure (Figure 38) Therefore the correlations and the Na-K-Si and Na-K-Ca indices do not agree with the measured enthalpies
The decrease in steam production might be due in part to the pressure drop in the exploited strata because of lower reservoir fluid production capacity
The enthalpy decrease in the wells could be partly due to the inflow from colder upper or lower strata that are not directly exploited This inflow is possible because of the pressure drop in the producing reservoirs
The life span of the production casings will be shortened because corrosion and high temperature reduce their resistance to collapse and fracture This and the reduction in pressure within the well (due to the drop in reservoir pressure) cause pressure differences between the inside of the well and the nonexploited strata and tend to break the casings Fortunately this will happen mainly in the deeper part of the well
These problems will be reduced in the new wells since a program has been impleshymented to install with higher capacity to withstand fracture and collapse
As the behavior of observation and production wells has shown they are reaching equilibrium When the wells start producing the variations in water level production rate and enthalpy are not as great as they were at the beginning of field exploitation
As already mentioned the production wells tend to stabilize their output characteristics Likewise the water levels stabilize in the obsershyvation wells This would indicate that the area is reaching an equilibrium between the fluid proshyduced and the recharge from the surrounding area
Changes in production conditions will be smaller as wells are drilled at greater distances from each other Over-exploitation in a small area would otherwise occur resulting in large pressure reduction and promoting infiltrations from colder upper or lower strata The pressure drop will also be smaller if the water produced from the is reinjected
SUMMARY
In this paper we have shown that the physical and thermodynamic changes detected are normal and are mainly the result of an over-exploitation of a reduced area and not due to a decline in the capashycity of the geothermal field These variations are found in most geothermal fields throughout the world and are not a peculiarity of the Cerro Prieto system
ACKNOWLEDGMENTS
We wish to thank the authorities of CFE for their kind invitation to participate in this symposium and present our interpretation of the field data We also wish to thank the engineers of the CFE production department for their coopershyation Without their help we would not have been able to prepare this paper
FIGURE CAPTIONS
Figure 1 Typical surface installations at a Cerro Prieto geothermal well
Figure 2 Production of steam-brine mixture and water level changes in observation wells at Cerro Prieto
Figure 3 Location of wells in the Cerro Prieto geothermal field
Figure 4 Downhole pressure logs wells M-2lA M-27 M-14 M-45 and M-46
Figure 5 Downhole pressure logs well M-25
Figure 6 Downhole pressure and temperature logs well M-30
7 Downhole pressure and temperature logs well M-31
8 Downhole pressure and temperature logs well M-3l
9 Downhole pressure logs well M-2IA
Figure 10 Downhole pressure logs wells M-13 and M-5
Figure 11 Downhole pressure logs well ~-8
Figure 12 Downhole pressure logs wells M-50 M-90 M-53 and M-84
Figure 13 Downhole pressure logs wells M-90 M-51 M-53 and M-84
14 Downhole pressure logs well M-51
Figure 15 Producing intervals Cerro Prieto wells
Figure 16 Producing intervals Cerro Prieto wells
332
Figure 17 Changes observed during production Figure 29 Production history well M-14
Figure 18 Production history well M-5 Figure 30 Production history well M-26
Figure 19 Production history well M-8 Figure 3l Production history well M-1l
Figure 20 Production history well M-25 Figure 32 Production history well M-19A
Figure 2l Production history well M-30 Figure 33 Production history well M-20
Figure 22 Production history well M-31 Figure 34 Production history well M-9
Figure 23 Production history well M-34 Figure 35 Production history well M-15A
Figure 24 Production history well M-35 Figure 36 Production history well M-39
Figure 25 Production history well M-2lA Figure 37 Production history well M-29
Figure 26 Production history well M-27 Figure 38 Enthalpy variations (kcalkg) in Cerro Prieto production wells
Figure 27 Production history well M-45
Figure 28 Production history well M-46
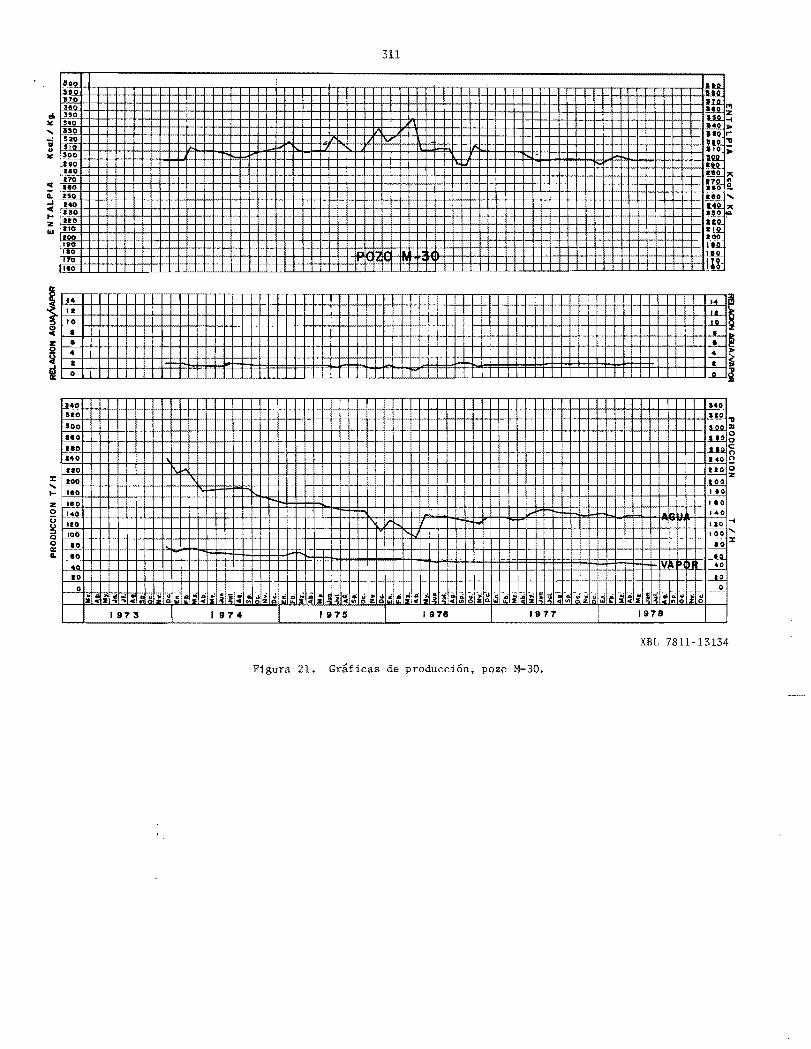
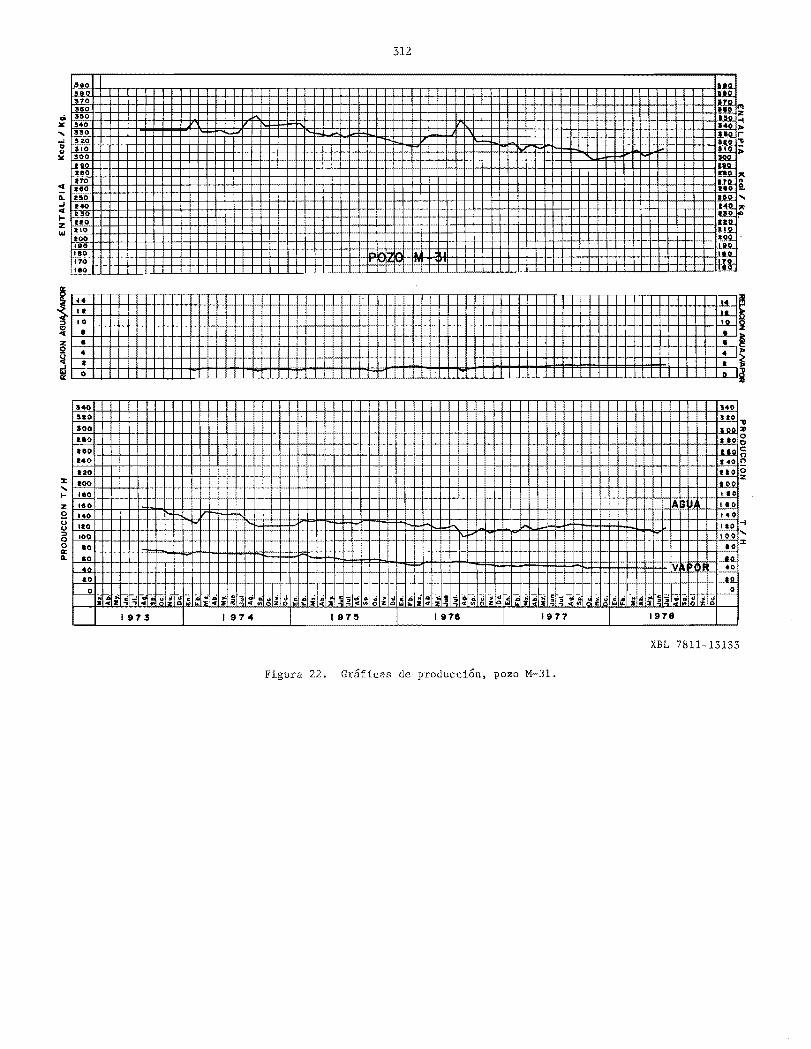
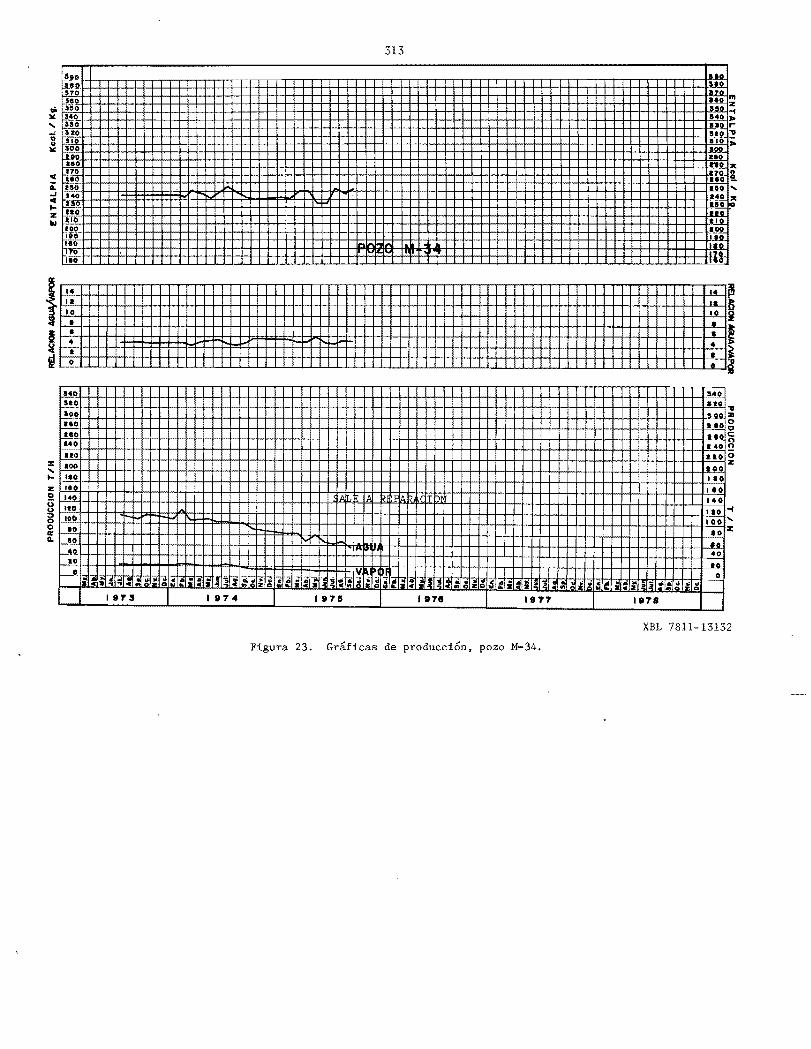
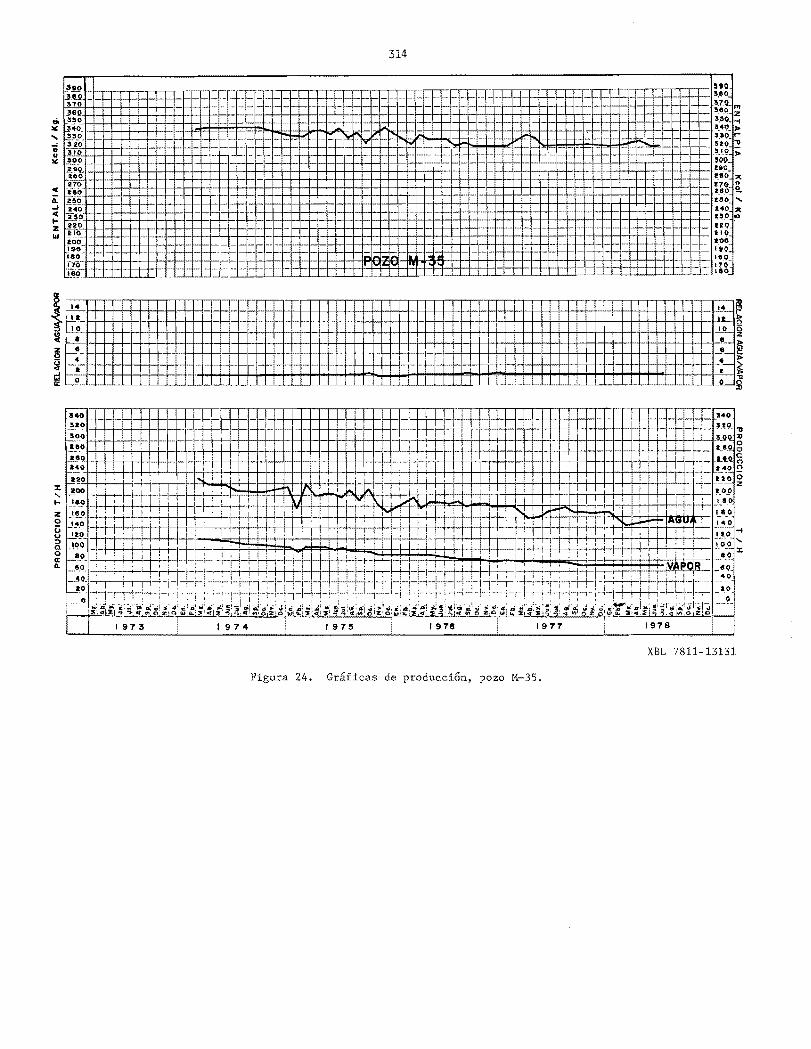
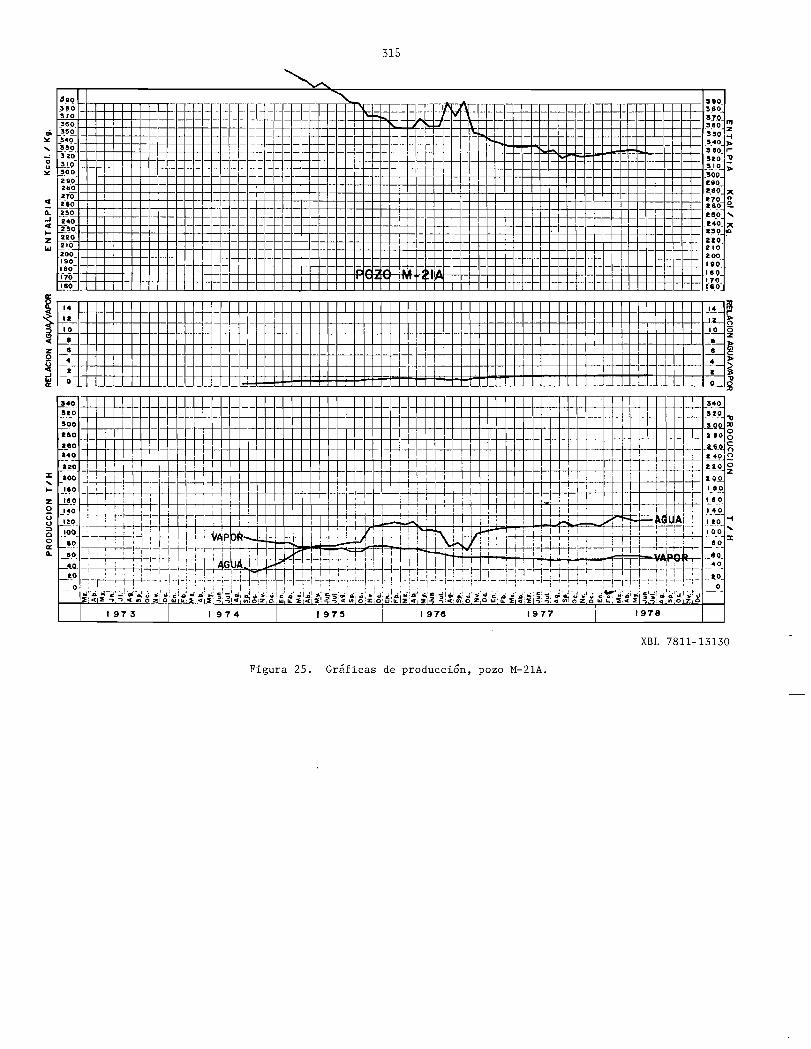
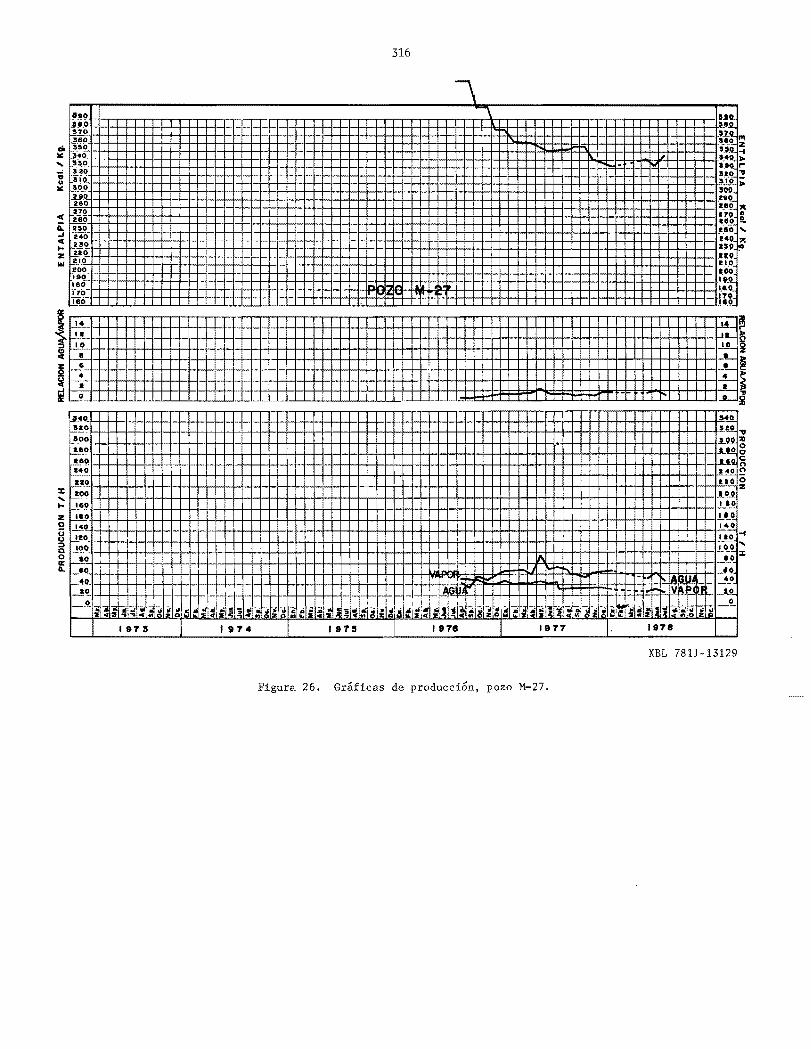
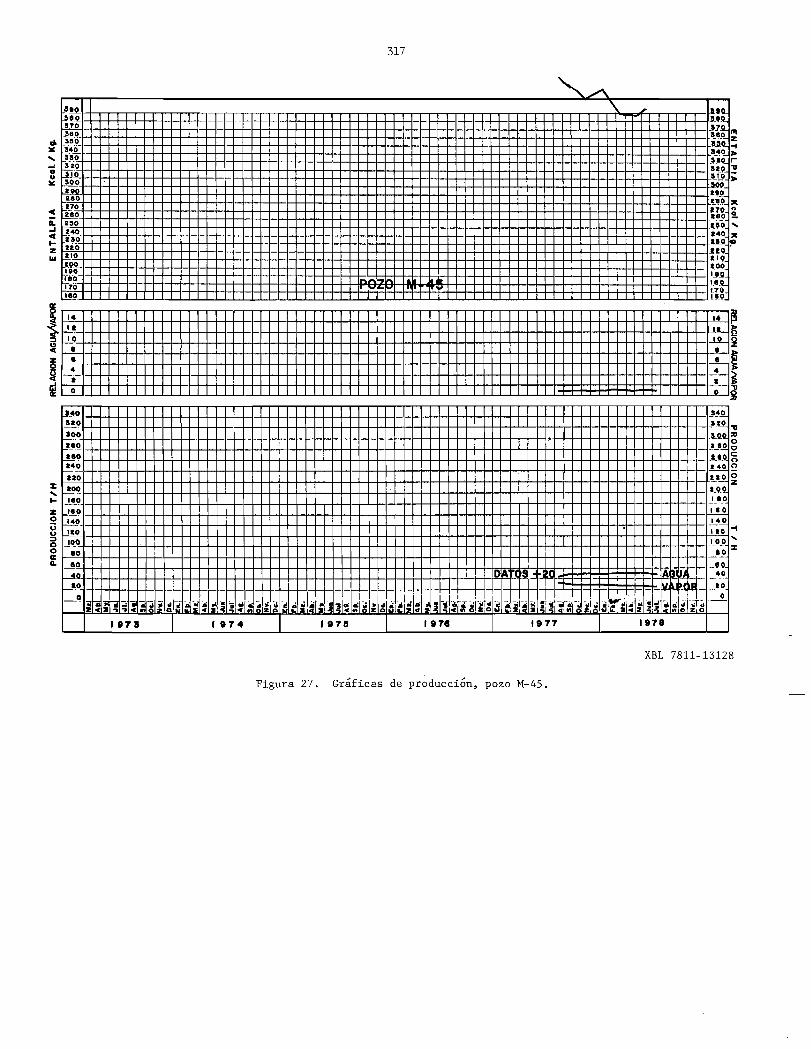
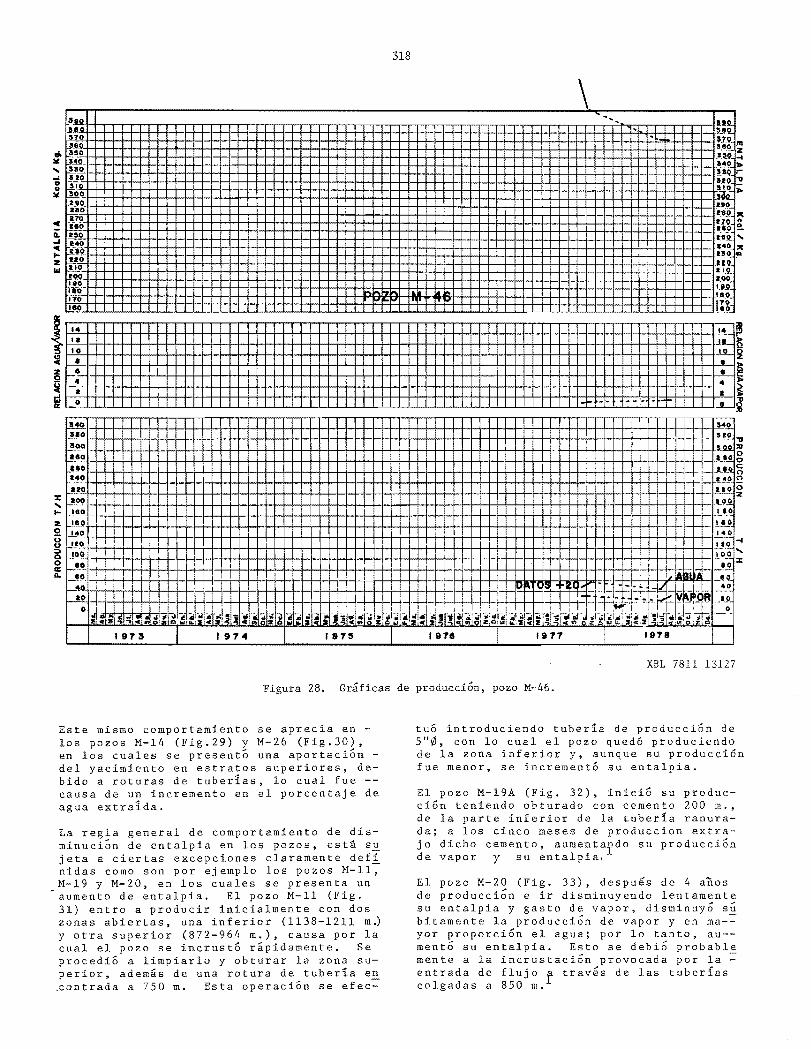
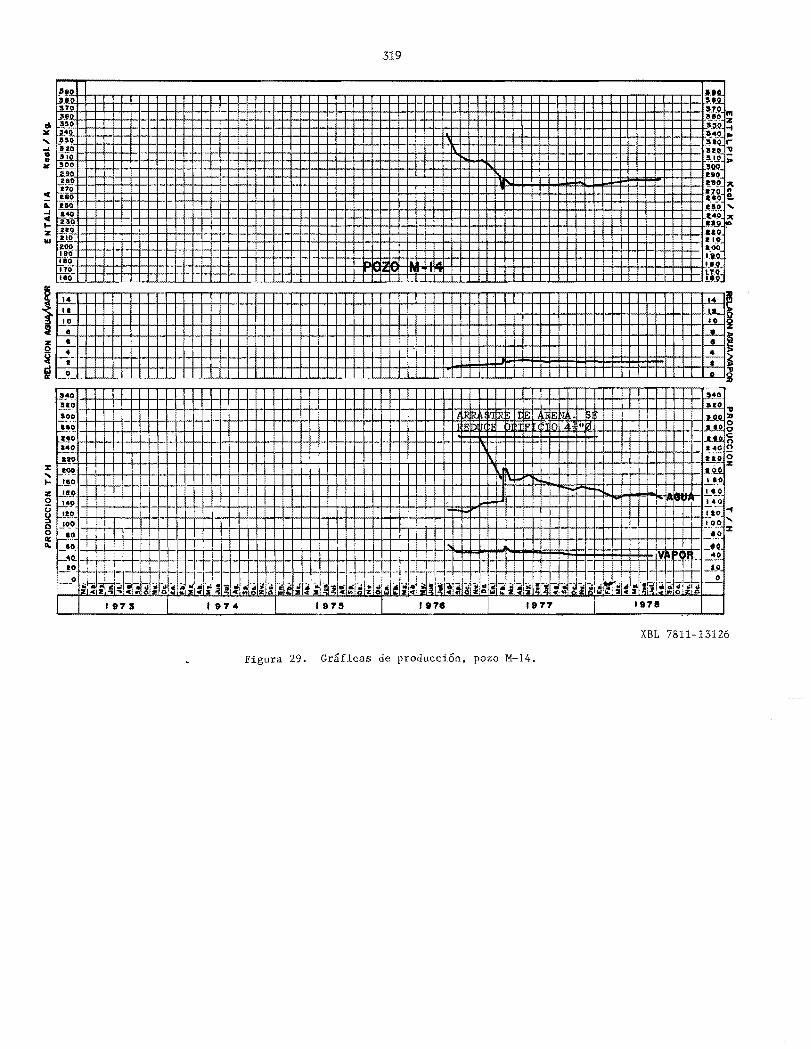
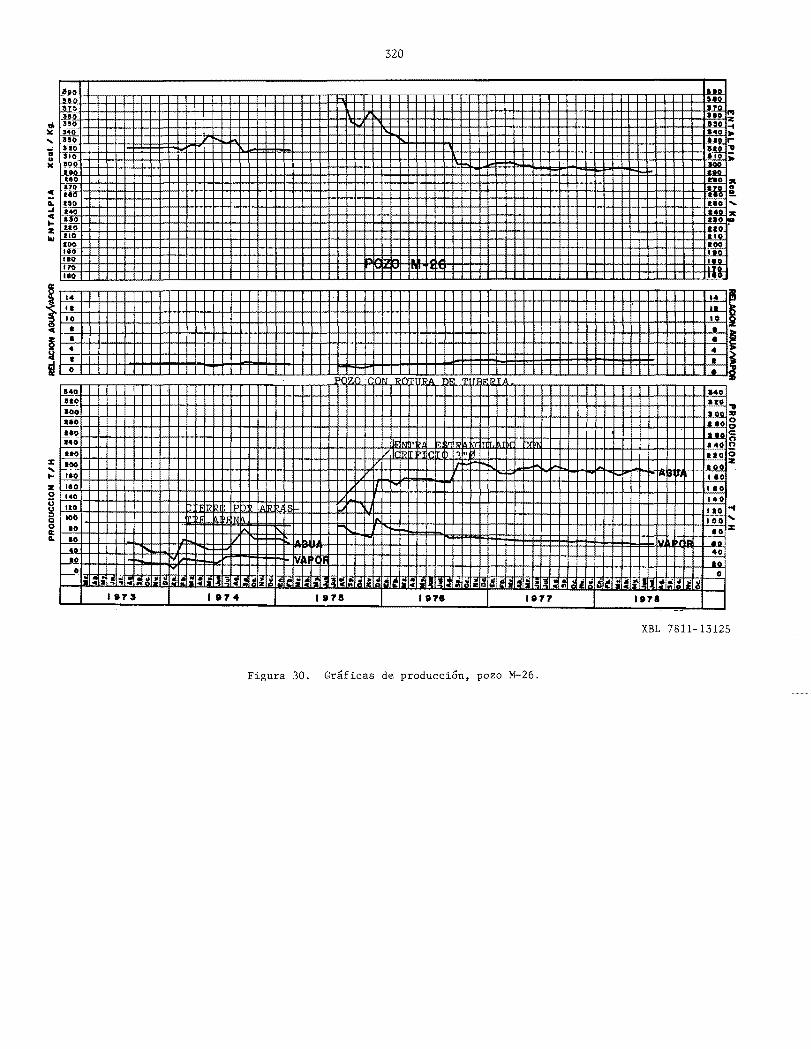
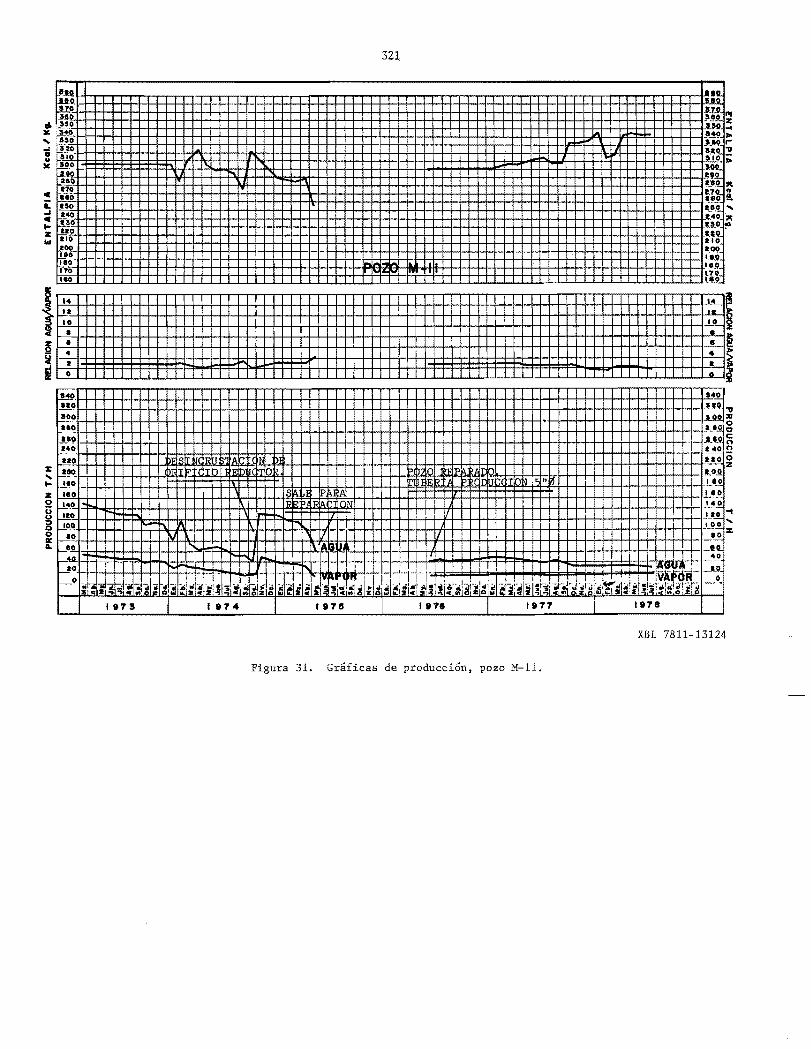
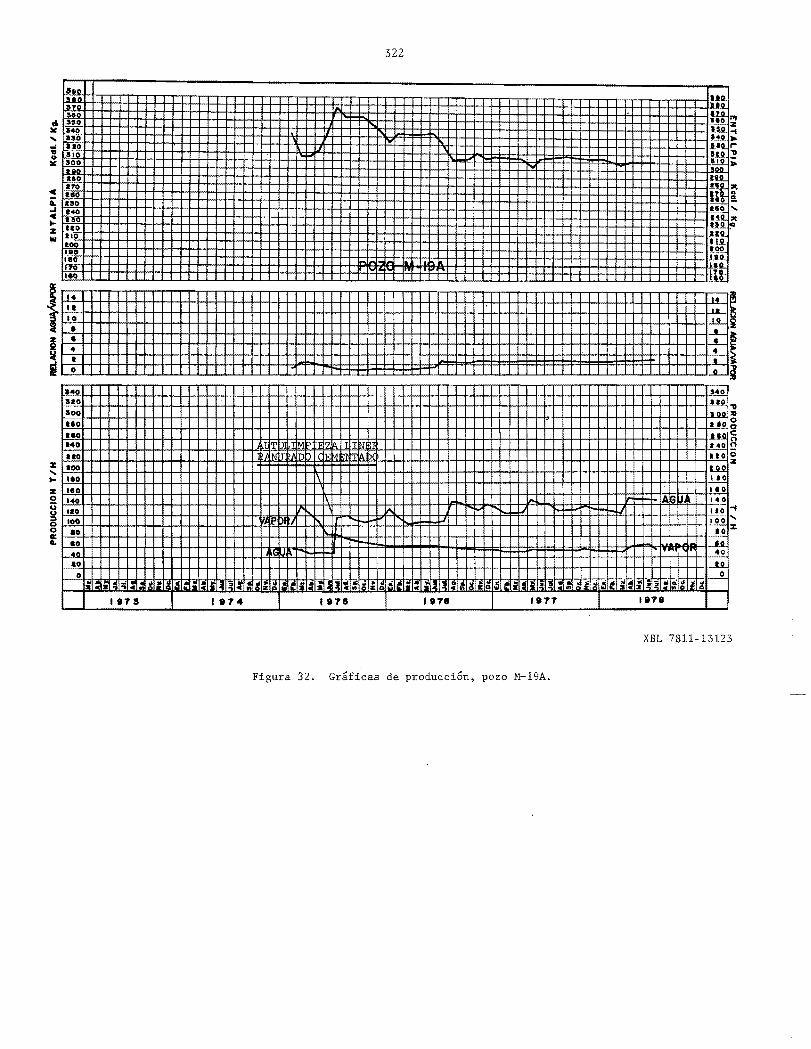
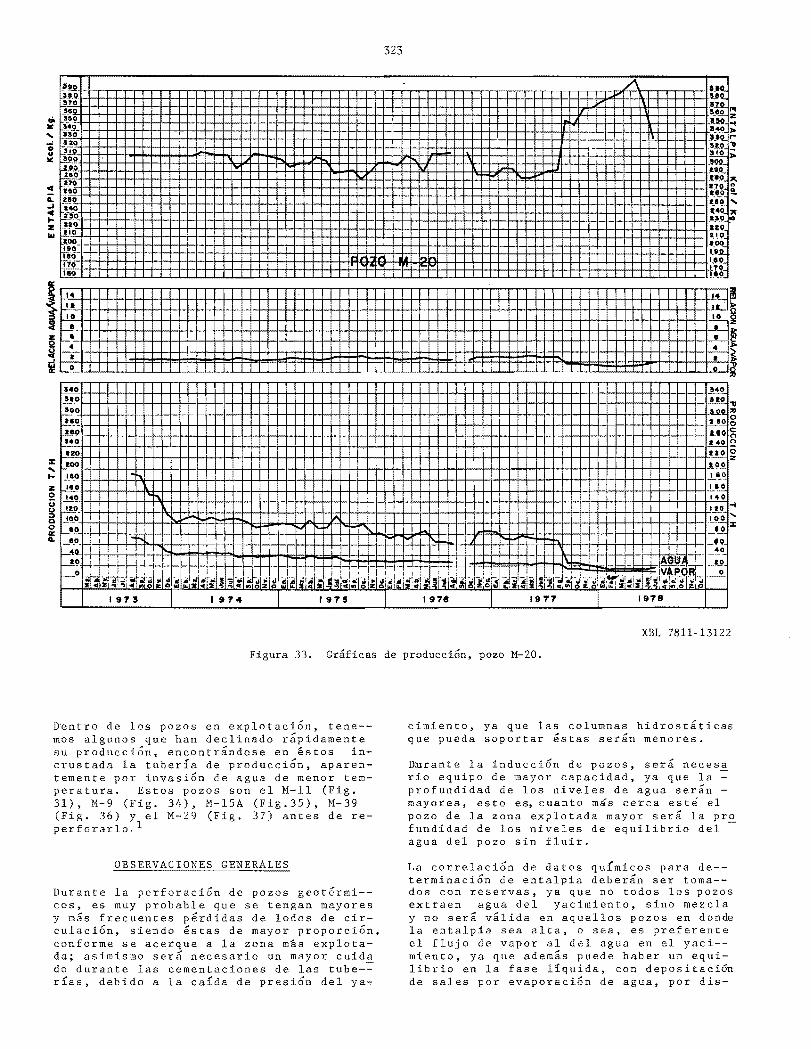
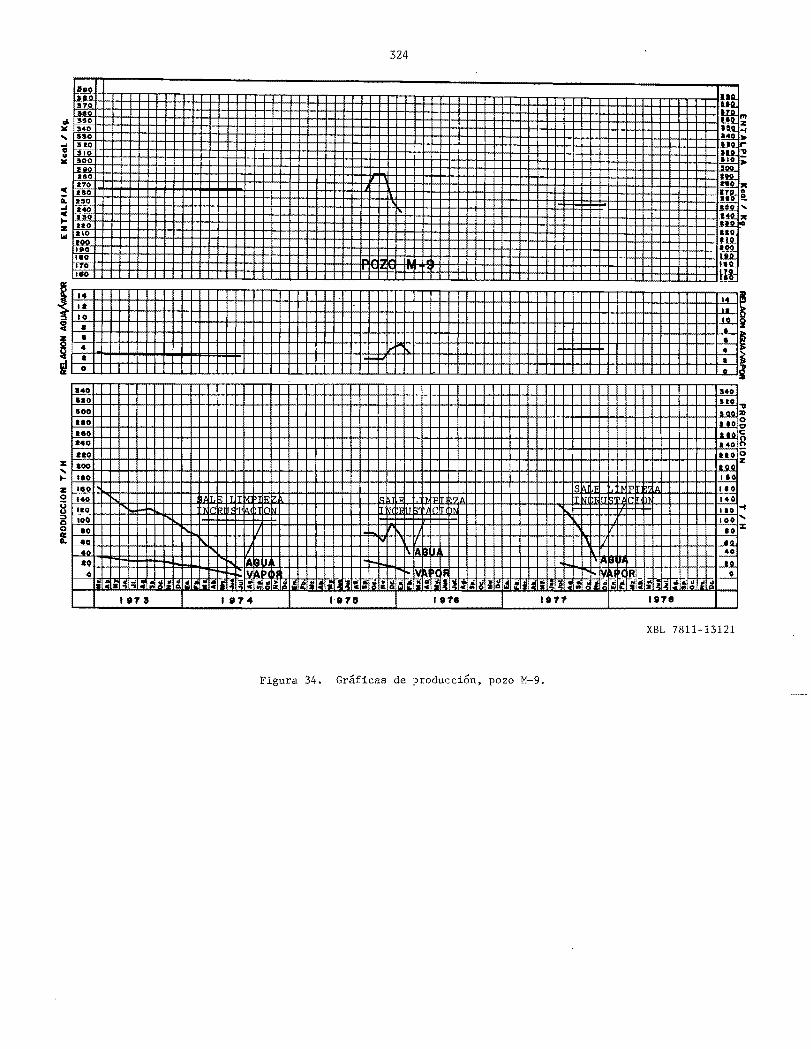
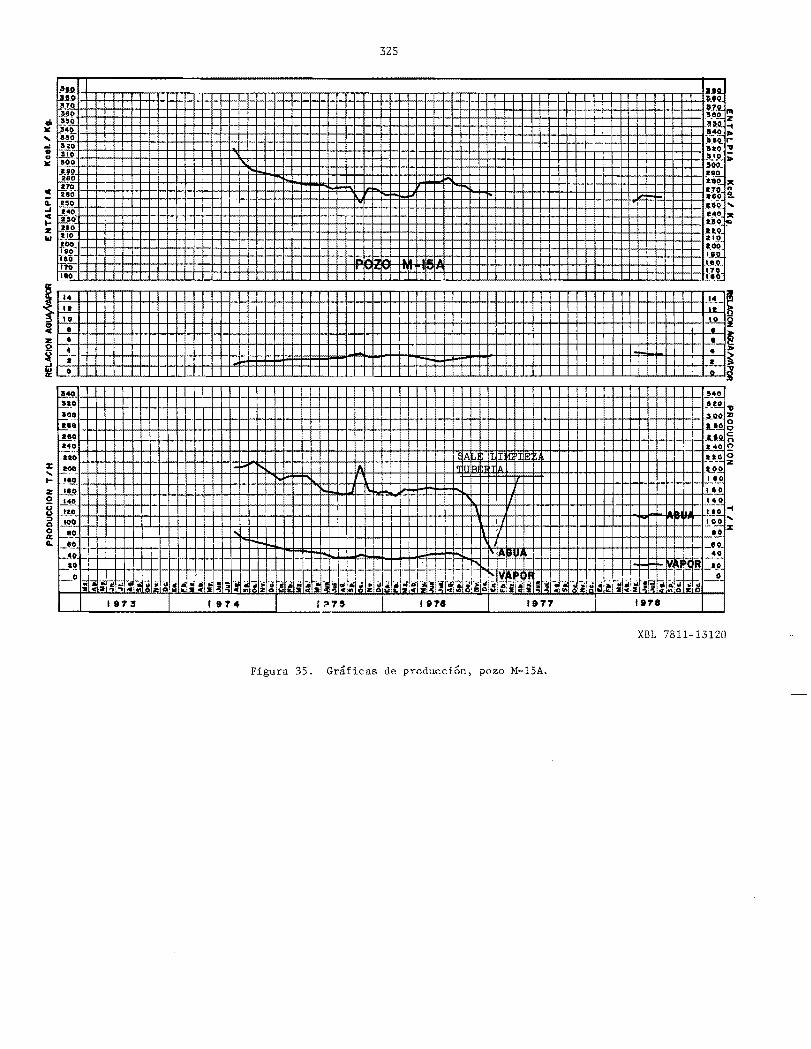
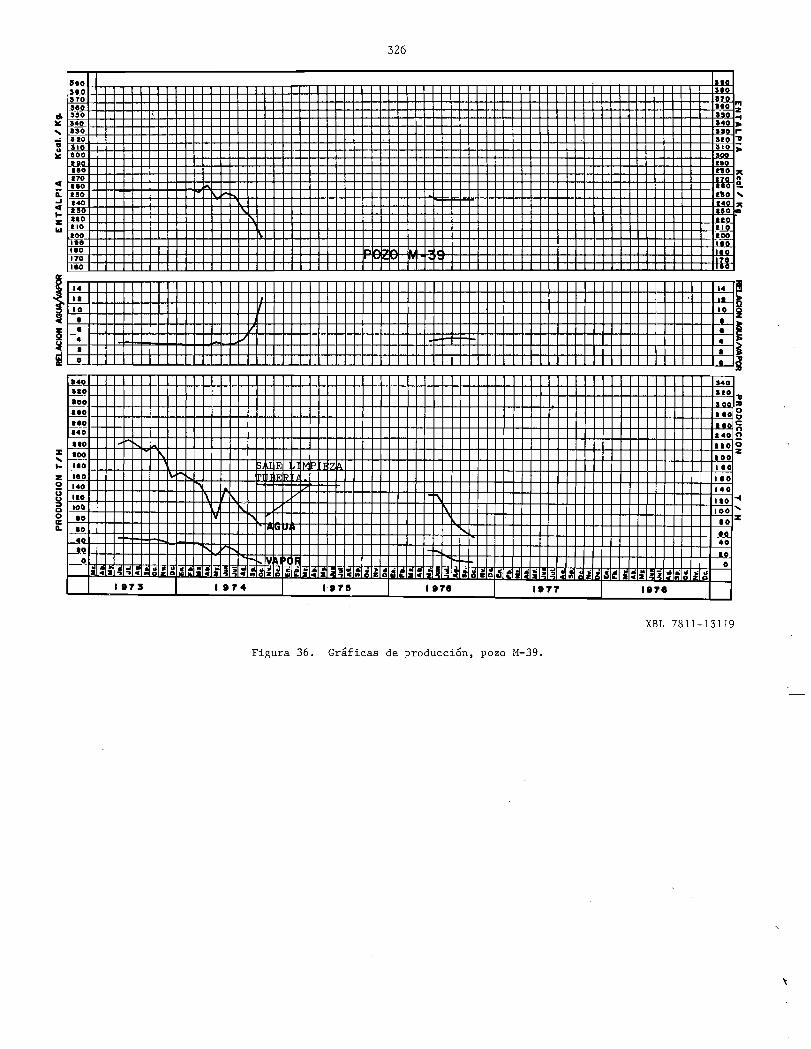
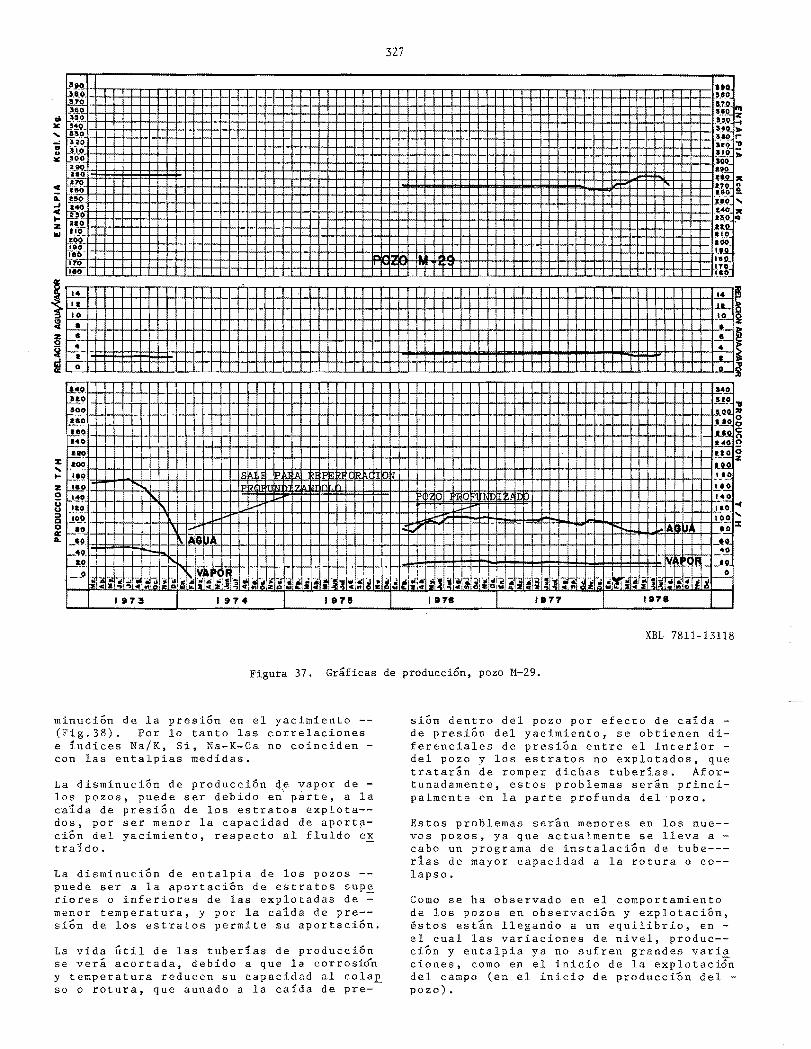
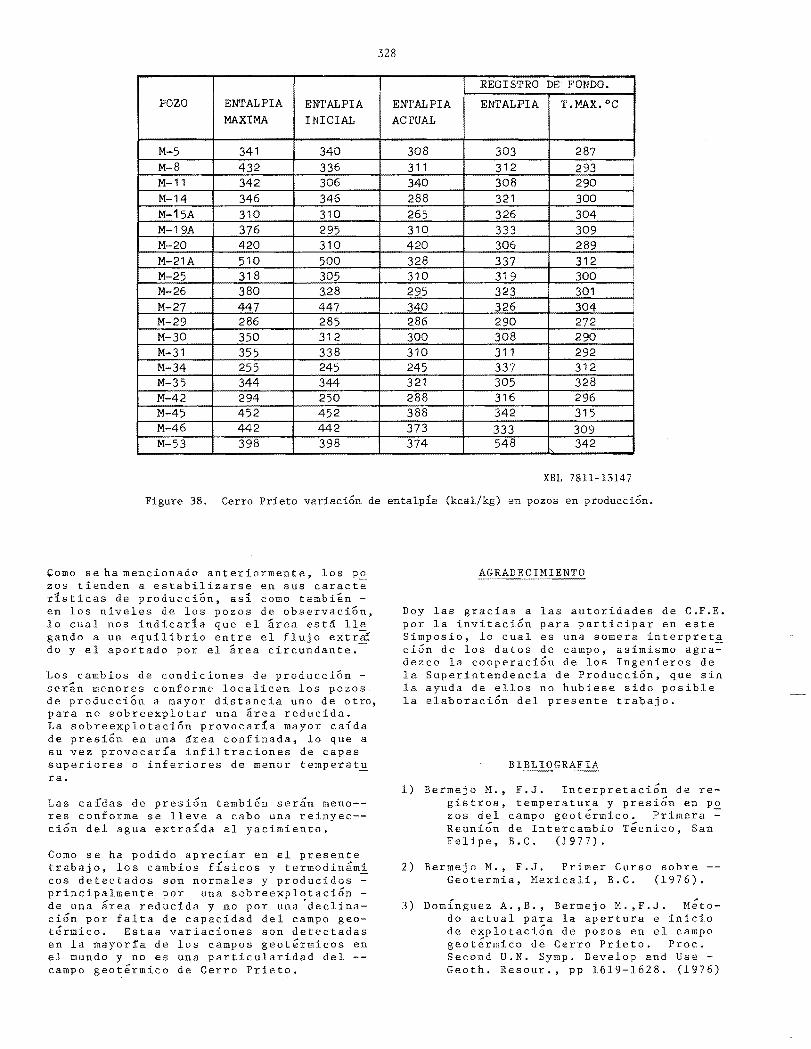
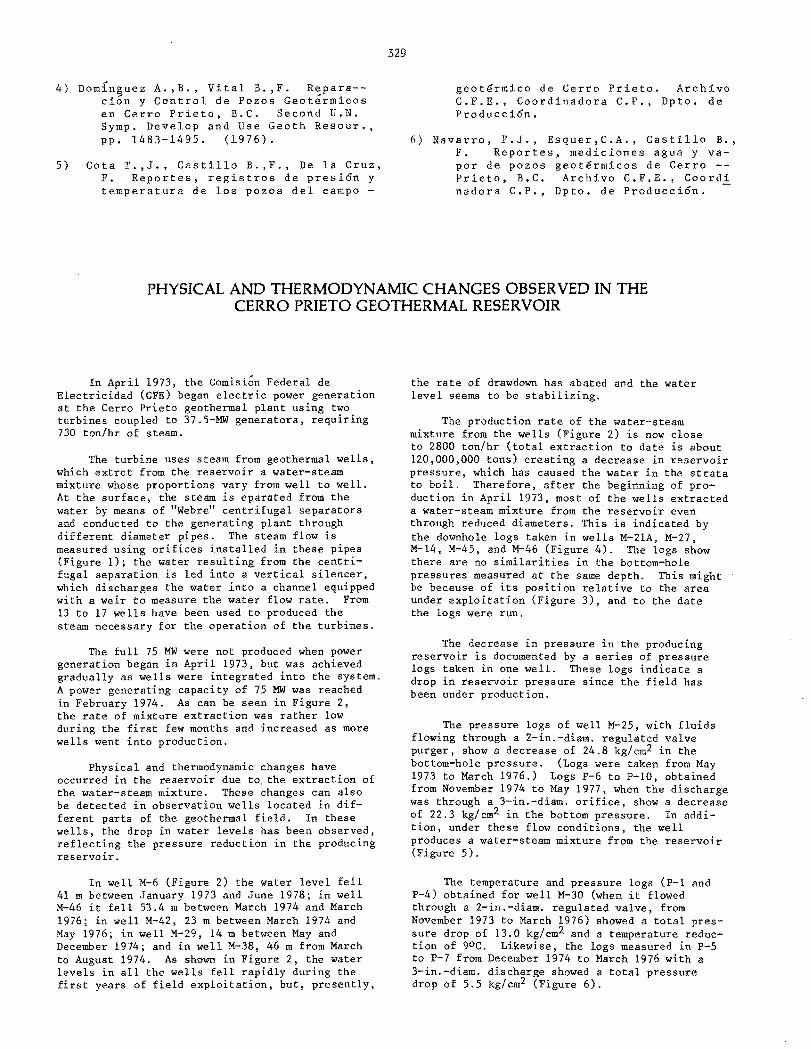
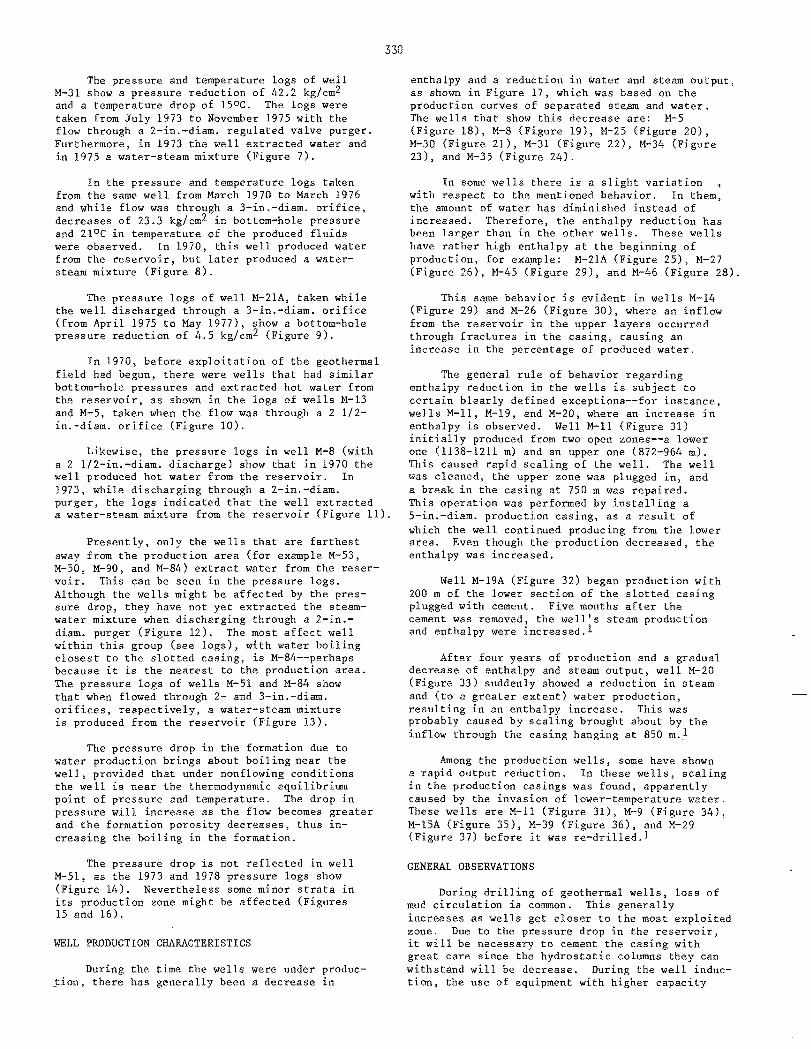
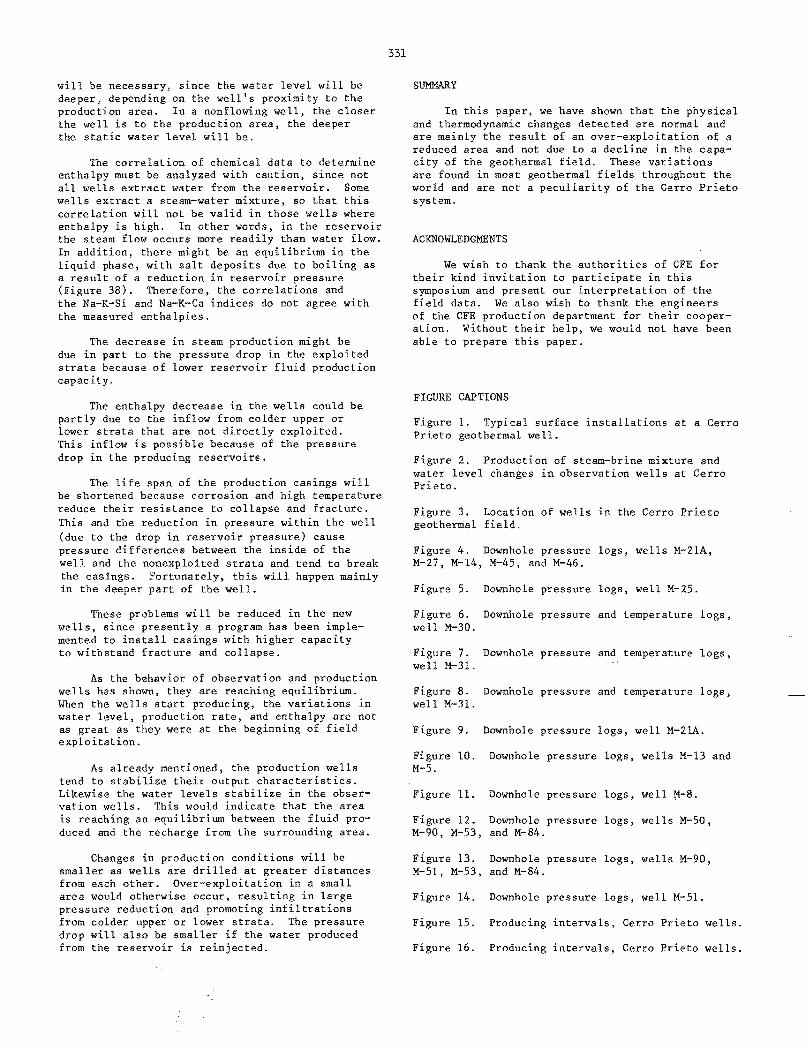