Embed Size (px)
Citation preview
Cambridge Associates LLC U.S. Private Equity Index® And Benchmark Statistics September 30, 2008
CA
MB
RI
DG
E
AS
SO
CI
AT
ES
L
LC
Copyright © 2009 by Cambridge Associates LLC. All rights reserved. This report may not be displayed, reproduced, distributed, transmitted, or used to create derivative works in any form, in whole or in portion, by any means, without written permission from Cambridge Associates LLC ("CA"). Copying of this publication is a violation of federal copyright laws (17 U.S.C. 101 et seq.). Violators of this copyright may be subject to liability for substantial monetary damages. The information and material published in this report are confidential and non-transferable. This means that authorized members may not disclose any information or material derived from this report to third parties, or use information or material from this report, without prior written authorization. An authorized member may disclose information or material from this report to its staff, trustees, or Investment Committee with the understanding that these individuals will treat it confidentially. Additionally, information from this report may be disclosed if disclosure is required by law or court order, but members are required to provide notice to CA reasonably in advance of such disclosure. This report is provided for informational purposes only. It is not intended to constitute an offer of securities of any of the issuers that are described in the report. This report is provided only to persons that CA believes to be "Accredited Investors" as that term is defined in Regulation D under the Securities Act of 1933. When applicable, investors should completely review all Fund offering materials before considering an investment. No part of this report is intended as a recommendation of any firm or any security. Factual information contained herein about investment firms and their returns which has not been independently verified has generally been collected from the firms themselves through the mail. CA can neither assure nor accept responsibility for accuracy, but substantial legal liability may apply to misrepresentations of results delivered through the mail. The CA manager universe statistics, including medians, are derived from CA's proprietary database covering investment managers. These universe statistics and rankings exclude managers that exclude cash from their reported total returns, and for calculations including any years from 1998 to the present, those managers with less than $50 million in product assets. Returns for inactive (discontinued) managers are included if performance is available for the entire period measured. Performance results are generally gross of investment management fees. CA does not necessarily endorse or recommend the managers in this universe. Cambridge Associates, LLC is a Massachusetts limited liability company with offices in Arlington, VA; Boston, MA; Dallas, TX; and Menlo Park, CA. Cambridge Associates Limited is registered as a limited company in England and Wales No. 06135829 and is authorised and regulated by the Financial Services Authority in the conduct of Investment Business. Cambridge Associates Limited, LLC is a Massachusetts limited liability company with a branch office in Sydney, Australia (ARBN 109 366 654). Cambridge Associates Asia Pte Ltd is a Singapore corporation (Registration No. 200101063G).
Cambridge Associates LLC U.S. Private Equity Index® And Benchmark Statistics
September 30, 2008
1
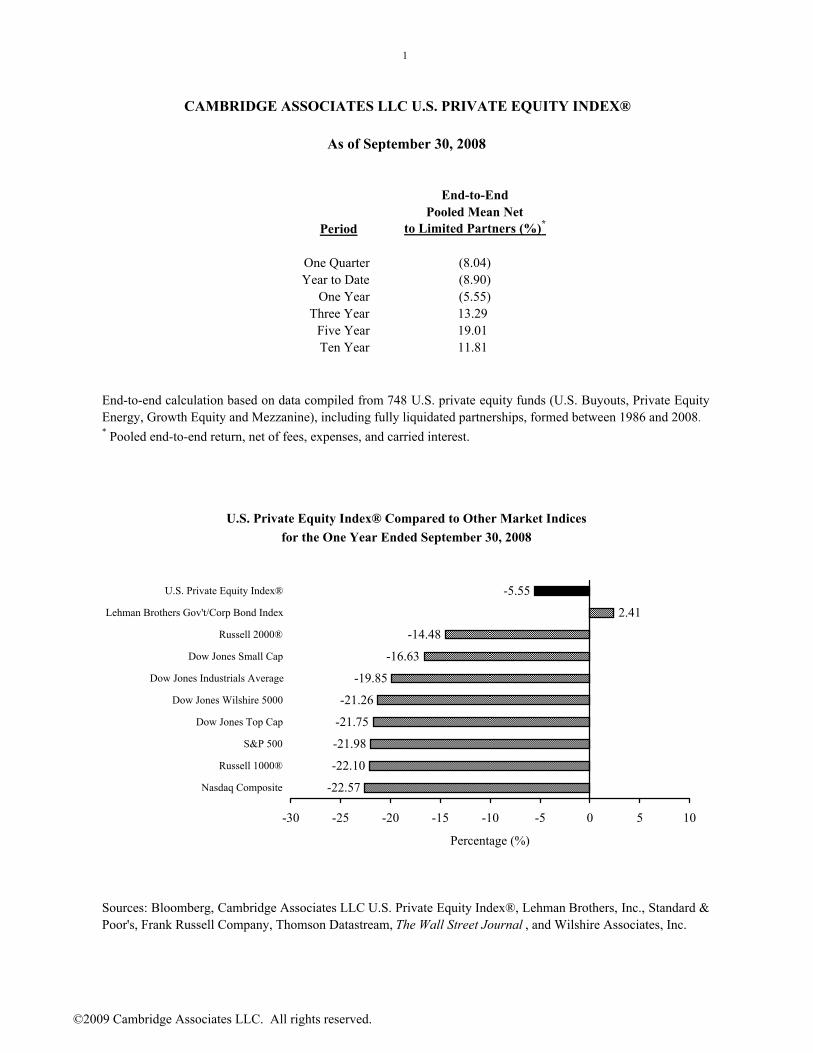
End-to-EndPooled Mean Net
Period to Limited Partners (%)*
One Quarter (8.04)Year to Date (8.90)
One Year (5.55)Three Year 13.29
Five Year 19.01Ten Year 11.81
CAMBRIDGE ASSOCIATES LLC U.S. PRIVATE EQUITY INDEX®
As of September 30, 2008
U.S. Private Equity Index® Compared to Other Market Indicesfor the One Year Ended September 30, 2008
End-to-end calculation based on data compiled from 748 U.S. private equity funds (U.S. Buyouts, Private EquityEnergy, Growth Equity and Mezzanine), including fully liquidated partnerships, formed between 1986 and 2008. * Pooled end-to-end return, net of fees, expenses, and carried interest.
-22.57
-22.10
-21.98
-21.26
-19.85
-16.63
-14.48
2.41
-5.55
-21.75
-30 -25 -20 -15 -10 -5 0 5 10
Nasdaq Composite
Russell 1000®
S&P 500
Dow Jones Top Cap
Dow Jones Wilshire 5000
Dow Jones Industrials Average
Dow Jones Small Cap
Russell 2000®
Lehman Brothers Gov't/Corp Bond Index
U.S. Private Equity Index®
Percentage (%)
Sources: Bloomberg, Cambridge Associates LLC U.S. Private Equity Index®, Lehman Brothers, Inc., Standard &Poor's, Frank Russell Company, Thomson Datastream, The Wall Street Journal , and Wilshire Associates, Inc.
©2009 Cambridge Associates LLC. All rights reserved.
2
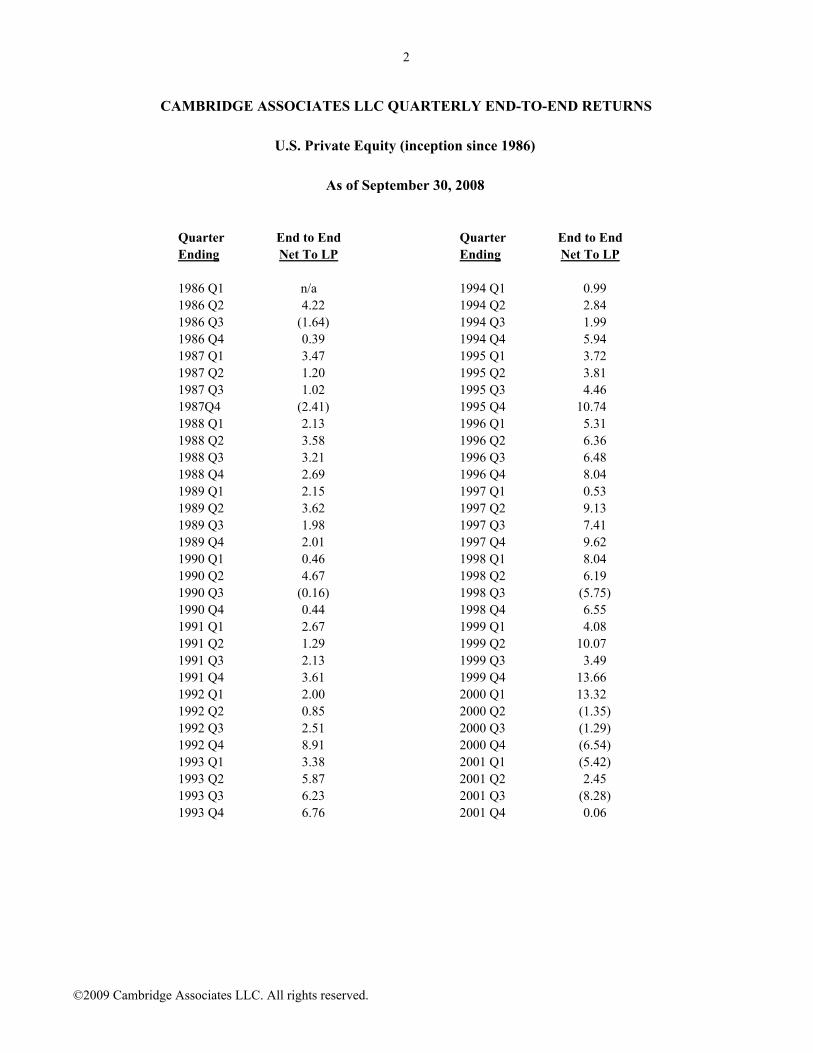
Quarter End to End Quarter End to EndEnding Net To LP Ending Net To LP
1986 Q1 n/a 1994 Q1 0.99 1986 Q2 4.22 1994 Q2 2.84 1986 Q3 (1.64) 1994 Q3 1.99 1986 Q4 0.39 1994 Q4 5.94 1987 Q1 3.47 1995 Q1 3.72 1987 Q2 1.20 1995 Q2 3.81 1987 Q3 1.02 1995 Q3 4.46 1987Q4 (2.41) 1995 Q4 10.74 1988 Q1 2.13 1996 Q1 5.31 1988 Q2 3.58 1996 Q2 6.36 1988 Q3 3.21 1996 Q3 6.48 1988 Q4 2.69 1996 Q4 8.04 1989 Q1 2.15 1997 Q1 0.53 1989 Q2 3.62 1997 Q2 9.13 1989 Q3 1.98 1997 Q3 7.41 1989 Q4 2.01 1997 Q4 9.62 1990 Q1 0.46 1998 Q1 8.04 1990 Q2 4.67 1998 Q2 6.19 1990 Q3 (0.16) 1998 Q3 (5.75) 1990 Q4 0.44 1998 Q4 6.55 1991 Q1 2.67 1999 Q1 4.08 1991 Q2 1.29 1999 Q2 10.07 1991 Q3 2.13 1999 Q3 3.49 1991 Q4 3.61 1999 Q4 13.66 1992 Q1 2.00 2000 Q1 13.32 1992 Q2 0.85 2000 Q2 (1.35) 1992 Q3 2.51 2000 Q3 (1.29) 1992 Q4 8.91 2000 Q4 (6.54) 1993 Q1 3.38 2001 Q1 (5.42) 1993 Q2 5.87 2001 Q2 2.45 1993 Q3 6.23 2001 Q3 (8.28) 1993 Q4 6.76 2001 Q4 0.06
CAMBRIDGE ASSOCIATES LLC QUARTERLY END-TO-END RETURNS
U.S. Private Equity (inception since 1986)
As of September 30, 2008
©2009 Cambridge Associates LLC. All rights reserved.
3
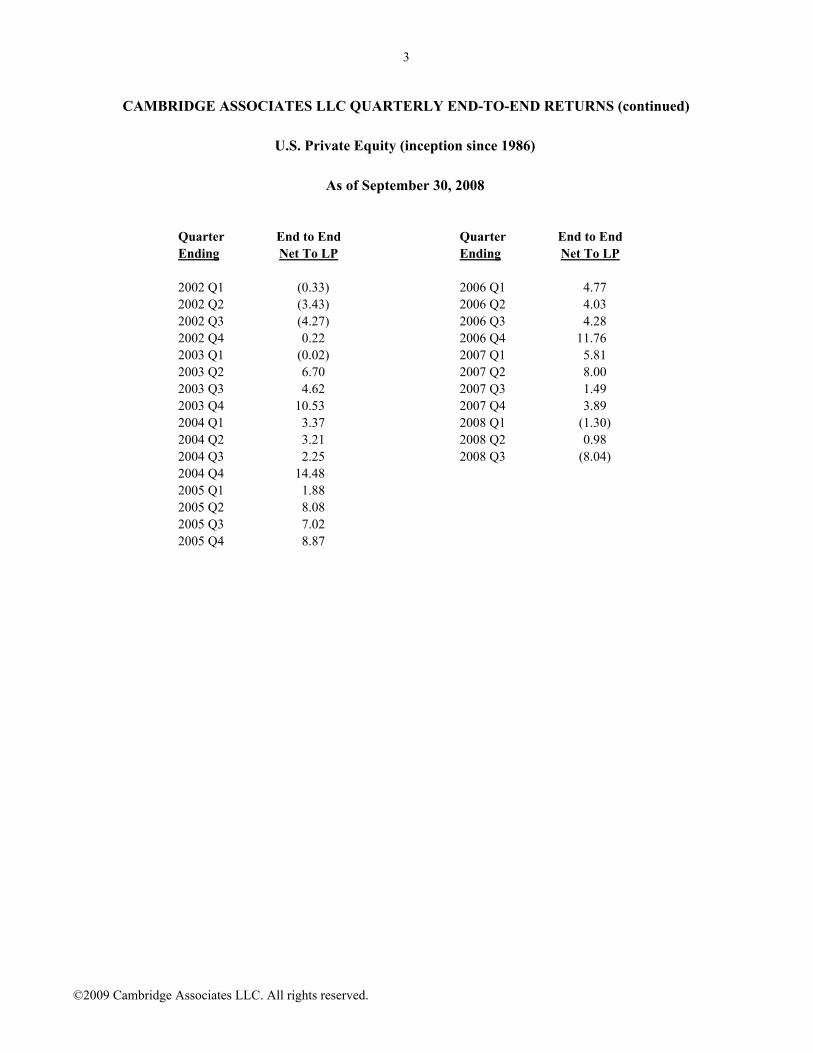
Quarter End to End Quarter End to EndEnding Net To LP Ending Net To LP
2002 Q1 (0.33) 2006 Q1 4.77 2002 Q2 (3.43) 2006 Q2 4.03 2002 Q3 (4.27) 2006 Q3 4.28 2002 Q4 0.22 2006 Q4 11.76 2003 Q1 (0.02) 2007 Q1 5.81 2003 Q2 6.70 2007 Q2 8.00 2003 Q3 4.62 2007 Q3 1.49 2003 Q4 10.53 2007 Q4 3.89 2004 Q1 3.37 2008 Q1 (1.30) 2004 Q2 3.21 2008 Q2 0.98 2004 Q3 2.25 2008 Q3 (8.04) 2004 Q4 14.48 2005 Q1 1.88 2005 Q2 8.08 2005 Q3 7.02 2005 Q4 8.87
CAMBRIDGE ASSOCIATES LLC QUARTERLY END-TO-END RETURNS (continued)
U.S. Private Equity (inception since 1986)
As of September 30, 2008
©2009 Cambridge Associates LLC. All rights reserved.
4
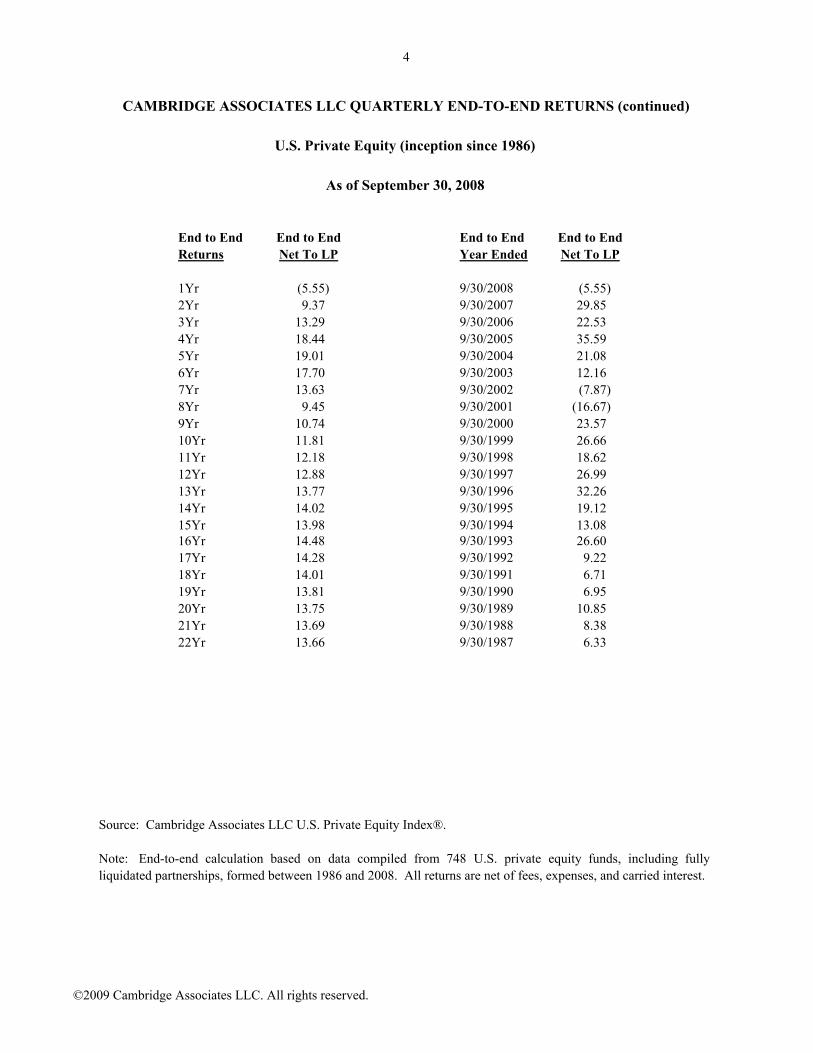
End to End End to End End to End End to EndReturns Net To LP Year Ended Net To LP
1Yr (5.55) 9/30/2008 (5.55) 2Yr 9.37 9/30/2007 29.85 3Yr 13.29 9/30/2006 22.53 4Yr 18.44 9/30/2005 35.59 5Yr 19.01 9/30/2004 21.08 6Yr 17.70 9/30/2003 12.16 7Yr 13.63 9/30/2002 (7.87) 8Yr 9.45 9/30/2001 (16.67) 9Yr 10.74 9/30/2000 23.57 10Yr 11.81 9/30/1999 26.66 11Yr 12.18 9/30/1998 18.62 12Yr 12.88 9/30/1997 26.99 13Yr 13.77 9/30/1996 32.26 14Yr 14.02 9/30/1995 19.12 15Yr 13.98 9/30/1994 13.08 16Yr 14.48 9/30/1993 26.60 17Yr 14.28 9/30/1992 9.22 18Yr 14.01 9/30/1991 6.71 19Yr 13.81 9/30/1990 6.95 20Yr 13.75 9/30/1989 10.85 21Yr 13.69 9/30/1988 8.38 22Yr 13.66 9/30/1987 6.33
CAMBRIDGE ASSOCIATES LLC QUARTERLY END-TO-END RETURNS (continued)
U.S. Private Equity (inception since 1986)
As of September 30, 2008
Source: Cambridge Associates LLC U.S. Private Equity Index®.
Note: End-to-end calculation based on data compiled from 748 U.S. private equity funds, including fullyliquidated partnerships, formed between 1986 and 2008. All returns are net of fees, expenses, and carried interest.
©2009 Cambridge Associates LLC. All rights reserved.
5
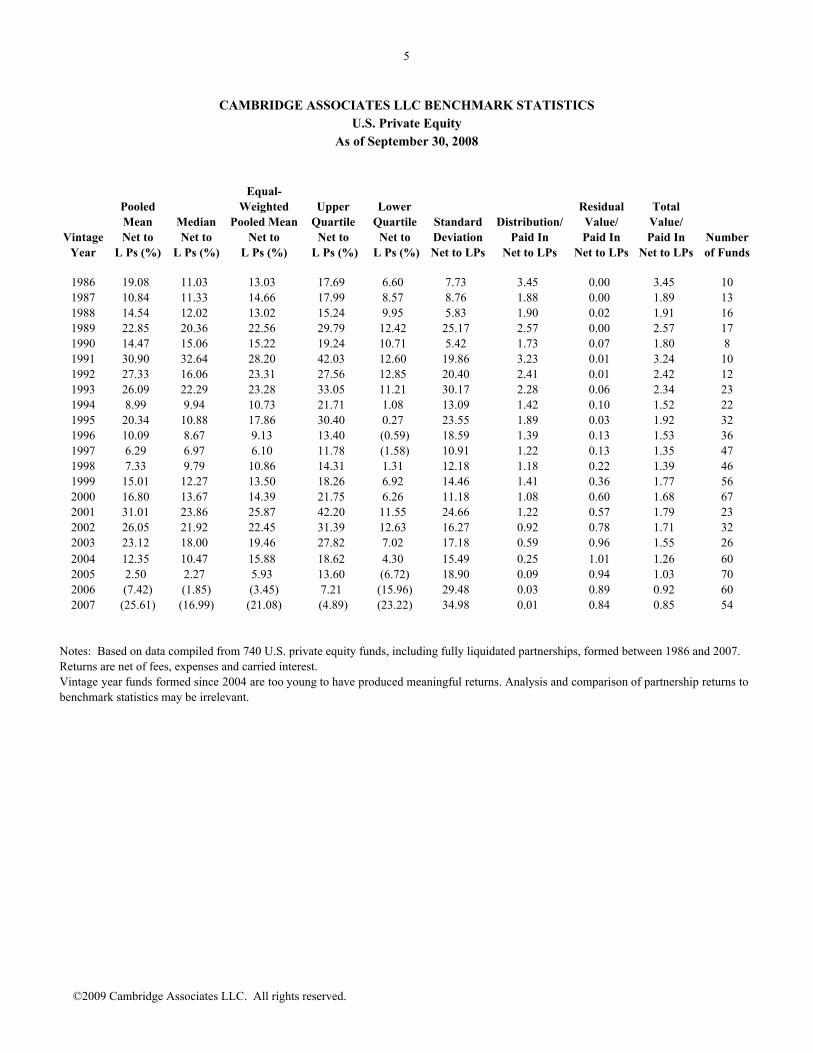
Equal-Pooled Weighted Upper Lower Residual TotalMean Median Pooled Mean Quartile Quartile Standard Distribution/ Value/ Value/
Vintage Net to Net to Net to Net to Net to Deviation Paid In Paid In Paid In NumberYear L Ps (%) L Ps (%) L Ps (%) L Ps (%) L Ps (%) Net to LPs Net to LPs Net to LPs Net to LPs of Funds
1986 19.08 11.03 13.03 17.69 6.60 7.73 3.45 0.00 3.45 101987 10.84 11.33 14.66 17.99 8.57 8.76 1.88 0.00 1.89 131988 14.54 12.02 13.02 15.24 9.95 5.83 1.90 0.02 1.91 161989 22.85 20.36 22.56 29.79 12.42 25.17 2.57 0.00 2.57 171990 14.47 15.06 15.22 19.24 10.71 5.42 1.73 0.07 1.80 81991 30.90 32.64 28.20 42.03 12.60 19.86 3.23 0.01 3.24 101992 27.33 16.06 23.31 27.56 12.85 20.40 2.41 0.01 2.42 121993 26.09 22.29 23.28 33.05 11.21 30.17 2.28 0.06 2.34 231994 8.99 9.94 10.73 21.71 1.08 13.09 1.42 0.10 1.52 221995 20.34 10.88 17.86 30.40 0.27 23.55 1.89 0.03 1.92 321996 10.09 8.67 9.13 13.40 (0.59) 18.59 1.39 0.13 1.53 361997 6.29 6.97 6.10 11.78 (1.58) 10.91 1.22 0.13 1.35 471998 7.33 9.79 10.86 14.31 1.31 12.18 1.18 0.22 1.39 461999 15.01 12.27 13.50 18.26 6.92 14.46 1.41 0.36 1.77 562000 16.80 13.67 14.39 21.75 6.26 11.18 1.08 0.60 1.68 672001 31.01 23.86 25.87 42.20 11.55 24.66 1.22 0.57 1.79 232002 26.05 21.92 22.45 31.39 12.63 16.27 0.92 0.78 1.71 322003 23.12 18.00 19.46 27.82 7.02 17.18 0.59 0.96 1.55 262004 12.35 10.47 15.88 18.62 4.30 15.49 0.25 1.01 1.26 602005 2.50 2.27 5.93 13.60 (6.72) 18.90 0.09 0.94 1.03 702006 (7.42) (1.85) (3.45) 7.21 (15.96) 29.48 0.03 0.89 0.92 602007 (25.61) (16.99) (21.08) (4.89) (23.22) 34.98 0.01 0.84 0.85 54
CAMBRIDGE ASSOCIATES LLC BENCHMARK STATISTICSU.S. Private Equity
As of September 30, 2008
Notes: Based on data compiled from 740 U.S. private equity funds, including fully liquidated partnerships, formed between 1986 and 2007. Returns are net of fees, expenses and carried interest.Vintage year funds formed since 2004 are too young to have produced meaningful returns. Analysis and comparison of partnership returns tobenchmark statistics may be irrelevant.
©2009 Cambridge Associates LLC. All rights reserved.
6
Pooled Pooled Pooled Pooled PooledVintage Mean Net Number Mean Net Number Mean Net Number Mean Net Number Mean Net Number
Year to LPs (%) of Funds to LPs (%) of Funds to LPs (%) of Funds to LPs (%) of Funds to LPs (%) of Funds
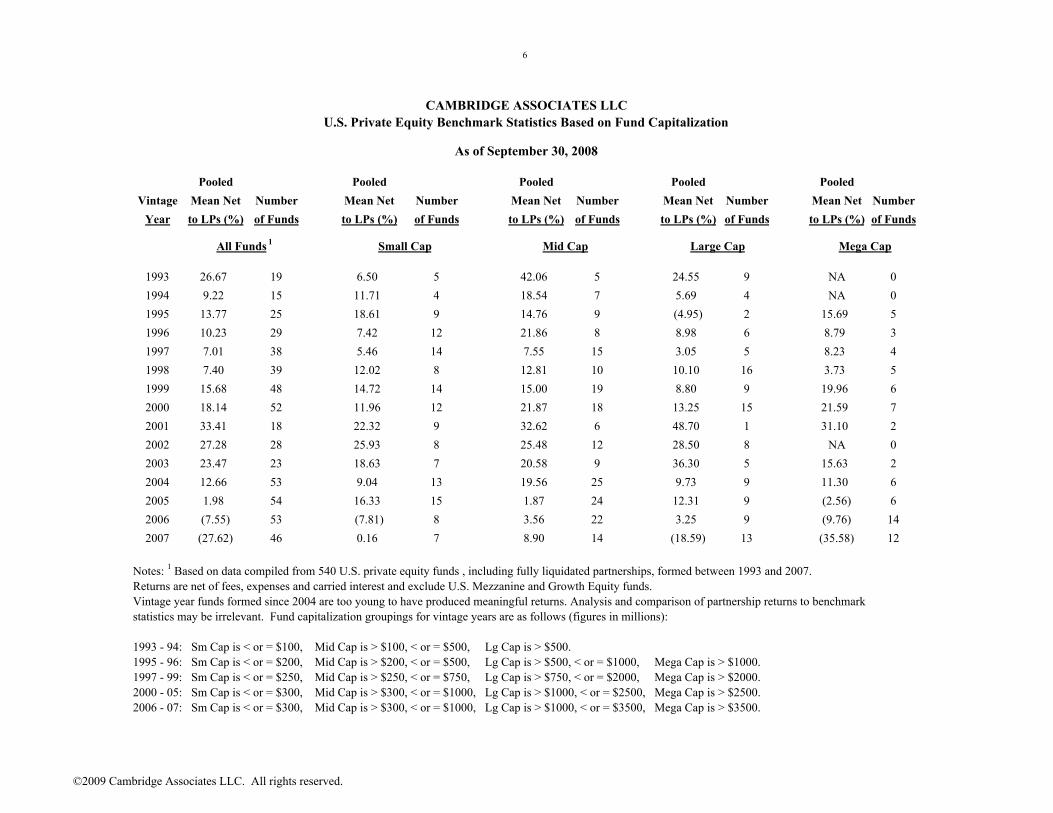
1993 26.67 19 6.50 5 42.06 5 24.55 9 NA 01994 9.22 15 11.71 4 18.54 7 5.69 4 NA 01995 13.77 25 18.61 9 14.76 9 (4.95) 2 15.69 51996 10.23 29 7.42 12 21.86 8 8.98 6 8.79 31997 7.01 38 5.46 14 7.55 15 3.05 5 8.23 41998 7.40 39 12.02 8 12.81 10 10.10 16 3.73 51999 15.68 48 14.72 14 15.00 19 8.80 9 19.96 62000 18.14 52 11.96 12 21.87 18 13.25 15 21.59 72001 33.41 18 22.32 9 32.62 6 48.70 1 31.10 22002 27.28 28 25.93 8 25.48 12 28.50 8 NA 02003 23.47 23 18.63 7 20.58 9 36.30 5 15.63 22004 12.66 53 9.04 13 19.56 25 9.73 9 11.30 62005 1.98 54 16.33 15 1.87 24 12.31 9 (2.56) 62006 (7.55) 53 (7.81) 8 3.56 22 3.25 9 (9.76) 142007 (27.62) 46 0.16 7 8.90 14 (18.59) 13 (35.58) 12
Mega Cap
CAMBRIDGE ASSOCIATES LLCU.S. Private Equity Benchmark Statistics Based on Fund Capitalization
As of September 30, 2008
Small Cap Mid Cap Large CapAll Funds 1
Notes: 1 Based on data compiled from 540 U.S. private equity funds , including fully liquidated partnerships, formed between 1993 and 2007.Returns are net of fees, expenses and carried interest and exclude U.S. Mezzanine and Growth Equity funds.Vintage year funds formed since 2004 are too young to have produced meaningful returns. Analysis and comparison of partnership returns to benchmark statistics may be irrelevant. Fund capitalization groupings for vintage years are as follows (figures in millions):
1993 - 94: Sm Cap is < or = $100, Mid Cap is > $100, < or = $500, Lg Cap is > $500. 1995 - 96: Sm Cap is < or = $200, Mid Cap is > $200, < or = $500, Lg Cap is > $500, < or = $1000, Mega Cap is > $1000.1997 - 99: Sm Cap is < or = $250, Mid Cap is > $250, < or = $750, Lg Cap is > $750, < or = $2000, Mega Cap is > $2000. 2000 - 05: Sm Cap is < or = $300, Mid Cap is > $300, < or = $1000, Lg Cap is > $1000, < or = $2500, Mega Cap is > $2500. 2006 - 07: Sm Cap is < or = $300, Mid Cap is > $300, < or = $1000, Lg Cap is > $1000, < or = $3500, Mega Cap is > $3500.
©2009 Cambridge Associates LLC. All rights reserved.
7
1995 1996 1997 1998 1999 2000 2001 2002 2003 2004 2005 2006 2007
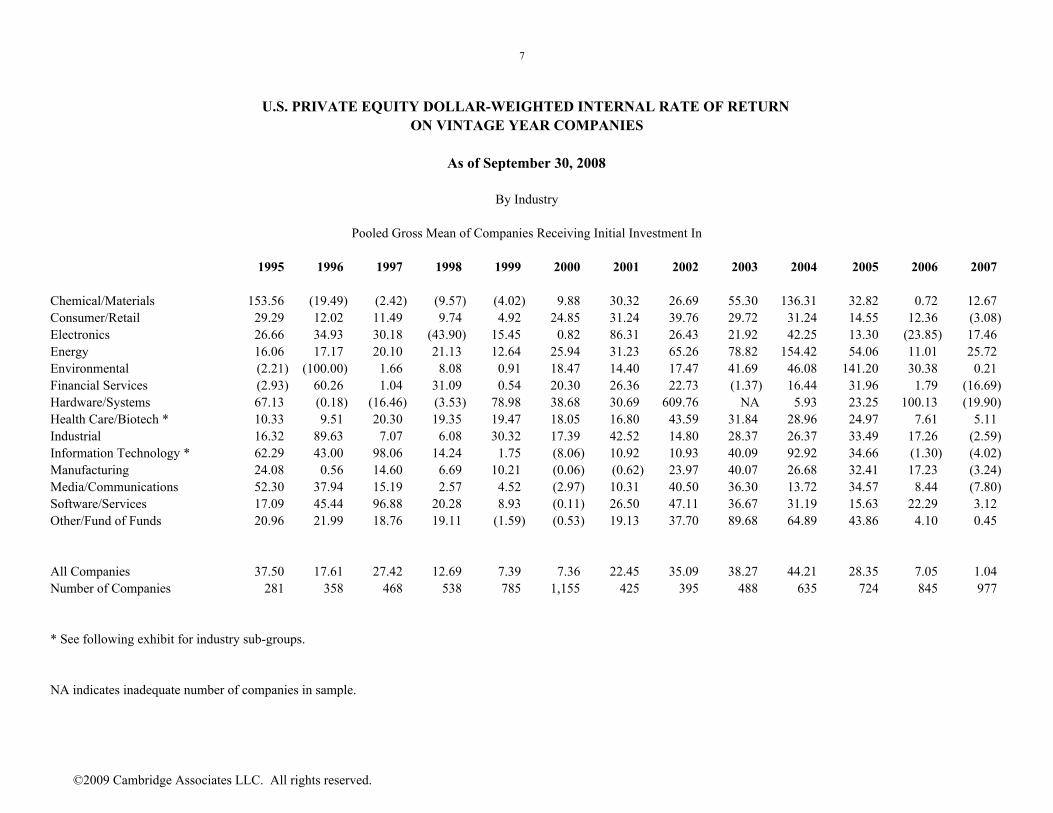
Chemical/Materials 153.56 (19.49) (2.42) (9.57) (4.02) 9.88 30.32 26.69 55.30 136.31 32.82 0.72 12.67Consumer/Retail 29.29 12.02 11.49 9.74 4.92 24.85 31.24 39.76 29.72 31.24 14.55 12.36 (3.08)Electronics 26.66 34.93 30.18 (43.90) 15.45 0.82 86.31 26.43 21.92 42.25 13.30 (23.85) 17.46Energy 16.06 17.17 20.10 21.13 12.64 25.94 31.23 65.26 78.82 154.42 54.06 11.01 25.72Environmental (2.21) (100.00) 1.66 8.08 0.91 18.47 14.40 17.47 41.69 46.08 141.20 30.38 0.21Financial Services (2.93) 60.26 1.04 31.09 0.54 20.30 26.36 22.73 (1.37) 16.44 31.96 1.79 (16.69)Hardware/Systems 67.13 (0.18) (16.46) (3.53) 78.98 38.68 30.69 609.76 NA 5.93 23.25 100.13 (19.90)Health Care/Biotech * 10.33 9.51 20.30 19.35 19.47 18.05 16.80 43.59 31.84 28.96 24.97 7.61 5.11Industrial 16.32 89.63 7.07 6.08 30.32 17.39 42.52 14.80 28.37 26.37 33.49 17.26 (2.59)Information Technology * 62.29 43.00 98.06 14.24 1.75 (8.06) 10.92 10.93 40.09 92.92 34.66 (1.30) (4.02)Manufacturing 24.08 0.56 14.60 6.69 10.21 (0.06) (0.62) 23.97 40.07 26.68 32.41 17.23 (3.24)Media/Communications 52.30 37.94 15.19 2.57 4.52 (2.97) 10.31 40.50 36.30 13.72 34.57 8.44 (7.80)Software/Services 17.09 45.44 96.88 20.28 8.93 (0.11) 26.50 47.11 36.67 31.19 15.63 22.29 3.12Other/Fund of Funds 20.96 21.99 18.76 19.11 (1.59) (0.53) 19.13 37.70 89.68 64.89 43.86 4.10 0.45
All Companies 37.50 17.61 27.42 12.69 7.39 7.36 22.45 35.09 38.27 44.21 28.35 7.05 1.04Number of Companies 281 358 468 538 785 1,155 425 395 488 635 724 845 977
* See following exhibit for industry sub-groups.
NA indicates inadequate number of companies in sample.
Pooled Gross Mean of Companies Receiving Initial Investment In
U.S. PRIVATE EQUITY DOLLAR-WEIGHTED INTERNAL RATE OF RETURN
As of September 30, 2008
By Industry
ON VINTAGE YEAR COMPANIES
©2009 Cambridge Associates LLC. All rights reserved.
8
1995 1996 1997 1998 1999 2000 2001 2002 2003 2004 2005 2006 2007
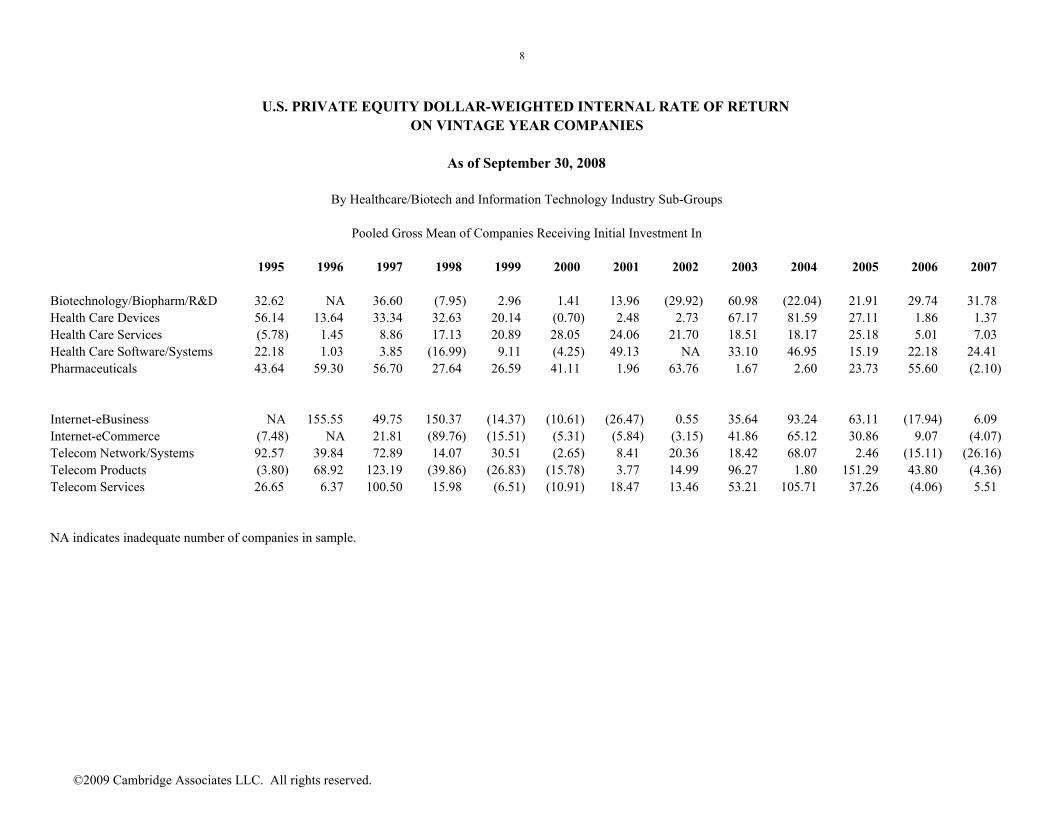
Biotechnology/Biopharm/R&D 32.62 NA 36.60 (7.95) 2.96 1.41 13.96 (29.92) 60.98 (22.04) 21.91 29.74 31.78Health Care Devices 56.14 13.64 33.34 32.63 20.14 (0.70) 2.48 2.73 67.17 81.59 27.11 1.86 1.37Health Care Services (5.78) 1.45 8.86 17.13 20.89 28.05 24.06 21.70 18.51 18.17 25.18 5.01 7.03Health Care Software/Systems 22.18 1.03 3.85 (16.99) 9.11 (4.25) 49.13 NA 33.10 46.95 15.19 22.18 24.41Pharmaceuticals 43.64 59.30 56.70 27.64 26.59 41.11 1.96 63.76 1.67 2.60 23.73 55.60 (2.10)
Internet-eBusiness NA 155.55 49.75 150.37 (14.37) (10.61) (26.47) 0.55 35.64 93.24 63.11 (17.94) 6.09Internet-eCommerce (7.48) NA 21.81 (89.76) (15.51) (5.31) (5.84) (3.15) 41.86 65.12 30.86 9.07 (4.07)Telecom Network/Systems 92.57 39.84 72.89 14.07 30.51 (2.65) 8.41 20.36 18.42 68.07 2.46 (15.11) (26.16)Telecom Products (3.80) 68.92 123.19 (39.86) (26.83) (15.78) 3.77 14.99 96.27 1.80 151.29 43.80 (4.36)Telecom Services 26.65 6.37 100.50 15.98 (6.51) (10.91) 18.47 13.46 53.21 105.71 37.26 (4.06) 5.51
NA indicates inadequate number of companies in sample.
As of September 30, 2008
Pooled Gross Mean of Companies Receiving Initial Investment In
By Healthcare/Biotech and Information Technology Industry Sub-Groups
U.S. PRIVATE EQUITY DOLLAR-WEIGHTED INTERNAL RATE OF RETURN ON VINTAGE YEAR COMPANIES
©2009 Cambridge Associates LLC. All rights reserved.
9
©2009 Cambridge Associates LLC. All rights reserved.
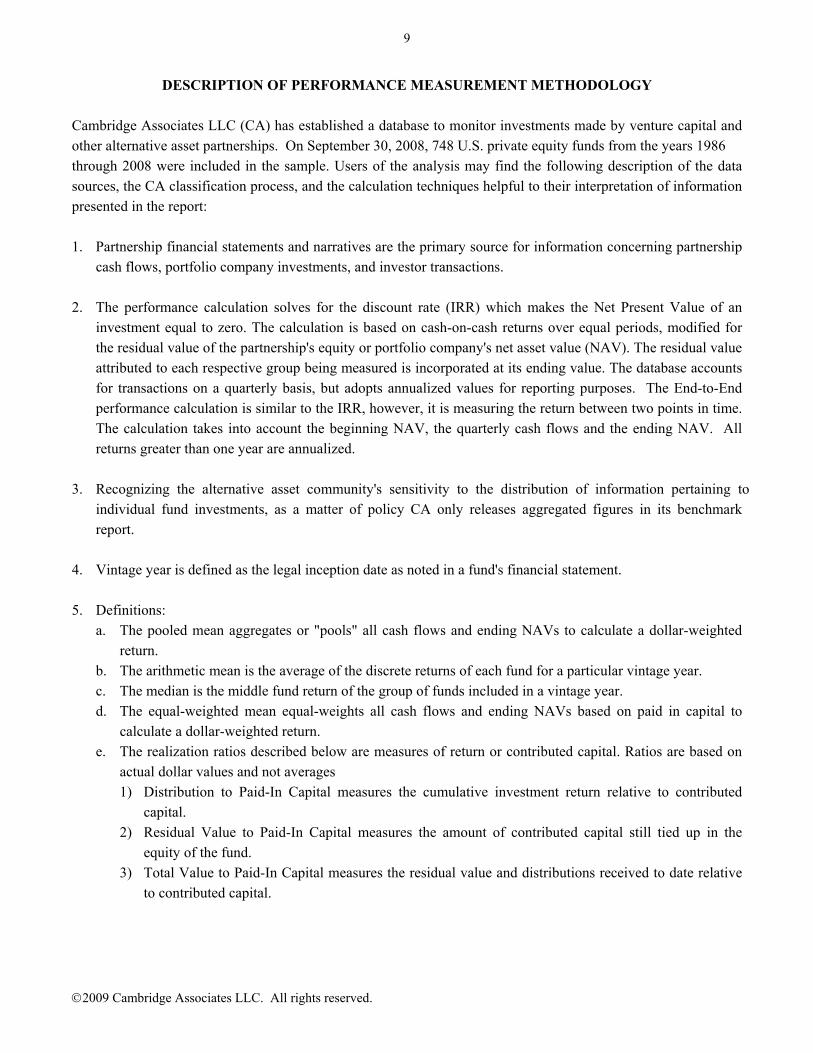
DESCRIPTION OF PERFORMANCE MEASUREMENT METHODOLOGY Cambridge Associates LLC (CA) has established a database to monitor investments made by venture capital and other alternative asset partnerships. On September 30, 2008, 748 U.S. private equity funds from the years 1986 through 2008 were included in the sample. Users of the analysis may find the following description of the data sources, the CA classification process, and the calculation techniques helpful to their interpretation of information presented in the report: 1. Partnership financial statements and narratives are the primary source for information concerning partnership
cash flows, portfolio company investments, and investor transactions. 2. The performance calculation solves for the discount rate (IRR) which makes the Net Present Value of an
investment equal to zero. The calculation is based on cash-on-cash returns over equal periods, modified for the residual value of the partnership's equity or portfolio company's net asset value (NAV). The residual value attributed to each respective group being measured is incorporated at its ending value. The database accounts for transactions on a quarterly basis, but adopts annualized values for reporting purposes. The End-to-End performance calculation is similar to the IRR, however, it is measuring the return between two points in time. The calculation takes into account the beginning NAV, the quarterly cash flows and the ending NAV. All returns greater than one year are annualized.
3. Recognizing the alternative asset community's sensitivity to the distribution of information pertaining to
individual fund investments, as a matter of policy CA only releases aggregated figures in its benchmark report.
4. Vintage year is defined as the legal inception date as noted in a fund's financial statement. 5. Definitions:
a. The pooled mean aggregates or "pools" all cash flows and ending NAVs to calculate a dollar-weighted return.
b. The arithmetic mean is the average of the discrete returns of each fund for a particular vintage year. c. The median is the middle fund return of the group of funds included in a vintage year. d. The equal-weighted mean equal-weights all cash flows and ending NAVs based on paid in capital to
calculate a dollar-weighted return. e. The realization ratios described below are measures of return or contributed capital. Ratios are based on
actual dollar values and not averages 1) Distribution to Paid-In Capital measures the cumulative investment return relative to contributed
capital. 2) Residual Value to Paid-In Capital measures the amount of contributed capital still tied up in the
equity of the fund. 3) Total Value to Paid-In Capital measures the residual value and distributions received to date relative
to contributed capital.


![Benchmarks - May, 2011 | Benchmarks Onlineit.unt.edu/sites/default/files/benchmarks-05-2011.pdf · Benchmarks - May, 2011 | Benchmarks Online 4/28/16, 9:13:42 AM] By Patrick McLoud,](https://img.pdfslide.net/doc/110x75/5fe545814aa19825752e7bae/benchmarks-may-2011-benchmarks-benchmarks-may-2011-benchmarks-online-42816.jpg)