Embed Size (px)
Citation preview

*3580845999*
This document consists of 18 printed pages and 2 blank pages.
DC (NF/CT) 152730/3© UCLES 2018 [Turn over
Cambridge International ExaminationsCambridge International General Certificate of Secondary Education
BIOLOGY 0610/42Paper 4 Theory (Extended) October/November 2018 1 hour 15 minutesCandidates answer on the Question Paper.No Additional Materials are required.
READ THESE INSTRUCTIONS FIRST
Write your Centre number, candidate number and name on all the work you hand in.Write in dark blue or black pen.You may use a pencil for any diagrams or graphs.Do not use staples, paper clips, glue or correction fluid.DO NOT WRITE IN ANY BARCODES.
Answer all questions.
Electronic calculators may be used.You may lose marks if you do not show your working or if you do not use appropriate units.
At the end of the examination, fasten all your work securely together.The number of marks is given in brackets [ ] at the end of each question or part question.
This syllabus is approved for use in England, Wales and Northern Ireland as a Cambridge International Level 1/Level 2 Certificate.

2
0610/42/O/N/18© UCLES 2018
BLANK PAGE
3
0610/42/O/N/18© UCLES 2018 [Turn over
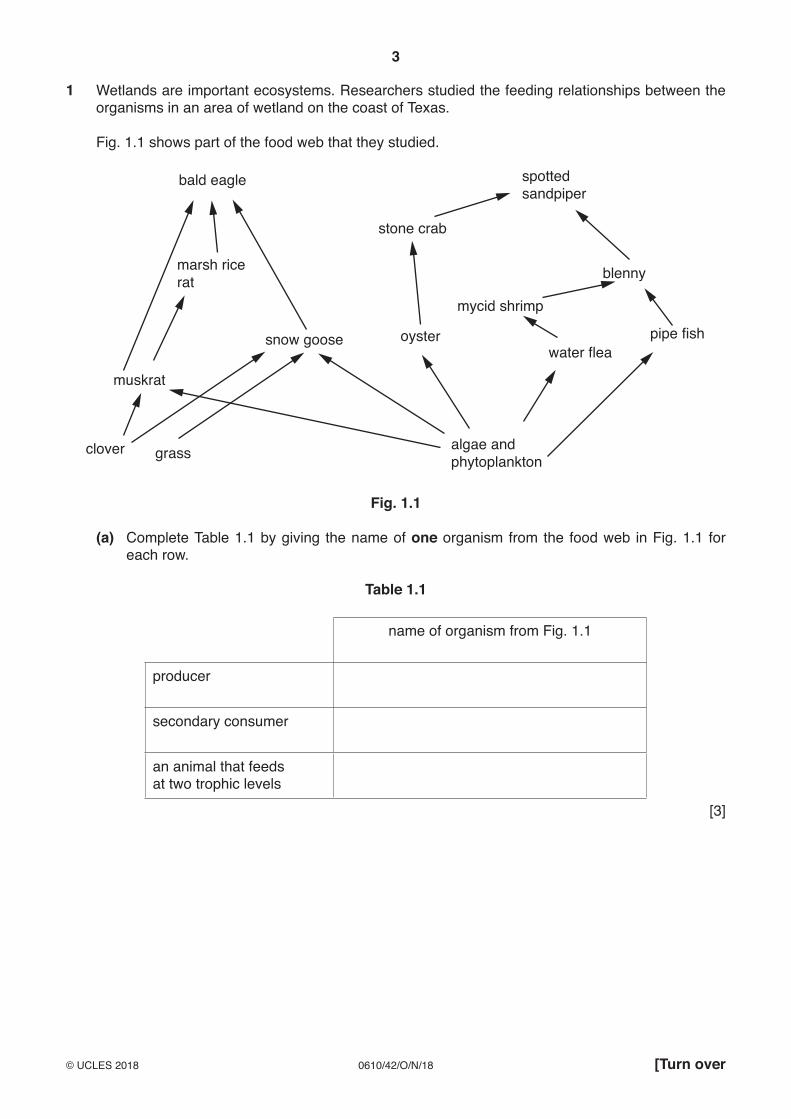
1 Wetlands are important ecosystems. Researchers studied the feeding relationships between the organisms in an area of wetland on the coast of Texas.
Fig. 1.1 shows part of the food web that they studied.
bald eagle
marsh ricerat
muskrat
clover grass
snow goose
algae andphytoplankton
oyster
stone crab
spottedsandpiper
mycid shrimp
blenny
water fleapipe fish
Fig. 1.1
(a) Complete Table 1.1 by giving the name of one organism from the food web in Fig. 1.1 for each row.
Table 1.1
name of organism from Fig. 1.1
producer
secondary consumer
an animal that feeds at two trophic levels
[3]
4
0610/42/O/N/18© UCLES 2018
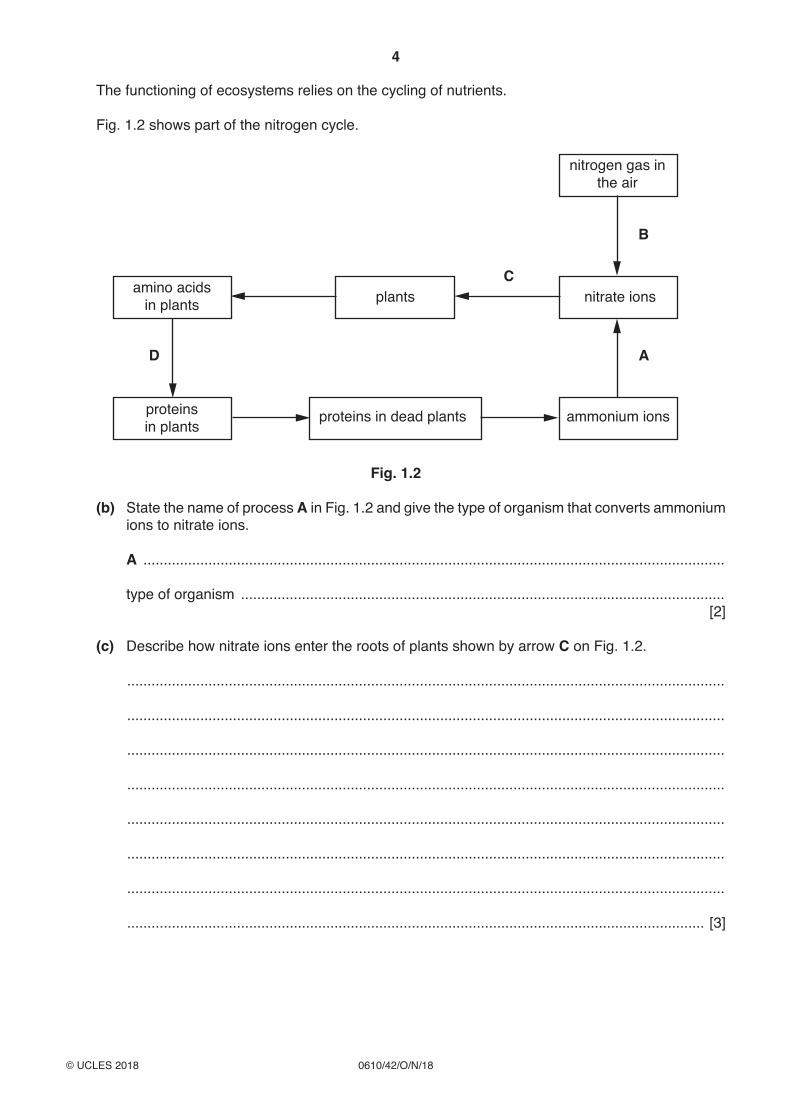
The functioning of ecosystems relies on the cycling of nutrients.
Fig. 1.2 shows part of the nitrogen cycle.
nitrogen gas inthe air
nitrate ionsplantsamino acidsin plants
proteinsin plants proteins in dead plants ammonium ions
D A
B
C
Fig. 1.2
(b) State the name of process A in Fig. 1.2 and give the type of organism that converts ammonium ions to nitrate ions.
A ...............................................................................................................................................
type of organism .......................................................................................................................[2]
(c) Describe how nitrate ions enter the roots of plants shown by arrow C on Fig. 1.2.
...................................................................................................................................................
...................................................................................................................................................
...................................................................................................................................................
...................................................................................................................................................
...................................................................................................................................................
...................................................................................................................................................
...................................................................................................................................................
.............................................................................................................................................. [3]
5
0610/42/O/N/18© UCLES 2018 [Turn over
(d) State the name of the structure in plant cells where process D occurs.
.............................................................................................................................................. [1]
(e) State the process that occurs at B.
.............................................................................................................................................. [1]
(f) A pyramid of numbers for the wetland ecosystem showed that there were very large numbers of organisms at the base of the pyramid and very few at the top.
Explain why.
...................................................................................................................................................
...................................................................................................................................................
...................................................................................................................................................
...................................................................................................................................................
...................................................................................................................................................
...................................................................................................................................................
...................................................................................................................................................
.............................................................................................................................................. [3]
[Total: 13]

6
0610/42/O/N/18© UCLES 2018
BLANK PAGE
7
0610/42/O/N/18© UCLES 2018 [Turn over
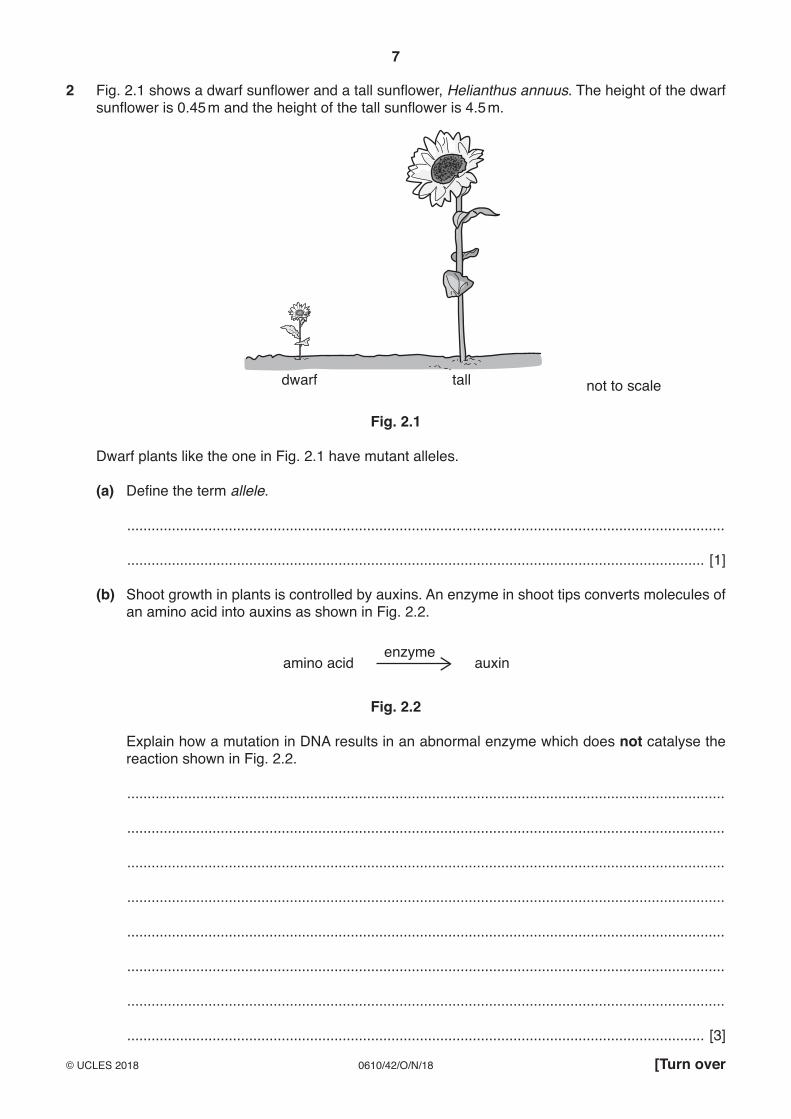
2 Fig. 2.1 shows a dwarf sunflower and a tall sunflower, Helianthus annuus. The height of the dwarf sunflower is 0.45 m and the height of the tall sunflower is 4.5 m.
dwarf not to scaletall
Fig. 2.1
Dwarf plants like the one in Fig. 2.1 have mutant alleles.
(a) Define the term allele.
...................................................................................................................................................
.............................................................................................................................................. [1]
(b) Shoot growth in plants is controlled by auxins. An enzyme in shoot tips converts molecules of an amino acid into auxins as shown in Fig. 2.2.
enzymeamino acid auxin
Fig. 2.2
Explain how a mutation in DNA results in an abnormal enzyme which does not catalyse the reaction shown in Fig. 2.2.
...................................................................................................................................................
...................................................................................................................................................
...................................................................................................................................................
...................................................................................................................................................
...................................................................................................................................................
...................................................................................................................................................
...................................................................................................................................................
.............................................................................................................................................. [3]
8
0610/42/O/N/18© UCLES 2018
(c) Two tall sunflower plants were crossed. 25% of the offspring produced were dwarf.
Explain how it is possible for two tall parent plants to have this percentage of dwarf offspring.
...................................................................................................................................................
...................................................................................................................................................
...................................................................................................................................................
...................................................................................................................................................
.............................................................................................................................................. [2]
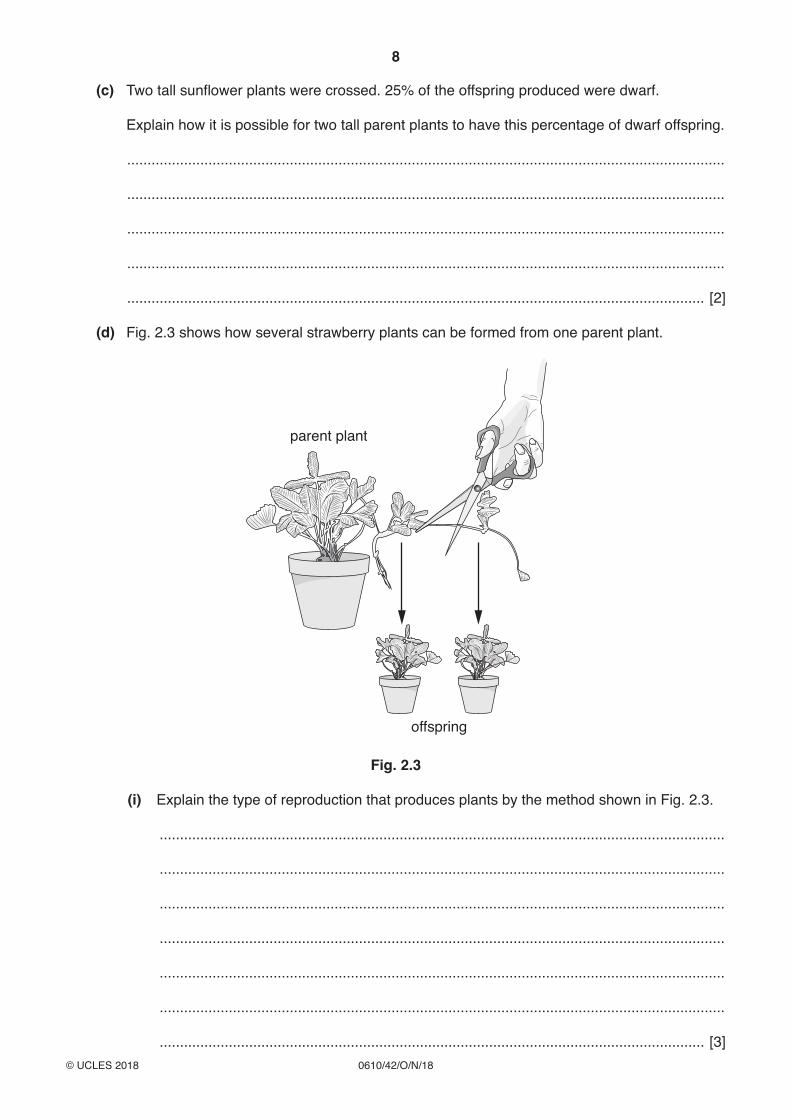
(d) Fig. 2.3 shows how several strawberry plants can be formed from one parent plant.
parent plant
offspring
Fig. 2.3
(i) Explain the type of reproduction that produces plants by the method shown in Fig. 2.3.
...........................................................................................................................................
...........................................................................................................................................
...........................................................................................................................................
...........................................................................................................................................
...........................................................................................................................................
...........................................................................................................................................
...................................................................................................................................... [3]
9
0610/42/O/N/18© UCLES 2018 [Turn over
(ii) Explain the disadvantages of the type of reproduction shown in Fig. 2.3.
...........................................................................................................................................
...........................................................................................................................................
...........................................................................................................................................
...........................................................................................................................................
...........................................................................................................................................
...........................................................................................................................................
...................................................................................................................................... [3]
[Total: 12]
10
0610/42/O/N/18© UCLES 2018
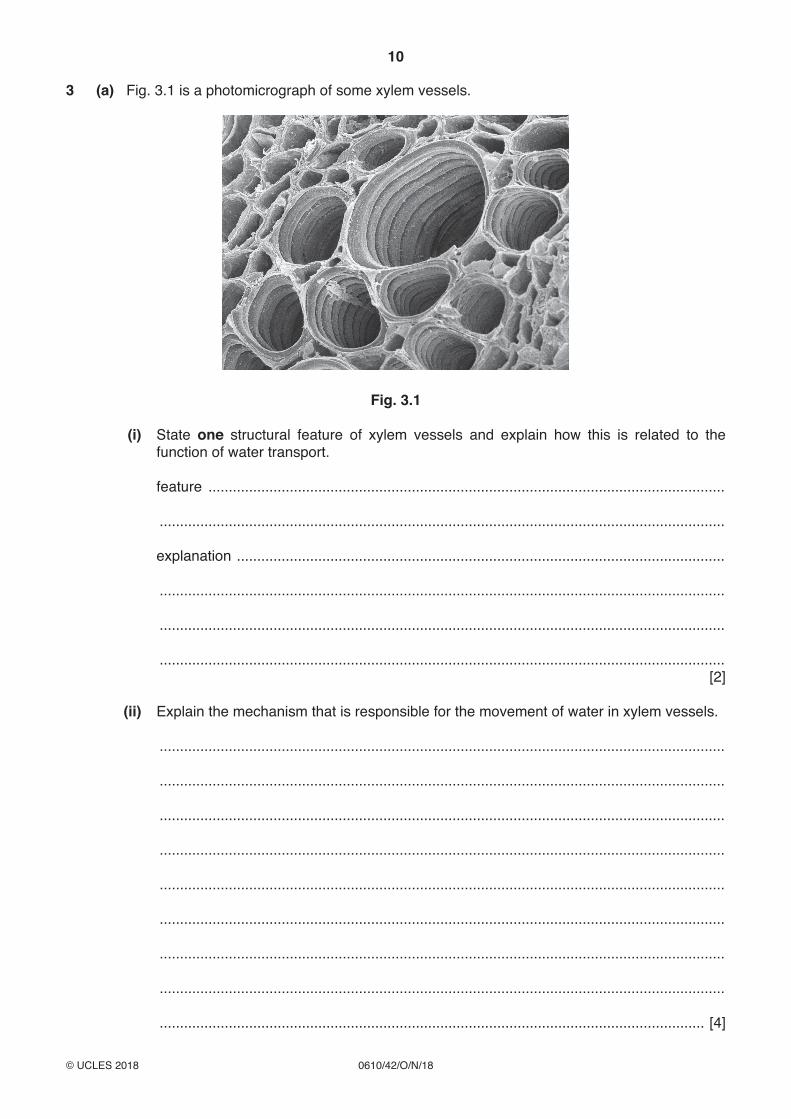
3 (a) Fig. 3.1 is a photomicrograph of some xylem vessels.
Fig. 3.1
(i) State one structural feature of xylem vessels and explain how this is related to the function of water transport.
feature ...............................................................................................................................
...........................................................................................................................................
explanation ........................................................................................................................
...........................................................................................................................................
...........................................................................................................................................
...........................................................................................................................................[2]
(ii) Explain the mechanism that is responsible for the movement of water in xylem vessels.
...........................................................................................................................................
...........................................................................................................................................
...........................................................................................................................................
...........................................................................................................................................
...........................................................................................................................................
...........................................................................................................................................
...........................................................................................................................................
...........................................................................................................................................
...................................................................................................................................... [4]
11
0610/42/O/N/18© UCLES 2018 [Turn over
(iii) State one role of xylem vessels other than transport.
...................................................................................................................................... [1]
(b) The rate of transpiration is affected by several factors including the temperature and the humidity of the air.
State and explain the effect of an increase in temperature on the rate of transpiration.
...................................................................................................................................................
...................................................................................................................................................
...................................................................................................................................................
...................................................................................................................................................
...................................................................................................................................................
...................................................................................................................................................
...................................................................................................................................................
.............................................................................................................................................. [3]
[Total: 10]
12
0610/42/O/N/18© UCLES 2018
4 Insulin is a hormone that regulates the concentration of glucose in the blood.
(a) Define the term hormone.
...................................................................................................................................................
...................................................................................................................................................
...................................................................................................................................................
...................................................................................................................................................
...................................................................................................................................................
.............................................................................................................................................. [3]
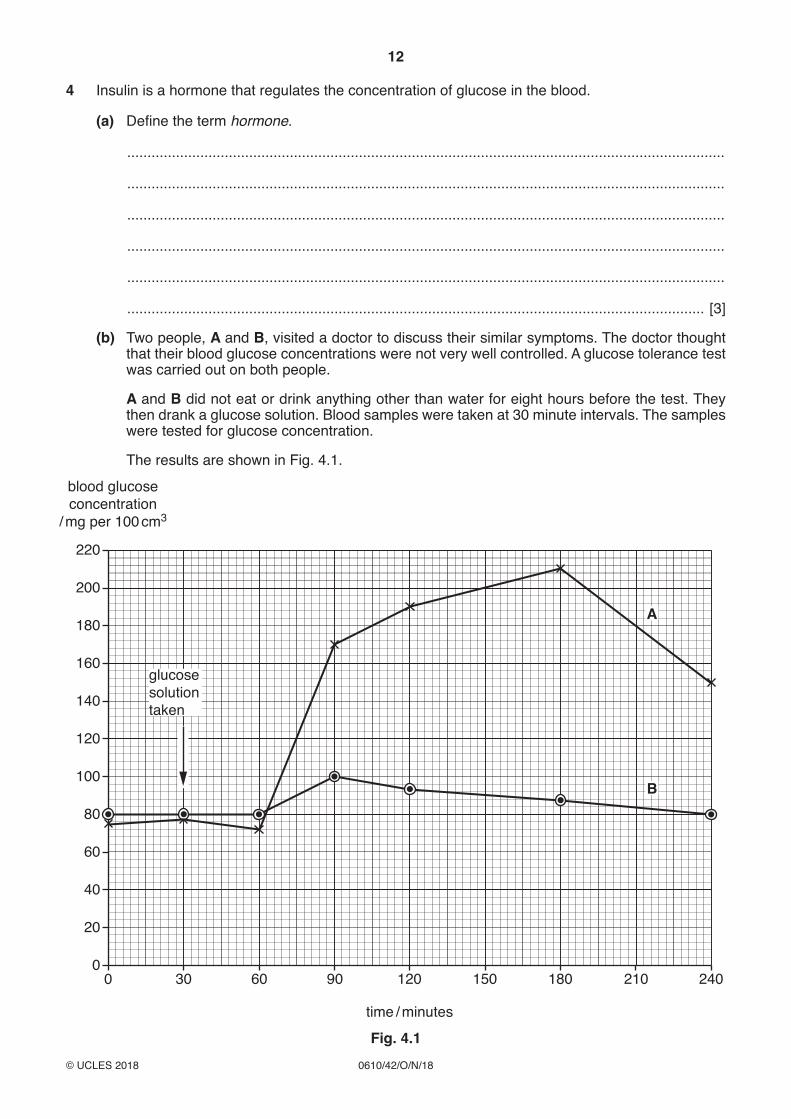
(b) Two people, A and B, visited a doctor to discuss their similar symptoms. The doctor thought that their blood glucose concentrations were not very well controlled. A glucose tolerance test was carried out on both people.
A and B did not eat or drink anything other than water for eight hours before the test. They then drank a glucose solution. Blood samples were taken at 30 minute intervals. The samples were tested for glucose concentration.
The results are shown in Fig. 4.1.
00
20
40
60
80
100
120
140
160
180
200
220
30 60 90 120 150 180 210 240
blood glucoseconcentration
/ mg per 100 cm3
time / minutes
B
A
glucosesolutiontaken
Fig. 4.1
13
0610/42/O/N/18© UCLES 2018 [Turn over
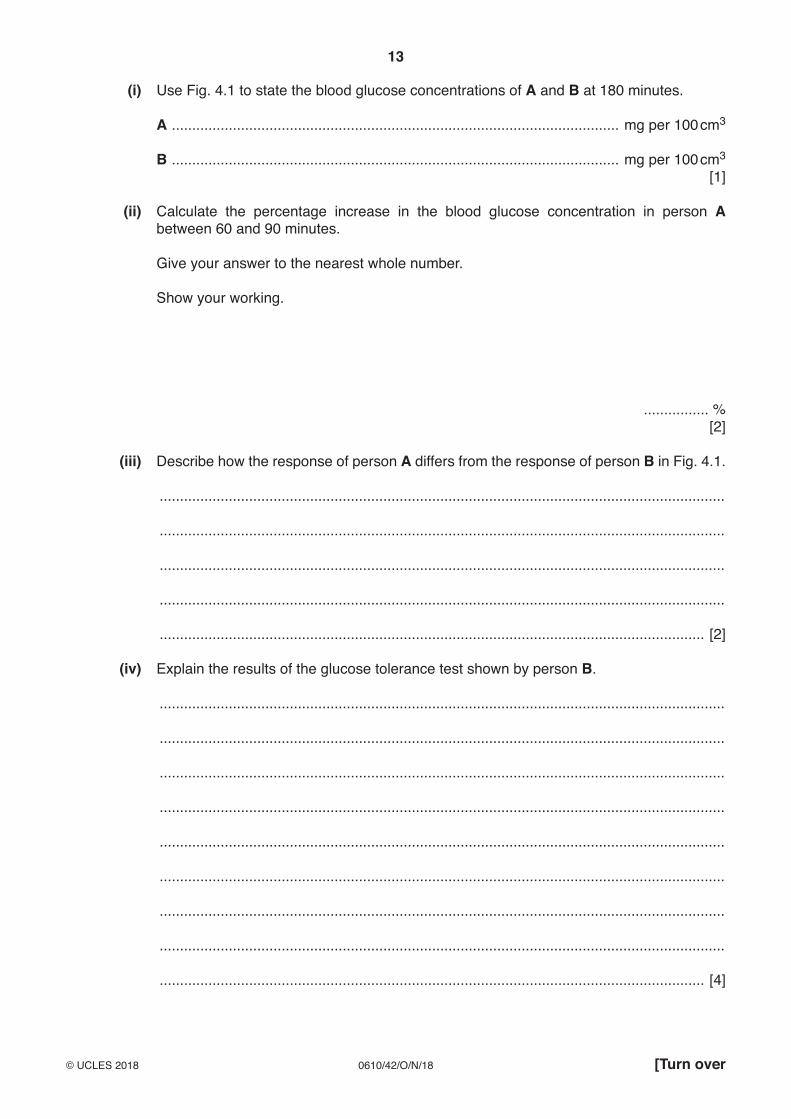
(i) Use Fig. 4.1 to state the blood glucose concentrations of A and B at 180 minutes.
A .............................................................................................................. mg per 100 cm3
B .............................................................................................................. mg per 100 cm3
[1]
(ii) Calculate the percentage increase in the blood glucose concentration in person A between 60 and 90 minutes.
Give your answer to the nearest whole number.
Show your working.
................ %[2]
(iii) Describe how the response of person A differs from the response of person B in Fig. 4.1.
...........................................................................................................................................
...........................................................................................................................................
...........................................................................................................................................
...........................................................................................................................................
...................................................................................................................................... [2]
(iv) Explain the results of the glucose tolerance test shown by person B.
...........................................................................................................................................
...........................................................................................................................................
...........................................................................................................................................
...........................................................................................................................................
...........................................................................................................................................
...........................................................................................................................................
...........................................................................................................................................
...........................................................................................................................................
...................................................................................................................................... [4]
14
0610/42/O/N/18© UCLES 2018
(v) The doctor thought that person A had Type 1 diabetes.
Describe three symptoms of Type 1 diabetes.
...........................................................................................................................................
...........................................................................................................................................
...........................................................................................................................................
...........................................................................................................................................
...................................................................................................................................... [3]
[Total: 15]
15
0610/42/O/N/18© UCLES 2018 [Turn over
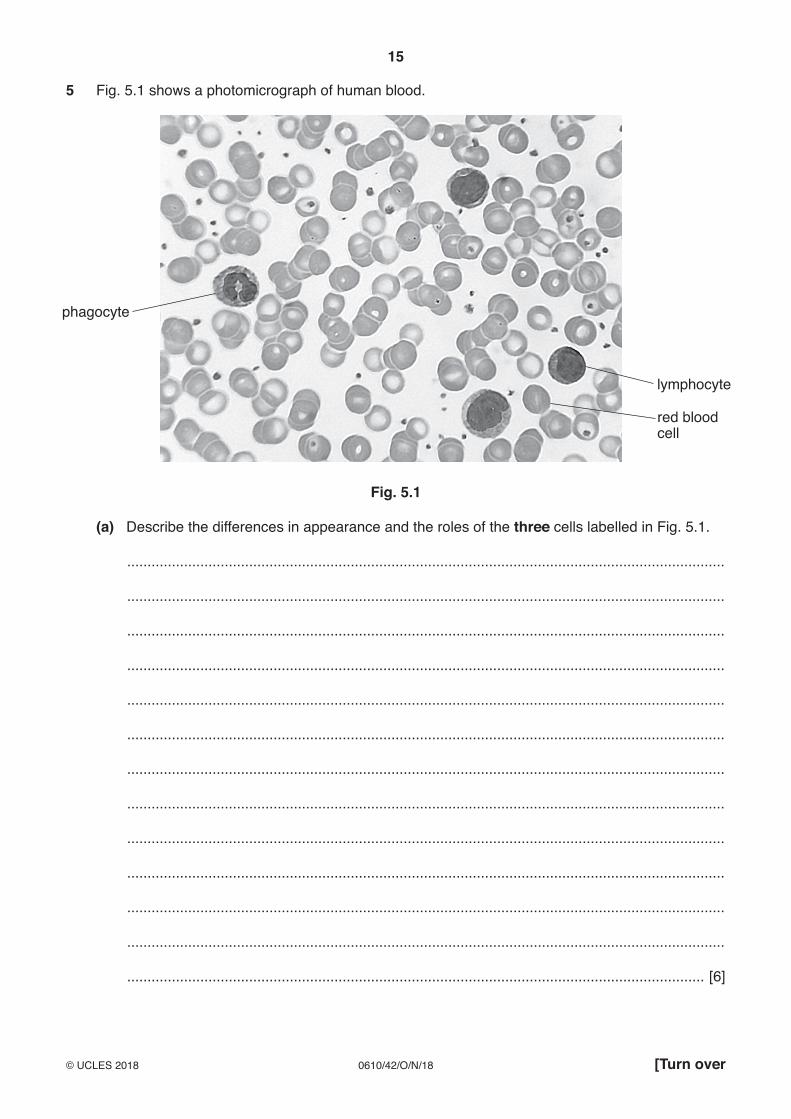
5 Fig. 5.1 shows a photomicrograph of human blood.
phagocyte
red bloodcell
lymphocyte
Fig. 5.1
(a) Describe the differences in appearance and the roles of the three cells labelled in Fig. 5.1.
...................................................................................................................................................
...................................................................................................................................................
...................................................................................................................................................
...................................................................................................................................................
...................................................................................................................................................
...................................................................................................................................................
...................................................................................................................................................
...................................................................................................................................................
...................................................................................................................................................
...................................................................................................................................................
...................................................................................................................................................
...................................................................................................................................................
.............................................................................................................................................. [6]
16
0610/42/O/N/18© UCLES 2018
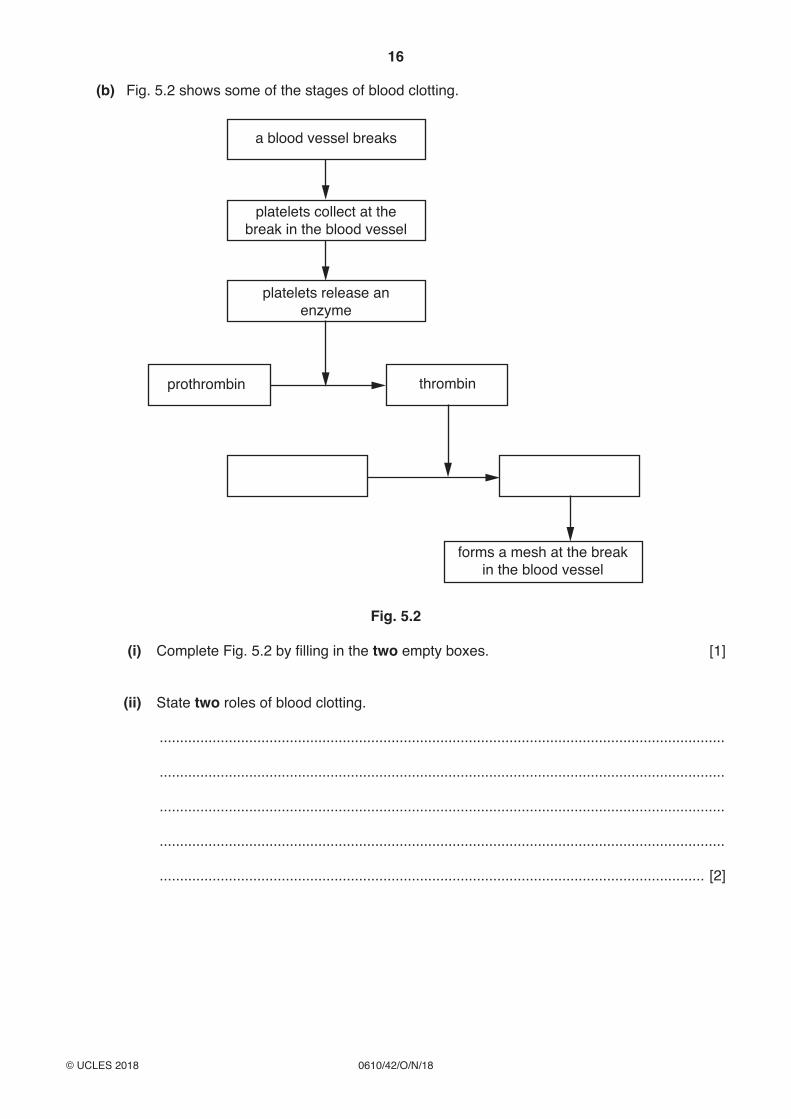
(b) Fig. 5.2 shows some of the stages of blood clotting.
a blood vessel breaks
platelets collect at thebreak in the blood vessel
platelets release anenzyme
forms a mesh at the breakin the blood vessel
prothrombin thrombin
Fig. 5.2
(i) Complete Fig. 5.2 by filling in the two empty boxes. [1]
(ii) State two roles of blood clotting.
...........................................................................................................................................
...........................................................................................................................................
...........................................................................................................................................
...........................................................................................................................................
...................................................................................................................................... [2]
17
0610/42/O/N/18© UCLES 2018 [Turn over
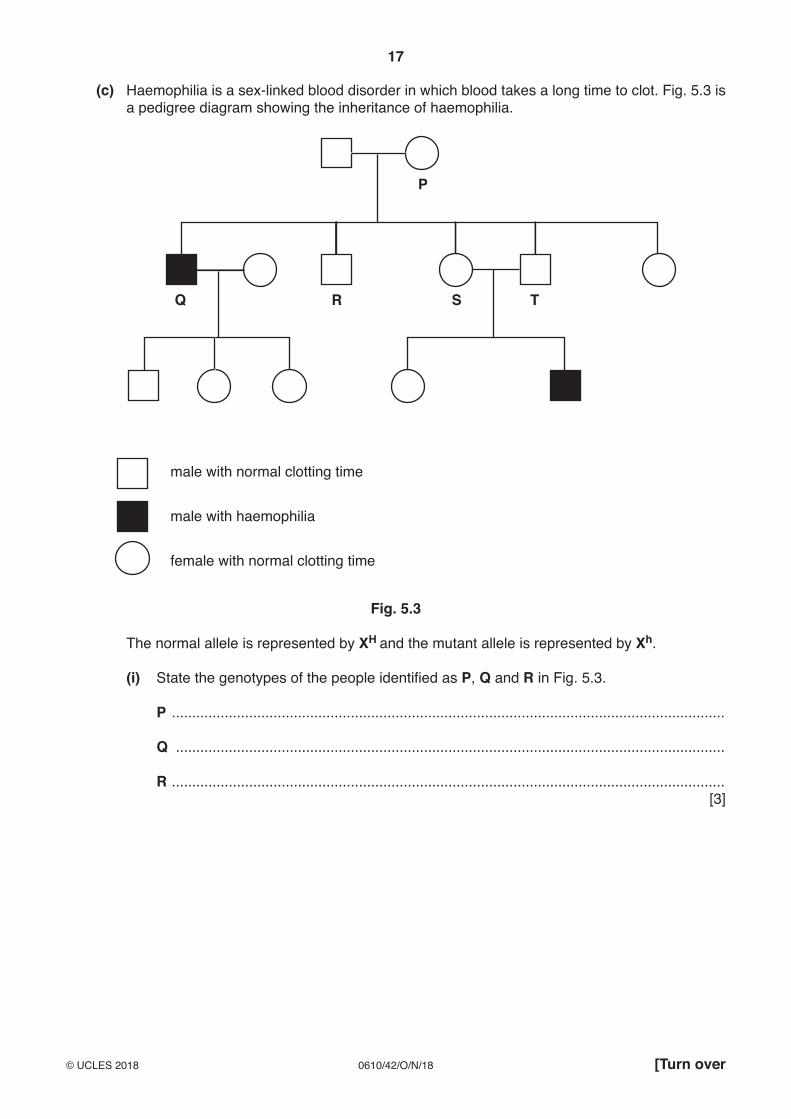
(c) Haemophilia is a sex-linked blood disorder in which blood takes a long time to clot. Fig. 5.3 is a pedigree diagram showing the inheritance of haemophilia.
Q R
P
S T
male with normal clotting time
male with haemophilia
female with normal clotting time
Fig. 5.3
The normal allele is represented by XH and the mutant allele is represented by Xh.
(i) State the genotypes of the people identified as P, Q and R in Fig. 5.3.
P ........................................................................................................................................
Q .......................................................................................................................................
R ........................................................................................................................................[3]
18
0610/42/O/N/18© UCLES 2018
(ii) The couple S and T are expecting another child.
What is the probability that the child will have haemophilia?
Space for working
...................................................................................................................................... [1]
(iii) Define the term sex-linked characteristic.
...........................................................................................................................................
...........................................................................................................................................
...........................................................................................................................................
...........................................................................................................................................
...................................................................................................................................... [2]
[Total: 15]
19
0610/42/O/N/18© UCLES 2018 [Turn over
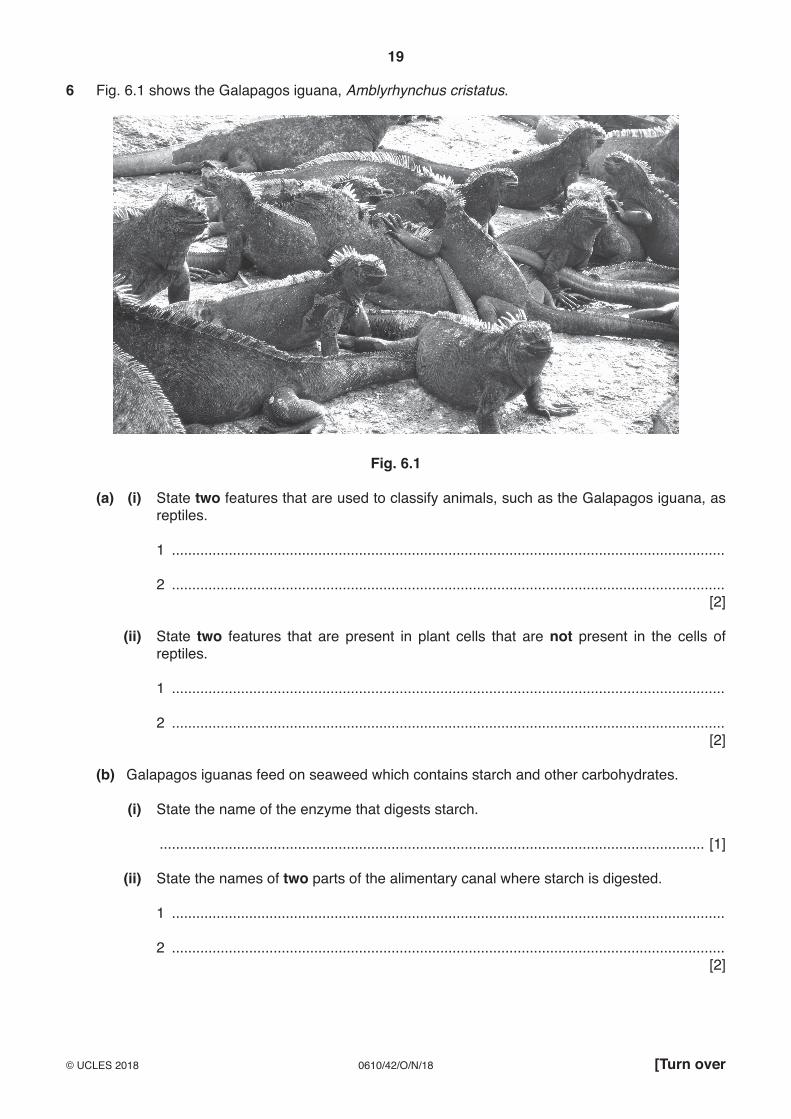
6 Fig. 6.1 shows the Galapagos iguana, Amblyrhynchus cristatus.
Fig. 6.1
(a) (i) State two features that are used to classify animals, such as the Galapagos iguana, as reptiles.
1 ........................................................................................................................................
2 ........................................................................................................................................[2]
(ii) State two features that are present in plant cells that are not present in the cells of reptiles.
1 ........................................................................................................................................
2 ........................................................................................................................................[2]
(b) Galapagos iguanas feed on seaweed which contains starch and other carbohydrates.
(i) State the name of the enzyme that digests starch.
...................................................................................................................................... [1]
(ii) State the names of two parts of the alimentary canal where starch is digested.
1 ........................................................................................................................................
2 ........................................................................................................................................[2]
20
0610/42/O/N/18© UCLES 2018
Permission to reproduce items where third-party owned material protected by copyright is included has been sought and cleared where possible. Every reasonable effort has been made by the publisher (UCLES) to trace copyright holders, but if any items requiring clearance have unwittingly been included, the publisher will be pleased to make amends at the earliest possible opportunity.
To avoid the issue of disclosure of answer-related information to candidates, all copyright acknowledgements are reproduced online in the Cambridge International Examinations Copyright Acknowledgements Booklet. This is produced for each series of examinations and is freely available to download at www.cie.org.uk after the live examination series.
Cambridge International Examinations is part of the Cambridge Assessment Group. Cambridge Assessment is the brand name of University of Cambridge Local Examinations Syndicate (UCLES), which is itself a department of the University of Cambridge.
(c) There are many threats to wildlife in the Galapagos.
Describe ways in which endangered species can be conserved.
...................................................................................................................................................
...................................................................................................................................................
...................................................................................................................................................
...................................................................................................................................................
...................................................................................................................................................
...................................................................................................................................................
...................................................................................................................................................
...................................................................................................................................................
...................................................................................................................................................
...................................................................................................................................................
.............................................................................................................................................. [5]
(d) One aim of conservation is to maintain resources in natural ecosystems.
State three resources that natural ecosystems provide for humans.
1 ................................................................................................................................................
2 ................................................................................................................................................
3 ................................................................................................................................................[3]
[Total: 15]


![WELCOME [] · Jaime Chase Australian Haemophilia Nurses’ Group Stephen Matthews Australian Haemophilia Nurses’ Group Alison Morris Australian and NZ Physiotherapy Haemophilia](https://img.pdfslide.net/doc/110x75/5e50837a1b4e1e39a670712f/welcome-jaime-chase-australian-haemophilia-nursesa-group-stephen-matthews.jpg)


![PRODUCT MONOGRAPH - Pr innohep® - LEO Pharma8.0)_-_26-MAY-2017[1].pdf · insufficiency, women with abortus imminens) • Haemophilia or major blood clotting disorders • Acute cerebral](https://img.pdfslide.net/doc/110x75/5e31a4986b48be720b4f9615/product-monograph-pr-innohep-leo-pharma-80-26-may-20171pdf-insufficiency.jpg)