Embed Size (px)
Citation preview
UNIVERSITY OFCAMBRIDGE
Cambridge Working Papers in Economics
Divine Competition: Religious Organisations
and Service Provision in India
Sriya Iyer, Chander Velu and Melvyn Weeks
CWPE 1409
Divine Competition: Religious Organisations and Service
Provision in India
Sriya IyerFaculty of Economics
University of Cambridge
Chander VeluDepartment of EngineeringUniversity of Cambridge
Melvyn WeeksFaculty of Economics
University of Cambridge
May 16, 2014
Abstract
This paper examines religious and non-religious service provision by religious or-ganisations in India. We present a stylized Hotelling-style model in which two religiousorganisations differentiate themselves on the strength of religious beliefs in order tocompete in attracting adherents. We show in the model two central predictions: first,that the organisations will differentiate themselves on the strength of religious beliefs.Second, that in equilibrium, economic inequality makes the organisations increase theirprovision of non-religious services. To test this, we present unique primary survey dataon the economics of religion, collected by us between 2006 and 2010 from 568 Hindu,Muslim, Christian, Sikh and Jain religious organisations spread across 7 Indian states.We use these data to demonstrate that the organisations have substantially increasedtheir provision of non-religious services. We also provide quantitative evidence based oneconometric testing to highlight that religious organisations are differentiating them-selves on the strength of religious beliefs with respect to other organisations, and arealso providing higher education and health services as economic inequality increases inIndia.
JEL Classification Code: Z12Keywords: Economics of Religion, Service Provision, Hotelling Model, Inequality, India
Acknowledgements This work has been funded by the Spiritual Capital Research Program,
sponsored by the Metanexus Institute on Religion and Science, with the generous support of
the John Templeton Foundation. We are also grateful for research grant support to the Isaac
Newton Trust, University of Cambridge. We are especially indebted to Indicus Analytics,
Laveesh Bhandari, Siddartha Dutta, Shaheen Ansari, Gaurav Munjal, Suryakant Yadav, and
the Indicus team, who assisted us in helping collect the data for the India religion survey. For
excellent research assistance we thank Tirthankar Chakravarty, Rachana Shanbhogue, Abdul
Mumit, Anand Shrivastava and Paul Sweeny. For helpful discussions and comments we thank
Kathy Anderson, Robert Barro, Eli Berman, Tiago Calvacanti, Latika Chaudhary, Partha
Dasgupta, Vessela Daskalova, Steven Durlauf, Sanjeev Goyal, Timothy Guinnane, Geoffrey
Harcourt, Larry Iannaccone, Timur Kuran, Gabriel Leon, Gary Libecap, Vijay Mahajan,
Rachel McCleary, Pratap Bhanu Mehta, Robbie Mochrie, Kaivan Munshi, Christos Pitelis,
Raghuram Rajan, Robert Rowthorn, Abusaleh Shariff, John Thompson, Jun Xue, the other
participants of the Spiritual Capital Research Program, and seminar or conference participants
including ASSA 2011, ASREC 2014, EPCS 2014, IEA World Congress 2014, Herriot-Watt,
Reading and St Catharine’s College, Cambridge.
1
Political economy or economics is a study of mankind in the ordinary business of life; it
examines that part of individual and social action which is most closely connected with the
attainment and with the use of the material requisites of wellbeing.
Thus it is on the one side a study of wealth; and on the other, and more important side, a
part of the study of man. For man’s character has been moulded by his every-day work, and
the material resources which he thereby procures, more than by any other influence unless
it be that of his religious ideals; and the two great forming agencies of the world’s history
have been the religious and the economic. Here and there the ardour of the military or the
artistic spirit has been for a while predominant: but religious and economic influences have
nowhere been displaced from the front rank even for a time; and they have nearly always
been more important than all others put together.
Alfred Marshall, Principles of Economics (1890), Book 1, Chapter 1, Page 1.
1 Introduction
Alfred Marshall’s prophecy could not have been more prescient as economics today has
much to offer the study of contemporary religion. In the twenty-first century the resilience
of religion in both developed and developing countries has been observed by scholars inves-
tigating the economics and sociology of religion (Iannaccone 1998; Stark and Finke, 2001;
Berman 2009; Kuran 2010). Religion constitutes an important source of ‘spiritual capital’,
contributing significantly to building norms and networks among populations organised on
the basis of religion. Against this background, our research asks a simple question: How
do religious organisations provide and change their religious and non-religious services in
response to the competition for adherents and income inequality?
Studies in the economics of religion have assessed the effect of religion on economic
behaviour at both microeconomic and macroeconomic levels (Azzi and Ehrenberg 1975;
Iannaccone 1994; Stark and Finke 2000; Barro and McCleary 2003; Glaeser 2005; Dehejia
et al. 2007; Krueger 2007; Berman 2009). Sociologists of religion have discussed the
‘religion-market model’ (Stark and Finke 2001). In particular, Finke (2004) has argued
that while most religions preserve their core teachings, they introduce innovations in the
periphery in terms of how services are provided and resources are secured for members.
Economists have written seminal papers regarding how religious strictness might overcome
free-rider problems, and especially how this can increase commitment, raise participation,
and enable a group to offer greater benefits to potential members (Iannaccone 1992; Berman
2000).
Our paper makes two main contributions. First, to provide a model of religion and
service provision by religious organisations that shows how the strength of religious beliefs
might differ in response to competition. Second, we take our model to new primary data to
show how religious organisations provide their religious and non-religious services consistent
with changes in income inequality. We present a simple and stylized Hotelling-style model
in which two religious organisations choose a religious focal point and decide upon the
non-religious services provided. Two central predictions of the model are: (i) organisations
2
will differentiate themselves on the strength of religious beliefs; (ii) economic inequality
makes both organisations increase their provision of non-religious services. To test our
model, we also present a unique dataset – to the best of our knowledge, the first large-
scale economic survey of religious institutions undertaken in India. We find evidence that
religious organisations in India have increased their provision of non-religious services and
that this is related to economic inequality and competition.
Overwhelmingly, studies on the economics of religion are based on developed nations,
especially using contemporary US data (Iannaccone and Berman 2008). There is far less
research on the economics of religion in emerging economies such as India. India is charac-
terized by a multiplicity of religions, the active practice of religion, and religious conflict,
which has been commented upon extensively by historians, political scientists, economists
and sociologists (Bayly 1983; Engineer 1984; Bagchi 1991; Varshney 2000; Brass 2003;
Bohlken and Sergenti, 2010; Sen 2005; Mitra and Ray 2014). Some estimates have sug-
gested that there are over thirty thousand Muslim and other religious schools in India (US
Department of State 2010).
Yet, large-scale economic surveys of the activities of religious organisations in India
are conspicuously absent. Our study redresses this gap: our economic survey of religious
institutions consists of rich and unique primary data from 568 religious organisations, which
we collected between 2006 and 2010 in a survey spanning 7 large Indian states. This data
includes information on Hindu, Muslim, Christian, Sikh, and Jain organisations, and is
collected to examine the economic and competitive behaviour of these organisations. We
collected the data using the semi-structured interview format which reduces the possibility
of measurement error and which is appropriate when collecting data on a sensitive topic
like religion. The data cover religious service provision, non-religious service provision,
adherents, religious competition and other issues.
The remainder of this paper proceeds as follows: Section 2 discusses the current liter-
ature on the economics of religion that concerns religious positioning. Section 3 presents
the model. Section 4 discusses our primary survey of religious organisations undertaken in
India. Sections 5 and 6 present the quantitative econometric findings of the research that
tests the theoretical propositions developed and the key results. Section 7 concludes the
paper.
2 Religious Positioning and Social Services
Economists’ and other scholars’ have interests in religion and social economics more gener-
ally (Becker and Murphy 2000; Iannaccone, Neal, Boettke and McCloskey, 2005; Putnam
and Campbell 2010); and to the continuing persistence and impact of religion in developed
and developing countries alike (Iannaccone and Berman 2008; Bisin and Verdier 2000; Iyer
2008). The main focus of our work is on the links between the strength of religious beliefs,
service provision, religious competition and economic inequality.
Our work is located within the broadly socio-economic view of religion, which expounds
the rational-choice approach to the study of religion, and is found in the work of many
3
economists and sociologists (Azzi and Ehrenberg 1975; Iannaccone 1992; Iannaccone 1998;
Montgomery 1996; Stark, Iannaccone and Finke 1996; Stark and Finke 2000; Berman 2000).
They examine both the supply side, in terms of the structures of religious organisations
(Dehejia et al. 2007), and the demand side, in terms of the preferences of consumers
of religion (Oslington 2003). This implies that the activities of religious economies are
important.1
In this approach, individuals are rational consumers of religion who decide whether or
not to believe, or in which religion to believe, based on their attributes and relative to their
initial endowments. According to this view, people adopt religion because it is optimal
for them to do so and their beliefs and activities may change over time. In a similar
way, the supply of religion is explained by churches behaving like firms in a competitive
market, particularly regarding service provision to attract potential customers. This idea
also underlies our thinking in this paper. In this context, we think of this issue as if buyers
(or individuals) and sellers (or the religions) meet in a marketplace in which supply and
demand dictate allocation of adherents across religions.
Our study adds to existing work on the rational choice approach to understanding reli-
gion, but also to understanding how religious competition matters in developing countries.
Within the rational choice framework, one line of research that economists have pursued is
the so-called ‘club models’ of religion, which have contributed vitally to our understanding
of how sects develop. These models are based on the idea that producing and consuming
religion have all the features of a collective good and that, like other collective goods, there
is potential for free-riding, lack of commitment and participation. Hence, these models
look at stigmas and sacrifice as ways of screening members, and predict that more sectar-
ian communities have tighter networks, and higher aid from members than less sectarian
religious groups (Iannaccone 1992; Berman 2000; Chen 2010; Abramitzky 2011). The the-
ory that we propose in this paper builds on existing theoretical research to the extent that
we are also interested in how religious groups position themselves relative to other groups.
However, we suggest that, particularly in emerging economies, economic inequality is an
important factor that might differentiate groups on the religious spectrum.
Studies in the economics of religion have focused on the links between religion and
economic theory; and the effect of religion on economic behaviour at both microeconomic
and macroeconomic levels. Adam Smith first made reference to the church and competi-
tion between religions in The Wealth of Nations and in The Theory of Moral Sentiments.
Smith considered religion as a means through which individuals enhanced the value of their
human capital. He was also interested in the incentives that prompt individuals to choose
to participate in religion-related activities and the effects of different religious beliefs on
individual behaviour (Anderson 1988).
More recent studies explore the effect of religion on economic behaviour at both mi-
croeconomic and macroeconomic levels and are also concerned with policy debates about
faith-based welfare programmes and the economic regulation of the church. One concern is
1Stark and Finke, for example, state: ‘Religious economies are like commercial economies in that theyconsist of a market of current and potential customers, a set of organisations or firms seeking to serve thatmarket, and the religion offered by various organisations’ (Stark and Finke, 2000, pp. 2–3).
4
also whether deregulation, or a lack of regulation of religious organisations, is imperative.
Economists have commented on religious competition and why economic growth has not
led to a decline in the practice of religion in rich countries (McBride 2010).
One theme of the economics of religion literature is that many religious groups have
provided social services such as education, as shown, for example, in a national study of
congregations in the US (Chaves 2004) and how church provision of services in that country
changed with state provision and economic legislation in the 1930s (Gruber and Hungerman
2007). There are also examples from the developing world, such as, for example, the Hamas,
which have provided spiritual services alongside social and welfare services in the regions
where they operate (Berman 2009). As Berman points out, this approach emphasizes
the social and economic aspects of religious communities, rather than purely the effect of
religious faith.2
The question is why do religious organisations provide social services? Altering the
interpretation of religious doctrine and practice is one channel through which religious
differentiation might take place, but varying the service levels provided by religious or-
ganisations, particularly with respect to education and health, may be another channel,
especially where these services are less well provided for by the state. Recent research also
discusses how church activities can substitute for state activities (Hungerman 2005). It is
important to examine this relationship between religion and service provision because some
theologically strict religions argue that social services are only a means to attain spiritual
ends, or to promote religious conversion. More liberal religions argue that providing social
services is a moral imperative and so an end in itself, regardless of whether those who are
served convert to the religion. So for some religions providing social services might simply
be a moral end in itself.
We argue in this paper that for other organisations, social service provision may arise
in response to economic inequality, or even as a means of survival in multi-religious com-
munities in which religions not undertaking social-service provision may ‘fall off the cliff’
so to speak, thereby witnessing evidence of declining religious adherence.
In this context, one seminal study of the vitality of religious organisations in the US
argues that most religions preserve their core teachings, but introduce innovations in terms
of ‘how congregations provide services for members, secure resources from members, or
support the core teachings of the larger institution’ (Finke, 2004, p. 23). So religions
might consider new products and methods that enhance the productivity and efficiency of
the religious organisation through the religious and non-religious services that they provide,
thereby increasing their efficiency in competing for adherents.
2As Berman writes: ‘Distinguishing between those two functions is often difficult, but the distinctionis critical. Regardless of the strength of a member’s faith, and regardless of the salience of a theology,an organisation that can limit shirking will be more successful at mutual aid. . . That’s why social serviceprovision and spiritual service provision so often appear together in communities, making it difficult todistinguish commitment to beliefs from commitment to community, for community members and outsideobservers alike.’ (Berman 2009, p. 19.)
5
3 The Model
Suppose we begin with a simplified economy in which there are two religious organisations.
Our model is applicable to two situations: first, where there are two organisations from
different religions, for example, if we were thinking about competition between Hindus and
Muslims, or second, to a situation in which there are two competing organisations belonging
to the same religion, which may be more typically the case in India. We assume that
each organisation is competing for adherents and that each organisation tries to maximize
adherents via choosing a focal point.3 By a focal point we mean the strength of religious
beliefs4.
Each organisation maximises adherents possibly owing to political, monetary or other
benefits derived from having a large number of adherents. Each organisation also provides
non-religious services that we assume the poor will value and use more than the rich. Our
model assumes that each adherent chooses membership of a religious organisation based
upon the difference between their personal focal point relative to that of the religious
organisation, and the wealth benefits from membership of a religious organisation.5 The
two religious organisations each choose a religious focal point and decide upon the non-
religious services provided. But they need to do this by taking into account each other’s
choices, while they are both competing for adherents in this simplified model.
Let us now develop our model more formally. Let I denote a set of individuals. For
individual i ∈ I, let ei ∈ [0, ∞) denote individual i’s economic well-being. At the outset we
assume ei = e, for all i. We will relax the assumption that everyone’s economic well-being
is the same as we extend the model to include economic inequality. xi denotes individual
i’s religiousness which we assume is uniformly distributed across all individuals over [0, 1].
Two religious organisations compete for individuals in I by choosing a religious focal
point x ∈ [0, 1], and an amount of non-religious services s ∈ [0,∞). The organisations
incur a cost of providing services. The two organisations have identical pay-off functions,
which are (p − s)n, where p > 0 is a given constant, and n is the number of adherents.
The term (p − s) captures the net benefit for the organisation of providing non-religious
services for each adherent. Individual i’ s expected utility function is assumed to have the
following form:
ui = −(xi − x)2 +s
ei(1)
where x and s are chosen by the organisation that individual i chooses to be affiliated with.
The utility function takes this form in that we include the fraction sei
as we assume that
the poor will value these services more than the rich, because the rich already have them.
The two organisations choose their religious focal points x (x1 and x2) simultaneously
and then observe each other’s choices of x, and choose their non-religious services s (s1 and
s2) simultaneously. Individuals choose the organisation that gives them a higher utility.
3A focal point can also be thought of as the product space in the market for religion.4In other models in the economics of religion, economists have talked about religious ‘strictness’ (Ian-
naccone 1994). Our focal point can be interpreted to include strictness that may also influence the strengthof religious beliefs.
5We can think of this, say, as education, health, employment, or other services arising from membershipof the organisation.
6
Our model is similar to Hotelling’s (1929) model of price and location competition (Vogel
2011) in that the timing of the game in our model is analagous to a standard location-price
competition model in which firms decide first where to locate and secondly what prices to
charge. In our context the religious focal point decision is likely to be more ‘sticky’ than
the service provision decision. Religious organisations need to be clear where they stand
‘religiously’ before they can determine their service levels.
We discuss the characterisation of our equilibrium in two stages – first, when there is no
economic inequality and everyone is assumed to have the same economic well-being. Then,
we relax this assumption and discuss our model when economic inequality is introduced.
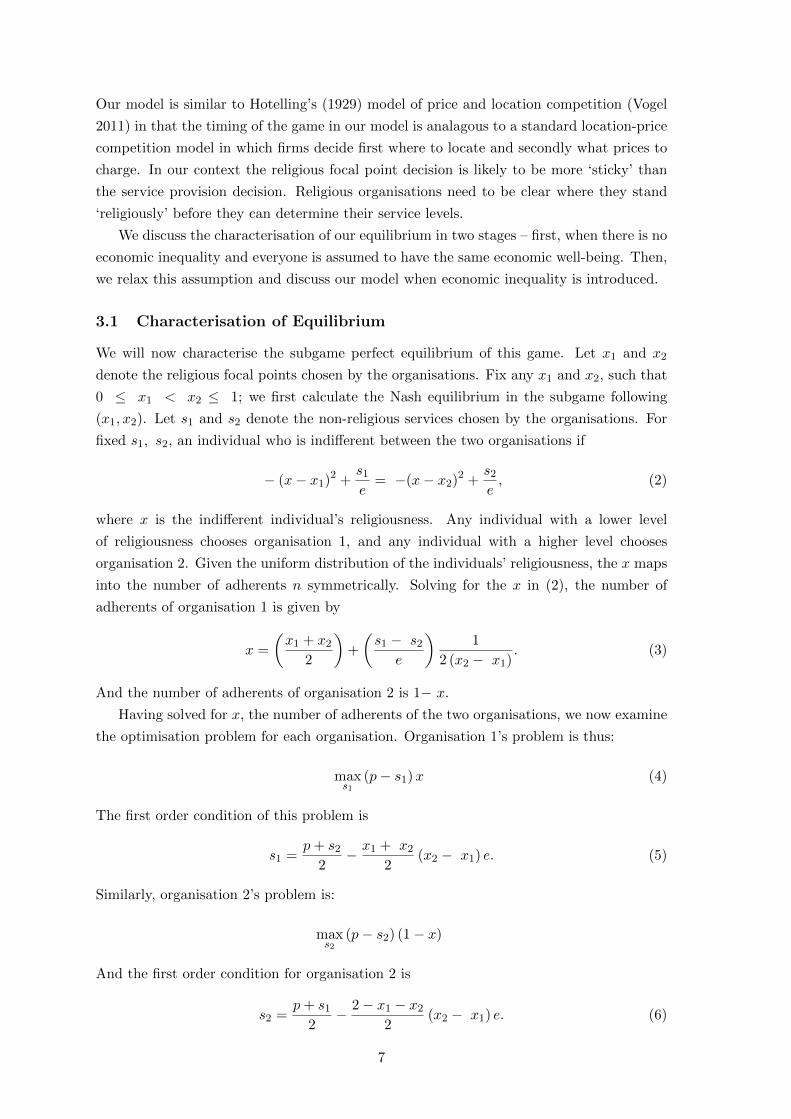
3.1 Characterisation of Equilibrium
We will now characterise the subgame perfect equilibrium of this game. Let x1 and x2
denote the religious focal points chosen by the organisations. Fix any x1 and x2, such that
0 ≤ x1 < x2 ≤ 1; we first calculate the Nash equilibrium in the subgame following
(x1, x2). Let s1 and s2 denote the non-religious services chosen by the organisations. For
fixed s1, s2, an individual who is indifferent between the two organisations if
− (x− x1)2 +s1e
= −(x− x2)2 +s2e, (2)
where x is the indifferent individual’s religiousness. Any individual with a lower level
of religiousness chooses organisation 1, and any individual with a higher level chooses
organisation 2. Given the uniform distribution of the individuals’ religiousness, the x maps
into the number of adherents n symmetrically. Solving for the x in (2), the number of
adherents of organisation 1 is given by
x =
(x1 + x2
2
)+
(s1 − s2
e
)1
2 (x2 − x1). (3)
And the number of adherents of organisation 2 is 1− x.
Having solved for x, the number of adherents of the two organisations, we now examine
the optimisation problem for each organisation. Organisation 1’s problem is thus:
maxs1
(p− s1)x (4)
The first order condition of this problem is
s1 =p+ s2
2− x1 + x2
2(x2 − x1) e. (5)
Similarly, organisation 2’s problem is:
maxs2
(p− s2) (1− x)
And the first order condition for organisation 2 is
s2 =p+ s1
2− 2− x1 − x2
2(x2 − x1) e. (6)
7

Solving for s1 and s2, we have:
s1 = p− 1
3(x2 − x1) (2 + x1 + x2) e (7)
s2 = p− 1
3(x2 − x1) (4− x1 − x2) e (8)
Now we calculate the equilibrium choices of x1 and x2. For fixed x1 and x2, organisation
1’s pay-off is:
π1 (x1, x2) := (p− s1)x, (9)
where x is given in (3), and s1 is given in (7).
To emphasise the dependence of x on x1, x2, s1 and s2, and the dependence of s1 and
s2 on x1 and x2, we rewrite (9) as:
π1 (x1, x2) = (p− s1 (x1, x2))x (x1, x2, s1 (x1, x2) , s2 (x1, x2)) (10)
By the envelope theorem, as we differentiate π1 (x1, x2) with respect to x1, we can take
s1(x1, x2) as a constant, because the partial derivative of π1 with respect to s1 is equal to
0 at the optimal s1(x1, x2). Moreover, in equilibrium it must be that p ≥ s1 (x1 x2).
Therefore, to calculate the impact of x1 on π1, it suffices to calculate dxdx1
+ dxds2
ds2dx1
. From
(3) we note thatdx
dx1=
1
2+s1 − s2
e
1
2(x2 − x1)2 . (11)
From (3) and (7)dx
ds2
ds2dx1
=1
3
(x1 − 2)
(x2 − x1). (12)
From (7)
s1 − s2 =1
3e (x2 − x1) (2− 2x1 − 2x2). (13)
Hence:dx
dx1=
1
2+
1
3
(1− x1 − x2)
(x2 − x1)(14)
From the above, the calculation shows that dxdx1
+ dxds2
ds2dx1
< 0, for all x1, x2. Therefore,
organisation 1 chooses x1 = 0 in equilibrium. Similarly organisation 2 chooses x2 = 1
in equilibrium. The two organisations differentiate their religious focal points, to avoid
competition in non-religious services.
So far in the analysis we have assumed that x1 < x2.6 We now argue that it is impossible
to have an equilibrium in which x1 = x2. This is because in the subgame conditional on
x1 = x2 being chosen, the two organisations will compete away any positive profits by
raising s all the way to p; otherwise one organisation can always offer a few more services
than its competitor and grab the whole market, thus obtaining a higher pay-off. Hence,
both organisations receive zero profits in the subgame. But then organisation 1 can deviate
by choosing a lower x1 and make a positive profit, because our analysis above shows that
both organisations make positive profits in any subgame following x1 < x2 being chosen.
6A similar argument can be made for the case where x2 < x1.
8
3.2 Characterization of Equilibrium with Economic Inequality
Until now, we have assumed that there are 2 organisations on the supply side but that
the demand side is entirely homogenous because we have all adherents who have identical
economic well-being. In reality however, we do see economic inequality across adherents
and much heterogeniety on the demand side, so in order to incorporate this aspect we
now introduce economic inequality in our model. By starting with (2) which states the
indifference condition that the 2 organisations ought to satisfy if an adherent is indifferent
across the 2 organisations, we can now introduce economic inequality. In order to examine
the effect of economic inequality we focus on changing the population from being equally
well-off to increased dispersion in the well-being whilst maintaining the average well-being
of the population, i.e., a mean-preserving spread in their well-being.
Let eH = ae and eL = be where a and b are positive constants. Suppose the economic
well-being of half of the population goes up to eH , and the economic well-being of the other
half goes down to eL. Moreover, we assume that there is no correlation at the individual
level between economic well-being and religiousness. Without loss of generality, we can
assume that for each x ∈ [0, 1], there is a rich individual with eH with probability 1/2,
and a poor individual with eL with probability 1/2; both have the same religiousness, x.
We follow the same steps above to characterize the subgame perfect equilibrium of
the game with inequality. Fix x1 and x2, let xH denote the number of rich adherents of
organisation 1, and xL denote the number of poor adherents of organisation 1. We again
write the same indifference condition (2) now as:
− (xH − x1)2 +s1eH
= −(xH − x2)2 +s2eH− (xL − x1)2 +
s1eL
= −(xL − x2)2 +s2eL
(15)
Hence
xH =x1 + x2
2+s1 − s2eH
1
2 (x2 − x1)xL =
x1 + x22
+s1 − s2eL
1
2 (x2 − x1). (16)
Hence the total number of adherents of organisation 1 is
xH + xL2
=x1 + x2 + s1−s2
2(x2−x1)eH+eLeHeL
2. (17)
Organisation 1’s optimisation problem is
maxs1
(p− s1)(xH + xL
2
). (18)
The first order condition of the problem is
s1 =p+ s2
2− (x1 + x2) (x2 − x1)
eHeLeH + eL
. (19)
Organisation 2’s objective function is
maxs2
(p− s2)(
1−(xH + xL
2
) )9
. The first order condition for organisation 2’s problem may be written
s2 =p+ s1
2− (2− x1 − x2)(x2 − x1)
eHeLeH + eL
. (20)
Comparing (19) and (20) with (5) and (6), we observe that the non-religious services
provided by the two organisations increase in the inequality case, if
eHeLeH + eL
<e
2, (21)
or equivalently b < a2a−1 . Therefore, both religious organisations will provide more non-
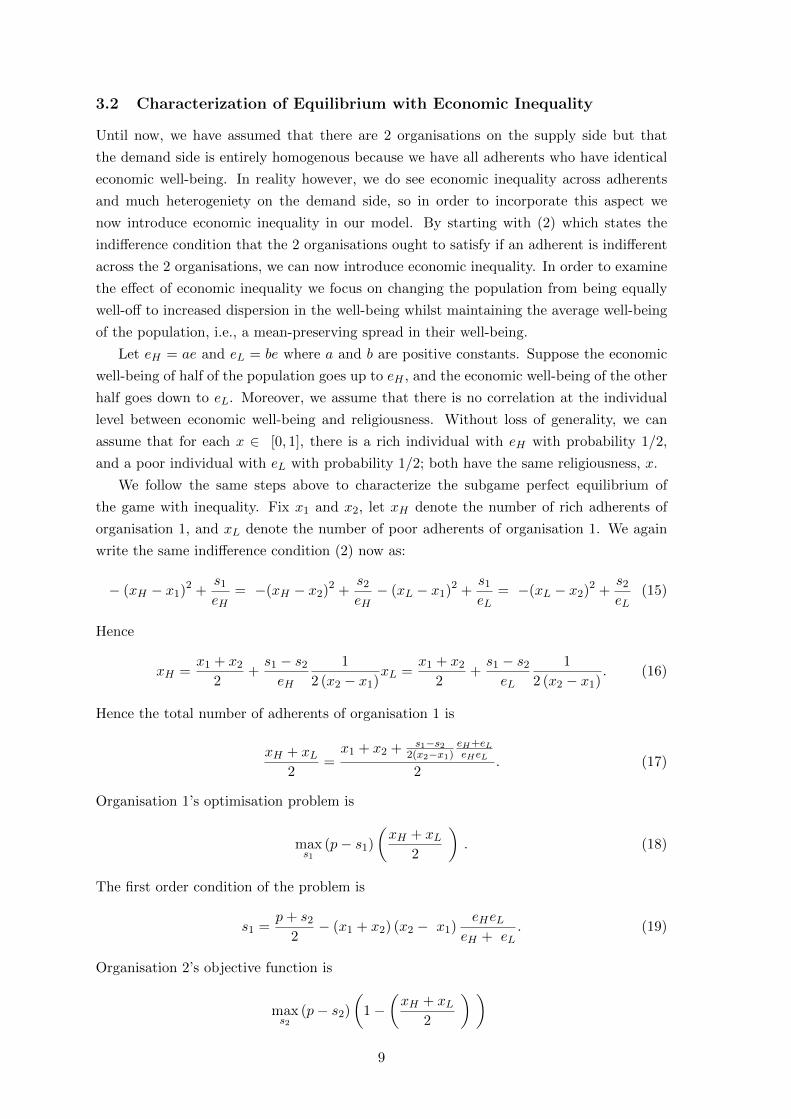
religious services when there is economic inequality7. Figure 1 illustrates the effect of
Figure 1: Effects of inequality on the provision of non-religious services.
economic inequality on the non-religious service provision of organisations 1 and 2. The
intersection of the continuous lines representing equations (6) and (7) show the level of
non-religious service provision without economic inequality. In contrast, the intersection
of the dotted lines representing Equations (19) and (20) show non-religious services with
inequality. The intersection of the lines show the optimal levels of service provision with
and without inequality - these are marked as s∗1 and s∗2, compared to, s∗∗1 and s∗∗2 . As
can be seen, the non-religious service provision is greater (s∗∗2 > s∗2), when there is some
economic inequality.
7It should be qualified that this result will hold only if the poor remain poor enough in that even with anincrease in economic well-being for the population, there should be a sizeable proportion of the populationthat is still poor enough to demand the services provided by the religious organisations.
10
Finally, we calculate the equilibrium choices of x1 and x2, in the inequality case. Notice
that if we replace eHeLeH+eL
by e2 in (17), (19), and (20) which are the total number of adherents
and the first order conditions for both organisations’ problems, we get exactly (3), (5),
and (6) which were in the non-inequality case. Notice also that in the envelope theorem
argument above, the partial derivatives are independent of e. Therefore, the same result
carries on to the inequality case, i.e., x1 = 0, x2 = 1.
We can summarise the analysis into the following two propositions:
Proposition 1. In the presence of competition in the provision of non-religious services, the
religious organisations differentiate their religious focal points.
Proposition 2. The provision of non-religious services by the religious organisations in-
creases when there is a change in economic inequality.
Hence, we show that when we solve the model mathematically, the subgame perfect
equilibrium for these religious organisations is such that it generates these two propositions
describing their behavior. The intuition behind Proposition 1 arises because the organi-
sations are differentiating themselves religiously in order to reduce the amount they have
to compete for providing non-religious services. The intuition behind Proposition 2 is that
when economic inequality rises, religious organisations provide more non-religious services.
This is because, assuming diminishing marginal utility of non-religious services in an indi-
vidual’s economic well-being, both religious organisations will find it in their interests to
provide more non-religious services to attract the population of less well-off individuals.
This is because the organisations are competing for more adherents among them. Our
model suggests that one factor that pushes religious organisations towards more extremes
is non-religious service provision: religious organisations essentially product differentiate in
order to reduce competition in service provision. In the next section we discuss the survey
of the religious organisations in India.
4 The Survey of Religious Organisations in India
As a part of this study we planned and executed a survey of 568 religious organisations
in India with a view to understanding their economic and competitive behaviour. We
emphasize that, to the best of our knowledge, no previous large-scale economic surveys
of religious organisations have been undertaken in India comparable to this survey. The
survey conducted between 2006 and 2010 involved extensive primary data collection and
fieldwork using questionnaires and personal interviews. The survey involved interviews with
272 Hindu (47.9 per cent), 248 Muslim (43.7 per cent), 25 Christian (4.4 per cent), and 23
Sikh and Jain religious organisations (4.1 per cent) based in the Indian states of Jammu
and Kashmir, Uttar Pradesh, West Bengal, Madhya Pradesh, Gujarat, Maharashtra and
Karnataka. In section 4.1 we discuss the approach to data collection and research design.
We discuss religious motivation and social practices in section 4.2, the strength of religious
beliefs in section 4.3, followed by a discussion in section 4.4 of the religious and non-religious
services provided by the religious organisations in our sample. Finally, we elaborate on the
role of religious competition in section 4.5 and economic inequality in section 4.6.
11
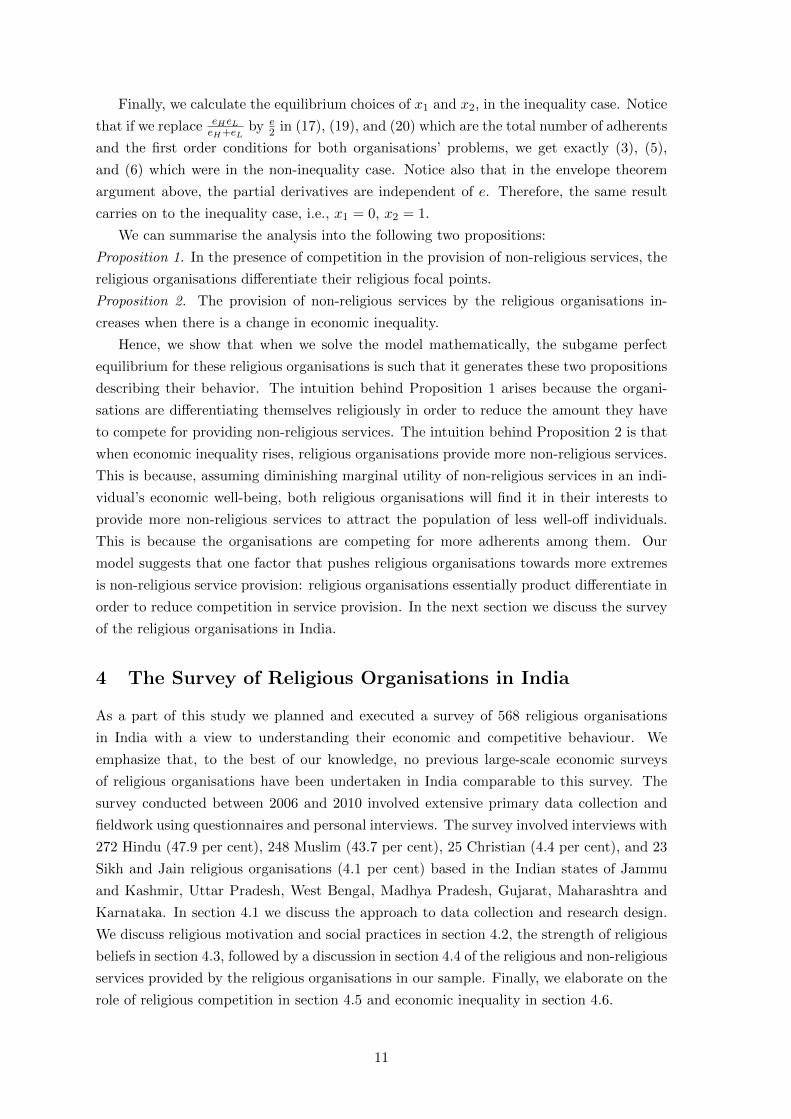
Table 1: Distribution of the Sample by Religion and Region
Hindu Muslim Christian Other All-India PercentageGujarat 51 34 3 0 88 15.5
Jammu and Kashmir 26 41 4 11 82 14.4Karnataka 27 42 6 0 75 13.2
Maharashtra 64 11 1 2 78 13.7Madhya Pradesh 40 30 2 3 75 13.2Uttar Pradesh 36 52 3 1 92 16.2West Bengal 28 38 6 6 78 13.7
Total 272 248 25 23 568 100.00Percentage 47.9 43.7 4.4 4.1
4.1 Research Design
A stratified random sample of religious organisations in selected districts of each of the
seven states was chosen, based on a listing of all religious organisations by the Registrar
of Charities. The stratified sampling framework consisted of equal samples between states.
The religious organisations consist of temples, mosques, churches, religion-based NGOs,
religion-based family trusts (parivar), religion-based trusts (samitis) and religion-based
communes (ashrams), other religion-based groups (mandals and sabhas), and religion-based
charities (madrasas), religion-based committees, and welfare societies.
The sample is diverse and shows that the organisations have been in existence for
varying lengths of time.8 The distribution of the sample by religion and states is shown in
Table 1. We used only Hindu and Muslim investigators. The states in which the survey
was conducted are shown in Figure 2.
Recent research has emphasised the importance of collecting accurate data when survey-
ing organisations using interview methods (Bloom and Van Reenan 2010; Bloom and Van
Reenan 2007). We follow the prescribed best practice in order to obtain unbiased responses
in our questionnaire survey and to reduce interviewer bias based on their perceptions. We
elaborate upon our approach below.
In order to reduce respondent bias, we conducted interviews with those individuals at
different levels of the organisation’s hierarchy. So in each organisation we interviewed those
individuals who were most closely involved with the religious and organisational decision-
making. In order to avoid ‘common-method bias’ on average three people were interviewed
in each organisation: typically a trustee, one person responsible for administration, and
another who could talk about financial issues9. The three people answered different ques-
tions: For philosophical issues related to the religion, we talked to the temple or mosque
trustees; and for managerial and employment issues, we talked to the general administra-
8For example, in terms of their date of foundation although a majority of the organisations were foundedin the nineteenth and twentieth centuries, some organisations were founded as early as the thirteenth century,and others were founded nine centuries later in the twenty-first century.
9Common-method bias is the bias introduced by the same person answering all questions in a question-naire survey.
12
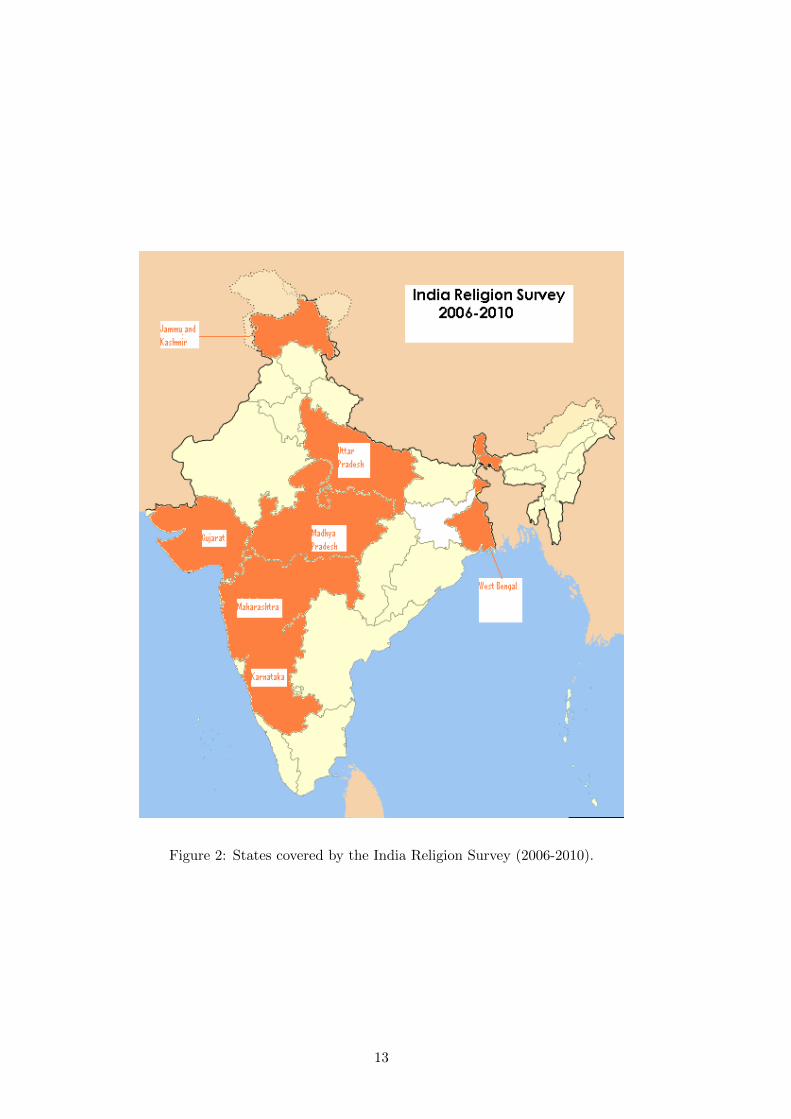
Figure 2: States covered by the India Religion Survey (2006-2010).
13
tion of the temple, usually an employee. For financial issues, we spoke to the treasurer
or employees of the accounts section of the religious organisation. In case there were any
inconsistencies we went back to the relevant official to seek clarification. Each section of
the questionnaire relevant to each official’s jurisdiction was completed by the field inves-
tigator in the local language in which the interview was conducted, and then translated
into English. 10 In addition, we provided training to the field staff and conducted practice
sessions with them to ensure reliability and consistency in recording responses to ques-
tions among the field staff. The interviewers themselves had little prior knowledge of the
organisations they were interviewing, and many also conducted the interviews in several
states with the team leaders visiting all states, which ensured consistency and accuracy
of responses. This interviewing strategy of course puts demands on the interviewers, and
many of our interviewers were scholars and assistant professors in local universities, which
ensured high-quality interviewing skills.
The questionnaire survey that was administered to the organisations consisted of a
series of questions on topics and themes such as basic demographics; areas of operation;
adherent numbers; religious practices and religious service provision; non-religious service
provision; perceptions of how all types of service provision have changed over time; sources
of income and expenditure including donations and other assets; and perceptions of com-
petitive intensity with other religious organisations. In the survey we used a combination
of open and closed questions - this has also been used in other surveys of firm practice
(see for example Bloom and Van Reenen 2010). For example, we used questions such as
’What are the religious services provided by your organisation?’ followed by ’What do you
perceive is the primary gain to the organisation in providing these services?’
We also asked questions that elicited examples particularly on areas where practices
might differ by religion such as ’What steps do you take to ensure smooth and efficient
functioning of the services provided by you?’and ’In providing these services, please can
you tell us on what criteria you determine who will be included or excluded from them?’
Other open-ended questions on economic factors included questions such as ’What are the
most important economic changes that you think have happened in your area in the last 5
years?’
We conducted the interviews using the semi-structured interview format. We did so for
two reasons - first, because religion is a sensitive topic; and second, in order to minimise
the potential for measurement and misclassification errors (an issue we discuss in more
detail in Section 6 below). The semi-structured interview is a face-to-face interview in
which respondents’ beliefs and views on topics are assessed in discussions and open-ended
questions that allow the interviewer to minimise the possibility of errors in obtaining and
recording responses. This is a strategy that is being advocated increasingly in other census
and survey work as well (see for example Schatz 2012). Although semi-structured interviews
can take many forms, the best form is face-to-face interviews which are labour intensive
but which allow for the collection of high-quality data because they permit the interviewer
10We also first conducted a pilot survey in two states in order to test-run the questionnaire before ad-ministering the actual survey in all seven states.
14
to correct misunderstandings, clarify questions, elicit experiences and follow-up on ideas.
There are two main advantages to using semi-structured interviews.
First, the semi-structured interview is a broad questioning technique which can also be
used to minimise possible inconsistencies as we corroborate responses from different sources
(qualitative and quantitative data), and where these varied data sources generate poten-
tially different responses. In conducting these interviews, there are potentially errors that
can arise when asking the questions and interpreting the answers. The flexibility of the
semi-structured format enables the interviewer to question more broadly based on the re-
sponses and hence reduces the possibility of misclassification. Although the semi-structured
interview has the appearance of a conversation or discussion, ’this is due to the skills of
the interviewer in facilitating a relaxed, non-threatening atmosphere where interviewees
feel comfortable to express themselves.’ (Mathers, Fox and Hunn, 1998). Interviewer bias
is minimized through training and more time spent in the interview listening rather than
the interviewer talking. The interviewers use interviews to triangulate between the general
discussions and the responses recorded in the questionnaire. This is because the technique
can create consistency between interviewees’ responses and the external material that is
collected from the organisations such as pamphlets and what people say more generally
about topics and themes concerned. So for example some questions are assessing what
someone actually knows about a topic, while others are assessing their opinions, beliefs or
views.
Second, for complex and sensitive topics where a simple method might be less effective,
the semi-structured interview format is important. This is because the semi-structured
interview is organised around topics and themes and its purpose is to have flexibility in
how and in what sequence questions are asked. This format is also usually used when
’the subject matter is very sensitive, if the questions are very complex or if the interview is
likely to be lengthy’ (Mathers, Fox and Hunn, 1998). This is why semi-structured interview
methods are usually used when collecting attitudinal information on a large scale, as we
do, and in psychoanalytic and clinical medicine research (Schatz 2012). In our experience,
conducting interviews especially about religion and religious beliefs display many of these
characteristics, so the semi-structured format was preferred.
Our use of the semi-structured format was driven by these two advantages. In order
to conduct our interviews, we made several visits to each organisation to understand the
religious ethos of each organisation before asking questions about the economic variables
we were interested in. Frequently these conversations concerned theological debates in the
religion, scriptural support for service provision, understanding the mythology associated
with the religious institution, as well as economic issues. We made repeat visits to the
organisations and as also shown in Table 2, the average number of interviews that involved
these semi-structured interviews was 2.4 in Maharashtra, 2.2 in Karnataka, 1.8 in Madhya
Pradesh, 2.1 in Jammu and Kashmir, 3.5 in Uttar Pradesh, 2.2 in West Bengal and 1.6 in
Gujarat.
15
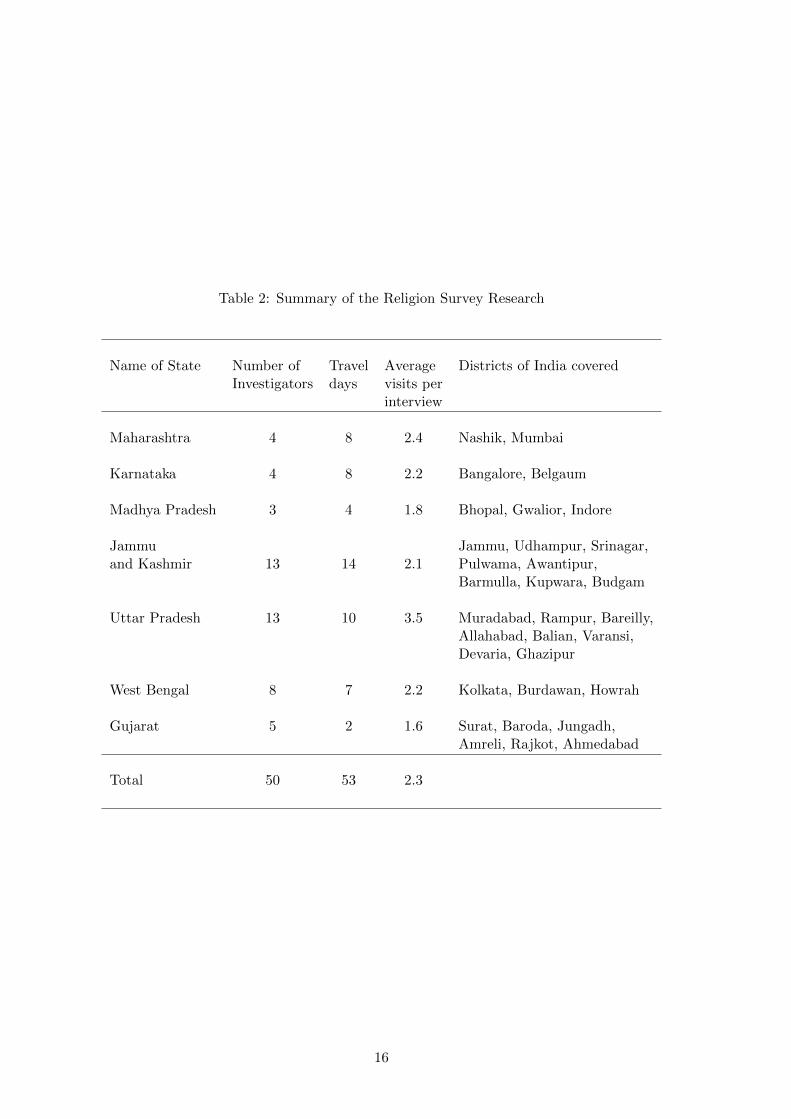
Table 2: Summary of the Religion Survey Research
Name of State Number of Travel Average Districts of India coveredInvestigators days visits per
interview
Maharashtra 4 8 2.4 Nashik, Mumbai
Karnataka 4 8 2.2 Bangalore, Belgaum
Madhya Pradesh 3 4 1.8 Bhopal, Gwalior, Indore
Jammu Jammu, Udhampur, Srinagar,and Kashmir 13 14 2.1 Pulwama, Awantipur,
Barmulla, Kupwara, Budgam
Uttar Pradesh 13 10 3.5 Muradabad, Rampur, Bareilly,Allahabad, Balian, Varansi,Devaria, Ghazipur
West Bengal 8 7 2.2 Kolkata, Burdawan, Howrah
Gujarat 5 2 1.6 Surat, Baroda, Jungadh,Amreli, Rajkot, Ahmedabad
Total 50 53 2.3
16
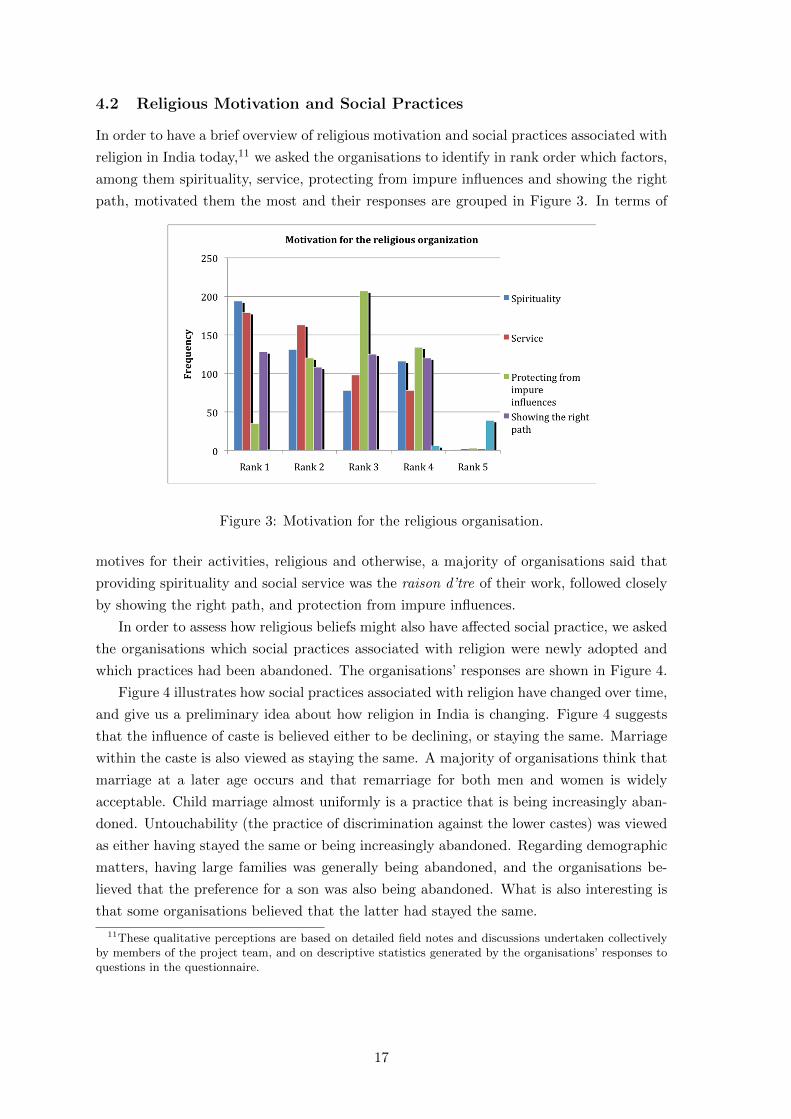
4.2 Religious Motivation and Social Practices
In order to have a brief overview of religious motivation and social practices associated with
religion in India today,11 we asked the organisations to identify in rank order which factors,
among them spirituality, service, protecting from impure influences and showing the right
path, motivated them the most and their responses are grouped in Figure 3. In terms of
Figure 3: Motivation for the religious organisation.
motives for their activities, religious and otherwise, a majority of organisations said that
providing spirituality and social service was the raison d’tre of their work, followed closely
by showing the right path, and protection from impure influences.
In order to assess how religious beliefs might also have affected social practice, we asked
the organisations which social practices associated with religion were newly adopted and
which practices had been abandoned. The organisations’ responses are shown in Figure 4.
Figure 4 illustrates how social practices associated with religion have changed over time,
and give us a preliminary idea about how religion in India is changing. Figure 4 suggests
that the influence of caste is believed either to be declining, or staying the same. Marriage
within the caste is also viewed as staying the same. A majority of organisations think that
marriage at a later age occurs and that remarriage for both men and women is widely
acceptable. Child marriage almost uniformly is a practice that is being increasingly aban-
doned. Untouchability (the practice of discrimination against the lower castes) was viewed
as either having stayed the same or being increasingly abandoned. Regarding demographic
matters, having large families was generally being abandoned, and the organisations be-
lieved that the preference for a son was also being abandoned. What is also interesting is
that some organisations believed that the latter had stayed the same.
11These qualitative perceptions are based on detailed field notes and discussions undertaken collectivelyby members of the project team, and on descriptive statistics generated by the organisations’ responses toquestions in the questionnaire.
17
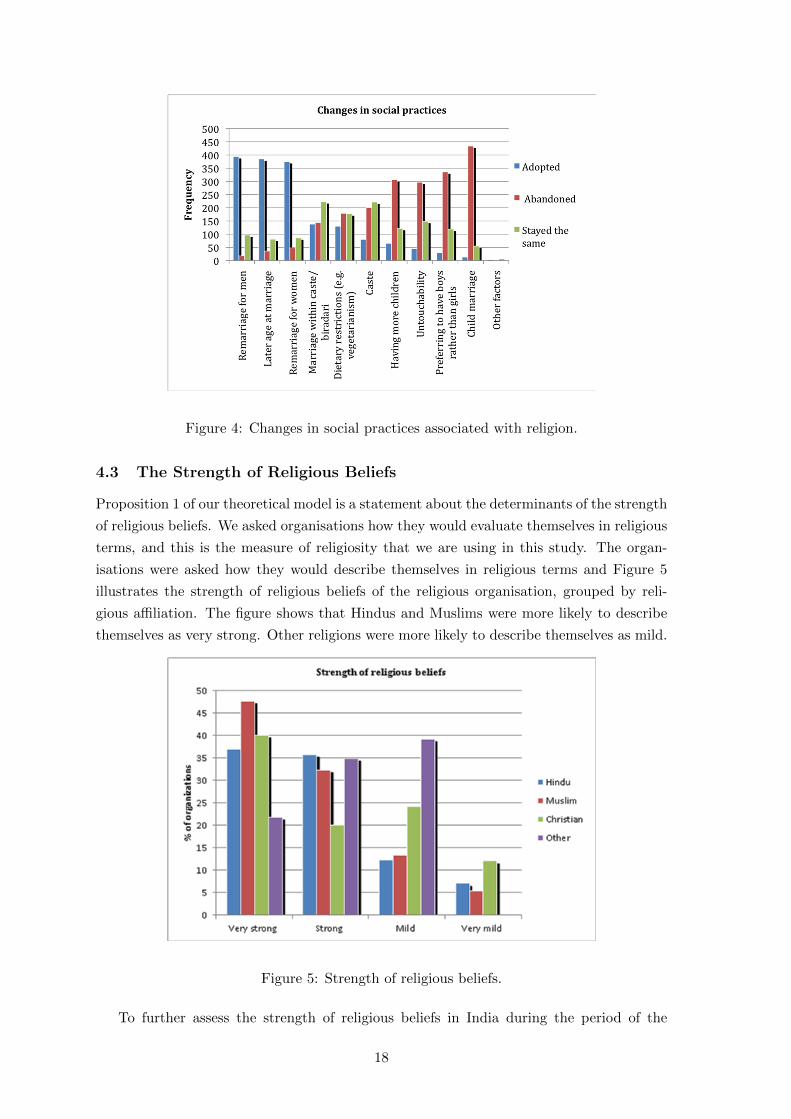
Figure 4: Changes in social practices associated with religion.
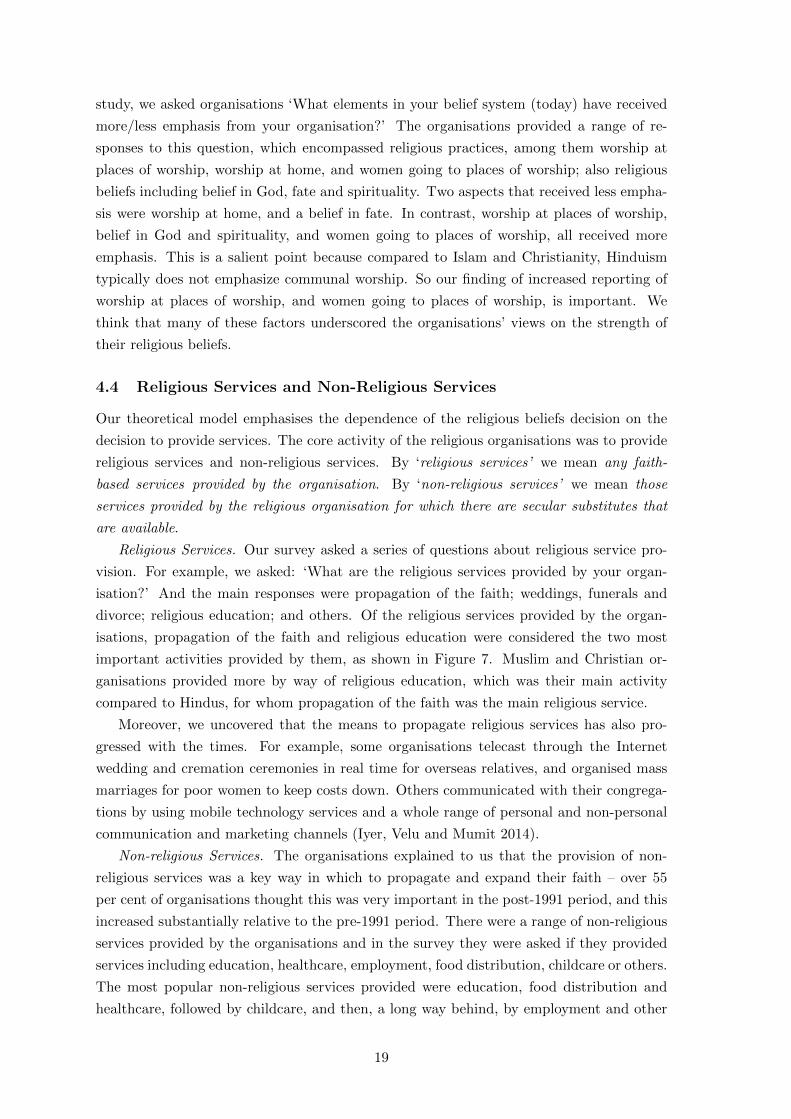
4.3 The Strength of Religious Beliefs
Proposition 1 of our theoretical model is a statement about the determinants of the strength
of religious beliefs. We asked organisations how they would evaluate themselves in religious
terms, and this is the measure of religiosity that we are using in this study. The organ-
isations were asked how they would describe themselves in religious terms and Figure 5
illustrates the strength of religious beliefs of the religious organisation, grouped by reli-
gious affiliation. The figure shows that Hindus and Muslims were more likely to describe
themselves as very strong. Other religions were more likely to describe themselves as mild.
Figure 5: Strength of religious beliefs.
To further assess the strength of religious beliefs in India during the period of the
18
study, we asked organisations ‘What elements in your belief system (today) have received
more/less emphasis from your organisation?’ The organisations provided a range of re-
sponses to this question, which encompassed religious practices, among them worship at
places of worship, worship at home, and women going to places of worship; also religious
beliefs including belief in God, fate and spirituality. Two aspects that received less empha-
sis were worship at home, and a belief in fate. In contrast, worship at places of worship,
belief in God and spirituality, and women going to places of worship, all received more
emphasis. This is a salient point because compared to Islam and Christianity, Hinduism
typically does not emphasize communal worship. So our finding of increased reporting of
worship at places of worship, and women going to places of worship, is important. We
think that many of these factors underscored the organisations’ views on the strength of
their religious beliefs.
4.4 Religious Services and Non-Religious Services
Our theoretical model emphasises the dependence of the religious beliefs decision on the
decision to provide services. The core activity of the religious organisations was to provide
religious services and non-religious services. By ‘religious services’ we mean any faith-
based services provided by the organisation. By ‘non-religious services’ we mean those
services provided by the religious organisation for which there are secular substitutes that
are available.
Religious Services. Our survey asked a series of questions about religious service pro-
vision. For example, we asked: ‘What are the religious services provided by your organ-
isation?’ And the main responses were propagation of the faith; weddings, funerals and
divorce; religious education; and others. Of the religious services provided by the organ-
isations, propagation of the faith and religious education were considered the two most
important activities provided by them, as shown in Figure 7. Muslim and Christian or-
ganisations provided more by way of religious education, which was their main activity
compared to Hindus, for whom propagation of the faith was the main religious service.
Moreover, we uncovered that the means to propagate religious services has also pro-
gressed with the times. For example, some organisations telecast through the Internet
wedding and cremation ceremonies in real time for overseas relatives, and organised mass
marriages for poor women to keep costs down. Others communicated with their congrega-
tions by using mobile technology services and a whole range of personal and non-personal
communication and marketing channels (Iyer, Velu and Mumit 2014).
Non-religious Services. The organisations explained to us that the provision of non-
religious services was a key way in which to propagate and expand their faith – over 55
per cent of organisations thought this was very important in the post-1991 period, and this
increased substantially relative to the pre-1991 period. There were a range of non-religious
services provided by the organisations and in the survey they were asked if they provided
services including education, healthcare, employment, food distribution, childcare or others.
The most popular non-religious services provided were education, food distribution and
healthcare, followed by childcare, and then, a long way behind, by employment and other
19
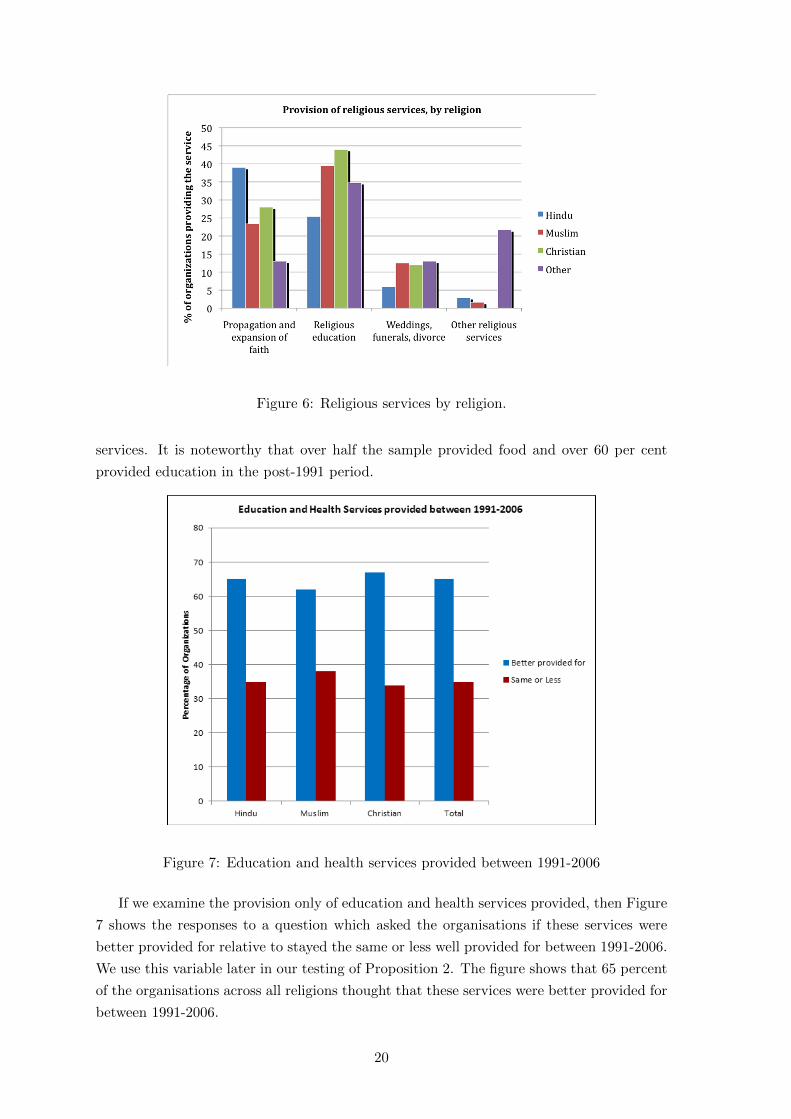
Figure 6: Religious services by religion.
services. It is noteworthy that over half the sample provided food and over 60 per cent
provided education in the post-1991 period.
Figure 7: Education and health services provided between 1991-2006
If we examine the provision only of education and health services provided, then Figure
7 shows the responses to a question which asked the organisations if these services were
better provided for relative to stayed the same or less well provided for between 1991-2006.
We use this variable later in our testing of Proposition 2. The figure shows that 65 percent
of the organisations across all religions thought that these services were better provided for
between 1991-2006.
20
Some of the ‘other services’ that religious organisations provided were quite diverse,
including organizing blood donation and other medical camps, flood relief, setting up drug
rehabilitation centres, operating homes for the elderly, organizing group marriages for the
poor, running sewing classes for women, organizing widow welfare programmes, HIV/AIDS
awareness campaigns, book distribution, sari distribution, cow-lending and other innovative
microfinance schemes, which were particularly striking. Most organisations had either
introduced or were in the process of introducing computer education and computer-based
learning schemes. While the main focus of non-religious service provision for most of the
organisations was on education, many people were educationally backward in the key areas
of operation in the organisations. More than 90 per cent of the respondents said that
people in India needed education more than any other service. Healthcare provision was
the second most popular service provided after education. Breaking down non-religious
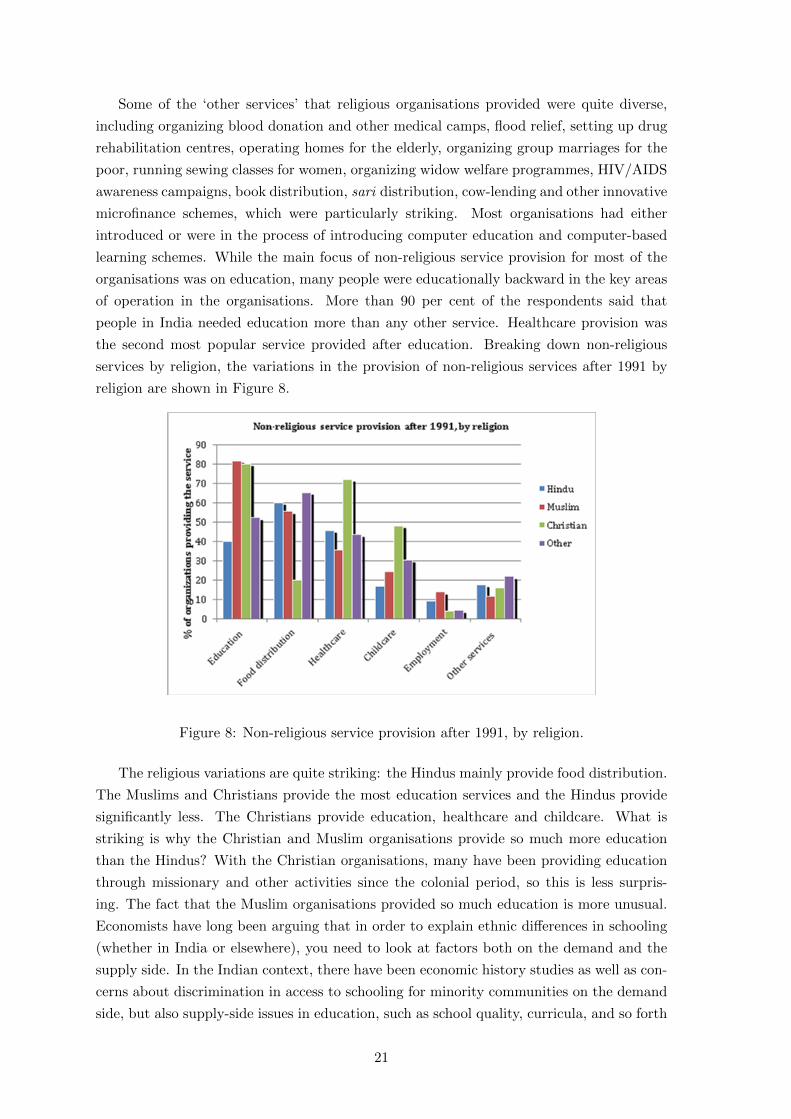
services by religion, the variations in the provision of non-religious services after 1991 by
religion are shown in Figure 8.
Figure 8: Non-religious service provision after 1991, by religion.
The religious variations are quite striking: the Hindus mainly provide food distribution.
The Muslims and Christians provide the most education services and the Hindus provide
significantly less. The Christians provide education, healthcare and childcare. What is
striking is why the Christian and Muslim organisations provide so much more education
than the Hindus? With the Christian organisations, many have been providing education
through missionary and other activities since the colonial period, so this is less surpris-
ing. The fact that the Muslim organisations provided so much education is more unusual.
Economists have long been arguing that in order to explain ethnic differences in schooling
(whether in India or elsewhere), you need to look at factors both on the demand and the
supply side. In the Indian context, there have been economic history studies as well as con-
cerns about discrimination in access to schooling for minority communities on the demand
side, but also supply-side issues in education, such as school quality, curricula, and so forth
21
(Chaudhary and Rubin 2011; Borooah and Iyer 2005). Chaudhary and Rubin (2011) for
example argue that religious differences in education have long historical roots - over the
19th century they show that Hindus used secular state schools more compared to indige-
nous schools including religious schools, compared to the Muslims. This may be related
to specific groups having a monopoly over education in Hinduism compared to a relatively
more egalitarian outlook to education in Islam. These differences are also reflected in more
recent studies: for example, Borooah and Iyer (2005) found that even after controlling for
other individual, household and village-level characteristics, Muslims in India enjoyed lower
primary-school enrolment than did Hindus. There is also some evidence that parents might
send their children to religious schools because most, such as madrasas, provide free tuition
and boarding. Another factor that might explain this finding is that non-religious services
are structurally required in Islam through zakaah.
4.5 Religious Competition
Our model emphasises the role that religious competition plays in affecting organisations’
decisions about beliefs and non-religious service provision.
We assessed organisations’ knowledge of other organisations in the same geographical
area. Specifically, organisations were asked both about the number and size of other or-
ganisations operating in the same area with the question, ‘How many other religious (all)
organisations also operate in your geographical sphere of influence?’ There were 150 or-
ganisations who reported 1–2 others; 136 who reported 3–5 competitors; 96 who reported
6–10; 74 who reported over 10 organisations as competitors; and 112 who did not know
their competition.
In order to assess competition among the organisations we asked whether an organisa-
tion provided a service because other organisations in the vicinity did so. The question we
asked of the organisations was ‘Have you provided a new religious service because other
organisations in your area have provided a new service?’ and they were asked to respond
‘Yes’ or ‘No’.
4.6 Economic Inequality
Our model illustrates the role that economic inequality plays in influencing what services
organisations will provide.
We asked the organisations questions about their perceptions of inequality, such as:
‘How do you think economic inequality has changed in your district over the past 20 years?’;
and ‘What are the most important economic changes that you think have happened in your
area in the last 5 years?’ It should be clarified that when thinking about inequality the
respondents were evaluating the income of the poor relative to the income of the middle-
class and the rich. We also asked them to categorise their responses between increased,
decreased or stayed the same. In order to be consistent with our model, this response was
also coded as a binary variable which showed whether they thought that income inequality
had increased or not.
22
A majority of the sample believed that economic inequality had either increased (46.1
per cent) or stayed the same (21.8 per cent). The split was not dissimilar across the various
religious groups. A majority of organisations agreed that there was an observable increase
in income and overall standard of living of the general population, but that economic
inequality had increased. The perceived changes in income inequality are consistent with
other studies, which have commented recently on the increase in income inequality in the
post-1991 economic reform period in India (Sarkar and Mehta 2010).
To provide some historical perspective, we note that in 1991 the Indian economy lib-
eralised its trade policy. One outcome of this policy was economic growth which has been
widely documented by economists (Panagariya 2008); the other consequence has been rising
income inequality (Deaton and Dreze 2002). Based on their calculations of state-level in-
equality based on consumer expenditures, Deaton and Dreze (2002, p.3740) argue, ’To sum
up, except for the absence of clear evidence of rising intra-rural inequality within states, we
find strong indications of a pervasive increase in economic inequality in the nineties. This
is a new development in the Indian economy; until 1993-94, the all-India Gini coefficients
of per capita consumer expenditure in rural and urban areas was fairly stable.’ As 1991
was a watershed year in Indian development policy, while focusing our study on religious
organisations’ service provision, we are especially interested in the post-policy period 1991-
2006. We think that a major policy change in the Indian economy that increased growth
and inequality might have consequences for our study.
We asked questions of the organisations in the survey related to perceived changes in
the economy such as subjective evaluations of inequality. First, the organisations were
asked: ‘What are the most important economic changes that you think have happened?’
They provided a range of qualitative responses including that the area was now better
developed, that awareness had increased, that there were better education and employment
opportunities, that ‘Brahmins had become richer’, that ‘everyone carries a mobile’, that
‘farmers are quitting farming’, and that there was an increase in real-estate activity, but
equally an increase in slum areas. Others pointed out that there was much development
in the IT sector but as one temple trustee appositely put it, ‘Mumbai has developed but
Dharavi has not!’ Others pointed out the positive aspects that ‘poor people can now
manage two square meals a day’.
Additionally, our measure of the perception of inequality is correlated with a more
general measure of consumption inequality used by Banerjee and Iyer (2005). This measure
is not a measure of income inequality but of inequality in consumption expenditure. It is
measured at the level of the NSS region, which is above that of the Indian district and
includes between 3 and 10 districts. Several hundred villages may comprise a district. In
India there are no actual measures of inequality at the level of the village or town. Hence
our measure of the perception of inequality at the level of the village or town was collected
which is at a far more disaggregated level than the NSS region at which this commonly-
used measure of consumption inequality is calculated. Nevertheless it is comforting that
the correlation between our subjective inequality indicator and the Gini coefficient in 1987,
as used in Banerjee and Iyer (2005) is 0.30 and significant at the 1% level. This suggests
23
that our measure may be a useful proxy for actual inequality in our sample.
5 Econometric Testing of the Propositions
The econometric analysis consists of testing two propositions identified by the theoretical
model.
Proposition 1. In the presence of competition in the provision of non-religious services,
religious organisations differentiate their religious focal points.
Proposition 2. The provision of non-religious services by the religious organisations in-
creases when there is a change in economic inequality.
Our theoretical model demonstrates that religious organisations will choose both a reli-
gious focal point and the amount of non-religious services as they compete for the adherents.
We assume that the organisation’s objective function is to maximize adherents subject to
the cost of providing non-religious services for them. In this sense the organisation seeks to
maximise the net benefit per adherent, in the face of competition from the other religious
organisation. This is derived formally from the theoretical model in Section 3. Our model
demonstrates that when there is competition between religious organisations for adherents,
and when the population’s demand for non-religious services increase, the religious organi-
sation is faced with two decisions: a religious focal point, and the provision of non-religious
services. The religious organisation differentiates itself religiously from others as much as
possible in order to minimise the amount of non-religious services it needs to provide. This
is the intuition behind Proposition 1.
We get Proposition 2 from the same model by examining what happens to the provision
of non-religious services by the religious organisation in the presence of economic inequality.
What we derive from the model is that when there is an increase in economic inequality in
the population, all religious organisations will provide more non-religious services, as the
poor demand more of them. This gives us the intuition behind Proposition 2.
We first test Proposition 1 by examining the dispersion of the strength of religious
beliefs, and the effect of competition on this. We then test Proposition 2 by examining non-
religious service provision, and specifically test whether education and health services have
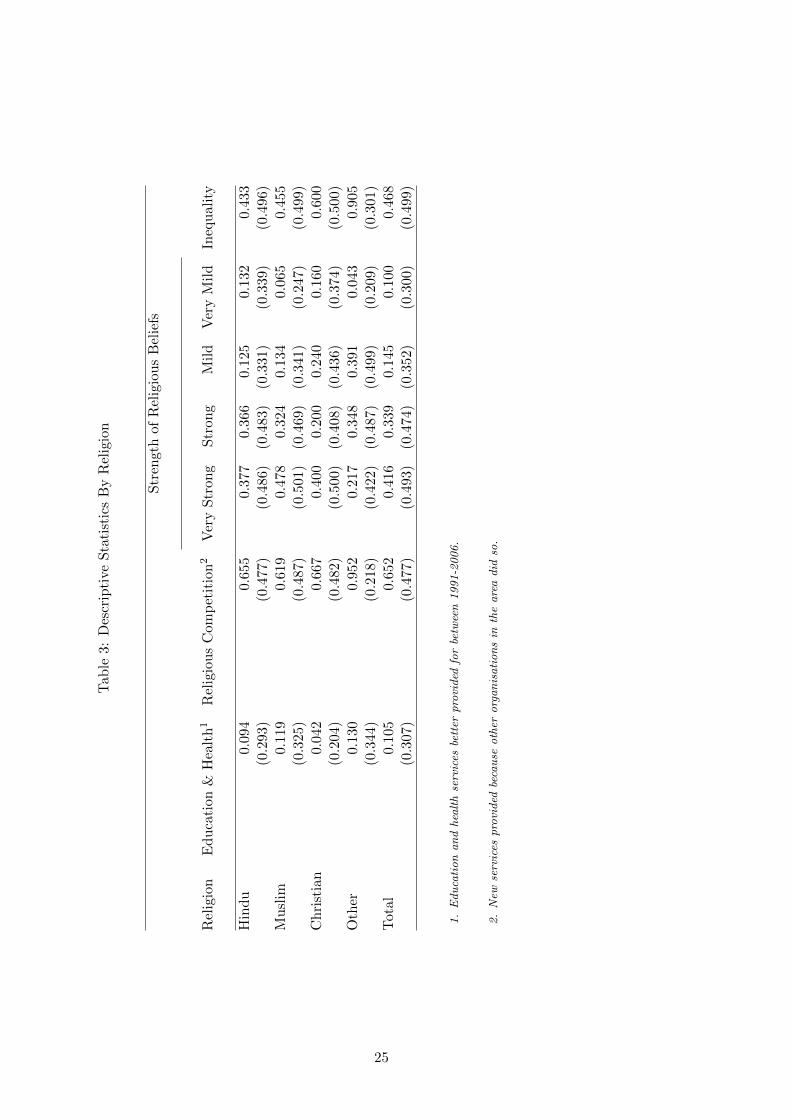
improved between 1991-2006 in response to a change in inequality. We present descriptive
statistics by religion for the variables we use in testing our propositions in Table 3. We
also consider the issue of clustering of the organisations by religion.
24
Tab
le3:
Des
crip
tive
Sta
tist
ics
By
Rel
igio
n
Str
engt
hof
Rel
igio
us
Bel
iefs
Rel
igio
nE
du
cati
on&
Hea
lth1
Rel
igio
us
Com
pet
itio
n2
Ver
yS
tron
gS
tron
gM
ild
Ver
yM
ild
Ineq
uali
ty
Hin
du
0.09
40.
655
0.37
70.
366
0.12
50.1
32
0.4
33
(0.2
93)
(0.4
77)
(0.4
86)
(0.4
83)
(0.3
31)
(0.3
39)
(0.4
96)
Mu
slim
0.11
90.
619
0.47
80.
324
0.13
40.0
65
0.4
55
(0.3
25)
(0.4
87)
(0.5
01)
(0.4
69)
(0.3
41)
(0.2
47)
(0.4
99)
Ch
rist
ian
0.04
20.
667
0.40
00.
200
0.24
00.1
60
0.6
00
(0.2
04)
(0.4
82)
(0.5
00)
(0.4
08)
(0.4
36)
(0.3
74)
(0.5
00)
Oth
er0.
130
0.95
20.
217
0.34
80.
391
0.0
43
0.9
05
(0.3
44)
(0.2
18)
(0.4
22)
(0.4
87)
(0.4
99)
(0.2
09)
(0.3
01)
Tot
al0.
105
0.65
20.
416
0.33
90.
145
0.1
00
0.4
68
(0.3
07)
(0.4
77)
(0.4
93)
(0.4
74)
(0.3
52)
(0.3
00)
(0.4
99)
1.Educationandhealthservices
better
provided
forbetw
een1991-2006.
2.New
services
provided
because
other
organisationsin
theareadid
so.
25
5.1 Clustering of Organisations by Religion
Underlying the empirical analysis of our two propositions is the religious organisation, the
unit of observation. The data on these organisations was collected based on a sampling
framework in which an equal sample of religious organisations were collected across states,
but within states organisations were randomly sampled.
In this context we can think of religious organisations, indexed by i, as forming L
clusters based upon grouping by districts, with the lth cluster containing nl organisations.
In deciding how to conduct inference when confronted with this form of clustering, two
critical factors are whether the cluster effects are treated as fixed or random; and the
number of clusters. The former relates to the question of how to model the correlation
structure. With data varying over l and i, and the focus of the analysis on variables which
vary by religious organisations, a fixed effects approach is attractive given that it allows
these effects to be correlated with covariates that vary within clusters. As in the current
set up, with large nl the religion fixed effects can be treated as parameters to estimate. The
question remains as to whether conditional on these fixed effects, together with covariates
xil, we can treat errors as conditionally independent. Although the use of fixed effects can
in principle account for much of the within cluster error, it is still the case that, in theory,
an error component contains a deviation from the demeaned error. Given that our data
contains a large number of clusters and small cluster sizes, it is relatively straightforward to
make inference robust to arbitrary within-cluster correlation and heteroscedasticity. Here
we follow common practice and use sandwich estimators for the standard errors, which
permit the errors to be heteroskedastic and arbitrarily correlated within clusters.
5.2 The Dispersion of Religious Beliefs
Our empirical evidence for Proposition 1 relies on two sets of analyses. First, we use
goodness-of-fit tests to assess whether across religious organisations the distribution of
religious beliefs is consistent with a model of independent choice, or whether there exists
dispersion (agglomeration) of religious beliefs. We then examine whether there is an effect
of religious competition on the strength of these beliefs, controlling for a number of other
factors that might also affect the religiosity of the organisation.
To test Proposition 1 we first need a measure of religious beliefs. Consistent with
our theoretical model and as discussed in Section 3, we asked organisations directly how
they would evaluate themselves in terms of the strength of religious beliefs: very strong,
strong, mild or very mild. To set the problem up we first define notation. We have
data on L religions each represented by nl religious organisations. Religious organisations
make choices in a space of religiousity, each choosing between C options; the number of
organisations choosing option c in religion l is xcl , and the probability of choosing option c
is πc. We let xl = {xcl } denote a C × 1 vector of choices for religion l and π = {πc} is a
C × 1 vector of probabilities. For religion l the likelihood of observing a set of outcomes xl
is given by
L(xl, nl,π) =
(nl
x1l . . . , xCl
)πx1l
1 . . . , πxCl
C . (22)
26
Letting X denote the L × C matrix of choices over all religions, the log-likelihood for all
organisations may be written as
ln L(X,n,π) =L∑l=1
ln
(nl
x1l , . . . , xCl
)+ ln(π1)
x1l + · · ·+ ln(πC)x
Cl , (23)
where n is a L×1 vector of the number of religious organisations representing each religion.
The question we wish to address is whether the observed choices in terms of religiosity
recorded in X, is consistent with independent random choice, or alternately arises as a
result of a process of agglomeration or dispersion. If religious organisations make inde-
pendent choices then the observed choices for each religion, namely xl = {xcl }, would be
the same as the aggregate. If religious organisations make similar decisions then we would
observe a process of agglomeration in the distribution. Alternately, if organisations seek to
differentiate themselves from one another in a space of religiousity, then we would observed
a more dispersed distribution.
The null model is specified based upon independent choices. Specifically we test the
hypothesis: H0 : π = π0, where π0 = (π01 . . . , π0C)′ = 1/C. In evaluating whether
the observed distribution of strength of beliefs deviates from this benchmark, a natural
starting point is the classic large sample goodness-of-fit tests for discrete data, based upon
the Pearson chi-square statistic. While the classical Pearson goodness-of-fit test is able to
discriminate between an independent null distribution and alternatives, it cannot indicate
the direction of any deviation from the null i.e. whether there actually is agglomeration
or dispersion. To circumvent this problem we construct a general multinomial test for
agglomeration and dispersion (MTAD) along the lines of Rysman and Greenstein (2005).
Our test statistic is based upon two log-likelihood statistics: one generated by a set of
independent random choices drawn from a multinomial probability density function and
the other, ln L(X,n,π), the log-likelihood statistic constructed using the observed data.
A likelihood ratio-test allows us to determine whether this difference is significant and if
so, the sign of the test statistic points to either excess dispersion or excess agglomeration
relative to independent random choice.12 We report the results of our tests on the strength
of religious beliefs in Table 4. Exact p-values are approximated by Monte Carlo sampling
from the null distribution.
Based upon the positive and significant LR test statistic we conclude that religious or-
ganisations are dispersed more widely than would be expected if they were choosing their
strength of religious beliefs independently of each other. This supports Proposition 1 and
what we expect would happen to the religious organisations. Using a method developed by
Andrews (1988a), we extend the above tests to their conditional (on covariates) counter-
parts. The covariates used are age of the organisation, expenditure, number of adherents,
religion and state fixed effects. Age is measured as the organisation’s age in 2006 based on
the year in which it was founded. We also use the total expenditure of the organisation
as measured in Rupees, whether the organisation spent in total less than Rs. 99,999; from
12This approach is based upon the Cressie-Read power divergence family of statistics. See Read andCressie (1988).
27
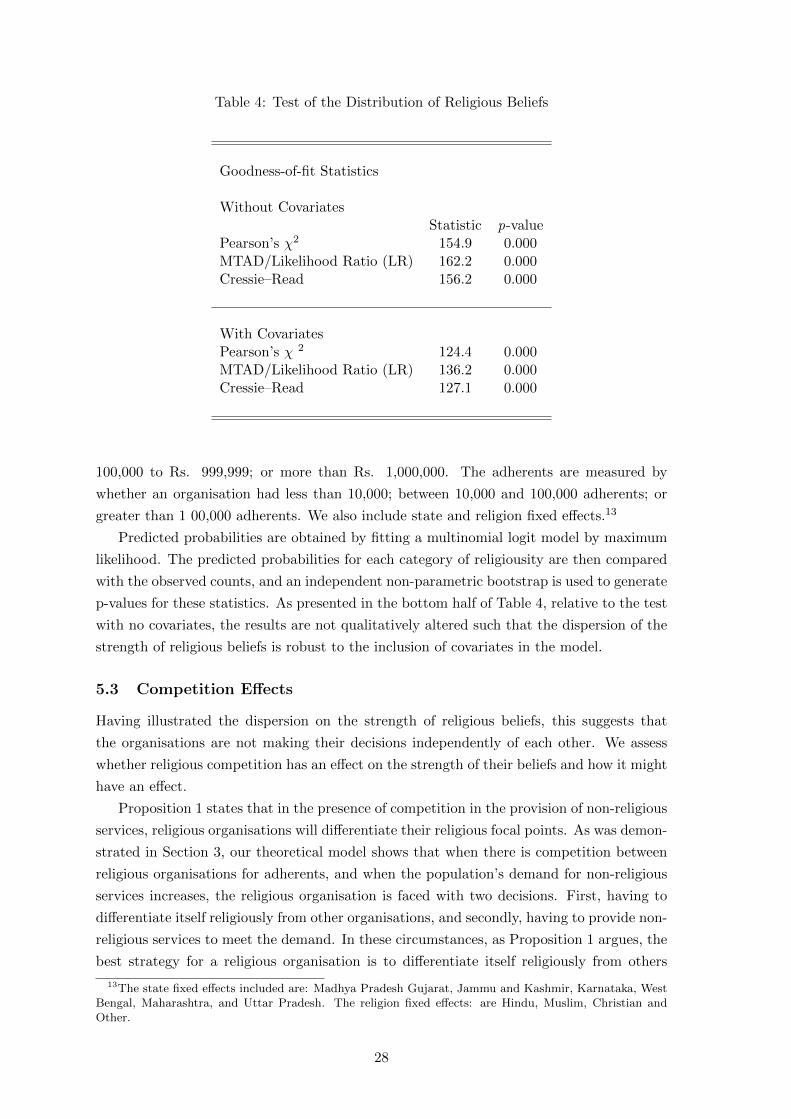
Table 4: Test of the Distribution of Religious Beliefs
Goodness-of-fit Statistics
Without CovariatesStatistic p-value
Pearson’s χ2 154.9 0.000MTAD/Likelihood Ratio (LR) 162.2 0.000Cressie–Read 156.2 0.000
With CovariatesPearson’s χ 2 124.4 0.000MTAD/Likelihood Ratio (LR) 136.2 0.000Cressie–Read 127.1 0.000
100,000 to Rs. 999,999; or more than Rs. 1,000,000. The adherents are measured by
whether an organisation had less than 10,000; between 10,000 and 100,000 adherents; or
greater than 1 00,000 adherents. We also include state and religion fixed effects.13
Predicted probabilities are obtained by fitting a multinomial logit model by maximum
likelihood. The predicted probabilities for each category of religiousity are then compared
with the observed counts, and an independent non-parametric bootstrap is used to generate
p-values for these statistics. As presented in the bottom half of Table 4, relative to the test
with no covariates, the results are not qualitatively altered such that the dispersion of the
strength of religious beliefs is robust to the inclusion of covariates in the model.
5.3 Competition Effects
Having illustrated the dispersion on the strength of religious beliefs, this suggests that
the organisations are not making their decisions independently of each other. We assess
whether religious competition has an effect on the strength of their beliefs and how it might
have an effect.
Proposition 1 states that in the presence of competition in the provision of non-religious
services, religious organisations will differentiate their religious focal points. As was demon-
strated in Section 3, our theoretical model shows that when there is competition between
religious organisations for adherents, and when the population’s demand for non-religious
services increases, the religious organisation is faced with two decisions. First, having to
differentiate itself religiously from other organisations, and secondly, having to provide non-
religious services to meet the demand. In these circumstances, as Proposition 1 argues, the
best strategy for a religious organisation is to differentiate itself religiously from others
13The state fixed effects included are: Madhya Pradesh Gujarat, Jammu and Kashmir, Karnataka, WestBengal, Maharashtra, and Uttar Pradesh. The religion fixed effects: are Hindu, Muslim, Christian andOther.
28
as much as possible in order to minimise the amount of non-religious services it needs to
provide.
We measure religious competition by an indicator which recorded the response to the
question: ’Have you provided a new religious service because other organisations in your
area have provided a new service?’ We use an ordered probit regression with the strength of
religious beliefs variable as our dependent variable, measured as whether the organisation
described themselves religiously as ’very strong, strong, mild or very mild’. In addition
to the competition variable discussed above, the controls are the age of the organisation,
number of adherents, total annual expenditure, and whether communal riots had increased
in the area in the last 5 years.
In Table 5 we report parameter estimates, together with the threshold constants αj , j =
1, 2, 3.14 In Table 6 we report the marginal effects. Specification 1 has only the state and
religion fixed effects and the competition variable. Specification 2 includes all of the above
and the organisation-level controls. We observe that the presence of competition in the
provision of non-religious services positively affects the probability of an organisation being
stronger in its religious beliefs. For example, we find that for organisations that provide a
new service in the face of competition, increases the probability of an organisation being
very strong in its religious beliefs by 16%. This effect is robust to the inclusion of state
and religion-fixed effects (FE).
The empirical evidence in support of Proposition 1 is based upon on goodness-of-fit tests
for the dispersion on the strength of religious beliefs; and on the use of Ordered Probit re-
gressions. Our results reveal that the distribution of religious beliefs across organisations
are more dispersed than they would have been if they were choosing their beliefs indepen-
dently. This is consistent with a wider historical and sociological literature on India that
suggests that in the post liberalization period, there has been an increase in the practice
of religion, with some organisations becoming more radical as for example in discussions
about Hindutva (a form of radical Hinduism) and radical Islam in the sub-continent. In
addition our results provide support that in the presence of competition for providing non-
religious services, the religious organisations are differentiating on the strength of their
religious beliefs.
6 Non-religious Service Provision and Economic Inequality
Our model puts forward two propositions which deal with strength of beliefs and non-
religious service provision. We now examine non-religious service provision. Proposition 2
states that the provision of non-religious services by the religious organisations increases
when there is a change in economic inequality. In order to test Proposition 2 on our data
we need a measure of whether the organisation provided non-religious services. We use
the provision of education and health services between 1991-2006 measured by whether the
organisation stated that this provision was better provided for, or not, in this period. We
are interested in whether this is affected by the perception of inequality. Our perception of
14Note that since the dependent variable is ordinal - recording whether the organisation described them-selves religiously as ’very strong, strong, mild or very mild’, then we report three threshold parameters.
29
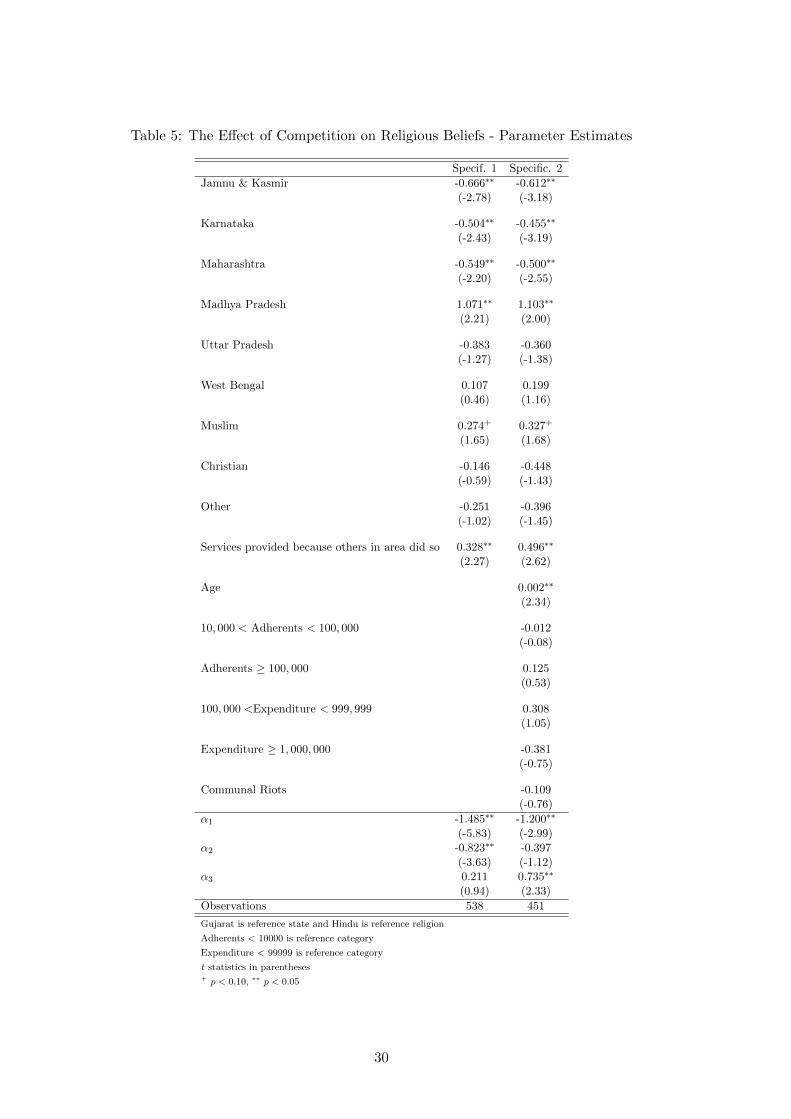
Table 5: The Effect of Competition on Religious Beliefs - Parameter Estimates
Specif. 1 Specific. 2
Jamnu & Kasmir -0.666∗∗ -0.612∗∗
(-2.78) (-3.18)
Karnataka -0.504∗∗ -0.455∗∗
(-2.43) (-3.19)
Maharashtra -0.549∗∗ -0.500∗∗
(-2.20) (-2.55)
Madhya Pradesh 1.071∗∗ 1.103∗∗
(2.21) (2.00)
Uttar Pradesh -0.383 -0.360(-1.27) (-1.38)
West Bengal 0.107 0.199(0.46) (1.16)
Muslim 0.274+ 0.327+
(1.65) (1.68)
Christian -0.146 -0.448(-0.59) (-1.43)
Other -0.251 -0.396(-1.02) (-1.45)
Services provided because others in area did so 0.328∗∗ 0.496∗∗
(2.27) (2.62)
Age 0.002∗∗
(2.34)
10, 000 < Adherents < 100, 000 -0.012(-0.08)
Adherents ≥ 100, 000 0.125(0.53)
100, 000 <Expenditure < 999, 999 0.308(1.05)
Expenditure ≥ 1, 000, 000 -0.381(-0.75)
Communal Riots -0.109(-0.76)
α1 -1.485∗∗ -1.200∗∗
(-5.83) (-2.99)α2 -0.823∗∗ -0.397
(-3.63) (-1.12)α3 0.211 0.735∗∗
(0.94) (2.33)
Observations 538 451
Gujarat is reference state and Hindu is reference religion
Adherents < 10000 is reference category
Expenditure < 99999 is reference category
t statistics in parentheses+ p < 0.10, ∗∗ p < 0.05
30
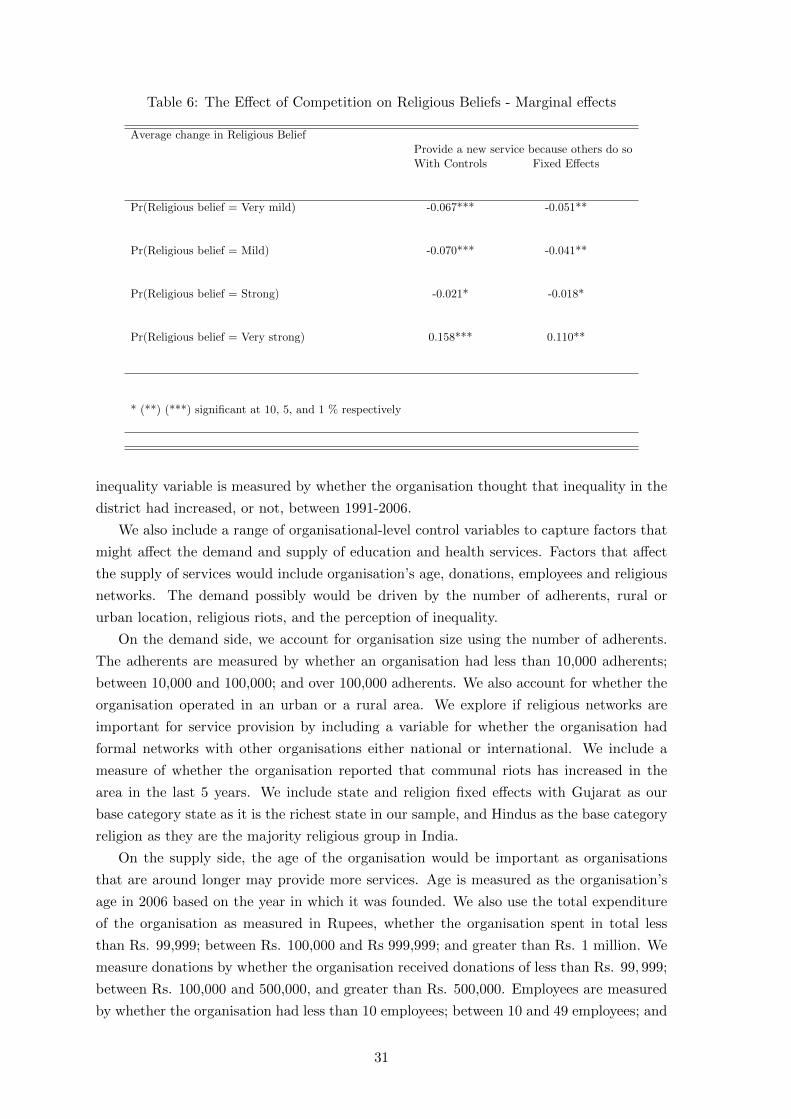
Table 6: The Effect of Competition on Religious Beliefs - Marginal effects
Average change in Religious BeliefProvide a new service because others do soWith Controls Fixed Effects
Pr(Religious belief = Very mild) -0.067*** -0.051**
Pr(Religious belief = Mild) -0.070*** -0.041**
Pr(Religious belief = Strong) -0.021* -0.018*
Pr(Religious belief = Very strong) 0.158*** 0.110**
* (**) (***) significant at 10, 5, and 1 % respectively
inequality variable is measured by whether the organisation thought that inequality in the
district had increased, or not, between 1991-2006.
We also include a range of organisational-level control variables to capture factors that
might affect the demand and supply of education and health services. Factors that affect
the supply of services would include organisation’s age, donations, employees and religious
networks. The demand possibly would be driven by the number of adherents, rural or
urban location, religious riots, and the perception of inequality.
On the demand side, we account for organisation size using the number of adherents.
The adherents are measured by whether an organisation had less than 10,000 adherents;
between 10,000 and 100,000; and over 100,000 adherents. We also account for whether the
organisation operated in an urban or a rural area. We explore if religious networks are
important for service provision by including a variable for whether the organisation had
formal networks with other organisations either national or international. We include a
measure of whether the organisation reported that communal riots has increased in the
area in the last 5 years. We include state and religion fixed effects with Gujarat as our
base category state as it is the richest state in our sample, and Hindus as the base category
religion as they are the majority religious group in India.
On the supply side, the age of the organisation would be important as organisations
that are around longer may provide more services. Age is measured as the organisation’s
age in 2006 based on the year in which it was founded. We also use the total expenditure
of the organisation as measured in Rupees, whether the organisation spent in total less
than Rs. 99,999; between Rs. 100,000 and Rs 999,999; and greater than Rs. 1 million. We
measure donations by whether the organisation received donations of less than Rs. 99, 999;
between Rs. 100,000 and 500,000, and greater than Rs. 500,000. Employees are measured
by whether the organisation had less than 10 employees; between 10 and 49 employees; and
31
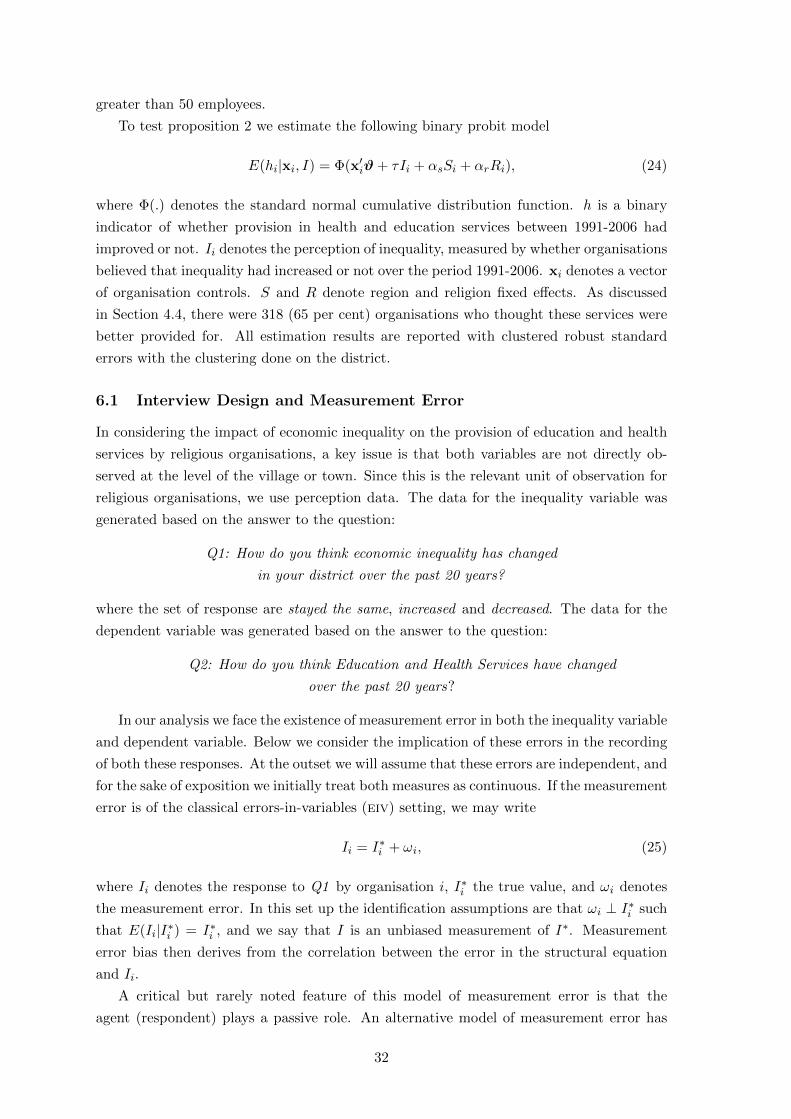
greater than 50 employees.
To test proposition 2 we estimate the following binary probit model
E(hi|xi, I) = Φ(x′iϑ+ τIi + αsSi + αrRi), (24)
where Φ(.) denotes the standard normal cumulative distribution function. h is a binary
indicator of whether provision in health and education services between 1991-2006 had
improved or not. Ii denotes the perception of inequality, measured by whether organisations
believed that inequality had increased or not over the period 1991-2006. xi denotes a vector
of organisation controls. S and R denote region and religion fixed effects. As discussed
in Section 4.4, there were 318 (65 per cent) organisations who thought these services were
better provided for. All estimation results are reported with clustered robust standard
errors with the clustering done on the district.
6.1 Interview Design and Measurement Error
In considering the impact of economic inequality on the provision of education and health
services by religious organisations, a key issue is that both variables are not directly ob-
served at the level of the village or town. Since this is the relevant unit of observation for
religious organisations, we use perception data. The data for the inequality variable was
generated based on the answer to the question:
Q1: How do you think economic inequality has changed
in your district over the past 20 years?
where the set of response are stayed the same, increased and decreased. The data for the
dependent variable was generated based on the answer to the question:
Q2: How do you think Education and Health Services have changed
over the past 20 years?
In our analysis we face the existence of measurement error in both the inequality variable
and dependent variable. Below we consider the implication of these errors in the recording
of both these responses. At the outset we will assume that these errors are independent, and
for the sake of exposition we initially treat both measures as continuous. If the measurement
error is of the classical errors-in-variables (eiv) setting, we may write
Ii = I∗i + ωi, (25)
where Ii denotes the response to Q1 by organisation i, I∗i the true value, and ωi denotes
the measurement error. In this set up the identification assumptions are that ωi ⊥ I∗i such
that E(Ii|I∗i ) = I∗i , and we say that I is an unbiased measurement of I∗. Measurement
error bias then derives from the correlation between the error in the structural equation
and Ii.
A critical but rarely noted feature of this model of measurement error is that the
agent (respondent) plays a passive role. An alternative model of measurement error has
32
the respondent aware of the lack of precision of his measure. Letting I denote this noisy
measure of I∗i , we then write
Ii = I∗i + ωi, (26)
where ωi is independent of I∗i as in the classical eiv model. The critical difference between
the two error models is that in the classical eiv model the reported value and Ii are the
same. For the alternate model the respondent reports his best estimate of the underlying
true value, based upon the noisey measure, namely Ii = E(I∗i |Ii).This measurement error model is referred to as the optimal prediction error model
(OPE), precisely since in this context Ii is the best predictor of the underlying true value
given the noisey measurement Ii.15 This type of model has been considered by a number
of analysts, including Hyslop and Imbens (2001), who emphasise that the choice of model
for measurement-error issues requires greater attention than is ordinarily given by both
social and physical scientists. The application of this measurement error model to data
based upon self-reports is appropriate since individuals may be aware of the uncertainty in
their estimates and effectively adjust for this by reporting a form of average value, based
upon the information available.16 In the linear model the presence of OPE means that the
measurement error is ignorable in terms of bias.17 However, given that in this particular
context the true value of I∗i is categorical, measurement error is recast as a misclassification;
a misclassification error is well known to be negatively correlated with I∗i . In addition, and
as noted by Chen, Hong and Nekipelov (2011), we cannot resort to the use of instrumental
variables - i.e. other measurements - as a source of identification when the underlying
model is nonlinear.
In anticipation of these issues we sought to mitigate the consequences of misclassifica-
tion errors in both the dependent variable18 and regressors by utilising the semi-structured
conversations method proposed by Manski (2004), and discussed in Section 4.1. Although
economists have traditionally been skeptical of the use of perceptions data, Manski has
argued that one way to use subjective data more effectively is to require intensive prob-
ing of persons to learn how they perceive their environments and how they process new
information. The flexibility of the semi-structured format derives from the fact that the
interviewer does not simply passively record responses, as would a physical measurement
device.19 Rather by adopting a semi-structured approach, the interviewer can effectively
15This measurement error model is also referred to as Berkson-error model in the statistics and medicalliterature.
16See Schennach (2013) for an interesting study on the use of nonparametric techniques to deal withBerkson errors.
17See Hyslop and Imbens (2001) for further details.18We are aware of alternate ways of dealing with measurement error in a binary dependent variable. For
example, Hausman, Abrevaya, and Scott-Morton (1998) demonstrate that the maximum likelihood estimatesfrom the unmodified log-likelihood with misclassification ignored are generally inconsistent. Christin andHug (2005) replicate their results for different sample sizes, and find that the maximum likelihood estimatoris preferable for samples of 5000 observations or greater. However, for smaller samples, the standard probitestimator has smaller root-mean-squared-error than the estimator that takes account of misclassifications.In this sense the authors recommend that it is only advisable to use the maximum likelihood estimator ofHausman, Abrevaya, and Scott-Morton (1998) for large samples.
19Other advantages are that they are usually used when ’the subject matter is very sensitive, if thequestions are very complex or if the interview is likely to be lengthy’(Mathers, Fox and Hunn, 1998).
33
triangulate between the true value I∗i , the noisey measure Ii and the response recorded
in the questionnaire, Ii. In this regard, where interviewees (respondents) are likely to be
aware of their own uncertainty when responding to questions, such that measurement error
is of the OPE form, a semi-structured interview format can be used as a form of averaging
device.
One part of the questionnaire related to background changes in the economy in order
for us to assess perception of inequality in the area more generally by the organisation.
This can be illustrated by considering how we sort to illicit views on inequality given
that actual inequality at the level of the local market for religion is not available in In-
dia. To set the stage for a wider discussion around these issues, the interviewer would
start with an open-ended question on ’What are the most important economic changes that
you think have happened in your area in the last 5 years?’ In posing these broader ques-
tions, the interviewer seeks to expand the information set available to the respondent, and
thereby reduce measurement error. The interviewer would then follow with more precise
questions which included the specific question on inequality: ’How do you think economic
inequality has changed in your district over the past 20 years?’ As a result, we note that
the interviewer first engaged in an open-ended discussion about the economic status of
the population that the religious organisation served, which was then followed by specific
questions on perceptions of inequality. The key point is that the semi-structured format
allows the interviewer to engage generally with the respondent, and use this technique to
obtain more accurate responses to specific questions of key interest.
In this context one might think of our interviewers (INT) as providing additional in-
formation, say ZINT, which seeks to mitigate for the presence of measurement error. We
may then write the best predictor for I∗i as Ii = E(I∗i |Ii, ZINT,i), where the best predictor
is based upon whatever information is available.20 However, just as the use of instrumental
variables may introduce bias, we sought to reduce errors on the part of the interviewer
through training and more time spent in the interview listening rather than the interviewer
talking. In addition, and as discussed in Section 4.1, we made several visits to each organi-
sation to understand the religious ethos of each organisation before asking questions about
the economic variables we were interested in. Frequently, these conversations concerned
theological debates in the religion, scriptural support for service provision, and understand-
ing the mythology associated with the religious institution.
6.1.1 Correlated Responses
In the discussion above we have considered the existence of misclassification errors for
regressors and a dependent variable separately. However, since respondents provide infor-
mation on both variables, we face possible bias as a result of correlated responses. For
example, if an individual responds positively to the question as to whether education and
health services have increased in the area covered by her organisation this might induce
an increased likelihood of reporting an increase in inequality. This problem is referred to
as common method bias. To circumvent this bias survey questions were targeted at three
20We thank Dean Hyslop for pointing out this observation in a personal communication.
34

different people in the organisation: questions on religion were posed to the temple trustee
or official priest or organisation head, questions on inequality were targeted to the officer
responsible for financial matters in the organisation. Questions on education and health
service provision (which we use on the left-hand side of our regressions) were asked of the
administrative officer. By asking different questions to different persons in the survey we
reduce the likelihood that the responses to questions are correlated.
We have sought to address problems of endogeneity that arise from the use of percep-
tion data by the use of a semi-structured interview format, in conjunction with the use of
responses from different individuals. We also include a rich set of organisation-level vari-
ables, along with a set of state and religion fixed effects. The reason for including these
fixed effects is due to the fact that the provision of non-religious services in India varies by
state and religion. It varies by state partly because education and health are state-level
subjects, decided upon mainly by state governments, and so there is considerable variation
in public sector provision of health and education in India by state.21
6.2 Results
Based upon the binary probit model as presented in equation (24), Table 7 presents the
average marginal effects. Note that we present results for a number of specifications, with
each including the binary regressor ’Inequality’. A Baseline model includes this variable
together with state and religion fixed effects. In moving from models M2 to the full model,
we are able to account for any sensitivities which are due to a specific set of controls.
Model M2 includes state and religion fixed effects and controls for adherents and age
which assess the size of the organisations. The full model includes these variables and a
range of organisational controls.22 We find that the average probability of providing more
education and health services conditional upon an increase in the perception of economic
inequality, increases by approximately 8% to 10%, depending on the specification. This
finding provides support for Proposition 2 given that we observe a consistent relationship
between non-religious services increasing when there is some inequality. This finding is
important as it is the main effect under study. Many would argue that with economic
growth in India, many things have changed. Yet, much of the focus of this research has
not been on the effect on religious organisations, an area relatively ignored by economists
of India. Our findings here shows that even seemingly unrelated areas such as religion,
were affected by the liberalization due to the increase in the perception of inequality. Our
finding also suggests that we should explore much more deeply than we have at present,
the relationships between economics and religion.
Other covariates are also important: for example, non-religious service provision is
greater with increasing expenditure. Non-religious service provision is also greater if an
organisation has more employees. We do not find an effect of religious networks or religious
riots. The effects for states are significant for Jammu and Kashmir, Maharashtra, Madhya
Pradesh, Uttar Pradesh, West Bengal which provide more services. This is consistent
21Provision also varies by religion. See, for example, Borooah and Iyer 2005 for a detailed discussion.22Standard errors are robust to arbitrary heteroscedasticity.
35
with our hypothesis that the poorer or more unequal regions of India are those in which
religious organisations are providing more education and health services. If the organisation
is Muslim rather than Hindu then it is providing less services as a result of the change in
inequality. One reason for presupposing a difference between religious groups in their
provision of education and health services is the Islamic theological requirements to give
charitable donations, either compulsorily or voluntarily. This might be an important reason
why Muslim organisations might provide more services than the Hindus or other groups.
Consequently, with a change in economic inequality, we may expect Hindu groups to be
providing more services than others. We think this is because Muslim organisations were
already providing many more education and health services than the Hindus.
We emphasise the different motives for religious differences in non-religious service pro-
vision. For example, in Islam, charitable giving is considered one of the ’pillars of Islam’
and it is perceived as an indication of the sincerity of one’s faith. There are two types of
charitable giving prescribed in Islam - the zakaah, which is an obligatory form of charity and
the sadaqah, which is voluntary giving. It is believed in Islam that ’Charity extinguishes
sins as water extinguishes fire’ and so the zakaah is considered an act of worship in which a
Muslim is required to donate about 2.5 percent of their idle wealth to charity. This desire
on the part of Muslims to contribute to charitable giving was evident in our sample as well,
as many of the organisations spoke eloquently of the reasons for providing education ser-
vices including that it was important to ’Educate people about Islamic law’ or to provide
’Islamic law to the common people’. They pointed out that they provided ’interest-free
loans for higher education’ and that ’Hindi and English are taught in the madrasa’. Hindu
organisations spoke more about ’We are trying to educate farmers about farming’or ’We
are providing free medicines for poor people.’ These differences in motives for providing
services may be quite important in explaining religious differences in non-religious services
among the religious groups in this study as at least in the case of one religion, Islam, there
is an explicit theological mandate to engage in charity. It might possibly explain why in
our data the Muslim organisations are providing much more education services than the
Hindus.
On balance, what we find is that the average change in the probability of providing
higher levels of education and health services for an increase in the perception of inequality
remains large, significant and positive. So if organisations perceived that inequality had
increased, they also said that education and health services were better provided for. Hindu
organisations are providing more services. Other factors that are driving their decision-
making seems to be total expenditure and employees. The state effects are particularly
noteworthy and include both Muslim-majority and Hindu-majority states suggesting that
our findings are important for all religious groups.
7 Conclusion
Consider this view from the field – ’Yahan bhukha jagtaa hai par koi bhukha sota nahi’,
translated as ‘People wake up on an empty stomach here but no one will go to bed on an
36
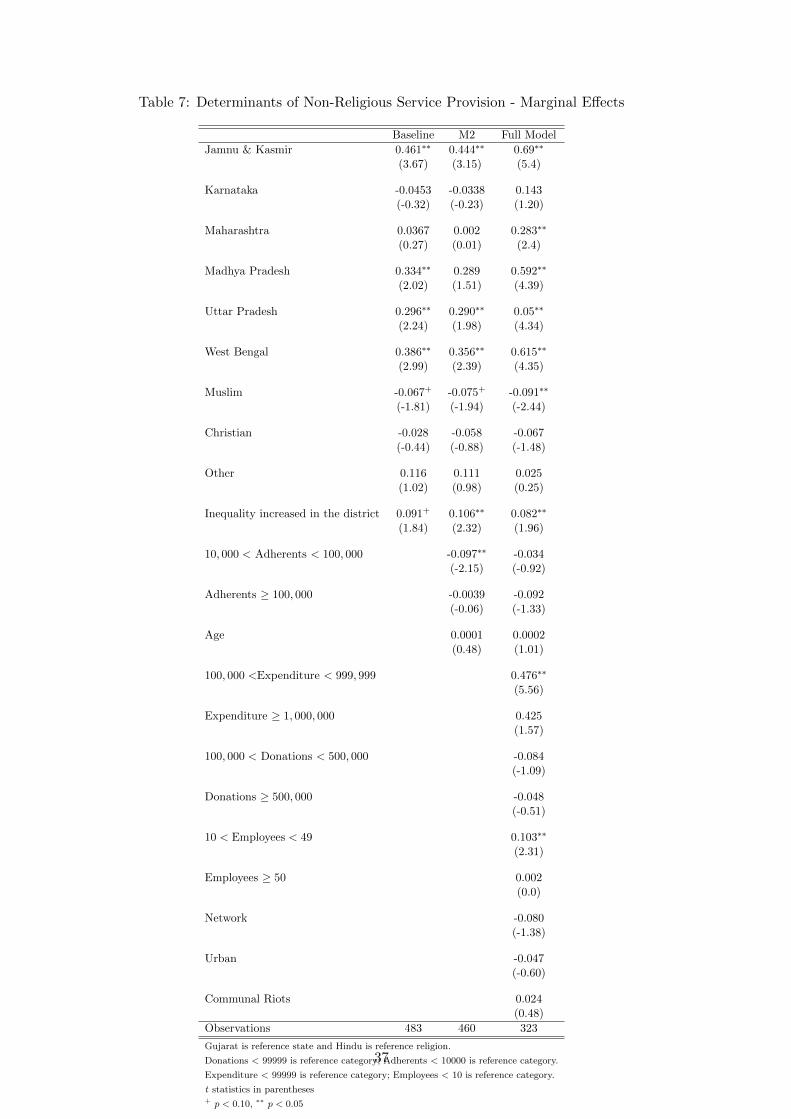
Table 7: Determinants of Non-Religious Service Provision - Marginal Effects
Baseline M2 Full Model
Jamnu & Kasmir 0.461∗∗ 0.444∗∗ 0.69∗∗
(3.67) (3.15) (5.4)
Karnataka -0.0453 -0.0338 0.143(-0.32) (-0.23) (1.20)
Maharashtra 0.0367 0.002 0.283∗∗
(0.27) (0.01) (2.4)
Madhya Pradesh 0.334∗∗ 0.289 0.592∗∗
(2.02) (1.51) (4.39)
Uttar Pradesh 0.296∗∗ 0.290∗∗ 0.05∗∗
(2.24) (1.98) (4.34)
West Bengal 0.386∗∗ 0.356∗∗ 0.615∗∗
(2.99) (2.39) (4.35)
Muslim -0.067+ -0.075+ -0.091∗∗
(-1.81) (-1.94) (-2.44)
Christian -0.028 -0.058 -0.067(-0.44) (-0.88) (-1.48)
Other 0.116 0.111 0.025(1.02) (0.98) (0.25)
Inequality increased in the district 0.091+ 0.106∗∗ 0.082∗∗
(1.84) (2.32) (1.96)
10, 000 < Adherents < 100, 000 -0.097∗∗ -0.034(-2.15) (-0.92)
Adherents ≥ 100, 000 -0.0039 -0.092(-0.06) (-1.33)
Age 0.0001 0.0002(0.48) (1.01)
100, 000 <Expenditure < 999, 999 0.476∗∗
(5.56)
Expenditure ≥ 1, 000, 000 0.425(1.57)
100, 000 < Donations < 500, 000 -0.084(-1.09)
Donations ≥ 500, 000 -0.048(-0.51)
10 < Employees < 49 0.103∗∗
(2.31)
Employees ≥ 50 0.002(0.0)
Network -0.080(-1.38)
Urban -0.047(-0.60)
Communal Riots 0.024(0.48)
Observations 483 460 323
Gujarat is reference state and Hindu is reference religion.
Donations < 99999 is reference category; Adherents < 10000 is reference category.
Expenditure < 99999 is reference category; Employees < 10 is reference category.
t statistics in parentheses+ p < 0.10, ∗∗ p < 0.05
37
empty stomach.’ And so the words of a Sufi scholar discussing the practice of ‘langar’ or
the community kitchen of his mosque, which undertakes a community feeding programme,
epitomises the vital nature of non-religious service provision by religious organisations in
India today. If we examine the history of India’s religions, all of them – Hinduism, Islam,
Jainism, and Buddhism – arose in response to the perceived inequalities in society and
by a desire on the part of those propagating the religion to deal with the social problems
that emerged in various historical periods. Such lessons underlie the crucial role of the
socio-economic consequences of religiosity and service provision, which has played a key
role in the operations of Indian religious organisations in the past.
This paper has examined the economics of religion in India in the present day. In par-
ticular, we highlight the provision of religious and non-religious services such as education
and health by religious organisations as a way of retaining adherents in a situation where
economic growth and income inequality are both increasing. To illustrate this theoretically,
we presented a simple and stylized Hotelling-style model in which religious organisations
choose a religious focal point and decide upon the non-religious services provided. We
showed in the model two central predictions. First, that the organisations will differentiate
themselves on the strength of religious beliefs. Second, that in equilibrium, economic in-
equality alone is sufficient to make the organisations increase their provision of non-religious
services.
To examine the issue empirically, we present our unique primary survey data collected
between 2006 and 2010 in India from 568 Hindu, Muslim, Christian, Sikh and Jain religious
organisations spread across 7 major Indian states. Using our theoretical model, and testing
the two key propositions from it on our survey data, we highlight that religious organisations
in India are choosing to differentiate themselves on the strength of religious beliefs with
respect to other organisations. We find evidence that organisations of all religions in India
have substantially increased their provision of religious and especially non-religious services,
and that this is related to their perception of economic inequality. We also show that the
average change in the probability of providing higher levels of education and health services
for an increase in the perception of inequality remains large, positive, significant and robust.
We acknowledge that while this study presents one argument for why service provision
has increased among religious organisations in India so rapidly, there may also be other
possible explanations. For example, there could be changes in religious regulation, increased
missionary work from outside the country, other factors related to economic growth, and
so forth. While our study does not emphasise these factors, we do acknowledge that the
growth of religion and service provision in India has complex roots, grounded in the history,
politics and sociology of the subcontinent. Religious organisations across India, irrespective
of religion, are playing a very important role in local communities by providing education,
health, or other services. This is a very positive role that they play in their communities,
by contributing to both religious and non-religious activities that build social capital and
address economic necessity. In this study the links we highlight between the sacred and the
secular demonstrate simply how one economic channel, economic inequality, may interact
to influence religious and non-religious service provision by religious organisations in India.
38
References
[1] Abramitzky, R. (2011), ‘On the (Lack of) Stability of Communes and Economic Per-
spective’, The Oxford Handbook of the Economics of Religion, edited by Rachel M.
McCleary, Oxford: Oxford University Press: 169-189.
[2] Anderson, G. M. (1988), ‘Mr Smith and the Preachers: The Economics of Religion in
the Wealth of Nations’, Journal of Political Economy, 96 : 1066–88.
[3] Andrews, D. W. K. (1988a), ‘Chi-square diagnostic tests for econometric models: The-
ory’, Econometrica, Volume 56 : 1419–53.
[4] Andrews, D. W. K. (1988b), ‘Chi-square diagnostic tests for econometric models: In-
troduction and applications’, Journal of Econometrics, Volume 37 : 135–56.
[5] Angrist, J. D. and J. S Pischke (2009), Mostly Harmless Econometrics: An Empiricist’s
Companion. Princeton University Press, Princeton and Oxford.
[6] Azzi, C and Ehrenberg, R. G. (1975), ‘Household allocation of time and church atten-
dance’, Journal of Political Economy, 83: 27–56.
[7] Bagchi, A. K. (1991), ‘Predatory Commercialization and Communalism in India’,
In Anatomy of a Confrontation: The Babri Masjid-Ramjanmabhoomi Issue (ed. S.
Gopal), pp. 193–218. Delhi: Penguin.
[8] Banerjee, A. and Iyer, L. (2005), ’History, Institutions, and Economic Performance:
The Legacy of Colonial Land Tenure Systems in India.’ American Economic Review,
95(4): 1190–1213.
[9] Barro, R. J. and McCleary, R. M. (2003), ‘Religion and economic growth across coun-
tries’, American Sociological Review, 68 : 760–81.
[10] Barro, R.J. and McCleary, R. M. (2005), ‘Which Countries Have State Religions?’
textitThe Quarterly Journal of Economics, 120 : 1331–70.
[11] Bayly, C. A. (1983), Rulers, Townsmen and Bazaars: North Indian Society in the Age
of British Expansion 1770–1870, Cambridge: Cambridge University Press.
[12] Becker, G. S. and Murphy, K. (2000), Social Economics, Market Behavior in a Social
Environment, Cambridge: Harvard University Press.
[13] Berman, E. (2000), ‘Sect, Subsidy and Sacrifice: An Economist’s View of Ultra-
Orthodox Jews’, Quarterly Journal of Economics 115: 905–53.
[14] Berman, E. (2009), Radical, Religious and Violent. The New Economics of Terrorism.
MIT Press.
[15] Bisin, A. and Verdier, T. (2000), ‘Beyond the melting pot: Cultural transmission, mar-
riage, and the evolution of ethnic and religious traits’, Quarterly Journal of Economics,
3: 955–88.
39
[16] Bloom, N. and Van Reenan, J. (2007), ‘Measuring and Explaining Manangement Prac-
tices across Firms and Countries’, Quarterly Journal of Economics, 122(4): 1351–1408.
[17] Bloom, N. and Van Reenan, J. (2010), ‘New Approaches to Surveying Organisations’,
American Economic Review Papers and Proceedings, 100(2): 105–109.
[18] Bohlken, A. T. and Sergenti E. (2010), ‘Economic growth and ethnic violence: An
empirical investigation of Hindu-Muslim riots in India’, Journal of Peace Research, 47
: 589–600.
[19] Borooah, V. and Iyer, S. (2005), ‘Vidya, Veda and Varna: The influence of religion
and caste on education in rural India’, Journal of Development Studies, 41 : 1369–404.
[20] Brass, P. R. (2003), The Production of Hindu-Muslim Violence in Contemporary India,
Seattle, WA: University of Washington Press.
[21] Chaves, M. (2004), Congregations in America. Cambridge, Massachusetts: Harvard
University Press.
[22] Carroll, R., Ruppert, D., Stefanski, L. and Crainiceann, C. (2006), Measurement Error
in Nonlinear Models: A Modern Perspective, Second Edition. Boca Raton: Taylor and
Francis, Chapman and Hall.
[23] Chaudhary, L., and Rubin, J. (2011), Reading, Writing, and Religion: Institutions
and Human Capital Formation, Journal of Comparative Economics, 39(1): 17-33.
[24] Chen, D. L. (2010), ‘Club Goods and Group Identity: Evidence from the Islamic
Resurgence during the Indonesian Financial Crisis’, Journal of Political Economy, 118
: 300–54.
[25] Chen, X., Hong, H. and Nekipelov, D. (2011), ’Nonlinear Models of Measurement
Errors’, Journal of Economic Literature, 49(4): 901-937.
[26] Cressie, N. and Read, T. R. C. (1984), ‘Multinomial goodness-of-t tests’, Journal of
the Royal Statistical Society, 46 : 440–64.
[27] Deaton, A. and Dreze, J. (2002), ’Poverty and Inequality in India: A Reexamination’,
Economic and Political Weekly, September 7, 3729-48.
[28] Dehejia, R., DeLeire, T. and Luttmer, E. F. P. (2007), ‘Insuring Consumption and
Happiness through Religious organisations’, Journal of Public Economics 91: 259–79.
[29] Durlauf, S., Kourtellos, A. and Tan C. M. (2011), ‘Is God in the Details? A Re-
examination of the Role of Religion in Economic Growth’, Journal of Applied Econo-
metrics, forthcoming.
[30] Ellison, G. and Glaeser, E. L. (1997), ‘Geographic Concentration in US Manufacturing
Industries: A Dartboard Approach’, Journal of Political Economy, 105 : 889–927.
40
[31] Engineer, A. A. (1984), ‘Understanding Communalism’, Economic and Political
Weekly, 18: 752–56.
[32] Finke, R. (2004), ‘Innovative Returns to Tradition: Using Core Teachings as the Foun-
dation for Innovative Accommodation’, Journal for the Scientific Study of Religion,
43 : 19–34.
[33] Glaeser, E. L. (2005), ‘The Political Economy of Hatred’, Quarterly Journal of Eco-
nomics, 120: 45–86.
[34] Gruber, J. and Hungerman, D. M. (2006), ‘The Church versus the Mall: What Hap-
pens When Religion Faces Increased Secular Competition?’ The Quarterly Journal of
Economics, 123: 831–62.
[35] Gruber, J. and Hungerman, D. M. (2007), ‘Faith-based Charity and Crowd Out during
the Great Depression.’ Journal of Public Economics, 91: 1043-61.
[36] Hansen, C.B. (2007), Asymptotic properties of a robust variance matrix estimator for
panel data when is large. Journal of Econometrics, 141(2): 597-620.
[37] Harris, L. R. and Brown, G. T. L. (2010), ’Mixing interview and questionanire meth-
ods: Practical problems in aligning data’, Practical Assessment, Research and Evalu-
ation, 15(1): 1-19.
[38] Hausman, J., Abrevaya, J. and Scott-Morton, F. (1998), ’Misclassification of the De-
pendent Variable in a Discrete-Response Setting’, Journal of Econometrics, 87(2):
239-269.
[39] Hoderlain, S. and Winter, J. (2010), ‘Structural Measurement Errors in Non-separable
Models’, Journal of Econometrics, 157 : 432–40.
[40] Hotelling, H .(1929), ‘Stability in Competition’, The Economic Journal, 39 : 41–57.
[41] Hu, Y., and Schennach, S. (2008), ’Instrumental Variable Treatment of Nonclassical
Measurement Error Models’, Econometrica, 76: 195-216.
[42] Hungerman, D. M. (2005), ‘Are Church and State Substitutes? Evidence from the
1996 Welfare Reform’, Journal of Public Economics, 89: 2245-2267.
[43] Hyslop, D. R. and Imbens, G. W. (2001), ‘Bias from Classical and Other Forms of
Measurement Error’, Journal of Business and Economic Statistics, 19 : 475–81.
[44] Iannaccone, L. R. (1992), ‘Sacrifice and Stigma: Reducing Free-riding in Cults, Com-
munes and other Collectives’, Journal of Political Economy, 100: 271–92.
[45] Iannaccone, L. R. (1994), ‘Why Strict Churches are Strong?’ American Journal of
Sociology, 99 : 1180–211.
[46] Iannaccone, L. R. (1998), ‘Introduction to the Economics of Religion’, Journal of
Economic Literature, 36 : 1465-95.
41
[47] Iannaccone, L. R., Finke, R. and Stark, R. (1997), ‘Deregulating religion: The eco-
nomics of church and state’, Economic Inquiry, 35: 350–64.
[48] Iannaccone, L. R., Neal, D.A., Boettke, P. and McCloskey, D. (2005), ‘The Economics
of Religion: A Symposium’ Faith and Economics 46: 1–23.
[49] Iannaccone, L. R. and Berman, E. (2008) ‘Economics of Religion’, In The New Pal-
grave Dictionary of Economics, edited by Steven N. Durlauf and Lawrence E. Blume,
Basingstoke and New York: Palgrave Macmillan.
[50] Iyer, S. (2002), Demography and Religion in India, Delhi: Oxford University Press.
[51] Iyer, S. (2008), ‘Religion and Economic Development’, In The New Palgrave Dictionary
of Economics, edited by Steven N. Durlauf and Lawrence E. Blume, Basingstoke and
New York: Palgrave Macmillan.
[52] Iyer, S., Velu, C. and Mumit, A. (2014), ‘Communication and Marketing of Services
by Religious organisations in India’, Journal of Business Research., 67: 59–67.
[53] Krueger, A. (2007), What Makes a Terrorist? Economics and the Roots of Terrorism.
Lionel Robbins Lectures. Princeton: Princeton University Press.
[54] Kuran, T. (2010), The Long Divergence: How Islamic Law Held Back the Middle East.
Princeton: Princeton University Press.
[55] Mather, N., Fox, N. and Hunn, A. (1998), Using Interviews in a Research Project,
Trent Focus for Research and Development in Primary Health Care, Trent Focus
Group.
[56] Marshall, A. (1890), Principles of Economics, Book I, Chapter III, pp. 32–3, Great
Minds Series, Prometheus Books: New York, 1997, first published in 1890.
[57] Manski, C. (2004), ’Measuring Expectations’, Econometrica 1329-1376.
[58] McBride, M. (2010), ‘Religious Market Competition in a Richer World’, Economica
77: 148–71.
[59] Mitra, A. and Ray, D. (2014), ‘Implications of an Economic Theory of Conflict: Hindu-
Muslim Violence in India’, Journal of Political Economy forthcoming.
[60] Montgomery, J. D. (1996), ‘Contemplations on the Economic Approach to Religious
Behavior’, American Economic Review, 86: 443–7.
[61] Oslington, P. (2003), Economics and Religion, Volumes 1 and 2, The International
Library of Critical Writings in Economics 167, Edward Elgar, Cheltenham, UK.
[62] Putnam, R. D. and Campbell, D. E. (2010), American Grace: How Religion Divides
and Unites Us, New York, Simon & Schuster.
42
[63] Read, T. R. C. and Cressie, N. A. C. (1988), Goodness-Of-Fit Statistics for Discrete
Multivariate Data, Springer.
[64] Rysman, M. and Greenstein (2005), ‘Testing for agglomeration and dispersion’, Eco-
nomics Letters, 86: 405–11.
[65] Panagariya, A. (2008), India: The Emerging Giant, New York: Oxford University
Press.
[66] Sarkar, S. and Mehta B. S. (2010), ‘Income inequality in India: pre- and post-reform
periods’, Economic and Political Weekly, Volume 45, Number 37, 11 September.
[67] Schatz, E. (2012), ’Rationale and procedures for nesting semi-structured interviews in
surveys and censuses’, Population Studies, 66(2): 183-195.
[68] Schennach, S. (2013), ’Regressions with Berkson errors in covariates - a nonparametric
approach’, Institute for Fiscal Studies Cemmap Working Paper CWP22/13.
[69] Sen, A. K. (2005), The Argumentative Indian, London: Allen Lane.
[70] Stark, R. and Bainbridge, W. S. (1987), A Theory of Religion. Toronto Studies in
Religion; Volume 2. New York: Peter Lang.
[71] Stark, R. and Finke, R. (2001), ‘Beyond Church and Sect: Dynamics and Stability in
Religious Economies’, in T. Jelen (ed.) Sacred Markets and Sacred Canopies: Essays
on Religious Markets and Religious Pluralism. Lanham: Rowman and Littlefield.
[72] Stark, R. and Finke, R. (2000), Acts of Faith: Explaining the Human Side of Religion,
Berkeley: University of California Press.
[73] Stark, R, Iannaccone, L. R. and Finke, R. (1996), ‘Religion, science, and rationality’,
American Economic Review Papers and Proceedings, 86: 433–47.
[74] United States Department of State (2010), Report on International Religious Freedom
– India, 17 November 2010.
[75] Varshney, A. (2000), Ethnic Conflict and Civic Life: Hindus and Muslims in India,
New Haven: Yale University Press.
[76] Vogel, J. (2011), ’Spatial price discrimination with heterogenous firms’ Journal of
Industrial Economics, Volume LIX, Number 4, 661-676.
[77] Vuong, Q. H. and Wang, W. (1991), ‘Selecting estimated models using Chi-Square
statistics’, Tilburg Centre for Economic Research Papers 9165, Tilburg University.
[78] Hausman, Jerry, A. Jason Abrevaya, and F. M. Scott-Morton (1998) “Misclassification
of the Dependent Variable in a Discrete-Response Setting”. Journal of Econometrics,
87(2), 239-69.
[79] Xiaohong, Chen, Han Hong and Denis Nekipelov (2011), “Nonlinear Models of Mea-
surement Errors”. Journal of Economic Literature, 49(4): 901-937.
43


![Principles of Economics [1890] - Alfred Marshall](https://img.pdfslide.net/doc/110x75/55cf882555034664618dd607/principles-of-economics-1890-alfred-marshall.jpg)