Embed Size (px)
Citation preview
RUFUS C. BURLESONSchool Number 117
The information in this packert is based on data from the 2007-08 school year.
Campus Data Packetfor 2008 - 09 Plans
July 31, 2008
Data Analysis, Reporting, and Research Services https://portal.dallasisd.org/mydata
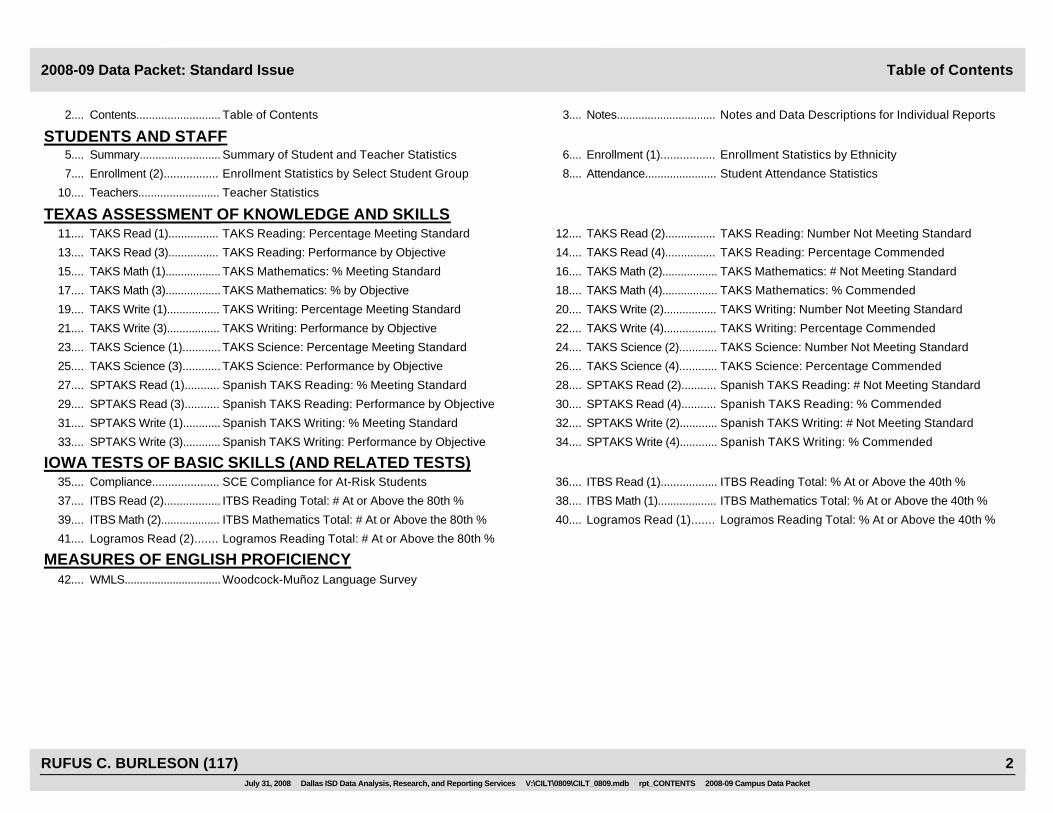
Table of Contents2008-09 Data Packet: Standard Issue
2.... Contents........................... Table of Contents 3.... Notes................................ Notes and Data Descriptions for Individual Reports
STUDENTS AND STAFF5.... Summary.......................... Summary of Student and Teacher Statistics 6.... Enrollment (1)................. Enrollment Statistics by Ethnicity
7.... Enrollment (2)................. Enrollment Statistics by Select Student Group 8.... Attendance....................... Student Attendance Statistics
10.... Teachers.......................... Teacher Statistics
TEXAS ASSESSMENT OF KNOWLEDGE AND SKILLS11.... TAKS Read (1)................ TAKS Reading: Percentage Meeting Standard 12.... TAKS Read (2)................ TAKS Reading: Number Not Meeting Standard
13.... TAKS Read (3)................ TAKS Reading: Performance by Objective 14.... TAKS Read (4)................ TAKS Reading: Percentage Commended
15.... TAKS Math (1).................. TAKS Mathematics: % Meeting Standard 16.... TAKS Math (2).................. TAKS Mathematics: # Not Meeting Standard
17.... TAKS Math (3).................. TAKS Mathematics: % by Objective 18.... TAKS Math (4).................. TAKS Mathematics: % Commended
19.... TAKS Write (1)................. TAKS Writing: Percentage Meeting Standard 20.... TAKS Write (2)................. TAKS Writing: Number Not Meeting Standard
21.... TAKS Write (3)................. TAKS Writing: Performance by Objective 22.... TAKS Write (4)................. TAKS Writing: Percentage Commended
23.... TAKS Science (1)............ TAKS Science: Percentage Meeting Standard 24.... TAKS Science (2)............ TAKS Science: Number Not Meeting Standard
25.... TAKS Science (3)............ TAKS Science: Performance by Objective 26.... TAKS Science (4)............ TAKS Science: Percentage Commended
27.... SPTAKS Read (1)........... Spanish TAKS Reading: % Meeting Standard 28.... SPTAKS Read (2)........... Spanish TAKS Reading: # Not Meeting Standard
29.... SPTAKS Read (3)........... Spanish TAKS Reading: Performance by Objective 30.... SPTAKS Read (4)........... Spanish TAKS Reading: % Commended
31.... SPTAKS Write (1)............ Spanish TAKS Writing: % Meeting Standard 32.... SPTAKS Write (2)............ Spanish TAKS Writing: # Not Meeting Standard
33.... SPTAKS Write (3)............ Spanish TAKS Writing: Performance by Objective 34.... SPTAKS Write (4)............ Spanish TAKS Writing: % Commended
IOWA TESTS OF BASIC SKILLS (AND RELATED TESTS)35.... Compliance..................... SCE Compliance for At-Risk Students 36.... ITBS Read (1).................. ITBS Reading Total: % At or Above the 40th %
37.... ITBS Read (2).................. ITBS Reading Total: # At or Above the 80th % 38.... ITBS Math (1)................... ITBS Mathematics Total: % At or Above the 40th %
39.... ITBS Math (2)................... ITBS Mathematics Total: # At or Above the 80th % 40.... Logramos Read (1)....... Logramos Reading Total: % At or Above the 40th %
41.... Logramos Read (2)....... Logramos Reading Total: # At or Above the 80th %
MEASURES OF ENGLISH PROFICIENCY42.... WMLS................................Woodcock-Muñoz Language Survey
July 31, 2008 Dallas ISD Data Analysis, Research, and Reporting Services V:\CILT\0809\CILT_0809.mdb rpt_CONTENTS 2008-09 Campus Data Packet
RUFUS C. BURLESON (117) 2
Notes, Definitions, and Data DescriptionsNotes
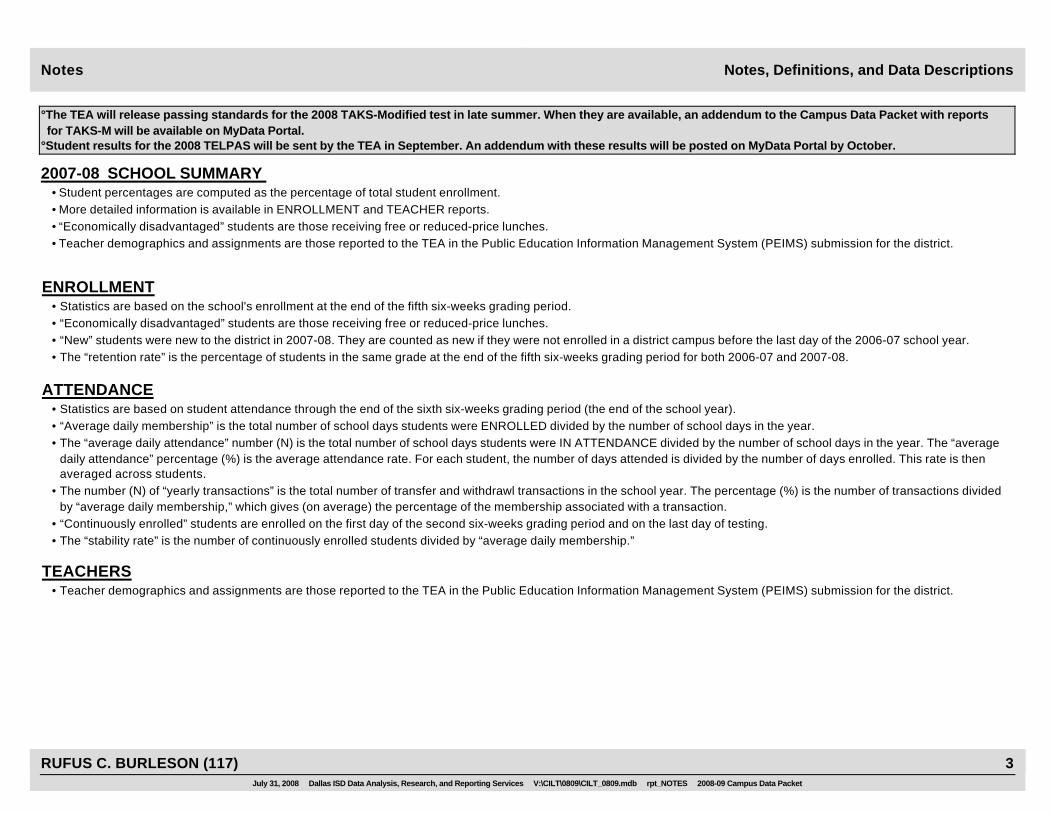
2007-08 SCHOOL SUMMARY Student percentages are computed as the percentage of total student enrollment.•
More detailed information is available in ENROLLMENT and TEACHER reports.•“Economically disadvantaged” students are those receiving free or reduced-price lunches.•Teacher demographics and assignments are those reported to the TEA in the Public Education Information Management System (PEIMS) submission for the district.•
°The TEA will release passing standards for the 2008 TAKS-Modified test in late summer. When they are available, an addendum to the Campus Data Packet with reports for TAKS-M will be available on MyData Portal.°Student results for the 2008 TELPAS will be sent by the TEA in September. An addendum with these results will be posted on MyData Portal by October.
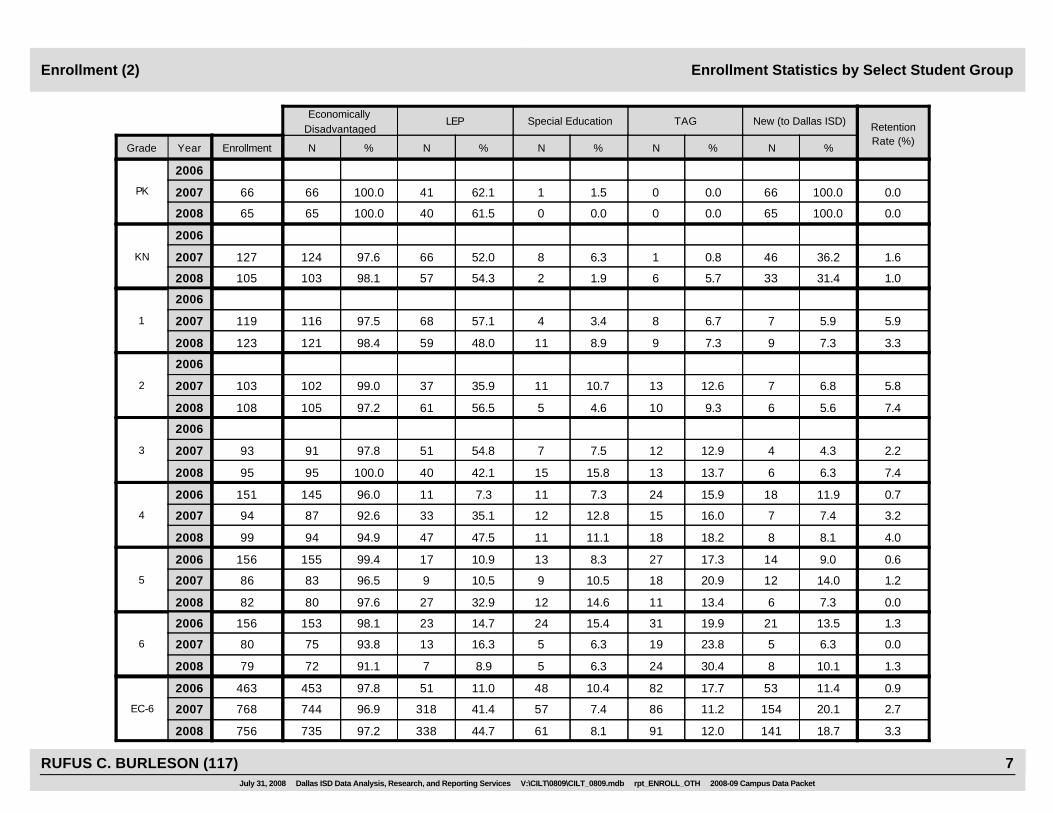
ENROLLMENTStatistics are based on the school's enrollment at the end of the fifth six-weeks grading period.•
“Economically disadvantaged” students are those receiving free or reduced-price lunches.•
The “retention rate” is the percentage of students in the same grade at the end of the fifth six-weeks grading period for both 2006-07 and 2007-08.•“New” students were new to the district in 2007-08. They are counted as new if they were not enrolled in a district campus before the last day of the 2006-07 school year.•
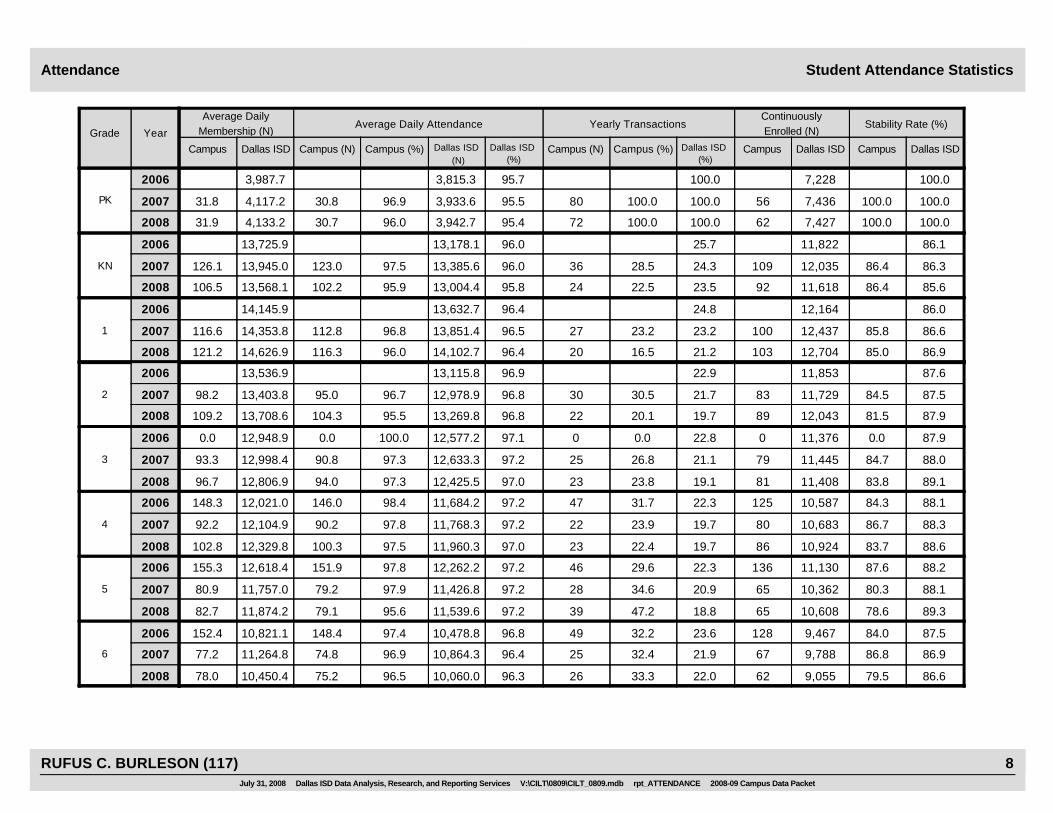
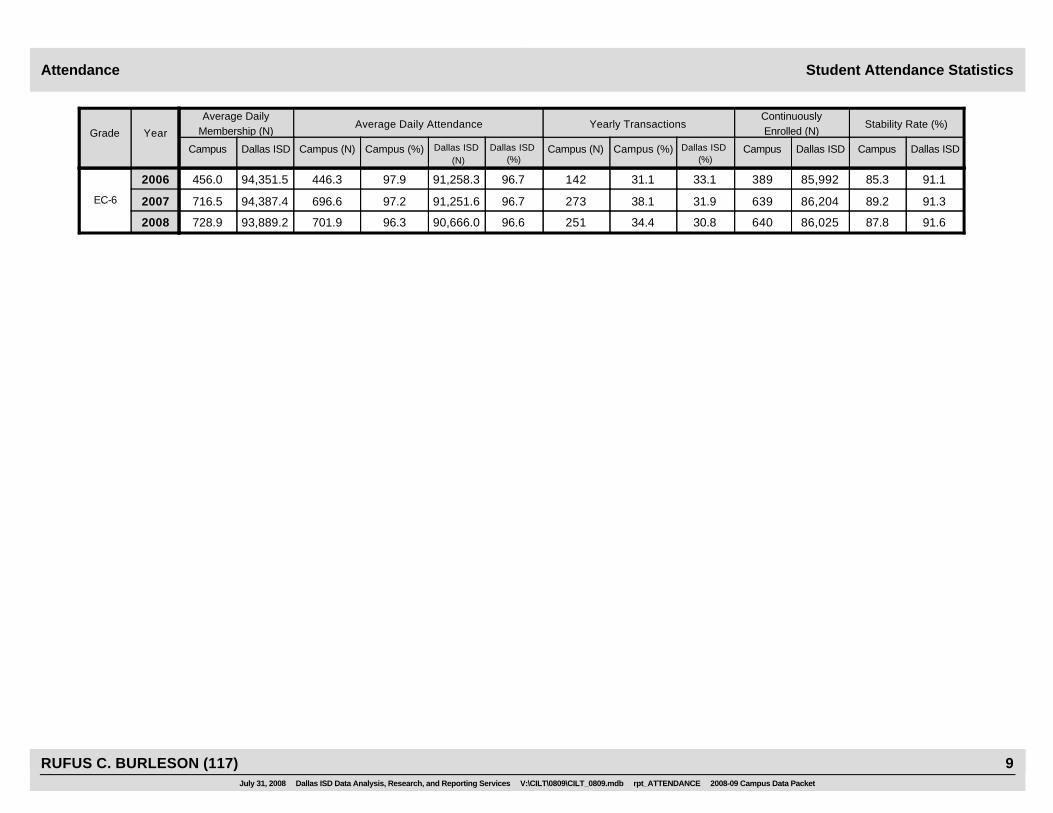
ATTENDANCE• Statistics are based on student attendance through the end of the sixth six-weeks grading period (the end of the school year).• “Average daily membership” is the total number of school days students were ENROLLED divided by the number of school days in the year.• The “average daily attendance” number (N) is the total number of school days students were IN ATTENDANCE divided by the number of school days in the year. The “average
daily attendance” percentage (%) is the average attendance rate. For each student, the number of days attended is divided by the number of days enrolled. This rate is then averaged across students.
• The number (N) of “yearly transactions” is the total number of transfer and withdrawl transactions in the school year. The percentage (%) is the number of transactions divided by “average daily membership,” which gives (on average) the percentage of the membership associated with a transaction.
• “Continuously enrolled” students are enrolled on the first day of the second six-weeks grading period and on the last day of testing.• The “stability rate” is the number of continuously enrolled students divided by “average daily membership.”
TEACHERS• Teacher demographics and assignments are those reported to the TEA in the Public Education Information Management System (PEIMS) submission for the district.
July 31, 2008 Dallas ISD Data Analysis, Research, and Reporting Services V:\CILT\0809\CILT_0809.mdb rpt_NOTES 2008-09 Campus Data Packet
RUFUS C. BURLESON (117) 3
Notes, Definitions, and Data DescriptionsNotes
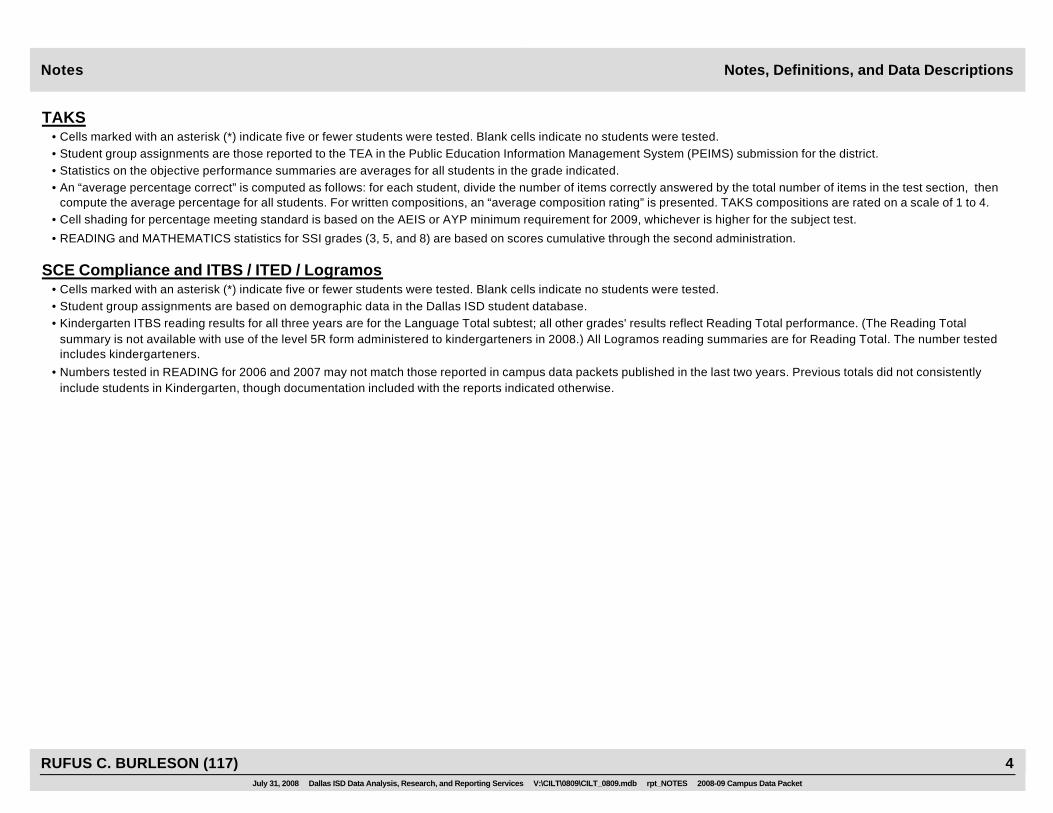
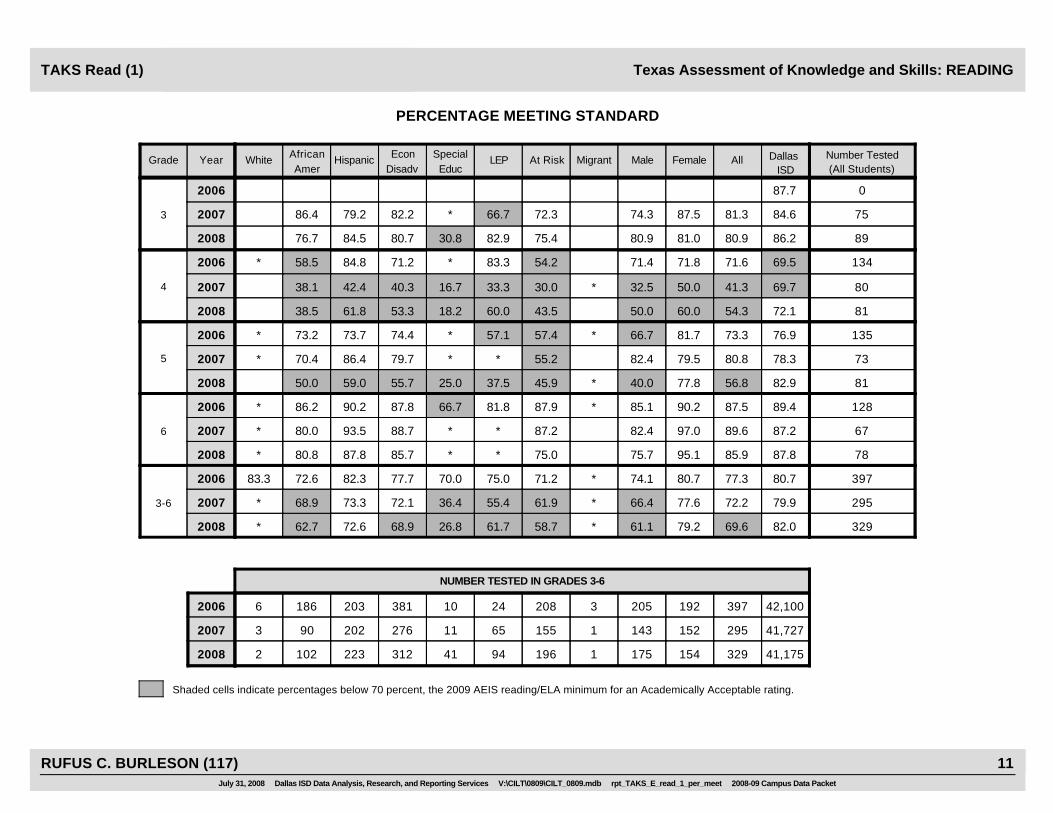
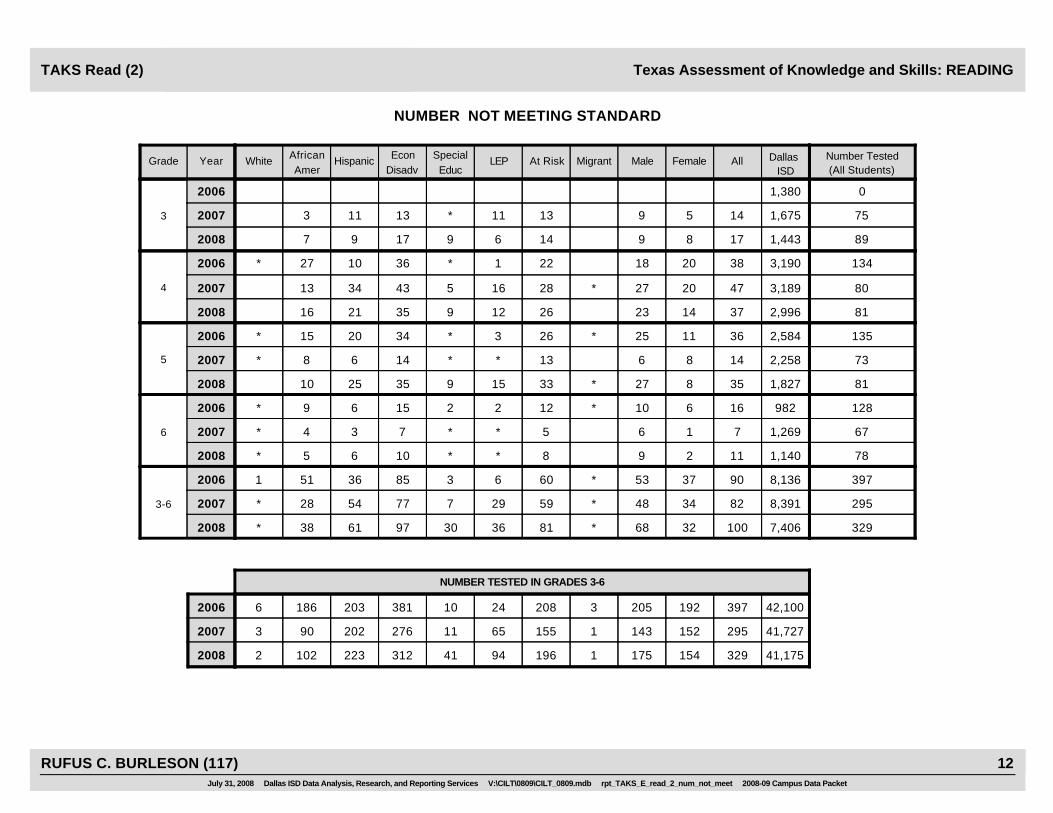
TAKSCells marked with an asterisk (*) indicate five or fewer students were tested. Blank cells indicate no students were tested.•
•
•
••
Student group assignments are those reported to the TEA in the Public Education Information Management System (PEIMS) submission for the district.
Cell shading for percentage meeting standard is based on the AEIS or AYP minimum requirement for 2009, whichever is higher for the subject test.
Statistics on the objective performance summaries are averages for all students in the grade indicated.An “average percentage correct” is computed as follows: for each student, divide the number of items correctly answered by the total number of items in the test section, then compute the average percentage for all students. For written compositions, an “average composition rating” is presented. TAKS compositions are rated on a scale of 1 to 4.
• READING and MATHEMATICS statistics for SSI grades (3, 5, and 8) are based on scores cumulative through the second administration.
••
SCE Compliance and ITBS / ITED / LogramosCells marked with an asterisk (*) indicate five or fewer students were tested. Blank cells indicate no students were tested.Student group assignments are based on demographic data in the Dallas ISD student database.
• Kindergarten ITBS reading results for all three years are for the Language Total subtest; all other grades' results reflect Reading Total performance. (The Reading Total summary is not available with use of the level 5R form administered to kindergarteners in 2008.) All Logramos reading summaries are for Reading Total. The number tested includes kindergarteners.
• Numbers tested in READING for 2006 and 2007 may not match those reported in campus data packets published in the last two years. Previous totals did not consistently include students in Kindergarten, though documentation included with the reports indicated otherwise.
July 31, 2008 Dallas ISD Data Analysis, Research, and Reporting Services V:\CILT\0809\CILT_0809.mdb rpt_NOTES 2008-09 Campus Data Packet
RUFUS C. BURLESON (117) 4
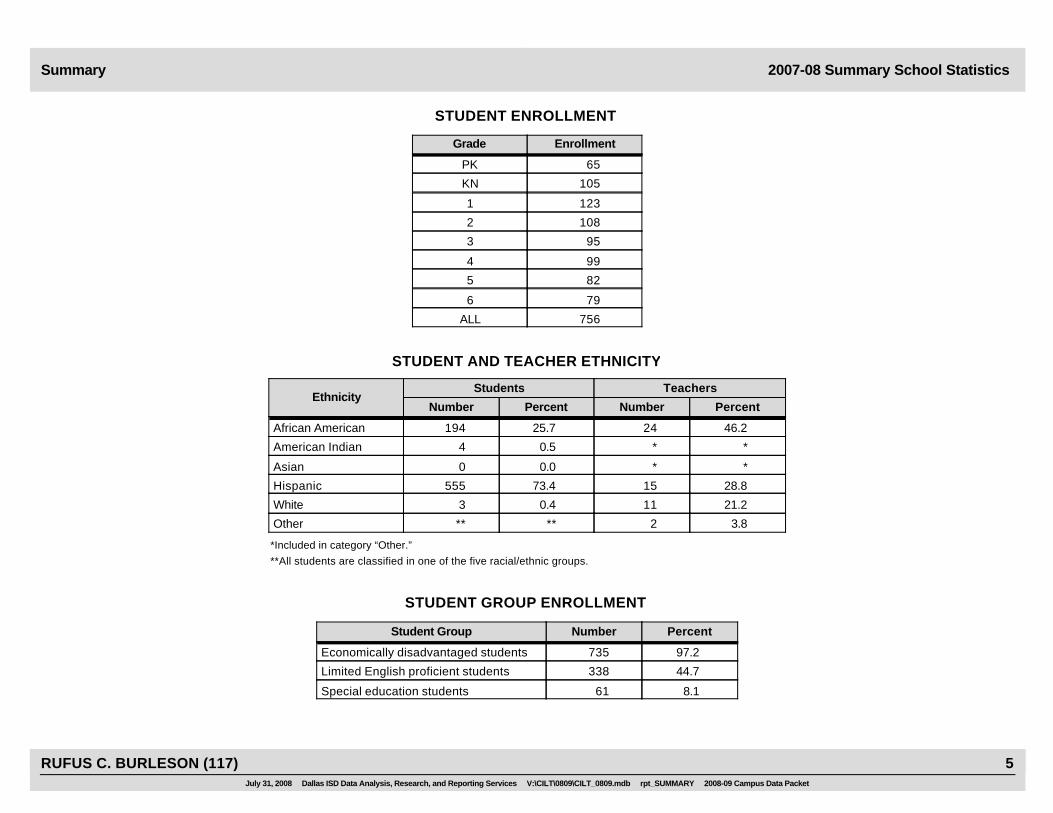
STUDENT ENROLLMENT
Grade Enrollment
Summary 2007-08 Summary School Statistics
PK 65
KN 105
1 123
2 108
3 95
4 99
5 82
6 79
ALL 756
Students Teachers
Number Percent Number PercentEthnicity
African American
American Indian
Asian
Hispanic
White
Other
194 25.7
4 0.5
0 0.0
555 73.4
3 0.4
24 46.2
15 28.8
11 21.2
2 3.8
* *
* *
** **
STUDENT GROUP ENROLLMENT
Number PercentStudent Group
Economically disadvantaged students
Limited English proficient students
Special education students
735 97.2
338 44.7
61 8.1
*Included in category “Other.”**All students are classified in one of the five racial/ethnic groups.
STUDENT AND TEACHER ETHNICITY
July 31, 2008 Dallas ISD Data Analysis, Research, and Reporting Services V:\CILT\0809\CILT_0809.mdb rpt_SUMMARY 2008-09 Campus Data Packet
RUFUS C. BURLESON (117) 5
N %
Asian
%NN %%
Hispanic
N N %Grade Year
African American American Indian
Enrollment
White
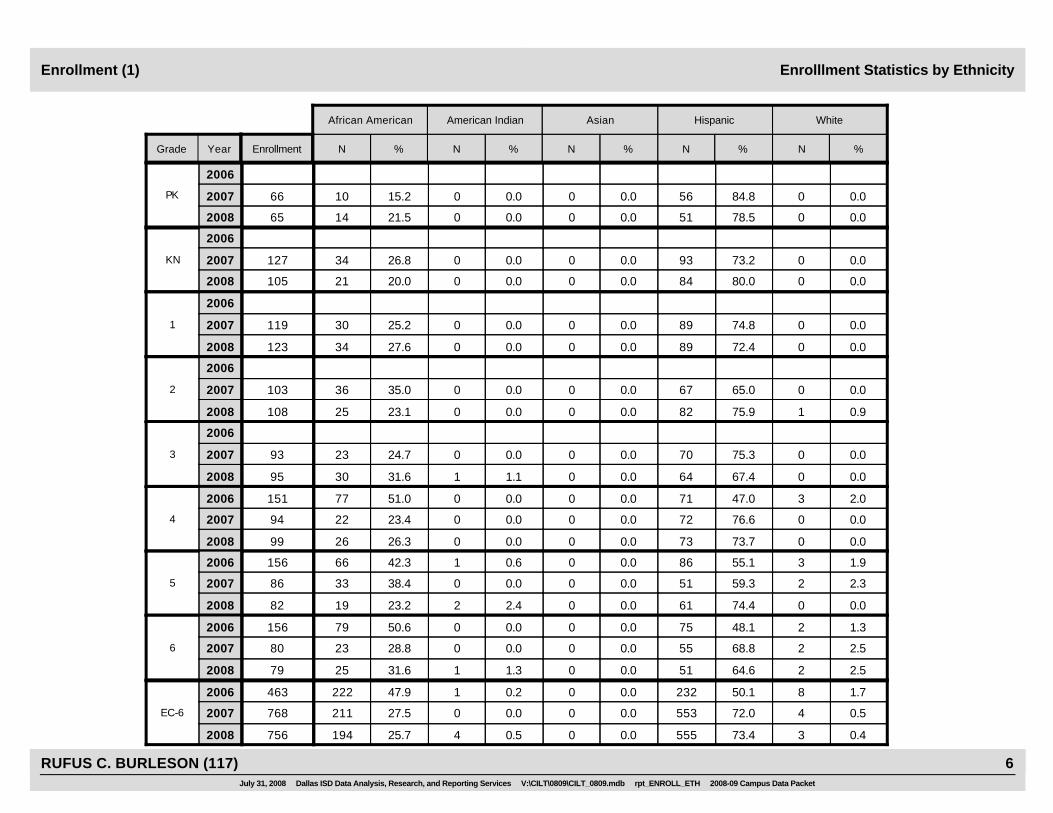
Enrolllment Statistics by EthnicityEnrollment (1)
2008
2006
2007 0.0
0.0
0
0
0.0
0.0
0
0
84.8
78.5
56
51
15.2
21.5
10
14
0.0
0.0
0
0
PK
65
66
2008
2006
2007 0.0
0.0
0
0
0.0
0.0
0
0
73.2
80.0
93
84
26.8
20.0
34
21
0.0
0.0
0
0
KN
105
127
2008
2006
2007 0.0
0.0
0
0
0.0
0.0
0
0
74.8
72.4
89
89
25.2
27.6
30
34
0.0
0.0
0
0
1
123
119
2008
2006
2007 0.0
0.0
0
0
0.0
0.0
0
0
65.0
75.9
67
82
35.0
23.1
36
25
0.0
0.9
0
1
2
108
103
2008
2006
2007 0.0
0.0
0
0
0.0
1.1
0
1
75.3
67.4
70
64
24.7
31.6
23
30
0.0
0.0
0
0
3
95
93
2008
2006
2007
0.0
0.0
0.0
0
0
0
0.0
0.0
0.0
0
0
0
47.0
76.6
73.7
71
72
73
51.0
23.4
26.3
77
22
26
2.0
0.0
0.0
3
0
0
4
99
94
151
2008
2006
2007
0.0
0.0
0.0
0
0
0
0.6
0.0
2.4
1
0
2
55.1
59.3
74.4
86
51
61
42.3
38.4
23.2
66
33
19
1.9
2.3
0.0
3
2
0
5
82
86
156
2008
2006
2007
0.0
0.0
0.0
0
0
0
0.0
0.0
1.3
0
0
1
48.1
68.8
64.6
75
55
51
50.6
28.8
31.6
79
23
25
1.3
2.5
2.5
2
2
2
6
79
80
156
2008
2006
2007
0.0
0.0
0.0
0
0
0
0.2
0.0
0.5
1
0
4
50.1
72.0
73.4
232
553
555
47.9
27.5
25.7
222
211
194
1.7
0.5
0.4
8
4
3
EC-6
756
768
463
July 31, 2008 Dallas ISD Data Analysis, Research, and Reporting Services V:\CILT\0809\CILT_0809.mdb rpt_ENROLL_ETH 2008-09 Campus Data Packet
RUFUS C. BURLESON (117) 6
New (to Dallas ISD)
N %
TAG
N %
Economically Disadvantaged
Grade Year
LEP Special Education
N % N % N %
Retention Rate (%)
Enrollment
Enrollment Statistics by Select Student GroupEnrollment (2)
100.0
100.0
PK
2008 65
66 100.0
100.0
66
65
62.1
61.5
41
40
1.5
0.0
1
0
0.0
0.0
0
0
0.0
0.0
2006
2007 66
65
36.2
31.4
KN
2008 105
127 97.6
98.1
124
103
52.0
54.3
66
57
6.3
1.9
8
2
0.8
5.7
1
6
1.6
1.0
2006
2007 46
33
5.9
7.3
1
2008 123
119 97.5
98.4
116
121
57.1
48.0
68
59
3.4
8.9
4
11
6.7
7.3
8
9
5.9
3.3
2006
2007 7
9
6.8
5.6
2
2008 108
103 99.0
97.2
102
105
35.9
56.5
37
61
10.7
4.6
11
5
12.6
9.3
13
10
5.8
7.4
2006
2007 7
6
4.3
6.3
3
2008 95
93 97.8
100.0
91
95
54.8
42.1
51
40
7.5
15.8
7
15
12.9
13.7
12
13
2.2
7.4
2006
2007 4
6
11.9
7.4
8.1
4
2008 99
94
151 96.0
92.6
94.9
145
87
94
7.3
35.1
47.5
11
33
47
7.3
12.8
11.1
11
12
11
15.9
16.0
18.2
24
15
18
0.7
3.2
4.0
2006
2007
18
7
8
9.0
14.0
7.3
5
2008 82
86
156 99.4
96.5
97.6
155
83
80
10.9
10.5
32.9
17
9
27
8.3
10.5
14.6
13
9
12
17.3
20.9
13.4
27
18
11
0.6
1.2
0.0
2006
2007
14
12
6
13.5
6.3
10.1
6
2008 79
80
156 98.1
93.8
91.1
153
75
72
14.7
16.3
8.9
23
13
7
15.4
6.3
6.3
24
5
5
19.9
23.8
30.4
31
19
24
1.3
0.0
1.3
2006
2007
21
5
8
11.4
20.1
18.7
EC-6
2008 756
768
463 97.8
96.9
97.2
453
744
735
11.0
41.4
44.7
51
318
338
10.4
7.4
8.1
48
57
61
17.7
11.2
12.0
82
86
91
0.9
2.7
3.3
2006
2007
53
154
141
July 31, 2008 Dallas ISD Data Analysis, Research, and Reporting Services V:\CILT\0809\CILT_0809.mdb rpt_ENROLL_OTH 2008-09 Campus Data Packet
RUFUS C. BURLESON (117) 7
Stability Rate (%)
Campus
ContinuouslyEnrolled (N)
Campus Dallas ISDCampus (N)Campus
Average DailyMembership (N)
Average Daily Attendance Yearly TransactionsGrade Year
Campus (N) Campus (%)Dallas ISD Dallas ISD (N)
Dallas ISD (%)
Campus (%) Dallas ISD (%)
Dallas ISD
Student Attendance StatisticsAttendance
100.0
100.0
62
56
7,228
7,427
7,436
72
80PK
2006 100.0
2007
2008 96.030.7 100.0 100.0
96.930.8 100.0 100.0
3,987.7
4,133.2
4,117.2
95.7
95.4
95.5
3,815.3
3,942.7
3,933.6
100.0
100.0
100.0
31.9
31.8
86.4
86.4
92
109
11,822
11,618
12,035
24
36KN
2006 25.7
2007
2008 95.9102.2 22.5 23.5
97.5123.0 28.5 24.3
13,725.9
13,568.1
13,945.0
96.0
95.8
96.0
13,178.1
13,004.4
13,385.6
86.1
85.6
86.3
106.5
126.1
85.0
85.8
103
100
12,164
12,704
12,437
20
271
2006 24.8
2007
2008 96.0116.3 16.5 21.2
96.8112.8 23.2 23.2
14,145.9
14,626.9
14,353.8
96.4
96.4
96.5
13,632.7
14,102.7
13,851.4
86.0
86.9
86.6
121.2
116.6
81.5
84.5
89
83
11,853
12,043
11,729
22
302
2006 22.9
2007
2008 95.5104.3 20.1 19.7
96.795.0 30.5 21.7
13,536.9
13,708.6
13,403.8
96.9
96.8
96.8
13,115.8
13,269.8
12,978.9
87.6
87.9
87.5
109.2
98.2
0.0
83.8
84.7
0
81
79
11,376
11,408
11,445
0
23
253
2006 100.00.0 0.0 22.8
2007
2008 97.394.0 23.8 19.1
97.390.8 26.8 21.1
12,948.9
12,806.9
12,998.4
97.1
97.0
97.2
12,577.2
12,425.5
12,633.3
87.9
89.1
88.0
0.0
96.7
93.3
84.3
83.7
86.7
125
86
80
10,587
10,924
10,683
47
23
224
2006 98.4146.0 31.7 22.3
2007
2008 97.5100.3 22.4 19.7
97.890.2 23.9 19.7
12,021.0
12,329.8
12,104.9
97.2
97.0
97.2
11,684.2
11,960.3
11,768.3
88.1
88.6
88.3
148.3
102.8
92.2
87.6
78.6
80.3
136
65
65
11,130
10,608
10,362
46
39
285
2006 97.8151.9 29.6 22.3
2007
2008 95.679.1 47.2 18.8
97.979.2 34.6 20.9
12,618.4
11,874.2
11,757.0
97.2
97.2
97.2
12,262.2
11,539.6
11,426.8
88.2
89.3
88.1
155.3
82.7
80.9
84.0
79.5
86.8
128
62
67
9,467
9,055
9,788
49
26
256
2006 97.4148.4 32.2 23.6
2007
2008 96.575.2 33.3 22.0
96.974.8 32.4 21.9
10,821.1
10,450.4
11,264.8
96.8
96.3
96.4
10,478.8
10,060.0
10,864.3
87.5
86.6
86.9
152.4
78.0
77.2
July 31, 2008 Dallas ISD Data Analysis, Research, and Reporting Services V:\CILT\0809\CILT_0809.mdb rpt_ATTENDANCE 2008-09 Campus Data Packet
RUFUS C. BURLESON (117) 8
Stability Rate (%)
Campus
ContinuouslyEnrolled (N)
Campus Dallas ISDCampus (N)Campus
Average DailyMembership (N)
Average Daily Attendance Yearly TransactionsGrade Year
Campus (N) Campus (%)Dallas ISD Dallas ISD (N)
Dallas ISD (%)
Campus (%) Dallas ISD (%)
Dallas ISD
Student Attendance StatisticsAttendance
85.3
87.8
89.2
389
640
639
85,992
86,025
86,204
142
251
273EC-6
2006 97.9446.3 31.1 33.1
2007
2008 96.3701.9 34.4 30.8
97.2696.6 38.1 31.9
94,351.5
93,889.2
94,387.4
96.7
96.6
96.7
91,258.3
90,666.0
91,251.6
91.1
91.6
91.3
456.0
728.9
716.5
July 31, 2008 Dallas ISD Data Analysis, Research, and Reporting Services V:\CILT\0809\CILT_0809.mdb rpt_ATTENDANCE 2008-09 Campus Data Packet
RUFUS C. BURLESON (117) 9
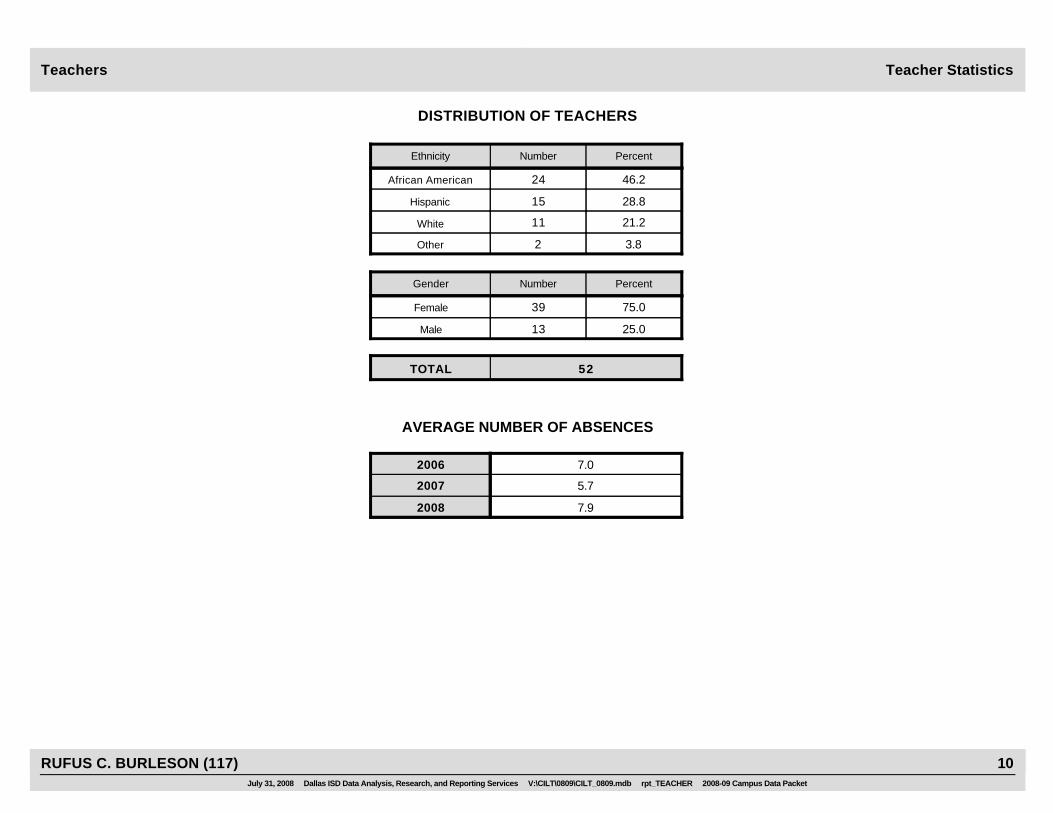
Number PercentEthnicity
Teacher Statistics
DISTRIBUTION OF TEACHERS
Teachers
52
2
Number Percent
75.039
25.013
3.8
28.815
46.224
21.211White
African American
Hispanic
Other
Gender
Male
Female
7.9
5.7
7.02006
2007
2008
TOTAL
AVERAGE NUMBER OF ABSENCES
July 31, 2008 Dallas ISD Data Analysis, Research, and Reporting Services V:\CILT\0809\CILT_0809.mdb rpt_TEACHER 2008-09 Campus Data Packet
RUFUS C. BURLESON (117) 10
FemaleMigrant MaleAt RiskWhite AfricanAmer
Hispanic EconDisadv
SpecialEduc
LEP All Dallas ISD
YearGrade Number Tested(All Students)
Texas Assessment of Knowledge and Skills: READING
PERCENTAGE MEETING STANDARD
TAKS Read (1)
80.9 81.0
74.3 87.5
86.22008 76.7 84.5 80.7 30.8 82.9 80.9 8975.4
3
87.72006 0
84.62007 86.4 79.2 82.2 * 66.7 81.3 7572.3
50.0 60.0
71.4 71.8
* 32.5 50.0
72.12008 38.5 61.8 53.3 18.2 60.0 54.3 8143.5
4
69.52006 * 58.5 84.8 71.2 * 83.3 71.6 13454.2
69.72007 38.1 42.4 40.3 16.7 33.3 41.3 8030.0
* 40.0 77.8
* 66.7 81.7
82.4 79.5
82.92008 50.0 59.0 55.7 25.0 37.5 56.8 8145.9
5
76.92006 * 73.2 73.7 74.4 * 57.1 73.3 13557.4
78.32007 * 70.4 86.4 79.7 * * 80.8 7355.2
75.7 95.1
* 85.1 90.2
82.4 97.0
87.82008 * 80.8 87.8 85.7 * * 85.9 7875.0
6
89.42006 * 86.2 90.2 87.8 66.7 81.8 87.5 12887.9
87.22007 * 80.0 93.5 88.7 * * 89.6 6787.2
* 61.1 79.2
* 74.1 80.7
* 66.4 77.6
82.02008 * 62.7 72.6 68.9 26.8 61.7 69.6 32958.7
3-6
80.72006 83.3 72.6 82.3 77.7 70.0 75.0 77.3 39771.2
79.92007 * 68.9 73.3 72.1 36.4 55.4 72.2 29561.9
1 175 154
3 205 192
1 143 152
41,1752008 2 223102 312 41 94 329196
42,1002006 6 203186 381 10 24 397208
NUMBER TESTED IN GRADES 3-6
41,7272007 3 20290 276 11 65 295155
Shaded cells indicate percentages below 70 percent, the 2009 AEIS reading/ELA minimum for an Academically Acceptable rating.
July 31, 2008 Dallas ISD Data Analysis, Research, and Reporting Services V:\CILT\0809\CILT_0809.mdb rpt_TAKS_E_read_1_per_meet 2008-09 Campus Data Packet
RUFUS C. BURLESON (117) 11
FemaleMigrant MaleAt RiskWhite AfricanAmer
Hispanic EconDisadv
SpecialEduc
LEP All Dallas ISD
YearGrade
NUMBER NOT MEETING STANDARD
Number Tested(All Students)
Texas Assessment of Knowledge and Skills: READINGTAKS Read (2)
9 8
9 5
1,4432008 7 9 17 9 6 17 8914
3
1,3802006 0
1,6752007 3 11 13 * 11 14 7513
23 14
18 20
* 27 20
2,9962008 16 21 35 9 12 37 8126
4
3,1902006 * 27 10 36 * 1 38 13422
3,1892007 13 34 43 5 16 47 8028
* 27 8
* 25 11
6 8
1,8272008 10 25 35 9 15 35 8133
5
2,5842006 * 15 20 34 * 3 36 13526
2,2582007 * 8 6 14 * * 14 7313
9 2
* 10 6
6 1
1,1402008 * 5 6 10 * * 11 788
6
9822006 * 9 6 15 2 2 16 12812
1,2692007 * 4 3 7 * * 7 675
* 68 32
* 53 37
* 48 34
7,4062008 * 38 61 97 30 36 100 32981
3-6
8,1362006 1 51 36 85 3 6 90 39760
8,3912007 * 28 54 77 7 29 82 29559
1 175 154
3 205 192
1 143 152
41,1752008 2 223102 312 41 94 329196
42,1002006 6 203186 381 10 24 397208
NUMBER TESTED IN GRADES 3-6
41,7272007 3 20290 276 11 65 295155
July 31, 2008 Dallas ISD Data Analysis, Research, and Reporting Services V:\CILT\0809\CILT_0809.mdb rpt_TAKS_E_read_2_num_not_meet 2008-09 Campus Data Packet
RUFUS C. BURLESON (117) 12
Basic UnderstandingApplying Knowledgeof Literary Elements
Using Strategiesto Analyze
Applying Critical-Thinking Skills
YearGrade
OBJECTIVE
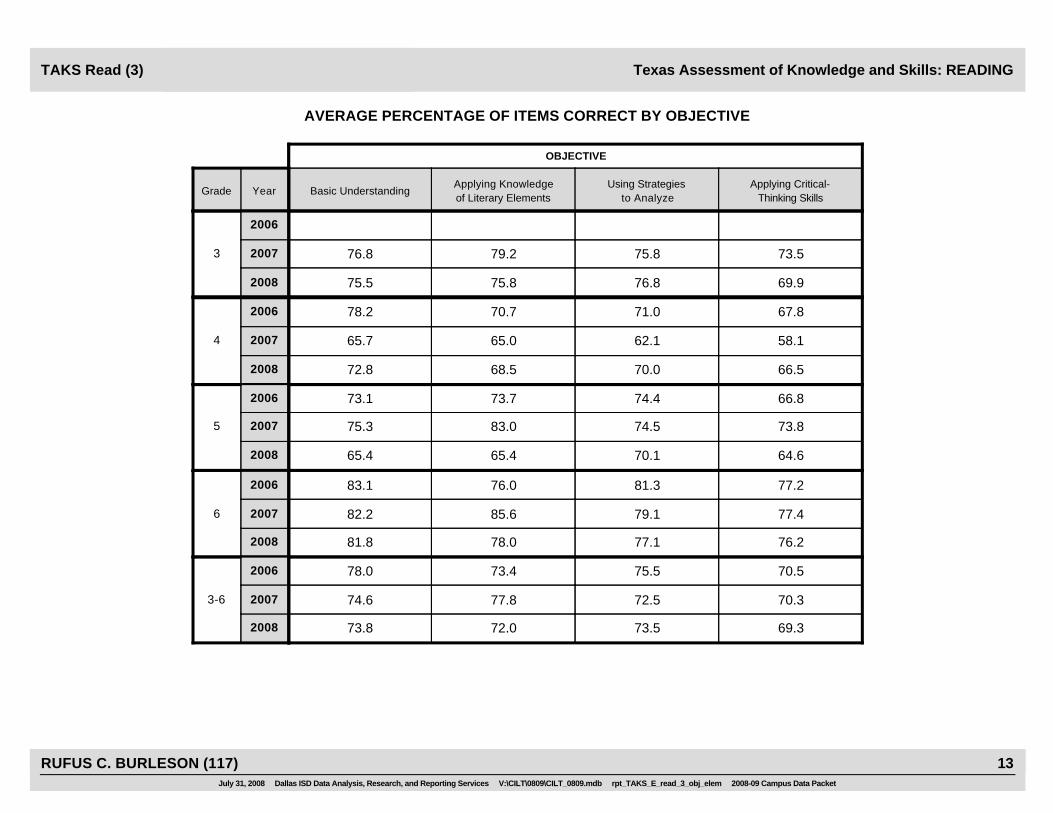
AVERAGE PERCENTAGE OF ITEMS CORRECT BY OBJECTIVE
Texas Assessment of Knowledge and Skills: READINGTAKS Read (3)
2008 75.5 75.8 76.8 69.9
2006
20073 76.8 79.2 75.8 73.5
2008 72.8 68.5 70.0 66.5
2006
2007
78.2 70.7 71.0 67.8
4 65.7 65.0 62.1 58.1
2008 65.4 65.4 70.1 64.6
2006
2007
73.1 73.7 74.4 66.8
5 75.3 83.0 74.5 73.8
2008 81.8 78.0 77.1 76.2
2006
2007
83.1 76.0 81.3 77.2
6 82.2 85.6 79.1 77.4
2008 73.8 72.0 73.5 69.3
2006
2007
78.0 73.4 75.5 70.5
3-6 74.6 77.8 72.5 70.3
July 31, 2008 Dallas ISD Data Analysis, Research, and Reporting Services V:\CILT\0809\CILT_0809.mdb rpt_TAKS_E_read_3_obj_elem 2008-09 Campus Data Packet
RUFUS C. BURLESON (117) 13
FemaleMigrant MaleAt RiskWhite AfricanAmer
Hispanic EconDisadv
SpecialEduc
LEP All Dallas ISD
YearGrade Number Tested(All Students)
Texas Assessment of Knowledge and Skills: READING
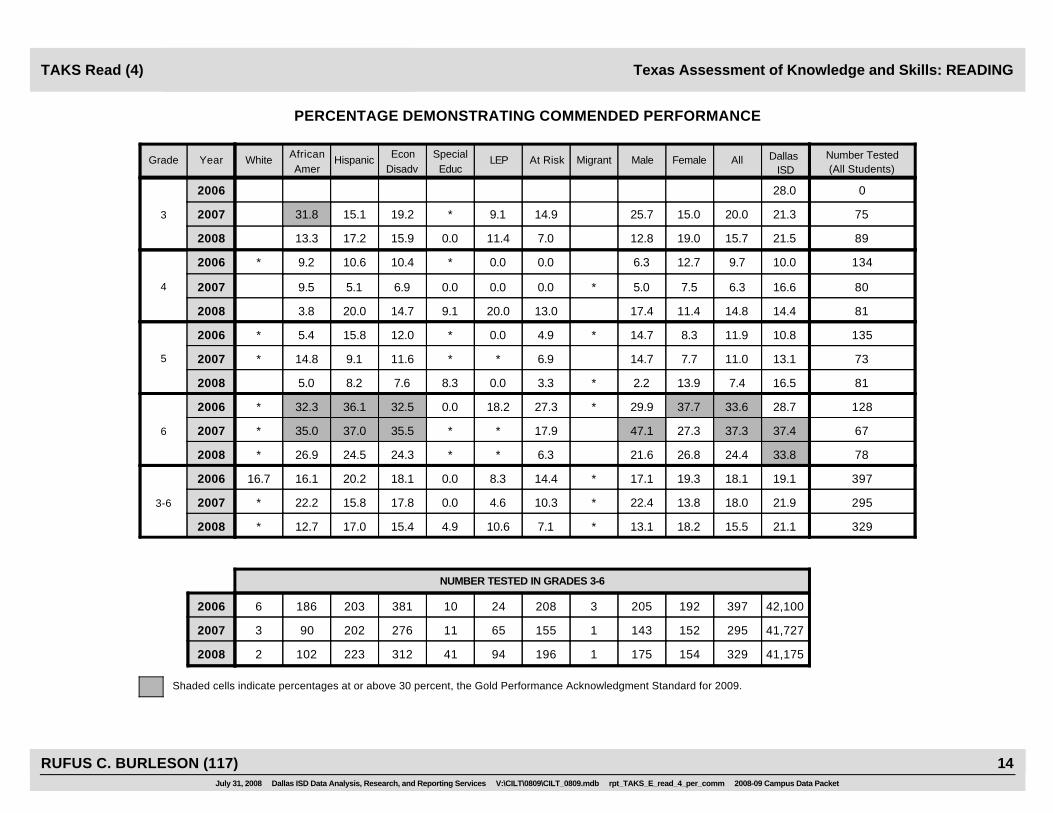
PERCENTAGE DEMONSTRATING COMMENDED PERFORMANCE
TAKS Read (4)
12.8 19.0
25.7 15.0
21.52008 13.3 17.2 15.9 0.0 11.4 15.7 897.0
3
28.02006 0
21.32007 31.8 15.1 19.2 * 9.1 20.0 7514.9
17.4 11.4
6.3 12.7
* 5.0 7.5
14.42008 3.8 20.0 14.7 9.1 20.0 14.8 8113.0
4
10.02006 * 9.2 10.6 10.4 * 0.0 9.7 1340.0
16.62007 9.5 5.1 6.9 0.0 0.0 6.3 800.0
* 2.2 13.9
* 14.7 8.3
14.7 7.7
16.52008 5.0 8.2 7.6 8.3 0.0 7.4 813.3
5
10.82006 * 5.4 15.8 12.0 * 0.0 11.9 1354.9
13.12007 * 14.8 9.1 11.6 * * 11.0 736.9
21.6 26.8
* 29.9 37.7
47.1 27.3
33.82008 * 26.9 24.5 24.3 * * 24.4 786.3
6
28.72006 * 32.3 36.1 32.5 0.0 18.2 33.6 12827.3
37.42007 * 35.0 37.0 35.5 * * 37.3 6717.9
* 13.1 18.2
* 17.1 19.3
* 22.4 13.8
21.12008 * 12.7 17.0 15.4 4.9 10.6 15.5 3297.1
3-6
19.12006 16.7 16.1 20.2 18.1 0.0 8.3 18.1 39714.4
21.92007 * 22.2 15.8 17.8 0.0 4.6 18.0 29510.3
1 175 154
3 205 192
1 143 152
41,1752008 2 223102 312 41 94 329196
42,1002006 6 203186 381 10 24 397208
NUMBER TESTED IN GRADES 3-6
41,7272007 3 20290 276 11 65 295155
Shaded cells indicate percentages at or above 30 percent, the Gold Performance Acknowledgment Standard for 2009.
July 31, 2008 Dallas ISD Data Analysis, Research, and Reporting Services V:\CILT\0809\CILT_0809.mdb rpt_TAKS_E_read_4_per_comm 2008-09 Campus Data Packet
RUFUS C. BURLESON (117) 14
FemaleMigrant MaleAt RiskWhite AfricanAmer
Hispanic EconDisadv
SpecialEduc
LEP All Dallas ISD
YearGrade Number Tested(All Students)
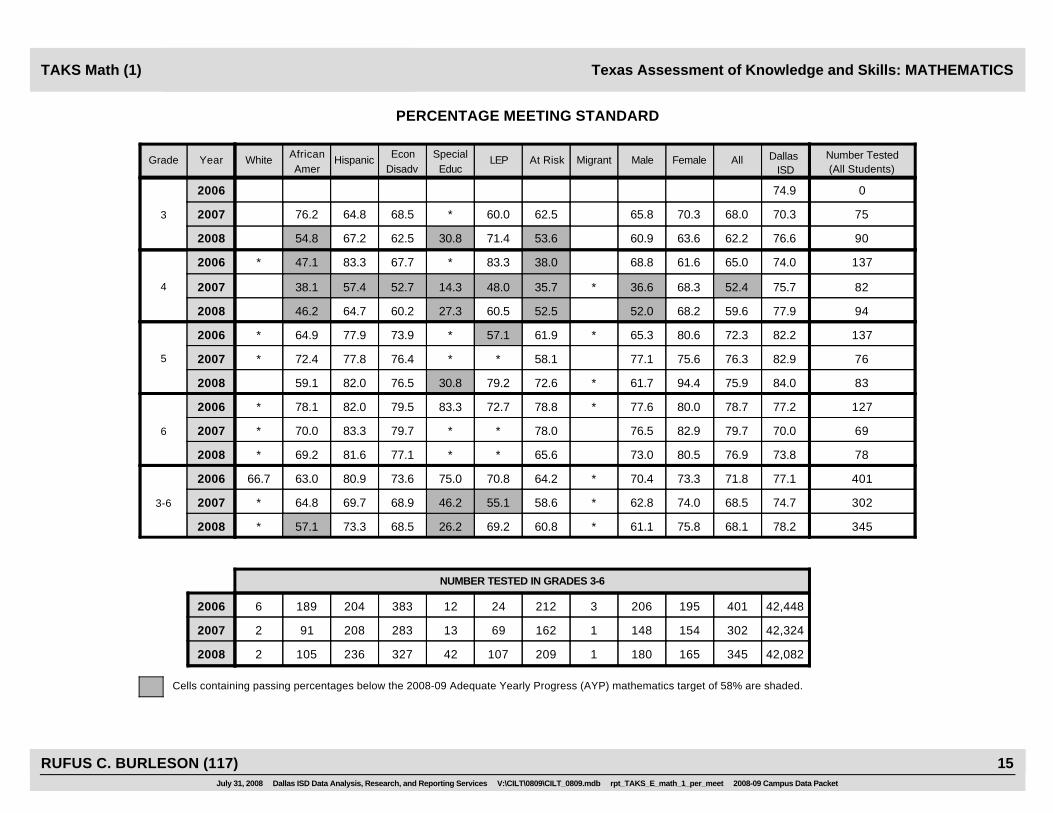
Texas Assessment of Knowledge and Skills: MATHEMATICS
PERCENTAGE MEETING STANDARD
TAKS Math (1)
60.9 63.6
65.8 70.3
76.62008 54.8 67.2 62.5 30.8 71.4 62.2 9053.6
3
74.92006 0
70.32007 76.2 64.8 68.5 * 60.0 68.0 7562.5
52.0 68.2
68.8 61.6
* 36.6 68.3
77.92008 46.2 64.7 60.2 27.3 60.5 59.6 9452.5
4
74.02006 * 47.1 83.3 67.7 * 83.3 65.0 13738.0
75.72007 38.1 57.4 52.7 14.3 48.0 52.4 8235.7
* 61.7 94.4
* 65.3 80.6
77.1 75.6
84.02008 59.1 82.0 76.5 30.8 79.2 75.9 8372.6
5
82.22006 * 64.9 77.9 73.9 * 57.1 72.3 13761.9
82.92007 * 72.4 77.8 76.4 * * 76.3 7658.1
73.0 80.5
* 77.6 80.0
76.5 82.9
73.82008 * 69.2 81.6 77.1 * * 76.9 7865.6
6
77.22006 * 78.1 82.0 79.5 83.3 72.7 78.7 12778.8
70.02007 * 70.0 83.3 79.7 * * 79.7 6978.0
* 61.1 75.8
* 70.4 73.3
* 62.8 74.0
78.22008 * 57.1 73.3 68.5 26.2 69.2 68.1 34560.8
3-6
77.12006 66.7 63.0 80.9 73.6 75.0 70.8 71.8 40164.2
74.72007 * 64.8 69.7 68.9 46.2 55.1 68.5 30258.6
1 180 165
3 206 195
1 148 154
42,0822008 2 236105 327 42 107 345209
42,4482006 6 204189 383 12 24 401212
NUMBER TESTED IN GRADES 3-6
42,3242007 2 20891 283 13 69 302162
Cells containing passing percentages below the 2008-09 Adequate Yearly Progress (AYP) mathematics target of 58% are shaded.
July 31, 2008 Dallas ISD Data Analysis, Research, and Reporting Services V:\CILT\0809\CILT_0809.mdb rpt_TAKS_E_math_1_per_meet 2008-09 Campus Data Packet
RUFUS C. BURLESON (117) 15
FemaleMigrant MaleAt RiskWhite AfricanAmer
Hispanic EconDisadv
SpecialEduc
LEP All Dallas ISD
YearGrade Number Tested(All Students)
Texas Assessment of Knowledge and Skills: MATHEMATICS
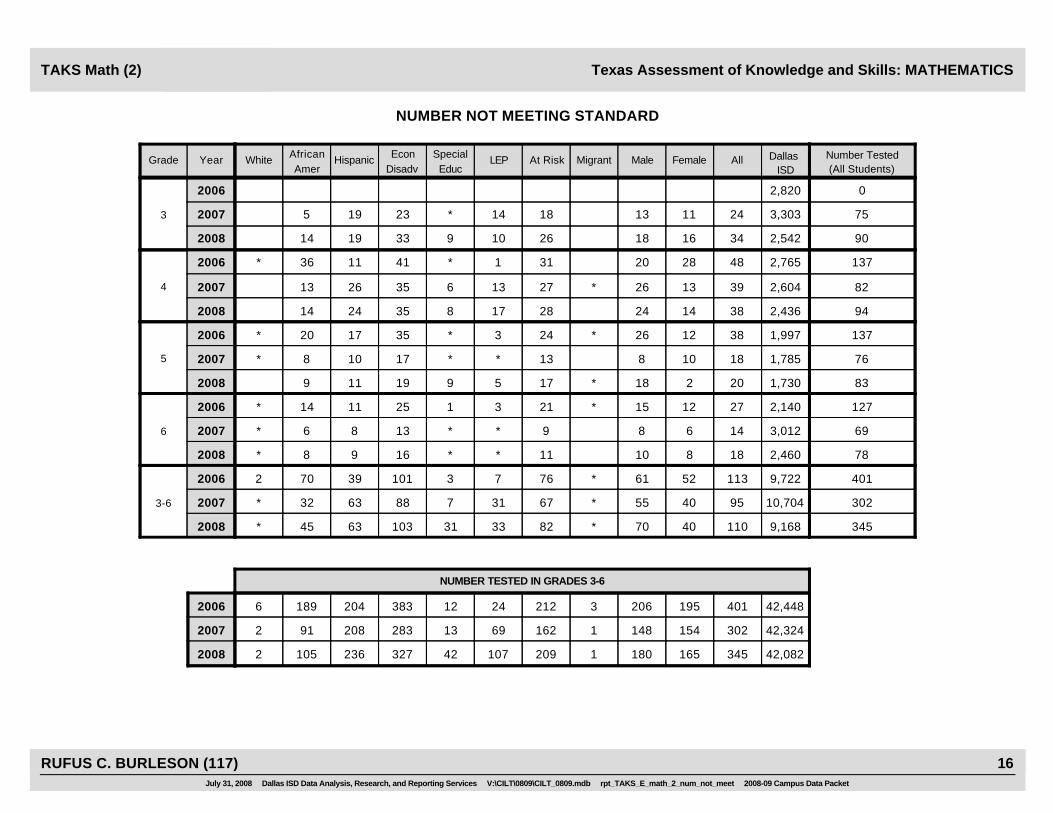
NUMBER NOT MEETING STANDARD
TAKS Math (2)
2008
2006
2007
18 16
13 11
2,54214 19 33 9 10 34 9026
3
2,820 0
3,3035 19 23 * 14 24 7518
2008
2006
2007
24 14
20 28
* 26 13
2,43614 24 35 8 17 38 9428
4
2,765* 36 11 41 * 1 48 13731
2,60413 26 35 6 13 39 8227
2008
2006
2007
* 18 2
* 26 12
8 10
1,7309 11 19 9 5 20 8317
5
1,997* 20 17 35 * 3 38 13724
1,785* 8 10 17 * * 18 7613
2008
2006
2007
10 8
* 15 12
8 6
2,460* 8 9 16 * * 18 7811
6
2,140* 14 11 25 1 3 27 12721
3,012* 6 8 13 * * 14 699
2008
2006
2007
* 70 40
* 61 52
* 55 40
9,168* 45 63 103 31 33 110 34582
3-6
9,7222 70 39 101 3 7 113 40176
10,704* 32 63 88 7 31 95 30267
1 180 165
3 206 195
1 148 154
42,0822008 2 236105 327 42 107 345209
42,4482006 6 204189 383 12 24 401212
NUMBER TESTED IN GRADES 3-6
42,3242007 2 20891 283 13 69 302162
July 31, 2008 Dallas ISD Data Analysis, Research, and Reporting Services V:\CILT\0809\CILT_0809.mdb rpt_TAKS_E_math_2_num_not_meet 2008-09 Campus Data Packet
RUFUS C. BURLESON (117) 16
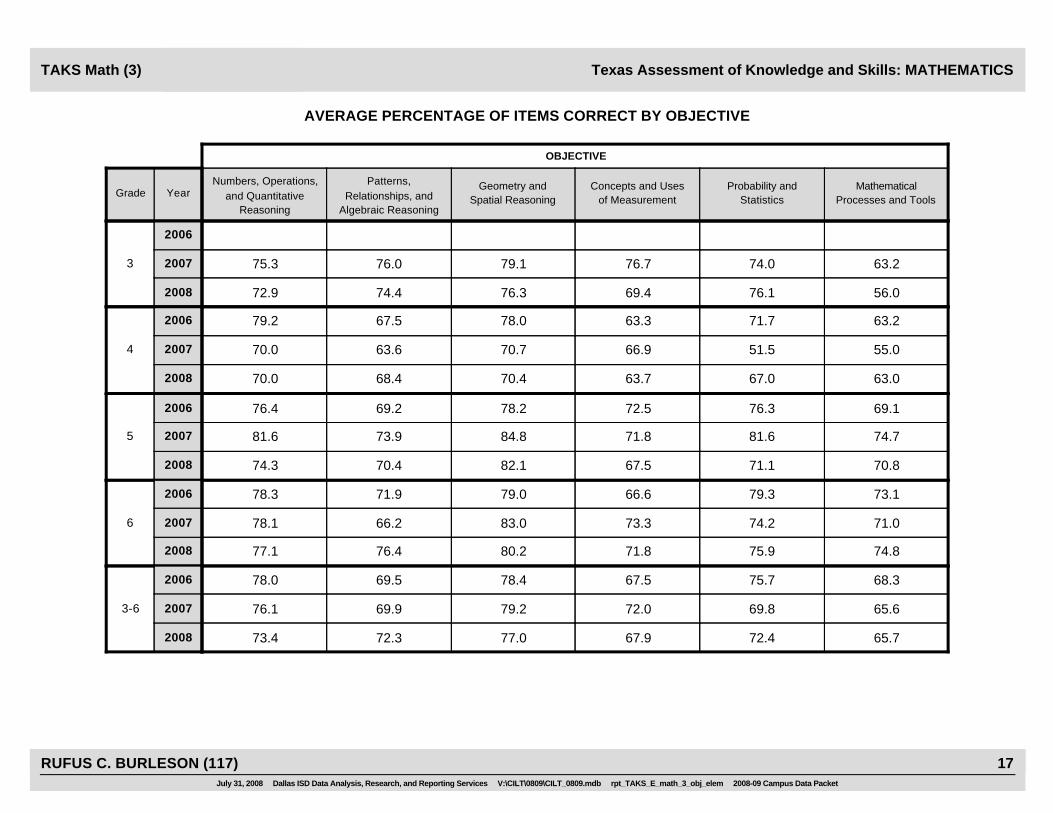
Numbers, Operations,and Quantitative
Reasoning
Patterns,Relationships, and
Algebraic Reasoning
Geometry andSpatial Reasoning
Concepts and Usesof Measurement
Probability andStatistics
MathematicalProcesses and Tools
YearGrade
OBJECTIVE
Texas Assessment of Knowledge and Skills: MATHEMATICS
AVERAGE PERCENTAGE OF ITEMS CORRECT BY OBJECTIVE
TAKS Math (3)
2008 72.9 74.4 76.3 69.4 76.1 56.0
2006
3 2007 75.3 76.0 79.1 76.7 74.0 63.2
2008 70.0 68.4 70.4 63.7 67.0 63.0
2006 79.2 67.5 78.0 63.3 71.7
4
63.2
2007 70.0 63.6 70.7 66.9 51.5 55.0
2008 74.3 70.4 82.1 67.5 71.1 70.8
2006 76.4 69.2 78.2 72.5 76.3
5
69.1
2007 81.6 73.9 84.8 71.8 81.6 74.7
2008 77.1 76.4 80.2 71.8 75.9 74.8
2006 78.3 71.9 79.0 66.6 79.3
6
73.1
2007 78.1 66.2 83.0 73.3 74.2 71.0
2008 73.4 72.3 77.0 67.9 72.4 65.7
2006 78.0 69.5 78.4 67.5 75.7
3-6
68.3
2007 76.1 69.9 79.2 72.0 69.8 65.6
July 31, 2008 Dallas ISD Data Analysis, Research, and Reporting Services V:\CILT\0809\CILT_0809.mdb rpt_TAKS_E_math_3_obj_elem 2008-09 Campus Data Packet
RUFUS C. BURLESON (117) 17
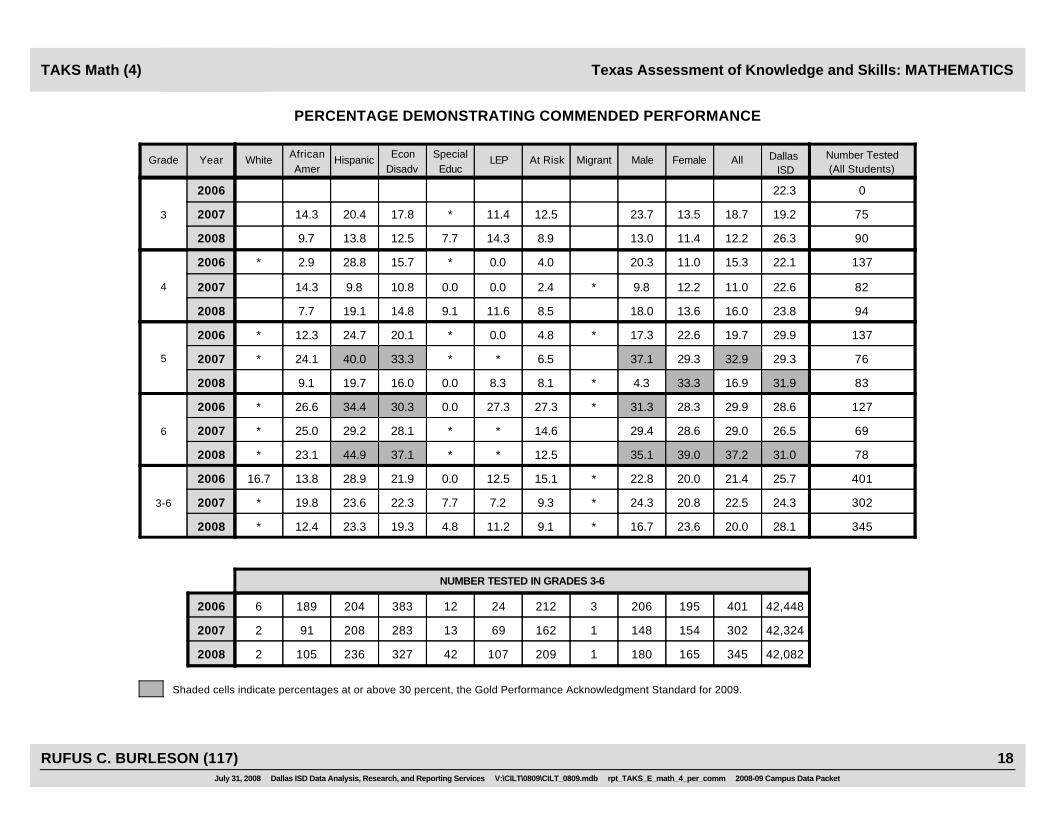
FemaleMigrant MaleAt RiskWhite AfricanAmer
Hispanic EconDisadv
SpecialEduc
LEP All Dallas ISD
YearGrade Number Tested(All Students)
Texas Assessment of Knowledge and Skills: MATHEMATICS
PERCENTAGE DEMONSTRATING COMMENDED PERFORMANCE
TAKS Math (4)
13.0 11.4
23.7 13.5
26.32008 9.7 13.8 12.5 7.7 14.3 12.2 908.9
3
22.32006 0
19.22007 14.3 20.4 17.8 * 11.4 18.7 7512.5
18.0 13.6
20.3 11.0
* 9.8 12.2
23.82008 7.7 19.1 14.8 9.1 11.6 16.0 948.5
4
22.12006 * 2.9 28.8 15.7 * 0.0 15.3 1374.0
22.62007 14.3 9.8 10.8 0.0 0.0 11.0 822.4
* 4.3 33.3
* 17.3 22.6
37.1 29.3
31.92008 9.1 19.7 16.0 0.0 8.3 16.9 838.1
5
29.92006 * 12.3 24.7 20.1 * 0.0 19.7 1374.8
29.32007 * 24.1 40.0 33.3 * * 32.9 766.5
35.1 39.0
* 31.3 28.3
29.4 28.6
31.02008 * 23.1 44.9 37.1 * * 37.2 7812.5
6
28.62006 * 26.6 34.4 30.3 0.0 27.3 29.9 12727.3
26.52007 * 25.0 29.2 28.1 * * 29.0 6914.6
* 16.7 23.6
* 22.8 20.0
* 24.3 20.8
28.12008 * 12.4 23.3 19.3 4.8 11.2 20.0 3459.1
3-6
25.72006 16.7 13.8 28.9 21.9 0.0 12.5 21.4 40115.1
24.32007 * 19.8 23.6 22.3 7.7 7.2 22.5 3029.3
1 180 165
3 206 195
1 148 154
42,0822008 2 236105 327 42 107 345209
42,4482006 6 204189 383 12 24 401212
NUMBER TESTED IN GRADES 3-6
42,3242007 2 20891 283 13 69 302162
Shaded cells indicate percentages at or above 30 percent, the Gold Performance Acknowledgment Standard for 2009.
July 31, 2008 Dallas ISD Data Analysis, Research, and Reporting Services V:\CILT\0809\CILT_0809.mdb rpt_TAKS_E_math_4_per_comm 2008-09 Campus Data Packet
RUFUS C. BURLESON (117) 18
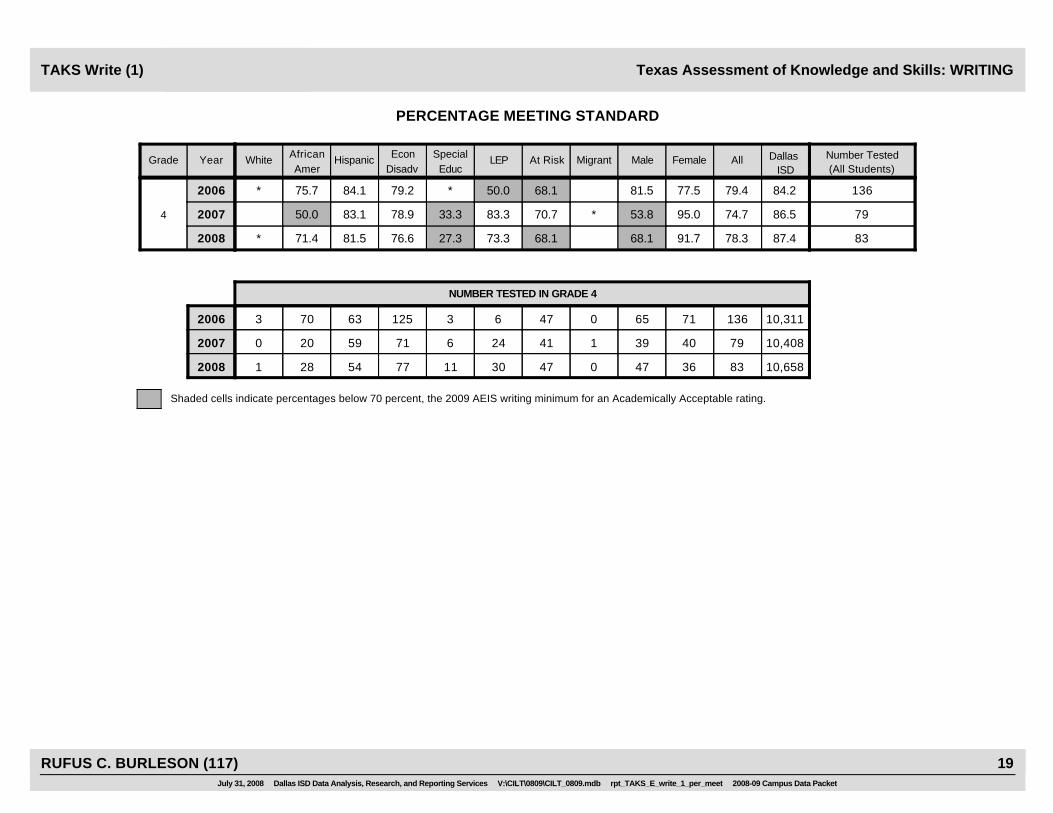
FemaleMigrant MaleAt RiskWhite AfricanAmer
Hispanic EconDisadv
SpecialEduc
LEP All Dallas ISD
YearGrade Number Tested(All Students)
Texas Assessment of Knowledge and Skills: WRITING
PERCENTAGE MEETING STANDARD
TAKS Write (1)
68.1 91.7
81.5 77.5
* 53.8 95.0
87.42008 * 71.4 81.5 76.6 27.3 73.3 78.3 8368.1
4
84.22006 * 75.7 84.1 79.2 * 50.0 79.4 13668.1
86.52007 50.0 83.1 78.9 33.3 83.3 74.7 7970.7
0 47 36
0 65 71
1 39 40
10,6582008 1 5428 77 11 30 8347
10,3112006 3 6370 125 3 6 13647
NUMBER TESTED IN GRADE 4
10,4082007 0 5920 71 6 24 7941
Shaded cells indicate percentages below 70 percent, the 2009 AEIS writing minimum for an Academically Acceptable rating.
July 31, 2008 Dallas ISD Data Analysis, Research, and Reporting Services V:\CILT\0809\CILT_0809.mdb rpt_TAKS_E_write_1_per_meet 2008-09 Campus Data Packet
RUFUS C. BURLESON (117) 19

FemaleMigrant MaleAt RiskWhite AfricanAmer
Hispanic EconDisadv
SpecialEduc
LEP All Dallas ISD
YearGrade Number Tested(All Students)
Texas Assessment of Knowledge and Skills: WRITING
NUMBER NOT MEETING STANDARD
TAKS Write (2)
15 3
12 16
* 18 2
1,3482008 * 8 10 18 8 8 18 8315
4
1,6312006 * 17 10 26 * 3 28 13615
1,4082007 10 10 15 4 4 20 7912
0 47 36
0 65 71
1 39 40
10,6582008 1 5428 77 11 30 8347
10,3112006 3 6370 125 3 6 13647
NUMBER TESTED IN GRADE 4
10,4082007 0 5920 71 6 24 7941
July 31, 2008 Dallas ISD Data Analysis, Research, and Reporting Services V:\CILT\0809\CILT_0809.mdb rpt_TAKS_E_write_2_num_not_meet 2008-09 Campus Data Packet
RUFUS C. BURLESON (117) 20
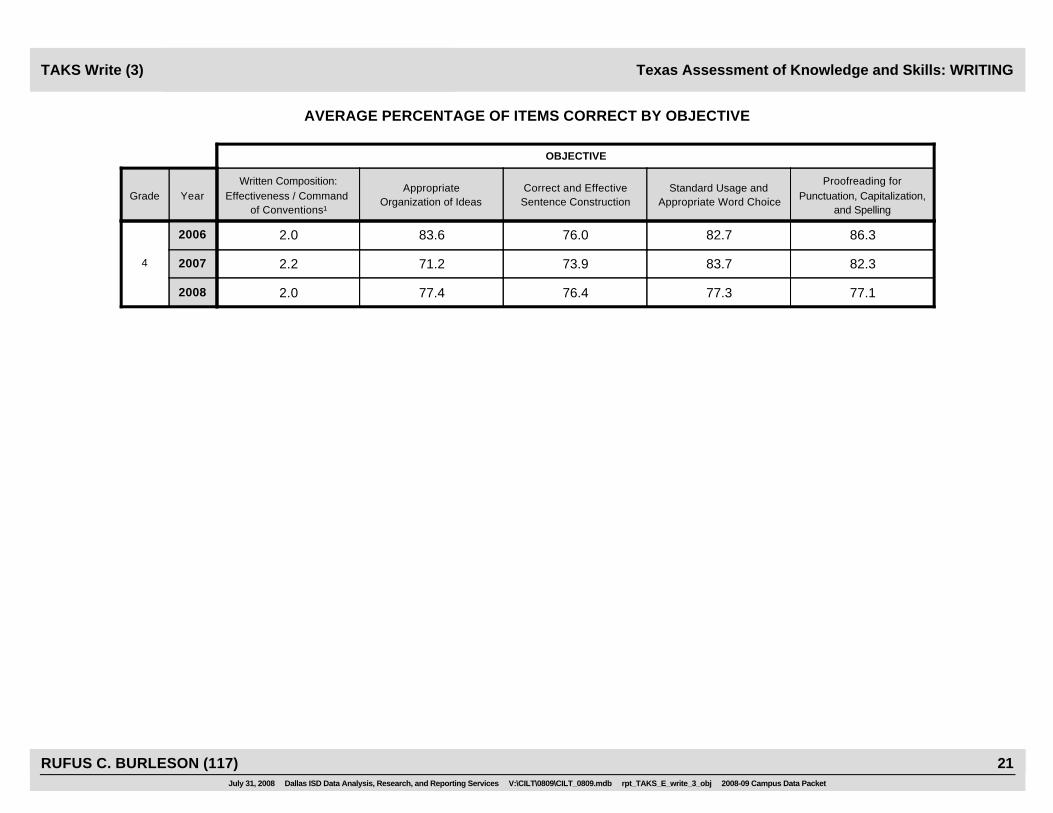
Written Composition:Effectiveness / Command
of Conventions¹
AppropriateOrganization of Ideas
Correct and EffectiveSentence Construction
Standard Usage andAppropriate Word Choice
Proofreading forPunctuation, Capitalization,
and SpellingYearGrade
OBJECTIVE
Texas Assessment of Knowledge and Skills: WRITING
AVERAGE PERCENTAGE OF ITEMS CORRECT BY OBJECTIVE
TAKS Write (3)
2008 2.0 77.4 76.4 77.3 77.1
2006 2.0 83.6 76.0 82.7 86.3
4 2007 2.2 71.2 73.9 83.7 82.3
July 31, 2008 Dallas ISD Data Analysis, Research, and Reporting Services V:\CILT\0809\CILT_0809.mdb rpt_TAKS_E_write_3_obj 2008-09 Campus Data Packet
RUFUS C. BURLESON (117) 21
FemaleMigrant MaleAt RiskWhite AfricanAmer
Hispanic EconDisadv
SpecialEduc
LEP All Dallas ISD
YearGrade Number Tested(All Students)
Texas Assessment of Knowledge and Skills: WRITING
PERCENTAGE DEMONSTRATING COMMENDED PERFORMANCE
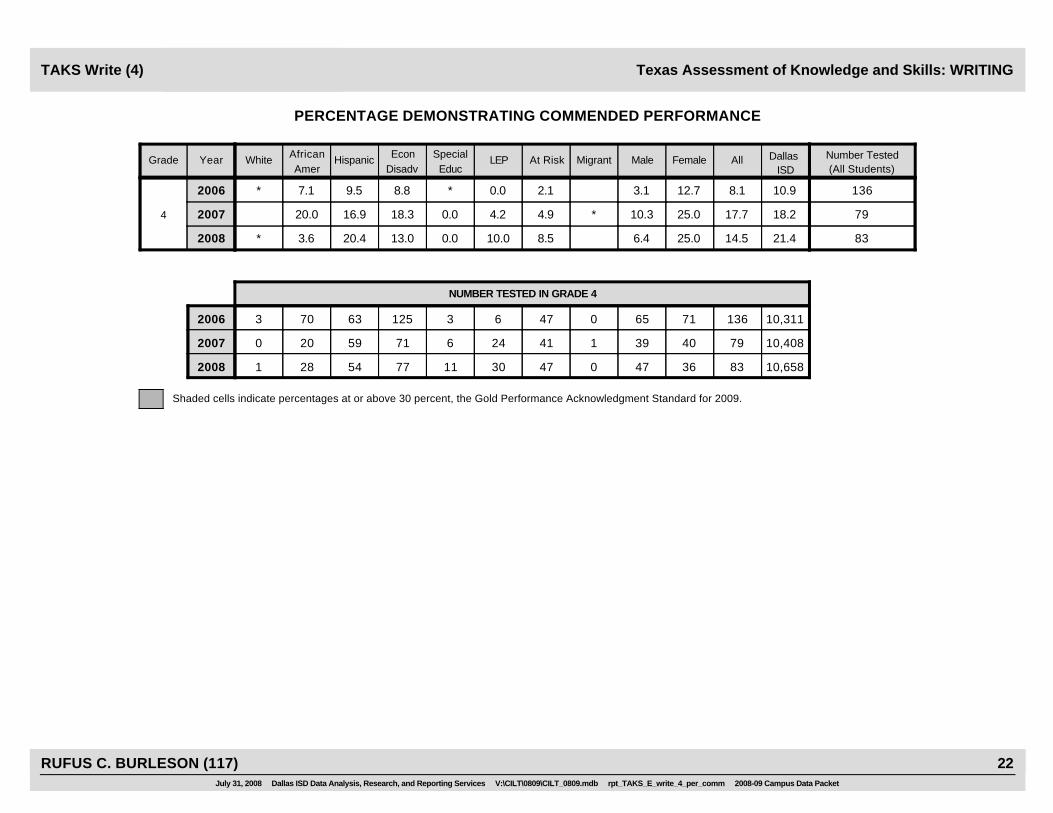
TAKS Write (4)
6.4 25.0
3.1 12.7
* 10.3 25.0
21.42008 * 3.6 20.4 13.0 0.0 10.0 14.5 838.5
4
10.92006 * 7.1 9.5 8.8 * 0.0 8.1 1362.1
18.22007 20.0 16.9 18.3 0.0 4.2 17.7 794.9
0 47 36
0 65 71
1 39 40
10,6582008 1 5428 77 11 30 8347
10,3112006 3 6370 125 3 6 13647
NUMBER TESTED IN GRADE 4
10,4082007 0 5920 71 6 24 7941
Shaded cells indicate percentages at or above 30 percent, the Gold Performance Acknowledgment Standard for 2009.
July 31, 2008 Dallas ISD Data Analysis, Research, and Reporting Services V:\CILT\0809\CILT_0809.mdb rpt_TAKS_E_write_4_per_comm 2008-09 Campus Data Packet
RUFUS C. BURLESON (117) 22
FemaleMigrant MaleAt RiskWhite AfricanAmer
Hispanic EconDisadv
SpecialEduc
LEP All Dallas ISD
YearGrade Number Tested(All Students)
Texas Assessment of Knowledge and Skills: SCIENCE
PERCENTAGE MEETING STANDARD
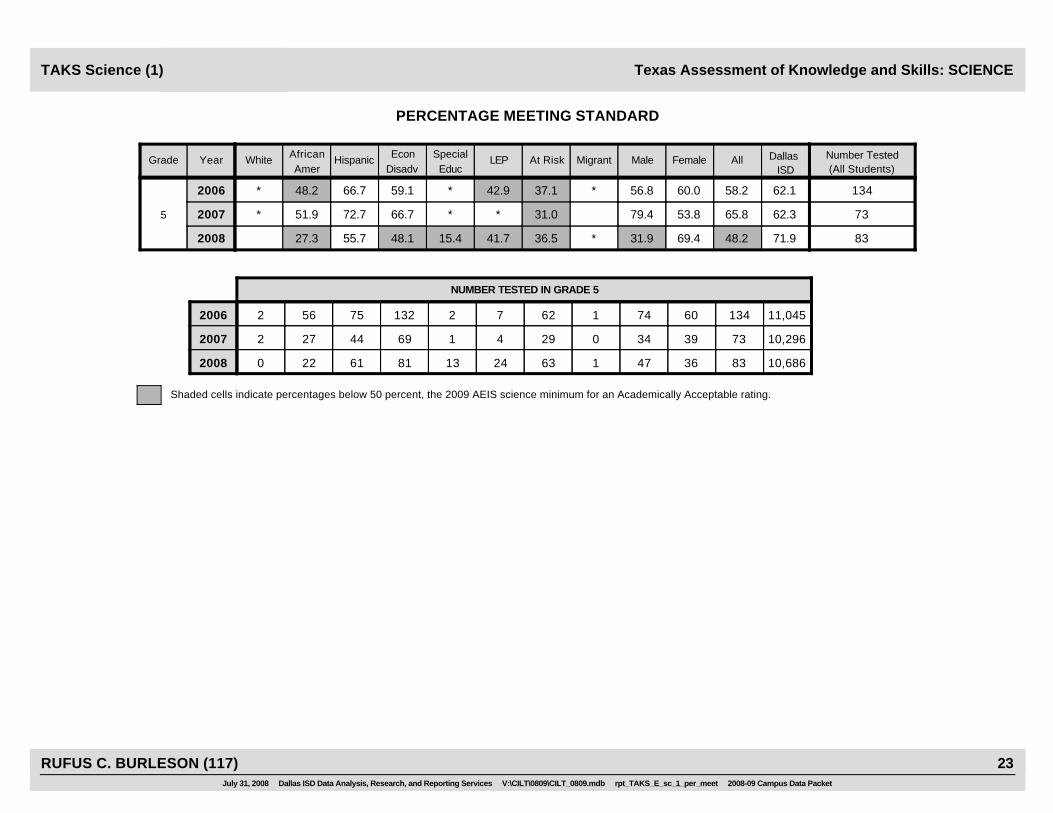
TAKS Science (1)
* 31.9 69.4
* 56.8 60.0
79.4 53.8
71.92008 27.3 55.7 48.1 15.4 41.7 48.2 8336.5
5
62.12006 * 48.2 66.7 59.1 * 42.9 58.2 13437.1
62.32007 * 51.9 72.7 66.7 * * 65.8 7331.0
1 47 36
1 74 60
0 34 39
10,6862008 0 6122 81 13 24 8363
11,0452006 2 7556 132 2 7 13462
NUMBER TESTED IN GRADE 5
10,2962007 2 4427 69 1 4 7329
Shaded cells indicate percentages below 50 percent, the 2009 AEIS science minimum for an Academically Acceptable rating.
July 31, 2008 Dallas ISD Data Analysis, Research, and Reporting Services V:\CILT\0809\CILT_0809.mdb rpt_TAKS_E_sc_1_per_meet 2008-09 Campus Data Packet
RUFUS C. BURLESON (117) 23
FemaleMigrant MaleAt RiskWhite AfricanAmer
Hispanic EconDisadv
SpecialEduc
LEP All Dallas ISD
YearGrade Number Tested(All Students)
Texas Assessment of Knowledge and Skills: SCIENCE
NUMBER NOT MEETING STANDARD
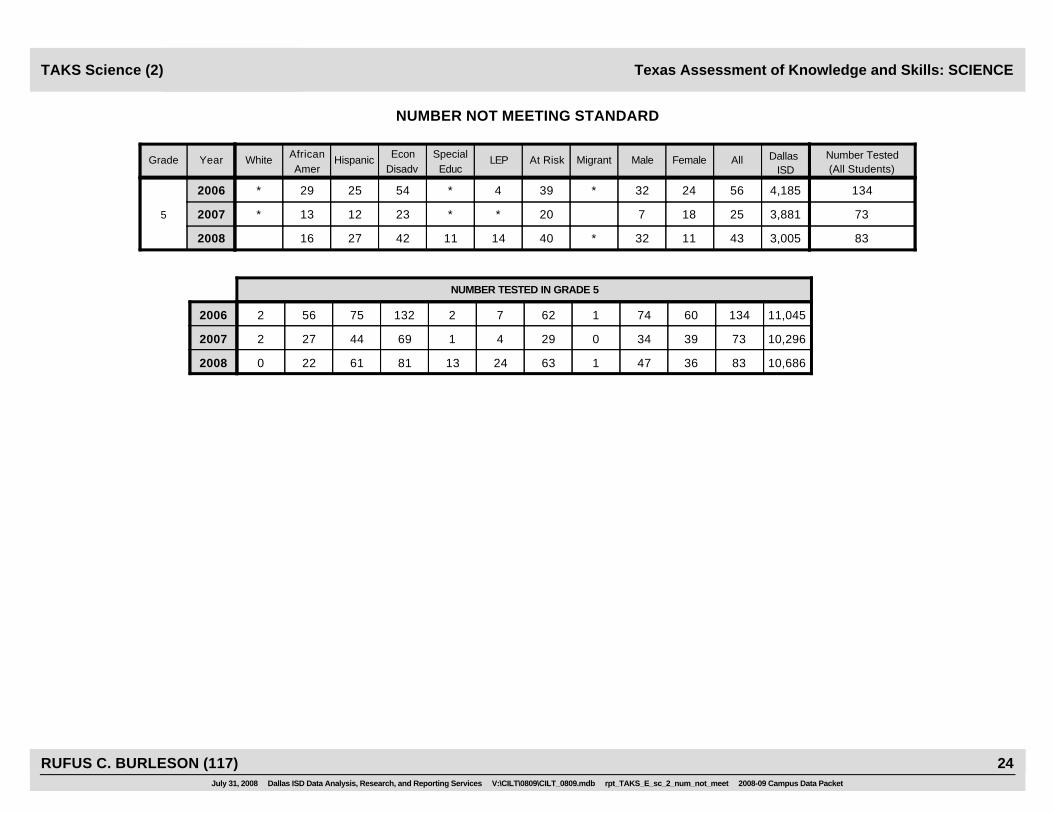
TAKS Science (2)
* 32 11
* 32 24
7 18
3,0052008 16 27 42 11 14 43 8340
5
4,1852006 * 29 25 54 * 4 56 13439
3,8812007 * 13 12 23 * * 25 7320
1 47 36
1 74 60
0 34 39
10,6862008 0 6122 81 13 24 8363
11,0452006 2 7556 132 2 7 13462
NUMBER TESTED IN GRADE 5
10,2962007 2 4427 69 1 4 7329
July 31, 2008 Dallas ISD Data Analysis, Research, and Reporting Services V:\CILT\0809\CILT_0809.mdb rpt_TAKS_E_sc_2_num_not_meet 2008-09 Campus Data Packet
RUFUS C. BURLESON (117) 24
Nature of Science Life Sciences Physical Sciences Earth SciencesYearGrade
OBJECTIVE
Texas Assessment of Knowledge and Skills: SCIENCE
AVERAGE PERCENTAGE OF ITEMS CORRECT BY OBJECTIVE
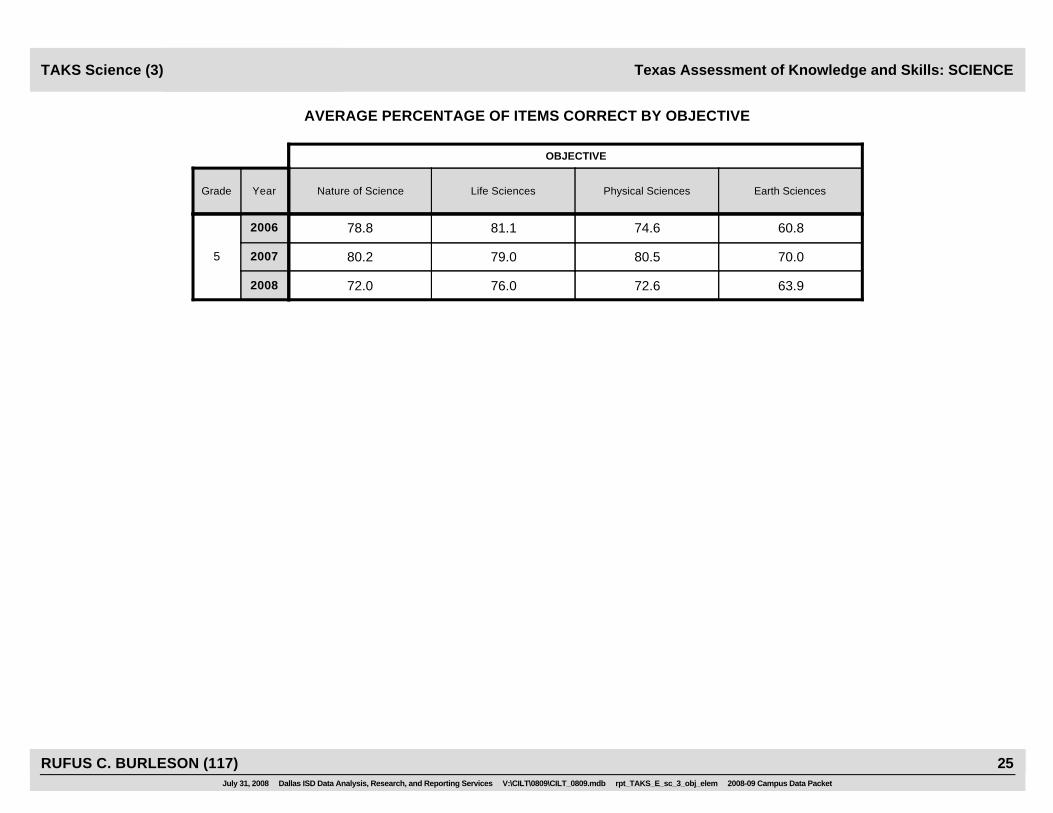
TAKS Science (3)
2008 72.0 76.0 72.6 63.9
2006 78.8 81.1 74.6 60.8
5 2007 80.2 79.0 80.5 70.0
July 31, 2008 Dallas ISD Data Analysis, Research, and Reporting Services V:\CILT\0809\CILT_0809.mdb rpt_TAKS_E_sc_3_obj_elem 2008-09 Campus Data Packet
RUFUS C. BURLESON (117) 25
FemaleMigrant MaleAt RiskWhite AfricanAmer
Hispanic EconDisadv
SpecialEduc
LEP All Dallas ISD
YearGrade Number Tested(All Students)
Texas Assessment of Knowledge and Skills: SCIENCE
PERCENTAGE DEMONSTRATING COMMENDED PERFORMANCE
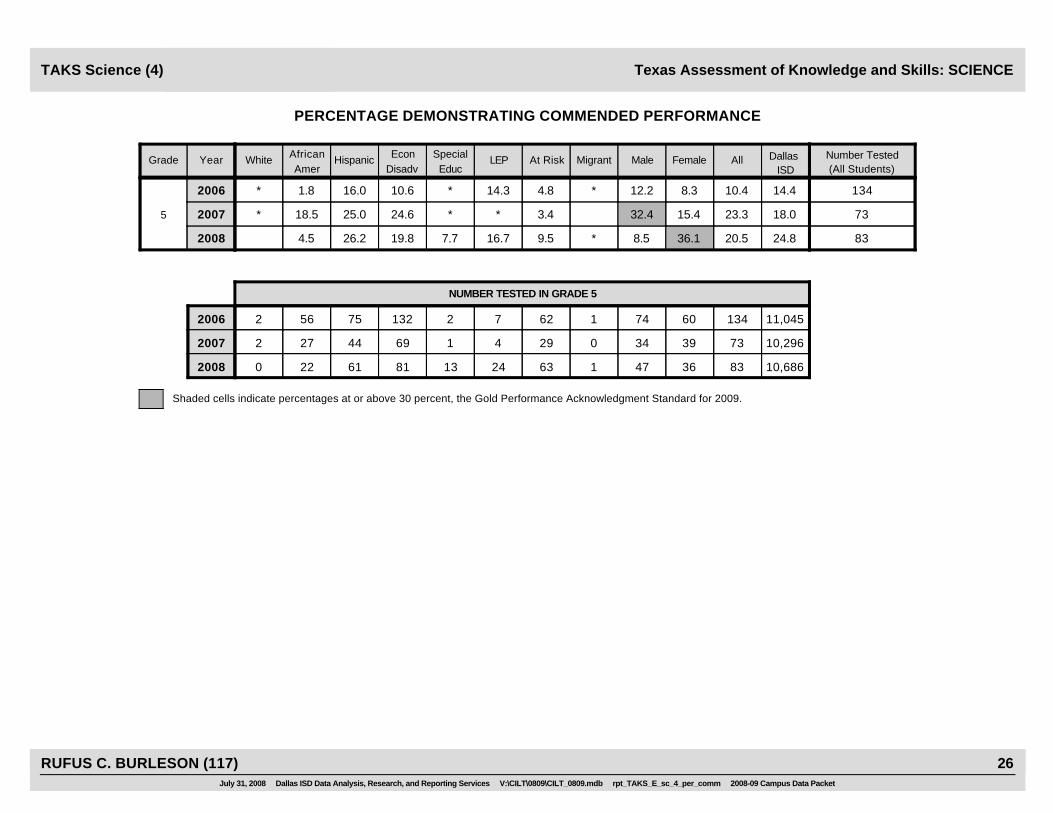
TAKS Science (4)
* 8.5 36.1
* 12.2 8.3
32.4 15.4
24.82008 4.5 26.2 19.8 7.7 16.7 20.5 839.5
5
14.42006 * 1.8 16.0 10.6 * 14.3 10.4 1344.8
18.02007 * 18.5 25.0 24.6 * * 23.3 733.4
1 47 36
1 74 60
0 34 39
10,6862008 0 6122 81 13 24 8363
11,0452006 2 7556 132 2 7 13462
NUMBER TESTED IN GRADE 5
10,2962007 2 4427 69 1 4 7329
Shaded cells indicate percentages at or above 30 percent, the Gold Performance Acknowledgment Standard for 2009.
July 31, 2008 Dallas ISD Data Analysis, Research, and Reporting Services V:\CILT\0809\CILT_0809.mdb rpt_TAKS_E_sc_4_per_comm 2008-09 Campus Data Packet
RUFUS C. BURLESON (117) 26
FemaleMigrant MaleAt RiskWhite AfricanAmer
Hispanic EconDisadv
SpecialEduc
LEP All Dallas ISD
YearGrade Number Tested(All Students)
Spanish Texas Assessment of Knowledge and Skills: READING
PERCENTAGE MEETING STANDARD
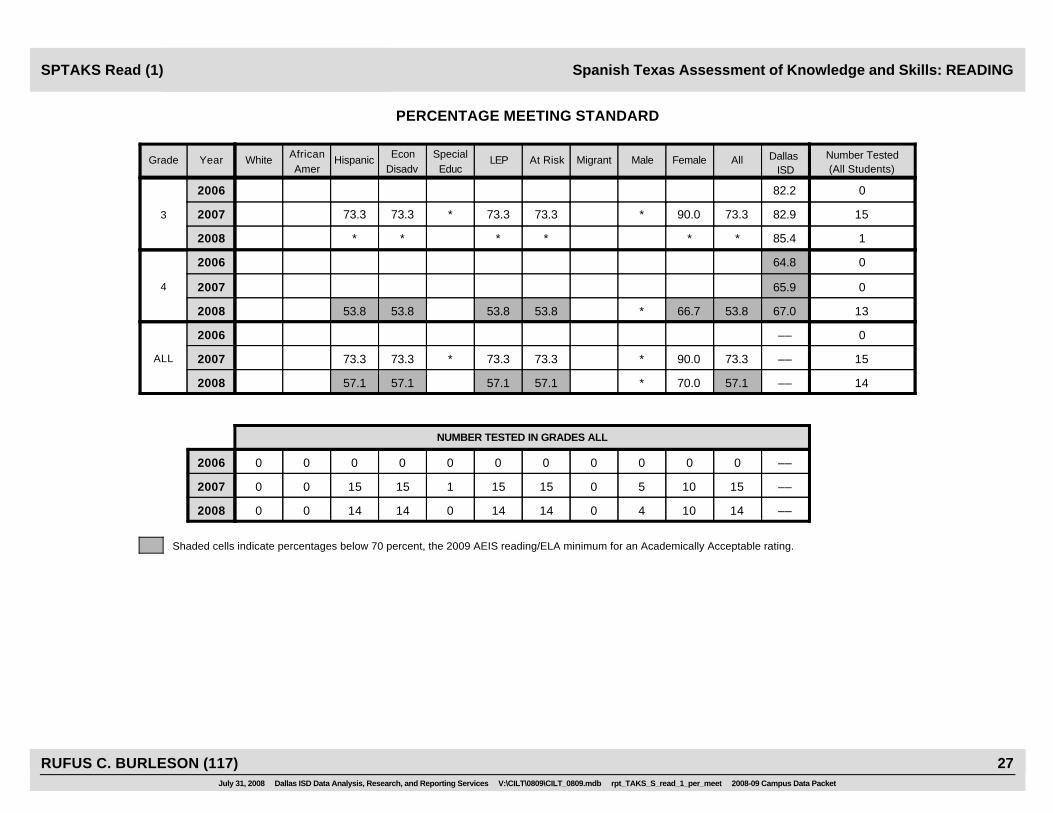
SPTAKS Read (1)
*
* 90.0
85.42008 * * * * 1*
3
82.22006 0
82.92007 73.3 73.3 * 73.3 73.3 1573.3
* 66.7 67.02008 53.8 53.8 53.8 53.8 1353.8
4
64.82006 0
65.92007 0
* 70.0
* 90.0
––2008 57.1 57.1 57.1 57.1 1457.1
ALL
––2006 0
––2007 73.3 73.3 * 73.3 73.3 1573.3
0 4 10
0 0 0
0 5 10
––2008 0 140 14 0 14 1414
––2006 0 00 0 0 0 00
NUMBER TESTED IN GRADES ALL
––2007 0 150 15 1 15 1515
Shaded cells indicate percentages below 70 percent, the 2009 AEIS reading/ELA minimum for an Academically Acceptable rating.
July 31, 2008 Dallas ISD Data Analysis, Research, and Reporting Services V:\CILT\0809\CILT_0809.mdb rpt_TAKS_S_read_1_per_meet 2008-09 Campus Data Packet
RUFUS C. BURLESON (117) 27
FemaleMigrant MaleAt RiskWhite AfricanAmer
Hispanic EconDisadv
SpecialEduc
LEP All Dallas ISD
YearGrade Number Tested(All Students)
Spanish Texas Assessment of Knowledge and Skills: READING
NUMBER NOT MEETING STANDARD
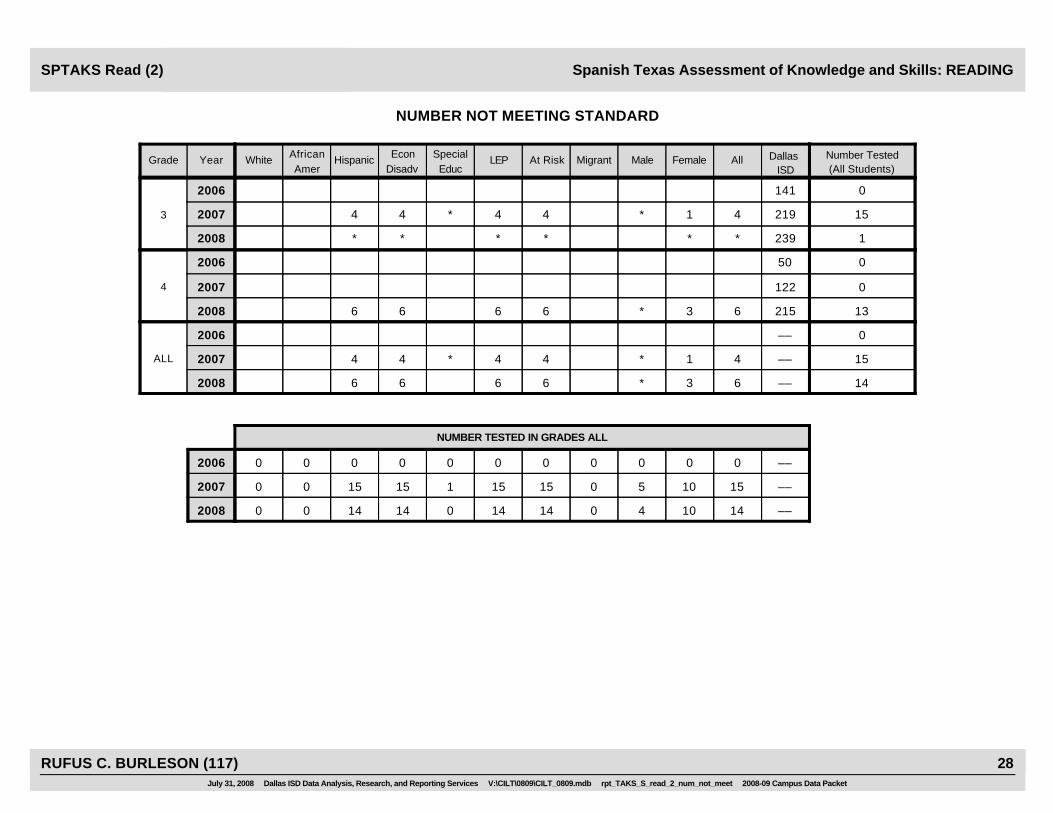
SPTAKS Read (2)
*
* 1
2392008 * * * * 1*
3
1412006 0
2192007 4 4 * 4 4 154
* 3 2152008 6 6 6 6 136
4
502006 0
1222007 0
* 3
* 1
––2008 6 6 6 6 146
ALL
––2006 0
––2007 4 4 * 4 4 154
0 4 10
0 0 0
0 5 10
––2008 0 140 14 0 14 1414
––2006 0 00 0 0 0 00
NUMBER TESTED IN GRADES ALL
––2007 0 150 15 1 15 1515
July 31, 2008 Dallas ISD Data Analysis, Research, and Reporting Services V:\CILT\0809\CILT_0809.mdb rpt_TAKS_S_read_2_num_not_meet 2008-09 Campus Data Packet
RUFUS C. BURLESON (117) 28
Basic UnderstandingApplying Knowledge of
Literary ElementsUsing Strategies
to AnalyzeApplying Critical-
Thinking SkillsYearGrade
OBJECTIVE
Spanish Texas Assessment of Knowledge and Skills: READING
AVERAGE PERCENTAGE OF ITEMS CORRECT BY OBJECTIVE
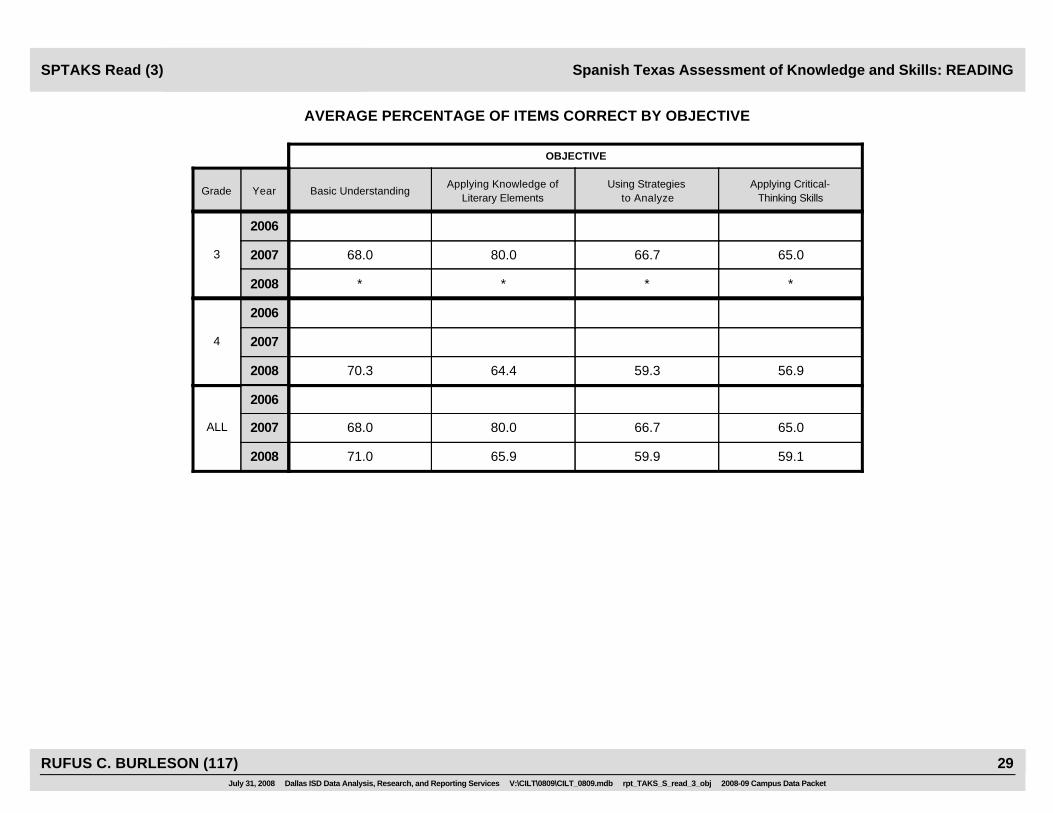
SPTAKS Read (3)
2008 * * * *
2006
20073 68.0 80.0 66.7 65.0
2008 70.3 64.4 59.3 56.9
2006
20074
2008 71.0 65.9 59.9 59.1
2006
2007ALL 68.0 80.0 66.7 65.0
July 31, 2008 Dallas ISD Data Analysis, Research, and Reporting Services V:\CILT\0809\CILT_0809.mdb rpt_TAKS_S_read_3_obj 2008-09 Campus Data Packet
RUFUS C. BURLESON (117) 29
FemaleMigrant MaleAt RiskWhite AfricanAmer
Hispanic EconDisadv
SpecialEduc
LEP All Dallas ISD
YearGrade Number Tested(All Students)
Spanish Texas Assessment of Knowledge and Skills: READING
PERCENTAGE DEMONSTRATING COMMENDED PERFORMANCE
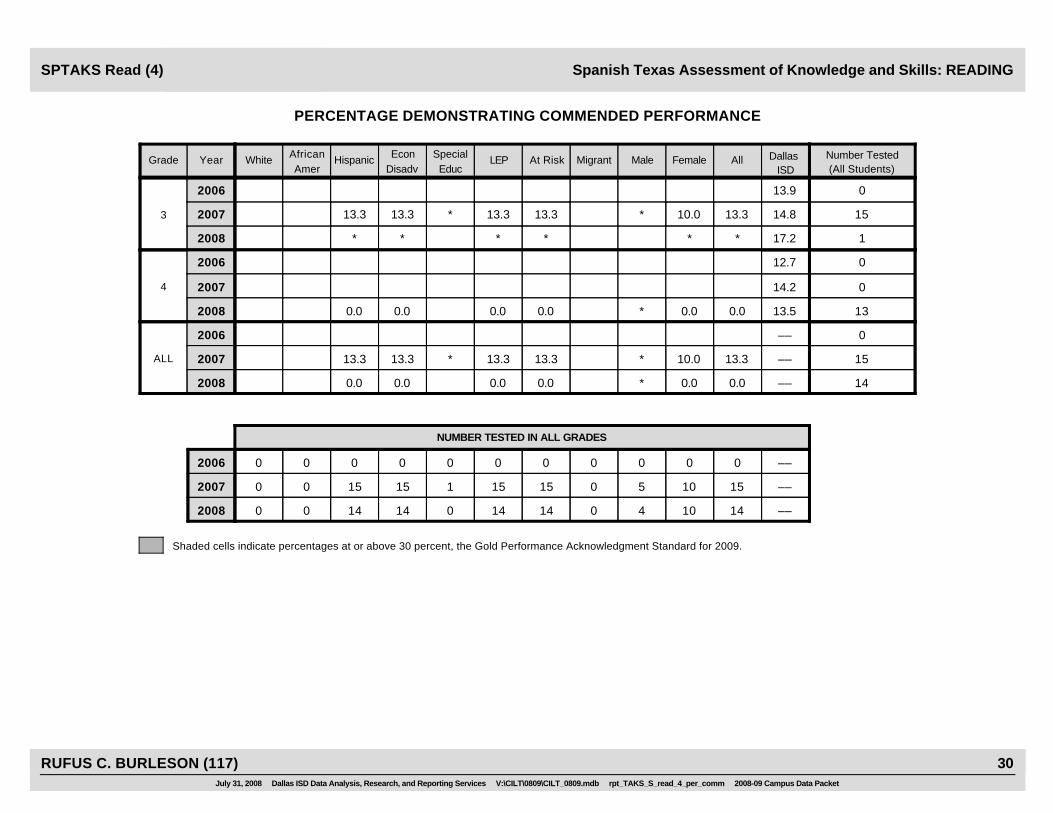
SPTAKS Read (4)
*
* 10.0
17.22008 * * * * 1*
3
13.92006 0
14.82007 13.3 13.3 * 13.3 13.3 1513.3
* 0.0 13.52008 0.0 0.0 0.0 0.0 130.0
4
12.72006 0
14.22007 0
* 0.0
* 10.0
––2008 0.0 0.0 0.0 0.0 140.0
ALL
––2006 0
––2007 13.3 13.3 * 13.3 13.3 1513.3
0 4 10
0 0 0
0 5 10
––2008 0 140 14 0 14 1414
––2006 0 00 0 0 0 00
NUMBER TESTED IN ALL GRADES
––2007 0 150 15 1 15 1515
Shaded cells indicate percentages at or above 30 percent, the Gold Performance Acknowledgment Standard for 2009.
July 31, 2008 Dallas ISD Data Analysis, Research, and Reporting Services V:\CILT\0809\CILT_0809.mdb rpt_TAKS_S_read_4_per_comm 2008-09 Campus Data Packet
RUFUS C. BURLESON (117) 30
FemaleMigrant MaleAt RiskWhite AfricanAmer
Hispanic EconDisadv
SpecialEduc
LEP All Dallas ISD
YearGrade Number Tested(All Students)
Spanish Texas Assessment of Knowledge and Skills: WRITING
PERCENTAGE MEETING STANDARD
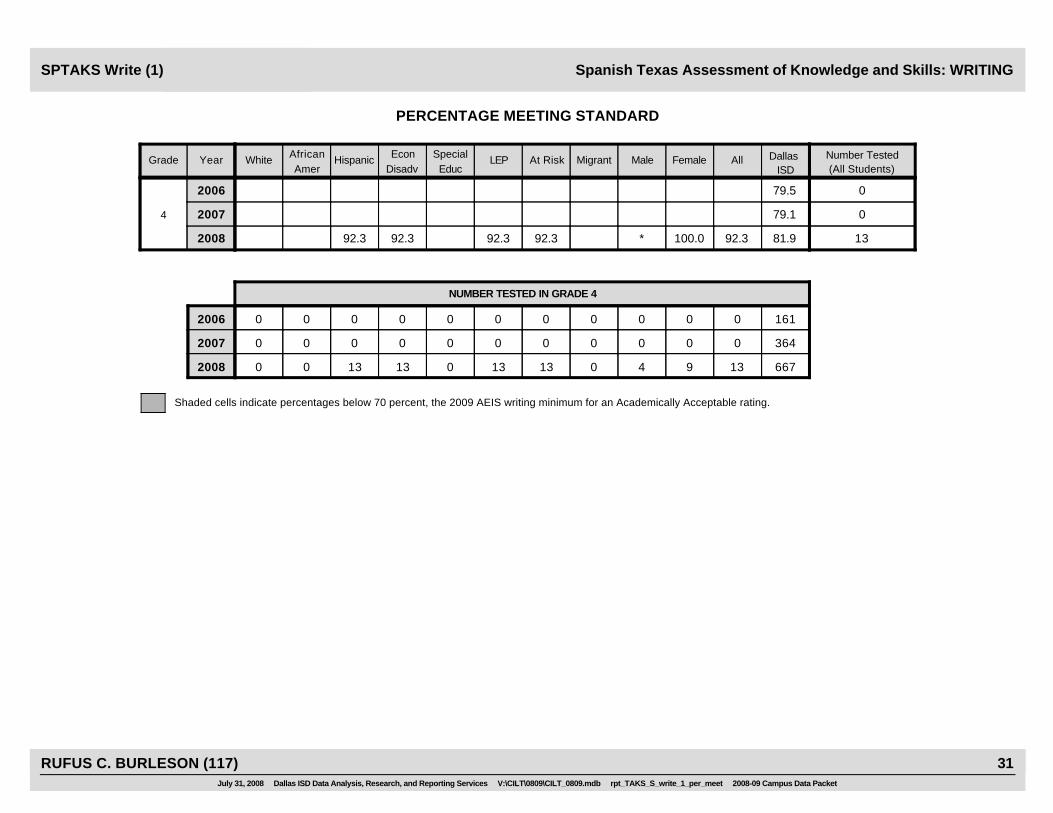
SPTAKS Write (1)
* 100.0 81.92008 92.3 92.3 92.3 92.3 1392.3
4
79.52006 0
79.12007 0
0 4 9
0 0 0
0 0 0
6672008 0 130 13 0 13 1313
1612006 0 00 0 0 0 00
NUMBER TESTED IN GRADE 4
3642007 0 00 0 0 0 00
Shaded cells indicate percentages below 70 percent, the 2009 AEIS writing minimum for an Academically Acceptable rating.
July 31, 2008 Dallas ISD Data Analysis, Research, and Reporting Services V:\CILT\0809\CILT_0809.mdb rpt_TAKS_S_write_1_per_meet 2008-09 Campus Data Packet
RUFUS C. BURLESON (117) 31
FemaleMigrant MaleAt RiskWhite AfricanAmer
Hispanic EconDisadv
SpecEduc
LEP All Dallas ISD
YearGrade Number Tested(All Students)
Spanish Texas Assessment of Knowledge and Skills: WRITING
NUMBER NOT MEETING STANDARD
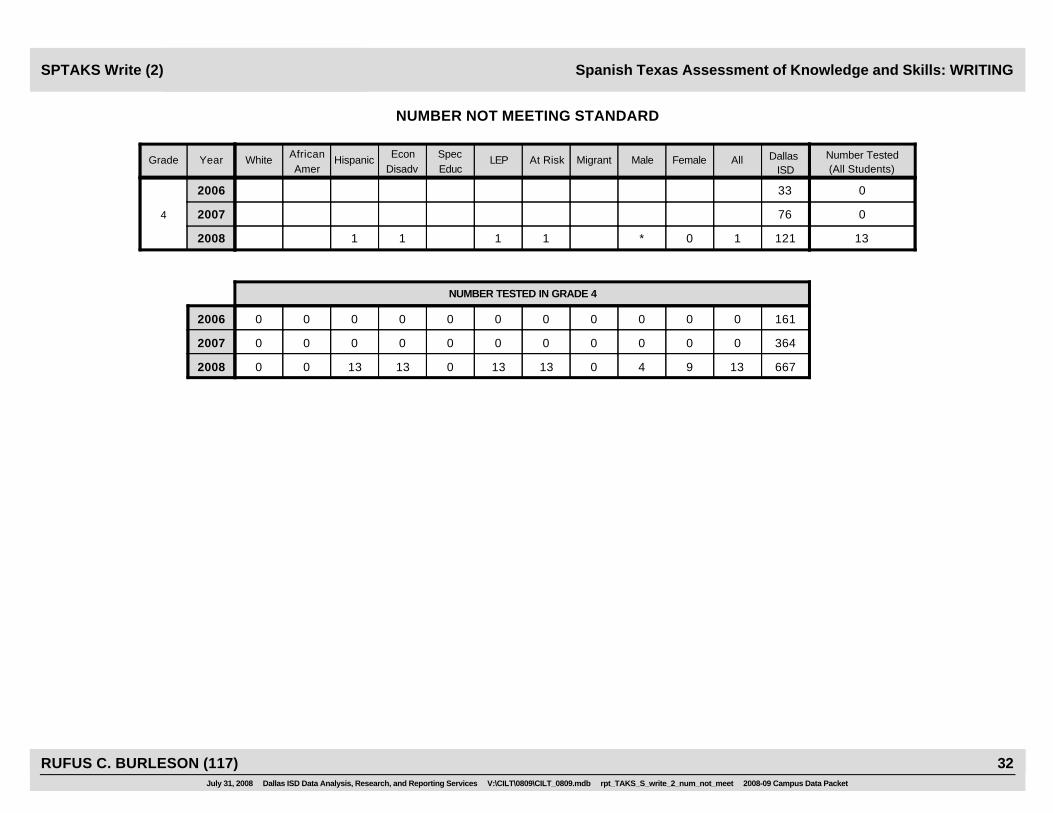
SPTAKS Write (2)
* 0 1212008 1 1 1 1 131
4
332006 0
762007 0
0 4 9
0 0 0
0 0 0
6672008 0 130 13 0 13 1313
1612006 0 00 0 0 0 00
NUMBER TESTED IN GRADE 4
3642007 0 00 0 0 0 00
July 31, 2008 Dallas ISD Data Analysis, Research, and Reporting Services V:\CILT\0809\CILT_0809.mdb rpt_TAKS_S_write_2_num_not_meet 2008-09 Campus Data Packet
RUFUS C. BURLESON (117) 32
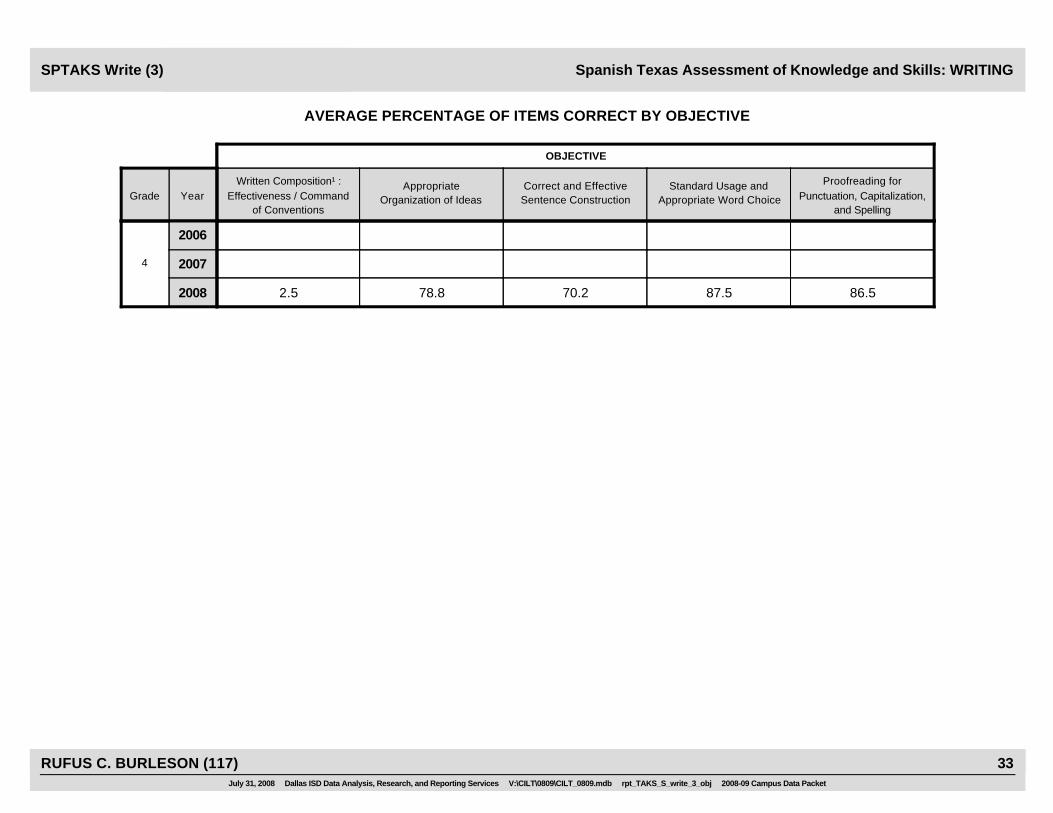
Written Composition¹ :Effectiveness / Command
of Conventions
AppropriateOrganization of Ideas
Correct and EffectiveSentence Construction
Standard Usage andAppropriate Word Choice
Proofreading forPunctuation, Capitalization,
and SpellingYearGrade
OBJECTIVE
Spanish Texas Assessment of Knowledge and Skills: WRITING
AVERAGE PERCENTAGE OF ITEMS CORRECT BY OBJECTIVE
SPTAKS Write (3)
2008 2.5 78.8 70.2 87.5 86.5
2006
4 2007
July 31, 2008 Dallas ISD Data Analysis, Research, and Reporting Services V:\CILT\0809\CILT_0809.mdb rpt_TAKS_S_write_3_obj 2008-09 Campus Data Packet
RUFUS C. BURLESON (117) 33
FemaleMigrant MaleAt RiskWhite AfricanAmer
Hispanic EconDisadv
SpecialEduc
LEP All Dallas ISD
YearGrade Number Tested(All Students)
Spanish Texas Assessment of Knowledge and Skills: WRITING
PERCENTAGE DEMONSTRATING COMMENDED PERFORMANCE
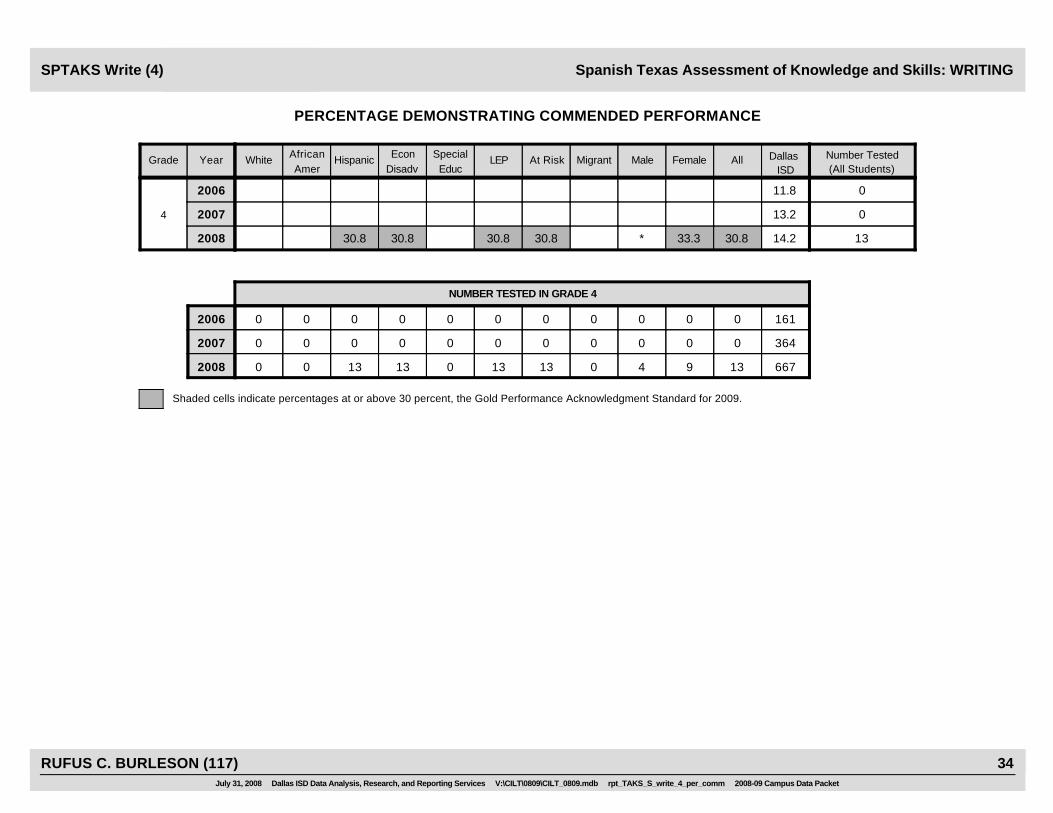
SPTAKS Write (4)
* 33.3 14.22008 30.8 30.8 30.8 30.8 1330.8
4
11.82006 0
13.22007 0
0 4 9
0 0 0
0 0 0
6672008 0 130 13 0 13 1313
1612006 0 00 0 0 0 00
NUMBER TESTED IN GRADE 4
3642007 0 00 0 0 0 00
Shaded cells indicate percentages at or above 30 percent, the Gold Performance Acknowledgment Standard for 2009.
July 31, 2008 Dallas ISD Data Analysis, Research, and Reporting Services V:\CILT\0809\CILT_0809.mdb rpt_TAKS_S_write_4_per_comm 2008-09 Campus Data Packet
RUFUS C. BURLESON (117) 34
Number Tested(All Students)
Number Tested(All Students)
Dallas ISD
MATHEMATICS TOTALREADING TOTAL (**LANGUAGE TOTAL)
At Risk Not At Risk All Dallas ISDYearGrade At Risk Not At Risk All
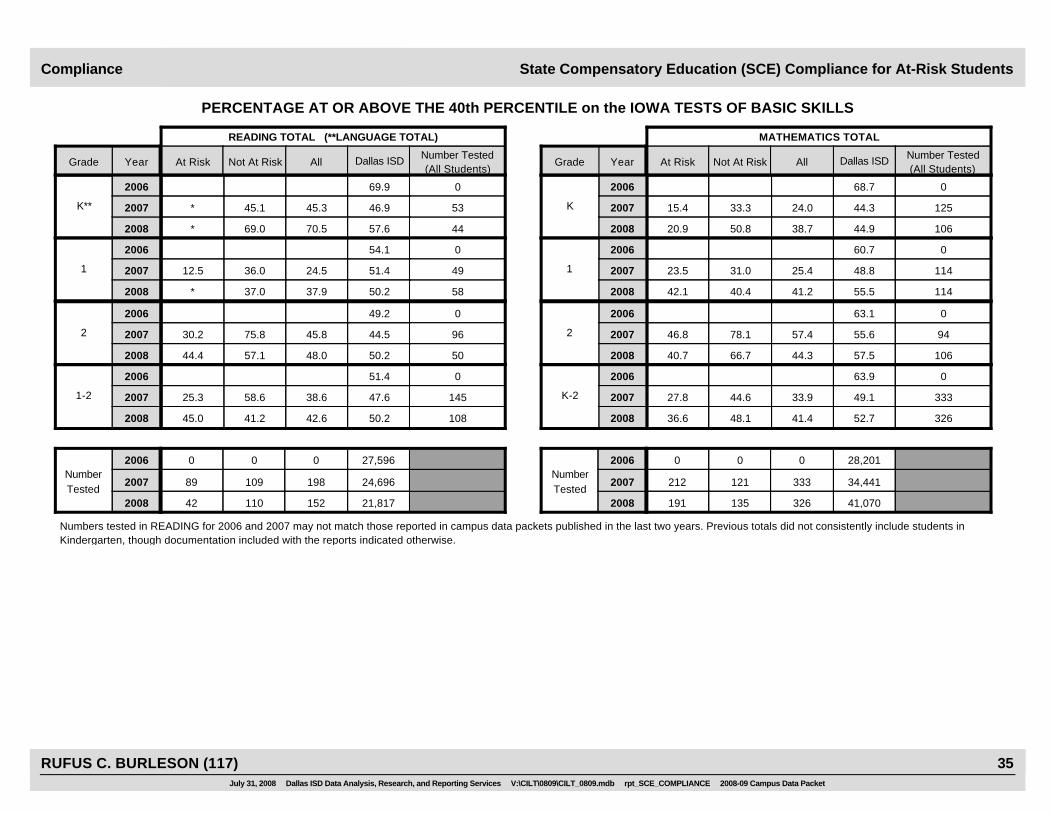
State Compensatory Education (SCE) Compliance for At-Risk StudentsCompliance
PERCENTAGE AT OR ABOVE THE 40th PERCENTILE on the IOWA TESTS OF BASIC SKILLS
YearGrade
2006
K**
44.9 10657.62008 * 69.0 70.5 44 20.9 50.8 38.7
68.7
44.3
0
125
69.9 0
46.92007 * 45.1 45.3 53 15.4 33.3 24.0
2006
K
2008
2007
2006
1
55.5 11450.22008 * 37.0 37.9 58 42.1 40.4 41.2
60.7
48.8
0
114
54.1 0
51.42007 12.5 36.0 24.5 49 23.5 31.0 25.4
2006
1
2008
2007
2006
2
57.5 10650.22008 44.4 57.1 48.0 50 40.7 66.7 44.3
63.1
55.6
0
94
49.2 0
44.52007 30.2 75.8 45.8 96 46.8 78.1 57.4
2006
2
2008
2007
2006
1-2
52.7 32650.22008 45.0 41.2 42.6 108 36.6 48.1 41.4
63.9
49.1
0
333
51.4 0
47.62007 25.3 58.6 38.6 145 27.8 44.6 33.9
2006
K-2
2008
2007
21,8172008 42 110 152 41,070191 135 326
27,5962006 0 0 0
24,6962007 89 109 198
28,2010 0 0
34,441212 121 333NumberTested
2008
2006
2007NumberTested
filler
Numbers tested in READING for 2006 and 2007 may not match those reported in campus data packets published in the last two years. Previous totals did not consistently include students in Kindergarten, though documentation included with the reports indicated otherwise.
July 31, 2008 Dallas ISD Data Analysis, Research, and Reporting Services V:\CILT\0809\CILT_0809.mdb rpt_SCE_COMPLIANCE 2008-09 Campus Data Packet
RUFUS C. BURLESON (117) 35
FemaleMigrant MaleAt RiskWhite AfricanAmer
Hispanic EconDisadv
SpecialEduc
LEP All Dallas ISD
YearGrade Number Tested(All Students)
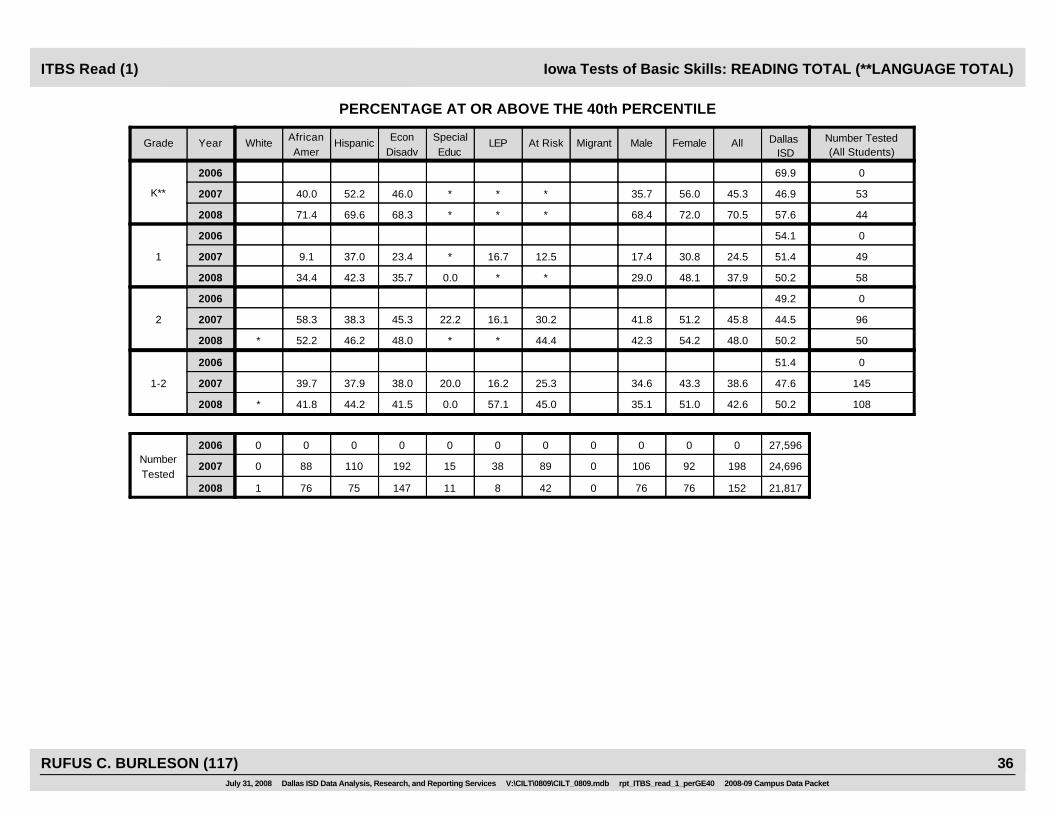
Iowa Tests of Basic Skills: READING TOTAL (**LANGUAGE TOTAL)ITBS Read (1)
PERCENTAGE AT OR ABOVE THE 40th PERCENTILE
68.4 72.0
35.7 56.0
57.62008 71.4 69.6 68.3 * * 70.5 44*
K**
69.92006 0
46.92007 40.0 52.2 46.0 * * 45.3 53*
29.0 48.1
17.4 30.8
50.22008 34.4 42.3 35.7 0.0 * 37.9 58*
1
54.12006 0
51.42007 9.1 37.0 23.4 * 16.7 24.5 4912.5
42.3 54.2
41.8 51.2
50.22008 * 52.2 46.2 48.0 * * 48.0 5044.4
2
49.22006 0
44.52007 58.3 38.3 45.3 22.2 16.1 45.8 9630.2
35.1 51.0
34.6 43.3
50.22008 * 41.8 44.2 41.5 0.0 57.1 42.6 10845.0
1-2
51.42006 0
47.62007 39.7 37.9 38.0 20.0 16.2 38.6 14525.3
0 76 76
0 0 0
0 106 92
21,8172008 1 7576 147 11 8 15242
27,5962006 0 00 0 0 0 00NumberTested
24,6962007 0 11088 192 15 38 19889
filler
July 31, 2008 Dallas ISD Data Analysis, Research, and Reporting Services V:\CILT\0809\CILT_0809.mdb rpt_ITBS_read_1_perGE40 2008-09 Campus Data Packet
RUFUS C. BURLESON (117) 36
FemaleMigrant MaleAt RiskWhite AfricanAmer
Hispanic EconDisadv
SpecialEduc
LEP All Dallas ISD
YearGrade Number Tested(All Students)
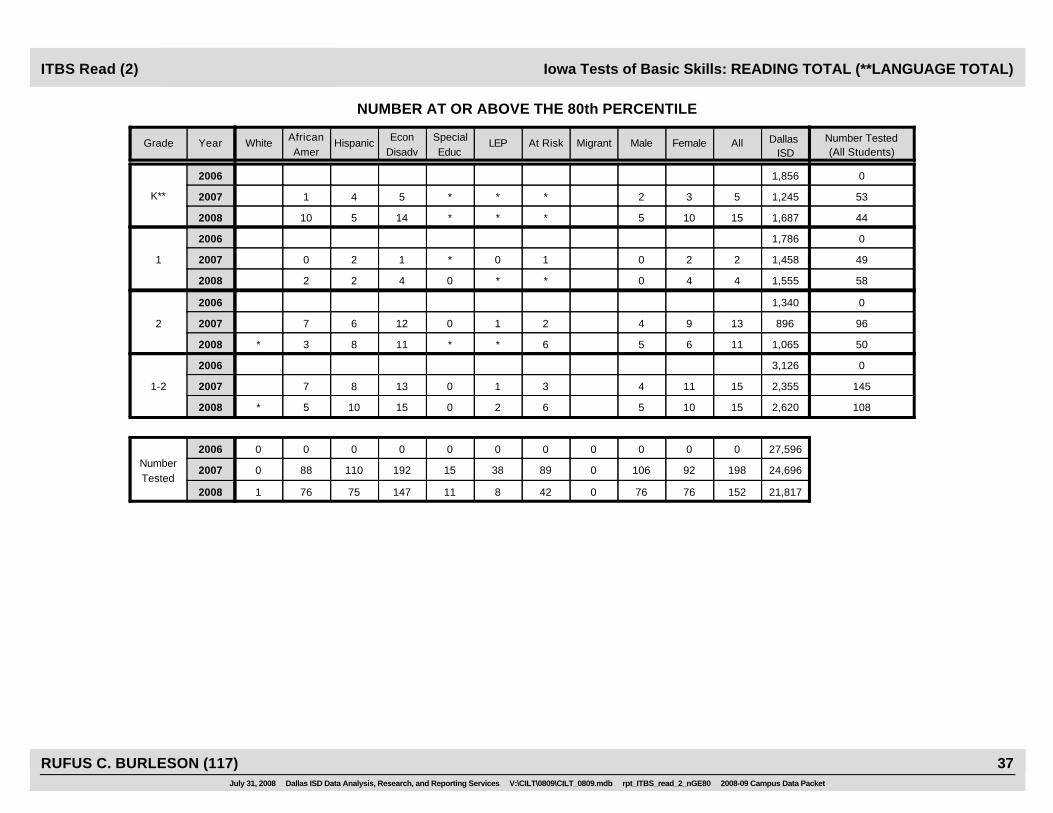
Iowa Tests of Basic Skills: READING TOTAL (**LANGUAGE TOTAL)ITBS Read (2)
NUMBER AT OR ABOVE THE 80th PERCENTILE
5 10
2 3
1,6872008 10 5 14 * * 15 44*
K**
1,8562006 0
1,2452007 1 4 5 * * 5 53*
0 4
0 2
1,5552008 2 2 4 0 * 4 58*
1
1,7862006 0
1,4582007 0 2 1 * 0 2 491
5 6
4 9
1,0652008 * 3 8 11 * * 11 506
2
1,3402006 0
8962007 7 6 12 0 1 13 962
5 10
4 11
2,6202008 * 5 10 15 0 2 15 1086
1-2
3,1262006 0
2,3552007 7 8 13 0 1 15 1453
0 76 76
0 0 0
0 106 92
21,8172008 1 7576 147 11 8 15242
27,5962006 0 00 0 0 0 00NumberTested
24,6962007 0 11088 192 15 38 19889
filler
July 31, 2008 Dallas ISD Data Analysis, Research, and Reporting Services V:\CILT\0809\CILT_0809.mdb rpt_ITBS_read_2_nGE80 2008-09 Campus Data Packet
RUFUS C. BURLESON (117) 37
FemaleMigrant MaleAt RiskWhite AfricanAmer
Hispanic EconDisadv
SpecialEduc
LEP All Dallas ISD
YearGrade Number Tested(All Students)
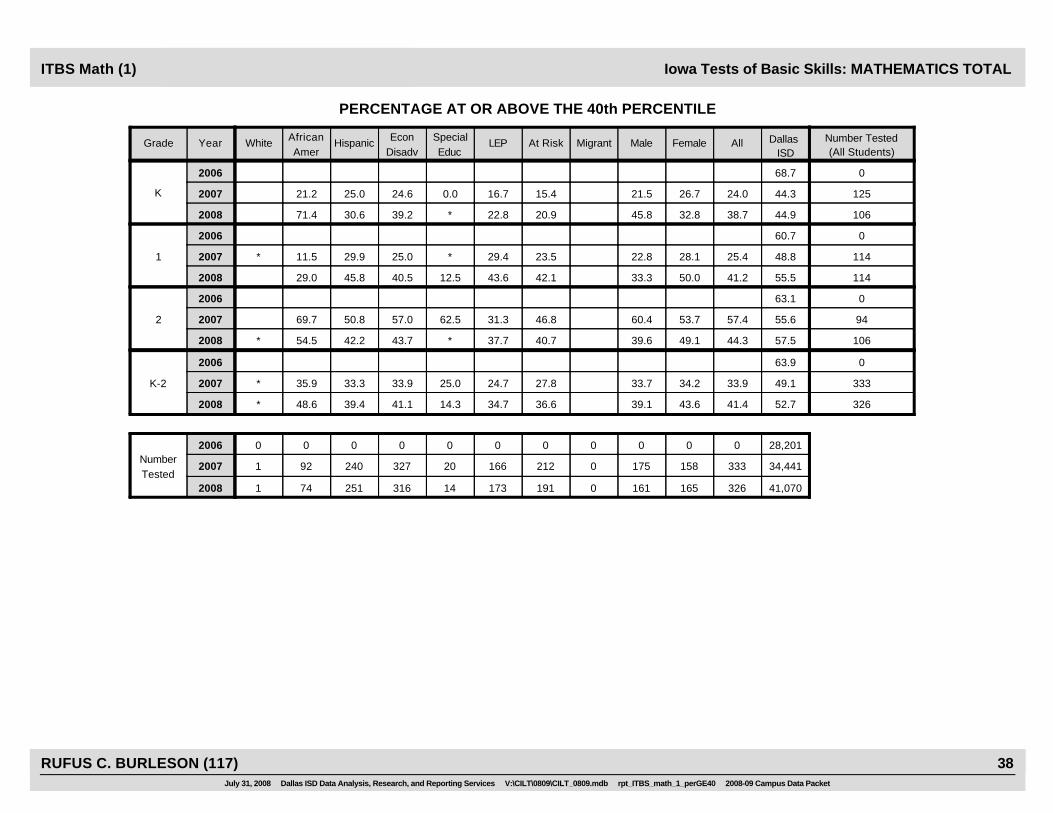
Iowa Tests of Basic Skills: MATHEMATICS TOTALITBS Math (1)
PERCENTAGE AT OR ABOVE THE 40th PERCENTILE
45.8 32.8
21.5 26.7
44.92008 71.4 30.6 39.2 * 22.8 38.7 10620.9
K
68.72006 0
44.32007 21.2 25.0 24.6 0.0 16.7 24.0 12515.4
33.3 50.0
22.8 28.1
55.52008 29.0 45.8 40.5 12.5 43.6 41.2 11442.1
1
60.72006 0
48.82007 * 11.5 29.9 25.0 * 29.4 25.4 11423.5
39.6 49.1
60.4 53.7
57.52008 * 54.5 42.2 43.7 * 37.7 44.3 10640.7
2
63.12006 0
55.62007 69.7 50.8 57.0 62.5 31.3 57.4 9446.8
39.1 43.6
33.7 34.2
52.72008 * 48.6 39.4 41.1 14.3 34.7 41.4 32636.6
K-2
63.92006 0
49.12007 * 35.9 33.3 33.9 25.0 24.7 33.9 33327.8
0 161 165
0 0 0
0 175 158
41,0702008 1 25174 316 14 173 326191
28,2012006 0 00 0 0 0 00NumberTested
34,4412007 1 24092 327 20 166 333212
filler
July 31, 2008 Dallas ISD Data Analysis, Research, and Reporting Services V:\CILT\0809\CILT_0809.mdb rpt_ITBS_math_1_perGE40 2008-09 Campus Data Packet
RUFUS C. BURLESON (117) 38
FemaleMigrant MaleAt RiskWhite AfricanAmer
Hispanic EconDisadv
SpecialEduc
LEP All Dallas ISD
YearGrade Number Tested(All Students)
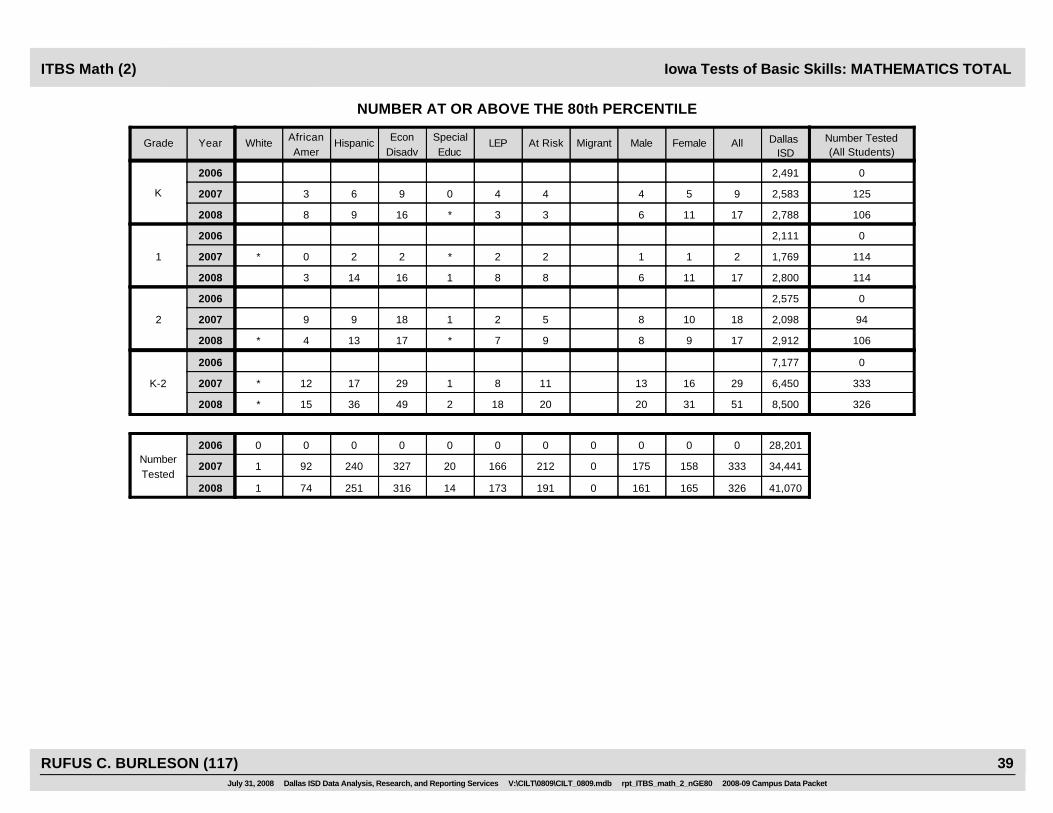
Iowa Tests of Basic Skills: MATHEMATICS TOTALITBS Math (2)
NUMBER AT OR ABOVE THE 80th PERCENTILE
6 11
4 5
2,7882008 8 9 16 * 3 17 1063
K
2,4912006 0
2,5832007 3 6 9 0 4 9 1254
6 11
1 1
2,8002008 3 14 16 1 8 17 1148
1
2,1112006 0
1,7692007 * 0 2 2 * 2 2 1142
8 9
8 10
2,9122008 * 4 13 17 * 7 17 1069
2
2,5752006 0
2,0982007 9 9 18 1 2 18 945
20 31
13 16
8,5002008 * 15 36 49 2 18 51 32620
K-2
7,1772006 0
6,4502007 * 12 17 29 1 8 29 33311
0 161 165
0 0 0
0 175 158
41,0702008 1 25174 316 14 173 326191
28,2012006 0 00 0 0 0 00NumberTested
34,4412007 1 24092 327 20 166 333212
filler
July 31, 2008 Dallas ISD Data Analysis, Research, and Reporting Services V:\CILT\0809\CILT_0809.mdb rpt_ITBS_math_2_nGE80 2008-09 Campus Data Packet
RUFUS C. BURLESON (117) 39
FemaleMigrant MaleAt RiskWhite AfricanAmer
Hispanic EconDisadv
SpecialEduc
LEP All Dallas ISD
YearGrade Number Tested(All Students)
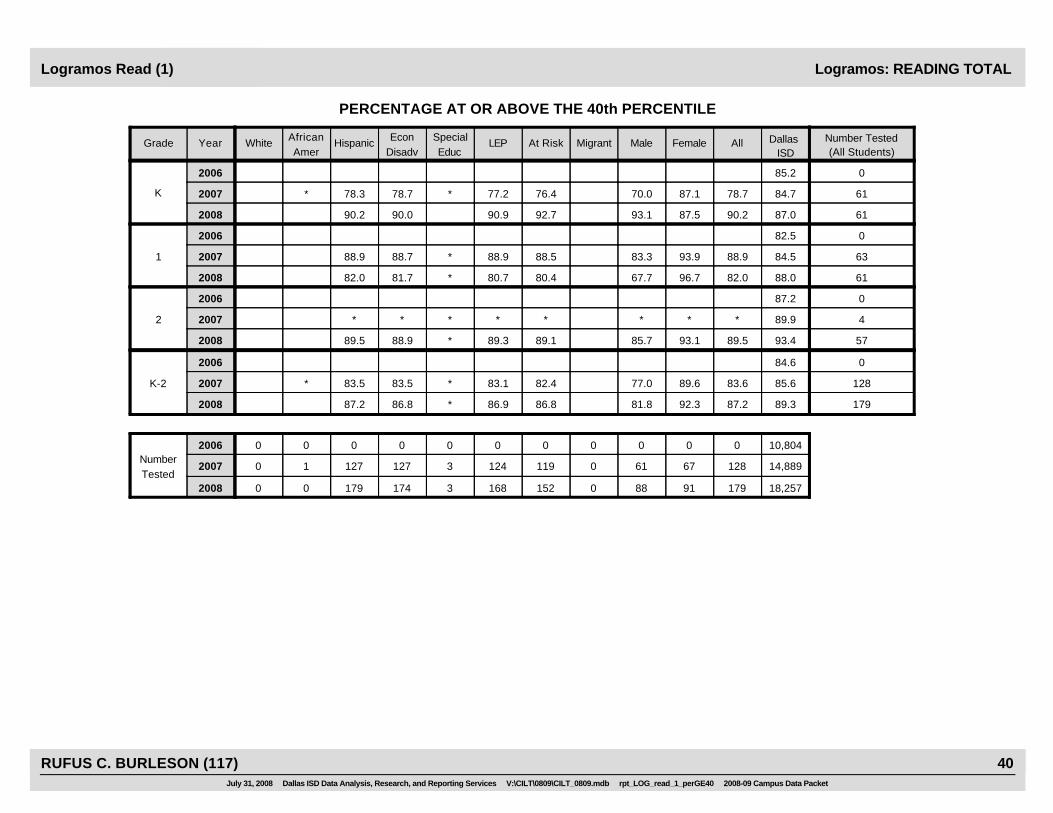
Logramos: READING TOTALLogramos Read (1)
PERCENTAGE AT OR ABOVE THE 40th PERCENTILE
93.1 87.5
70.0 87.1
87.02008 90.2 90.0 90.9 90.2 6192.7
K
85.22006 0
84.72007 * 78.3 78.7 * 77.2 78.7 6176.4
67.7 96.7
83.3 93.9
88.02008 82.0 81.7 * 80.7 82.0 6180.4
1
82.52006 0
84.52007 88.9 88.7 * 88.9 88.9 6388.5
85.7 93.1
* *
93.42008 89.5 88.9 * 89.3 89.5 5789.1
2
87.22006 0
89.92007 * * * * * 4*
81.8 92.3
77.0 89.6
89.32008 87.2 86.8 * 86.9 87.2 17986.8
K-2
84.62006 0
85.62007 * 83.5 83.5 * 83.1 83.6 12882.4
0 88 91
0 0 0
0 61 67
18,2572008 0 1790 174 3 168 179152
10,8042006 0 00 0 0 0 00NumberTested
14,8892007 0 1271 127 3 124 128119
filler
July 31, 2008 Dallas ISD Data Analysis, Research, and Reporting Services V:\CILT\0809\CILT_0809.mdb rpt_LOG_read_1_perGE40 2008-09 Campus Data Packet
RUFUS C. BURLESON (117) 40

FemaleMigrant MaleAt RiskWhite AfricanAmer
Hispanic EconDisadv
SpecialEduc
LEP All Dallas ISD
YearGrade Number Tested(All Students)
Logramos: READING TOTALLogramos Read (2)
NUMBER AT OR ABOVE THE 80th PERCENTILE
11 12
4 10
3,2802008 23 23 22 23 6116
K
2,0642006 0
2,7792007 * 13 14 * 12 14 6112
4 8
5 10
2,4122008 12 11 * 11 12 6110
1
1,3912006 0
1,7822007 15 14 * 15 15 6315
7 12
* *
2,5962008 19 18 * 19 19 5718
2
8382006 0
1,1962007 * * * * * 4*
22 32
9 21
8,2882008 54 52 * 52 54 17944
K-2
4,2932006 0
5,7572007 * 29 29 * 28 30 12828
0 88 91
0 0 0
0 61 67
18,2572008 0 1790 174 3 168 179152
10,8042006 0 00 0 0 0 00NumberTested
14,8892007 0 1271 127 3 124 128119
filler
July 31, 2008 Dallas ISD Data Analysis, Research, and Reporting Services V:\CILT\0809\CILT_0809.mdb rpt_LOG_read_2_nGE80 2008-09 Campus Data Packet
RUFUS C. BURLESON (117) 41
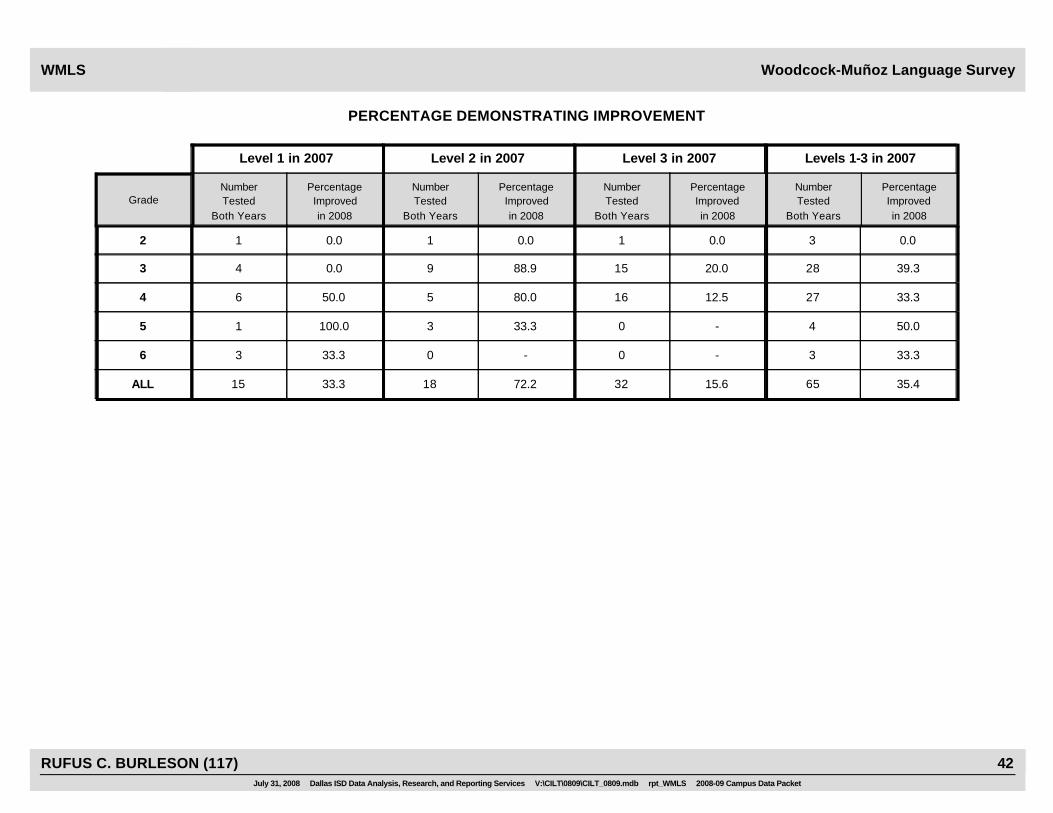
PercentageImprovedin 2008
PercentageImprovedin 2008
PercentageImprovedin 2008
PercentageImprovedin 2008
Level 1 in 2007 Level 2 in 2007 Level 3 in 2007 Levels 1-3 in 2007
NumberTested
Both Years
NumberTested
Both YearsGrade
NumberTested
Both Years
NumberTested
Both Years
Woodcock-Muñoz Language Survey
PERCENTAGE DEMONSTRATING IMPROVEMENT
WMLS
12 1 0.0 0.0 1 0.0 3 0.0
93 4 0.0 88.9 15 20.0 28 39.3
54 6 50.0 80.0 16 12.5 27 33.3
35 1 100.0 33.3 0 - 4 50.0
06 3 33.3 - 0 - 3 33.3
18ALL 15 33.3 72.2 32 15.6 65 35.4
July 31, 2008 Dallas ISD Data Analysis, Research, and Reporting Services V:\CILT\0809\CILT_0809.mdb rpt_WMLS 2008-09 Campus Data Packet
RUFUS C. BURLESON (117) 42