Embed Size (px)
Citation preview
1
Can Africa Compete with China in Manufacturing?
The Role of Relative Unit Labor Costs*
Janet Ceglowski
Bryn Mawr College
Stephen Golub
Swarthmore College
Aly Mbaye
Universite Cheikh Anta Diop, Dakar
Varun Prasad
Swarthmore College
February 2015
Abstract
In this paper examine Sub-Saharan Africa (SSA) bilateral trade and cost competitiveness
with China. We review patterns of bilateral trade between SSA and China, showing an
extraordinary imbalance in the structure of trade in that China overwhelmingly exports
manufactured products to SSA and almost exclusively imports primary products in
return. Our principal means of assessing the competitiveness of SSA’s manufacturing
sector vis-à-vis China are measures of relative unit labor costs, i.e., pairwise comparisons
of ratios of wages to productivity between SSA countries and China. We find that
African RULC levels have generally been very high relative to China, but declined over
the 2000s as China’s wages have risen faster than Chinese productivity while the reverse
is true for the SSA countries in our sample. Nevertheless RULC vis-à-vis China
remained elevated for many SSA countries as of 2010. Generally high RULC along with
weaknesses in the business climate suggest that most SSA countries are unlikely to be
competitive in labor-intensive manufacturing any time soon.
*The authors thank Haroon Bhorat for inviting this contribution and participants in the
conference on China in Africa sponsored by the University of Cape Town’s Development
Policy Research Unit for comments.

2
I. Introduction
Economic ties between China and Africa have intensified in recent years, with
bilateral trade growing considerably faster than total trade for both parties and booming
Chinese foreign direct investment (FDI) in Africa. The effects of China’s rising
involvement in African economies are controversial. On the positive side, China’s
demand for African raw materials and its investments in African infrastructure have
undoubtedly contributed to Africa’s recent improved economic growth. On the other
hand, trade with China does little to promote and may even inhibit African structural
transformation as booming exports of primary products exacerbate Africa’s dependence
on capital-intensive minerals and fuels while China’s exports of labor-intensive
manufactures create strong headwinds for Africa’s meager industrial base and formal
employment. Still, manufacturing wages in China have been rising quickly in recent
years, potentially creating new opportunities for low-cost producers. This paper attempts
to answer the questions of whether African countries can develop labor-intensive
manufacturing exports, taking advantage of rising wages in China.
In this paper we take a closer look at Africa’s competitiveness in manufacturing,
focusing on Sub-Saharan Africa’s bilateral trade and cost competitiveness with China.
Our principal means of assessing the competitiveness of Sub-Saharan Africa’s
manufacturing sector are measures of relative unit labor costs. We compare unit labor
costs in SSA manufacturing to those in China. Because China is a dominant exporter of
labor-intensive manufactures, our relative unit labor cost measures should be good
gauges of SSA’s cost competitiveness in the world market for manufactured goods. To

3
our knowledge, our estimates are the first to evaluate Sub-Saharan Africa’s
manufacturing competitiveness with respect to China by comparing their unit labor costs.
Section II reviews trends in SSA-China trade and FDI, highlighting the imbalance in
manufactured goods in China’s favor. Section III develops the concept of relative unit
labor costs (RULC) as a metric for assessing manufacturing competitiveness. RULC
encompasses differences in real wage rates, labor productivity, and exchange rates into a
single measure of international competitiveness. Section IV computes and analyzes
RULC for selected SSA countries vis-à-vis China. Section V discusses the implications
of the competitiveness analysis for expanding SSA exports of labor-intensive goods.
II. China-Africa Trade and FDI in Manufacturing
Overview. Trade and investment between China and SSA took off after the
liberalization era in China, accelerating in the 2000s (Lyons and Brown 2010,
Ademola et al 2009, Broadman 2007, Sautman and Hairong 2007, Li 2005, Zafar
2007). Figures 1 and 2 illustrate the rapid growth of this bilateral trade from
China’s and SSA’s perspectives, respectively.1 Bilateral trade has grow in faster for
both China and SSA than their trade with the rest of the world, although it still
remains quite small as a share of each economy’s total trade. For China, trade with
SSA has expanded from less than 1 percent of both exports and imports in the early
1990s to 3.2 percent of exports and 5.6 percent of imports in 2012. For SSA, trade
with China has expanded even more strongly to 7.4 percent of its total exports and
1 There are very large discrepancies between the reported values for total bilateral trade
for SSA and China in the UN Comtrade database. The Chinese data show much larger
values for total bilateral trade than the data for SSA. They also indicate a trade surplus
vis-à-vis SSA whereas the data for SSA indicate a bilateral trade deficit for China.

4
12.9 percent of its total imports from about 1 percent each in the early 1990s. Thus,
bilateral trade is more significant for SSA than China.
Chinese FDI in SSA has also increased rapidly. Data from the Heritage
Foundation and American Enterprise Institute indicate it rose from $9 billion in
2006 to $29 billion in 2013. As Figure 3 shows, Chinese investment in Sub-Saharan
Africa also became increasingly geographically diversified during this period.
Sectoral Pattern of Trade and Investment. SSA’s bilateral trade is
characterized by large compositional differences between its exports to and imports
from China. The bulk of Sub-Saharan Africa’s exports to China are primary products
and China’s reliance on Africa as a source of natural resources, particularly oil,
increased in the 2000s (Kaplinsky et al 2007, Alden and Alves 2009). In contrast,
Chinese exports to Sub-Saharan Africa mainly consist of light manufactures
including clothing, footwear and plastic products, and heavy machinery, such as
transport equipment (Haugen 2011). These compositional differences have
geographic implications. While a few countries account for a significant share of
SSA’s exports to China, reflecting the dominance of oil and minerals in China’s
bilateral import 2 . Chinese exports to the region are less geographically
concentrated.
To gain greater insight into the nature of this bilateral trade, this section
classifies trade flows between China and Sub-Saharan Africa using the factor-
2 Angola accounted for almost half of China’s total imports from SSA in 2012, up from 9
percent in 1992. South Africa is second, accounting for 21 percent of China’s imports
from the region in 2012.

5
intensity method detailed/developed/specified by the International Trade Center
(van Marrewijk and Hu 2013, Maswana 2011). Products are divided into five
categories, primary products and four types of manufactured goods: natural
resource-intensive products, unskilled labor-intensive products, human capital-
intensive products and technology-intensive products. The individual products
comprising each category are shown in the Appendix.
Figures 4 and 5 depict the composition of bilateral trade between China and
SSA as a whole by factor intensity for 1996-2005 and 2006-2012. SSA’s bilateral
exports consist overwhelmingly of primary products in both time periods (Figure
4). Moreover, the small share of manufactured products has become increasingly
concentrated in natural resource-intensive products, with the shares of technology-
intensive and human capital-intensive products actually declining. Most
significantly, SSA exports virtually no labor-intensive products to China. In
contrast, SSA’s imports from China are overwhelmingly manufactured goods, with a
small and declining share of primary products (Figure 5). Reflecting China’s rising
sophistication in production, the shares of technology- and human capital-intensive
products in China’s exports to SSA have grown while those of unskilled-labor
intensive products have declined.
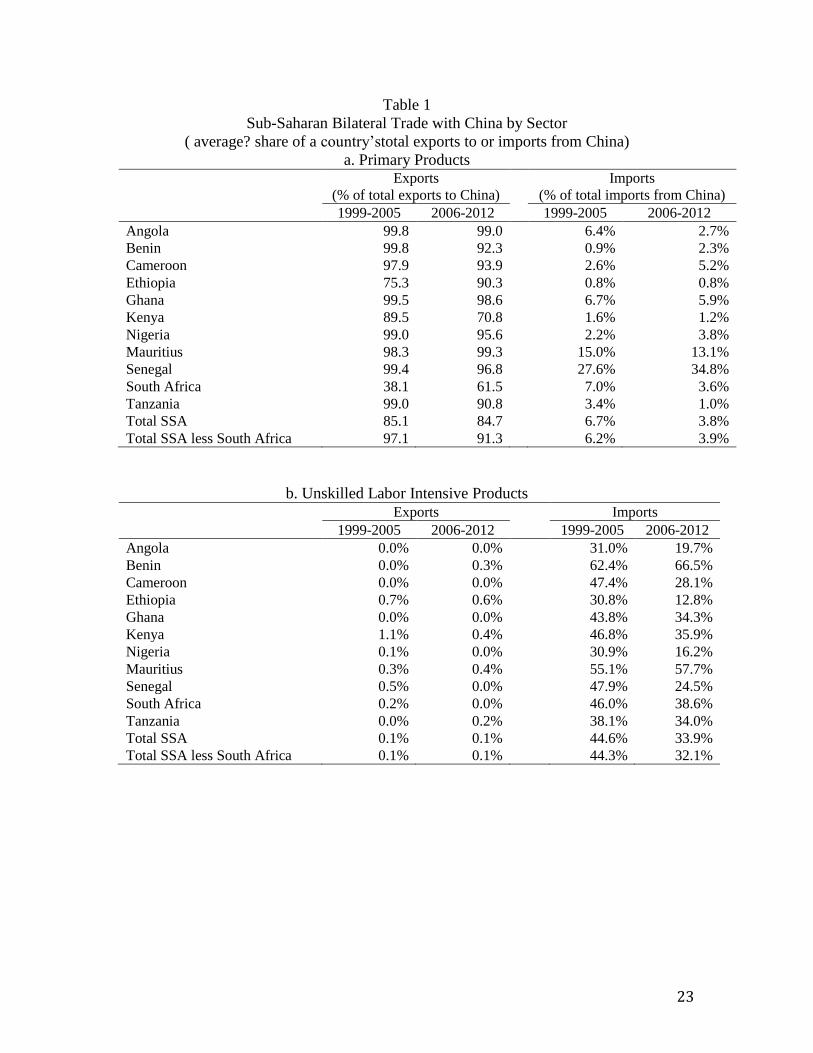
Table 1 shows bilateral Chinese trade with selected SSA countries and SSA as
a whole, with and without South Africa, by product categories, as a share of each
respective country or group’s total bilateral trade with China. For all countries
except South Africa, primary products account for the large majority of exports to
China, with the share exceeding 90 percent in most cases and rising between 1999-

6
2005 and 2006-2012 (Table 1a). Kenya is a notable exception; its share of primary
products fell to 71 percent from 89 percent over the two periods. Even Mauritius,
the most successful exporter of manufactures in SSA, exports only primary products
to China. Most SSA countries import little in the way of primary products from
China.
Table 1b reveals the large imbalance in labor-intensive goods. The share of
labor-intensive goods in exports to China is negligible for all countries, and a mere
0.1 percent for SSA as a whole, with and without South Africa. In contrast, imports
of unskilled labor-intensive products were large for all countries shown, accounting
for about 45 percent of SSA’s total imports from China in 1999-2005 and 32 percent
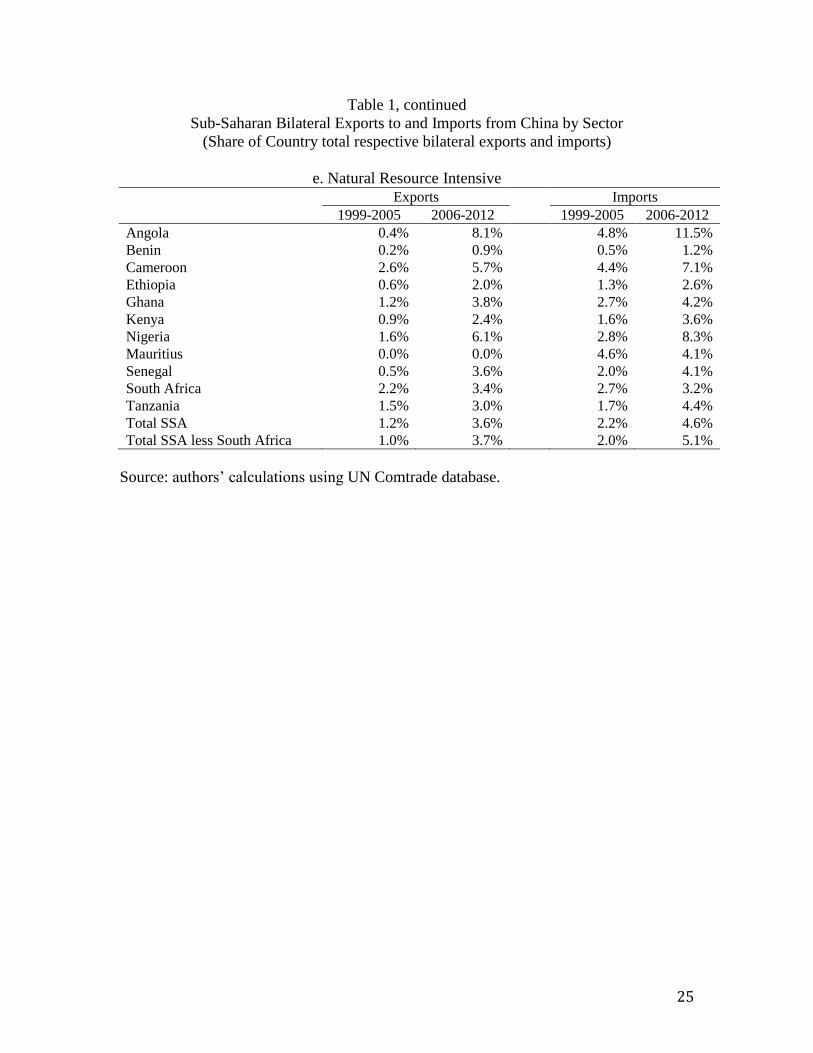
in 2006-2012.3 Tables 1c and 1d show the rising proportion of SSA’s bilateral
imports in the technology- and human capital-intensive categories, and the low and
generally-declining shares of SSA exports to China in the same categories. South
Africa experienced particularly large declines in both categories. Natural resource
intensive products constitute the only improving sector for SSA exports of
manufactured goods to China, but these remain small for most countries and the
largest increases are for Angola and Nigeria, consisting of petroleum products
(Table 1e).
Chinese foreign investment is also heavily oriented towards primary
products with energy and metals accounting for over half of the value of FDI inflows
into SSA over 2006-2014 (Figure 6). Infrastructure, particularly transport, is
3 Benin’s share of these imports is particularly large and Nigeria’s low, reflecting Benin’s
role as a smuggling entrepot into Nigeria (Golub, 2012). Ethiopia’s low share likely
reflects its efforts to promote domestic industry with high import barriers.

7
another important sector for Chinese FDI in the region. There is no significant
Chinese investment in labor-intensive manufacturing.
There is considerable debate on the motivations and effects of China’s
foreign investment in Africa. Referring to the “Beijing Consensus”, some claim that
Chinese FDI differs from Western FDI in that it is motivated by political
considerations. Proponents of non-economic motivations assert that shared ideals
of illiberalism have pushed China towards Africa, which is home to several
authoritarian regimes (Eisenman, 2012). Tull (2006) posits that the establishment
of global multipolarity is a key objective of China’s growing relationship with Africa.
China has also been accused of being more import dependent on African countries
with poorer governance records (de Grauwe el al 2012, Asongu and Aminkeng
2013). Lin (2012) argues that China’s state-sponsored capitalist model makes it
difficult to separate economic and political motivations for trade and investment.
Others argue that China’s investment and trade in Africa is driven
substantially by its demand for African minerals and that Africa provides a market
for Chinese manufactured goods. Thus, China’s trade is often seen as consistent with
the Heckscher-Ohlin theory which predicts that bilateral trade depends on the
relative factor abundance between trade partners. Proponents of this theory argue
that the distinct composition of SSA-China bilateral trade reflects China’s relatively
scarce resource endowment and its comparative advantage in labor-intensive
manufactures (Biggeri and Sanfilippo 2009, Alden and Alves 2009, Wang 2007, van
Marrewijk and Hu 2013). Political and economic considerations can also coincide

8
insofar as China’s trade with Africa is seeking resource security (Alden and Alves
2009).
Factor endowment-based explanations of SSA-China trade, however, are
inconsistent with the fact that a significant number of Sub-Saharan African countries
have few natural resources and most countries have a large reservoir of
underemployed workers with very low earnings (Golub and Hayat 2014). From
this perspective, Chinese exports of labor-intensive goods inhibit the growth of
manufacturing in SSA (Giovanetti and Sanfilippo 2009, Jenkins and Edwards 2006.
Thus while Chinese demand for raw materials has benefited some SSA countries
(Jacobs 2012), the question remains why SSA is unable to compete with China in
manufacturing despite rising wages in China and plenty of underemployed labor in
SSA. To address this issue we propose a framework based on relative unit labor
costs.
III. Assessing Competitiveness: Relative Unit Labor Costs
Method.
A country’s international competitiveness in manufacturing depends on its costs
of production relative to competitors. Relative unit labor costs are a useful metric of
these relative production costs in manufacturing. Golub et al (2007) emphasize the
importance of non-tradable input costs in attracting footloose inputs, notably FDI and
technology transfer from global buyers. Tradable input costs are likely to be similar
everywhere so global buyers will tend to source from locations with low non-tradable
costs. Labor is the most important non-tradable input, particularly for labor-intensive

9
goods, justifying our focus on RULC as a measure of competitiveness. Infrastructure
(electricity, transport, telecommunications) is also an important non-tradable input not
explicitly considered in RULC calculations, but the quality and cost of infrastructure may
be reflected partially in RULC measures through their impact on labor productivity. In
previous work we have analyzed RULC for Africa and China separately (Mbaye and
Golub 2003, Edwards and Golub 2004, Ceglowski and Golub 2007, Ceglowski and
Golub 2012).
RULC is a simple concept that can be explained as follows. Let a represent the
unit labor requirement (the inverse of productivity) in manufacturing:
(1) a =L
Q
where Q is value added and L is labor employment. Marginal productivity and hence a
are assumed to be constant with respect to variations in L.
Let w denote the average labor compensation per worker in manufacturing. If
labor is the only factor of production (or other factor costs do not differ across countries),
average costs of production are equal to unit labor costs (ULC), the product of the unit
labor requirement and average labor compensation, aw. Expressed in domestic currency,
foreign unit labor costs are a*w*e, where * refers to the foreign country and e is the
exchange rate (domestic currency per unit of foreign currency). A country’s
international competitiveness in manufacturing then depends on its relative unit labor
costs (RULC):
(2) RULC = aw
a*w*e = (
) (
)

10
The last expression in equation (2) shows that relative unit labor costs can be
decomposed into relative productivity and relative wages measured in a common
currency. The home country will have a competitive advantage in manufacturing when
RULC < 1, i.e., its unit labor costs are below those of its trading partners.
Alternatively, equation (2) can be written as
(3) RULC = aw
a*w *e=a
a*
æ
èç
ö
ø÷w
w*e
æ
èç
ö
ø÷ =
a i
a*
æ
èç
ö
ø÷
wi
w*ePPP
æ
èç
ö
ø÷ePPP
e
æ
èç
ö
ø÷
where ePPP denotes the purchasing power parity (PPP) exchange rate for manufacturing
defined as the ratio of the domestic to foreign price levels for manufactured goods, p and
p* respectively, i.e., ePPP =p
p*
. Substituting the definition of ePPP into the middle term
of the right-hand side of equation (3) yields:
(4) RULC =a
a*
æ
èç
ö
ø÷w / p
w* / p*
æ
èç
ö
ø÷ePPP
e
æ
èç
ö
ø÷
A country’s competitiveness vis-à-vis other countries depends on the three terms in
equation (4): 1) labor productivity in the home country relative to other countries, 2) real
labor compensation in the home country relative to those of other countries4 or,
equivalently, the country’s relative nominal labor compensation evaluated at ePPPand 3)
the level of the bilateral exchange rate relative to its PPP level. Gains or losses in a
country’s competitive position over time can originate with changes in any of these
ratios.
4 Labor compensation is deflated by producer prices for manufacturing in equation (4) rather than consumer
prices, so it is not an indicator of workers’ welfare.
11
Data
Our measures of SSA-China RULC are constructed in two steps. We first construct
RULCs for individual SSA countries and China relative to the US. We then compare the
RULCs for individual SSA countries to the RULC for China to assess their
competitiveness in manufacturing relative to China. These calculations require data for
manufacturing productivity and wages, as well as exchange rates. Productivity is
calculated as manufacturing value added per employee, deflated by a manufacturing
value-added deflator and converted to US dollars at an equilibrium or purchasing power
parity exchange (PPP) rate. Wages are defined as total labor compensation per
employee, converted to dollars at the market exchange rate. As is accepted in the
literature on international labor productivity and unit labor cost comparisons, PPP
exchange rates are used for international productivity comparisons to eliminate the
effects of exchange-rate volatility on measures of real output, which should be invariant
to such exchange-rate fluctuations. But deviations of exchange rates from PPP do affect
relative labor costs, so it is appropriate to use the market exchange rate in converting
wages. Currency depreciation consequently tends to improve international
competitiveness by reducing labor costs relative to labor productivity.
The primary data source for manufacturing productivity and wages is the UNIDO
Industrial Statistics database (INSTAT). INSTAT reports nominal value added, labor
compensation and employment for various countries through 2010, including China and a
limited number of African countries. The INSTAT data were supplemented with national
data for the United States and Senegal. The series for nominal value added in
manufacturing were converted to real terms by deflating them by manufacturing value-

12
added deflators derived from measures of nominal and real manufacturing value added
reported in the World Bank’s World Development Indicators.5 Two sources are used for
PPP exchange rates: the International Comparison Project (ICP) PPPs for traded goods,
and the University of Groningen/Conference Board manufacturing PPPs. While
manufacturing-specific PPPs are ideal, and are available for China, they are not available
for most SSA countries, with the exception of South Africa.
IV. African Relative Unit Labor Costs vis-à-vis China
This section compares manufacturing productivity, wages and unit labor costs in
selected SSA countries to China.6 Some initial insights into SSA’s competitiveness in
manufacturing emerge from a comparison of manufacturing wages to per capita GDP.
Per capita GDP can be taken an indicator of a country’s overall productivity level. In
comparison to a number of other countries, manufacturing wages are very high in SSA
relative to per capita GDP (Table 2). In 2010, most Asian countries, including China ,
had ratios of manufacturing wages to per capita GDP at or below 1.0. That is, average
annual manufacturing wages are roughly equal to per capita income in most Asian
countries. The same is true in Eastern Europe and Latin America. In Sub-Saharan
Africa, however, wages are typically several times per capita GDP. The only exception
is Mauritius and to a lesser extent South Africa. The ratio of wages to per capita GDP
has fallen in Sub-Saharan Africa since 2000 but remained very high as of 2010.
5 The World Bank measures of manufacturing value added differ from UNIDO’s, as the
former are based on a national accounts concept and the latter are census-based. See
Ceglowski and Golub (2007, 2012) for further discussion. However, the ratios of
nominal to real value added are likely to be less dissimilar across countries than the levels
of the two alternative measures. 6 Countries are selected based on data availability.

13
Table 3 and Figure 7 compare the unit labor costs in manufacturing of individual
SSA countries to Chinese unit labor costs. Two sets of RULC measures are shown based
on the two alternative estimates of PPP exchange rates.7 The first set, labeled ICP-based,
is based on tradable-goods PPPs (exports and imports) from the International Comparison
Project (ICP). The second set of estimates, labeled ICOP-based, uses manufacturing PPP
values derived from the University of Groningen International Comparison of Output and
Productivity (ICOP) project for those countries for which such data are available (China
and South Africa), and the ICP traded goods values for other countries. The higher
values in the second set of estimates is mainly due to the fact that the China-US PPP
exchange rate in ICOP is considerably lower than that of ICP.
In both sets of estimates, RULCs with respect to China were very high in key
SSA countries in the early 2000s (Figure 7). They have dropped for all countries since
then but nevertheless remain high for most countries in 2010. The majority have RULCs
above 1, indicating their unit labor costs in manufacturing exceed those in China.
Ethiopia and Tanzania are exceptions. As of 2010, unit labor costs for Ethiopia and
Tanzania are at rough parity with China according to the ICOP-based measures and are
substantially below China’s according to the ICP-based measures (Table 3).
Table 4 breaks down the improvement in RULCs for SSA into Chinese and SSA
real wage and productivity growth and real exchange rate movements over 2000-2010.
Chinese productivity and wages both grew strongly, with wage growth outpacing
productivity growth and pushing up Chinese unit labor costs. Manufacturing
productivity growth in the SSA economies was slower than China’s, substantially so in
7 The PPP exchange rates are used in constructing relative productivity.

14
most cases. However, real wage growth in the SSA economies was even slower, pushing
down unit labor costs. In a nutshell, the improvement in SSA’s manufacturing
competitiveness reflects both rising Chinese unit labor costs and productivity growth in
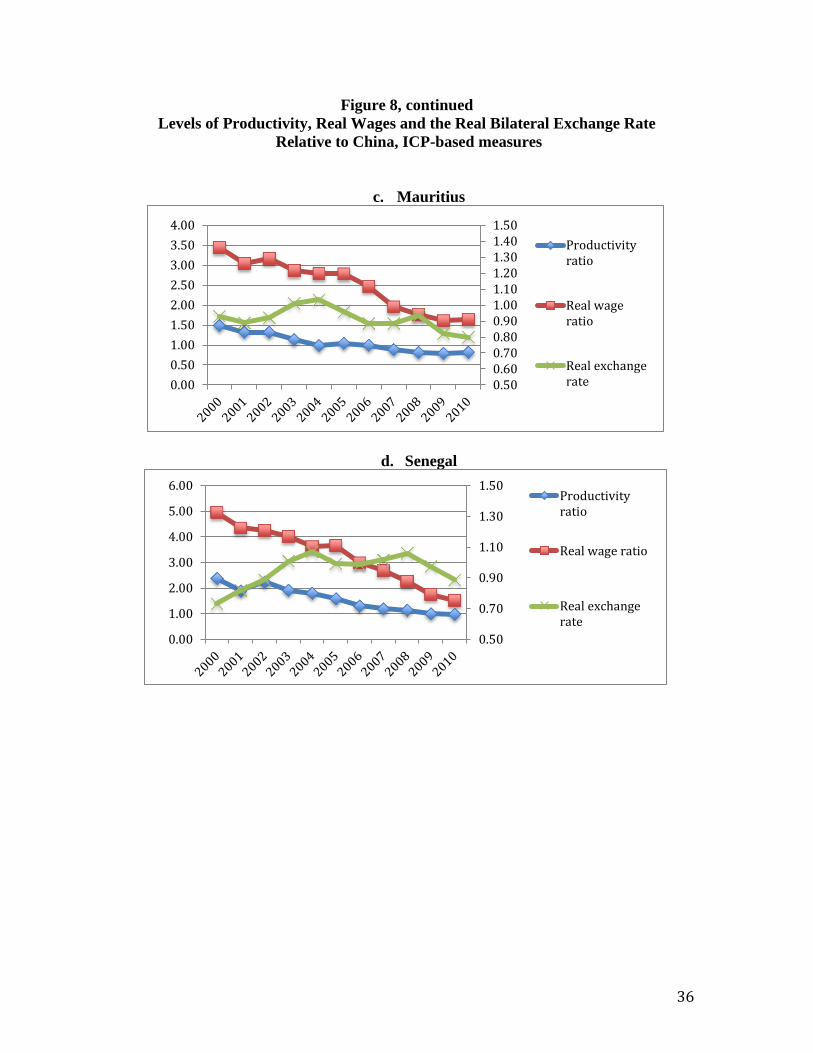
SSA countries that outpaced wages. Figures 8a-8f plot the factors underpinning the
bilateral RULC levels vis-à-vis China over 2000-2010: relative productivity, real wages
and the real bilateral exchange rate of our sample of SSA countries relative to China.
These figures show that relative real wages and relative productivity in the SSA countries
are both high and generally declining, with relative real wages consistently exceeding
relative productivity. There is no clear trend for the real bilateral exchanges rate
between the SSA countries and China over 2000-2010. However, exchange rate changes
contributed to falling RULCs for Ethiopia, Mauritius, and Tanzania; these countries all
experienced real appreciations that were smaller than the real appreciation of China’s
currency, effectively resulting in a real depreciation against the renminbi (Table 5).
Several key findings emerge from this analysis. First, manufacturing wages in
Sub-Saharan Africa are very high relative to per capita GDP. Second, until recently
,real wages and productivity in SSA manufacturing have been both well above China’s
levels, with the real wage differential exceeding the productivity differential.
Consequently unit labor costs in our sample of SSA economies have been significantly
higher than in China. These high labor costs have harmed African competitiveness and
explain in part Africa’s failure to develop labor-intensive manufacturing. Third, the
growth of real wages and productivity in SSA manufacturing has lagged the growth in
their Chinese counterparts in recent years. Fourth, relative real wages have dropped more
rapidly than relative productivity for our sample of SSA countries, boosting their

15
competitiveness vis-à-vis China. Unit labor costs in some countries (Ethiopia and
Tanzania) are now at or even below China’s levels. For other SSA countries, however
RULC remains elevated.
V. Can Africa Now Compete in Labor-Intensive Manufacturing?
The previous section indicated that some African RULC have declined
considerably relative to China due both to rising wages in China and productivity growth
that has exceeded wage growth in SSA countries. Have SSA countries been able to take
advantage of rising Chinese costs? While there are some reports of increasing FDI in
African manufacturing, these investments are small and oriented towards the domestic
market (Shen 2014), with the possible exception of Ethiopia (Dinh et al 2012).
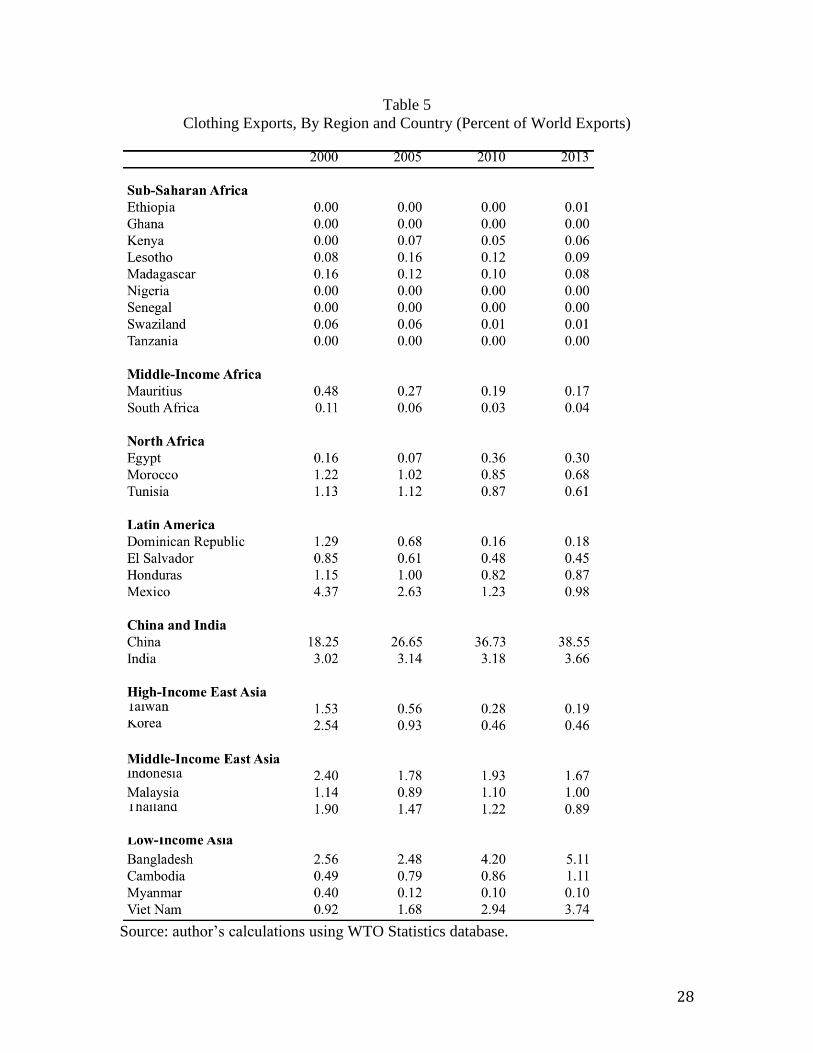
We assess the situation by examining SSA’s success in exporting clothing, a basic
labor-intensive export product that has served as an initial gateway for some countries’
greater participation in world export markets for manufactures. Table 6 shows shares of
world clothing exports by region and country, comparing sub-Saharan countries to other
regions. Sub-Saharan African countries’ presence in the world export market for clothing
has never been large and has declined further in recent years. A few low-income African
countries benefited from trade preferences under the African Growth and Opportunity
Act (AGOA) enacted in 1999. These include Lesotho and Madagascar and to a lesser
extent Swaziland and Kenya. With the expiration of the Multi-Fiber Accord in 2005,
however, AGOA preferences have apparently been insufficient to sustain African
countries’ competitiveness and their modest shares of exports in the early 2000s fell off.
Many other African countries, including relatively successful countries such as Ethiopia,
16
Ghana and Tanzania have yet to enter the clothing export market in any significant
volume, as of 2013. Middle-income Mauritius and South Africa have also seen their
moderate shares of the market decline in recent years.
Based on the apparel market, there is no indication from recent data to indicate
that African countries’ are becoming successful exporters of labor-intensive
manufactures in the face of China’s falling competitiveness. Instead, the shares of other
low-income Asian countries’ exports are growing as is China’s, despite its rising costs.
Why have African countries failed so far to take advantage of China’s falling
competitiveness? There are two main reasons. First, unit labor costs in SSA countries
remain high relative to China and other Asian countries in most cases. Table 6 shows
wages, productivity and ULC in manufacturing relative to the United States for the SSA
and Asian countries for which data are available.8 While relative unit labor costs indicate
that Ethiopia and Tanzania have become very competitive, other African countries have
high unit labor costs compared to those in the US. In contrast, most Asian countries in
Table 6 have low RULCs relative to the US, implying that the SSA economies have very
high unit labor costs relative to these Asian competitors. Second, labor costs are not the
only source of competitiveness. The general business environment also matters. African
countries tend to perform poorly in comparisons of the quality of infrastructure,
corruption and institutional quality more generally (Eifert et al 2008, Golub et al 2011).
In Ethiopia and Tanzania, the two countries with favorable unit labor costs, power
outages are frequent, roads are of poor quality, and ports are slow to process containers
(Golub and Hayat 2015).
8 These estimates use the ICP values of the PPP exchange rate for all reported countries.

17
Conclusions and Policy Implications
Economic growth in Sub-Saharan Africa has improved but has been substantially
based on capital-intensive sectors such as minerals and telecommunications, with
consequent limited growth of formal sector employment. This contrasts with Asian
reliance on labor-intensive manufacturing exports, which have boosted employment and
contributed dramatically to poverty reduction. China in particular has become a
dominant exporter of manufactured goods, and its bilateral trade with Sub-Saharan Africa
is highly unbalanced in the sense that it overwhelmingly exports manufactures to the
region while importing minerals from it. In recent years, however, Chinese wages have
been rising rapidly and outpacing productivity growth, reducing China’s competitive
advantage in manufacturing and opening the door to inroads by lower-income countries,
including those in Sub-Saharan Africa.
We show that Sub-Saharan Africa’s international competitiveness has improved
but remains largely unfavorable relative to China, as measured by relative unit labor
costs. Real wages in Sub-Saharan African formal manufacturing are very high relative to
per capita income. High real wages in formal manufacturing reduce competitiveness in
labor-intensive manufacturing. Poor infrastructure and weak institutions also adversely
affect the business environment for foreign investment. Low-income Asian countries
have so far shown a greater ability to enter into the global manufacturing than sub-
Saharan countries, in particular in the crucial clothing sector. Given new Asian
competitors and China’s continued dominant presence, the possibilities for Africa to

18
compete in low-skill manufacturing are not encouraging, despite some glimmers of
progress in a few countries such as Ethiopia (Dinh et al 2012).
Instead, African countries may have greater potential to boost labor-intensive
exports in other sectors, especially agriculture, including traditional primary products,
horticulture and fishing (Golub et al, 2008). Agricultural exports share many of the
features of manufacturing, both in terms of their potential to spur growth and
employment, and the institutional constraints they face in achieving this potential.
Several critical aspects of manufacturing exports that promote development and poverty
reduction apply to traditional and non-traditional agriculture. These include high labor-
intensity, possibilities for technological upgrading and consequently raising producer
incomes, and access to state-of-the-art foreign technology through FDI and outsourcing.
But they also include the necessity of attaining international competitiveness, and thus
the critical roles of low-cost labor and a favorable climate for investment. For
agriculture, especially, sanitary and phyto-sanitary norms in developed-country markets
are a major hurdle for successful exporting (Golub and McManus 2009, Mbaye and
Gueye 2014), analogous to the demanding specifications of global buyers of
manufactures. Sub-Saharan Africa’s success in exporting labor-intensive products, in
agriculture as in manufacturing, hinges on improving the business climate and boosting
competitiveness through increased labor productivity and wage moderation.

19
Appendix
Definition of Product Groups
Group Constituents SITC Codes Primary Products Food, Beverages,
Minerals, Crude Oil, Animal and Vegetable Oils
0,1,2,32, 333, 34, 35, 4
Natural Resource Intensive
Leather Manufactures, , Lime, Cement, Clay, Mineral Manufactures, Precious Stones, Pig Iron, Non Ferrous Metals
61,63,661,662, 663,667, 671, 68
Human Capital Intensive
Dyeing materials, essential oils, Rubber Manufactures, Steel Ingots, Telecommunications equipment, Photographic apparatus, watches
53,55,62,672,673,674,675,676.677, 678,679,69,761, 762,73,885,894,895, 896,897,898,899
Unskilled Labor Intensive
Textile yarn, Glass, Prefabricated buildings, plumbing, heating, furniture, Travel goods, apparel, footwear
65, 664, 665, 666, 81, 82, 83, 84, 85, 894,895
Technology Intensive
Organic and inorganic chemicals, fertilizers, plastics,
51,52,54,56,57,58,59,71,72,73,74 75,764,77,792,87,881,882,883, 884,892,893
20
References
Ademola, O. T., A. S. Bankole and A. O. Adewuyi, A. O. (2009). China–Africa Trade
Relations: Insights from AERC Scoping Studies. European Journal of
Development Research 21(4), 485-505.
Alden, C. (2005). China in Africa. Survival 47(3), 147-164.
Alden, C., and A. C. Alves (2009). China and Africa's Natural Resources: The
Challenges and Implications for Development and Governance. Occasional Paper
41, South African Institute of International Affairs.
Asongu, S. A., and G. A. Aminkeng (2013). The Economic Consequences of China–
Africa Relations: Debunking Myths in the Debate. Journal of Chinese Economic
and Business Studies 11(4), 261-277.
Biggeri, M., and M. Sanfilippo (2009). Understanding China's Move into Africa: an
Empirical Analysis. Journal of Chinese Economic and Business Studies 7(1), 31-
54.
Broadman, H. G. (2007). Africa's Silk Road: China and India's New Economic Frontier.
Washington DC: World Bank Publications.
Ceglowski, J. and S. Golub (2007). Just How Low Are China’s Labor Costs?” The World
Economy 30( 4), 597-617.
Ceglowski, J. and S. Golub (2012). Does China Still Have a Labor Cost Advantage? Global
Economy Journal 12(3)g
De Grauwe, P., R. Houssa & G. Piccillo (2012). African Trade Dynamics: Is China a
Different Trading Partner? Journal of Chinese Economic and Business
Studies 10(1), 15-45.
Dinh, H. T., V. Palmade, V. Chandra, and F. Cossar (2012). Light Manufacturing in
Africa: Targeted Policies to Enhance Private Investment and Jobs. Washington
DC: World Bank.
Edwards, L. and S. Golub (2004). South Africa’s International Cost Competitiveness and
Exports in Manufacturing. World Development 32(8), 1323-1339.
Eifert, B., A. Gelb, and V. Ramachandran (2008). The Cost of Doing Business in Africa:
Evidence from the Investment Climate Data. World Development 36(9): 1531-
1546.
Eisenman, J. (2012). China–Africa Trade Patterns: Causes and Consequences. Journal of
Contemporary China 21(77), 793-810.
Giovannetti, G., and M. Sanfilippo (2009). Do Chinese Exports Crowd-out African
Goods? An Econometric Analysis by Country and Sector. European Journal of
Development Research 21(4), 506-530.
Golub, S., R.W. Jones and H. Kierzkowski (2007). Globalization and Country-Specific Services
Links. Journal of Economic Policy Reform 10, 63-88.
21
Golub, S. (2012). Entrepot Trade and Smuggling in West Africa: Benin, Togo and
Nigeria. The World Economy 35(9), 1139-1161.
Golub, S. and F. Hayat (2015). Employment, Unemployment and Underemployment in
Africa.In Oxford Handbook of Africa and Economics, ed. C. Monga and J. Lin,
forthcoming.
Golub, S. and J. McManus (2009). Horticulture Exports and African Development. paper
prepared for UNCTAD.
Golub, S., A. Bernhardt and M. Liu (2011). Development and Trade Strategies for Least
Developed Countries. paper prepared for UNCTAD.
Golub, S., S. A. O’Connell and W. Du (2008). Export Competitiveness and Development
in LDCs: Policies, Issues, and Priorities for Least Developed Countries. Paper
prepared for UNCTAD.
Haugen, H. Ø. (2011). Chinese Exports to Africa: Competition, Complementarity and
Cooperation Between Micro-level Actors. Forum for Development Studies38(2),
157-176.
Jacobs, B. (2012). A Dragon and a Dove? A Comparative Overview of Chinese and
European Trade Relations with Sub-Saharan Africa. Journal of Current Chinese
Affairs 40(4), 17-60.
Jenkins, R. and C. Edwards (2006). The Economic Impacts of China and India on Sub-
Saharan Africa: Trends and Prospects. Journal of Asian Economics17(2), 207-
225.
Kaplinsky, R., McCormick, D., & Morris, M. (2007). The impact of China on sub-
Saharan Africa.
Li, H. (2005). The Chinese Path of Economic Reform and Its Implications. Asian Affairs:
An American Review 31(4), 195-211.
Lin, J. Y. (2012). New Structural Economics: A Framework for Rethinking Development
and Policy. Washington DC: World Bank Publications.
Lyons, M. and A. Brown (2010). Has Mercantilism Reduced Urban Poverty in SSA?
Perceptions of Boom, Bust, and the China-Africa Trade in Lome and Bamako.
World Development 38(5), 771-782.
Maswana, J. C. (2011). Emerging Patterns in Sino-African Trade and Potentials for
Enterprise Development. In China-OECD/DAC Study Group, Conference at
Addis Ababa.
Mbaye, A. A. and A. Gueye (2014). SPS Standards and International Competitiveness in Africa:
The Case of Senegal.In Connecting to Global Markets, ed.M. Jansen, M. S. Jallab and M.
Smeets, 73-85. Geneva: World Trade Organization.
Mbaye, A. A. and S. Golub (2003). Unit Labor Costs, International Competitiveness, and
Exports: the Case of Senegal. Journal of African Economies 2, 219-248.
Sautman, B., and Y. Hairong (2007). Friends and Interests: China's Distinctive Links
with Africa. African Studies Review 50(03), 75-114.

22
Tull, D. M. (2006). China's Engagement in Africa: Scope, Significance and
Consequences. The Journal of Modern African Studies 44(03), 459-479.
van Marrewijk, C. and S. Hu (2013). An Empirical Analysis of the China-Africa Trade
Puzzle: The Role of China’s Trade Policies. unpublished working paper.
Wang, J. Y. (2007). What Drives China's Growing Role in Africa? IMF working Paper
7-211, October.k
Zafar, A. (2007). The Growing Relationship between China and Sub-Saharan Africa:
Macroeconomic, Trade, Investment, and Aid Links. The World Bank Research
Observer 22(1), 103-130.
23
Table 1
Sub-Saharan Bilateral Trade with China by Sector
( average? share of a country’stotal exports to or imports from China)
a. Primary Products
Exports
(% of total exports to China)
Imports
(% of total imports from China)
1999-2005 2006-2012 1999-2005 2006-2012
Angola 99.8 99.0
6.4% 2.7%
Benin 99.8 92.3
0.9% 2.3%
Cameroon 97.9 93.9
2.6% 5.2%
Ethiopia 75.3 90.3
0.8% 0.8%
Ghana 99.5 98.6
6.7% 5.9%
Kenya 89.5 70.8
1.6% 1.2%
Nigeria 99.0 95.6
2.2% 3.8%
Mauritius 98.3 99.3
15.0% 13.1%
Senegal 99.4 96.8
27.6% 34.8%
South Africa 38.1 61.5
7.0% 3.6%
Tanzania 99.0 90.8
3.4% 1.0%
Total SSA 85.1 84.7
6.7% 3.8%
Total SSA less South Africa 97.1 91.3 6.2% 3.9%
b. Unskilled Labor Intensive Products
Exports Imports
1999-2005 2006-2012 1999-2005 2006-2012
Angola 0.0% 0.0%
31.0% 19.7%
Benin 0.0% 0.3%
62.4% 66.5%
Cameroon 0.0% 0.0%
47.4% 28.1%
Ethiopia 0.7% 0.6%
30.8% 12.8%
Ghana 0.0% 0.0%
43.8% 34.3%
Kenya 1.1% 0.4%
46.8% 35.9%
Nigeria 0.1% 0.0%
30.9% 16.2%
Mauritius 0.3% 0.4%
55.1% 57.7%
Senegal 0.5% 0.0%
47.9% 24.5%
South Africa 0.2% 0.0%
46.0% 38.6%
Tanzania 0.0% 0.2%
38.1% 34.0%
Total SSA 0.1% 0.1%
44.6% 33.9%
Total SSA less South Africa 0.1% 0.1% 44.3% 32.1%

24
Table 1, continued
Sub-Saharan Bilateral Exports to and Imports from China by Sector
(Share of Country total respective bilateral exports and imports)
c. Technology Intensive
Exports Imports
1999-2005 2006-2012 1999-2005 2006-2012
Angola 0.0% 0.0%
41.5% 44.0%
Benin 0.2% 0.0%
23.1% 17.2%
Cameroon 0.0% 4.1%
25.7% 37.7%
Ethiopia 0.0% 0.1%
46.2% 64.7%
Ghana 0.0% 0.1%
30.4% 35.1%
Kenya 2.9% 10.6%
33.3% 39.5%
Nigeria 0.3% 1.3%
44.6% 50.1%
Mauritius 1.2% 0.2%
12.7% 13.0%
Senegal 0.1% 0.2%
13.8% 24.2%
South Africa 10.3% 3.3%
32.7% 40.2%
Tanzania 0.6% 1.6%
37.6% 39.2%
Total SSA 2.5% 1.2%
32.4% 40.1%
Total SSA less South Africa 0.4% 0.6% 32.6% 40.1%
d. Human Capital Intensive
Exports Imports
1999-2005 2006-2012 1999-2005 2006-2012
Angola 0.0% 0.0%
16.3% 22.1%
Benin 0.0% 0.0%
13.0% 12.8%
Cameroon 0.0% 0.1%
19.9% 21.9%
Ethiopia 0.0% 0.0%
20.9% 19.0%
Ghana 0.0% 0.1%
16.3% 20.4%
Kenya 2.4% 0.1%
16.7% 19.7%
Nigeria 0.0% 0.0%
19.5% 21.7%
Mauritius 0.1% 0.1%
12.6% 12.1%
Senegal 0.0% 0.0%
8.8% 12.4%
South Africa 14.5% 2.4%
11.7% 14.4%
Tanzania 0.0% 0.0%
19.3% 21.3%
Total SSA 3.0% 0.5%
14.1% 17.6%
Total SSA less South Africa 0.1% 0.0% 14.9% 18.8%
25
Table 1, continued
Sub-Saharan Bilateral Exports to and Imports from China by Sector
(Share of Country total respective bilateral exports and imports)
e. Natural Resource Intensive
Exports Imports
1999-2005 2006-2012 1999-2005 2006-2012
Angola 0.4% 8.1%
4.8% 11.5%
Benin 0.2% 0.9%
0.5% 1.2%
Cameroon 2.6% 5.7%
4.4% 7.1%
Ethiopia 0.6% 2.0%
1.3% 2.6%
Ghana 1.2% 3.8%
2.7% 4.2%
Kenya 0.9% 2.4%
1.6% 3.6%
Nigeria 1.6% 6.1%
2.8% 8.3%
Mauritius 0.0% 0.0%
4.6% 4.1%
Senegal 0.5% 3.6%
2.0% 4.1%
South Africa 2.2% 3.4%
2.7% 3.2%
Tanzania 1.5% 3.0%
1.7% 4.4%
Total SSA 1.2% 3.6%
2.2% 4.6%
Total SSA less South Africa 1.0% 3.7% 2.0% 5.1%
Source: authors’ calculations using UN Comtrade database.

26
Table 2
Annual Manufacturing Wages,
Selected Countries in Africa and Other Regions, current US$
2000 2010
Level in
US$
Relative
toPer
Capita
GDP
Level in
US$
Relative
toPer
Capita
GDP
Sub-Saharan Africa
Burundi NA NA
3261 14.9
Cameroon 3088 5.3
NA NA
Ethiopia 771 6.3
807 2.4
Ghana 1832 4.9
NA NA
Kenya 2118 5.2
2854 3.6
Malawi 436 2.8
2045 5.7
Mauritius 3254 0.8
6285 0.8
Senegal 3680 7.8
6450 6.5
South Africa 7981 2.6
12331 1.7
Tanzania 2296 7.5
1581 3.0
North Africa
Egypt 2028 1.3
3453 1.2
Morocco 4123 3.2
6654 2.4
Tunisia 4066 1.8
5455 1.3
Latin America
Brazil 5822 1.6
10918 1.0
Colombia 4096 1.6
4680 0.8
Mexico 8048 1.2
7310 0.8
Asia
Bangladesh NA NA
680 1.6
China 1016 1.1
4770 1.1
India 1356 3.0
2619 1.8
Indonesia 929 1.2
1897 0.6
Malaysia 4405 1.1
6548 0.7
Vietnam NA NA
1727 1.3
Eastern Europe
Czech Rep. 3964 0.7
12673 0.7
Latvia 3689 1.1
9191 0.8
Poland 5829 1.1 10162 0.8
Per Capita GDP from World Bank World Development Indicators

27
Table 3
Relative Unit Labor Cost vis-a-vis China (RULC),
2010
ICP-based
measures
ICOP-based
measures
Ethiopia 0.61 1.01
Kenya 1.21 2.01
Malawi 1.75 2.92
Mauritius 1.61 2.68
Senegal 1.38 2.30
South Africa 1.52 3.01
Tanzania 0.56 0.94
RULC > 1.0 means African countries have higher unit labor costs than China.
Source: Authors’ calculations using UNIDO INSTAT database.
Table 4
Productivity, Real Wages, Real Exchange rates, and Relative Unit Costs, Annual
Percent Changes, 2000-2010
Productivity
Growth
Real Wage
Growth
Real
Appreciation
vis-à-vis US
dollar
Relative
Unit Labor
Cost vis-à-
vis USA
Relative
Unit Labor
Cost vis-à-
vis China
China 11.7 12.9% 4.7% 7.8% NA
Ethiopia 0.2 -1.3% 2.5% 2.2% -5.6%
Kenya 1.5 -0.7% 5.0% 4.7% -3.1%
Mauritius 5.2 4.8% 3.1% 4.7% -3.1%
Senegal 2.2 0.3% 6.7% 6.8% -1.0%
South Africa 3.0 2.0% 4.6% 5.6% -2.2%
Tanzania 8.4 0.6% 1.8% -4.2% -12.0%
Source: Authors’ calculations using UNIDO INSTAT database.
28
Table 5
Clothing Exports, By Region and Country (Percent of World Exports)
Source: author’s calculations using WTO Statistics database.

29
Table 6
Productivity, Wages and Unit Labor Costs in Africa and Asia,
Relative to the United States, 2010 (United States = 1)
Relative
Productivity
Relative
Wage
Relative Unit
Labor Cost
Sub-Saharan Africa
Ethiopia 0.03 0.02 0.53
Kenya 0.05 0.06 1.23
Malawi 0.03 0.05 1.79
Mauritius 0.09 0.14 1.64
Senegal 0.10 0.15 1.41
South Africa 0.18 0.28 1.56
Tanzania 0.06 0.04 0.57
Asia
Bangladesh 0.02 0.02 0.70
China 0.18 0.11 0.61
India 0.12 0.06 0.50
Indonesia 0.08 0.04 0.55
Vietnam 0.03 0.04 1.23
Source: Authors’ calculations using UNIDO INSTAT database.

30
Figure 1:
China’s Exports to and Imports from Sub-Saharan Africa (SSA) (Percent of China’s Total Exports and Imports, Respectively)
Source: authors’ calculations using UN COMTRADE database
Figure 2: Sub-Saharan Africa (SSA) Exports to and Imports from China
(Percent of SSA’s Total Exports and Imports, Respectively)
Source: authors’ calculations using UN COMTRADE database
0%
1%
2%
3%
4%
5%
6%
Imports from SSA
Exports to SSA
0%
2%
4%
6%
8%
10%
12%
14%
Imports from China
Exports to China

31
Figure 3: Number of SSA Countries with new Chinese Foreign Direct Investment, 2006-2013
Source: authors’ calculations using data from the Heritage Foundation
6
10 9
14
11
17 18 18
0
2
4
6
8
10
12
14
16
18
20
2006 2007 2008 2009 2010 2011 2012 2013

32
Fig 4: Total Sub-Saharan Exports to China, by Sector
Source: authors’ calculations using UN COMTRADE database.
Figure 5: Total Sub-Saharan Imports from China, by Sector
Source: authors’ calculations using UN COMTRADE database.
0%
10%
20%
30%
40%
50%
60%
70%
80%
90%
100%
1996-2005 2006-2012
Technology Intensive
Unskilled LaborIntensive
Human Capital Intensive
Natural ResourceIntensive
Primary Products
0%
10%
20%
30%
40%
50%
60%
70%
80%
90%
100%
1996-2005 2006-2012
Technology Intensive
Unskilled LaborIntensive
Human Capital Intensive
Natural ResourceIntensive
Primary Products

33
Figure 6
Cumulative Chinese FDI in SSA, 2006-2014 ($ billion)
Source: authors’ calculations using data from the Heritage Foundation.
0
5
10
15
20
25
30
35
40
45
50

34
Figure 7
Relative Unit Labor Cost vis-a-vis China,
2003-2010,
a. ICP-based measures
b. ICOP-based measures
0.0
0.5
1.0
1.5
2.0
2.5
3.0
2003 2004 2005 2006 2007 2008 2009 2010
Ethiopia
Kenya
Mauritius
Senegal
South Africa
Tanzania
0.0
1.0
2.0
3.0
4.0
5.0
6.0
2003 2004 2005 2006 2007 2008 2009 2010
Ethiopia
Kenya
Mauritius
Senegal
South Africa
Tanzania

35
Figure 8
Levels of Productivity, Real Wages and the Real Bilateral Exchange Rate Relative
to China, ICP-based measures
a. Ethiopia
b. Kenya
0.500.600.700.800.901.001.101.201.301.401.50
0.00
0.10
0.20
0.30
0.40
0.50
0.60
0.70
0.80
0.90
Productivityratio
Real wage ratio
Real exchangerate
0.500.600.700.800.901.001.101.201.301.401.50
0.00
0.50
1.00
1.50
2.00
2.50
3.00
Productivity ratio
Real wage ratio
Real exchangerate
36
Figure 8, continued
Levels of Productivity, Real Wages and the Real Bilateral Exchange Rate
Relative to China, ICP-based measures
c. Mauritius
d. Senegal
0.500.600.700.800.901.001.101.201.301.401.50
0.00
0.50
1.00
1.50
2.00
2.50
3.00
3.50
4.00
Productivityratio
Real wageratio
Real exchangerate
0.50
0.70
0.90
1.10
1.30
1.50
0.00
1.00
2.00
3.00
4.00
5.00
6.00Productivityratio
Real wage ratio
Real exchangerate

37
Figure 8, continued
Levels of Productivity, Real Wages and the Real Bilateral Exchange Rate
Relative to China, ICP-based measures
e. South Africa
f. Tanzania
0.50
0.60
0.70
0.800.90
1.00
1.10
1.20
1.30
1.401.50
0.00
2.00
4.00
6.00
8.00
10.00
12.00
Productivityratio
Real wage ratio
Real exchangerate
0.500.600.700.800.901.001.101.201.301.401.50
0.000.100.200.300.400.500.600.700.800.901.00
2004 2005 2006 2007 2008 2009 2010
Productivityratio
Real wage ratio
Real exchangerate