Embed Size (px)
Citation preview
Can fluorescence spectrometry be used as a surrogate for theBiochemical Oxygen Demand (BOD) test in water qualityassessment? An example from South West England
Naomi Hudsona, Andy Bakera,⁎, David Wardb, Darren M. Reynoldsc, Chris Brunsdond,Cynthia Carliell-Marquete, Simon Browningf
aDepartment of Geography, Earth and Environmental Sciences, University of Birmingham, Birmingham, B15 2TT, UKbSafe Training Systems Ltd, Holly House, Maidenhead Road, Wokingham, Berkshire, RG40 5RR, UKcCentre for Research in Analytical Materials & Sensor Science, University of the West of England, Coldharbour Lane,Frenchay, Bristol, BS16 1QY, UKdDepartment of Geography, University of Leicester, Leicester, LE1 7RH, UKeSchool of Engineering, University of Birmingham, Edgbaston, Birmingham, B15 2TT, UKfEnvironment Agency, Science Group- Technology, Rivers House, Lower Bristol Road, Bath, BA2 9ES, UK
A R T I C L E I N F O A B S T R A C T
Article history:Received 30 March 2007Received in revised form23 October 2007Accepted 28 October 2007Available online 4 December 2007
The fluorescence intensities of tryptophan-like, tyrosine-like and humic-likematerials weredetermined using excitation-emission-matrices (EEMs) for a wide range of samplesincluding natural surface waters, sewage and industrial effluents and waters that haveexperienced known pollution events from the SouthWest of England (n=469). Fluorescenceintensities reported in arbitrary fluorescence units (AFU) were correlated with standard fiveday Biochemical Oxygen Demand (BOD5) values which were used as an indicator of theamount of biodegradable organic material present. Tryptophan-like fluorescence, whichhas been found to relate to the activity of the biological community, showed the strongestcorrelation with BOD5. Fluorescence analysis of the tryptophan-like peak (excitation/emission wavelength region 275/340 nm) is found to provide an accurate indication of thepresence, and relative proportions of bioavailable organic material present (natural oranthropogenic). It therefore provides an insight relating to its oxygen depleting potential.Thus fluorescence spectroscopy is recommended as a portable or laboratory tool for thedetermination of the presence of biodegradable organic matter with intrinsic oxidisingpotential in natural waters. The novel application of Geographically Weighted Regression(GWR) to the data illustrates that strong local relationships exist between the twoparameters and that site specific character may be a strong factor in the strength of thetryptophan-like fluorescence/BOD5 relationship.
© 2007 Elsevier B.V. All rights reserved.
Keywords:FluorescenceBiochemical Oxygen Demand (BOD)Water qualityRiversWastewaterGeographically Weighted Regression(GWR)
1. Introduction
Fluorescence spectroscopy is commonly used in the study ofdissolved organic matter (DOM) in natural waters including
marine waters (Coble, 1996), rivers (Patel-Sorrentino et al.,2002), groundwaters (Baker and Genty, 1999) and lakes(Cammack et al., 2004). It is a rapid, reagentless techniquethat requires little sample preparation. An Excitation–Emis-
S C I E N C E O F T H E T O T A L E N V I R O N M E N T 3 9 1 ( 2 0 0 8 ) 1 4 9 – 1 5 8
⁎ Corresponding author. Department of Geography, Earth and Environmental Sciences, University of Birmingham, Birmingham, B15 2TT,UK. Tel.: +44 0121 415 8133; fax: +44 0121 414 5528.
E-mail address: [email protected] (A. Baker).
0048-9697/$ – see front matter © 2007 Elsevier B.V. All rights reserved.doi:10.1016/j.scitotenv.2007.10.054
ava i l ab l e a t www.sc i enced i rec t . com
www.e l sev i e r. com/ loca te / sc i to tenv
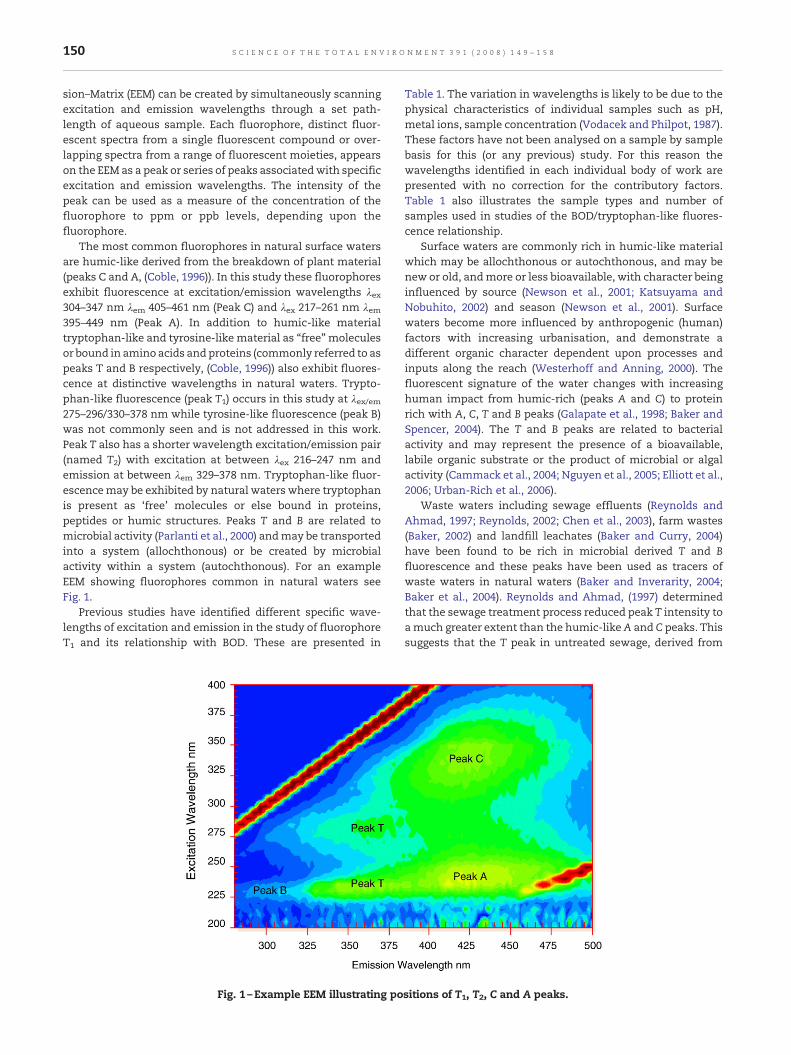
sion–Matrix (EEM) can be created by simultaneously scanningexcitation and emission wavelengths through a set path-length of aqueous sample. Each fluorophore, distinct fluor-escent spectra from a single fluorescent compound or over-lapping spectra from a range of fluorescent moieties, appearson the EEM as a peak or series of peaks associatedwith specificexcitation and emission wavelengths. The intensity of thepeak can be used as a measure of the concentration of thefluorophore to ppm or ppb levels, depending upon thefluorophore.
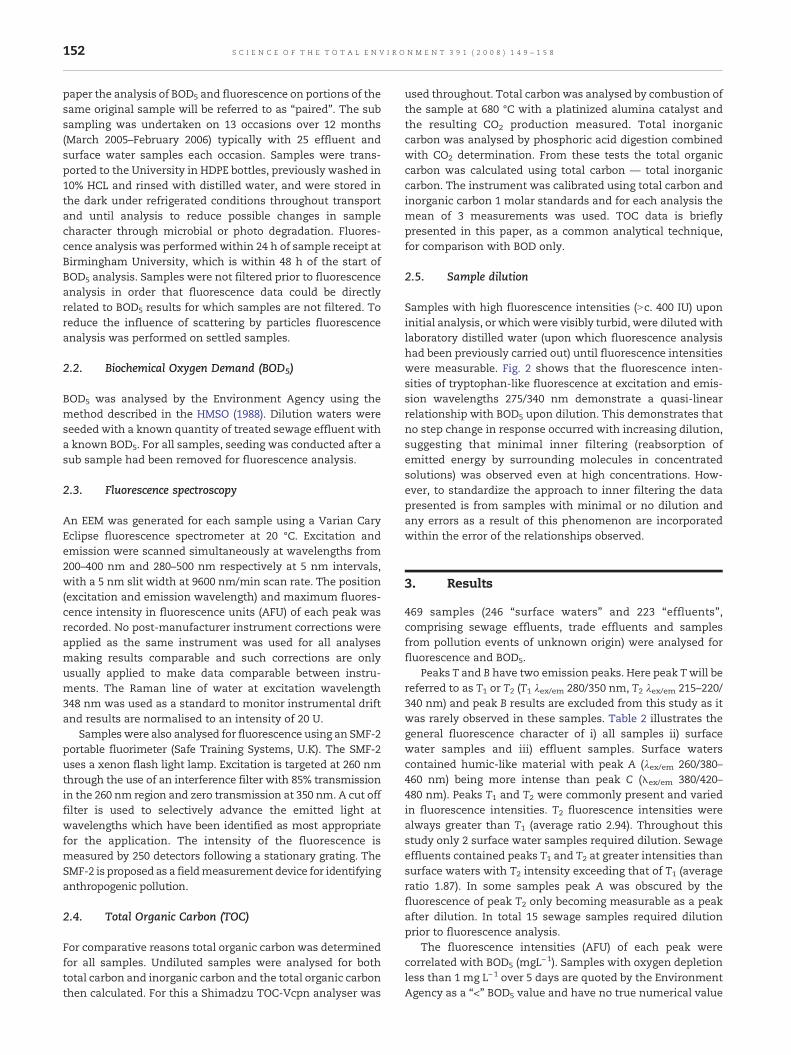
The most common fluorophores in natural surface watersare humic-like derived from the breakdown of plant material(peaks C and A, (Coble, 1996)). In this study these fluorophoresexhibit fluorescence at excitation/emission wavelengths λex304–347 nm λem 405–461 nm (Peak C) and λex 217–261 nm λem395–449 nm (Peak A). In addition to humic-like materialtryptophan-like and tyrosine-like material as “free”moleculesor bound in amino acids andproteins (commonly referred to aspeaks T and B respectively, (Coble, 1996)) also exhibit fluores-cence at distinctive wavelengths in natural waters. Trypto-phan-like fluorescence (peak T1) occurs in this study at λex/em275–296/330–378 nm while tyrosine-like fluorescence (peak B)was not commonly seen and is not addressed in this work.Peak T also has a shorter wavelength excitation/emission pair(named T2) with excitation at between λex 216–247 nm andemission at between λem 329–378 nm. Tryptophan-like fluor-escencemay be exhibited by natural waters where tryptophanis present as ‘free’ molecules or else bound in proteins,peptides or humic structures. Peaks T and B are related tomicrobial activity (Parlanti et al., 2000) andmay be transportedinto a system (allochthonous) or be created by microbialactivity within a system (autochthonous). For an exampleEEM showing fluorophores common in natural waters seeFig. 1.
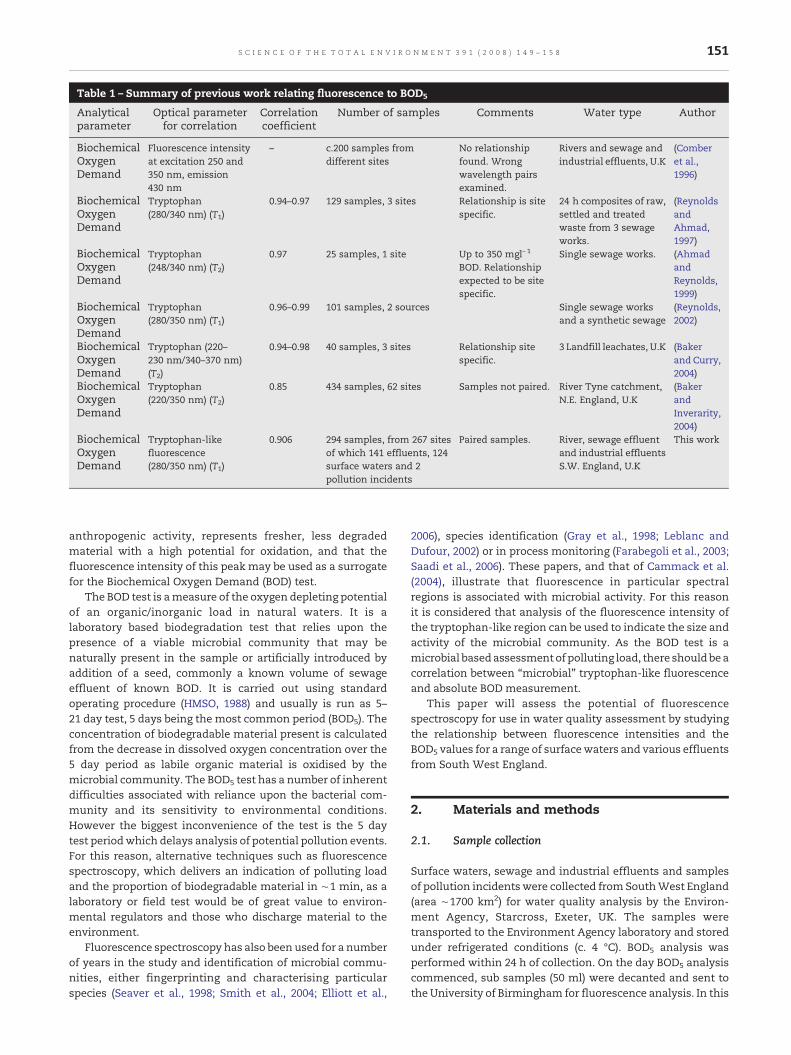
Previous studies have identified different specific wave-lengths of excitation and emission in the study of fluorophoreT1 and its relationship with BOD. These are presented in
Table 1. The variation in wavelengths is likely to be due to thephysical characteristics of individual samples such as pH,metal ions, sample concentration (Vodacek and Philpot, 1987).These factors have not been analysed on a sample by samplebasis for this (or any previous) study. For this reason thewavelengths identified in each individual body of work arepresented with no correction for the contributory factors.Table 1 also illustrates the sample types and number ofsamples used in studies of the BOD/tryptophan-like fluores-cence relationship.
Surface waters are commonly rich in humic-like materialwhich may be allochthonous or autochthonous, and may benew or old, andmore or less bioavailable, with character beinginfluenced by source (Newson et al., 2001; Katsuyama andNobuhito, 2002) and season (Newson et al., 2001). Surfacewaters become more influenced by anthropogenic (human)factors with increasing urbanisation, and demonstrate adifferent organic character dependent upon processes andinputs along the reach (Westerhoff and Anning, 2000). Thefluorescent signature of the water changes with increasinghuman impact from humic-rich (peaks A and C) to proteinrich with A, C, T and B peaks (Galapate et al., 1998; Baker andSpencer, 2004). The T and B peaks are related to bacterialactivity and may represent the presence of a bioavailable,labile organic substrate or the product of microbial or algalactivity (Cammack et al., 2004; Nguyen et al., 2005; Elliott et al.,2006; Urban-Rich et al., 2006).
Waste waters including sewage effluents (Reynolds andAhmad, 1997; Reynolds, 2002; Chen et al., 2003), farm wastes(Baker, 2002) and landfill leachates (Baker and Curry, 2004)have been found to be rich in microbial derived T and Bfluorescence and these peaks have been used as tracers ofwaste waters in natural waters (Baker and Inverarity, 2004;Baker et al., 2004). Reynolds and Ahmad, (1997) determinedthat the sewage treatment process reduced peak T intensity toamuch greater extent than the humic-likeA and C peaks. Thissuggests that the T peak in untreated sewage, derived from
Fig. 1 –Example EEM illustrating positions of T1, T2, C and A peaks.
150 S C I E N C E O F T H E T O T A L E N V I R O N M E N T 3 9 1 ( 2 0 0 8 ) 1 4 9 – 1 5 8
anthropogenic activity, represents fresher, less degradedmaterial with a high potential for oxidation, and that thefluorescence intensity of this peak may be used as a surrogatefor the Biochemical Oxygen Demand (BOD) test.
The BOD test is ameasure of the oxygen depleting potentialof an organic/inorganic load in natural waters. It is alaboratory based biodegradation test that relies upon thepresence of a viable microbial community that may benaturally present in the sample or artificially introduced byaddition of a seed, commonly a known volume of sewageeffluent of known BOD. It is carried out using standardoperating procedure (HMSO, 1988) and usually is run as 5–21 day test, 5 days being the most common period (BOD5). Theconcentration of biodegradable material present is calculatedfrom the decrease in dissolved oxygen concentration over the5 day period as labile organic material is oxidised by themicrobial community. The BOD5 test has a number of inherentdifficulties associated with reliance upon the bacterial com-munity and its sensitivity to environmental conditions.However the biggest inconvenience of the test is the 5 daytest periodwhich delays analysis of potential pollution events.For this reason, alternative techniques such as fluorescencespectroscopy, which delivers an indication of polluting loadand the proportion of biodegradable material in ∼1 min, as alaboratory or field test would be of great value to environ-mental regulators and those who discharge material to theenvironment.
Fluorescence spectroscopy has also been used for a numberof years in the study and identification of microbial commu-nities, either fingerprinting and characterising particularspecies (Seaver et al., 1998; Smith et al., 2004; Elliott et al.,
2006), species identification (Gray et al., 1998; Leblanc andDufour, 2002) or in process monitoring (Farabegoli et al., 2003;Saadi et al., 2006). These papers, and that of Cammack et al.(2004), illustrate that fluorescence in particular spectralregions is associated with microbial activity. For this reasonit is considered that analysis of the fluorescence intensity ofthe tryptophan-like region can be used to indicate the size andactivity of the microbial community. As the BOD test is amicrobial basedassessment of polluting load, there shouldbeacorrelation between “microbial” tryptophan-like fluorescenceand absolute BOD measurement.
This paper will assess the potential of fluorescencespectroscopy for use in water quality assessment by studyingthe relationship between fluorescence intensities and theBOD5 values for a range of surfacewaters and various effluentsfrom South West England.
2. Materials and methods
2.1. Sample collection
Surface waters, sewage and industrial effluents and samplesof pollution incidentswere collected from SouthWest England(area ∼1700 km2) for water quality analysis by the Environ-ment Agency, Starcross, Exeter, UK. The samples weretransported to the Environment Agency laboratory and storedunder refrigerated conditions (c. 4 °C). BOD5 analysis wasperformed within 24 h of collection. On the day BOD5 analysiscommenced, sub samples (50 ml) were decanted and sent tothe University of Birmingham for fluorescence analysis. In this
Table 1 – Summary of previous work relating fluorescence to BOD5
Analyticalparameter
Optical parameterfor correlation
Correlationcoefficient
Number of samples Comments Water type Author
BiochemicalOxygenDemand
Fluorescence intensityat excitation 250 and350 nm, emission430 nm
– c.200 samples fromdifferent sites
No relationshipfound. Wrongwavelength pairsexamined.
Rivers and sewage andindustrial effluents, U.K
(Comberet al.,1996)
BiochemicalOxygenDemand
Tryptophan(280/340 nm) (T1)
0.94–0.97 129 samples, 3 sites Relationship is sitespecific.
24 h composites of raw,settled and treatedwaste from 3 sewageworks.
(ReynoldsandAhmad,1997)
BiochemicalOxygenDemand
Tryptophan(248/340 nm) (T2)
0.97 25 samples, 1 site Up to 350 mgl−1
BOD. Relationshipexpected to be sitespecific.
Single sewage works. (AhmadandReynolds,1999)
BiochemicalOxygenDemand
Tryptophan(280/350 nm) (T1)
0.96–0.99 101 samples, 2 sources Single sewage worksand a synthetic sewage
(Reynolds,2002)
BiochemicalOxygenDemand
Tryptophan (220–230 nm/340–370 nm)(T2)
0.94–0.98 40 samples, 3 sites Relationship sitespecific.
3 Landfill leachates, U.K (Bakerand Curry,2004)
BiochemicalOxygenDemand
Tryptophan(220/350 nm) (T2)
0.85 434 samples, 62 sites Samples not paired. River Tyne catchment,N.E. England, U.K
(BakerandInverarity,2004)
BiochemicalOxygenDemand
Tryptophan-likefluorescence(280/350 nm) (T1)
0.906 294 samples, from 267 sitesof which 141 effluents, 124surface waters and 2pollution incidents
Paired samples. River, sewage effluentand industrial effluentsS.W. England, U.K
This work
151S C I E N C E O F T H E T O T A L E N V I R O N M E N T 3 9 1 ( 2 0 0 8 ) 1 4 9 – 1 5 8
paper the analysis of BOD5 and fluorescence on portions of thesame original sample will be referred to as “paired”. The subsampling was undertaken on 13 occasions over 12 months(March 2005–February 2006) typically with 25 effluent andsurface water samples each occasion. Samples were trans-ported to the University in HDPE bottles, previously washed in10% HCL and rinsed with distilled water, and were stored inthe dark under refrigerated conditions throughout transportand until analysis to reduce possible changes in samplecharacter through microbial or photo degradation. Fluores-cence analysis was performed within 24 h of sample receipt atBirmingham University, which is within 48 h of the start ofBOD5 analysis. Samples were not filtered prior to fluorescenceanalysis in order that fluorescence data could be directlyrelated to BOD5 results for which samples are not filtered. Toreduce the influence of scattering by particles fluorescenceanalysis was performed on settled samples.
2.2. Biochemical Oxygen Demand (BOD5)
BOD5 was analysed by the Environment Agency using themethod described in the HMSO (1988). Dilution waters wereseeded with a known quantity of treated sewage effluent witha known BOD5. For all samples, seeding was conducted after asub sample had been removed for fluorescence analysis.
2.3. Fluorescence spectroscopy
An EEM was generated for each sample using a Varian CaryEclipse fluorescence spectrometer at 20 °C. Excitation andemission were scanned simultaneously at wavelengths from200–400 nm and 280–500 nm respectively at 5 nm intervals,with a 5 nm slit width at 9600 nm/min scan rate. The position(excitation and emission wavelength) and maximum fluores-cence intensity in fluorescence units (AFU) of each peak wasrecorded. No post-manufacturer instrument corrections wereapplied as the same instrument was used for all analysesmaking results comparable and such corrections are onlyusually applied to make data comparable between instru-ments. The Raman line of water at excitation wavelength348 nm was used as a standard to monitor instrumental driftand results are normalised to an intensity of 20 U.
Samples were also analysed for fluorescence using an SMF-2portable fluorimeter (Safe Training Systems, U.K). The SMF-2uses a xenon flash light lamp. Excitation is targeted at 260 nmthrough the use of an interference filter with 85% transmissionin the 260 nm region and zero transmission at 350 nm. A cut offfilter is used to selectively advance the emitted light atwavelengths which have been identified as most appropriatefor the application. The intensity of the fluorescence ismeasured by 250 detectors following a stationary grating. TheSMF-2 is proposed as a fieldmeasurement device for identifyinganthropogenic pollution.
2.4. Total Organic Carbon (TOC)
For comparative reasons total organic carbon was determinedfor all samples. Undiluted samples were analysed for bothtotal carbon and inorganic carbon and the total organic carbonthen calculated. For this a Shimadzu TOC-Vcpn analyser was
used throughout. Total carbon was analysed by combustion ofthe sample at 680 °C with a platinized alumina catalyst andthe resulting CO2 production measured. Total inorganiccarbon was analysed by phosphoric acid digestion combinedwith CO2 determination. From these tests the total organiccarbon was calculated using total carbon — total inorganiccarbon. The instrument was calibrated using total carbon andinorganic carbon 1 molar standards and for each analysis themean of 3 measurements was used. TOC data is brieflypresented in this paper, as a common analytical technique,for comparison with BOD only.
2.5. Sample dilution
Samples with high fluorescence intensities (Nc. 400 IU) uponinitial analysis, or which were visibly turbid, were diluted withlaboratory distilled water (upon which fluorescence analysishad been previously carried out) until fluorescence intensitieswere measurable. Fig. 2 shows that the fluorescence inten-sities of tryptophan-like fluorescence at excitation and emis-sion wavelengths 275/340 nm demonstrate a quasi-linearrelationship with BOD5 upon dilution. This demonstrates thatno step change in response occurred with increasing dilution,suggesting that minimal inner filtering (reabsorption ofemitted energy by surrounding molecules in concentratedsolutions) was observed even at high concentrations. How-ever, to standardize the approach to inner filtering the datapresented is from samples with minimal or no dilution andany errors as a result of this phenomenon are incorporatedwithin the error of the relationships observed.
3. Results
469 samples (246 “surface waters” and 223 “effluents”,comprising sewage effluents, trade effluents and samplesfrom pollution events of unknown origin) were analysed forfluorescence and BOD5.
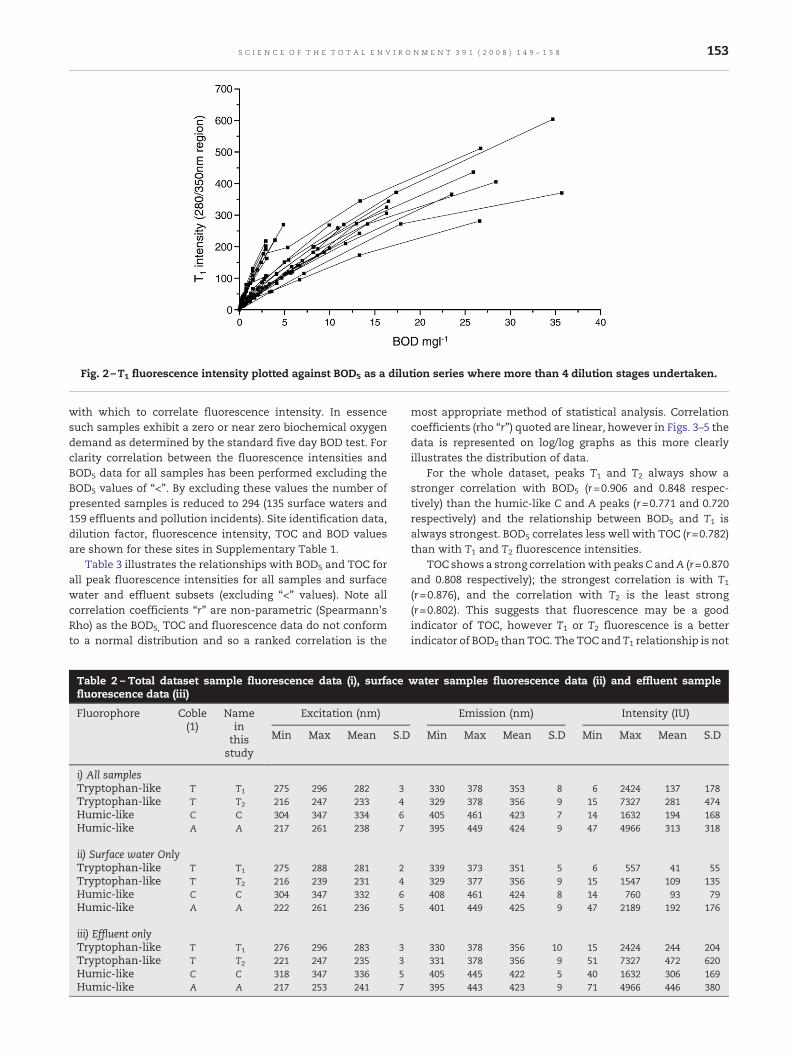
Peaks T and B have two emission peaks. Here peak Twill bereferred to as T1 or T2 (T1 λex/em 280/350 nm, T2 λex/em 215–220/340 nm) and peak B results are excluded from this study as itwas rarely observed in these samples. Table 2 illustrates thegeneral fluorescence character of i) all samples ii) surfacewater samples and iii) effluent samples. Surface waterscontained humic-like material with peak A (λex/em 260/380–460 nm) being more intense than peak C (λex/em 380/420–480 nm). Peaks T1 and T2 were commonly present and variedin fluorescence intensities. T2 fluorescence intensities werealways greater than T1 (average ratio 2.94). Throughout thisstudy only 2 surface water samples required dilution. Sewageeffluents contained peaks T1 and T2 at greater intensities thansurface waters with T2 intensity exceeding that of T1 (averageratio 1.87). In some samples peak A was obscured by thefluorescence of peak T2 only becoming measurable as a peakafter dilution. In total 15 sewage samples required dilutionprior to fluorescence analysis.
The fluorescence intensities (AFU) of each peak werecorrelated with BOD5 (mgL−1). Samples with oxygen depletionless than 1 mg L−1 over 5 days are quoted by the EnvironmentAgency as a “<” BOD5 value and have no true numerical value
152 S C I E N C E O F T H E T O T A L E N V I R O N M E N T 3 9 1 ( 2 0 0 8 ) 1 4 9 – 1 5 8
with which to correlate fluorescence intensity. In essencesuch samples exhibit a zero or near zero biochemical oxygendemand as determined by the standard five day BOD test. Forclarity correlation between the fluorescence intensities andBOD5 data for all samples has been performed excluding theBOD5 values of “<”. By excluding these values the number ofpresented samples is reduced to 294 (135 surface waters and159 effluents and pollution incidents). Site identification data,dilution factor, fluorescence intensity, TOC and BOD valuesare shown for these sites in Supplementary Table 1.
Table 3 illustrates the relationships with BOD5 and TOC forall peak fluorescence intensities for all samples and surfacewater and effluent subsets (excluding “<” values). Note allcorrelation coefficients “r” are non-parametric (Spearmann'sRho) as the BOD5, TOC and fluorescence data do not conformto a normal distribution and so a ranked correlation is the
most appropriate method of statistical analysis. Correlationcoefficients (rho “r”) quoted are linear, however in Figs. 3–5 thedata is represented on log/log graphs as this more clearlyillustrates the distribution of data.
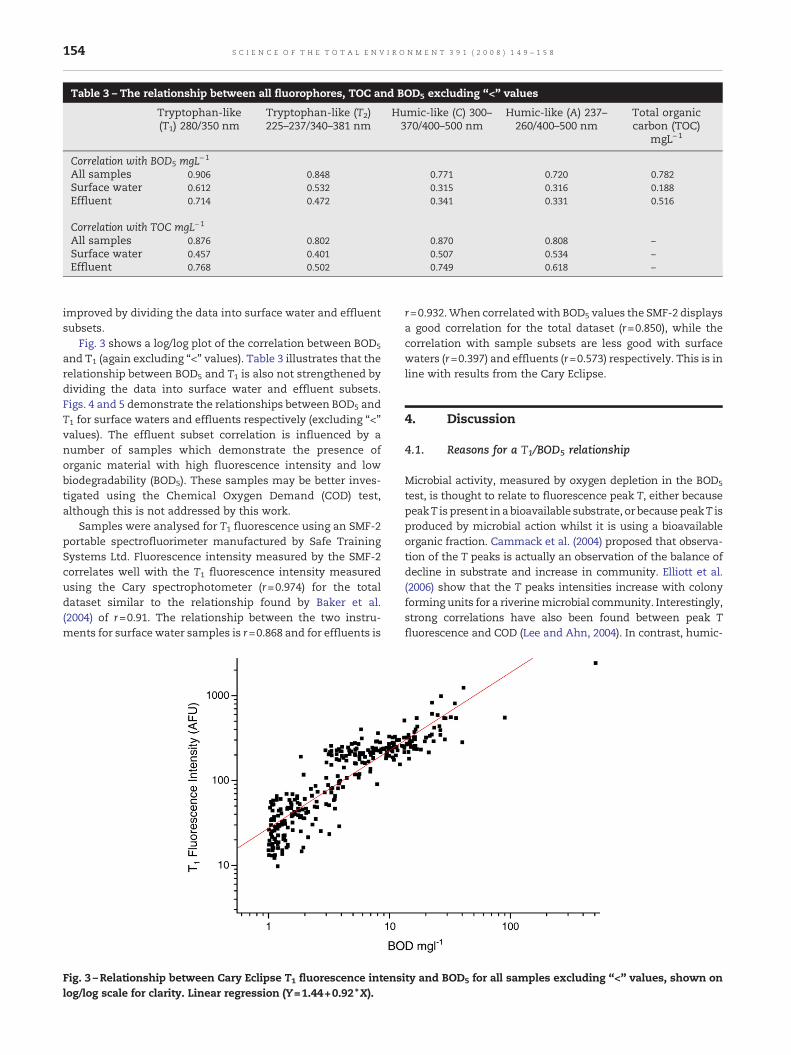
For the whole dataset, peaks T1 and T2 always show astronger correlation with BOD5 (r=0.906 and 0.848 respec-tively) than the humic-like C and A peaks (r=0.771 and 0.720respectively) and the relationship between BOD5 and T1 isalways strongest. BOD5 correlates less well with TOC (r=0.782)than with T1 and T2 fluorescence intensities.
TOC shows a strong correlationwith peaksC andA (r=0.870and 0.808 respectively); the strongest correlation is with T1
(r=0.876), and the correlation with T2 is the least strong(r=0.802). This suggests that fluorescence may be a goodindicator of TOC, however T1 or T2 fluorescence is a betterindicator of BOD5 than TOC. The TOC and T1 relationship is not
Table 2 – Total dataset sample fluorescence data (i), surface water samples fluorescence data (ii) and effluent samplefluorescence data (iii)
Fluorophore Coble(1)
Nameinthisstudy
Excitation (nm) Emission (nm) Intensity (IU)
Min Max Mean S.D Min Max Mean S.D Min Max Mean S.D
i) All samplesTryptophan-like T T1 275 296 282 3 330 378 353 8 6 2424 137 178Tryptophan-like T T2 216 247 233 4 329 378 356 9 15 7327 281 474Humic-like C C 304 347 334 6 405 461 423 7 14 1632 194 168Humic-like A A 217 261 238 7 395 449 424 9 47 4966 313 318
ii) Surface water OnlyTryptophan-like T T1 275 288 281 2 339 373 351 5 6 557 41 55Tryptophan-like T T2 216 239 231 4 329 377 356 9 15 1547 109 135Humic-like C C 304 347 332 6 408 461 424 8 14 760 93 79Humic-like A A 222 261 236 5 401 449 425 9 47 2189 192 176
iii) Effluent onlyTryptophan-like T T1 276 296 283 3 330 378 356 10 15 2424 244 204Tryptophan-like T T2 221 247 235 3 331 378 356 9 51 7327 472 620Humic-like C C 318 347 336 5 405 445 422 5 40 1632 306 169Humic-like A A 217 253 241 7 395 443 423 9 71 4966 446 380
Fig. 2 –T1 fluorescence intensity plotted against BOD5 as a dilution series where more than 4 dilution stages undertaken.
153S C I E N C E O F T H E T O T A L E N V I R O N M E N T 3 9 1 ( 2 0 0 8 ) 1 4 9 – 1 5 8
improved by dividing the data into surface water and effluentsubsets.
Fig. 3 shows a log/log plot of the correlation between BOD5
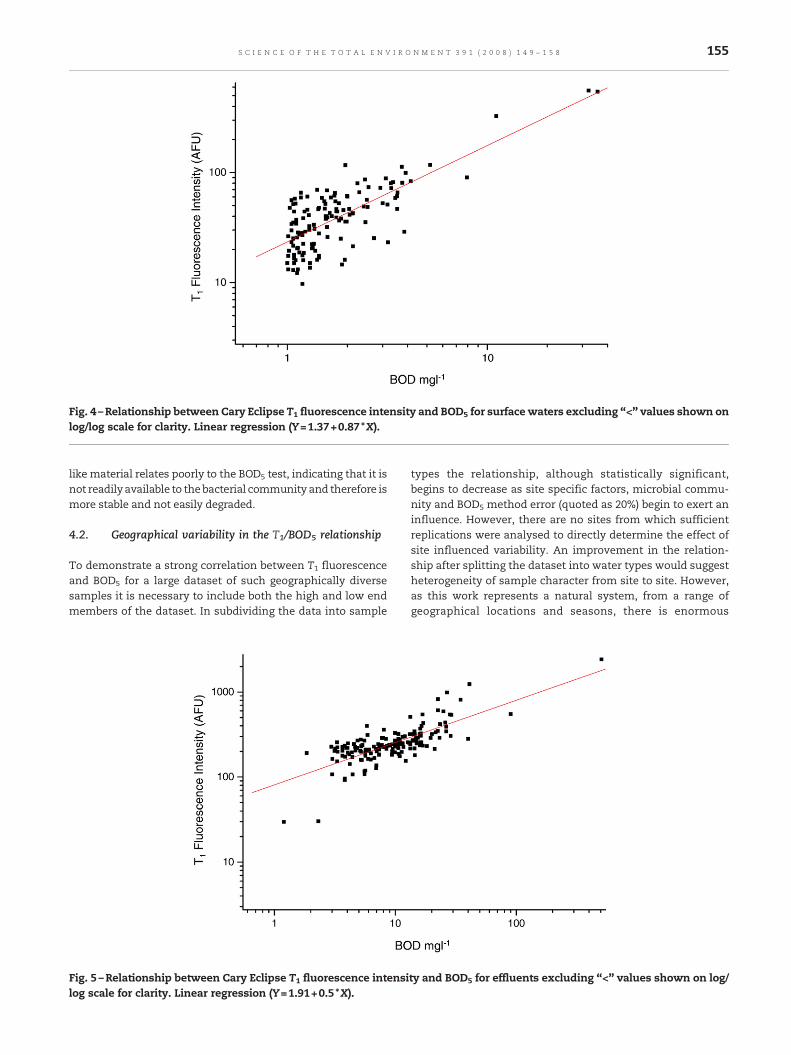
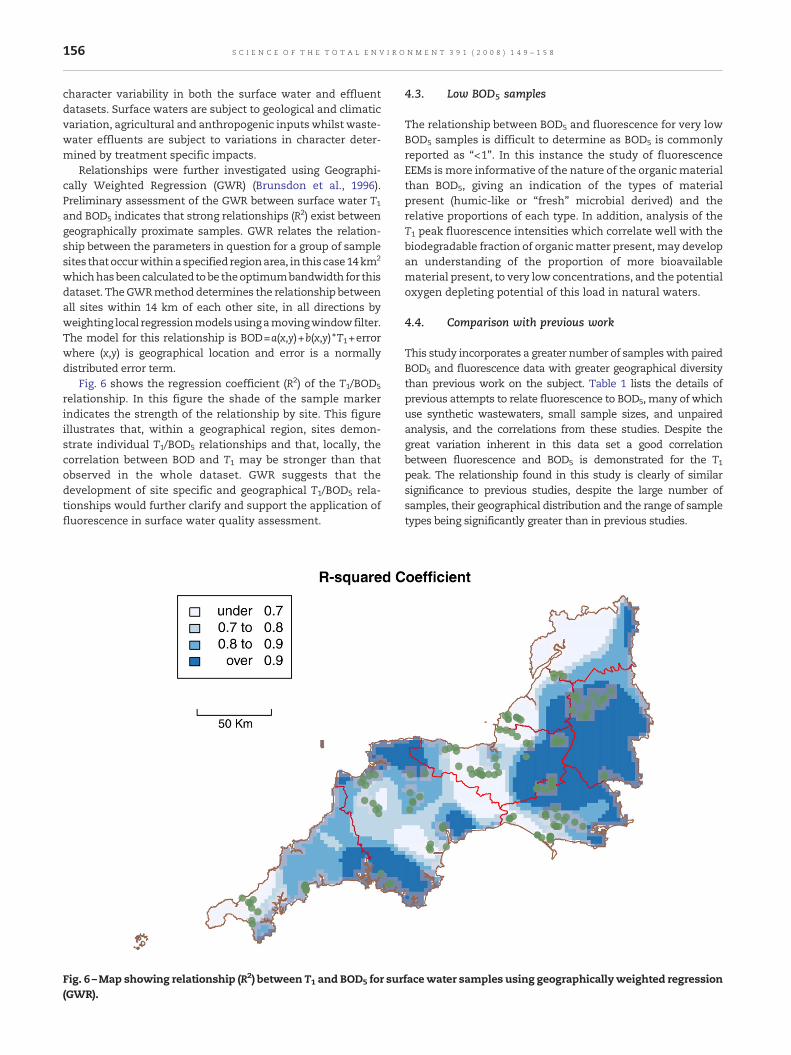
and T1 (again excluding “<” values). Table 3 illustrates that therelationship between BOD5 and T1 is also not strengthened bydividing the data into surface water and effluent subsets.Figs. 4 and 5 demonstrate the relationships between BOD5 andT1 for surface waters and effluents respectively (excluding “<”values). The effluent subset correlation is influenced by anumber of samples which demonstrate the presence oforganic material with high fluorescence intensity and lowbiodegradability (BOD5). These samples may be better inves-tigated using the Chemical Oxygen Demand (COD) test,although this is not addressed by this work.
Samples were analysed for T1 fluorescence using an SMF-2portable spectrofluorimeter manufactured by Safe TrainingSystems Ltd. Fluorescence intensity measured by the SMF-2correlates well with the T1 fluorescence intensity measuredusing the Cary spectrophotometer (r=0.974) for the totaldataset similar to the relationship found by Baker et al.(2004) of r=0.91. The relationship between the two instru-ments for surface water samples is r=0.868 and for effluents is
r=0.932.When correlatedwith BOD5 values the SMF-2 displaysa good correlation for the total dataset (r=0.850), while thecorrelation with sample subsets are less good with surfacewaters (r=0.397) and effluents (r=0.573) respectively. This is inline with results from the Cary Eclipse.
4. Discussion
4.1. Reasons for a T1/BOD5 relationship
Microbial activity, measured by oxygen depletion in the BOD5
test, is thought to relate to fluorescence peak T, either becausepeakT is present in a bioavailable substrate, or because peakT isproduced by microbial action whilst it is using a bioavailableorganic fraction. Cammack et al. (2004) proposed that observa-tion of the T peaks is actually an observation of the balance ofdecline in substrate and increase in community. Elliott et al.(2006) show that the T peaks intensities increase with colonyforming units for a riverinemicrobial community. Interestingly,strong correlations have also been found between peak Tfluorescence and COD (Lee and Ahn, 2004). In contrast, humic-
Fig. 3 –Relationship between Cary Eclipse T1 fluorescence intensity and BOD5 for all samples excluding “<” values, shown onlog/log scale for clarity. Linear regression (Y=1.44+0.92*X).
Table 3 – The relationship between all fluorophores, TOC and BOD5 excluding “<" values
Tryptophan-like(T1) 280/350 nm
Tryptophan-like (T2)225–237/340–381 nm
Humic-like (C) 300–370/400–500 nm
Humic-like (A) 237–260/400–500 nm
Total organiccarbon (TOC)
mgL−1
Correlation with BOD5 mgL−1
All samples 0.906 0.848 0.771 0.720 0.782Surface water 0.612 0.532 0.315 0.316 0.188Effluent 0.714 0.472 0.341 0.331 0.516
Correlation with TOC mgL−1
All samples 0.876 0.802 0.870 0.808 –Surface water 0.457 0.401 0.507 0.534 –Effluent 0.768 0.502 0.749 0.618 –
154 S C I E N C E O F T H E T O T A L E N V I R O N M E N T 3 9 1 ( 2 0 0 8 ) 1 4 9 – 1 5 8
like material relates poorly to the BOD5 test, indicating that it isnot readilyavailable to thebacterial community and therefore ismore stable and not easily degraded.
4.2. Geographical variability in the T1/BOD5 relationship
To demonstrate a strong correlation between T1 fluorescenceand BOD5 for a large dataset of such geographically diversesamples it is necessary to include both the high and low endmembers of the dataset. In subdividing the data into sample
types the relationship, although statistically significant,begins to decrease as site specific factors, microbial commu-nity and BOD5 method error (quoted as 20%) begin to exert aninfluence. However, there are no sites from which sufficientreplications were analysed to directly determine the effect ofsite influenced variability. An improvement in the relation-ship after splitting the dataset into water types would suggestheterogeneity of sample character from site to site. However,as this work represents a natural system, from a range ofgeographical locations and seasons, there is enormous
Fig. 5 –Relationship between Cary Eclipse T1 fluorescence intensity and BOD5 for effluents excluding “<” values shown on log/log scale for clarity. Linear regression (Y=1.91+0.5*X).
Fig. 4 –Relationship between Cary Eclipse T1 fluorescence intensity and BOD5 for surfacewaters excluding “<” values shown onlog/log scale for clarity. Linear regression (Y=1.37+0.87*X).
155S C I E N C E O F T H E T O T A L E N V I R O N M E N T 3 9 1 ( 2 0 0 8 ) 1 4 9 – 1 5 8
character variability in both the surface water and effluentdatasets. Surface waters are subject to geological and climaticvariation, agricultural and anthropogenic inputs whilst waste-water effluents are subject to variations in character deter-mined by treatment specific impacts.
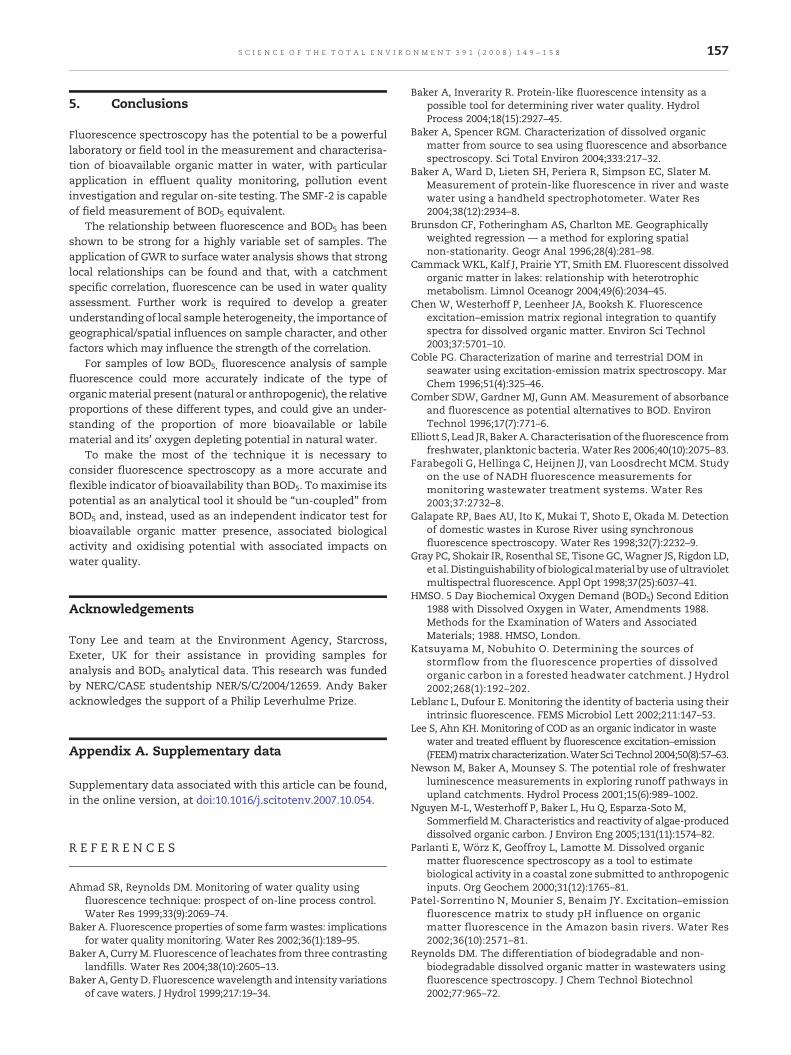
Relationships were further investigated using Geographi-cally Weighted Regression (GWR) (Brunsdon et al., 1996).Preliminary assessment of the GWR between surface water T1and BOD5 indicates that strong relationships (R2) exist betweengeographically proximate samples. GWR relates the relation-ship between the parameters in question for a group of samplesites that occurwithina specified regionarea, in this case14km2
whichhasbeencalculated tobe theoptimumbandwidth for thisdataset. TheGWRmethod determines the relationship betweenall sites within 14 km of each other site, in all directions byweighting local regressionmodelsusingamovingwindowfilter.The model for this relationship is BOD=a(x,y)+b(x,y) ⁎T1+errorwhere (x,y) is geographical location and error is a normallydistributed error term.
Fig. 6 shows the regression coefficient (R2) of the T1/BOD5
relationship. In this figure the shade of the sample markerindicates the strength of the relationship by site. This figureillustrates that, within a geographical region, sites demon-strate individual T1/BOD5 relationships and that, locally, thecorrelation between BOD and T1 may be stronger than thatobserved in the whole dataset. GWR suggests that thedevelopment of site specific and geographical T1/BOD5 rela-tionships would further clarify and support the application offluorescence in surface water quality assessment.
4.3. Low BOD5 samples
The relationship between BOD5 and fluorescence for very lowBOD5 samples is difficult to determine as BOD5 is commonlyreported as “<1”. In this instance the study of fluorescenceEEMs is more informative of the nature of the organicmaterialthan BOD5, giving an indication of the types of materialpresent (humic-like or “fresh” microbial derived) and therelative proportions of each type. In addition, analysis of theT1 peak fluorescence intensities which correlate well with thebiodegradable fraction of organicmatter present, may developan understanding of the proportion of more bioavailablematerial present, to very low concentrations, and the potentialoxygen depleting potential of this load in natural waters.
4.4. Comparison with previous work
This study incorporates a greater number of sampleswith pairedBOD5 and fluorescence data with greater geographical diversitythan previous work on the subject. Table 1 lists the details ofprevious attempts to relate fluorescence to BOD5, many of whichuse synthetic wastewaters, small sample sizes, and unpairedanalysis, and the correlations from these studies. Despite thegreat variation inherent in this data set a good correlationbetween fluorescence and BOD5 is demonstrated for the T1peak. The relationship found in this study is clearly of similarsignificance to previous studies, despite the large number ofsamples, their geographical distribution and the range of sampletypes being significantly greater than in previous studies.
Fig. 6 –Map showing relationship (R2) between T1 and BOD5 for surfacewater samples using geographicallyweighted regression(GWR).
156 S C I E N C E O F T H E T O T A L E N V I R O N M E N T 3 9 1 ( 2 0 0 8 ) 1 4 9 – 1 5 8
5. Conclusions
Fluorescence spectroscopy has the potential to be a powerfullaboratory or field tool in the measurement and characterisa-tion of bioavailable organic matter in water, with particularapplication in effluent quality monitoring, pollution eventinvestigation and regular on-site testing. The SMF-2 is capableof field measurement of BOD5 equivalent.
The relationship between fluorescence and BOD5 has beenshown to be strong for a highly variable set of samples. Theapplication of GWR to surface water analysis shows that stronglocal relationships can be found and that, with a catchmentspecific correlation, fluorescence can be used in water qualityassessment. Further work is required to develop a greaterunderstanding of local sample heterogeneity, the importance ofgeographical/spatial influences on sample character, and otherfactors which may influence the strength of the correlation.
For samples of low BOD5, fluorescence analysis of samplefluorescence could more accurately indicate of the type oforganicmaterial present (natural or anthropogenic), the relativeproportions of these different types, and could give an under-standing of the proportion of more bioavailable or labilematerial and its' oxygen depleting potential in natural water.
To make the most of the technique it is necessary toconsider fluorescence spectroscopy as a more accurate andflexible indicator of bioavailability than BOD5. Tomaximise itspotential as an analytical tool it should be “un-coupled” fromBOD5 and, instead, used as an independent indicator test forbioavailable organic matter presence, associated biologicalactivity and oxidising potential with associated impacts onwater quality.
Acknowledgements
Tony Lee and team at the Environment Agency, Starcross,Exeter, UK for their assistance in providing samples foranalysis and BOD5 analytical data. This research was fundedby NERC/CASE studentship NER/S/C/2004/12659. Andy Bakeracknowledges the support of a Philip Leverhulme Prize.
Appendix A. Supplementary data
Supplementary data associated with this article can be found,in the online version, at doi:10.1016/j.scitotenv.2007.10.054.
R E F E R E N C E S
Ahmad SR, Reynolds DM. Monitoring of water quality usingfluorescence technique: prospect of on-line process control.Water Res 1999;33(9):2069–74.
Baker A. Fluorescence properties of some farmwastes: implicationsfor water quality monitoring. Water Res 2002;36(1):189–95.
Baker A, CurryM. Fluorescence of leachates from three contrastinglandfills. Water Res 2004;38(10):2605–13.
Baker A, Genty D. Fluorescencewavelength and intensity variationsof cave waters. J Hydrol 1999;217:19–34.
Baker A, Inverarity R. Protein-like fluorescence intensity as apossible tool for determining river water quality. HydrolProcess 2004;18(15):2927–45.
Baker A, Spencer RGM. Characterization of dissolved organicmatter from source to sea using fluorescence and absorbancespectroscopy. Sci Total Environ 2004;333:217–32.
Baker A, Ward D, Lieten SH, Periera R, Simpson EC, Slater M.Measurement of protein-like fluorescence in river and wastewater using a handheld spectrophotometer. Water Res2004;38(12):2934–8.
Brunsdon CF, Fotheringham AS, Charlton ME. Geographicallyweighted regression — a method for exploring spatialnon-stationarity. Geogr Anal 1996;28(4):281–98.
CammackWKL, Kalf J, Prairie YT, Smith EM. Fluorescent dissolvedorganic matter in lakes: relationship with heterotrophicmetabolism. Limnol Oceanogr 2004;49(6):2034–45.
Chen W, Westerhoff P, Leenheer JA, Booksh K. Fluorescenceexcitation–emission matrix regional integration to quantifyspectra for dissolved organic matter. Environ Sci Technol2003;37:5701–10.
Coble PG. Characterization of marine and terrestrial DOM inseawater using excitation-emission matrix spectroscopy. MarChem 1996;51(4):325–46.
Comber SDW, Gardner MJ, Gunn AM. Measurement of absorbanceand fluorescence as potential alternatives to BOD. EnvironTechnol 1996;17(7):771–6.
Elliott S, Lead JR, BakerA. Characterisation of the fluorescence fromfreshwater, planktonic bacteria. Water Res 2006;40(10):2075–83.
Farabegoli G, Hellinga C, Heijnen JJ, van Loosdrecht MCM. Studyon the use of NADH fluorescence measurements formonitoring wastewater treatment systems. Water Res2003;37:2732–8.
Galapate RP, Baes AU, Ito K, Mukai T, Shoto E, Okada M. Detectionof domestic wastes in Kurose River using synchronousfluorescence spectroscopy. Water Res 1998;32(7):2232–9.
Gray PC, Shokair IR, Rosenthal SE, Tisone GC, Wagner JS, Rigdon LD,et al. Distinguishability of biologicalmaterial byuse of ultravioletmultispectral fluorescence. Appl Opt 1998;37(25):6037–41.
HMSO. 5 Day Biochemical Oxygen Demand (BOD5) Second Edition1988 with Dissolved Oxygen in Water, Amendments 1988.Methods for the Examination of Waters and AssociatedMaterials; 1988. HMSO, London.
Katsuyama M, Nobuhito O. Determining the sources ofstormflow from the fluorescence properties of dissolvedorganic carbon in a forested headwater catchment. J Hydrol2002;268(1):192–202.
Leblanc L, Dufour E. Monitoring the identity of bacteria using theirintrinsic fluorescence. FEMS Microbiol Lett 2002;211:147–53.
Lee S, Ahn KH. Monitoring of COD as an organic indicator in wastewater and treated effluent by fluorescence excitation–emission(FEEM)matrix characterization.WaterSciTechnol2004;50(8):57–63.
Newson M, Baker A, Mounsey S. The potential role of freshwaterluminescence measurements in exploring runoff pathways inupland catchments. Hydrol Process 2001;15(6):989–1002.
Nguyen M-L, Westerhoff P, Baker L, Hu Q, Esparza-Soto M,SommerfieldM. Characteristics and reactivity of algae-produceddissolved organic carbon. J Environ Eng 2005;131(11):1574–82.
Parlanti E, Wörz K, Geoffroy L, Lamotte M. Dissolved organicmatter fluorescence spectroscopy as a tool to estimatebiological activity in a coastal zone submitted to anthropogenicinputs. Org Geochem 2000;31(12):1765–81.
Patel-Sorrentino N, Mounier S, Benaim JY. Excitation–emissionfluorescence matrix to study pH influence on organicmatter fluorescence in the Amazon basin rivers. Water Res2002;36(10):2571–81.
Reynolds DM. The differentiation of biodegradable and non-biodegradable dissolved organic matter in wastewaters usingfluorescence spectroscopy. J Chem Technol Biotechnol2002;77:965–72.
157S C I E N C E O F T H E T O T A L E N V I R O N M E N T 3 9 1 ( 2 0 0 8 ) 1 4 9 – 1 5 8

Reynolds DM, Ahmad SR. Rapid and direct determination ofwastewater BOD values using a fluorescence technique. WaterRes 1997;31(8):2012–8.
Saadi I, Borisover M, Armon R, Laor Y. Monitoring of effluent DOMbiodegradation using fluorescence, UV and DOCmeasurements.Chemosphere 2006;63:530–539.
Seaver M, Roselle DC, Pinto JF, Eversole JD. Absolute emissionspectra from Bacillus subtilis and Escherichia coli vegetativecells in solution. Appl Opt 1998;37(22).
Smith CB, Anderson JE, Webb SR. Detection of Bacillus endosporesusing total luminescence spectroscopy. Spectrochim Acta, PartA 2004;60(11):2517–21.
Urban-Rich J, McCarty JT, Fernández D, Acuña JL. Larvaceans andcopepods excrete fluorescent dissolved organic matter (FDOM).J Exp Mar Biol Ecol 2006;332:96–105.
Vodacek A, Philpot WD. Environmental effects on laser-inducedfluorescence spectra of natural waters. Remote Sens Environ1987;21(1):83–95.
Westerhoff P, Anning D. Concentrations and characteristics oforganic carbon in surface water in Arizona: influence ofurbanization. J Hydrol 2000;236(3):202–22.
158 S C I E N C E O F T H E T O T A L E N V I R O N M E N T 3 9 1 ( 2 0 0 8 ) 1 4 9 – 1 5 8