Embed Size (px)
Citation preview

Can "good" HR practices be exported?
Evidence from a field experiment in
Ghana Oriana Bandiera
a and Freg Fischer
b
a London School of Economics (contact: [email protected]) and b London School of Economics (contact:
May 2013

Can “good” HR practices be exported? Evidence from a field experiment in Ghana
Oriana Bandiera† Greg Fischer LSE LSE
January 2013
ABSTRACT
Incentive pay is a key component of management strategy, and yet field evidence on the
impacts of both individual and team incentives is limited to studies carried out in high-income
countries. The mechanisms that lie behind individual responses to incentives go far beyond
rational considerations of wage maximization, and encompass concerns for social visibility,
preferences for collective work and other behavioral norms. These norms tend to vary by
culture, potentially creating considerable heterogeneity in responses to incentives across
countries. We present evidence from a field experiment designed to evaluate the impact of
individual and group monetary incentives and individual and group rank incentives in Accra,
Ghana. We precisely estimate that, contrary to earlier findings in other settings, these
incentives have no impact on productivity, work quality and firm profitability. The findings
indicate that more research is needed to shed light on the cultural characteristics of the setting
that determines whether performance pay is effective.
† We are indebted to Michael Goodwin and Alex Nisichenko for outstanding project management and research
assistance during the course of this project.
1
Table of Contents INTRODUCTION ............................................................................................................................................. 2
THE CONTEXT AND FIELD EXPERIMENT ........................................................................................................ 3
BASELINE DATA AND BALANCE ACROSS TREATMENT ................................................................................ 11
MODEL: INCENTIVES AND PRODUCTIVITY .................................................................................................. 14
IMPACT: PRODUCTIVITY, ACCURACY AND PROFITABILITY ......................................................................... 15
CONCLUSIONS ............................................................................................................................................. 21
REFERENCES ................................................................................................................................................ 22
TABLES ......................................................................................................................................................... 24
APPENDICES ................................................................................................................................................ 31
2
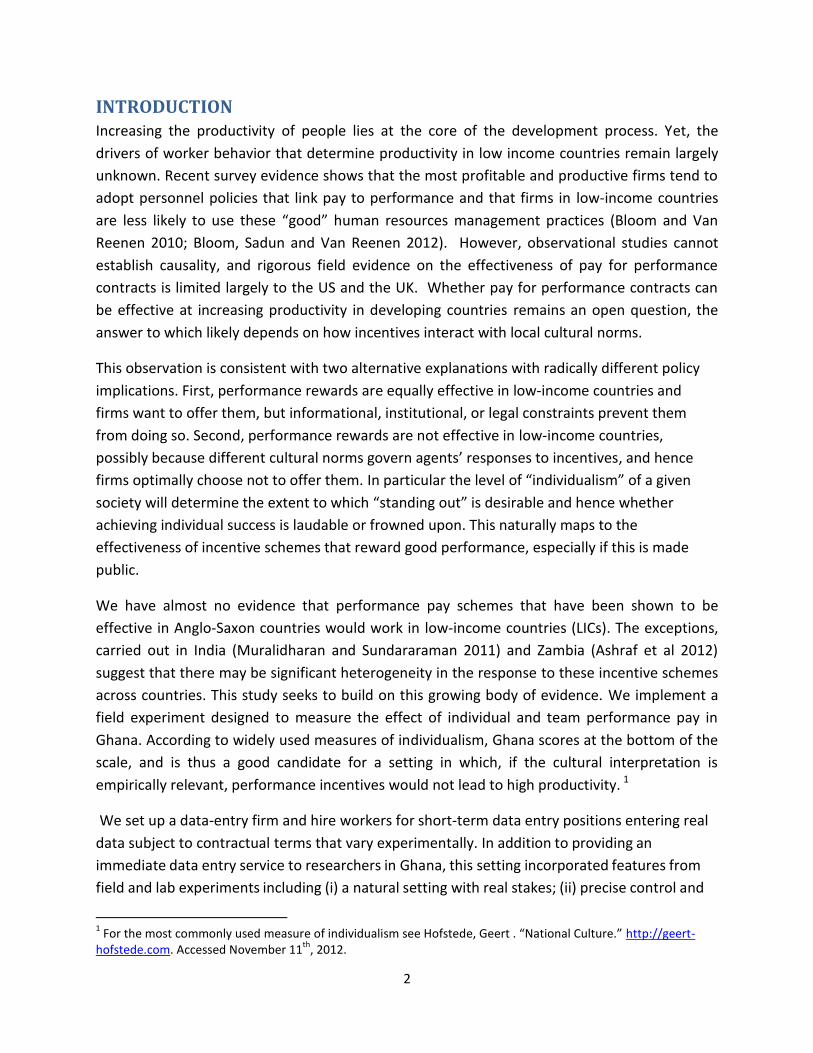
INTRODUCTION Increasing the productivity of people lies at the core of the development process. Yet, the
drivers of worker behavior that determine productivity in low income countries remain largely
unknown. Recent survey evidence shows that the most profitable and productive firms tend to
adopt personnel policies that link pay to performance and that firms in low-income countries
are less likely to use these “good” human resources management practices (Bloom and Van
Reenen 2010; Bloom, Sadun and Van Reenen 2012). However, observational studies cannot
establish causality, and rigorous field evidence on the effectiveness of pay for performance
contracts is limited largely to the US and the UK. Whether pay for performance contracts can
be effective at increasing productivity in developing countries remains an open question, the
answer to which likely depends on how incentives interact with local cultural norms.
This observation is consistent with two alternative explanations with radically different policy
implications. First, performance rewards are equally effective in low-income countries and
firms want to offer them, but informational, institutional, or legal constraints prevent them
from doing so. Second, performance rewards are not effective in low-income countries,
possibly because different cultural norms govern agents’ responses to incentives, and hence
firms optimally choose not to offer them. In particular the level of “individualism” of a given
society will determine the extent to which “standing out” is desirable and hence whether
achieving individual success is laudable or frowned upon. This naturally maps to the
effectiveness of incentive schemes that reward good performance, especially if this is made
public.
We have almost no evidence that performance pay schemes that have been shown to be
effective in Anglo-Saxon countries would work in low-income countries (LICs). The exceptions,
carried out in India (Muralidharan and Sundararaman 2011) and Zambia (Ashraf et al 2012)
suggest that there may be significant heterogeneity in the response to these incentive schemes
across countries. This study seeks to build on this growing body of evidence. We implement a
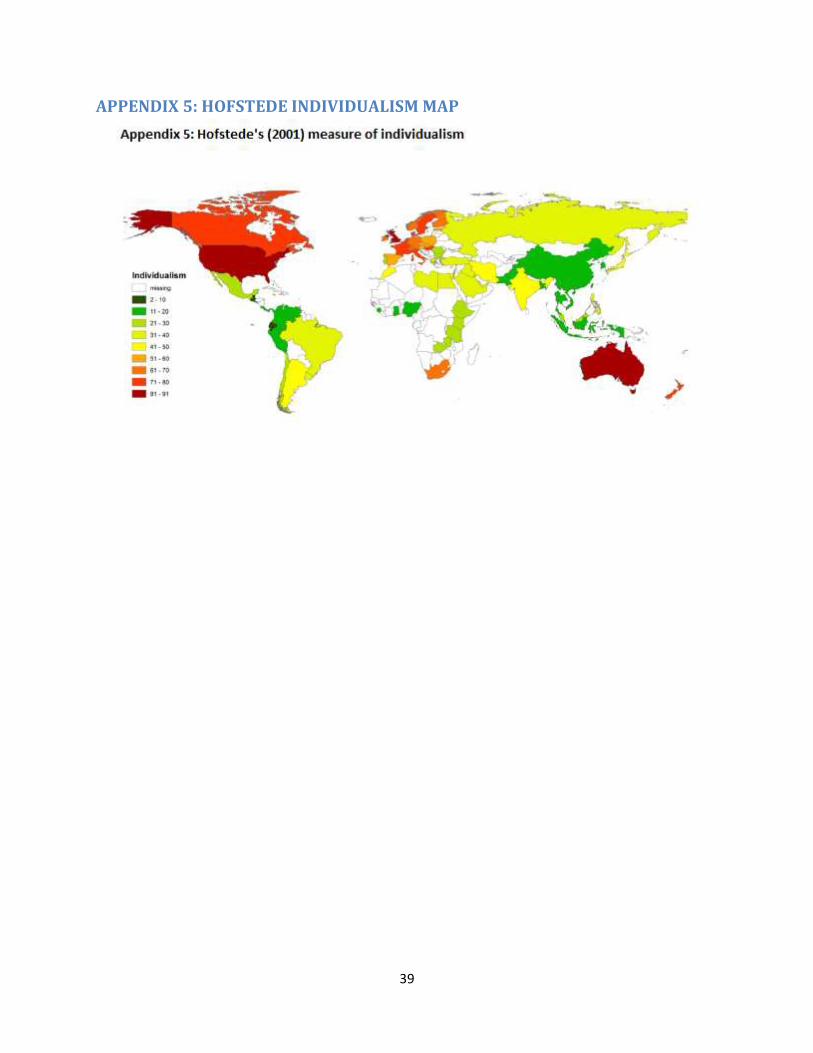
field experiment designed to measure the effect of individual and team performance pay in
Ghana. According to widely used measures of individualism, Ghana scores at the bottom of the
scale, and is thus a good candidate for a setting in which, if the cultural interpretation is
empirically relevant, performance incentives would not lead to high productivity. 1
We set up a data-entry firm and hire workers for short-term data entry positions entering real
data subject to contractual terms that vary experimentally. In addition to providing an
immediate data entry service to researchers in Ghana, this setting incorporated features from
field and lab experiments including (i) a natural setting with real stakes; (ii) precise control and
1 For the most commonly used measure of individualism see Hofstede, Geert . “National Culture.” http://geert-
hofstede.com. Accessed November 11th
, 2012.
3
measurement and (iii) comparable task variation within country. The experiment recruited
subjects who would normally work in data entry and their participation in the experiment
followed conditions typical for data entry jobs. We structured the experimental treatments to
explore existing “real world” incentive schemes and to test variation that interacts with
documented differences in preferences for individualism vs. collectivism (Hofstede, 2001;
Gelfand et al, 2007). The treatments include: flat wage, individual piece rate (IPR) and group
piece rate (GPR) contracts. To disentangle financial incentives from cultural factors related to
the visibility of individual achievements, we will also vary the visibility of performance in these
treatments by providing ranking of relative worker performance at set intervals throughout the
two-day contract. In a culture where individualism is not held in high regard, the public vs.
private comparison within the individual piece rate treatment will allow us to test whether
individuals do not respond to piece rates because they are concerned about others seeing them
deviating from the cultural norm or because the norm is hard-wired.
We find that performance rewards, both individual and team-based, do not increase
productivity, work quality or firm profitability: workers who are offered performance rewards
are not significantly more productive than their colleagues who receive hourly wages. These
estimates are in line with evidence from Zambia (Ashraf et al 2012). The findings are not driven
by the visibility of the rewards: incentives are equally ineffective regardless of whether
performance is made public. Overall the findings indicate that more research is needed to
explore the effectiveness of performance pay in different cultural settings, and to provide
evidence whether responses to incentives are indeed driven by differences in individualism.
THE CONTEXT AND FIELD EXPERIMENT
Why data entry?
To study the impact of different incentive contracts on firm productivity, we established a
model firm in Accra, Ghana. The model firm needed to be highly realistic and with work
productivity and quality that could be easily and accurately quantified and measured. To this
end, we founded a data entry firm in Ghana that would digitize a variety of different surveys on
behalf of Innovations for Poverty Action (IPA) over the course of the ten-month experiment.
We called this data entry firm IPA Data Services and advertised it to applicants and workers as
an entity dedicated to data entry.
Data entry is a task representative of the type of employment available to individuals with a
secondary education in LICs. Under the umbrella of Business Process Outsourcing (BPO), data
entry and similar tasks are being shifted to LICs to take advantage of lower labor costs there.
Data entry is therefore a common economic activity in LICs, including Ghana, and one that will
likely continue to grow as companies continue to outsource back office tasks. All workers

4
involved in this experiment were people who would normally work in data entry. We hired
them through normal channels and paid them a typical wage.
Data entry has a second advantage of being highly measureable. By definition, workers, also
known as data entry operators or DEOs, carry out all work on computers in custom-made data
entry interfaces. We used these interfaces, along with statistical analysis programs, to measure
worker productivity over time in key strokes per hour. Data entry therefore gives us an
extremely accurate and precise overview of worker behavior over time.
Structure of the firm
We established our firm in the Osu neighborhood of Accra, Ghana in September 2010. The
office space consisted of four rooms: one waiting room, one managerial office, and two
separate rooms for employees, with total space for five employees in each room (Appendix 1).
The office contained ten identical ten-inch netbooks with entry via both the keyboard and a
separate num pad. We disabled internet connectivity on the netbooks and removed extraneous
programs to ensure that workers had equivalent workstations with minimal distractions. A
Wireless Local Area Network (WLAN) connected these computers to a central server computer,
which permitted the manager to monitor worker progress via a specialized desktop monitoring
program, further reducing the propensity to engage in non-work activities. This also enabled
the manager to electronically collect worker output and generate wages at the end of contracts
based on productivity. Workers sat at common tables rather than desks, with up to five people
per table per room. The manager had recently worked at a local data entry firm, and so had
deep experience in the process of managing workers and ensuring compliance with office
policies. The office space, IT systems, and managerial capacity allowed the experiment to assess
up to ten workers at a time, and many more during the firm’s mass-interview process.
Recruitment
The recruitment process occurred over the course of two months, October to November 2010.
Managerial staff posted an advertisement on JobsinGhana.com, one of Ghana’s leading
recruitment websites (Appendix 2). The advertisement required prospective employees to have
a minimum of a secondary education, knowledge of computer applications, advanced English
skills and to be at least eighteen years old. In the course of the two-month recruitment period,
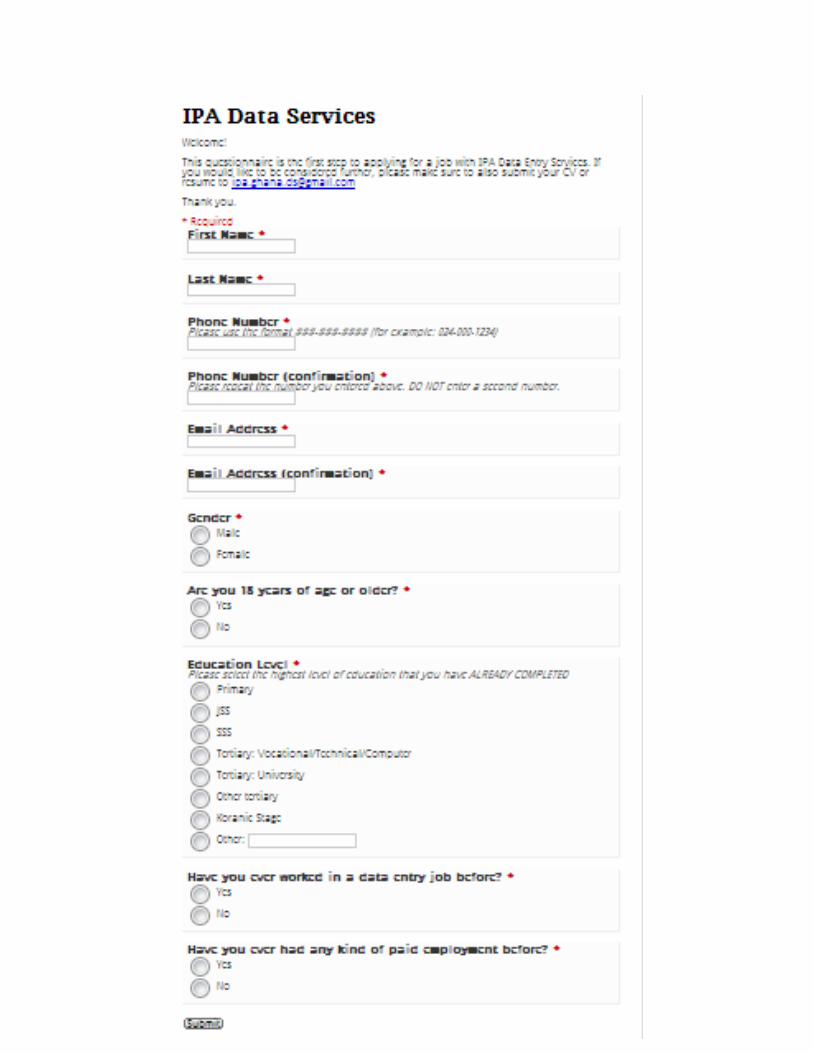
IPA Data Services received 855 applications for employment. The advertisement directed
applicants to an online form through which applicants provided their contact information
(name, phone number, email address) and the following baseline data: gender, age (over or
under 18), education level, previous experience in data entry and previous general employment
experience (Appendix 2). The benefits of using an online advertisement included low-cost,
wide-dispersion, the ability to collect electronically a portion of the baseline data. The online

5
form also served as a preliminary confirmation of prospective employees’ level of computer
savvy.
Interviewing
The recruitment phase provided the experiment with a large pool from which to build the
experimental sample. Managerial staff called these applicants in the order they applied and
invited them to in-person interviews. The in-person interviews took place in groups of up to ten
applicants, or one for each available workstation. The interviews took approximately one hour
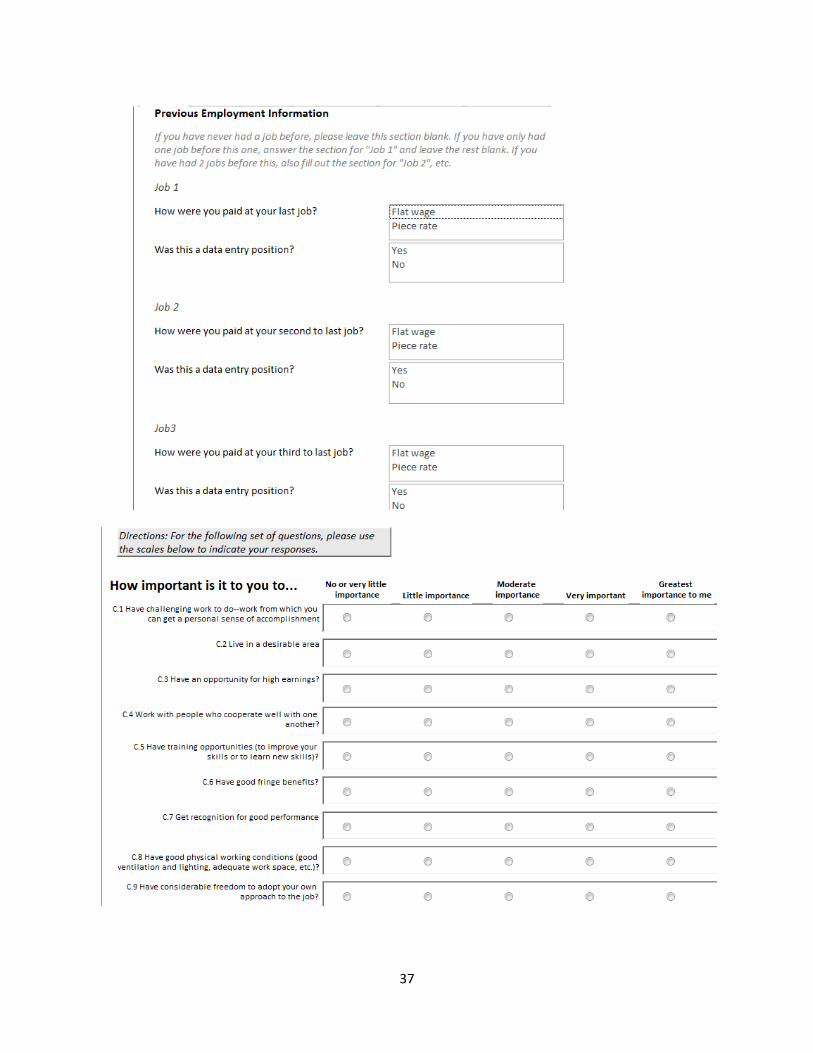
and consisted of two baseline typing tests and a demographic and work preferences survey.
Prior to the start of the interview, the on-site manager would explain IPA Data Services’ mission
to applicants: to provide high-quality paper-to-computer data entry services to IPA. The on-site
manager also detailed the logistics associated with the two-day contracts and explained that we
would store all applicant information in a secure database. We also made an effort to temper
expectations regarding the length of employment.
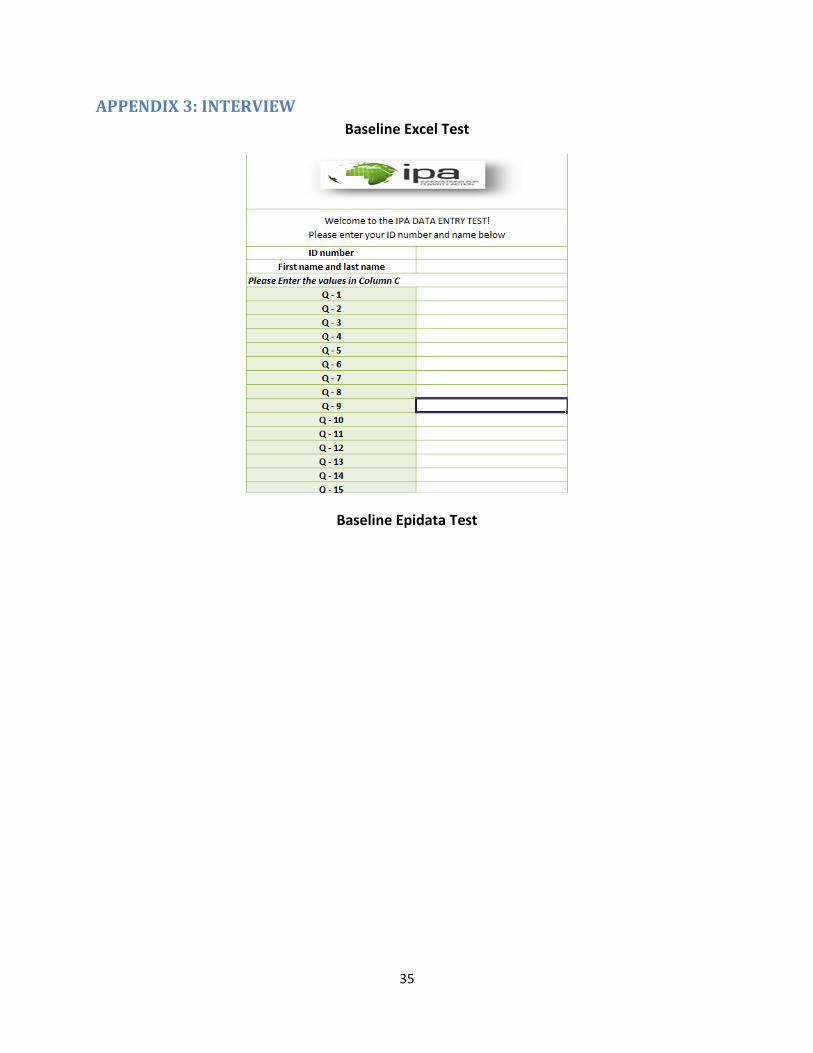
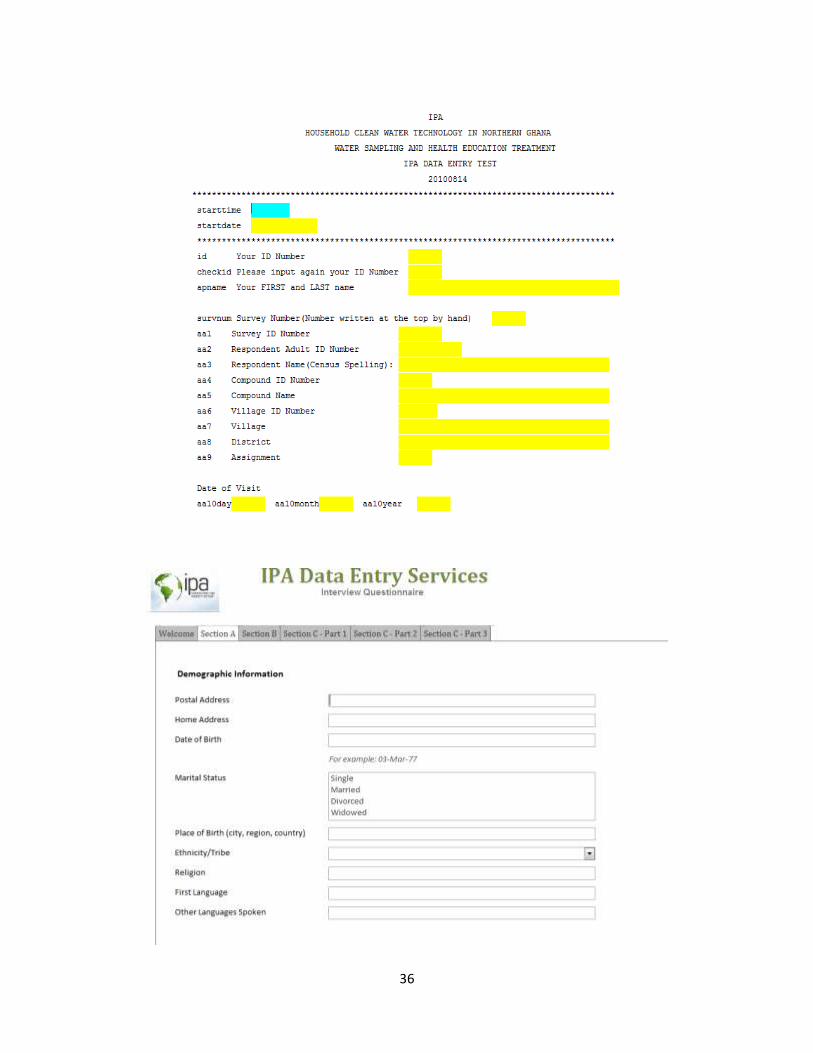
Applicants took one baseline typing test in Excel, and the other in Epidata, a commonly used
data entry interface software (Appendix 3). The Excel test featured a recurring list of numbers
that applicants entered as quickly and accurately as possible for five minutes. During the
fifteen-minute Epidata test, applicants entered the Pure Home Water Survey (PHWS), one of
the paper surveys we ultimately used during the experimental contracts. Prior to both tests, we
gave applicants brief oral instructions on how to enter data and, in the case of the Epidata test,
how to enter codes for blank variables and skip patterns. The instructions were brief, no more
than five minutes in length, and we told applicants that they could ask the manager questions
at any time during the test.
Following both tests, applicants took a 20-minute survey. This survey collected demographic
information, including age, gender, ethnicity and languages spoken. In addition to demographic
information, the survey collected information regarding work experience and preferences,
including prior experience in data entry and prior wages received (flat wage or piece rate).
Following the group interview, the on-site manager told applicants that we would contact
qualified applicants in the coming months as short-term contracts became available. In order to
replicate actual working conditions, we selected only to strongest applicants in our pool. During
piloting, we found that performance on the Epidata test did a better job than the Excel test of
predicting endline contract performance. Using these results, we therefore attempted to
replicate actual data entry firm hiring practices. We eliminated from consideration individuals
whose accuracy during the Epidata test was below 65%. We then stratified individuals using
three variables: gender, ethnicity (dominant vs. all others) and baseline Epidata performance
(above vs. below median productivity). Over the course of the experiment, we carried out
6
fifteen rounds of interviews and executed a stratified randomization after each interview to
assign individuals to either control or one of four treatment groups.
Invitation to contracts
We invited all applicants who scored above 65% accuracy on the baseline Epidata test to at
least one contract and a maximum of two contracts. We ran two two-day contracts per week
over the course of ten months from December 2010 to late October 2011. We randomly
assigned workers to one of the following contracts: flat wage, individual piece rate (IPR),
individual piece rate with rank (IPR rank), group piece rate (GPR), or group piece rate with rank
(GPR rank).
Over the course of two rounds, 50 workers were assigned to the flat wage contract and 100
workers to each of the piece rate contracts, for 450 total two-day observations. Occasionally,
workers who confirmed attendance would not show up for contracts. Despite inviting ten
workers to each contract, we found that approximately seven workers attended each contract
on average. To limit this phenomenon, we invited workers to work on an alternative date in the
event that they were unable to attend on their originally assigned date. If a worker did not
answer his or her phone after at least two attempts to contact him or her, we eliminated them
from consideration for future contracts. Individuals were not informed of their contract
assignment before they arrived and there is no relationship between treatment type and
attrition.
Contracts
In order to capture order effects, we offered each worker up to two contracts under either the
same or different payment terms. During the first contract, all workers entered the PHWS
survey. During the second contract, they entered the Formal Savings survey (FS).
To minimize selection bias, the on-site manager invited workers to contracts one to three days
in advance of the contract by telephone and text message. During all invitation calls, the on-site
manager did not indicate which contract type the worker would receive. The on-site manager
told workers that the actual salary would depend on the contract type they received, but that
the average worker should expect to receive 25 Ghana Cedis (GHC) per day, and that the
contract could be either flat wage or piece rate. During the call, the on-site manager also
reiterated that the contract was for two-days and that working hours would be from 8:30am –
4:30pm with one hour for lunch. Despite these instructions and due in large part to
unpredictable traffic in Accra, 26.8% of workers arrived after 8:30am to their contracts. The
average wage of 50 GHC per two-day contract was approximately 20% above the market
average and compensated workers for the short-term nature of the assignment.
7
The flat wage contract paid a salary of 50 GHC for two days, regardless of the quantity or
quality of the data entered. The piece rate contracts paid a fixed amount per keystroke,
whether correct or incorrect, defined as “a keyboard action that results in data capture in the
used program.” We calculated the piece rate separately for each of the two surveys. For the
PHWS survey, we calculated the piece rate as the flat wage divided by median number of total
key strokes entered during the first flat wage contract (held December 20th-21st, 2010) or
50/46,729 = .00107 GHC per keystroke. Likewise, for the FS survey, we calculated the piece rate
as the flat wage divided by median number of total key strokes entered during the first flat
wage contract (held April 28th-29th, 2011) or 50/80,425 = .0006217 GHC per keystroke.
We based payment in all four piece rate contracts on this piece rate calculation. In the IPR
contract, we paid the workers the survey-specific piece rate multiplied by the total number of
key strokes entered over two days. In the GPR contracts, we divided workers into two groups
and paid a salary equal to the total number of key strokes entered by all group members
multiplied by the survey-specific piece rate and divided by the number of workers in the group.
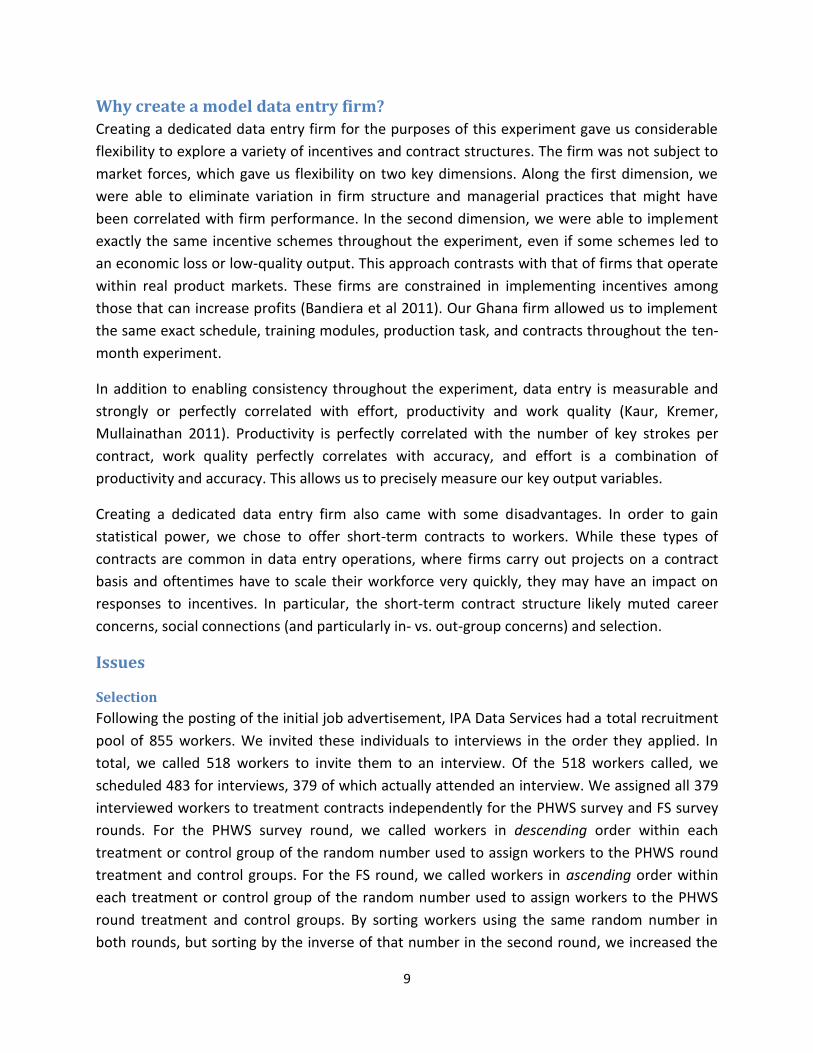
The IPR rank and GPR rank contracts had identical terms to their non-rank counterparts, but we
ranked workers based on their productivity three times a day at regular intervals to provide
public visibility of relative and absolute performance. The on-site manager used Stata to
calculate payment amounts and ranking.
Table 1
Contract type Private Public
Flat wage x
Individual piece rate (IPR) x x
Group piece rate (GPR) x x
Productivity Information
To avoid spillovers, all workers in a given two-day contract received the same contract (i.e., all
workers in the office at a given time received flat wage or IPR). We provide these workers with
a written contract to sign that laid out the contract terms. The on-site manager also passed
around a simplified description of the given contract, and spent five minutes explaining how we
would pay the workers and answering questions regarding remuneration to ensure that all
workers understood the contract terms before work began (Appendix 4).
The manager also explained work policies to all workers. Workers would work until 4:30pm,
would have one hour for lunch from 12:00pm to 1:00pm, and would be free to use the
bathroom or take brief breaks during the day as needed. For treatments with a rank
component, we told workers that the on-site manager would post full names and unique
identifiers on white boards at the front of each room three times a day at approximately
10:00am, 1:00pm and 3:00pm. Finally, the on-site manager was available all day to answer

8
questions regarding the data entry task or administrative issues. For the 26.8% of workers who
arrived after 8:30am, the on-site manager provided expedited individual instructions upon
arrival.
Production task
Following the brief orientation, we assigned workers to one of ten workstations and the on-site
manager led workers through a fifteen-minute, computer-based training. By using a
standardized presentation to train workers, we eliminated variations in training quality that
could have occurred over the course of the experiment. The on-site manager walked workers
through this training to ensure that they understood how to code certain responses and how to
move through the surveys. This training also introduced workers to the basic functionality of
the computers and number pads for use in data entry. Given that workers submitted
applications online and that the interview featured a typing test similar to the production task,
workers were well prepared for work when contracts began.
The on-site manager provided each worker with a stack of approximately fifty paper surveys to
enter. We also instructed workers to speak with the on-site manager when he or she had
finished entering those surveys. Throughout the day, the on-site manager provided new
surveys to workers as needed to ensure any exogenous interruptions to the workflow. The
production task itself required workers to enter coded data from paper surveys into the Epidata
interface. In general, the surveys contained short numeric and string fields, although four fields
in both PHWS and FS contained longer strings.
The data entry interfaces captured the total number of key strokes entered by workers over the
course of the two-day contract. In addition, the data entry interface captured key timing
variables, including the daily start time, end time and the number of seconds to complete one
survey. The on-site manager also recorded the lunchtime on a daily basis, which occasionally
varied from the 12:00pm-1:00pm schedule. The on-site manager recorded additional
anomalies, such as a workers leaving after a few hours due to an emergency or leaving for long
breaks midday, separately.
At the end of the two-day contract, the on-site manager paid workers in cash. For workers
under the flat wage contract, we did not carry out a salary calculation, and paid each worker 50
GHC. For the four incentive contracts, the on-site manager collected all data entered by the
workers and calculated their pay using based on the conditions of the workers’ assigned
contracts. Workers received cash along with a receipt stating the number of key strokes
entered and the calculation used to define their two-day wage. Before the workers left the
office, we told them that they would potentially be called for a second contract in the near
future. If employees missed the second day of work, we left one day of pay with a security
guard at the main IPA office down the block from the IPA Data Services office.
9
Why create a model data entry firm?
Creating a dedicated data entry firm for the purposes of this experiment gave us considerable
flexibility to explore a variety of incentives and contract structures. The firm was not subject to
market forces, which gave us flexibility on two key dimensions. Along the first dimension, we
were able to eliminate variation in firm structure and managerial practices that might have
been correlated with firm performance. In the second dimension, we were able to implement
exactly the same incentive schemes throughout the experiment, even if some schemes led to
an economic loss or low-quality output. This approach contrasts with that of firms that operate
within real product markets. These firms are constrained in implementing incentives among
those that can increase profits (Bandiera et al 2011). Our Ghana firm allowed us to implement
the same exact schedule, training modules, production task, and contracts throughout the ten-
month experiment.
In addition to enabling consistency throughout the experiment, data entry is measurable and
strongly or perfectly correlated with effort, productivity and work quality (Kaur, Kremer,
Mullainathan 2011). Productivity is perfectly correlated with the number of key strokes per
contract, work quality perfectly correlates with accuracy, and effort is a combination of
productivity and accuracy. This allows us to precisely measure our key output variables.
Creating a dedicated data entry firm also came with some disadvantages. In order to gain
statistical power, we chose to offer short-term contracts to workers. While these types of
contracts are common in data entry operations, where firms carry out projects on a contract
basis and oftentimes have to scale their workforce very quickly, they may have an impact on
responses to incentives. In particular, the short-term contract structure likely muted career
concerns, social connections (and particularly in- vs. out-group concerns) and selection.
Issues
Selection
Following the posting of the initial job advertisement, IPA Data Services had a total recruitment
pool of 855 workers. We invited these individuals to interviews in the order they applied. In
total, we called 518 workers to invite them to an interview. Of the 518 workers called, we
scheduled 483 for interviews, 379 of which actually attended an interview. We assigned all 379
interviewed workers to treatment contracts independently for the PHWS survey and FS survey
rounds. For the PHWS survey round, we called workers in descending order within each
treatment or control group of the random number used to assign workers to the PHWS round
treatment and control groups. For the FS round, we called workers in ascending order within
each treatment or control group of the random number used to assign workers to the PHWS
round treatment and control groups. By sorting workers using the same random number in
both rounds, but sorting by the inverse of that number in the second round, we increased the
10
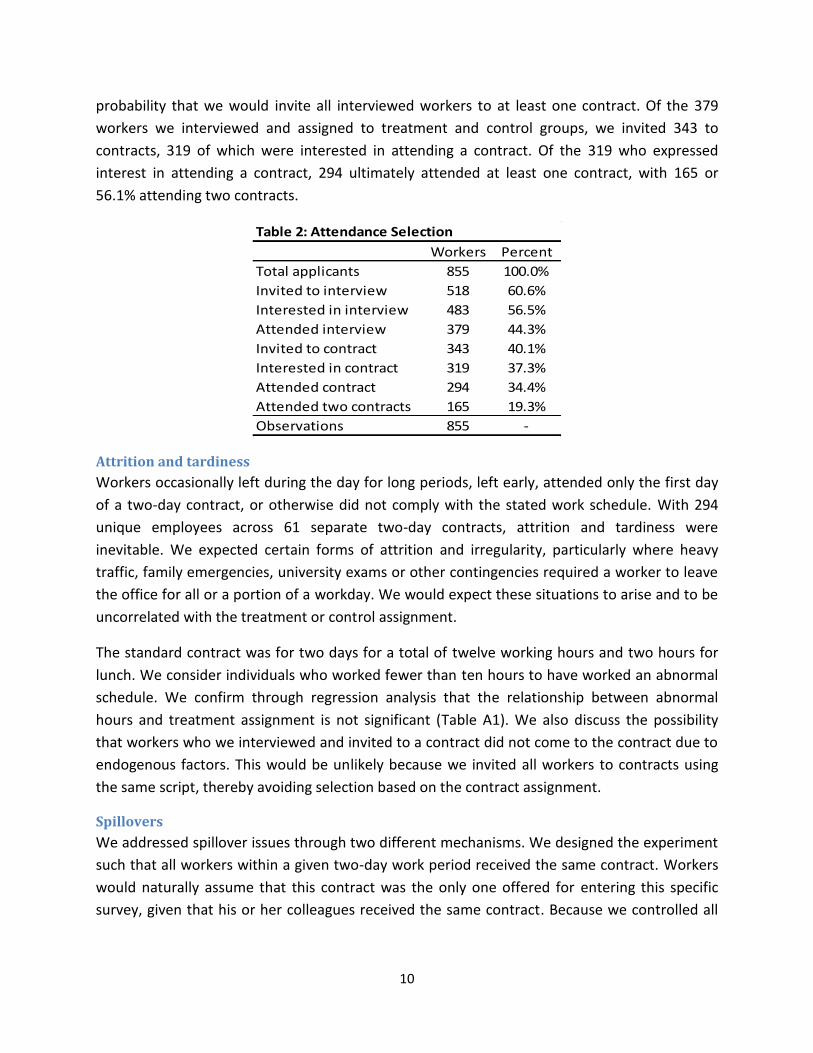
probability that we would invite all interviewed workers to at least one contract. Of the 379
workers we interviewed and assigned to treatment and control groups, we invited 343 to
contracts, 319 of which were interested in attending a contract. Of the 319 who expressed
interest in attending a contract, 294 ultimately attended at least one contract, with 165 or
56.1% attending two contracts.
Table 2: Attendance Selection
Workers Percent
Total applicants 855 100.0%
Invited to interview 518 60.6%
Interested in interview 483 56.5%
Attended interview 379 44.3%
Invited to contract 343 40.1%
Interested in contract 319 37.3%
Attended contract 294 34.4%
Attended two contracts 165 19.3%
Observations 855 -
Attrition and tardiness
Workers occasionally left during the day for long periods, left early, attended only the first day
of a two-day contract, or otherwise did not comply with the stated work schedule. With 294
unique employees across 61 separate two-day contracts, attrition and tardiness were
inevitable. We expected certain forms of attrition and irregularity, particularly where heavy
traffic, family emergencies, university exams or other contingencies required a worker to leave
the office for all or a portion of a workday. We would expect these situations to arise and to be
uncorrelated with the treatment or control assignment.
The standard contract was for two days for a total of twelve working hours and two hours for
lunch. We consider individuals who worked fewer than ten hours to have worked an abnormal
schedule. We confirm through regression analysis that the relationship between abnormal
hours and treatment assignment is not significant (Table A1). We also discuss the possibility
that workers who we interviewed and invited to a contract did not come to the contract due to
endogenous factors. This would be unlikely because we invited all workers to contracts using
the same script, thereby avoiding selection based on the contract assignment.
Spillovers
We addressed spillover issues through two different mechanisms. We designed the experiment
such that all workers within a given two-day work period received the same contract. Workers
would naturally assume that this contract was the only one offered for entering this specific
survey, given that his or her colleagues received the same contract. Because we controlled all
11
elements of the hiring and contracting process, we eliminated the possibility that a worker
would work a contract that we did not assign to them.
We also invited workers to only one contract with the PHWS survey or FS survey. By reinforcing
the idea that each work task has its own payment structure, we attempted to reduce the
impact that knowledge of other contract types would have on behavior. Nevertheless, it is
possible that through exogenous social connections, workers learned about other contract
types, which might have set expectations about contract type ex ante.
Hawthorne effects
One of the benefits of starting a dedicated data entry firm was that we maintained control over
key administrative and managerial decisions within a real-stakes work environment. IPA Data
Services employed workers on short-term contracts as real data entry employees.
Consequently, we avoided disclosing the experimental ends of worker employment. All workers
gave consent to IPA Data Services to collect survey and work data and an ethics committee
approved the survey and experimental design.
Working conditions as well as the production task mimicked those of a real firm. By giving all
workers within a given two-day work period the same contract, we avoided unnatural divisions
between and among workers. The daily salary as well as all contract documentation conformed
to local business practices and the on-site manager had previously worked as a data entry
manager for a local firm. By holding contracts using two different surveys, we avoided
situations in which one worker received two different contracts or payment types for entering
the same survey. Varying the work task permitted us to explore order effects without
introducing experimental bias or Hawthorne effects. Finally, workers entered real survey data
collected in Ghana. These efforts eliminated any sense of abnormality within the working
environment and minimized the probability that the experimental context altered worker
behavior.
BASELINE DATA AND BALANCE ACROSS TREATMENT The objective of the baseline was to collect information to verify the comparability of the
experimental groups and to be able to carry out heterogeneity analyses later in the experiment.
Baseline data collection took place on fifteen days between August 22nd, 2010 and July 14th,
2011. The baseline consisted of: (i) a demographic and work preferences survey; (ii) a five-
minute typing test in Excel; (iii) a fifteen-minute typing test. The survey and both typing tests all
served as our interview; however, all interested applicants were offered employment
regardless of their performance on the tests.
12
Each treatment cell contains approximately 100 observations, with the number of observations
between and among contracts varied slightly due to unpredictable worker attendance.2 Despite
having space for ten workers at a time, our average attendance over the course of the
experiment was 7.53 workers, with a range of 7.29 (flat wage) to 7.85 (IPR) workers per
contract. Average working hours is consistent across contracts, with the range being
approximately 10 minutes and the standard deviation 6 minutes among them.
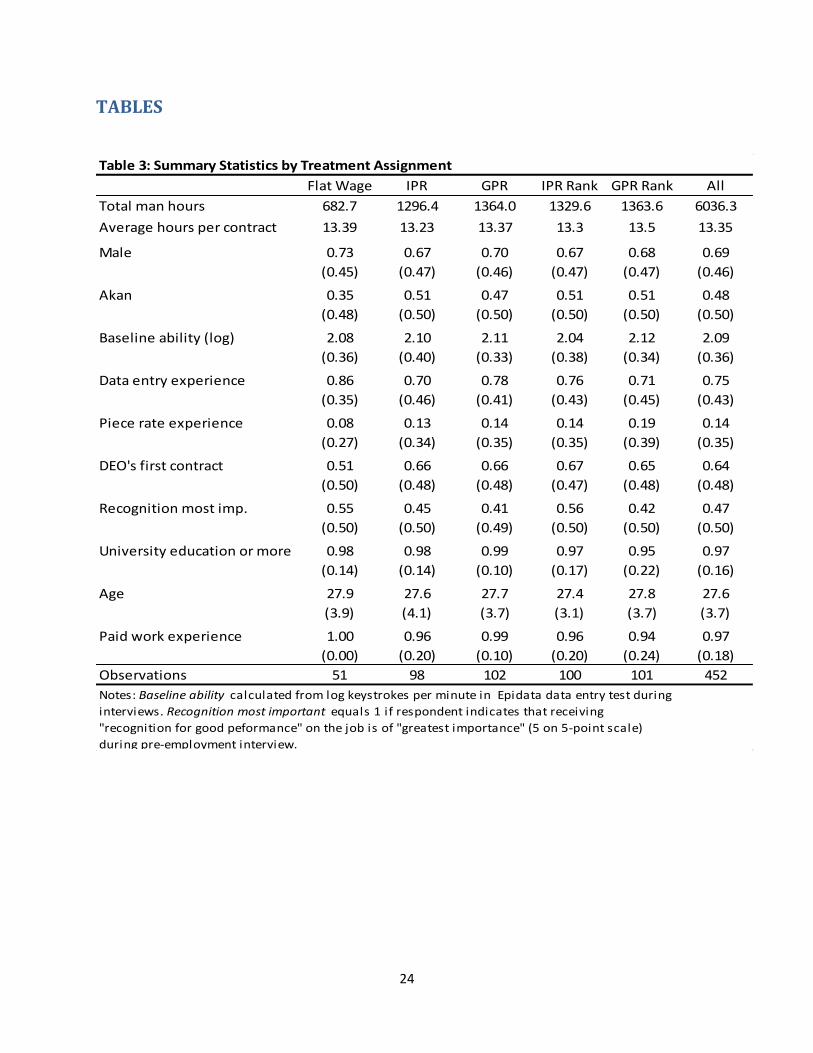
We collected baseline data during the baseline interview and the application process. The
demographic and experience data comes from both data streams. We stratified assignment to
the contract treatments based on gender, baseline ability and ethnicity as strata during the
randomization process. As shown in Table 3, these characteristics are roughly balance across
treatment cells; however, because of the relatively small samples required per cell, allocation
from eight possible strata combinations, and the need for rolling assignment to treatments
throughout the application process, this is not exact. The majority of workers were males, and
the sample is balanced with between 67% and 73% of each group being male. Likewise,
baseline ability as measured by key strokes per minute during the Epidata baseline test is
balanced. Individuals in all incentive treatments are 12%-16% more likely to be Akan than those
in the flat wage treatment. We control for all stratification variables in the analysis.
In addition to the stratification variables, throughout the analysis, we utilize key control
variables from the baseline including whether the worker: (i) has data entry experience; (ii) has
piece rate experience; (iii) likes recognition and (iv) has already participated in a contract (i.e.,
this observation is the worker’s second contract). These characteristics are relatively well
balanced across the contracts. Additional demographic variables of interest, including
education level, paid work experience and age are also mostly balanced based on a summary of
means across treatment and control groups. Nearly all subjects report having a university
education and previously paid employment. The average age of subjects is 27.6 years.
Baseline performance variables
We measure baseline productivity and accuracy using the interview Epidata test. We gave
workers fifteen minutes to enter as many surveys as quickly and accurately as possible. From
this test, we derive two measures of ability: one based on the number of key strokes entered
per minute and the other based on the number of accurate key strokes entered per minute.
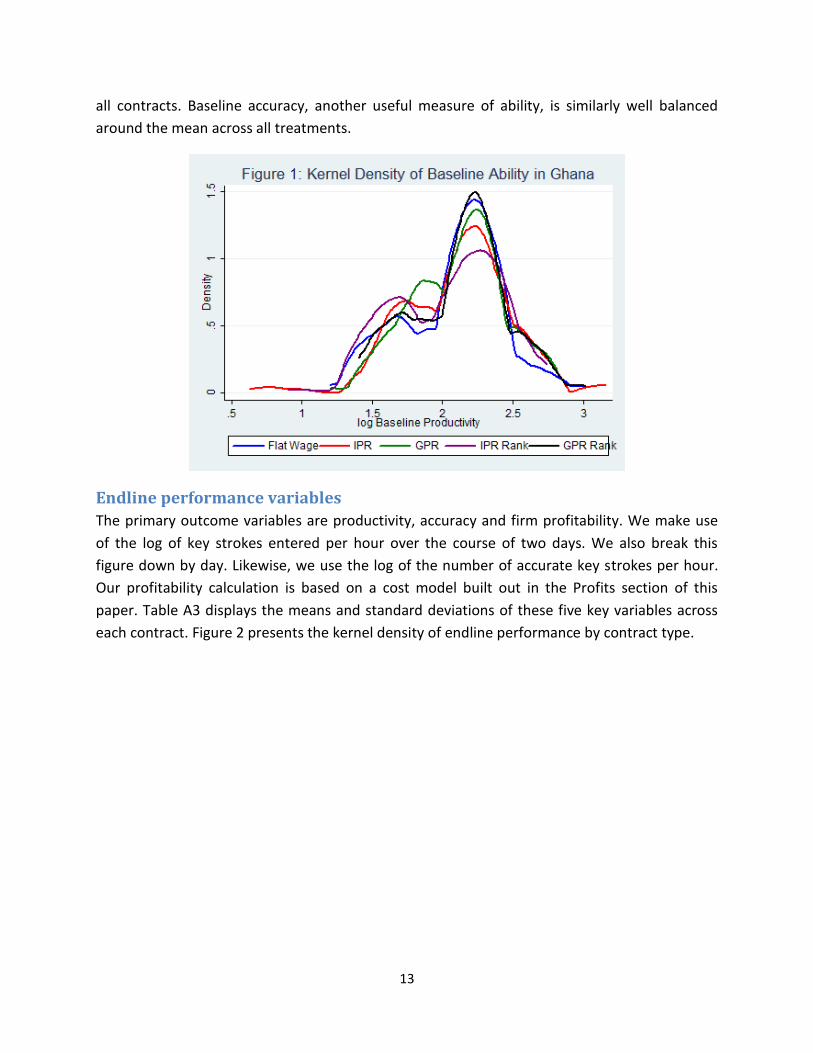
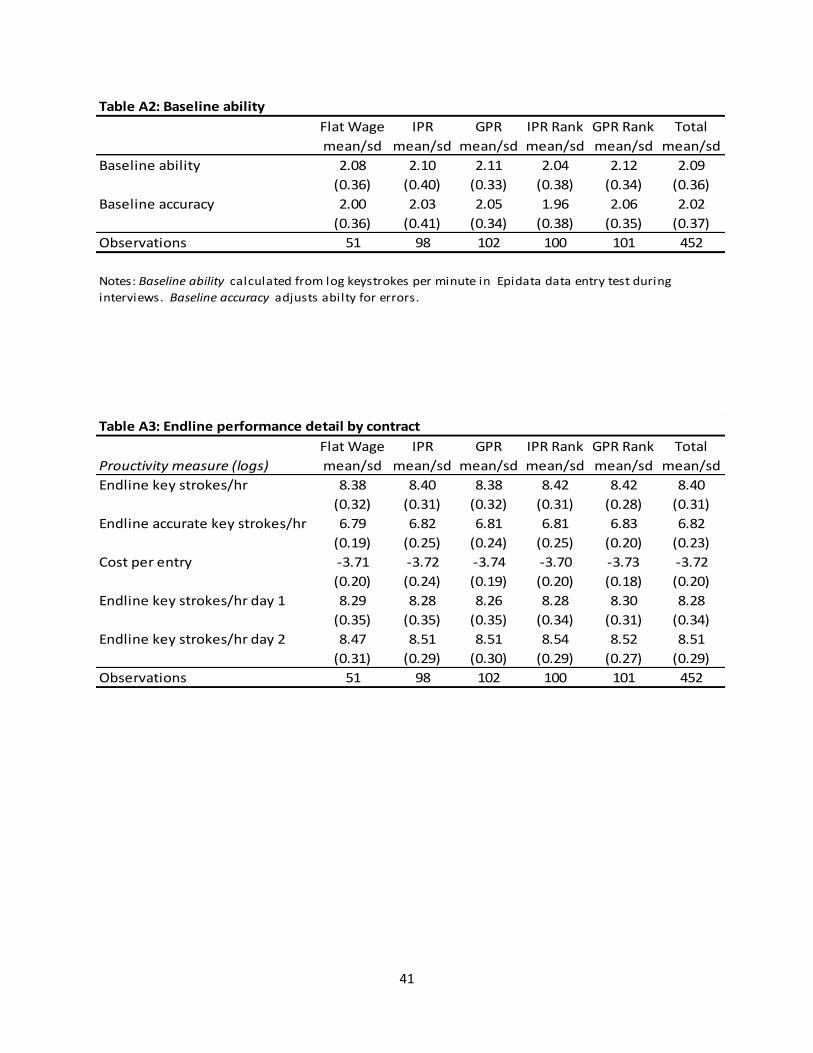
Figure 1 presents the kernel density of the former by contract type. Baseline ability follows
roughly the same distribution across all contracts, with productivity skewed rightwards. Table
A2 presents the means and standard deviations of baseline ability, and shows that the mean
baseline ability is within less than one-tenth of one standard deviation of the overall mean for
2 Because of the relatively low variability in performance under the flat wage contract, we targeted only 50
observations for this cell.
13
all contracts. Baseline accuracy, another useful measure of ability, is similarly well balanced
around the mean across all treatments.
Endline performance variables
The primary outcome variables are productivity, accuracy and firm profitability. We make use
of the log of key strokes entered per hour over the course of two days. We also break this
figure down by day. Likewise, we use the log of the number of accurate key strokes per hour.
Our profitability calculation is based on a cost model built out in the Profits section of this
paper. Table A3 displays the means and standard deviations of these five key variables across
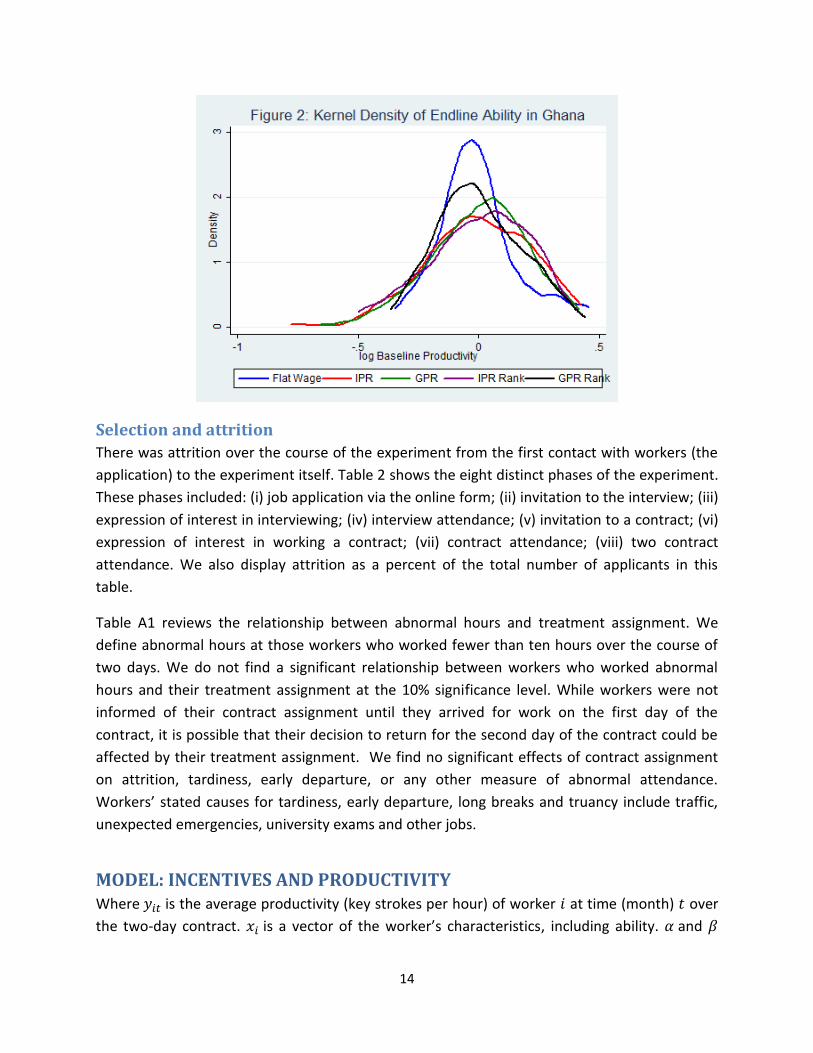
each contract. Figure 2 presents the kernel density of endline performance by contract type.
14
Selection and attrition
There was attrition over the course of the experiment from the first contact with workers (the
application) to the experiment itself. Table 2 shows the eight distinct phases of the experiment.
These phases included: (i) job application via the online form; (ii) invitation to the interview; (iii)
expression of interest in interviewing; (iv) interview attendance; (v) invitation to a contract; (vi)
expression of interest in working a contract; (vii) contract attendance; (viii) two contract
attendance. We also display attrition as a percent of the total number of applicants in this
table.
Table A1 reviews the relationship between abnormal hours and treatment assignment. We
define abnormal hours at those workers who worked fewer than ten hours over the course of
two days. We do not find a significant relationship between workers who worked abnormal
hours and their treatment assignment at the 10% significance level. While workers were not
informed of their contract assignment until they arrived for work on the first day of the
contract, it is possible that their decision to return for the second day of the contract could be
affected by their treatment assignment. We find no significant effects of contract assignment
on attrition, tardiness, early departure, or any other measure of abnormal attendance.
Workers’ stated causes for tardiness, early departure, long breaks and truancy include traffic,
unexpected emergencies, university exams and other jobs.
MODEL: INCENTIVES AND PRODUCTIVITY Where is the average productivity (key strokes per hour) of worker at time (month) over
the two-day contract. is a vector of the worker’s characteristics, including ability. and
15
measure the causal effect of incentives on productivity under the assumption that incentive
treatments are orthogonal to . Identifying assumptions can fail because of either
endogenous drop-outs or spillovers. As described above, neither appears to be relevant in this
setting.
IMPACT: PRODUCTIVITY, ACCURACY AND PROFITABILITY In the previous two sections, we discussed a host of descriptive statistics, with the end goal
being to demonstrate balance in the sample. To show that the relationships between contract
type and end line productivity, accuracy and profitability figures are statistically significant, we
carry out regression analyses following on the model described in the previous section. We
build upon this model by analyzing heterogeneous effects, the mechanisms by which incentives
change worker behavior, profitability and inter-day relationships that cause changes in
productivity, work quality and firm profitability. In the following regressions, we use a dummy
variable for Akan, the aforementioned baseline ability variable and a dummy variable for male
as controls. In addition to these stratification variables, we control on experience with data
entry, whether this is the first or second contract for the worker, whether this is the first time
working for a piece rate wage.
Survey and monthly fixed effects
Our model includes fixed effects for both month and survey type entered (PHWS or FS). We
never used the two surveys in the same month, but we did use each survey for several months.
As such, we control for unobserved heterogeneity over time. This is particularly relevant for the
fixed effects related to the survey used. The FS survey had higher productivity per hour than
the PHWS survey, and so the fixed effects model controls for variation in survey type as well.
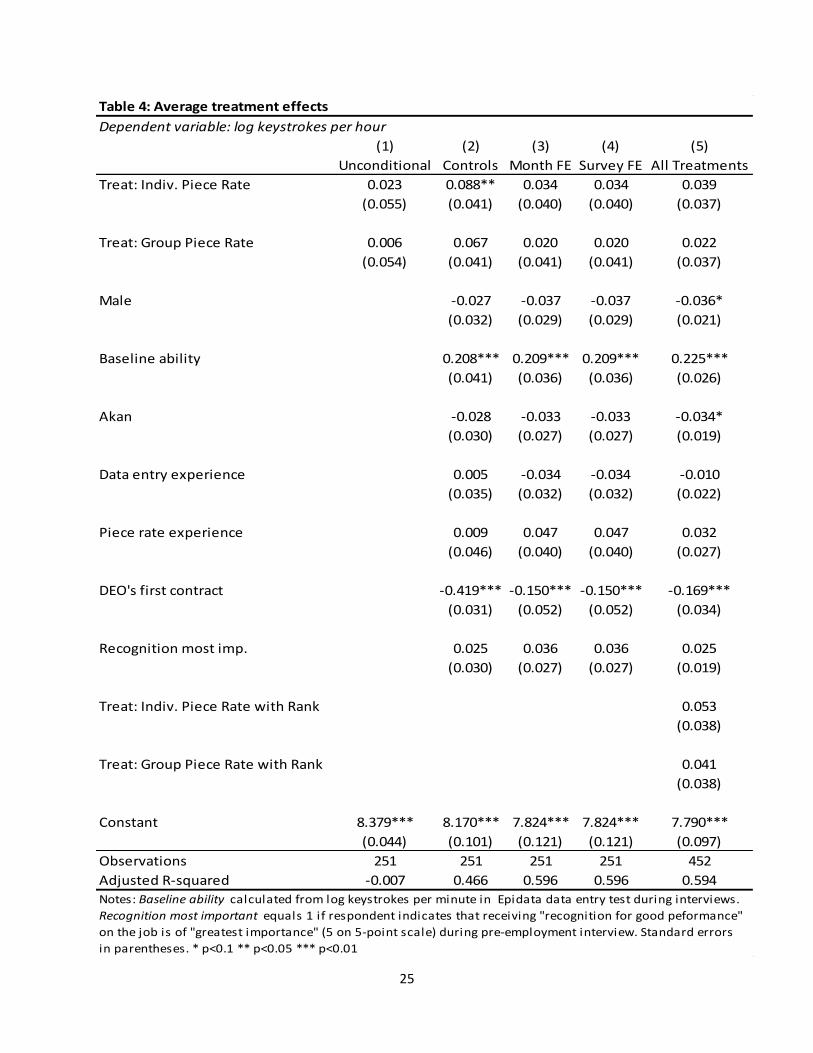
Average treatment effects
There is no significant effect for any of the treatment contracts. The coefficients on all four
contracts range from .006 to .039, none of which are significant at the 10% confidence level.
The treatment effects are stable, and adding controls and fixed effects improves the precision
of this estimate. We cannot reject performance under the IPR, GPR, IPR rank or GPR rank are
identical. This suggests that in this context neither monetary nor social incentives are effective
at improving productivity. This would also suggest that information does not help cooperation
in the GPR and GPR rank treatments.
Unsurprisingly, baseline ability has a significant impact on productivity, with a coefficient of
.225 significant at the 1% level (Column 5, Table 4). In other words, we expect a .22% increase
in endline productivity when baseline productivity increases by 1%. This suggests that
16
individuals with a greater preliminary endowment of ability in this task are more likely to
succeed at it in the short term. We show later that this effect diminishes after one day.
We also find that workers exhibit significant learning across contracts. The coefficient on the
workers first contract variable is -.169 significant at the 1% level (Column 5, Table 4). We expect
workers in their second contract to be 15.5% more productive than workers in their first
contract. We therefore find that workers’ skills improve significantly over a short period of time
when the task and environment are very similar, with major gains in productivity being seen
after only two days of work.
Heterogeneous treatment effects
Table 5 explores heterogeneous effects on productivity. We allow the response to incentives to
differ along several dimensions which include gender, ability, previous experience with data
entry and with piece rates. The table makes clear that the treatment effects are consistently
negligible for all worker characteristics . All the partitions we consider reveal that workers in
this setting do not respond to monetary incentives regardless of their gender, ability or
experience.
Exploring other determinants of productivity, we find that Akan males are 5.1% less productive
than other males ( = -.052 =.088 =174) (Column 2, Table 5). Among workers with low
baseline ability, we find that workers with piece rate experience are 14.2% more productive
than other workers with low baseline ability ( = .133 =.072 =123) (Column 4, Table 5).
Among workers who have data entry experience, we find that Akan workers are 5.5% less
productive than other workers with data entry experience ( = -.056 =.08 =193) (Column 5,
Table 5). Among workers who don’t have data entry experience, we find that people with piece
rate experience are 18.8% more productive than workers with data entry experience ( = .172
=.02 =58) (Column 6, Table 5). Among workers with no piece rate experience, we find that
those who find recognition to be important are 4.9% more productive than workers with piece
rate experience ( = .048 =.081 =220) (Column 8, Table 5). We should be cautious in
interpreting these results because some of these cells have very few observations.
Mechanisms
Does information help group cooperation
Cooperation does not appear to drive the response to group incentives. By adding the ranking
element to the GPR treatment, we hoped to assess whether workers’ performance improves or
declines in the presence of information regarding team members’ relative performance. If
information helped group cooperation, we would expect to find higher productivity among GPR
rank workers than among GPR workers. We do not, however, find a significant difference in the
response to incentives among workers assigned to these two contracts. The coefficients on GPR
17
and GPR rank are = .018 ( =.621) and = .033 ( =.381), respectively, neither of which is
significant at the 10% significance level (Column 2, Table 6).
Tall poppy vs. recognition
The literature contains a number of studies which examine the idea that in some African
cultures, people discourage individual success (Platteau 2000, Baland et al 2010, Comola and
Fafchamps 2010). If this were the case, we would expect to see significantly higher productivity
in the IPR contract than in the IPR rank contract. We find, however, that there is no significant
difference between productivity in the IPR and IPR rank contracts. The coefficients on these
contracts are = .036 ( =.366) and = .060 ( =.144), respectively, neither of which is
significant at the 10% significance level (Column 3, Table 6).
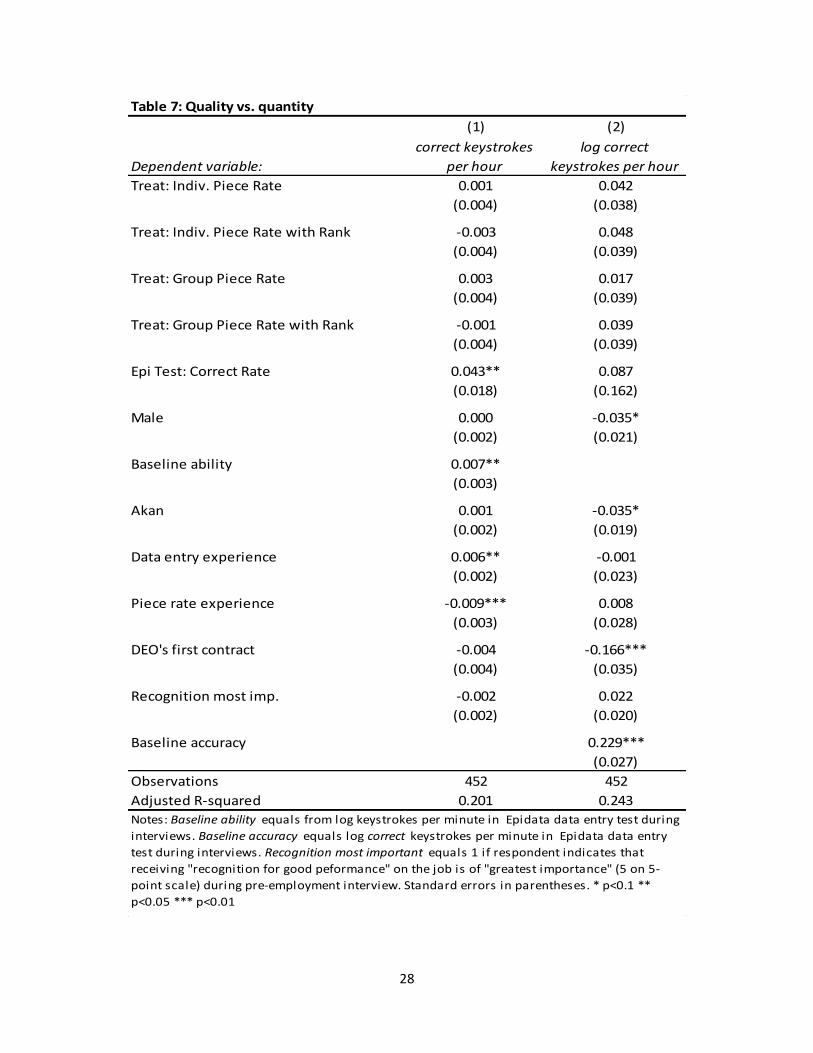
Quality vs. quantity
There does not appear to be a tradeoff between quality and quantity. We look at both quality
and quality per hour. We derive both quality variables by determining the percent of entries the
worker entered correct over the course of the contract. We find that in both the quality and log
of quality models, the coefficients on each of the four contract types are not significant at the
10% significance level. The coefficients on all of the treatments in the quality model are
approximately zero (Table 7).
Profits
Firm profitability is a relevant factor in considering which incentives to use. Businesses are not
only interested in high productivity, but also in high quality output. In our model firm, we
consider the various costs the firm incurs in order to produce a finished product. In this case,
data entry firms are generally held to high accuracy standards, with most contracts specifying
accuracy of 99.5%. Reaching this high level of accuracy requires a number of steps, and the
workers’ productivity and accuracy influences the costs associated with these steps. In our
model, we consider each worker to be an independent contract. We imagine that we hired 1
worker to enter a certain number of surveys and that all fixed costs apply to that single worker,
rather than to the actual number of DEOs present during a given 2-day experimental session.
We first determine the worker’s salary cost of entering the surveys, which is equal to the actual
amount we paid the worker under the terms of his or her contract. Then we determine the
managerial salary cost, which is equal to the manager’s salary for two days, or 78.5 GHC per
day. We also determine the fixed cost, which is equal to rent and services for two days, or 270.4
GHC per day. The cost per field entered is therefore a function of his or her salary and
the managerial and fixed costs multiplied by the number of days worked by the
worker divided by the total number of fields entered . We multiply by 2 to account for double
data entry.

18
(
)
To ensure that accuracy rates do not drop below 99.5%, data entry firms typically double enter
and then reconcile their data. As noted above, we assume that the same worker carries out the
process of double entry. During reconciliation, data entry firms compare two datasets, flag
discrepancies, and return to the original data to confirm the correct answer. Errors are probably
more costly than the original double entry, so we create a second assumption that defines the
reconciliation cost based on different inputs than the original double entry cost. It is also
possible that double entry with reconciliation fails to ensure 99.5% accuracy because there is
some non-convexity in that high error rates make it more likely that errors are not caught by
double entry, which can lead to contract penalties. We create three separate assumptions to
treat these three cases.
The first case is very straightforward. We assume that the unit cost of reconciliation is
based on the original unit cost of double entry , because reconciliation is usually double
entered, multiplied by the number of error fields and divided by the total number of fields
entered. We added the original unit cost of double entry to determine the full unit cost for
double entry and reconciliation of errors at the cost of double entry.
The second case establishes a separate set of inputs based on the assumption that
reconciliation is much slower than double entry. The first step is to determine the amount of
worker time in hours required to double reconcile all errors where a worker can
reconcile errors per day, which we assume to be equal to 500.
(
)
We also create an estimated worker salary cost per reconciliation . In this equation, we
determine the total number of errors the worker must reconcile and divide that by the number
of errors a worker can reconcile per day, multiplied by the daily salary , in this case based on
the flat wage of 25 GHC per day.
We estimate managerial salary cost per reconciliation required to manage the
reconciliation process. We assume that managerial time scales by a linear factor for

19
every 500 surveys to be reconciled, with the total number of surveys in the dataset and multiply
the total time by the manager’s daily salary .
Finally we calculate the fixed cost of reconciliation based on the amount of managerial and
worker time required to complete the reconciliation.
With these costs in hand, we find the cost of reconciliation in this second case to equal the
worker, managerial, and fixed costs divided by the total number of fields entered by the
worker. As in case 1, we add the original unit cost of double entry to this total to determine the
full unit cost for double entry and reconciliation of errors at the reconciliation cost defined by
.
The third case assumes that the cost of reconciliation also includes the cost of false positives,
including the probability of violating contract terms that require 99.5% accuracy. We first
determine the expected value of double errors for each worker. We do this by
analyzing the error rate on each question for both the PHWS survey and FS survey. We
square the expected value for each question to obtain the overall expected value of entering
the same questions wrong two times during double entry.
We also calculate the expected percent of entries each worker will get wrong
twice. This is calculated as the expected number of double error entries divided by the total
number of fields entered by each worker.
With both expected values in hand, we can calculate the potential cost of violating the contract
as a function of the reconciliation cost we calculate in case 2 and the contract violation cost.
We calculate the total cost of double errors as the product of the expected number of double
errors times the reconciliation cost noted in case 2 . We divide this by the
total fields entered to get per unit cost of correcting all double error across all entries. We add
to this the difference between the contract violation terms , which we assume to be 99.5%,
20
and the expected error rate multiplied by the reconciliation cost noted in case 2. We do not
divide this by the total fields entered by the worker because the per unit cost is implicit to .
( )
The unit cost of reconciliation with violation takes two forms. In the first form, the unit cost
of reconciliation with violation is equal to the unit cost of the original unit cost of double entry
plus the unit cost of reconciliation at the cost of reconciliation plus the unit cost of double
errors at the cost of reconciliation
plus the expected unit cost of contract
violation where the expected error rate is greater than .05%.
if
The second form includes only the first three components outlined in the first form, namely the
original unit cost for double entry, the unit cost for reconciliation, and the unit cost for double
errors. Because the expected error rate is less than .05% in these cases, no additional expected
violation cost is added.
if
This approach has one shortfall. In the third case, we likely over count the probability of a
double error, because we assume that there error would be the same, and therefore
undetectable during the reconciliation process, during both the first and second entries.
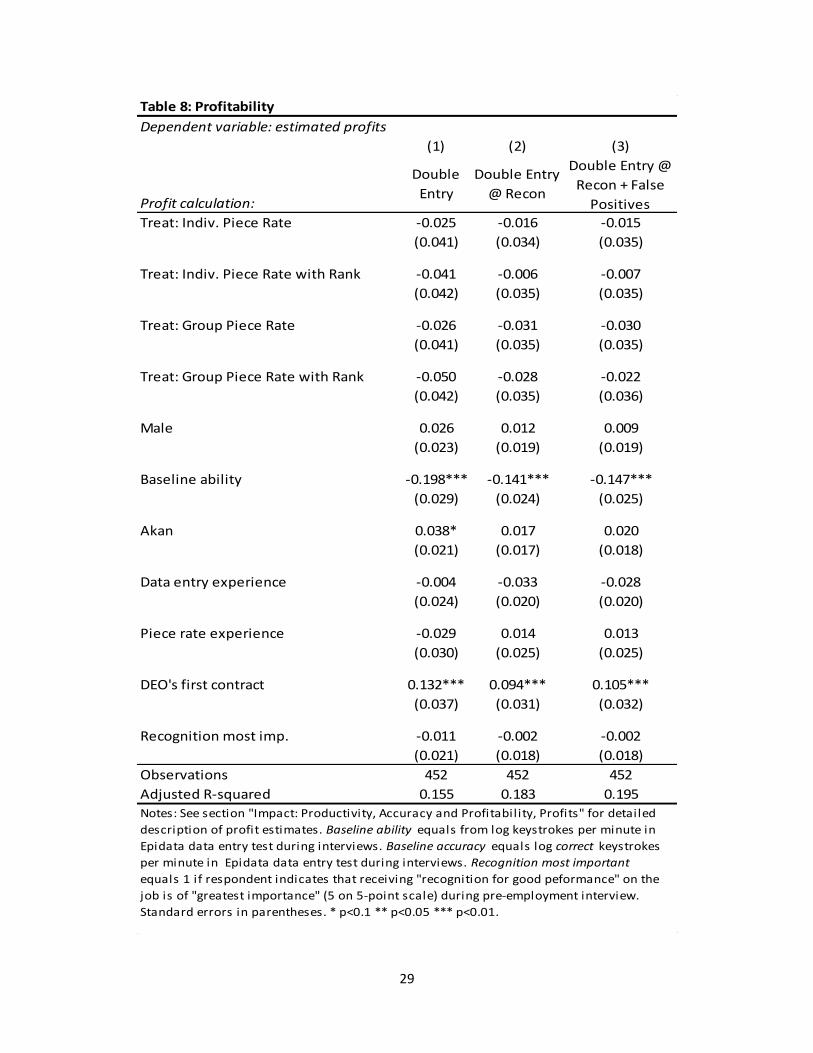
Table 9 reports the estimated treatment effects on each profit estimate. We do not find a
significant effect for any of the treatments for any of the three measures. The coefficients on all
the regressors are between -.051and approximately 0, with none significant at the 10%
significance level. We cannot reject the hypothesis that the four contracts have different effects
on each measure of firm profit.
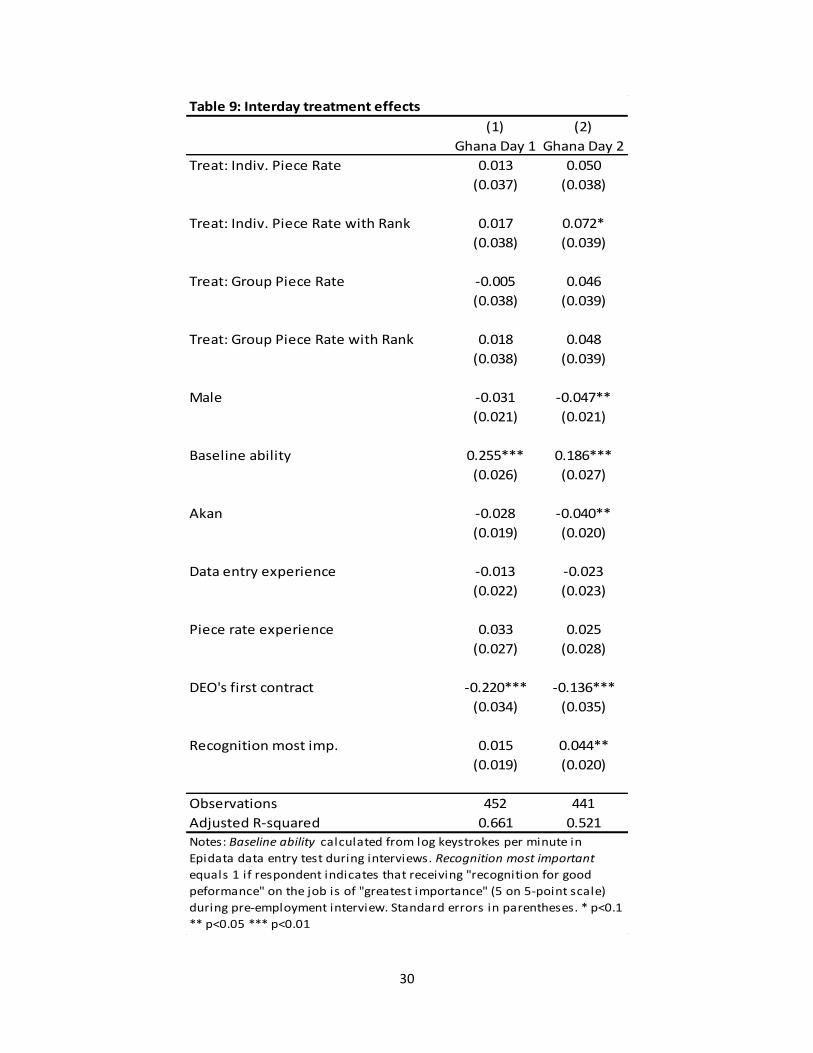
Interday
We carry out an analysis of responses to productivity on a daily basis to determine if responses
vary with time Table 9 shows that responses to incentives are muted on both days, with the
sole exception of the IPR treatment that leads to a modest 7.4% increase in productivity ( =
.072 =.068). We cannot, however, reject the hypothesis that the effect of IPR is the same on
both days.
21
The productivity of male workers decreases by 4.5% on day 2 (p = .029) at the 5% confidence
level. This suggests that, holding treatments constant, male workers complete less work (but
not necessarily lower quality work) during day 2 than their female counterparts (Column 2).
The shift from day one to day two causes the productivity penalty associated with first timers to
decrease from 19.8% ( = -.22 =0) to 12.7% ( = -.136 =0). This 36% improvement in
performance for workers attending their first contract suggests that workers improve very
rapidly (Columns 1 and 2).
From day one to day two, the effect baseline productivity has on endline productivity also
decreases. On day one, a 1% increase in baseline productivity results in a .25% increase in
endline productivity ( = .255 =0). On day two, that figure drops to a .18% increase in endline
productivity ( = .186 =0). The 28% change in the impact of baseline productivity on endline
productivity suggests that workers improve rapidly over time. It may also suggest that the
baseline productivity measure is less a proxy for innate work ability than an indicator of
familiarity with data entry in this context.
CONCLUSIONS In the context of our data entry firm in Accra, Ghana, we find that performance pay does not
increase worker productivity, work quality, or overall firm profitability. This is consistent with
the hypothesis that firms that do not implement such incentives are making profit maximizing
decisions. Ghana falls very low on the Hofstede individualism scale, and this study suggests that
alternative incentive structures may be optimal in such countries. When exploring some of the
mechanisms that might drive responses to these incentives, we find that information does not
help groups to cooperate (i.e., productivity during the group piece rate with ranking contract
was not significantly higher than productivity during the standard group piece rate contract).
However, we do note that productivity under the individual piece rate contract with publically
observed ranking is significantly lower than under the individual piece rate contract without.
Future research will explore whether this pattern holds in other countries with similarly low
levels of individualism and whether, in contrast, incentives are effective in countries that have
individualism scores closer to those measured in the United States and United Kingdom, where
performance pay is common.
Future research will also explore alternative methods to motivate workers and increase their
productivity in settings where monetary incentives fail.

22
REFERENCES Ashraf, N. O. Bandiera, K. Jack (2012) “No Margin, No Mission? A Field Experiment on Incentives
for Pro-Social Tasks”, Harvard Business School Working Paper 12-008.
Baland, J.M. C. Guirkinger, and C. Mali, (2010) “Pretending to be Poor: Borrowing to Escape
Forced Solidarity in Cameroon”, Centre for Research in the Economics of Development (CRED),
University of Namur, mimeo.
Bandiera, O. I. Barankay, and I. Rasul (2012) “Team Incentives: Evidence from a Field
Experiment”, Journal of the European Economic Association forthcoming.
Bisin, A. E. Patacchini, T Verdier, and Y Zenou (2010) "Bend It Like Beckham: Ethnic Identity and
Integration", NBER Working Papers 16465, National Bureau of Economic Research, Inc.
Bloom, N. B. Eifert, A. Mahajan, D. McKenzie, and J. Roberts (2010) “Does Management
Matter? Evidence from India”, International Growth Centre Working Paper: 10/0873.
Bloom, N. and J. Van Reenen (2010) “Why Do Management Practices Differ across Firms and
Countries?”, Journal of Economic Perspectives Volume 24, Number 1: 203-224.
Bloom, N. R. Sadun, and J. Van Reenen (2012) “The Organization of Firms Across Countries”,
Quarterly Journal of Economics, online ISSN 0033-5533.
Comola M. and M. Fafchamps (2010) "Are Gifts and Loans between Households Voluntary?",
CSAE Working Paper Series 2010-20, Centre for the Study of African Economies, University of
Oxford.
Gelfand, M. J. M. Erez, and Z. Aycan (2007) “Cross-Cultural Organizational Behavior”, Annual
Review of Psychology, 58: 479-514.
Gorodnichenko, Y. and G Roland (2011) "Which Dimensions of Culture Matter for Long-Run
Growth?", American Economic Review, American Economic Association Volume 101(3): 492-98.
Guiso, L. P. Sapienza, and L. Zingales (2006) “Does Culture Affect Economic Outcomes?”, Journal
of Economic Perspectives Volume 20, Number 2: 23-48
Hofstede, G. (2001) “Culture's Consequences: Comparing Values, Behaviors, Institutions, and
Organizations across Nations (2nd ed.)”, Thousand Oaks, California: Sage Publications, Inc.
Kaur, S. M. Kremer, and S. Mullainathan (2010) “Self-Control and the Development of Work
Arrangements”, American Economic Review Papers and Proceedings 100(2): 624-628.
23
Muralidharan, K. and V. Sundararaman (2011) “Teacher Performance Pay: Experimental
Evidence from India”, Journal of Political Economy Volume 119, Number 1: 39-77.
Platteau, J.P. (2000) “Institutions, Social Norms and Economic Development”, Harwood
Publishers.
Tabellini, G. (2010) “Culture and Institutions: Economic Development in the Regions of Europe”,
Journal of the European Economic Association Volume 8, Issue 4: 677-716
24
TABLES
Table 3: Summary Statistics by Treatment Assignment
Flat Wage IPR GPR IPR Rank GPR Rank All
Total man hours 682.7 1296.4 1364.0 1329.6 1363.6 6036.3
Average hours per contract 13.39 13.23 13.37 13.3 13.5 13.35
Male 0.73 0.67 0.70 0.67 0.68 0.69
(0.45) (0.47) (0.46) (0.47) (0.47) (0.46)
Akan 0.35 0.51 0.47 0.51 0.51 0.48
(0.48) (0.50) (0.50) (0.50) (0.50) (0.50)
Baseline ability (log) 2.08 2.10 2.11 2.04 2.12 2.09
(0.36) (0.40) (0.33) (0.38) (0.34) (0.36)
Data entry experience 0.86 0.70 0.78 0.76 0.71 0.75
(0.35) (0.46) (0.41) (0.43) (0.45) (0.43)
Piece rate experience 0.08 0.13 0.14 0.14 0.19 0.14
(0.27) (0.34) (0.35) (0.35) (0.39) (0.35)
DEO's first contract 0.51 0.66 0.66 0.67 0.65 0.64
(0.50) (0.48) (0.48) (0.47) (0.48) (0.48)
Recognition most imp. 0.55 0.45 0.41 0.56 0.42 0.47
(0.50) (0.50) (0.49) (0.50) (0.50) (0.50)
University education or more 0.98 0.98 0.99 0.97 0.95 0.97
(0.14) (0.14) (0.10) (0.17) (0.22) (0.16)
Age 27.9 27.6 27.7 27.4 27.8 27.6
(3.9) (4.1) (3.7) (3.1) (3.7) (3.7)
Paid work experience 1.00 0.96 0.99 0.96 0.94 0.97
(0.00) (0.20) (0.10) (0.20) (0.24) (0.18)
Observations 51 98 102 100 101 452
Notes: Baseline ability calculated from log keystrokes per minute in Epidata data entry test during
interviews. Recognition most important equals 1 if respondent indicates that receiving
"recognition for good peformance" on the job is of "greatest importance" (5 on 5-point scale)
during pre-employment interview.
25
Table 4: Average treatment effects
Dependent variable: log keystrokes per hour
(1) (2) (3) (4) (5)
Unconditional Controls Month FE Survey FE All Treatments
Treat: Indiv. Piece Rate 0.023 0.088** 0.034 0.034 0.039
(0.055) (0.041) (0.040) (0.040) (0.037)
Treat: Group Piece Rate 0.006 0.067 0.020 0.020 0.022
(0.054) (0.041) (0.041) (0.041) (0.037)
Male -0.027 -0.037 -0.037 -0.036*
(0.032) (0.029) (0.029) (0.021)
Baseline ability 0.208*** 0.209*** 0.209*** 0.225***
(0.041) (0.036) (0.036) (0.026)
Akan -0.028 -0.033 -0.033 -0.034*
(0.030) (0.027) (0.027) (0.019)
Data entry experience 0.005 -0.034 -0.034 -0.010
(0.035) (0.032) (0.032) (0.022)
Piece rate experience 0.009 0.047 0.047 0.032
(0.046) (0.040) (0.040) (0.027)
DEO's first contract -0.419*** -0.150*** -0.150*** -0.169***
(0.031) (0.052) (0.052) (0.034)
Recognition most imp. 0.025 0.036 0.036 0.025
(0.030) (0.027) (0.027) (0.019)
Treat: Indiv. Piece Rate with Rank 0.053
(0.038)
Treat: Group Piece Rate with Rank 0.041
(0.038)
Constant 8.379*** 8.170*** 7.824*** 7.824*** 7.790***
(0.044) (0.101) (0.121) (0.121) (0.097)
Observations 251 251 251 251 452
Adjusted R-squared -0.007 0.466 0.596 0.596 0.594
Notes: Baseline ability calculated from log keystrokes per minute in Epidata data entry test during interviews.
Recognition most important equals 1 if respondent indicates that receiving "recognition for good peformance"
on the job is of "greatest importance" (5 on 5-point scale) during pre-employment interview. Standard errors
in parentheses. * p<0.1 ** p<0.05 *** p<0.01

26
Table 5: Heterogenous treatment effects
Dependent variable: log keystrokes per hour
(1) (2) (3) (4) (5) (6) (7) (8)
Women Men
High
Ability
Low
Ability Experienced
Not
Experienced
Piece Rate
Experience
No Piece
Rate
Experience
Treat: Indiv. Piece Rate 0.043 0.030 0.030 0.058 0.040 0.056 -0.002 0.045
(0.083) (0.044) (0.050) (0.063) (0.046) (0.092) (0.160) (0.040)
Treat: Group Piece Rate 0.006 0.033 0.058 -0.008 0.025 0.049 -0.064 0.046
(0.088) (0.045) (0.050) (0.065) (0.046) (0.108) (0.161) (0.042)
Baseline ability per minute (log scale) 0.111 0.273*** 0.140 0.139* 0.197*** 0.298*** -0.019 0.274***
(0.075) (0.042) (0.094) (0.078) (0.041) (0.089) (0.103) (0.040)
Akan -0.002 -0.052* -0.038 -0.012 -0.056* 0.023 -0.032 -0.034
(0.058) (0.030) (0.038) (0.041) (0.032) (0.057) (0.091) (0.028)
Data entry experience -0.104 -0.004 0.001 -0.048 -0.162 0.003
(0.072) (0.035) (0.041) (0.049) (0.099) (0.033)
Piece rate experience 0.109 -0.042 0.007 0.133* -0.027 0.172**
(0.074) (0.050) (0.051) (0.073) (0.051) (0.071)
DEO's first contract -0.059 -0.150*** -0.103 -0.189** -0.145** -0.172 -0.423 -0.144***
(0.154) (0.057) (0.078) (0.074) (0.057) (0.161) (0.251) (0.052)
Recognition most imp. 0.083 0.022 0.043 0.034 0.036 0.077 -0.067 0.048*
(0.060) (0.030) (0.036) (0.040) (0.031) (0.062) (0.090) (0.027)
Observations 77 174 128 123 193 58 31 220
Adjusted R-squared 0.482 0.655 0.612 0.561 0.583 0.653 0.631 0.617
Notes: Baseline ability calculated from log keystrokes per minute in Epidata data entry test during interviews. Recognition most important equals 1 if
respondent indicates that receiving "recognition for good peformance" on the job is of "greatest importance" (5 on 5-point scale) during pre-
employment interview. Standard errors in parentheses. * p<0.1 ** p<0.05 *** p<0.01

27
Table 6: Mechanisms
Dependent variable: log keystrokes per hour
(1) (2) (3)
All
Treatments
Team Pay
Information
Individual
Pay
Information
IPR 0.039 0.036
(0.037) (0.039)
IPR rank 0.053 0.060
(0.038) (0.041)
GPR 0.022 0.018
(0.037) (0.037)
GPR rank 0.041 0.033
(0.038) (0.038)
Male -0.036* -0.021 -0.051*
(0.021) (0.026) (0.029)
Baseline ability 0.225*** 0.230*** 0.221***
(0.026) (0.035) (0.036)
Akan -0.034* -0.034 -0.038
(0.019) (0.024) (0.026)
Data entry experience -0.010 -0.039 0.013
(0.022) (0.028) (0.031)
Piece rate experience 0.032 0.033 0.031
(0.027) (0.034) (0.040)
DEO's first contract -0.169*** -0.162*** -0.160***
(0.034) (0.046) (0.052)
Recognition most imp. 0.025 0.039 0.005
(0.019) (0.024) (0.026)
Observations 452 254 249
Adjusted R-squared 0.594 0.644 0.579
Notes: Baseline ability calculated from log keystrokes per minute in Epidata data entry
test during interviews. Recognition most important equals 1 if respondent indicates that
receiving "recognition for good peformance" on the job is of "greatest importance" (5 on 5-
point scale) during pre-employment interview. Standard errors in parentheses. * p<0.1 **
p<0.05 *** p<0.01
28
Table 7: Quality vs. quantity
(1) (2)
Dependent variable:
correct keystrokes
per hour
log correct
keystrokes per hour
Treat: Indiv. Piece Rate 0.001 0.042
(0.004) (0.038)
Treat: Indiv. Piece Rate with Rank -0.003 0.048
(0.004) (0.039)
Treat: Group Piece Rate 0.003 0.017
(0.004) (0.039)
Treat: Group Piece Rate with Rank -0.001 0.039
(0.004) (0.039)
Epi Test: Correct Rate 0.043** 0.087
(0.018) (0.162)
Male 0.000 -0.035*
(0.002) (0.021)
Baseline ability 0.007**
(0.003)
Akan 0.001 -0.035*
(0.002) (0.019)
Data entry experience 0.006** -0.001
(0.002) (0.023)
Piece rate experience -0.009*** 0.008
(0.003) (0.028)
DEO's first contract -0.004 -0.166***
(0.004) (0.035)
Recognition most imp. -0.002 0.022
(0.002) (0.020)
Baseline accuracy 0.229***
(0.027)
Observations 452 452
Adjusted R-squared 0.201 0.243
Notes: Baseline ability equals from log keystrokes per minute in Epidata data entry test during
interviews. Baseline accuracy equals log correct keystrokes per minute in Epidata data entry
test during interviews. Recognition most important equals 1 if respondent indicates that
receiving "recognition for good peformance" on the job is of "greatest importance" (5 on 5-
point scale) during pre-employment interview. Standard errors in parentheses. * p<0.1 **
p<0.05 *** p<0.01
29
Table 8: Profitability
Dependent variable: estimated profits
(1) (2) (3)
Profit calculation:
Double
Entry
Double Entry
@ Recon
Double Entry @
Recon + False
Positives
Treat: Indiv. Piece Rate -0.025 -0.016 -0.015
(0.041) (0.034) (0.035)
Treat: Indiv. Piece Rate with Rank -0.041 -0.006 -0.007
(0.042) (0.035) (0.035)
Treat: Group Piece Rate -0.026 -0.031 -0.030
(0.041) (0.035) (0.035)
Treat: Group Piece Rate with Rank -0.050 -0.028 -0.022
(0.042) (0.035) (0.036)
Male 0.026 0.012 0.009
(0.023) (0.019) (0.019)
Baseline ability -0.198*** -0.141*** -0.147***
(0.029) (0.024) (0.025)
Akan 0.038* 0.017 0.020
(0.021) (0.017) (0.018)
Data entry experience -0.004 -0.033 -0.028
(0.024) (0.020) (0.020)
Piece rate experience -0.029 0.014 0.013
(0.030) (0.025) (0.025)
DEO's first contract 0.132*** 0.094*** 0.105***
(0.037) (0.031) (0.032)
Recognition most imp. -0.011 -0.002 -0.002
(0.021) (0.018) (0.018)
Observations 452 452 452
Adjusted R-squared 0.155 0.183 0.195
Notes: See section "Impact: Productivity, Accuracy and Profitability, Profits" for detailed
description of profit estimates. Baseline ability equals from log keystrokes per minute in
Epidata data entry test during interviews. Baseline accuracy equals log correct keystrokes
per minute in Epidata data entry test during interviews. Recognition most important
equals 1 if respondent indicates that receiving "recognition for good peformance" on the
job is of "greatest importance" (5 on 5-point scale) during pre-employment interview.
Standard errors in parentheses. * p<0.1 ** p<0.05 *** p<0.01.
30
Table 9: Interday treatment effects
(1) (2)
Ghana Day 1 Ghana Day 2
Treat: Indiv. Piece Rate 0.013 0.050
(0.037) (0.038)
Treat: Indiv. Piece Rate with Rank 0.017 0.072*
(0.038) (0.039)
Treat: Group Piece Rate -0.005 0.046
(0.038) (0.039)
Treat: Group Piece Rate with Rank 0.018 0.048
(0.038) (0.039)
Male -0.031 -0.047**
(0.021) (0.021)
Baseline ability 0.255*** 0.186***
(0.026) (0.027)
Akan -0.028 -0.040**
(0.019) (0.020)
Data entry experience -0.013 -0.023
(0.022) (0.023)
Piece rate experience 0.033 0.025
(0.027) (0.028)
DEO's first contract -0.220*** -0.136***
(0.034) (0.035)
Recognition most imp. 0.015 0.044**
(0.019) (0.020)
Observations 452 441
Adjusted R-squared 0.661 0.521
Notes: Baseline ability calculated from log keystrokes per minute in
Epidata data entry test during interviews. Recognition most important
equals 1 if respondent indicates that receiving "recognition for good
peformance" on the job is of "greatest importance" (5 on 5-point scale)
during pre-employment interview. Standard errors in parentheses. * p<0.1
** p<0.05 *** p<0.01

31
APPENDICES
APPENDIX 1: OFFICE SETUP

32
APPENDIX 2: RECRUITMENT
JOB ADVERTISEMENT: Data Entry Agent
TITLE: DATA ENTRY AGENT
COMPANY: IPA DATA SERVICES
INDUSTRY: BUSINESS SERVICES
CATEGORY: RESEARCH/ANALYSIS
LOCATION: ACCRA
JOB STATUS: TEMPORARY/SHORT TERM CONTRACTS
SALARY: NOT SPECIFIED
EDUCATION: SSS/HND/DEGREE
JOB SPECIFICATION
ENCODES DATA FROM DOCUMENT TO COMPUTER
33
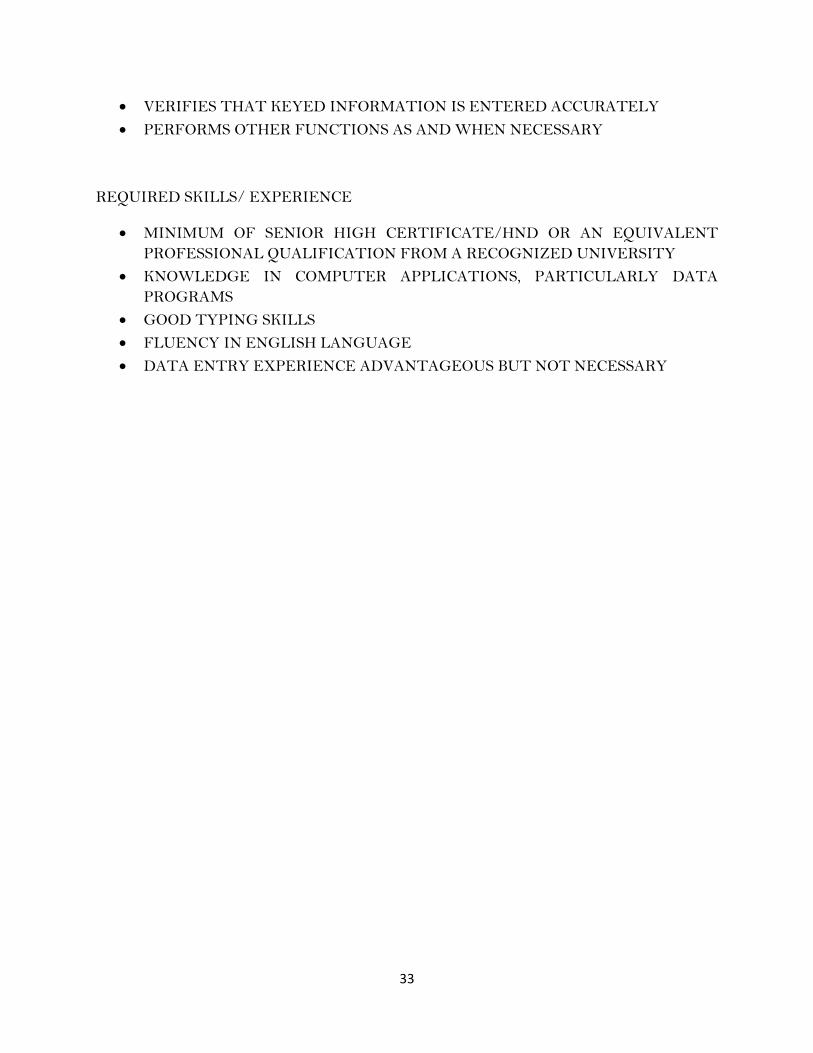
VERIFIES THAT KEYED INFORMATION IS ENTERED ACCURATELY
PERFORMS OTHER FUNCTIONS AS AND WHEN NECESSARY
REQUIRED SKILLS/ EXPERIENCE
MINIMUM OF SENIOR HIGH CERTIFICATE/HND OR AN EQUIVALENT
PROFESSIONAL QUALIFICATION FROM A RECOGNIZED UNIVERSITY
KNOWLEDGE IN COMPUTER APPLICATIONS, PARTICULARLY DATA
PROGRAMS
GOOD TYPING SKILLS
FLUENCY IN ENGLISH LANGUAGE
DATA ENTRY EXPERIENCE ADVANTAGEOUS BUT NOT NECESSARY
34
35
APPENDIX 3: INTERVIEW
Baseline Excel Test
Baseline Epidata Test
36
37
38
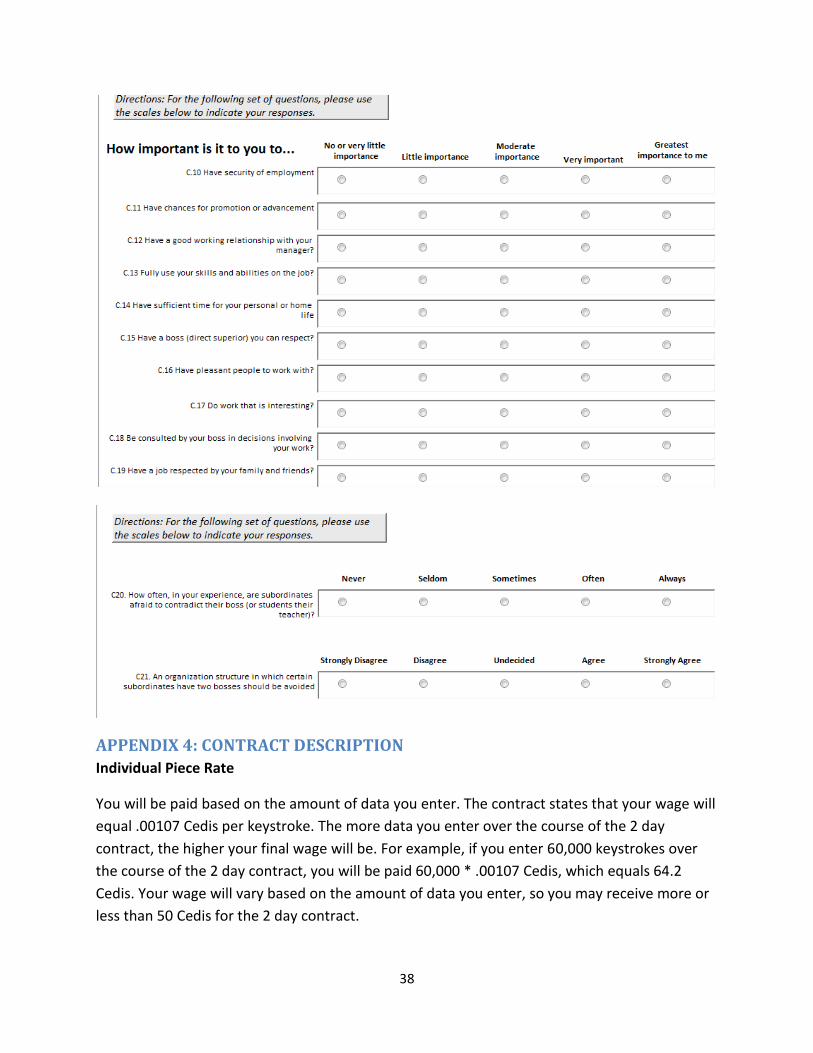
APPENDIX 4: CONTRACT DESCRIPTION
Individual Piece Rate
You will be paid based on the amount of data you enter. The contract states that your wage will
equal .00107 Cedis per keystroke. The more data you enter over the course of the 2 day
contract, the higher your final wage will be. For example, if you enter 60,000 keystrokes over
the course of the 2 day contract, you will be paid 60,000 * .00107 Cedis, which equals 64.2
Cedis. Your wage will vary based on the amount of data you enter, so you may receive more or
less than 50 Cedis for the 2 day contract.
39
APPENDIX 5: HOFSTEDE INDIVIDUALISM MAP

40
APPENDIX TABLES
Table A1: Abnormal hours
(1) (2) (3) (4) (5)
Unconditional Controls Month FE Survey FE All Treatments
Treat: Indiv. Piece Rate 0.053 0.046 0.012 0.012 0.015
(0.049) (0.051) (0.056) (0.056) (0.052)
Treat: Group Piece Rate 0.020 0.018 -0.006 -0.006 -0.020
(0.049) (0.050) (0.058) (0.058) (0.052)
Gender (=1 if male) -0.020 -0.019 -0.019 -0.007
(0.040) (0.040) (0.040) (0.029)
Baseline ability per minute (log scale) 0.024 0.020 0.020 -0.019
(0.050) (0.052) (0.052) (0.037)
Akan (=1 if akan) 0.048 0.048 0.048 0.023
(0.037) (0.038) (0.038) (0.026)
Data entry experience (=1 if yes) -0.018 -0.028 -0.028 -0.005
(0.044) (0.045) (0.045) (0.030)
Piece rate experience (=1 if yes) -0.037 -0.020 -0.020 0.023
(0.056) (0.057) (0.057) (0.038)
DEO's first contract 0.011 0.070 0.070 0.038
(0.038) (0.075) (0.075) (0.047)
Recognition most imp. 0.044 0.047 0.047 0.055**
(0.037) (0.038) (0.038) (0.026)
Treat: Indiv. Piece Rate with Rank -0.029
(0.053)
Treat: Group Piece Rate with Rank -0.053
(0.053)
Constant 0.059 -0.005 -0.104 -0.104 -0.024
(0.040) (0.124) (0.172) (0.172) (0.135)
Observations 251 251 251 251 452
Adjusted R-squared -0.003 -0.011 -0.018 -0.018 0.015
Standard errors in parentheses. * p<0.1 ** p<0.05 *** p<0.01
41
Table A2: Baseline ability
Flat Wage IPR GPR IPR Rank GPR Rank Total
mean/sd mean/sd mean/sd mean/sd mean/sd mean/sd
Baseline ability 2.08 2.10 2.11 2.04 2.12 2.09
(0.36) (0.40) (0.33) (0.38) (0.34) (0.36)
Baseline accuracy 2.00 2.03 2.05 1.96 2.06 2.02
(0.36) (0.41) (0.34) (0.38) (0.35) (0.37)
Observations 51 98 102 100 101 452
Notes: Baseline ability calculated from log keystrokes per minute in Epidata data entry test during
interviews. Baseline accuracy adjusts abilty for errors.
Table A3: Endline performance detail by contract
Flat Wage IPR GPR IPR Rank GPR Rank Total
Prouctivity measure (logs) mean/sd mean/sd mean/sd mean/sd mean/sd mean/sd
Endline key strokes/hr 8.38 8.40 8.38 8.42 8.42 8.40
(0.32) (0.31) (0.32) (0.31) (0.28) (0.31)
Endline accurate key strokes/hr 6.79 6.82 6.81 6.81 6.83 6.82
(0.19) (0.25) (0.24) (0.25) (0.20) (0.23)
Cost per entry -3.71 -3.72 -3.74 -3.70 -3.73 -3.72
(0.20) (0.24) (0.19) (0.20) (0.18) (0.20)
Endline key strokes/hr day 1 8.29 8.28 8.26 8.28 8.30 8.28
(0.35) (0.35) (0.35) (0.34) (0.31) (0.34)
Endline key strokes/hr day 2 8.47 8.51 8.51 8.54 8.52 8.51
(0.31) (0.29) (0.30) (0.29) (0.27) (0.29)
Observations 51 98 102 100 101 452