Embed Size (px)
Citation preview
Can integrated modelling support catchment management? A case study of the River Dee, Scotland
Bill Slee, Bedru Balana, Susan Cooksley, Sarah Dunn, Leah Jackson-Blake, Rachel Helliwell, Julia Martin-Ortega and Angel Perni
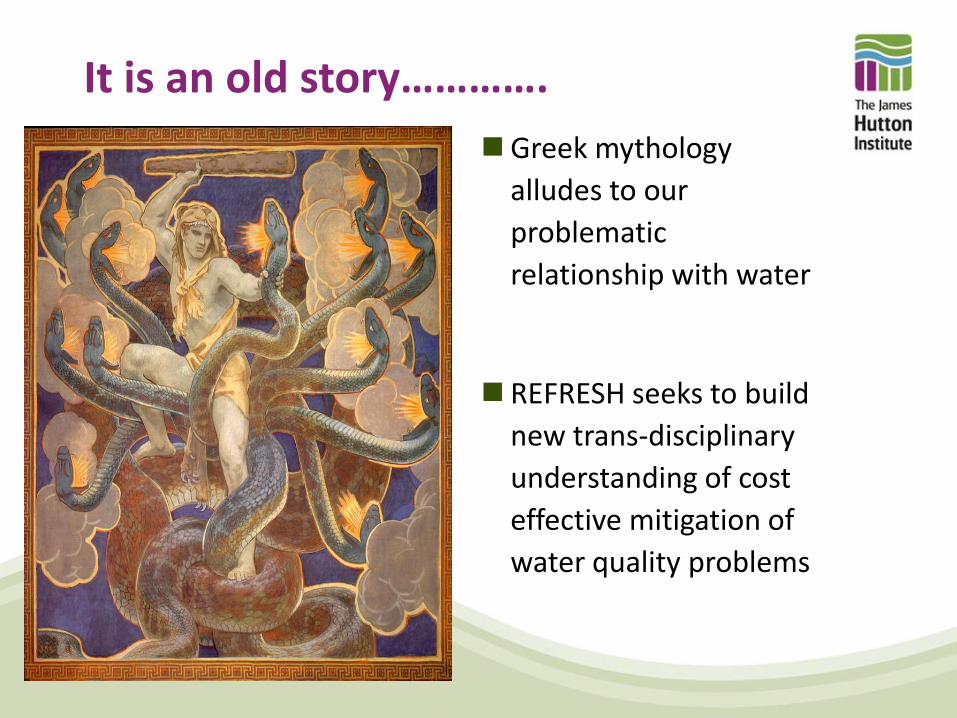
It is an old story………….
Greek mythology
alludes to our
problematic
relationship with water
REFRESH seeks to build
new trans-disciplinary
understanding of cost
effective mitigation of
water quality problems
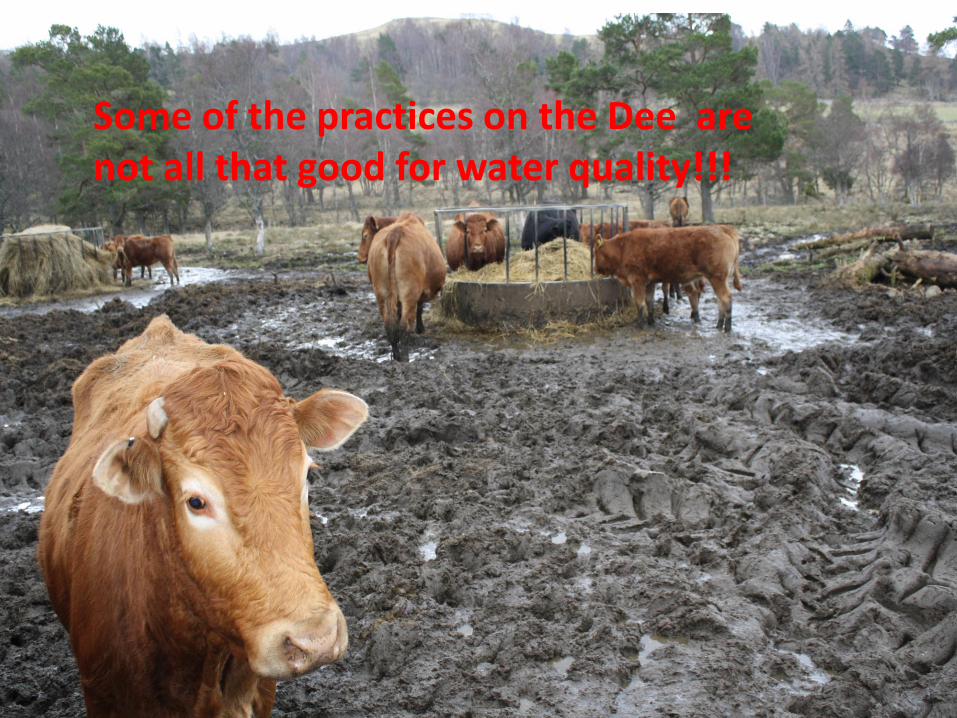
Some of the practices on the Dee are not all that good for water quality!!!
What I intend to talk about
How have water quality problems arisen?
The three worlds of catchment management (regulatory,
practical and theoretical)
The modelling challenges
The REFRESH approach to bio-economic modelling
The need for (and challenge of) socially cost effective
mitigation of water pollution
The farm level marginal abatement challenge
Some conclusions
How have water quality problems on the Dee arisen?
The Water Framework Directive
specifies a requirement for:
Good Ecological Status including Good Morphological Status
Both can be seen to be
compromised on the Dee
catchment to different degrees
in different parts of the
catchment. It is not all good
Rural land use is implicated in diffuse pollution
Nitrates from fertilisers or ploughed pasture
Phosphates from fertiliser
Pesticide residues
Forestry ploughing and timber extraction
Cattle waterings
Lack of trees
But some rural land use effects are more like mini-point pollution
Yard washings
Silage leachate ‘bree’
Food or timber processing plant leaks
The causes are not just farming and forestry practices
Septic tanks are (or could be) an issue
Acid deposition (nutrient enrichment and acidification)
Climate change exacerbates the effects through extreme events
Temperature
Extreme weather events
Fishing interests introduce morphological interventions
Industry can cause pollution incidents
Urbanisation can increase runoff & pollution incidents
Open grouse moor and deer forest leads to water temperature rises
Quarrying can increase sediment load
The modelling challenge
We must model- either intuitively or formally in order to try and direct
improvements to the system. This requires
Understanding the association and causation between land management practices, climate change and water ecological and morphological consequences, including the impact of extreme events
Understanding at a scale which can be translated into accurate specification of remedial practices
Understanding the diversity of farm economic situations, so that cost effectiveness and proportionality can be reasonably established/attributed
Understanding the non-market costs and benefits to feed into spatially explicit catchment models
Understanding both trickle and pulse effects
This requires very good data and rather sophisticated bio-economic modelling with both geochemical and socio-economic elements
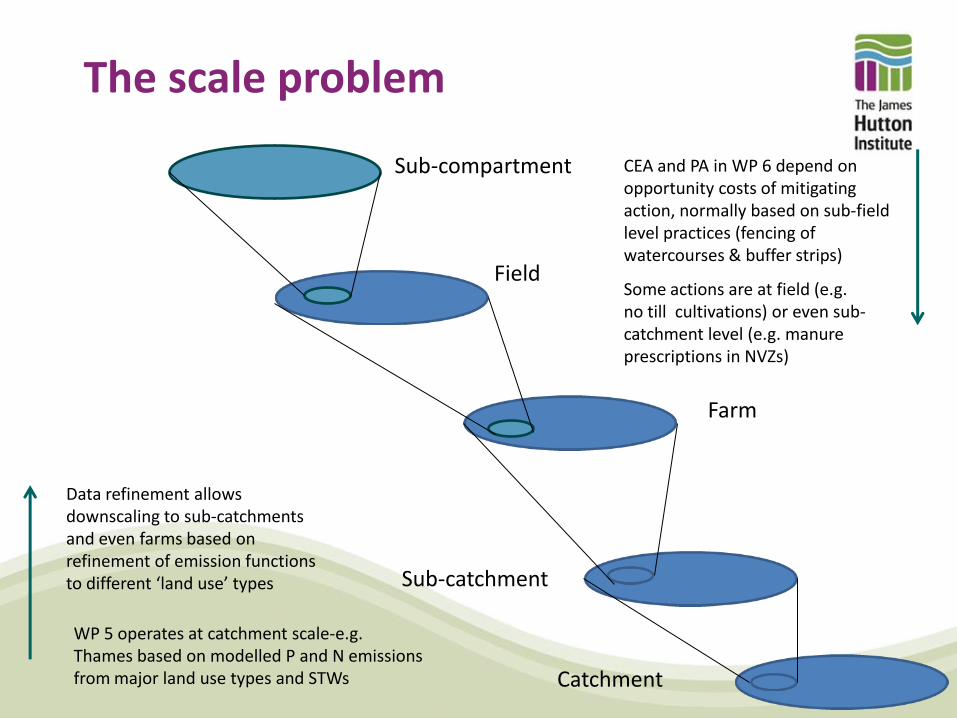
The scale problem
Sub-compartment
Farm
Sub-catchment
Catchment
WP 5 operates at catchment scale-e.g. Thames based on modelled P and N emissions from major land use types and STWs
Data refinement allows downscaling to sub-catchments and even farms based on refinement of emission functions to different ‘land use’ types
CEA and PA in WP 6 depend on opportunity costs of mitigating action, normally based on sub-field level practices (fencing of watercourses & buffer strips)
Some actions are at field (e.g. no till cultivations) or even sub-catchment level (e.g. manure prescriptions in NVZs)
Field
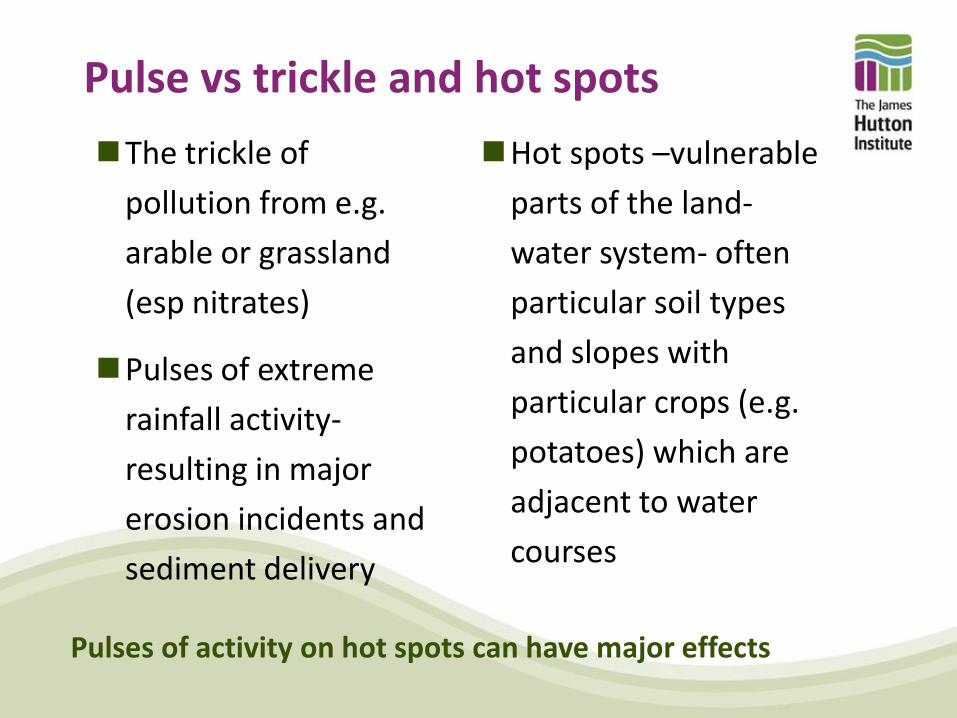
Pulse vs trickle and hot spots
The trickle of
pollution from e.g.
arable or grassland
(esp nitrates)
Pulses of extreme
rainfall activity-
resulting in major
erosion incidents and
sediment delivery
Hot spots –vulnerable
parts of the land-
water system- often
particular soil types
and slopes with
particular crops (e.g.
potatoes) which are
adjacent to water
courses
Pulses of activity on hot spots can have major effects
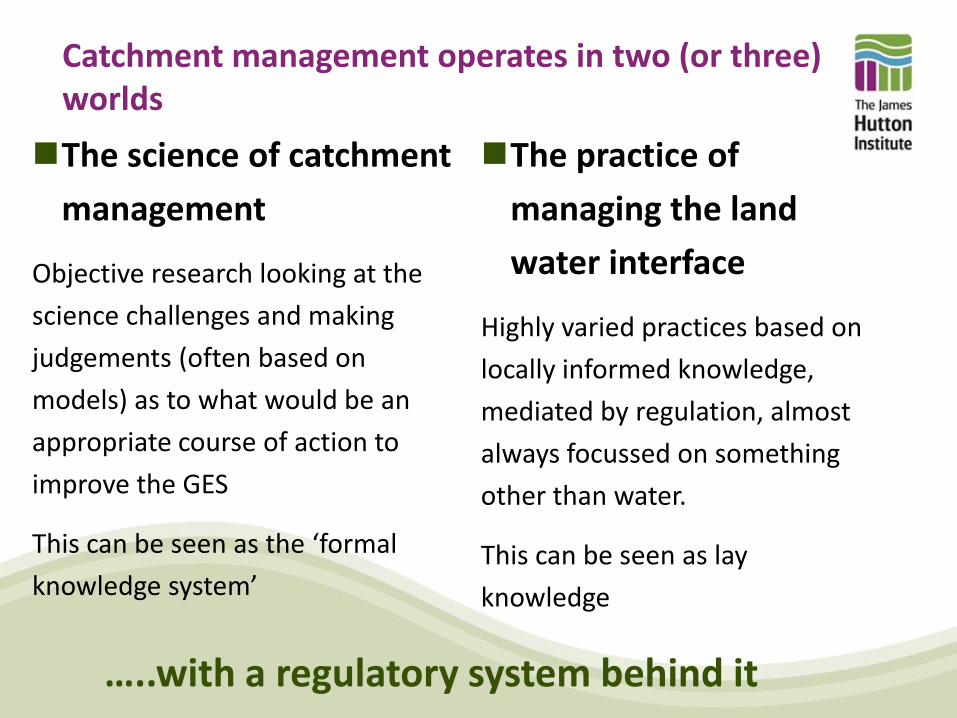
Catchment management operates in two (or three) worlds
The science of catchment
management
Objective research looking at the
science challenges and making
judgements (often based on
models) as to what would be an
appropriate course of action to
improve the GES
This can be seen as the ‘formal
knowledge system’
The practice of
managing the land
water interface
Highly varied practices based on
locally informed knowledge,
mediated by regulation, almost
always focussed on something
other than water.
This can be seen as lay
knowledge
…..with a regulatory system behind it
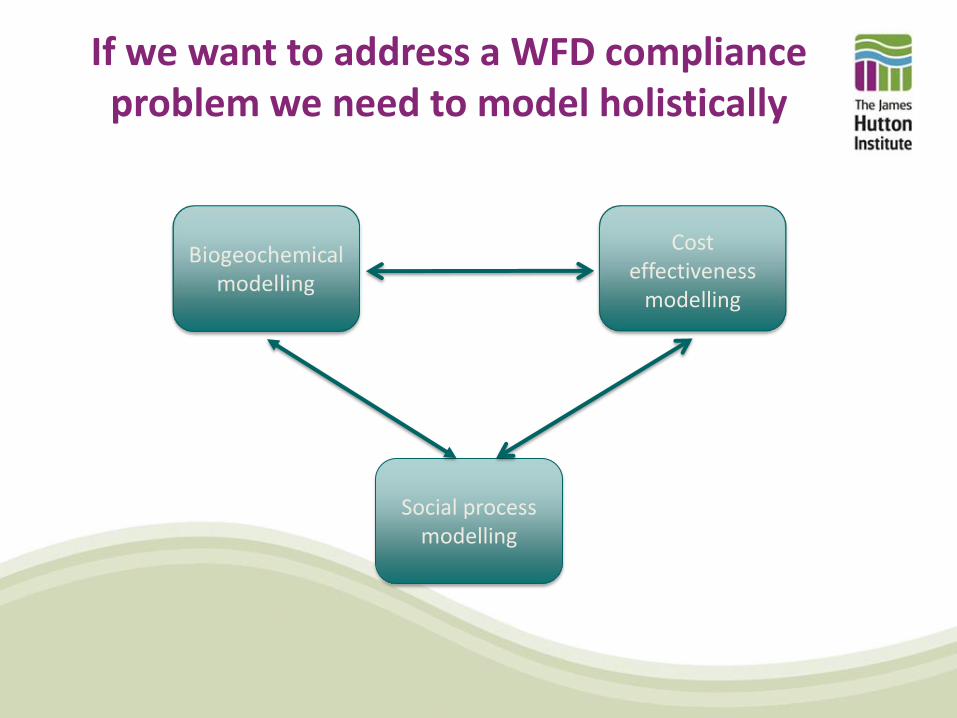
If we want to address a WFD compliance problem we need to model holistically
Social process modelling
Cost effectiveness
modelling
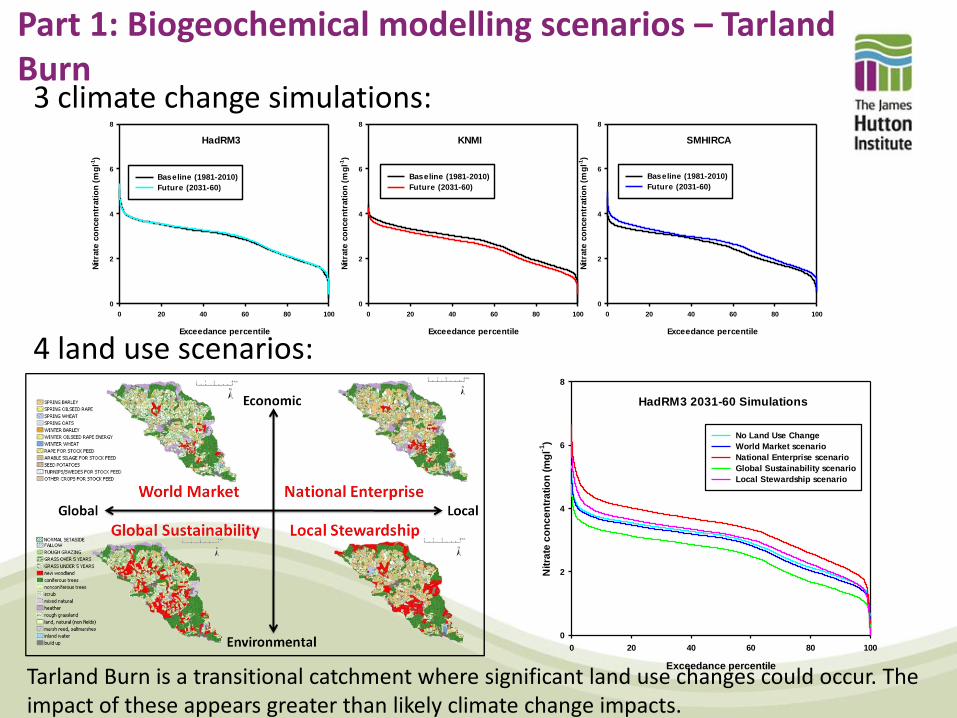
Part 1: Biogeochemical modelling scenarios – Tarland Burn
Tarland Burn is a transitional catchment where significant land use changes could occur. The impact of these appears greater than likely climate change impacts.
HadRM3
Exceedance percentile
0 20 40 60 80 100
Nit
rate
co
nce
ntr
ati
on
(m
gl-1
)
0
2
4
6
8
Baseline (1981-2010)
Future (2031-60)
KNMI
Exceedance percentile
0 20 40 60 80 100
Nit
rate
co
nce
ntr
ati
on
(m
gl-1
)
0
2
4
6
8
Baseline (1981-2010)
Future (2031-60)
SMHIRCA
Exceedance percentile
0 20 40 60 80 100
Nit
rate
co
nce
ntr
ati
on
(m
gl-1
)
0
2
4
6
8
Baseline (1981-2010)
Future (2031-60)
HadRM3 2031-60 Simulations
Exceedance percentile
0 20 40 60 80 100
Nit
rate
co
nc
en
tra
tio
n (
mg
l-1)
0
2
4
6
8
No Land Use Change
World Market scenario
National Enterprise scenario
Global Sustainability scenario
Local Stewardship scenario
3 climate change simulations:
4 land use scenarios:
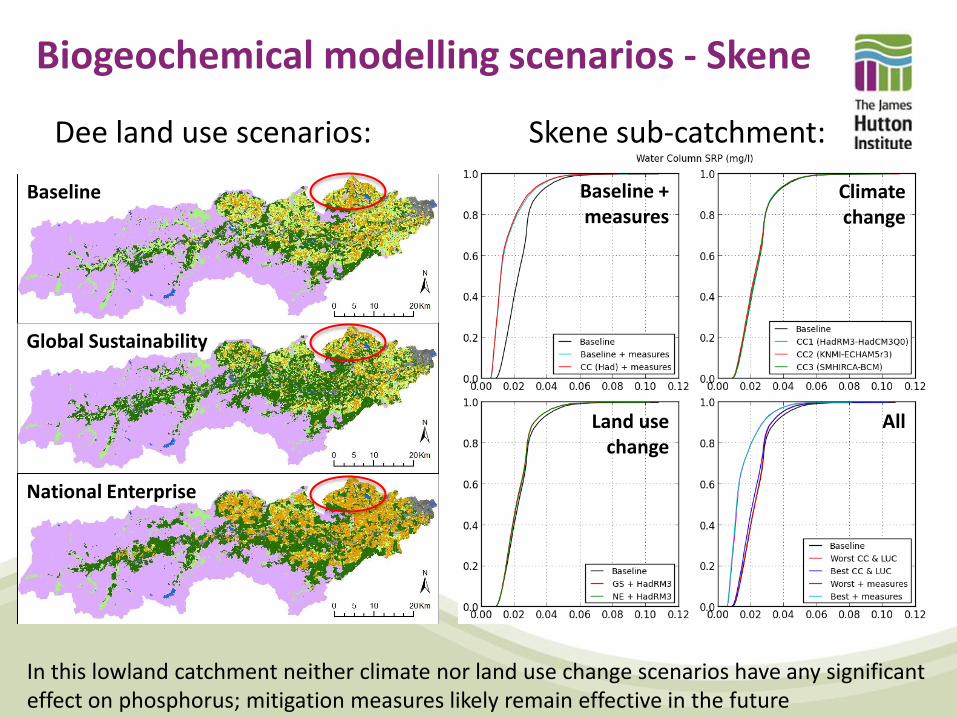
Biogeochemical modelling scenarios - Skene
Skene sub-catchment:
In this lowland catchment neither climate nor land use change scenarios have any significant effect on phosphorus; mitigation measures likely remain effective in the future
Baseline
Global Sustainability
National Enterprise
Dee land use scenarios:
Climate change
Land use change
Baseline + measures
All
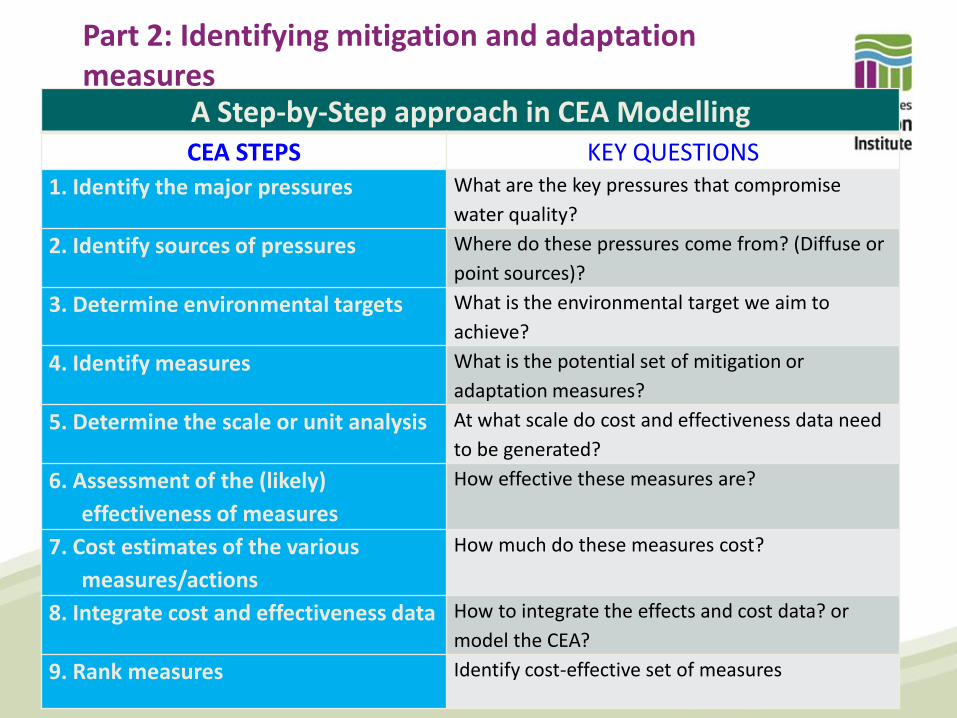
Part 2: Identifying mitigation and adaptation measures
A Step-by-Step approach in CEA Modelling CEA STEPS KEY QUESTIONS
1. Identify the major pressures What are the key pressures that compromise
water quality?
2. Identify sources of pressures Where do these pressures come from? (Diffuse or
point sources)?
3. Determine environmental targets What is the environmental target we aim to
achieve?
4. Identify measures What is the potential set of mitigation or
adaptation measures?
5. Determine the scale or unit analysis At what scale do cost and effectiveness data need
to be generated?
6. Assessment of the (likely)
effectiveness of measures
How effective these measures are?
7. Cost estimates of the various
measures/actions
How much do these measures cost?
8. Integrate cost and effectiveness data How to integrate the effects and cost data? or
model the CEA?
9. Rank measures Identify cost-effective set of measures
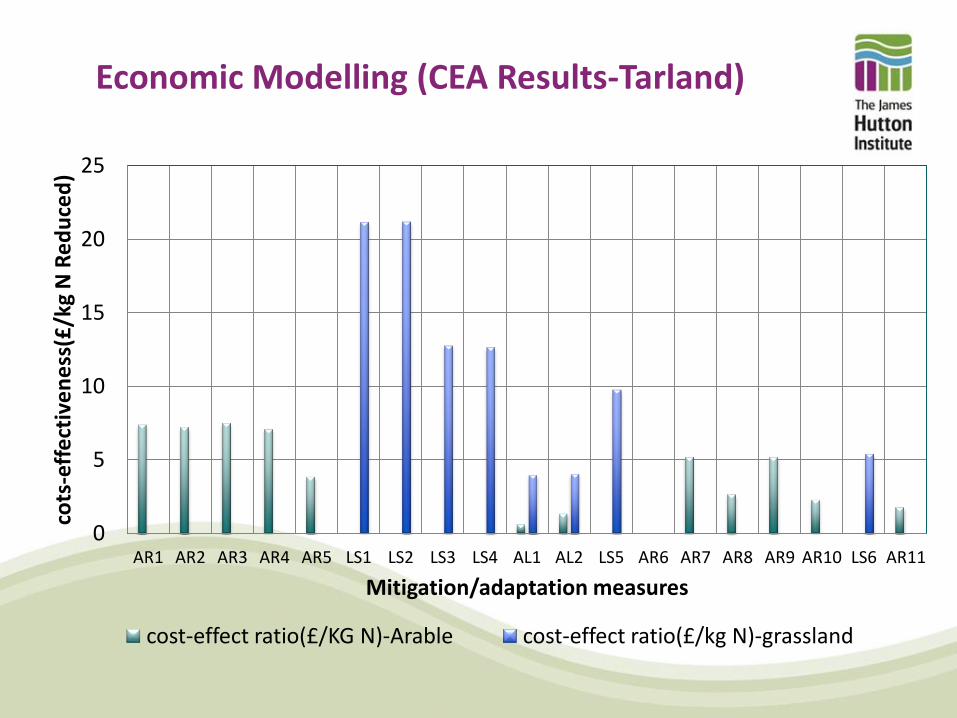
Economic Modelling (CEA Results-Tarland)
0
5
10
15
20
25
AR1 AR2 AR3 AR4 AR5 LS1 LS2 LS3 LS4 AL1 AL2 LS5 AR6 AR7 AR8 AR9 AR10 LS6 AR11
cots
-eff
ect
ive
ne
ss(£
/kg
N R
ed
uce
d)
Mitigation/adaptation measures
cost-effect ratio(£/KG N)-Arable cost-effect ratio(£/kg N)-grassland
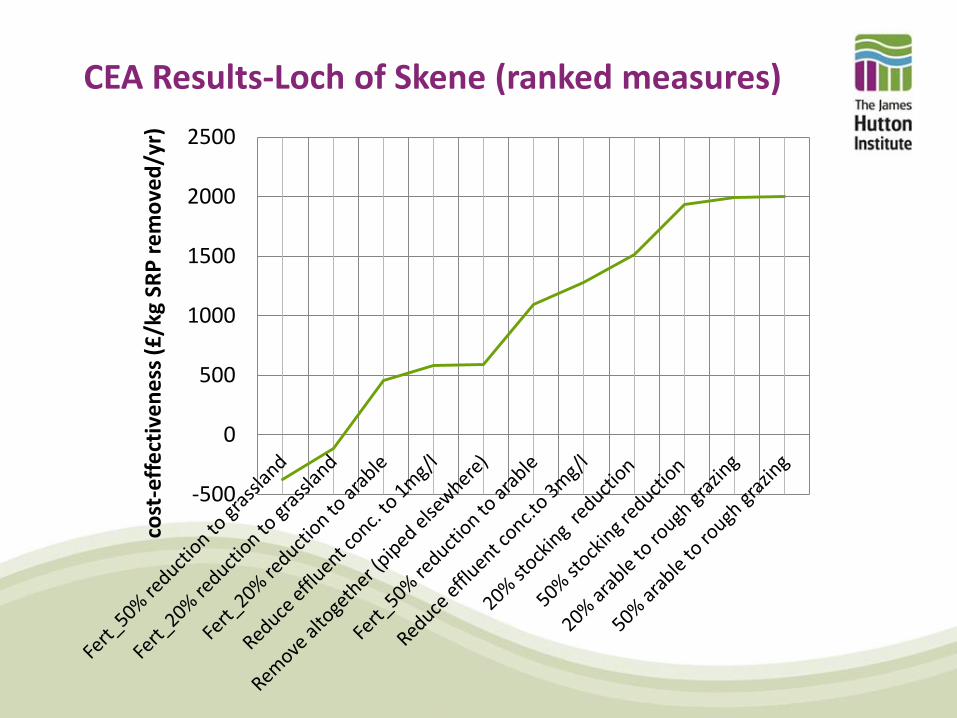
CEA Results-Loch of Skene (ranked measures)
-500
0
500
1000
1500
2000
2500 co
st-e
ffe
ctiv
en
ess
(£
/kg
SRP
re
mo
ved
/yr)
Part 3: Engaging with stakeholders
Building upon the solid roots of the Dee Catchment
Partnership
Designed as a two ways dialogue:
Gather local knowledge on the key pressures and their sources, available measures, barriers, sources of information for costs and benefits, etc.
Ground-truthing/validating modelling results
Through a series of local workshops, personal interviews
and follow-up contact with land owners and
representatives of nature organizations, the environmental
agency (SEPA), local councils, local estate, sailing clubs and
Scottish Water
Summary: the basic requirement if we are to mitigate cost-effectively An understanding of the biophysical consequences of land
management practices
A farm/estate scale understanding of the current state of play:
stocking rates; grazing regimes; watering; fencing, fertiliser
applications, other inputs, drainage, yields
An understanding of the opportunity costs of delivering
improvements, changing fertiliser regimes – what income is
foregone, what costs are saved
An understanding of the capital costs of different actions
(fencing, buffer strips, etc) and the effective life of that capital
An understanding of other non-market values impacted (e.g.
scenery or biodiversity)
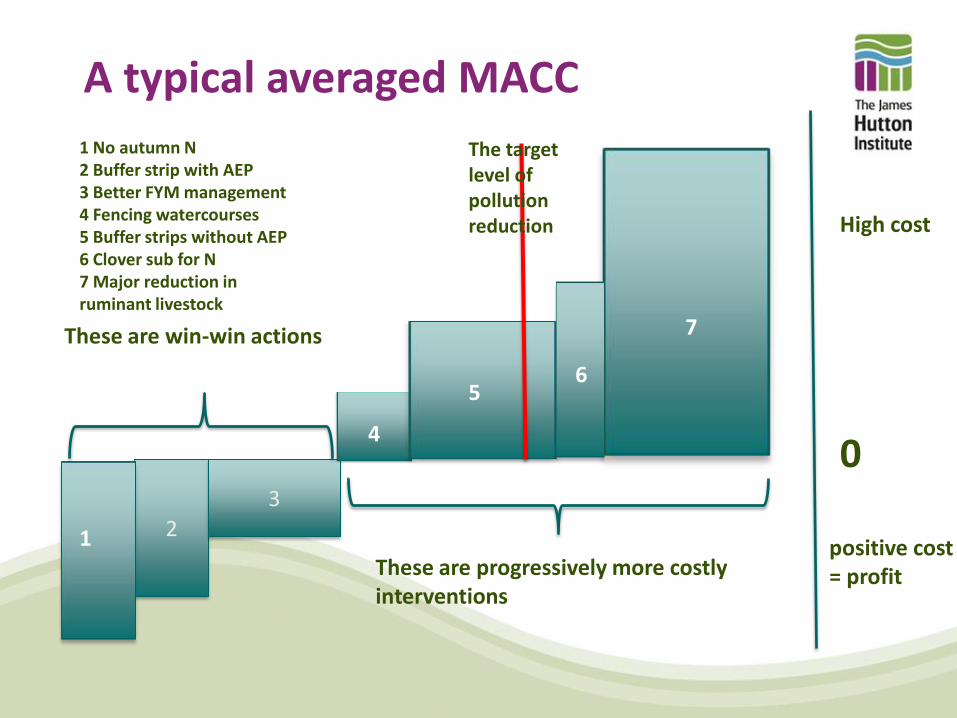
A typical averaged MACC
2
3
1
4
5 6
7 These are win-win actions
0
These are progressively more costly interventions
High cost
positive cost = profit
1 No autumn N 2 Buffer strip with AEP 3 Better FYM management 4 Fencing watercourses 5 Buffer strips without AEP 6 Clover sub for N 7 Major reduction in ruminant livestock
The target level of pollution reduction
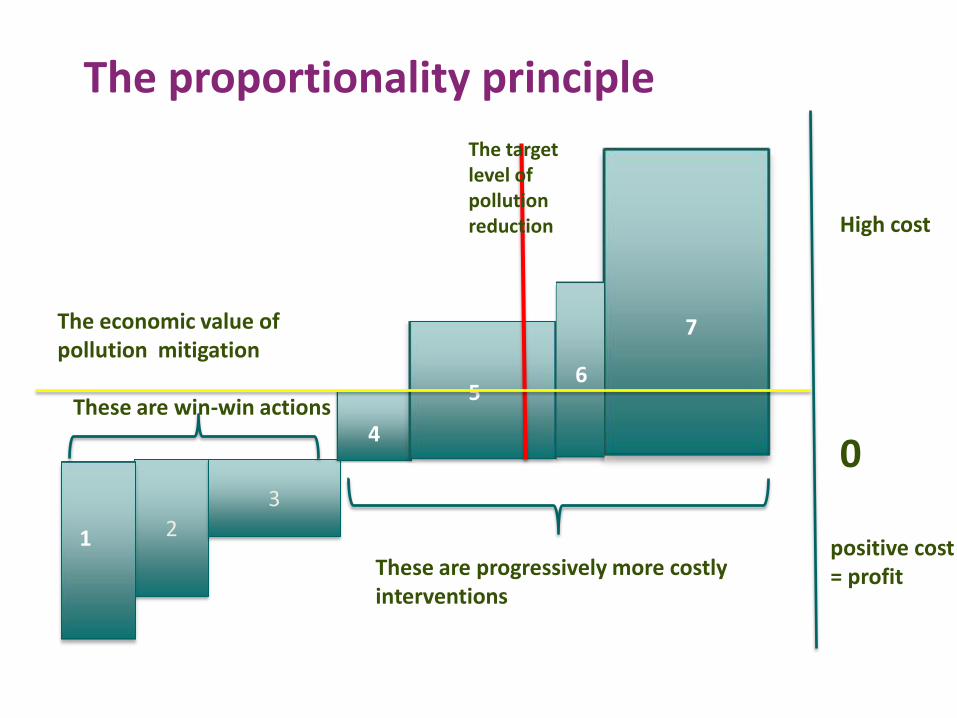
The proportionality principle
2
3
1
4
5 6
7
These are win-win actions
0
These are progressively more costly interventions
High cost
positive cost = profit
The target level of pollution reduction
The economic value of pollution mitigation
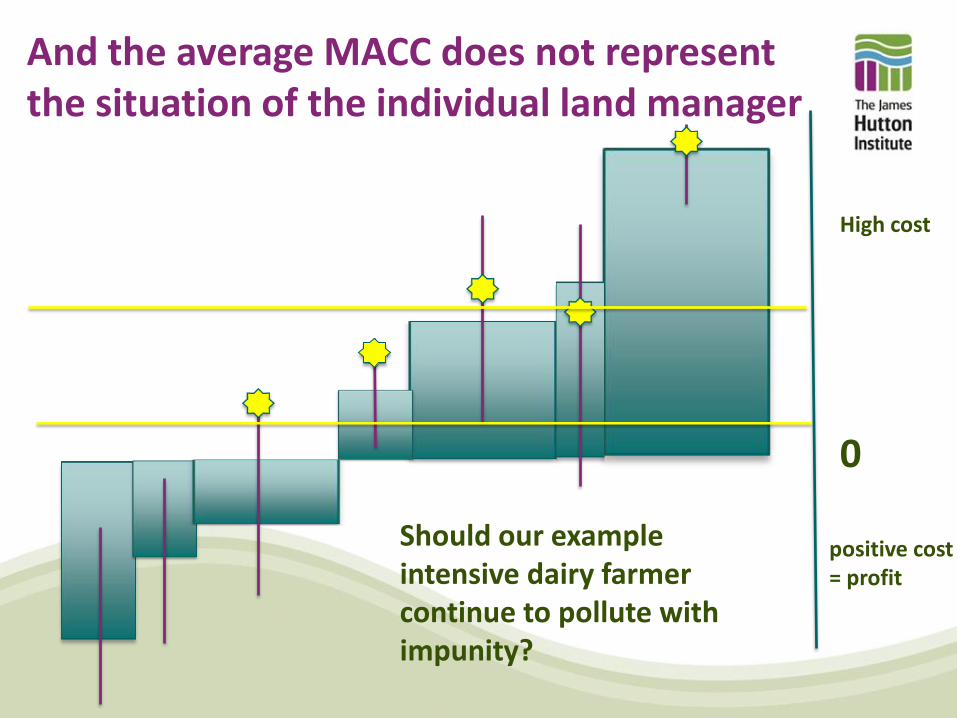
And the average MACC does not represent the situation of the individual land manager
4 0
High cost
positive cost = profit
Should our example intensive dairy farmer continue to pollute with impunity?
Case Study A: Growing barley in the Leuchar burn sub-catchment
Good Ecological/Morphological Status suggests that channel dredging is undesirable
A small farmer’s arable fields abut one of the problematic and more polluted watercourses on the Dee
Harvesting one field of spring barley was severely compromised by waterlogging 20% of the field nearest the stream
This waterlogging will increase Nitrous Oxide emissions, decrease nitrates to water but add to Greenhouse gas emissions- pollution swapping.
Does the ‘wellbeing’ of that water body really require that one of the only arable fields abutting the stream cannot have 300 metres of adjacent stream dredged? Are we being proportionate here?
We are in danger of looking for a solution to one (maybe small) water environmental problem and causing another environmental problem and a negative income effect on the basis of weak evidence base.
Case study B Pulse vs trickle
Extreme events can be hugely important in phosphate pollution
Gully erosion and massive soil and phosphate losses into Loch
of Skene (a shallow lake) in autumn 2010 and into the main
A944 road which was blocked for many hours
Most normal interventions reduce trickle effects (e.g. winter
stubble), but the big pulses may cause a real problem with
phosphates and normal remediation strategies may not work.
We need more information on effectiveness of different
measures under different conditions (e.g. does it matter what
the slope is of a winter stubble or how close to a stream?)
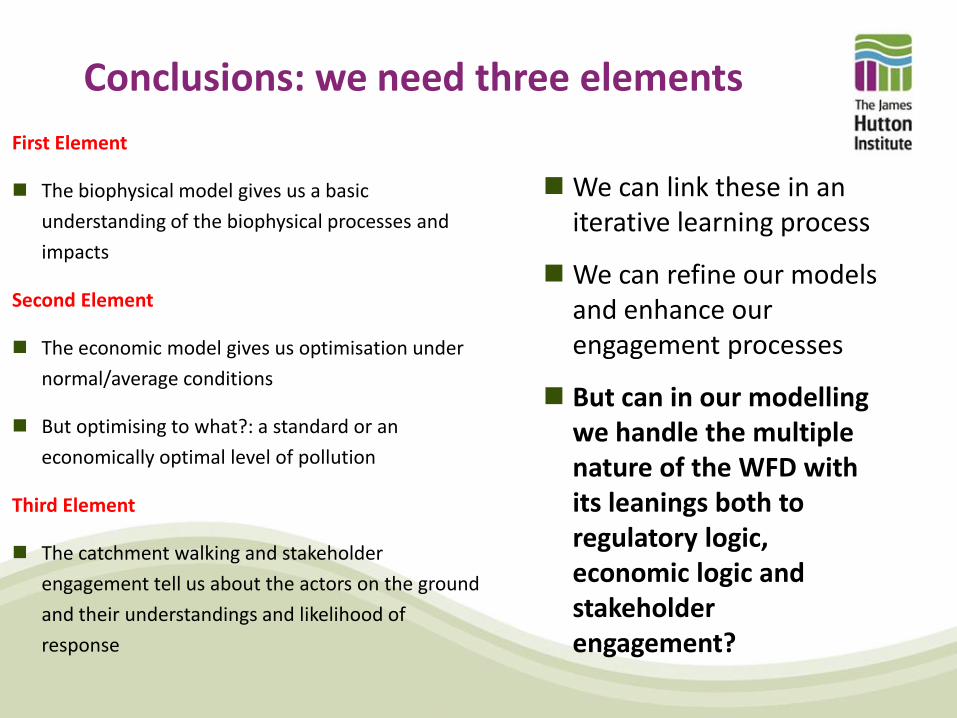
Conclusions: we need three elements
First Element
The biophysical model gives us a basic
understanding of the biophysical processes and
impacts
Second Element
The economic model gives us optimisation under
normal/average conditions
But optimising to what?: a standard or an
economically optimal level of pollution
Third Element
The catchment walking and stakeholder
engagement tell us about the actors on the ground
and their understandings and likelihood of
response
We can link these in an iterative learning process
We can refine our models and enhance our engagement processes
But can in our modelling we handle the multiple nature of the WFD with its leanings both to regulatory logic, economic logic and stakeholder engagement?
We have made very considerable progress in building bridges between bio-geochemical and economic models on the Dee at sub-catchment scale Our understanding of causes of diffuse pollution(and climate change effects) and cost effective interventions is enhanced But we must ground interventions in an understanding of practice
Thank you