Embed Size (px)
Citation preview
Thomas Smith 913356676
3/17/17
1
Can Macroeconomic Conditions Affect Enrollments in Higher Education? A
Study of U.S. College Enrollment Rates From 2002-2014
Thomas Smith
University of California, Davis
March 2017
Abstract
In a recession, the opportunity cost to pursue both college degrees and vocational
certificates drops, but does it push groups of students to choose one path over the other? Are
students’ choices of major directly affected by the state of the economy? This research focuses on
how recession affects students’ decisions to pursue post-secondary education. This study analyzes
data from The Integrated Postsecondary Education Data System on enrollment rates over the
admission years spanning 2002-2014. It is found that Hispanic students enroll into higher-
education at times opposite than economic theory would predict, relative to other ethnicities. Also,
evidence of major switching from non-STEM to STEM majors is found. These findings may be
due to significant changes in the opportunity cost to attend higher education as well as a large drop
in the consumption value of degrees with high intrinsic value.

Thomas Smith 913356676
3/17/17
2
Intro/Motivation
Colleges and universities have utilized various methods of managed enrollment techniques
since the pilgrims arrived (Kroc and Hanson 2001), but it wasn’t until the late 1970s and 1980s
that US colleges were forced to formally develop these managed enrollment techniques (Hossler
and Kalsbeek 2014). College enrollment rates were declining throughout the late 1970s and 1980s
but the colleges that mastered enrollment techniques, such as organized recruiting, prospered. As
demographics changed, enrollment management techniques changed with them; now institutions
control the size and characteristics of their student populations (Hossler and Kalsbeek 2014). In
the late 1980s, enrollment management also started to focus on completion of degrees in a timely
fashion (Kroc and Hanson 2001) and even expanded into offering financial aid. While managed
enrollment techniques have changed over time the process of deciding on higher educational
pathways has remained relatively constant.
By understanding how prospective students react to the change in the economy, school
recruiters can proactively target the desired demographics. Furthermore, this helps efficiency in
the allocation of resources when it is needed most as the budget for schools tightens in recession.
By proactively managing enrollments, schools will be able to slow down overheating majors which
may limit hardships post-graduation. Also, they will be able to expand majors that have a smaller
proportion of students when there are booms, but rapidly expand when there are recessions.
When students are deciding on a school and major they are taking many things into
consideration, but they may be looking past some of the most important questions. As the reliance
on student loans increases, the need for the ability to find a job post-graduation increases
exponentially. Students who drop out or cannot find a job after completing a degree may be worse
off because of their lower returns from education and increased indebtedness (Archibald 2002;
Boyd 1997; Clark 1999). Having the ability to properly evaluate degrees and pathways is essential
to maximizing the probability of being successful in times of financial stress. Thus, choosing a
major in which the probability of obtaining a job post-graduation should be moving to the top of
concerns for prospective students.
Understanding enrollment trends and how they are affected by changes in the business
cycle is crucial for institutions to effectively utilize enrollment management. Also, understanding
how the job market changes due to economic shocks is essential for students to effectively choose
majors that are conducive to employment post-graduation. This research explores how changes in
enrollment proportions based on gender, ethnicity, major, and institution can be explained by
economic shocks. I also explore the role of economic incentives in college-choice decision.
In the background section of this paper I will examine how this paper is relevant to the
literature around enrollment in post-secondary education and economic conditions. The theoretical
framework section will map the valuing of degrees by students. It will also highlight further the
importance of the need for schools to understand how students react to these changes and how it
may benefit both students and schools with greater effects than at a singular level. The data section
explains the methodology of gathering the data, sources of the data, and importance of the data.
The model section will display the regression analysis equation that this paper will implement to
find correlations within the data and weigh the impacts these correlations have.
Thomas Smith 913356676
3/17/17
3
The analysis approach of this paper follows the basic scientific method. I began with
collecting data from accredited sources. I then reshaped and formatted the data to a form that is
suitable for regression analysis. Following the data formatting I used inductive reasoning to
formulate an inference about enrollment trends in higher education. I also created a theoretical
framework describing the possible relationship between the variables. I then tested this theoretical
framework using a fixed effect regression analysis model. Finally, I analyzed the findings from
my regression and compared them with my hypothesis.
The findings of this paper should help bridge the gap between administrators who are
involved in enrollment management and students who need help choosing conducive majors in
times of negative economic conditions. This paper should be useful for both prospective students
and college institutions.
Background
The literature showing the relationship between recession and college, such as how The
Great Recession affected college affordability, enrollments and expenditures; also, how college
enrollments are related to economic growth and inflation is extensive (Long 2014; Ewing,
Beckerta and Ewing 2010). This paper will contribute to the growing literature and examine how
people of different genders and ethnicities react to these changes in the economy when choosing
their route to education and field of specialty. People of different races and genders may be
influenced by various economic fluctuations differently due to their initial socioeconomic
conditions. This may influence rates of enrollment by students of each race and gender and together
with macroeconomic conditions it could shape the enrollment proportions in higher educational
institutions. I also hypothesize that the increase of enrollments in postsecondary institutions will
be due mainly to Junior College and vocational training because of the barriers to entry in
universities.
Although the opportunity cost to pursue higher-education drops in recession, universities
have barriers to entry, such as SAT scores and high school diploma requirements, which may push
people into programs like Junior Colleges and vocational training. Junior College enrollments and
vocational training programs, along with the traditional four-year university will shape how the
effects of the business cycle changes people’s decisions towards higher education.
The educational outreach aspect of strategic enrollment management has helped
universities increase the overall accessibility to postsecondary education. However, the increase
in accessibility is also due to other factors, such as: state appropriation, state of the economy, and
earning differentials (Long 2004; Dellas and Sakellaris 2003; Card and Lemieux 2000). Those
factors are not controlled by the university, therefore are exogenous to the control of the university.
Furthermore, research shows that students will weigh the benefits of education with the cost, but
the returns to education are affected by the economic climate and may be over looked when
students are making that decision (Dejong and Ingram 2001; Becker 1964). The loss of job
experience from not finding a job post-graduation decreases the returns from education
exponentially the longer this duration of unemployment persists, as Dejong and Ingram showed
(Dejong and Ingram 2001). Thus, this factor should not be overlooked when valuing educational
attainment.
The extensive literature on economic factors that affect enrollment include research by
Dellas and Sakellaris (2003) that show college enrollment to be countercyclical. This may be due

Thomas Smith 913356676
3/17/17
4
to a fall in the opportunity cost of attaining education. The opportunity cost of education is
dependent on many aspects of the economy, but could be further affected by factors that are
exogenous to the economy, such as apportion rates. I will further address this relationship in the
theoretical framework section.
Betts and McFarland (1995) estimated from 1969-1985 that a 1% increase in the
unemployment rate results in a 4.5% rise in full time attendance at 2 year universities. This finding
is incorporated within the methodology of constructing the model of the paper.
Finally, two more papers that directly impacted the creation of this paper are Long (2014),
who finds cost and income affect enrollment rates and Bradley (2012), who shows wage growth
to be a decisive indicator. Yet again, this is incorporate into the methodology in constructing the
model which is touched on further in the model section. Also, these findings are used as the main
explanations and justifications to confirm the hypothesis on the relationship between
macroeconomic events and college enrollment. The few papers listed, of the many in the literature,
all highlight that economic factors play a very significant role in the education decision.
This paper builds on and expands prior research by incorporating the economic factors
found to be significant in the education decision. I further segment the group of examination into
race and major. As with the literature, I use unemployment rate and GDP per capita as the
economic indicators. Furthermore, this paper will improve the understanding within the literature
of how enrollment patterns of certain races and majors are affected by recessions, which will allow
universities to provide enrollment management techniques more efficiently and specifically target
the groups that need the most help. Prospective students will be more informed about their
decisions towards education as the increase in understanding at the institutional level will be
passed down through the enrollment management techniques leading to a more efficient outcome
at the student level. Furthermore, Students will be able to look at what the patterns are in
enrollments, which may help them in calculating realistic returns of their education.
Theoretical Framework
This section will highlight a method of valuing degrees that students may be using to decide
on their educational routes, why schools need to know, and how the information at the institutional
level can benefit students and educational providers. The method of valuing degrees for this paper
is based on a model of valuing degrees employed in Beffy (2010). Students may be misjudging
the macroeconomic conditions when they are making their decision about higher education. They
may be overvaluing the intrinsic value of certain degrees, while down weighting the consumption
value. The job market tightens in recession and trends in employment pre- recession, post-
recession, and during the recession may not be the same, and students should account for this when
making their decisions. According to (Hamermesh & Donald 2008 & Rumberger 1993)
Engineering, Science, Mathematics… etc are not as sensitive to downturns in the economy and
should be valued accordingly, however these careers may not be valued appropriately by the
prospective students. Since education is a major capital investment any misallocation could result
in an adverse outcome.
When considering any investment, the party looks at the net present value (NPV) of their
capital investment to determine which route has the best return that fits their needs and select
investments accordingly (Graham & Smart 281). This same framework is used by students when
choosing between furthering their education or entering the workforce. When deciding on an
Thomas Smith 913356676
3/17/17
5
educational pathway and major a student should choose the option that will give them the best
return throughout the business cycle through their career (Lee 2010). This need to select the best
route to education is critical as the job markets get tighter in recessions and students are financing
their education increasingly through debt instruments. Research by Arcidiacono (2010) shows that
when given new information that changes expected earnings from education, students may be
switching to majors that have less intrinsic value, but higher consumption value. This new
information may be changes in employment opportunities. Following Beffy’s (2010) research,
assume that a student can choose between two routes of education, route j and route k. The
student’s value function will be comprised of 𝑣0𝑗𝑖 which is the intrinsic value and 𝑣1𝑗
𝑖 the
consumption value. If 𝑁𝑃𝑉𝑗𝑡𝑖 > 𝑁𝑃𝑉𝑘𝑡
𝑖 where 𝑁𝑃𝑉𝑗𝑡𝑖 = 𝑣0𝑗
𝑖 + 𝑣1𝑗𝑖 then student i will choose route
j in time period t. Thus, if the consumption value of certain degrees that are not recession friendly
drop enough, it may push more students into majors that are more recession friendly respectively.
Understanding the mechanism of Beffy’s (2010) NPV calculation and how it affects
underrepresented populations is necessary for institutions to effectively allocate financial aid
programs. Post-secondary institutions need to optimally focus their limited financial aid programs
on underrepresented populations that have financial constraints, which may be keeping them out
of higher educational attainment. By targeting groups that are historically marginalized and
currently underrepresented in the higher educational system, managed enrollment financial aid
may see a great impact on first generation college students. According to Kroc and Hanson (2001)
first generation college students have the most substantial impact on increases in college
enrollments. Not only is this information useful to the individual parties at a singular level, but
when the information is combined and flows through both parties a synergistic effect may happen.
This synergy could arise at the institutional level when enrollment management
administrators target historically underrepresented populations. University administrators do this
through multiple methodologies, which include: extensive outreach programs, displaying
information of available programs, and creation of financial aid possibilities for the
underrepresented student with limited resources. The prospective students that belong to this
category can find and take advantage of these opportunities, which lowers the opportunity cost of
enrolling in college further. This lower opportunity cost increases enrollment proportions of these
groups that create a feedback loop to the institutions. This loop thus recycles the signal of the
importance of these programs in recruiting first generation college students, that otherwise tend to
be underrepresented. This process continues as the methodologies change and further refines the
relationship between enrollment proportions and macroeconomic conditions.
Construction of opportunity cost to education is a very complex process, which requires
delicate and meticulous thought process. The papers highlighted in the background section show
many things that distort the true opportunity cost of education. Multiple papers, including this one,
show that unemployment is a main driver of this distortion, but there may be factors that are
exogenous to the overall economy that affect the fluctuations in opportunity cost of education,
such as financial aid. The financial aid that schools give for recruited students is not fully
dependent on the economy and impacts the opportunity cost.
Another complex topic is how to measure/represent the economy’s performance; more
specifically, determine whether if it is in an expansionary or recessionary state. There are many
papers showing that the state of the economy affects enrollments, which may be due to changes in
opportunity cost. There are papers that use inflation to define the economy, or GDP per capita
growth, or, as I have used, unemployment. All the methods are successful at showing significance
Thomas Smith 913356676
3/17/17
6
on enrollments. I use GDP per capita and unemployment as the indicators for which state the
economy is in for prospective students because these both directly drop or raise the opportunity
cost of college. This drop of opportunity cost is due to the adverse job market that both variables
define.
Higher wages mean higher opportunity costs, which implies a higher cost to attend school.
High employment rates imply that jobs are readily available, which further implies that there are
higher costs to do something that is not earning a wage. Thus, combining these two theories should
sufficiently model the opportunity of education to a prospective student. We start to see why this
construction of modeling these concepts is a very difficult task because they are different for
different populations of interest, i.e. maybe inflation, interest rates, and Tobin’s q are better
evaluations for the economy and opportunity cost of businesses. I further touch on, in more detail,
the construction of these variables in the data section. Combining this theoretical framework with
the data fluctuations, I can see if this relationship is represented by tendencies in the data.
Data
The data for the empirical analysis came from The Integrated Postsecondary Education
Data System (IPEDS), The Bureau of Economic Analysis (BEA), and The Bureau of Labor
Statistics (BLS). These data include enrollment by different characteristics into all colleges that
participate in the federal student financial aid programs for admission years spanning from 2002-
2014 stratified by state. These data are merged with GDP per capita and unemployment for each
respective state.
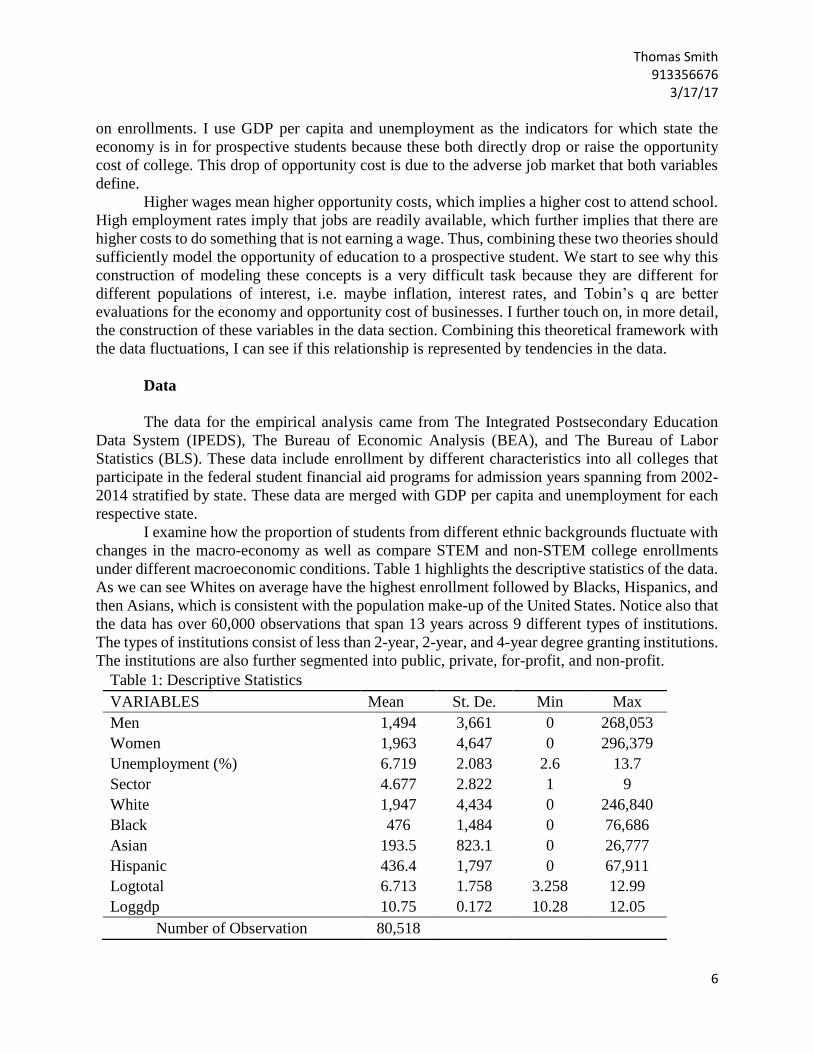
I examine how the proportion of students from different ethnic backgrounds fluctuate with
changes in the macro-economy as well as compare STEM and non-STEM college enrollments
under different macroeconomic conditions. Table 1 highlights the descriptive statistics of the data.
As we can see Whites on average have the highest enrollment followed by Blacks, Hispanics, and
then Asians, which is consistent with the population make-up of the United States. Notice also that
the data has over 60,000 observations that span 13 years across 9 different types of institutions.
The types of institutions consist of less than 2-year, 2-year, and 4-year degree granting institutions.
The institutions are also further segmented into public, private, for-profit, and non-profit.
Table 1: Descriptive Statistics
VARIABLES Mean St. De. Min Max
Men 1,494 3,661 0 268,053
Women 1,963 4,647 0 296,379
Unemployment (%) 6.719 2.083 2.6 13.7
Sector 4.677 2.822 1 9
White 1,947 4,434 0 246,840
Black 476 1,484 0 76,686
Asian 193.5 823.1 0 26,777
Hispanic 436.4 1,797 0 67,911
Logtotal 6.713 1.758 3.258 12.99
Loggdp 10.75 0.172 10.28 12.05
Number of Observation 80,518
Thomas Smith 913356676
3/17/17
7
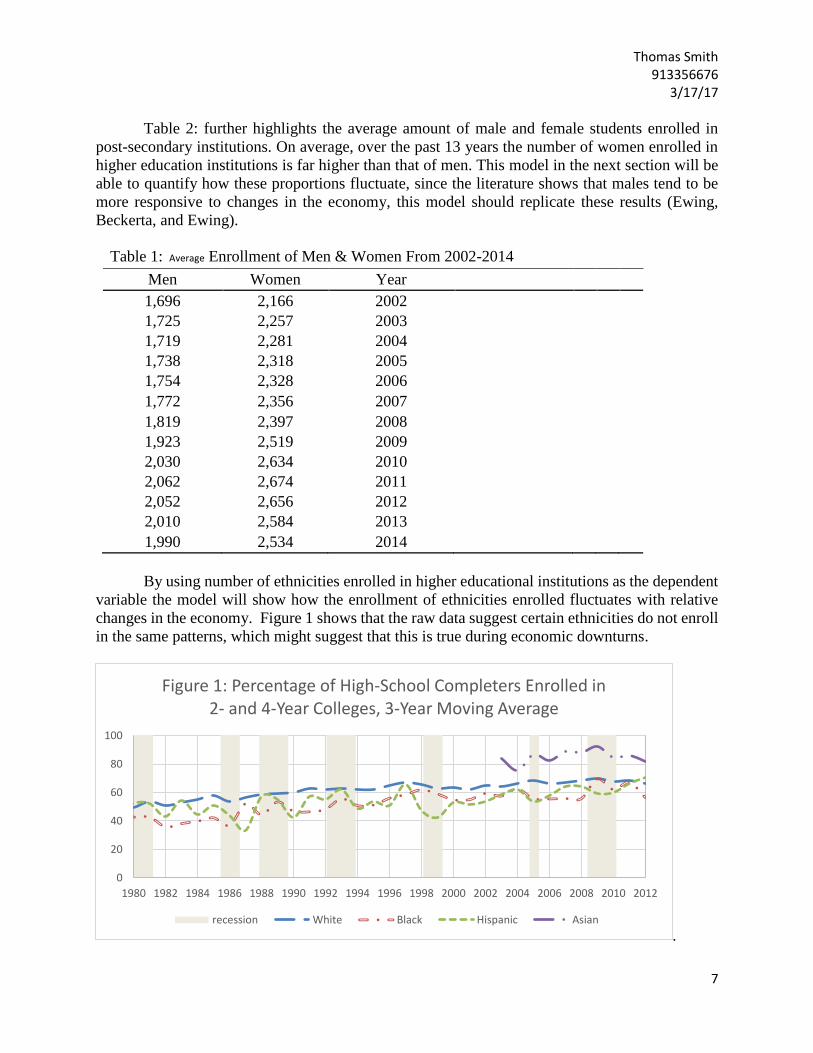
Table 2: further highlights the average amount of male and female students enrolled in
post-secondary institutions. On average, over the past 13 years the number of women enrolled in
higher education institutions is far higher than that of men. This model in the next section will be
able to quantify how these proportions fluctuate, since the literature shows that males tend to be
more responsive to changes in the economy, this model should replicate these results (Ewing,
Beckerta, and Ewing).
Table 1: Average Enrollment of Men & Women From 2002-2014
Men Women Year
1,696 2,166 2002
1,725 2,257 2003
1,719 2,281 2004
1,738 2,318 2005
1,754 2,328 2006
1,772 2,356 2007
1,819 2,397 2008
1,923 2,519 2009
2,030 2,634 2010
2,062 2,674 2011
2,052 2,656 2012
2,010 2,584 2013
1,990 2,534 2014
By using number of ethnicities enrolled in higher educational institutions as the dependent
variable the model will show how the enrollment of ethnicities enrolled fluctuates with relative
changes in the economy. Figure 1 shows that the raw data suggest certain ethnicities do not enroll
in the same patterns, which might suggest that this is true during economic downturns.
.
0
20
40
60
80
100
1980 1982 1984 1986 1988 1990 1992 1994 1996 1998 2000 2002 2004 2006 2008 2010 2012
Figure 1: Percentage of High-School Completers Enrolled in 2- and 4-Year Colleges, 3-Year Moving Average
recession White Black Hispanic Asian
Thomas Smith 913356676
3/17/17
8
Once again, the model detailed in the next section will quantify these affects and determine if the
heterogeneity of enrollments by ethnicities are in fact significantly affected by changes in the
economy. Seeing how these proportions change during times of economic uncertainty is crucial
for managed enrollment administrators to understand. The administrators can use these
fluctuations for finding the underrepresented populations at their campuses, while efficiently
allocating resources to attract those groups of students.
Another way these data are useful for institutions’ managed enrollment administrators is
the fact that it is allowing them to determine how enrollments in various types of majors and
programs offered at their institution fluctuate with the macroeconomic environment. As seen in
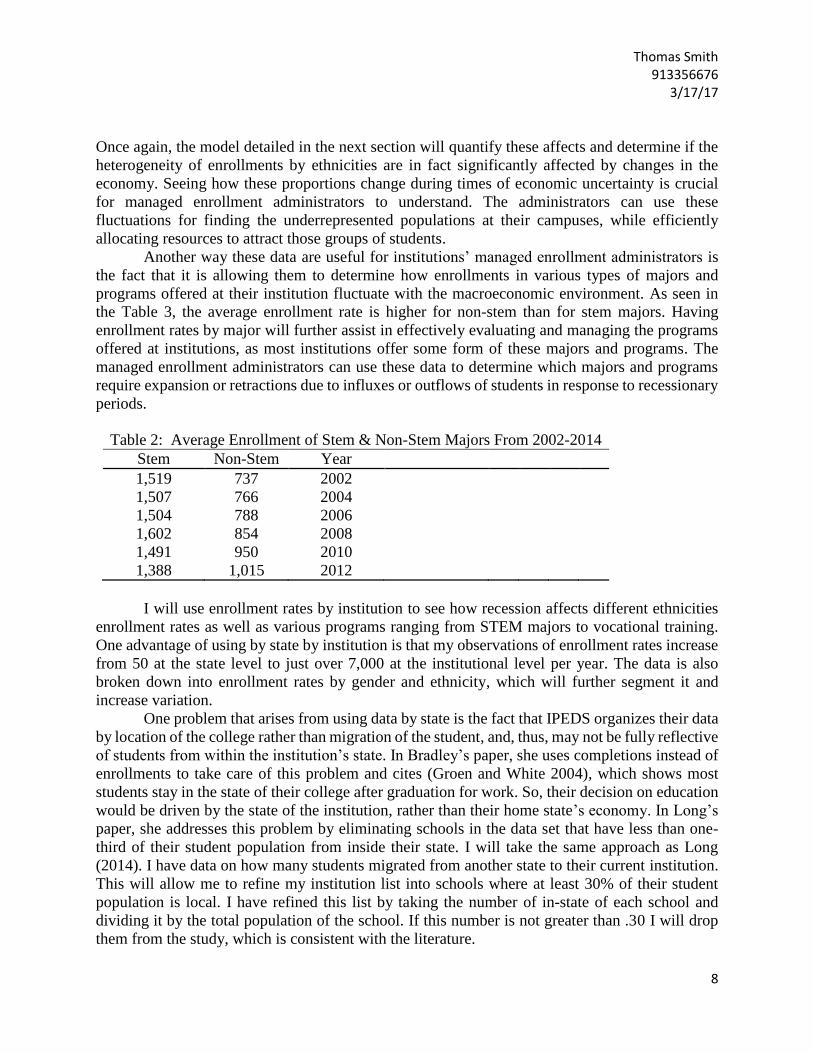
the Table 3, the average enrollment rate is higher for non-stem than for stem majors. Having
enrollment rates by major will further assist in effectively evaluating and managing the programs
offered at institutions, as most institutions offer some form of these majors and programs. The
managed enrollment administrators can use these data to determine which majors and programs
require expansion or retractions due to influxes or outflows of students in response to recessionary
periods.
Table 2: Average Enrollment of Stem & Non-Stem Majors From 2002-2014
Stem Non-Stem Year
1,519 737 2002 1,507 766 2004 1,504 788 2006 1,602 854 2008 1,491 950 2010 1,388 1,015 2012
I will use enrollment rates by institution to see how recession affects different ethnicities
enrollment rates as well as various programs ranging from STEM majors to vocational training.
One advantage of using by state by institution is that my observations of enrollment rates increase
from 50 at the state level to just over 7,000 at the institutional level per year. The data is also
broken down into enrollment rates by gender and ethnicity, which will further segment it and
increase variation.
One problem that arises from using data by state is the fact that IPEDS organizes their data
by location of the college rather than migration of the student, and, thus, may not be fully reflective
of students from within the institution’s state. In Bradley’s paper, she uses completions instead of
enrollments to take care of this problem and cites (Groen and White 2004), which shows most
students stay in the state of their college after graduation for work. So, their decision on education
would be driven by the state of the institution, rather than their home state’s economy. In Long’s
paper, she addresses this problem by eliminating schools in the data set that have less than one-
third of their student population from inside their state. I will take the same approach as Long
(2014). I have data on how many students migrated from another state to their current institution.
This will allow me to refine my institution list into schools where at least 30% of their student
population is local. I have refined this list by taking the number of in-state of each school and
dividing it by the total population of the school. If this number is not greater than .30 I will drop
them from the study, which is consistent with the literature.
Thomas Smith 913356676
3/17/17
9
For gauging the economic outlook for college students, I use two sets of data, one from
The Bureau of Economic Analysis (BEA) and another from the Bureau of Labor Statistics (BLS).
These data are used to construct the variable that describes the type of economy students face,
either expansionary or recessionary, and opportunity cost of education outlined in the theoretical
framework section. The data from BEA is real annual GDP per capita by state. If GDP per capita
is falling, it will indicate a declining economic condition as output and wages in the respective
states drop. This indicates that the opportunity cost of education has dropped and enrollment
should increase. Note, if enrollments increase with a lower GDP per capita that the variables are
inversely related, so a lower GDP should result in a positive effect on enrollments. The data from
BLS is annual seasonally adjusted unemployment rates by state. This indicates how many jobs are
readily available in the economy. A high unemployment rate represents both a drop in the
opportunity cost of perusing higher education and adverse economic conditions within the state’s
economy, as outlined in the theoretical framework section. If unemployment is above the states
average it will indicate a recession and a drop in the opportunity cost of school, which should
incentivize people to enroll in postsecondary educational institutions, all else equal. This should
result in a positive relationship between enrollment and unemployment. Thus, as unemployment
increases, enrollments increase as well.
This definition of the business cycle gives the ability to look at both, years in which the
economy is doing well and years in which the economy is in recession. This ability to view both
pre-recession and post-recession trends will allow for stronger claims about the effects on
enrollment proportions due to fluctuations in the macro-economy.
The Model
In this section I describe a regression model that will show how my independent variables
– unemployment rate by state and natural log of GDP per capita by state - affect the dependent
variable, natural log of enrollment rate by institution. Also, I will further explain the relationship
between the variables.
The Model is represented by this equation:
𝐿𝑁𝑒𝑛𝑟𝑜𝑙𝑙𝑚𝑒𝑛𝑡𝑠𝑡,𝑡𝑖 = 𝐵𝑜 + 𝐵1(𝐿𝑛 𝐺𝐷𝑃)𝑠𝑡,𝑡 + 𝐵2(𝑈𝑛𝑒𝑚𝑝𝑙𝑜𝑦𝑚𝑒𝑛𝑡 )𝑠𝑡,𝑡 + 𝛾𝑖 + 𝛾𝑡 + 𝜀𝑠𝑡,𝑡
This model will need to use panel data to tell whether the macro-economy affects school
enrollments. This model should be able to capture the change in enrollments following changes in
the economic outlook. The natural log of enrollment rates is at the institutional level pulled from
the IPEDS data and is used as dependent variable 𝐿𝑁𝑒𝑛𝑟𝑜𝑙𝑙𝑚𝑒𝑛𝑡𝑠𝑡,𝑡𝑖 .
This model can also account for institutional and time effects that may exist within the
data. Another advantage to using fixed effect is the fact that it decreases the likelihood of omitted
variable bias. In “The response of US college enrollment to unexpected changes in macroeconomic
activity,” Ewing, Beckerta, and Ewing found that male college enrollment rates are more
responsive to fluctuations in the economy. This model will build on these types of findings and
further split them into more stratified groups such as: ethnicity and field of study. If changes in the
economy affect one of these populations differently from the other or they all react differently this
model will be able to explicitly show the correlation.
The unit of analysis will be at the institutional level while the unit of observation will be at
the state and institutional level. Using institutions as the unit of analysis, I can maximize the
variation in the data while limiting the number of variables. This method compacts the variables
Thomas Smith 913356676
3/17/17
10
because the data is formatted at the college level. Thus, if I made state the unit of analysis I would
have a multiple of 51 states for every current variable, which is not practical. The dependent
variable 𝐿𝑁𝑒𝑛𝑟𝑜𝑙𝑙𝑚𝑒𝑛𝑡𝑠𝑡,𝑡𝑖 represents the number of students who enrolled at university, i, in state,
st, at time period, t. the dependent variable data is taken from IPEDS data. (𝐿𝑛 𝐺𝐷𝑃)𝑠𝑡,𝑡 is the
natural log of GDP per capita in state 𝑠𝑡 at time period 𝑡. If GDP per capita is lower than the state’s
average it will indicate a declining economy and a drop-in opportunity which should increase
enrollment, all else equal. Thus, we expected its coefficient to be negative. The negative coefficient
shows that, as the economy expands, it raises the opportunity cost to attend school, resulting in
fewer enrollments, all else equal. (𝑈𝑛𝑒𝑚𝑝𝑙𝑜𝑦𝑚𝑒𝑛𝑡 )𝑠𝑡,𝑡 is the seasonally adjusted unemployment
rate in state 𝑠𝑡 at time period 𝑡. If unemployment is greater than the state’s average it will indicate
a contraction in the economy. This contraction in the economy means that jobs are no longer
readily available and signals a drop in the opportunity cost to attend college, all else equal. This
drop in the opportunity cost should result in a positive coefficient. The positive coefficient
indicates that as unemployment in the economy raises, more students attend college. In both cases,
GDP and unemployment, the changes in the opportunity cost of education may be driving these
fluctuations in enrollment, thus these coefficients are the main focus of this paper. 𝛾𝑖 represents
the fixed effect for institutions which should control for the differences in each higher educational
institution that are time invariant, and 𝛾𝑡 is the fixed effect for time. By using fixed effects at the
institutional level, we limit chances of omitted variable bias as well as account for any other
changes that may be affecting enrollment. Similarly, we account for changes in enrollments over
time by using a time fixed effect. Both fixed effects limit the impact of exogenous variables on our
dependent variable, leading to a more causal relationship driven by our explanatory variables. 𝜀𝑠𝑡,𝑡
is an error term that will capture any affects that the model does not take into account. Following
the literature, I also control for a one year lag in enrollments because it takes a year to get into
most universities, and economic conditions are not immediately seen by the marginal enrollees.
The model specified above will sufficiently show the correlation, if any, between economic
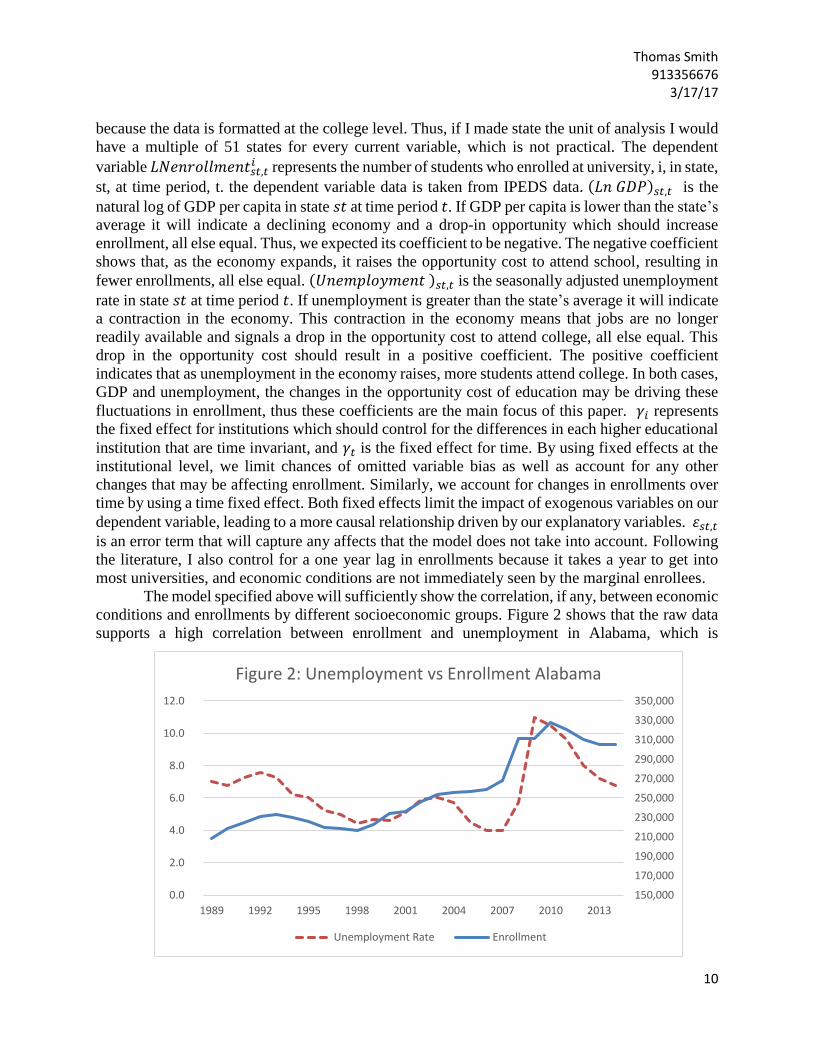
conditions and enrollments by different socioeconomic groups. Figure 2 shows that the raw data
supports a high correlation between enrollment and unemployment in Alabama, which is
150,000
170,000
190,000
210,000
230,000
250,000
270,000
290,000
310,000
330,000
350,000
0.0
2.0
4.0
6.0
8.0
10.0
12.0
1989 1992 1995 1998 2001 2004 2007 2010 2013
Figure 2: Unemployment vs Enrollment Alabama
Unemployment Rate Enrollment

Thomas Smith 913356676
3/17/17
11
consistent with economic theory outlined in this paper. The model above will be able to show if
this relationship is significant at any level. This model is also in line with current and historical
literature, which should lead to similar findings. Note, figure 2 only represents Alabama, however
it is consistent with the majority of states examined in this paper.
Results
The results from the first regression analysis specification ran using a fixed effect model is
outlined in table 4 below. The standard errors are in parentheses and are corrected for
heteroskedasticity. This specification uses the natural log of total enrollments as the dependent
variable and unemployment rate and natural log of real GDP per capita as the explanatory
variables, along with controls for year and institution. The results are consistence with the literature
and the theory of this paper. The coefficient for unemployment is positive and statistically
significant at all levels. Interpreting the results, a one percentage point change in the
unemployment rate in state st increases enrollments by 0.57% in institution i, all else equal.
Robust standard errors in parentheses
*** p<0.01, ** p<0.05, * p<0.1
This positive and significant coefficient means as unemployment increases, enrollments in post-
secondary educational institutions increases.
The coefficient for the natural log of GDP is negative and statically significant at all levels,
as well. For natural log of GDP per capita, a one percent change in natural log of GDP in state, st,
drops enrollments by 0.18% in institution i, all else equal. This coefficient implies that enrollments
are countercyclical, meaning that as the economy expands enrollments contract, and vice versa.
These findings may be due to the drop in the opportunity cost to attend college as outlined
previously in the theoretical framework section. By using fixed effects at the institutional level,
we account for all the variation in the dependent variable caused by time invariant characteristics
of each institution. The 𝑅2 for this specification shows that our model is explaining 97.5% of the
variation in our dependent variable.
Table 4: Natural log of Enrollment per Institution
(I) (II) (III)
VARIABLES Ln Total Ln Total Ln Total
Unemployment 0.0389*** 0.0443*** 0.00568***
(0.000607) (0.000641) (0.00193)
Ln GDP 0.951*** -0.184***
(0.0332) (0.0390)
Constant 6.876*** -3.387*** 8.874***
(0.00427) (0.359) (0.424)
Observations 62,556 62,556 62,556
R-squared 0.973 0.974 0.975
Institution FE YES YES YES
Year YES

Thomas Smith 913356676
3/17/17
12
Table 5 shows the results of the next specification. This regression specification shows
how the natural log of enrollments by Whites can be explained by relative changes in the economy.
As expected, there is not much evidence for fluctuations in the economy affecting enrollments by
Whites. This is evident in Figure 1 which shows a constant enrollment with a slight upward trend.
There is evidence at the 10% level that GDP may influence enrollments by White students. The
negative coefficient represents the higher opportunity cost to attend post-secondary education as
GDP expands. Again, the standard errors in parentheses are corrected for heteroskedasticity. This
specification’s 𝑅2 shows that the model is accounting for 96.5% of the variation in the dependent
variable.
Table 6 shows the results for the same regression, but with the outcome variable as the
natural log of Hispanic enrollees in institution, i, at time period, t. The regression results show very
interesting findings. As the economy expands, more Hispanics enroll into higher-education. The
increase in the enrollments by Hispanic students into higher education institutions as the economy
expands may be due to the opportunity cost significantly decreasing for Hispanic students. In Pew
Research Center’s 2014 National Journal Poll, 66% of Hispanics who entered the job market or
joined the military directly after high-school cited the need to help support their families as the
reason for not attending college. This may mean that the opportunity cost for Hispanics to attend
school in periods of economic growth drops exponentially, relative to other ethnicities. The
decrease in enrollments by Hispanics in times of high unemployment may highlight this need to
help support their families as the economy contracts, further.
Table 5: Natural Log of Whites per Institution
(I) (II) (III)
VARIABLES Ln White Ln White Ln White Lag
Unemployment 0.0207*** -0.00433 -0.00412
(0.000929) (0.00287) (0.00390)
Ln GDP 0.256*** -0.330*** -0.204*
(0.0419) (0.0565) (0.107)
L. Unemp 0.00193
(0.00383)
L. Ln GDP -0.112
(0.105)
Constant 3.542*** 9.882*** 9.775***
(0.452) (0.613) (0.706)
Observations 61,762 61,762 57,035
R-squared 0.963 0.963 0.965
Institution FE YES YES YES
Year FE YES YES
Robust standard errors in parentheses
*** p<0.01, ** p<0.05, * p<0.1

Thomas Smith 913356676
3/17/17
13
Economic theory suggests students that come from higher income families do better in
school, which may also explain why Hispanic students’ opportunity cost is different than that of
other ethnicities. Over the past decade, Hispanic high-school drop-out rates have dropped
exponentially. In 2000 the Hispanic high-school drop-out rate was 32% and fell under 12% by
2014, according to Pew Research Center. The relatively high drop-out rate for Hispanic high-
schoolers is consistent with being from lower income families, which further implies a greater
need to join the workforce upon finishing high-school and, thus a higher opportunity cost to attend
college in contractionary periods. However, as the economy expands, jobs become readily
available, and wages grow. This may mean that Hispanic families need less financial help from
their children and the opportunity cost to attend school falls.
Table 6: Natural Log of Hispanics per Institution
(I) (II) (III)
VARIABLES Ln Hispanic Ln Hispanic Ln Hispanic Lag
Unemployment 0.109*** -0.0108*** -0.0103**
(0.00122) (0.00340) (0.00494)
Ln GDP 3.435*** -0.0491 -0.619***
(0.0683) (0.0671) (0.149)
L. Unemp -0.00549
(0.00473)
L. Ln GDP 0.596***
(0.146)
Constant -33.39*** 4.377*** 4.229***
(0.737) (0.727) (0.803)
Observations 58,286 58,286 53,963
R-squared 0.944 0.952 0.954
Institution FE YES YES YES
Year FE YES YES
Robust standard errors in parentheses
*** p<0.01, ** p<0.05, * p<0.1
During the 2008 great recession, enrollments appeared to peak for most ethnicities,
whereas Hispanics appeared to hit a low point. This may be due to the vastly different opportunity
cost of education between ethnicities. When the economy expands, most ethnicities may pursue
other opportunities in the job market, since the cost to attend higher education institutions raises
for them with wage growth and job availability; for Hispanics, this may signal a drop in the
opportunity cost, since they may no longer need to help support their families. Thus, these findings
for the Hispanic population go against the foundation of this paper. This highlights the
heterogeneity of enrollments as well as the differing opportunity cost amongst ethnicities. For
Blacks, Whites, and Asians it appears the standard theory of the opportunity cost of education
holds, but for Hispanics it appears to have the opposite effect.

Thomas Smith 913356676
3/17/17
14
Now turning to the results of how contractions in the economy may lead to major switching.
The regression in table 7 has three separate specifications, only the dependent variable differs
between models. First, we have the natural log of non-stem majors with a two-period lag on our
economic indicators. The model must use a two-period lag because data for enrollments by major
are collected every even year. Unemployment from the previous period significantly affects
enrollments into different types of programs. This may be evidence that the prospective job market
for majors is very important when choosing which programs to enroll into.
Table 7: Major Shifting Specification
(I) (II) (III)
VARIABLES Ln Non-STEM Ln STEM Ln Edu
Unemployment -0.00854 0.00431 -0.0243*** (0.006470) (0.007670) (0.007970)
GDP -0.00364 -0.00982** -0.00642 (0.003760) (0.004340) (0.004570)
L2.Unemployment -0.0127* 0.0159* -0.0167* (0.006940) (0.008180) (0.008550)
L2.GDP -0.00269 -0.00355 -0.00141 (0.002720) (0.003140) (0.003340)
Constant 6.781*** 5.436*** 6.000***
(0.056200) (0.066000) (0.069200)
Observations 6,262 5,702 5,583
R-squared 0.961 0.963 0.949
Institution FE YES YES YES
Year FE YES YES YES
Robust standard errors in parentheses
*** p<0.01, ** p<0.05, * p<0.1
Evidence of students switching major with respect to unemployment is found. As
unemployment persists in the economy, less students enroll into non-STEM majors, which
historically are more sensitive to fluctuations in the job market. Every one percentage point change
in the unemployment rate from the previous period in state, st, causes a 1.27% drop in enrollments
into non-STEM majors at institution i, all else equal. Likewise, the same effect is found on
education programs, which are a subset of the non-STEM major category. Juxtapose this with the
natural log of STEM majors, and we see that as the job market tightens more students select STEM
majors. Mainly, a one percentage point increase in unemployment from last period in state st raises
STEM enrollments by 1.6% in institution i, all else equal. This switching into STEM majors may
be due to students attaining new information about future returns damping from degrees that are
relatively more sensitive to fluctuations in the job market, previously mentioned. Also, this may
represent a significant drop in the consumption value of degrees that are sensitive to fluctuations

Thomas Smith 913356676
3/17/17
15
in the job market, which make STEM degrees look relatively more attractive to prospective
students, even though they may have lower intrinsic values.
Conclusion
This study focuses on the fluctuations in college enrollments due to changes in the macro-
economic environment. Economic theory suggests that the most important economic indicators to
a prospective college student may be unemployment rates and GDP per capita. High
unemployment is positively correlated with a negative job market, which pushes some into
enrolling in post-secondary education. However, some majors may see larger increases in their
proportion of enrollees. Colleges that know how these trends in enrollment fluctuate can be more
proactive in their recruitment and allocation of resources.
There are many factors that could affect the enrollment decision that may not be found
within our models explanation power, and may be very significant. One example of these factors
could be cultural stigma of not going to college. People may enroll in higher education to avoid
the stigma that is associated with blue collar jobs, or from the cultural attitude of “college is the
only way to be successful” that so prevalent in today’s thought. Also, people may be using
education to hedge against the increasing automation within the economy. The reality may be that
people need to advance their education and skill to keep up with the ever moving and evolving
economy. These things are very hard to quantify so that they fit into a statistical model and will be
debated until this is possible. Thus, I stress to interpret these findings, as well as with all regression
analysis findings, with a grain of salt. I hypothesize 10 years from now that master’s degrees will
overtake undergraduate degrees as the covenanted degree for assured “job security.”
It is found that both unemployment and GDP per capita are significant at explaining
fluctuations in college enrollments. Furthermore, students that are Hispanic tend to enroll into
higher-education at times opposite to economic intuition. However, for Black, White, and Asian
students, economic theory correctly predicts enrollment patterns. Finally, as the job market
tightens it is found that students enroll less into non-STEM majors, especially within the education
field, and more into STEM majors.
These findings should prove to be fruitful for managed enrollment administrators to
correctly and efficiently target desired demographics as the economies output changes. Mainly, as
the job market tightens schools should be contracting budgets in non-STEM majors that tend to
become elastic, while expanding budgets within STEM fields. Also, in times of economic
contractions, schools should be shifting enrollment management resources towards Hispanic
populations to boost enrollments, by offsetting increases in opportunity cost with financial aid.
However, as the economy is expanding schools should be focusing more on Black, White, and
Asian populations. Finally, putting these two together, if schools properly shift their budgeting to
reflect these findings it may help put necessary resources where they are needed most, as their
budget tightens in declining economies, and are stretched thin by influxes of enrollments.
I have documented the finds this far and will continue to update and expand into more
refined areas until no rock is left unturned. The increase in information about how enrollment
trends react to fluctuations in the economy will enable schools managed enrollment administrators
to continue to evolve with the needs of the economy by means of effective managed enrollment
techniques. Furthermore, it will help increase the informational access to all parties, which
translates into a more efficient economy, by sending degrees into the job market that are need most

Thomas Smith 913356676
3/17/17
16
at that time. This might boost educational attainment and might even translate into a positive
impact on GDP by having smaller amounts of misallocated educational resources in the economy.
Reference
Archibald, R. B. (2002). Redesigning the financial aid system: Why colleges and universities
should switch roles with the federal government. (Baltimore and London: Johns Hopkins
University Press).
Arcidiacono, Peter, V. Joseph Hotz, and Songman Kang. 2010. “College Major Choices using
Elicited Measures of Expectations and Counterfactuals.” National Bureau of Economic
Research. Working Paper #15729.
Becker, G.(1964). Human Capital: A Theoretical and Empirical Analysis. New York: Columbia
University Press.
Beffy, Magali, Denis Fougre, and Arnaud Maurel. 2010. “Choosing the Field of Study in Post-
Secondary Education: Do Expected Earnings Matter?” Working Paper. .
Betts, J., and McFarland, L. (1995). “Safe Port in a Storm—The Impact of Labor-Market
Conditions on Community College Enrollments,” Journal of Human Resources 30, 741–
765.
Boyd, L. (1997). Discrimination in mortgage lending: The impact on minority defaults in the
Stafford loan program. Quarterly Review of Economics and Finance, 37, 23-37.
Bradley, Elizabeth S. "The Effect of the Business Cycle on Enrollment, Major, and Time-to-
Degree Decision of College Students." Diss. U of Georgia, 2012. 2012. Web.
Card, D.C., and T. Lemieux. 2000. Dropout and enrollment trends in the post-war period: What
went wrong in the 1970s? In An economic analysis of risky behavior among youth, ed. J.
Gruber, 439–82. Chicago: University of Chicago Press.
Clark, W. (1999). Paying off student loans. Perspectives on Labour and Income, 11, 28-33.
DeJong, D., and B. Ingram. 2001. The cyclical behavior of skill acquisition. Review of Economic
Dynamics 4, no. 3: 536–61.
Dellas, H., and V. Koubi. 2003. Business cycles and schooling. European Journal of Political
Economy 19, no. 4: 843–59.
Dalles, H., and P. Sakellans. 2003. On the cyclicality of schooling: Theory and evidence. Oxford
Economic Papers 55, no. 1: 148–72.
Ewing, Kris M., Kim A. Beckert, and Bradley T. Ewing. "The Response of US College Enrollment
to Unexpected Changes in Macroeconomic Activity." Education Economics18.4 (2010):
423-34. Web.
Hamermesh, Daniel S. and Stephen G. Donald. 2008. “The Effect of College Curriculum on
Earnings: Accounting for Non-ignorable Non-response Bias.” Journal of Econometrics.
Vol. 144: 479-491. Hardwick Day. 2011. “The Value and Impact of the College
Experience: A Comparative Study.” The Annapolis Group
Hossler, Donald, and David Kalsbeek. "Enrollment Management and Managing Enrollments:
Thomas Smith 913356676
3/17/17
17
Revisiting the Context for Institutional Strategy." Strategic Enrollment Quarterly (2013):
n. pag. American Association of Collegiate Registrars and Admissions Officers, 4 Apr.
2013. Web.
Kroc, R., and G. Hanson. 2001. Enrollment management and student affairs. In Institutional
research: Decision support in higher education, ed. R. Howard, 1–59. Tallahassee, FL:
Association for Institutional Research.
Long, B.T. 2004. How have college decisions changed over time? An application of the
conditional logistic choice model. Journal of Econometrics 121, nos. 1–2: 271–96.
Long, Bridget Terry. 2014. "The Financial Crisis and College Enrollment: How Have Students
andTheirFamiliesResponded?" NBER (n.d.):209-233
.Http://www.nber.org/chapters/c112862. University of Chicago Press, Dec. 2014. Web.
Rumberger, Russel W. and Scott L. Thomas. 1993. “The economic returns to college major quality
and performance: A multilevel analysis of recent graduates.” Economics of Education
Review. Vol. 12, No. 1: 1-19.