Embed Size (px)
Citation preview

Anna Flavia S. Silva1,2; Luís Cláudio Martins1,3; Liz M.B. Moraes1; Isabela C. Gonçalves1,3; Bianca B.R. de Godoy1,3; Sara W. Erasmus2; Saskia van Ruth2; Fábio Rodrigo P. Rocha1
1st International Electronic Conference on Food Science and Functional Foods
November, 2020
Can minerals be used as a tool to classify cinnamon samples?
1
¹Center for Nuclear Energy in Agriculture, University of Sao Paulo, Piracicaba, SP²Food Quality and Design, Wageningen University and Research, Wageningen, The Netherlands
³“Luiz de Queiroz” College of Agriculture, University of Sao Paulo, Piracicaba, SP, Brazil
1. Introduction
2. Material and Methods
3. Results and Discussion
4. Conclusions
5. Acknowledgements
Presentation topics
2

Introduction
3

Cinnamomum zeylanicum
Rich in bioactive compounds
Benefits for human health
Uses: food and medicinal purposes
Pictures from Internet4
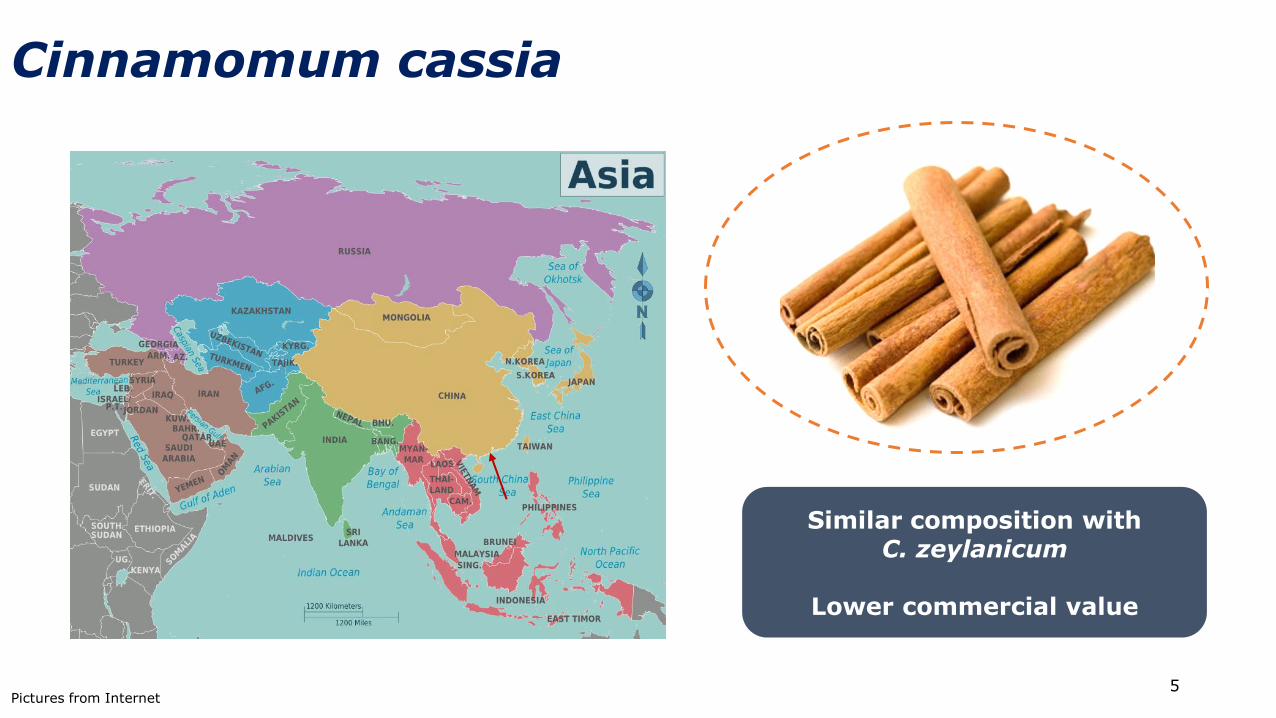
Cinnamomum cassia
Similar composition with C. zeylanicum
Lower commercial value
Pictures from Internet5

Spices’ vulnerability to food fraud
• $ 13.8 billions (2019)
• Market growing expectation: 6% (period 2020-2027)
• 30% of the Market concentrated in Asia
• Healthiness, New Ingredients
GRV, 2020; Silvis et al Food Control 2017, 81, 80-87. Pictures from Internet6

Mineral composition as a target marker
• Mineral profile can be exploited under terroir and traceabilityconcepts. Some examples are: white tea, Spanish virgin oliveoils, and yerba mate.
• Other examples are strategies to discriminate authentic andnon-authentic foods, considering mineral composition as atarget marker. Some examples are: ethnical foods, honey,and organic sugarcane juice.
Kamiloglu. Food Chem. 2019, 277, 12-24; Oliveri; Downey. Trends Anal. Chem. 2012, 35, 74-86; Ye et al. Food Anal. Methods 2017, 10, 191-199; Beltrán et al. Food Chem. 2015, 169, 350-357; Marcelo et al. Microchem. J. 2014, 117, 164-171; Kokhar et al. Food Nutr. Res. 2012, 56(1), 1-8; Chudzinska; Baralkiewicz. Food Chem. Toxicol. 2010, 48, 284-290; Barbosa et al. Food Chem 2015, 184, 154-159.
7

Objectives
The aim of this work was to evaluate the feasibility ofmineral composition as a possible authenticity markerfor classifying cinnamon samples commercialized inBrazil. To this aim, 12 elements (P, S, Mg, Ca, K, Cu,Zn, B, Fe, Al, Mn, and Si) were investigated as targets,also considering their importance for human nutrition.The analytical procedure was based on microwave-assisted acid digestion and elemental determinationby inductively coupled plasma optical emissionspectroscopy (ICP OES). Principal component analysiswas exploited for sample classification.
8

Material and Methods
9

Samples overview
n = 56 of ground samples4 cities in Sao Paulo region, Brazil
48 samples (conventional supermarket)
8 samples (bulk)
10

Procedure for mineral determination
Sample classification: PCA analysis at 95% of confidence level
(The Unscrambler X, version 10.4, CAMO Software, Norway,
2016)
500 mg(sample)
Cryogenic grinding(10 min)
6,0 mL 2 mol L-1 HNO3
+ 2,0 mL 30% v/v H2O2
Adjust volume (with water H2O) to 25 mL
Ethos 1600Milestone
ICAP 7400 Thermo
Digested Sample
Mineral Profile
(Quantification)
Cinnamon sample
11

Results and Discussion
12

General information about cinnamon samples
A = Contain glutenB = C. zeylanicumC = C. zeylanicum(origin: Sri Lanka)
D = Samples bought in bulkE = Chinese cinnamon (Cinnamomum cassia)
F = Contain traces of celery, mustard, and/or other spices
Prices varied fromUS$ 0.02/g to US$ 0.14/g
16%
31%
18%
14%
14%
7% (A) Cinnamon powder (n = 9)
(B) 100% cinnamon powder (n = 17)
(C) Cinnamomum zeylanicum (n = 10)
(D) Not informed (n = 8)
(E) Chinese cinnamon (n = 8)
(F) Ground cinnamon (n = 4)
13

Mass fractions (mg kg-1) of cinnamon powder samplesElement
(spectral line)
Minimum
found
Maximum
found
NIST 1515
found
NIST 1515
certified valuesLOD LOQ
P
(213.618 nm)5.19 + 0.08 1223 + 22 1583 + 2 1610 + 20 0.03 0.08
S
(182.034 nm)7.59 + 0.06 1681 + 16 1078 + 6 N.A. 0.05 0.14
Mg
(280.270 nm)479 + 2 1352 + 17 2835 + 8 2710 + 80 0.06 0.18
Ca
(422.673 nm)5300 + 30 13225 + 49 13720 + 93 15260 + 150 0.34 1.01
K
(766.490 nm)3877 + 27 7183 + 74 14075 + 175 16100 + 100 0.32 0.95
Cu
(324.754 nm) 2.55 + 0.03 10.5 + 0.1 5.50 + 0.07 5.6 + 0.2 0.04 0.12
Zn
(213.856 nm)5.4 + 0.1 24 + 1 12 + 1 12.5 + 0.3 0.04 0.11
B
(249.773 nm)9.34 + 0.04 17 + 1 31.50 + 0.06 27 + 2 0.02 0.06
Fe
(259.940 nm)18.0 + 0.5 1994 + 49 61.6 + 0.6 83 + 5 0.01 0.04
Al
(396.152 nm)28.4 + 0.4 2142 + 13 295.87 + 16.91 286 + 9 0.10 0.30
Mn
(257.610 nm)137.9 + 0.3 367 + 2 56.11 + 0.03 54 + 3 0.0002 0.0006
Si
(251.611 nm)40.4 + 0.9 2743 + 52 551.24 + 3.48 N.A. 0.60 1.80 14

PCA analysis: perceptual maps
PC1 explains 63% of the observed variance, PC2 21%, and PC3 9% (95% confidence level).
PC1, PC2, and PC3 are responsible for explaining 93% of the observed variance.
15

PCA analysis: perceptual maps
Highly variability in other groups; 4 outliers (circled); only 4 samples of Chinese cinnamon
(C. cassia) were highly clustered.
Groups C. zeylanicum and 100% cinnamon powder highly clustered.
100% cinnamon powder
Cinnamon powder
Cinnamomum zeylanicum
Ground cinnamon
Chinese cinnamon
Not informed
16

Conclusion
The proposed strategy pioneering indicatedthe possibility to identify C. zeylanicum incommercial cinnamon powders, usingmicroelements determined by ICP OES asauthenticity markers. It also indicated thepossibility to distinguish samples from C.cassia and others containing other grains,spices, and gluten, even though more studiesare required to establish standard models forthe classification of this product.
17

Acknowledgments
18
Funding
This research was funded by:
* Coordination for the Improvement of Higher Education Personnel
(CAPES, financial code 001)
* University of Sao Paulo Program of Internationalization
(USP/PrInt) supported by Capes (process number:
88887.371000/2019-00)
* National Council for Scientific and Technological Development
(CNPq)
* São Paulo Research Foundation (FAPESP)
* National Institute of Advanced Analytical Sciences and
Technologies (INCTAA). 19

Thanks for your attention!20E-mail: [email protected]