Embed Size (px)
Citation preview
Accepted Manuscript
Title: Can parents protect their children? Risk comparisonanalysis between affiliates of multi- and single-bank holdingcompanies
Authors: Kim Cuong Ly, Frank Hong Liu, Kwaku Opong
PII: S1572-3089(17)30028-1DOI: https://doi.org/10.1016/j.jfs.2018.05.001Reference: JFS 629
To appear in: Journal of Financial Stability
Received date: 10-1-2017Revised date: 29-4-2018Accepted date: 4-5-2018
Please cite this article as: Ly, Kim Cuong, Liu, Frank Hong, Opong, Kwaku,Can parents protect their children? Risk comparison analysis between affiliatesof multi- and single-bank holding companies.Journal of Financial Stabilityhttps://doi.org/10.1016/j.jfs.2018.05.001
This is a PDF file of an unedited manuscript that has been accepted for publication.As a service to our customers we are providing this early version of the manuscript.The manuscript will undergo copyediting, typesetting, and review of the resulting proofbefore it is published in its final form. Please note that during the production processerrors may be discovered which could affect the content, and all legal disclaimers thatapply to the journal pertain.
brought to you by COREView metadata, citation and similar papers at core.ac.uk
provided by Repository@Nottingham
1
Can parents protect their children? Risk comparison analysis between
affiliates of multi- and single-bank holding companies
Kim Cuong Lya*, Frank Hong Liub, Kwaku Opongb1
a School of Management, Swansea University, Swansea SA1 8EN, United Kingdom
b Business School, University of Aberdeen, Aberdeen AB24 3FX, United Kingdom
cAdam Smith Business School, University of Glasgow, Glasgow G12 8QQ, United Kingdom
* Corresponding author. 1 Authors are grateful for helpful comments from Iftekhar Hasan (editor) and referees to improve the paper. We would
like to thank Mingming Zhou and conference attendees at the 2016 MBF Conference, the 7th International Research
Meeting in Business and Management, International Rome Conference on Money, Banking and Finance 2016, the 13 th
INFINITI Conference on International Finance 2015, the BAFA Annual conference 2015, the 4 th International
Conference of the Financial Engineering and Banking Society 2014, Scottish Doctoral Colloquium in Accounting and
Finance 2014, as well as participants at the internal seminar at University of Glasgow, Jonkoping University (Sweden)
and Swansea University for their helpful comments. Send correspondence to Kim Cuong Ly, Room 229, School
of Management, Swansea University, Bay Campus, SA1 8EN, United Kingdom; E-mail addresses:
[email protected] (Kim Cuong Ly), [email protected] (Frank Hong Liu), [email protected]
(Kwaku Opong).
Highlights
We compare the insolvency risk between affiliates of multi- and single-bank holding
companies.
We use the U.S. bank sample over the period of 1994 to 2012.
Multi-bank holding companies (MBHCs) are found to be lower insolvency risk than single-
bank holding companies (SBHCs) at the parent level.
MBHC affiliates are found to have significantly higher insolvency risk than SBHC affiliates
at the subsidiary level.
ACCEPTED MANUSCRIP
T
2
Abstract
We find that multi-bank holding companies (MBHCs) in the U.S. have lower insolvency risk than
single-bank holding companies (SBHCs) at the parent level, but have significantly higher
insolvency risk than the latter at the subsidiary level. Our results suggest that MBHC parents tend
to benefit from the internal capital market while allowing for more risk-taking at the individual
levels. We further find that the higher risk for MBHC affiliates is because of the organizational and
geographic complexity at the MBHC parent level. Our results highlight the importance of
government regulation on banks at both parent and subsidiary levels.
Keywords: insolvency risk; complexity; internal capital market; stand-alone banks; bank holding
companies’ affiliates
JEL Classification: G20, G21, G28
1. Introduction
Ever since the passage of the 1956 Bank Holding Company Act, bank holding companies (BHCs)
have become dominant in the U.S. banking industry. As of 2012, BHCs as a group controlled well
over $15 trillion in total assets, more than 95% of all U.S. banking assets (Avraham et al. 2012).
Although the literature has suggested numerous operational advantages of BHC structure,
concerning reduced restrictions on scale and scope in various banking activities and greater
flexibility in financing at both the parent and subsidiary levels (Pozdena 1988), it is not clear in both
theory and empirical evidence whether BHC structure provides an additional layer of protection for
their subsidiaries. We attempt to address this question in this paper.
Specifically, we investigate the differences in insolvency risk between Single-BHC (SBHC)
and Multi-BHC (MBHC) at their subsidiary levels. We apply internal capital market theory and
complexity theory to form our hypotheses. First, we postulate that MBHC affiliates have lower
insolvency risk than SBHC affiliates, all else being equal. Diversification at the parent level
enhances the parents’ ability to obtain better external financing deals to create internal capital market
ACCEPTED MANUSCRIP
T
3
and enrich the internal financing available to their subsidiaries (Khanna and Palepu 2000), thereby
increasing the ability of the parent to relieve financial difficulties faced by their affiliates. The
creation of internal capital market is regarded as ‘source-of-strength’ effect, which states that a
parent can raise internal funds by divesting a non-banking subsidiary to rescue a troubled banking
subsidiary. Literature on business groups also argues that business groups enable members to share
risk by reallocating resources (Marisetty and Subrahmanyam 2010, Gopalan et al. 2007, Khanna
and Yafeh 2005, Ferris et al. 2003).
A competing hypothesis is that MBHC affiliates have higher insolvency risk than SBHC
affiliates, as suggested by complexity theory. In the wake of deregulation, MBHCs have become
more organizationally complex over the past two decades in terms of the number of separate legal
affiliates and their geographic locations (Cetorelli and Goldberg 2014, Cetorelli et al. 2014,
Avraham et al. 2012). On the one hand, complexity theory argues that agency problems between
the managers of the parent and affiliates in the organizational hierarchy structure decrease the
investment efficiency of subsidiaries (Rajan et al. 2000, Scharfstein and Stein 2000). On the other
hand, complexity theory posits that a competitive environment exists in the hierarchy structure (Pina
e Cunha and Vieira da Cunha 2006, Anderson 1999). Complexity theory also centers on the limited
ability of the parent to equitably provide resources for all of its subsidiaries as the parent adopts
increasingly complex structures due to diversification (Kahn and Winton 2004, DeYoung 2003,
Hughes et al. 1999).
We use a sample of U.S. commercial banks between 1994 and 2012 to test these two
hypotheses. Our descriptive statistics show that MBHC affiliates are larger, more diversified and
have more off-balance-sheet activities. We find that MBHC affiliates tend to have higher levels of
insolvency risk (measured as the Z-score) than SBHC affiliates. These results are consistent with
the complexity hypothesis, but not with the internal capital market hypothesis.
ACCEPTED MANUSCRIP
T
4
However, an important issue that may arise when attempting to estimate the riskiness of
different types of banks is that the choice of banks to become such types may be endogenous. Our
identification strategy seeks to address the endogeneity of the bank type decision by applying a
propensity score matching (PSM)-based pairwise difference-in-differences approach. Specifically,
we consider those banks which change status from SBHC affiliates into MBHC affiliates, i.e. the
parent of an SBHC becomes an MBHC. We match the SBHC affiliates that changed status
(treatment) with those SBHC affiliates that did not (control), using the propensity score matching
method. We then adopt the difference-in-differences identification strategy to investigate whether
the difference in insolvency risk between the treatment and control groups increases after the status
changes of the treatment group. We find that SBHC affiliates changing into MBHC affiliates
increase their level of risk, as compared to those controlled SBHC affiliates, therefore reaffirming
our main results.
Next, we employ causal mediation analysis to test whether complexity is the channel that
drives our main findings. We consider three different dimensions of bank complexity,
organizational, geographic and business complexity, at the parent bank holding company level. We
follow Cetorelli and Goldberg (2014) and measure organizational complexity as the total number
of bank and non-bank subsidiaries a BHC has. Following Goetz et al. (2013), geographic complexity
is measured by subtracting one from BHC’s concentration of asset cross states that is calculated by
Herfindahl–Hirschman index of BHC’s assets in each state in which it is active. Business complexity
is estimated by non-interest income divided by operating income (Stiroh and Rumble 2006, Stiroh
2004) at the parent BHC level. We interact these complexity measures with MBHC dummy in our
main model. We find that the negative effect of MBHC_affiliate on Z-score is taken away once we
control for organizational complexity and geographic complexity, but not business complexity.
These results suggest that organizational complexity and geographic complexity are the main driver
ACCEPTED MANUSCRIP
T
5
of the higher level of risk of MBHC affiliates compared to SBHC affiliates. This is consistent with
our complexity hypothesis.
We then consider stand-alone banks as a separate group in addition to SBHC and MBHC
affiliates and compare its insolvency risk among the three groups. We find no significant difference
in bank risk between stand-alone banks and SBHC affiliates. This result is not surprising, given that
most SBHCs do not have non-bank subsidiaries and hence do not form an internal capital market
within the SBHCs. In consistent with our main results, we find that MBHC affiliates are riskier than
stand-alone banks.
Finally, we compare the insolvency risks of SBHCs and MBHCs at the parent (the highest
position in the bank structure hierarchy) instead of the subsidiary level. We find that MBHCs have
lower insolvency risk than SBHCs. Overall, our findings that MBHC affiliates are riskier than
SBHC affiliates at the subsidiary level but MBHCs have less risk than SBHCs at the parent level
suggest that MBHCs take advantage of the internal capital market among subsidiaries to achieve
diversification benefits at the parent level, while allowing for higher level of risks in their individual
subsidiaries. This evidence is consistent with Billett and Mauer (2003) finding that inefficient
subsidies to financially constrained divisions significantly increase the excess value of diversified
firms. It also explains to some extent the ongoing trend of forming MBHCs in the U.S.
Our paper contributes to multiple strands of the literature. First, our paper is related to the
literature that examines the impact of the internal capital market on BHC value. Cremers et al.
(2011) examine the distribution of influence within the banking business group. Billett and Mauer
(2003) investigate the relationship between the internal capital market and excess value of
diversified firms. A number of previous studies, for example, Fauver et al. (2003), Lin and Servaes
(2002) and Khanna and Palepu (2000), examine the link between capital market development and
the value of diversification. Their evidence suggests that large diversified firms are better able to
ACCEPTED MANUSCRIP
T
6
access external financing. Our results suggest that MBHC parents achieve diversification benefits
by allowing their subsidiaries to take more risks than their SBHC counterparts.
Second, our paper contributes to the recent growing literature on bank complexity (Cetorelli
et al. 2014, Cetorelli and Goldberg 2014, Liu et al. 2016). According to Cetorelli et al. (2014),
studies on organizational complexity have policy importance because of its systemic risk
implication in spreading shock across many affiliates within multiple industries in the financial
sector. Studies on bank complexity, however, have not been documented comprehensively since the
collapse of the banking system during the 2007-2009 financial crisis, which triggered the debate on
the role of complex banks. Our paper finds that increased complexity at both organizational and
geographic levels leads to increased insolvency risk of MBHC subsidiaries; however, these
increased risks are diversified away at the parent level, resulting in an overall gain for MBHC
parents.
Third, our results comparing the insolvency risk between stand-alone banks and BHC
affiliates extend the substantial literature comparing stand-alone and affiliated banks. This literature
has primarily focused on bank performance before and after acquisition (Pozdena 1988; Mayne
1977, Piper and Weiss 1974, Ware 1973,Talley 1972) and with respect to cost efficiency (Yamori
et al. 2003, Rose and Scott 1979) and dividend policy (Mayne 1980).
The remainder of this paper is organized as follows. Section 2 reviews related literature and
develops the two main hypotheses. Section 3 describes the data and summary statistics. The
subsidiary results are presented in Section 4 while Second 5 reports results of the parent level.
Section 6 concludes.
2. Hypotheses development
Diversification at the parent level enhances the parents’ ability to obtain better external
financing deals to create internal capital market (Khanna and Palepu 2000). The internal capital
ACCEPTED MANUSCRIP
T
7
market theory suggests that the creation of an internal capital market, where the headquarters
allocate capital across different projects, could limit the distortions arising from external financing
costs (Shin and Stulz 1998, Lamont 1997, Stein 1997). This theory has advanced the importance of
its benefits for banks’ affiliates with a banking group. Houston et al. (1997) find that lending
activities of bank subsidiaries are closely tied to the BHC’s capital position but not the cash flows
at the subsidiary level. This evidence suggests that MBHCs create internal capital markets to
allocate scarce capital within the organization. Building on Houston et al. (1997), Houston and
James (1998) examine the relationship between organizational structure and bank lending by
comparing lending behaviours of MBHC affiliates and that of unaffiliated banks. They find a lower
cash flow sensitivity for affiliated banks, implying that holding company affiliation reduces the cost
of raising funds externally. Cremers et al. (2011) further provide evidence that the headquarters of
a retail banking group can provide their member banks with an intertemporal insurance function
against funding shortfalls.
The creation of internal capital market is regarded as ‘source-of-strength’ effect. The
‘source-of-strength’ doctrine states that a parent can raise internal funds by divesting a non-banking
subsidiary to rescue a troubled banking subsidiary (Gilbert 1991). The too-big-to-fail resolution
demonstrates the similar concept that counterparties of insolvent firm need protection to reduce
collateral damage that was caused directly or indirectly by the failure of that firm (Kaufman 2014).
Also, literature on business groups argues that business groups enable members to share risk by
reallocating resources (Marisetty and Subrahmanyam 2010, Gopalan et al. 2007, Khanna and Yafeh
2005, Ferris et al. 2003) or by reducing earnings volatility (Khanna and Yafeh 2007). Korte (2015)
suggests to resolve insolvent banks by overcoming moral hazard problem and improving banks’
credit allocation in order to increase real economic performance. MBHCs have more subsidiaries
than SBHCs and can, therefore, allow affiliates to access more internal resources than their SBHC
counterparts. Hence, we postulate the first hypothesis:
ACCEPTED MANUSCRIP
T
8
Hypothesis 1: MBHC affiliates have lower insolvency risk than SBHC affiliates
However, the organizational complexity of U.S. BHCs has developed through an intensive process
of consolidation and substantial acquisition over many subsidiaries (Cetorelli et al. 2014). The
increased complexity in the MBHC structure may cast doubt on its bank affiliates’ insolvency risk.
On the one hand, complexity theory posits that a competitive environment exists in the
hierarchy structure (Pina e Cunha and Vieira da Cunha 2006, Anderson 1999). In a similar vein,
Frankel (2013)’s study on large BHCs defines BHCs as a mall that owns financial shops. Due to the
variety and interconnectedness of the shops, BHCs’ management often finds it difficult to manage
their complex and varied shops.2 Each shop may be vulnerable to the risk taken by other shops in
the mall. A banking system faces risk shifting if banks reduce capital to take more risk (Duran and
Lozano-Vivas 2014). Evidence in the form of the threat of ‘poaching’ shows that managers of low-
growth subsidiaries can ‘poach’ the surplus of their high-growth counterparts (Rajan et al. 2000).
Insufficient capital raises the high probability of bank failure; however, excessive capital increases
unnecessary costs for banks, implying inefficient banking system (Chortareas et al. 2012). Such
activities are associated with a high probability of financial distress among the subsidiaries.
On the other hand, the agency problem between the managers of the parent and affiliates in
the organizational hierarchy may lead to less efficient investments for subsidiaries (Rajan et al.
2000, Scharfstein and Stein 2000). Managers of weak subsidiaries prefer larger capital budgets;
however, they gain fewer private benefits from less productive investments. Therefore, they increase
their bargaining power by negotiating compensation with the parent’s manager to entice them to
stay. The parent’s managers react by offering additional compensation in the form of preferential
2 MBHC subsidiaries are more likely to compete for financial resources from the parent (Baule, 2014), whereas SBHC
affiliates find it easy to access their parent’s resources when necessary (Gilbert, 1991). Such a moral hazard problem is
limited for SBHC subsidiaries because SBHCs have sole bank subsidiaries. When the parent controls a smaller set of
subsidiaries, the internal capital market tends to enhance allocation efficiency and funding is allocated according to an
internal ranking (Stein, 1997).
ACCEPTED MANUSCRIP
T
9
capital budgeting allocations rather than cash wages. In order words, the parent’s managers distort
capital allocations in favor of weak affiliates.
An alternative view of the more complex structure (Kahn and Winton 2004) posits that
institutions attempt to engage in loan switches to alter the risk postures of their subsidiaries. The
reason is that the lending exposure related to different composition such as the maturity, the industry
and the region is the common drivers of default risk (Memmel et al. 2015). Kahn and Winton (2004)
argue that the parent tends to protect safe subsidiaries by granting them the most attractive low-risk
loans, in contrast to the inefficient loans made to risky subsidiaries. DeYoung (2003) suggests that
MBHC parents isolate riskier subsidiaries outside of the main bank to protect organizational assets.
Hughes et al. (1999) and Deng and Elyasiani (2008) find that MBHCs operating over wider
geographic ranges are more likely to be exposed to affiliation risk, which is in line with Berger and
DeYoung (2001)’s argument that senior managers tend to concentrate on recently purchased remote
subsidiaries. Their attention centers on the limited ability of the parent to provide equitable treatment
to all of its subsidiaries. Jennings et al. (2015) find that geographic complexity reduces the quality
and quantity of management’s communication and increases the cost of gathering and analyzing
information. Therefore, Goetz et al. (2013) suggest that geographic diversification of BHCs reduce
BHC valuation and intensify agency problems. An increase in geographic diversification shifts the
risk-return frontier more steeply upward, hence, a movement goes on the efficient risk-return
frontier where higher risk-taking incentives are taken by BHC to exchange for higher return (Hughes
et al. 1996).
In addition to organizational and geographic complexity, banks also face business
complexity. Cetorelli et al. (2014) argue that the boundaries of banking firms have progressively
diversified into nonbank intermediaries and appeared in forms of increasingly complex BHCs.
Black et al. (1978) highlight that risky activities are carried within holding company or nonbank
affiliates rather than within the bank subsidiaries themselves. It is not obvious that operating under
ACCEPTED MANUSCRIP
T
10
the same BHCs, bank subsidiaries are completely insulated from non-bank affiliaties (Wall 1987).
The risky business activities of nonbank subsidiaries are likely to expose any threat of financial
stability to bank subsidiary. Therefore, the increased organizational, geographic and business
complexity associated with MBHC may result in the higher insolvency risk of MBHC subsidiaries.
By combining the insights of different perspectives in complexity theory, we offer the
second hypothesis as follows:
Hypothesis 2: MBHC bank affiliates have higher insolvency risk than SBHC affiliates
3. Empirical methods
3.1. Data sample
This study uses annual account data of commercial banks in the U.S. from 1994 to 2012
obtained from the Call Reports. We begin the data analysis in 1994 for two reasons. First,
Copeland (2012) reports that the largest banks began to organize as BHCs rather than being stand-
alone commercial banks in 1994.3 Second, after 1994, banks were allowed to establish branches in
other states. The complete structure of foreign-owned banks is unknown; therefore, we exclude
foreign-owned banks from our sample. Our final data set includes 9,265 banks with 4,982 SBHC
affiliates and 4,283 MBHC affiliates.
3.2. Empirical methods
To study the effect of bank type on bank insolvency risk, we use the following equation:
n
i
ititiiit CONTROLSaffiliateMBHCscoreZ1
110 _ (1)
Following the recent literature on bank risk (Demirgüc-Kunt and Huizinga 2010, Laeven
and Levine 2009), this study uses the Z-score as the main measure of insolvency risk. It is defined
3 The Riegle-Neal Interstate Banking and Branching Efficiency Act of 1994 removed many restrictions on opening bank
branches across state lines and permitted merger and acquisition through the holding company structure, which was the
first step in the deregulation process (Jayaratne and Strahan 1996).
ACCEPTED MANUSCRIP
T
11
by the sum of return on assets (ROA) and the capital ratio, which is then divided by the standard
deviation of ROA. The standard deviation of ROA is calculated over a four- and five-year rolling
timeframe. MBHC_affiliate takes a value of 1 if the banks are MBHC affiliates, and 0 is assigned
to SBHC affiliates. εit denotes the error term.
n
i
itiCONTROLS1
1 represents the control variables. We use one-year-lagged variables,
including Log Total assets, Deposit/Total assets%, Loan/Total assets%, Off-balance-sheet
(OBS)/Total assets%, Non-interest income/Operating income%, Cost-to-income%. Size is the
logarithm of total assets and can be an important determinant of banks’ risk (Huang et al. 2012,
Drehmann and Tarashev 2011, Tarashev et al. 2009). Demsetz and Strahan (1995) find evidence
that size is an advantage, as larger institutions can more easily diversify risk. Hence, it is expected
that larger banks are safer. Deposit/Total assets%, which is deposits as a percentage of total assets,
represents a crucial component of the liabilities of traditional commercial banks.
As Foos et al. (2010) point out, loan is regarded as an important driver of bank risk; therefore,
loan ratio is employed in this study. Following previous studies on bank risk (Stiroh and Rumble
2006), Loan/Total assets% is used to indicate the extent to which a bank is involved in traditional
lending activities. Following Stiroh (2004), we capture income diversification as the ratio of non-
interest income as a percentage of total operating income to examine the extent to which a bank
moved towards more volatile non-interest income. Lepetit et al. (2008) argue that banks with high
non-interest income activities are riskier. Demsetz and Strahan (1997), on the other hand, find that
economies of scale make large BHCs cost-effective in specializing in riskier activities. We follow
the recent study on organization complexity in Cetorelli and Goldberg (2014) to measure
organizational complexity by the total number of subsidiaries, which is equal to the number of bank
subsidiaries plus the number of non-bank subsidiaries.
ACCEPTED MANUSCRIP
T
12
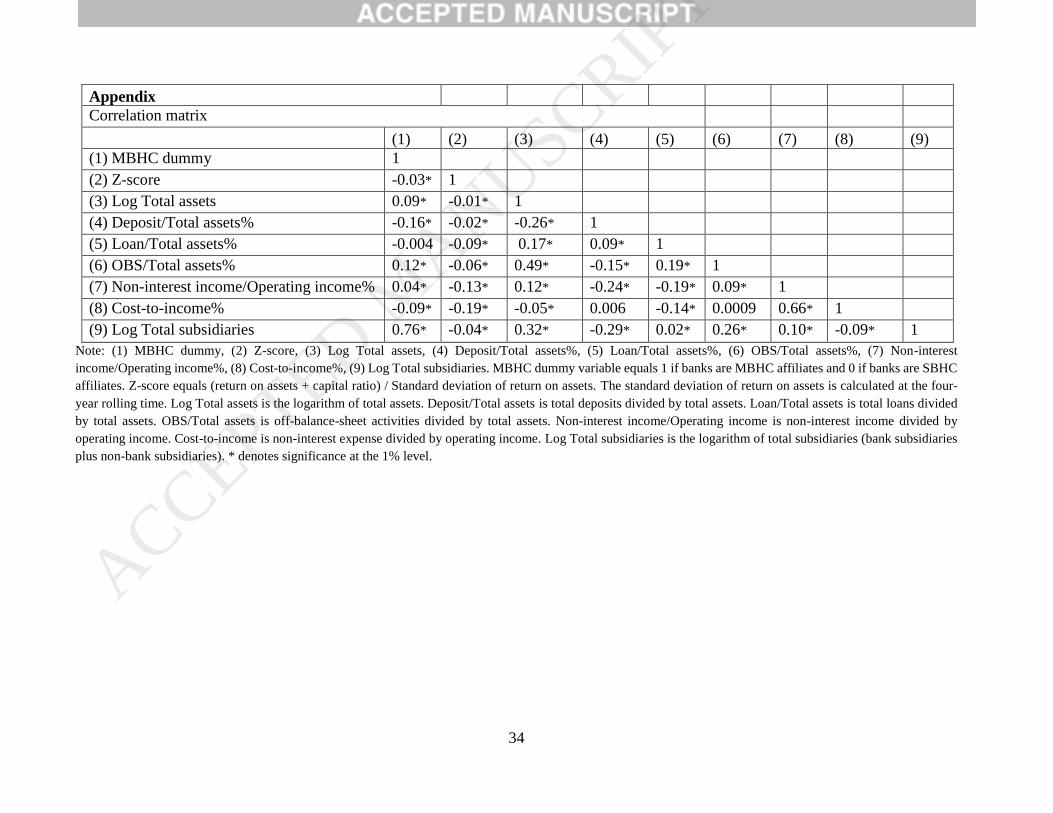
3.3. Summary statistics
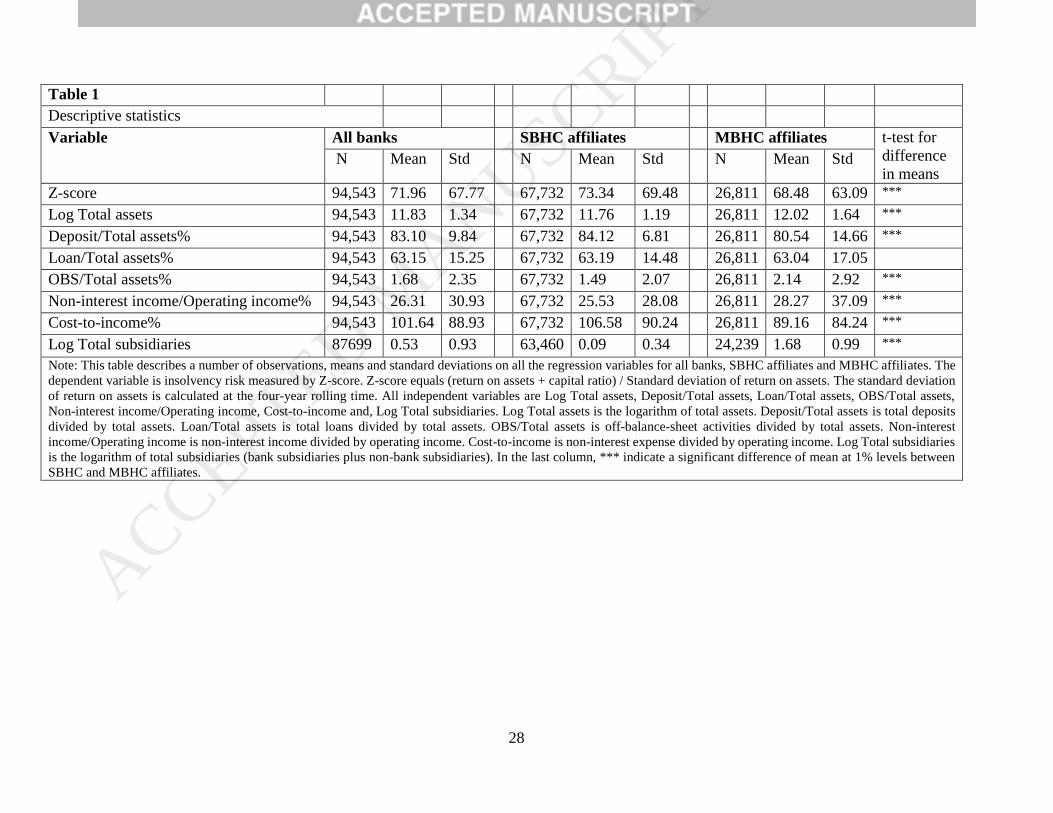
Table 1 provides descriptive statistics of the Z-score and bank-specific variables for all banks,
SBHC affiliates and MBHC affiliates. We winsorize all variables except size at the 1st and 99th
percentiles to minimize the impact of outliers. The correlation matrix for variables is displayed in
Appendix. MBHCs tend to be riskier, larger, have lower Deposit/Total assets, but have higher
OBS/Total assets and higher Non-interest income/Operating income.
The last column in Table 1 indicates a significant difference in the means of variables
between SBHC and MBHC affiliates. The results show that SBHC affiliates have higher Z-scores
than MBHC affiliates (73.34 and 68.48, respectively), indicating that SBHC affiliates have lower
insolvency risk than their MBHC counterparts. It appears that MBHC affiliates have a larger size,
higher OBS items, and higher non-interest income, and are affiliated with larger banking
organizations than SBHC affiliates. In contrast, SBHC affiliates hold a higher proportion of deposit
and are less cost-efficient than MBHC counterparts. On average, SBHCs have four subsidiaries,
whereas MBHCs have 48. The mean of Log Total subsidiaries of MBHCs is significantly higher
than that of SBHCs, implying that MBHCs are more complex than SBHCs.
4. Risk comparisons between SBHC affiliates and MBHC affiliates
In this section, we study the effect of bank structure on insolvency risk. First, we begin with the
ordinary least squares model to provide our main finding. Second, we deal with endogeneity issues
by employing PSM – based pairwise difference-in-differences approach to provide consistent
results. Third, we apply causal mediation analysis to prove the validity of our second hypothesis
that MBHC affiliates are riskier due to their organizational, geographic and business complexity.
4.1. Main results
ACCEPTED MANUSCRIP
T
13
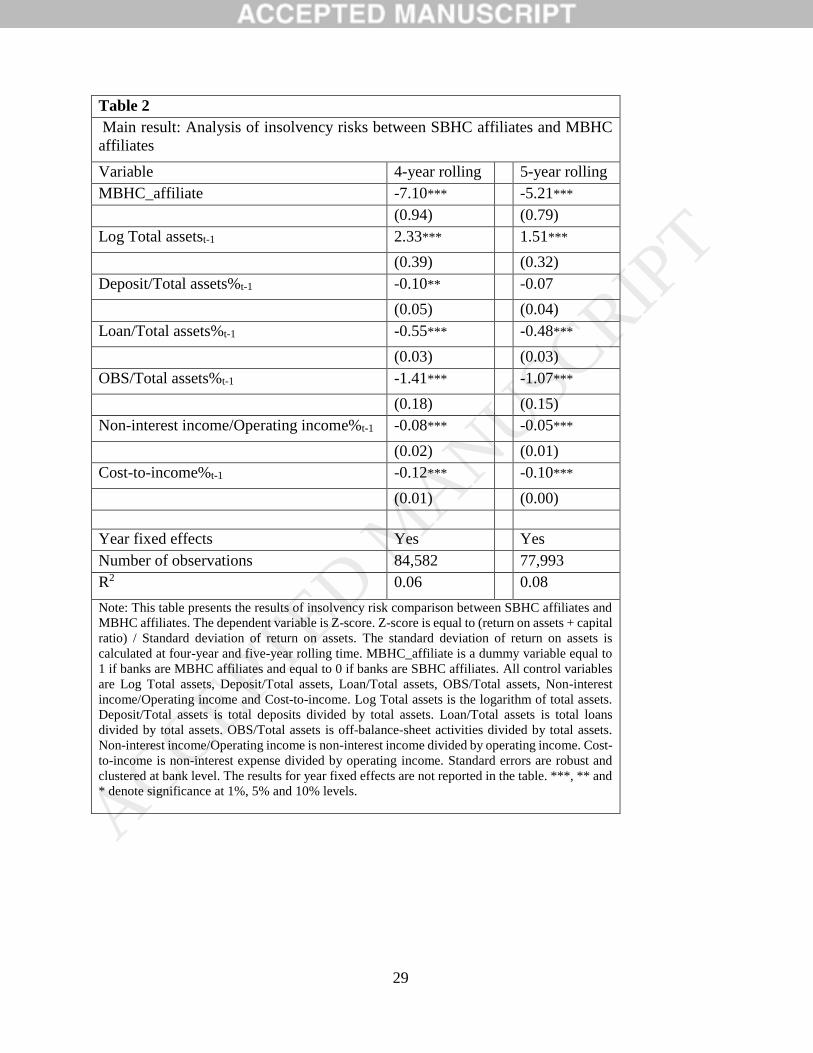
Table 2 reports the regression results of equation (1). Standard errors adjusted for
heteroscedasticity and clustered at the bank level are displayed from this table onwards. Time fixed
effects are included.
As displayed in the first column of Table 2, the coefficient estimate for MBHC affiliates is
negative and significant at the 1% level (-7.10), implying that MBHC affiliates are riskier than
SBHC affiliates. The results are consistent for two Z-scores with a four-year and five-year rolling
timeframe. Our finding supports the second hypothesis regarding complexity theory’s assumption
of agency problems and competition for resources in the internal capital market (Rajan et al. 2000,
Scharfstein and Stein 2000, Shin and Stulz 1998). Recent literature (Cetorelli et al. 2014, Cetorelli
and Goldberg 2014) shows that the complexity of U.S. BHCs has developed through an intensive
process of consolidation and substantial acquisition of many subsidiaries. The agency problem
between the managers of the parent and affiliates in the organizational hierarchy may lead to
decreased investment efficiency at the subsidiary level (Rajan et al. 2000, Scharfstein and Stein
2000).
The more complex structure, modeled by Kahn and Winton (2004), posits that institutions
attempt to engage in loan switches to alter the risk postures of their subsidiaries. A different strand
of the argument on complexity sheds light on the fact that MBHC affiliates tend to be exposed to
higher levels of risk when the number of subsidiaries in MBHCs increase.
We find that larger banks tend to be safer. This is consistent with the argument on the
diversification advantage of larger banks (Demsetz and Strahan 1995). However, banks highly
engaging in lending activities are riskier, consistent with the finding of Stiroh and Rumble (2006).
Banks with higher OBS/Total assets and Non-interest income/Operating income are riskier,
consistent with the finding of Lepetit et al. (2008). Confirming the evidence provided by Demsetz
and Strahan (1997), we find that banks with higher cost efficiency tend to be safer.
ACCEPTED MANUSCRIP
T
14
4.2. Propensity score matching-based pairwise difference-in-differences approach
The key result of the analysis reports that MBHC affiliates are riskier than SBHC affiliates.
One may argue, however, that our findings of different levels of riskiness among banks may not be
caused by the differences in bank types, e.g., SBHC or MBHC organizations, but are rather
endogenous to the decisions made to become such bank types. We attempt to address this issue in
this section.
To extract the endogeneity caused by unobserved factors, we rely on those banks that change
their status (for example, from SBHC affiliates to MBHC affiliates), within our sample period. We
assume that banks that change status do not change their characteristics in a short period other than
the level of risk before and after the status change. This strategy provides insights into whether
SBHC affiliates changing into MBHC affiliates will increase or decrease their level of risk. In this
analysis, we observe the following two groups:
(i) “status-changer”; that is, SBHC affiliates have changed into MBHC affiliates during
the observation period (treatment group);
(ii) “non-changer”; that is, SBHC affiliates that have not undertaken status changes into
MBHC affiliates during the observation period (control group).
Specifically, we use a propensity score matching-based pairwise difference-in-differences
(PSM diff-in-diff) approach for this experiment to test the effect of status changes on the changes
of insolvency risk of those banks. This is known as a difference-in-differences approach in which
the first difference eliminates the unobserved heterogeneity and the second difference provides the
impact estimate. As Blundell and Dias (2000) point out, a non-parametric PSM diff-in-diff has the
potential to significantly improve the quality of non-experimental evaluation results.
First, we run propensity score matching with the nearest-match method to match the control
group with the treatment group year by year upon a vector of bank-specific variables, including
ACCEPTED MANUSCRIP
T
15
bank size, deposit, loan, OBS, income diversification and cost-to-income ratios. Each status-changer
is matched with an observation from the non-changer group of the same year that the status changed.
Second, we pool the yearly matched status-changers and non-changers. The empirical setting
requires us to restrict the matching to those with data from one year before and one year after the
status changes. The process repeats for two-year and three-year windows.
Third, we estimate the differences in the mean changes of Z-score between status changers
and non-changers by the following diff-in-diff model:
n
i
ititiiiit CONTROLSchangestatusPostscoreZ1
110 _* (2)
iPost is a dummy variable equal to 1 for the time after changing status and 0 otherwise.
ichangestatus _ equals 1 for status-changers and 0 for non-changers. This is a bank-specific
attribute and does not vary by time. The variable of the primary interest in this set-up is the
interaction of ii changestatusPost _* , which shows the changes of the difference in bank risk
between status-changers and non-changers before and after the status changes. Because we include
both time and bank fixed effects in equation (2), both components of iPost and ichangestatus _ are
not included in the equation.
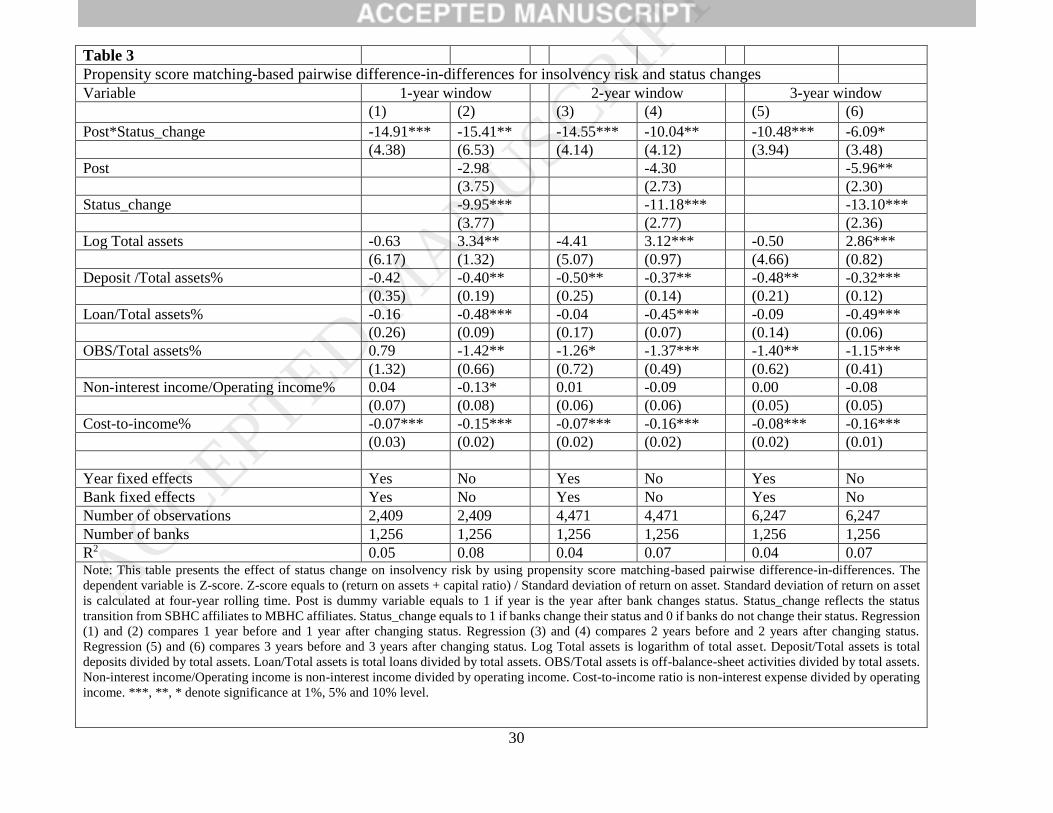
The results of the diff-in-diff analysis are presented in Table 3. Regression (1) compares one
year before and after the status changes. Regressions (3) and (5) compare two- and three-windows
before and after the status changes, respectively.
In three regressions, the interaction term of Post*Status_change is negative and significant,
indicating that SBHC affiliates changing into MBHC affiliates tend to increase their level of risk as
compared to those controlled SBHC affiliates with no such changes.
For robustness check, we include all Post, Status_change and their interaction term
(Post*Status_change) in our diff-in-diff model without controlling for bank and time fixed effects.
ACCEPTED MANUSCRIP
T
16
The results are reported in model (2), (4) and (6). We found the consistent results with this
alternative test. This experiment reaffirms our main finding that MBHC affiliates are riskier than
SBHC counterparts.
4.3. Channels
Our evidence so far shows that MBHC affiliates are riskier than SBHC affiliates. In this section, we
try to document the channels behind this difference. Since U.S. BHCs have developed substantial
acquisition over many subsidiaries and across the U.S. (Cetorelli et al. 2014), their organizational
and geographic complexity has substantially increased. The agency problem between the managers
of the parent and affiliates in the organizational hierarchy may lead to less efficient investments for
subsidiaries (Rajan et al. 2000, Scharfstein and Stein 2000). Jennings et al. (2015) find that
geographic complexity reduces the quality and quantity of management’s communication and
increase the cost of gathering and analyzing information. Therefore, Goetz et al. (2013) suggest that
geographic diversification of BHCs reduces BHC valuation and intensifies agency problems. In
addition to organizational and geographic complexity, banks also face business complexity. Black
et al. (1978) highlight that risky activities are carried within holding company or nonbank affiliates
rather than within the bank subsidiaries themselves. It is not obvious that operating under the same
BHCs, bank subsidiaries are completely insulated from non-bank affiliaties (Wall 1987).
The causal mediation analysis recommended by Imai et al. (2011), Imai et al. (2010) and
Judd and Kenny (1981) allows researchers to test competing theoretical explanations by identifying
intermediate variables or mediators that lie in the causal pathway between the treatment and the
outcome. If the treatment has no effect on the outcome once the mediators are controlled, one could
conclude that the mediators totally mediate the effect of the treatment on the outcome (Judd and
Kenny 1981). In this section, therefore, we test whether the higher level of insolvency risk for
MBHC affiliates is due to the level of complexity at its parent level.
ACCEPTED MANUSCRIP
T
17
Specifically, we employ three measures of complexity. They are organizational, geographic,
and business complexity. First, the measure of organizational complexity is the total number of bank
and non-bank subsidiaries at the BHC parent level. The number of non-bank subsidiaries is retrieved
from the consolidated BHC data FR Y-9SP, and this data is available from 1998 onwards.4
Therefore, the analysis includes bank-year observations from 1998 to 2012. Second, geographic
complexity equals one minus BHC’s concentration of asset cross states that is measured by
Herfindahl–Hirschman index of BHC’s assets in each state in which it is active (Goetz et al. 2013).
Third, we follow Stiroh and Rumble (2006) and Stiroh (2004) to construct business complexity as
non-interest income divided by operating income at the parent BHC level. We include the
interaction of MBHC dummy with the three complexity measures, respectively, to the main
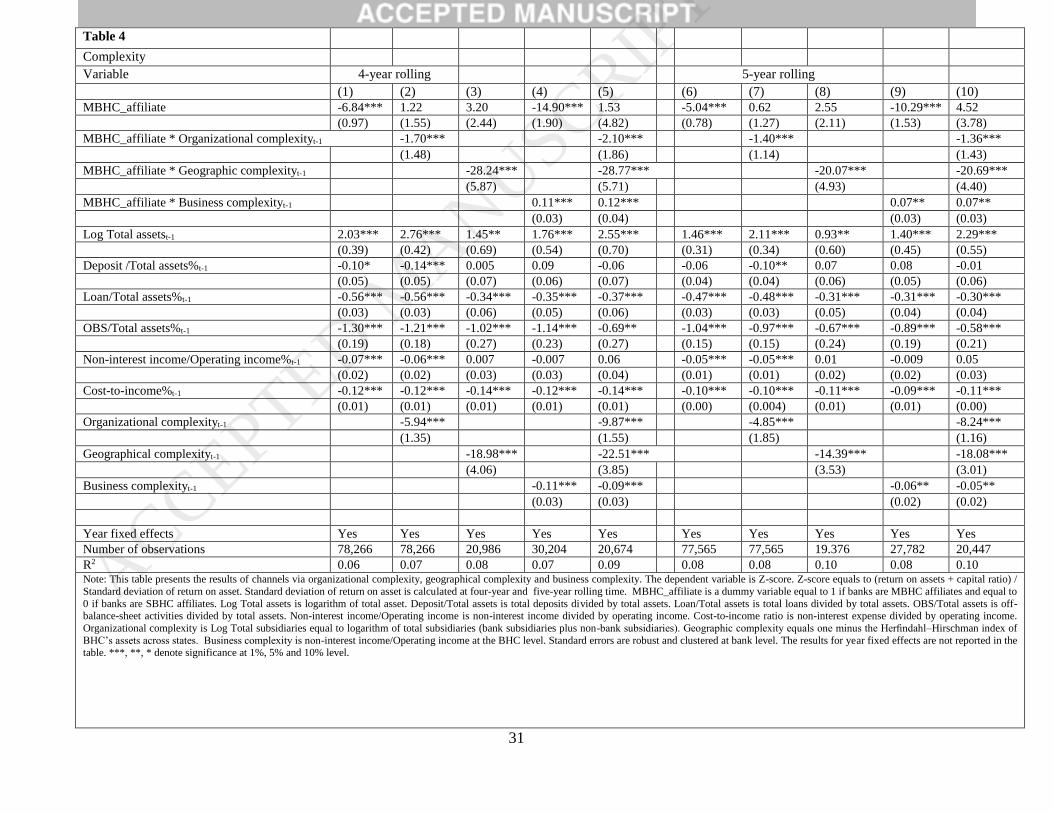
regression. Table 4 reports the results of Z-score with four-year and five-year rolling windows to
show the consistency of findings.
The coefficients of all complexity measures in column (2), (3) and (4) of Table 4 are negative
and significant at 1% level, suggesting that overall complexity, either organizational or geographical
or business, is negatively related to bank safety. Complexity theory posits that a competitive
environment exists in the hierarchy structure (Pina e Cunha and Vieira da Cunha 2006, Anderson
1999). Evidence in the form of the threat of ‘poaching’ shows that managers of low-growth
subsidiaries can ‘poach’ the surplus of their high-growth counterparts (Rajan et al. 2000).
Insufficient capital raises the high probability of bank failure, implying inefficient banking system
(Chortareas et al. (2012).
As compared with model (1) of Table 4, model (2) and (3) show that the negative effect of
MBHC_affiliate on Z-score found in model (1) is taken away once we control for organizational
4 We downloaded number of non-bank subsidiaries of a BHC in WRDS database under the tab “Bank Regulatory -
Bank Holding Companies”. The code of this variable is “BHCP2794 – Number of nonbank subsidiaries”.
ACCEPTED MANUSCRIP
T
18
and geographic complexity, respectively, indicating that the difference in risk between MBHC and
SBHC affiliates may be channeled from the bank’s organizational and geographic complexity at the
parent level, in line with our second hypothesis. The interactions of MBHC_affiliate*Organizational
complexity and MBHC*Geographical complexity are negative and significant at 1% level,
indicating that banks affiliated with MBHCs holding more complex structure and greater
geographical complexity are exposed to greater insolvency risk. However, model (4) shows that the
coefficient of MBHC_affiliate remains significantly negative, implying that the significant
difference between MBHC_affiliate and SBHC_affiliate as documented in the main regressions still
exists even in the presence of the interaction between BHC’s business complexity and
MBHC_affiliate. This result suggests that business complexity at the parent level is not the channel
for the baseline results.
We find that the interaction of MBHC_affiliate*business complexity is positive and
significant. This finding suggests that the difference in Z-score between MBHC_affiliate and
SBHC_affiliate becomes smaller when the MBHC affiliates engage in more non-interest income
activities to smooth out the volatility of returns, which in turn increases the Z-score, and hence bank
stability. Our result is consistent with the finding of Wagner (2010) that diversification reduces bank
failure. Zhang (2013) explains that non-interest income diversifies bank revenue by reducing the
covariance between the net interest income and non-interest income, therefore, a reduction in the
volatility of the net operating income. Gallo et al. (1996) find that mutual fund activities contribute
to risk reduction and an increase in bank profitability for BHCs, and conclude that the risk reduction
is a collective result of bank’s engagement in a wide range of new financial business lines.
In an attempt to provide a robustness check for our main findings, we include three
interaction terms between MBHC_affiliate with organizational/geographic/business complexity in
our model and the results are reported in column (5) and (10) of Table 4. We find that the negative
effect of MBHC_affiliate on Z-score found in model (1) of Table 4 is taken away once we include
ACCEPTED MANUSCRIP
T
19
three interaction terms between MBHC_affiliate with organizational/geographic/business
complexity in our model. These results are consistent with the ones reported in column (2), (3), (7)
and (8) that the difference in risk between MBHC and SBHC affiliates may be channeled from the
bank’s organizational and geographic complexity at the parent level, in line with our second
hypothesis.
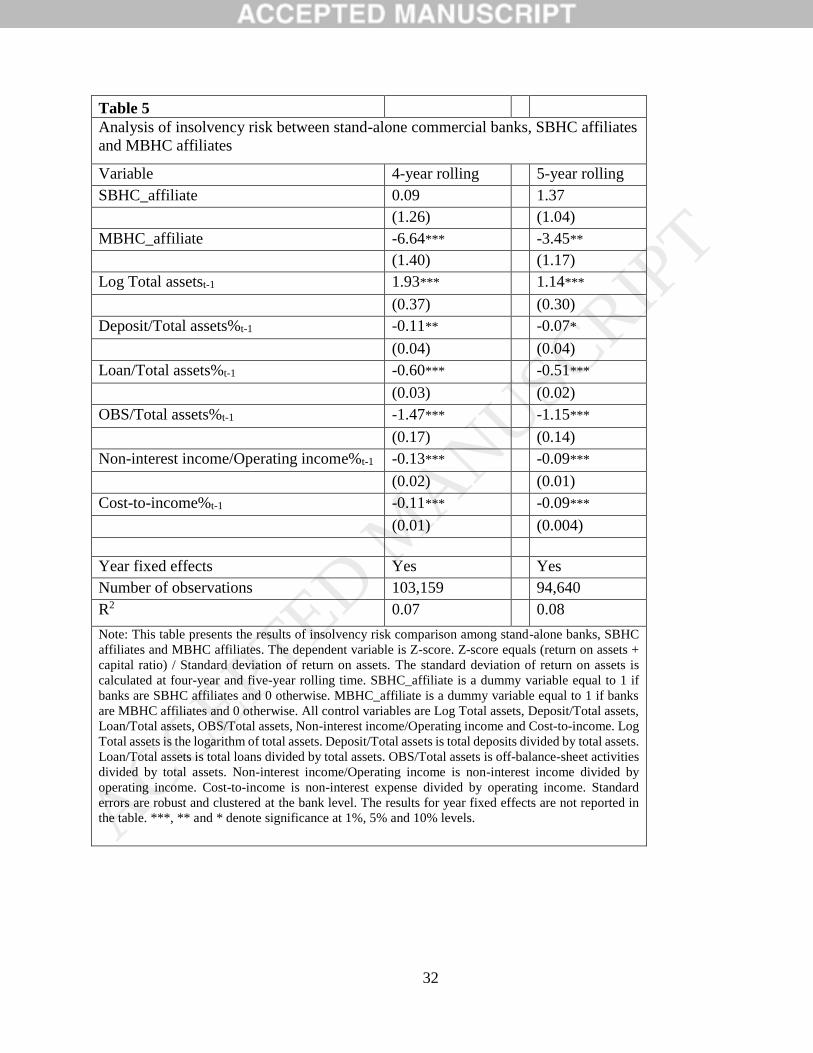
4.4. Risk comparisons among stand-alone commercial banks, SBHC affiliates and MBHC
affiliates
We then consider stand-alone banks as a separate group in addition to SBHC and MBHC
affiliates and compare the insolvency risk among the three groups in this section. Specifically, we
include both SBHC_affiliate and MBHC_affiliate indicator variables in the model:
n
i
ititiiiit CONTROLSaffiliateMBHCaffiliateSBHCscoreZ1
1210 __ (3)
Where SBHC_affiliate equals 1 if the banks are SBHC affiliates, and 0 otherwise.
MBHC_affiliate equals 1 if banks are MBHC affiliates, and 0 otherwise. Time fixed effects are
included. Table 5 reports the results when a four-year and fiver-year rolling window of Z-score is
considered.
Table 5 shows that SBHC_affiliate is insignificant, indicating that bank insolvency risk is
not different between stand-alone banks and SBHC affiliates. We find no significant difference in
bank risk between stand-alone banks and SBHC affiliates. This result is not surprising, given that
most SBHCs do not have non-bank subsidiaries and hence do not form an internal capital market
within the SBHCs. In consistent with our main results, we find that MBHC affiliates are riskier than
stand-alone banks.
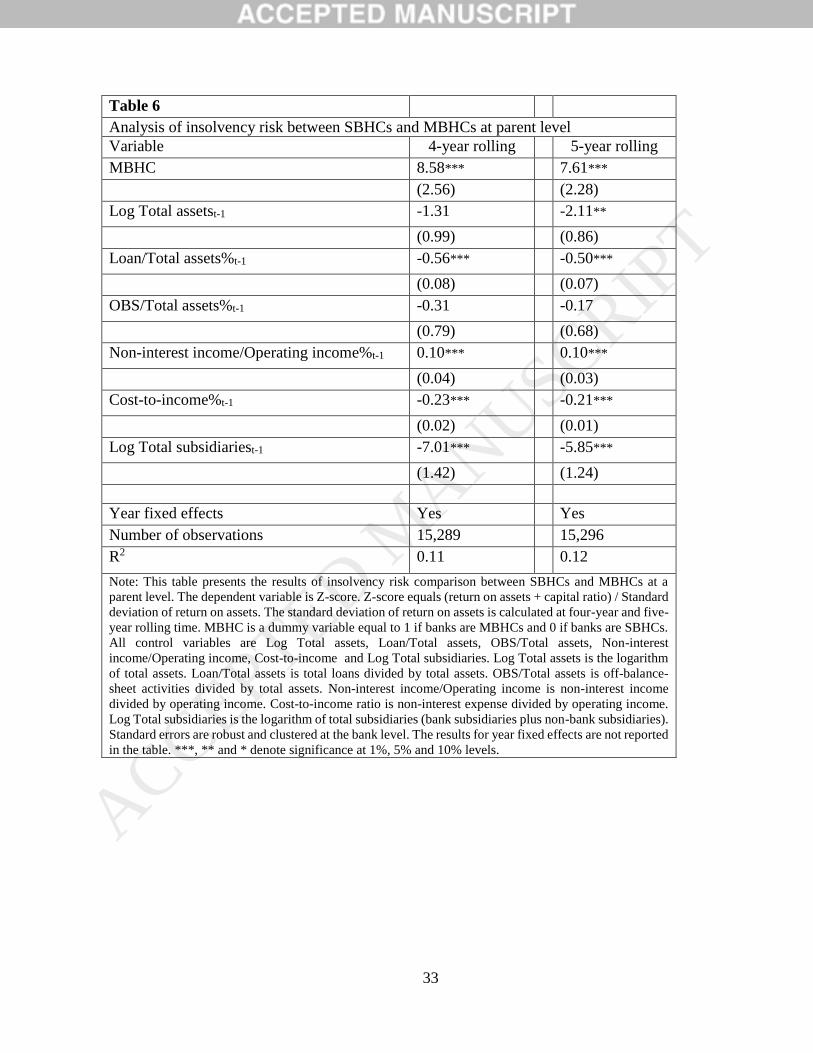
5. Risk comparison between SBHCs and MBHCs at the parent level
The results in the previous sections suggest that MBHC affiliates have higher insolvency
risk than both SBHC affiliates and stand-alone commercial banks, and this difference is driven by
ACCEPTED MANUSCRIP
T
20
the level of organizational and geographic complexity at the BHC parent level. In this section, we
examine the difference in insolvency risk between SBHCs and MBHCs at the parent level.
It is widely perceived that BHCs have become substantially more complex by incorporating
a large number of subsidiaries (Cetorelli et al. 2014). On the one hand, efficient internal capital
market models particularly suggest that diversification creates value. That is the reason why earlier
studies (Dimitrov and Tice 2006, Claessens et al. 1999, Stein 1997) conclude that diversification at
the parent level leads to risk reduction in subsidiaries. On the other hand, Matsusaka and Nanda
(2002) argue that diversification can be efficient or inefficient, depending on the characteristics of
the firms. They put forward a theory of diversification discount based on the agency theory
suggestion that the headquarters of the conglomerates themselves introduce another layer of agency
problems among subsidiaries, causing diversification discount.
We use the consolidated BHC data as Y-9C reports from 1994 to 2012 and the following
model:
n
i
ititiiit CONTROLSparentMBHCscoreZ1
110 _ (4)
Where MBHC_parent equals 1 if the banks are an MBHC parents and 0 if they are SBHC
parents. εit denotes the error term. Time fixed effects are included. Table 6 reports the results
Our results show that there is a diversification gain at the BHC parent level. MBHCs are
more geographically diversified than SBHCs, hence, the coinsurance effect associated with
geographic diversification benefits the MBHC parent with lower insolvency risk at the parent level.
According to portfolio theory, portfolio aggregates individual stocks to gain a diversification effect,
provided that beta instability is inherent in the individual stocks. Confirming the portfolio view of
banking, Demsetz and Strahan (1997) conclude that large banks are able to internally diversify and
reduce the risk. Consistent with the portfolio theory view, although MBHC affiliates have a higher
ACCEPTED MANUSCRIP
T
21
level of insolvency risk than their SBHC counterparts, the MBHC can achieve maximum
diversification benefits at the parent level.
Conclusion
We conduct a risk comparison analysis of SBHC affiliates and MBHC affiliates. Using U.S.
commercial bank data from 1994 to 2012, we find that MBHCs in the U.S. have lower insolvency
risk than SBHCs at the parent level, but have significantly higher insolvency risk than the latter at
the subsidiary levels. Our evidence suggests that MBHC parents tend to benefit from the internal
capital market, while allowing for more risk taking at the individual levels. Our results provided by
the PSM diff-in-diff approach suggest that SBHC affiliates changing into MBHC affiliates increase
their level of risk more than those not changing status, which reaffirms our main finding. Our results
are consistent with our hypotheses based on complexity theory – that MBHC affiliates face higher
risks than their SBHC affiliates because of the higher level of organizational and geographic
complexity at the MBHC parent level.
The tendency toward expanding BHC regulation in general and that on commercial banks,
in particular, is best illustrated by the central issue of this study. First, regulators should review the
source-of-strength doctrine for BHCs to ensure that MBHC affiliates can receive bailouts from their
parents in the event of future distress. Second, regulators should separately consider the risk
exposure between banks affiliated with SBHCs and MBHCs. Third, this paper reveals investors’
preference for safe bank structures to achieve efficient investment portfolios. Our findings highlight
the importance of government regulation on banks at both parent and subsidiary levels.
We acknowledge out data limitation that only accounting-based risk measure is used in this
paper. The market-based measures such as distance-to-default and asset volatility measures based
on KMV/Merton model require data from listed banks. However, our paper focuses mainly on banks
at their subsidiary levels while most banks are listed at their parent or bank holding company levels.
ACCEPTED MANUSCRIP
T

22
Therefore, the data limitations of listed banks restricted our ability to estimate market-based risk
measures.
ACCEPTED MANUSCRIP
T
23
REFERENCES
Anderson, P. (1999) 'Complexity theory and organization science', Organization Science, 10(3),
216-232.
Avraham, D., Selvaggi, P. and Vickery, J. (2012) 'A structure view of US bank holding companies',
FRBNY Economic Policy Review, 18(2), 65-81.
Baule, R. (2014) 'Allocation of risk capital on an internal market', European Journal of Operational
Research, 234(1), 186–196.
Berger, A. N. and DeYoung, R. (2001) 'The effects of geographic expansion on bank efficiency',
Journal of Financial Services Research, 19(2), 163–184.
Billett, M. T. and Mauer, D. C. (2003) 'Cross-subsidies, external financing constraints, and the
contribution of the internal capital market to firm value', Review of Financial Studies, 16(4),
1167-1201.
Black, F., Miller, M. H. & Posner, R. A. (1978) 'An approach to the regulation of bank holding
companies', Journal of Business, 51, 379-412.
Blundell, R. and Dias, M. C. (2000) 'Evaluation methods for non-experimental data', Fiscal Studies,
21(4), 427-468.
Cetorelli, N. and Goldberg, L. S. (2014) 'Measures of global bank complexity', FRBNY Economic
Policy Review, 20(2), 107-126.
Cetorelli, N., McAndrews, J. and Traina, J. (2014) 'Evolution in bank complexity', FRBNY
Economic Policy Review, 20(2), 85-106.
Chortareas, G. E., Girardone, C. and Ventouri, A. (2012) 'Bank supervision, regulation, and
efficiency: Evidence from the European Union, Journal of Financial Stability, 8, 292-302.
Claessens, S., Djankov, S., Fan, J. P. H. and Lang, L. H. P. (1999) 'Corporate diversification in East
Asia: The role of ultimate ownership and group affiliation', The World Bank Policy research
working paper, 2089.
Copeland, A. (2012) 'Evolution and heterogeneity among larger bank holding companies: 1994 to
2010', FRBNY Economic Policy Review, 18(2), 83-91.
Cremers, K. J. M., Huang, R. and Sautner, Z. (2011) 'Internal Capital Markets and Corporate Politics
in a Banking Group', Review of Financial Studies, 24(2), 358 - 401.
Demirgüc-Kunt, A. and Huizinga, H. (2010) 'Bank activity and funding strategies: The impact on
risk and returns', Journal of Financial Economics, 98(3), 626-650.
Demsetz, R. S. and Strahan, P. E. (1995) 'Historical patterns and recent changes in the relationship
between bank holding company size and risk', Economic Policy Review, 1(2), 13-26.
ACCEPTED MANUSCRIP
T
24
Demsetz, R. S. and Strahan, P. E. (1997) 'Diversification, size, and risk at bank holding companies',
Journal of Money, Credit and Banking, 29(3), 300-313.
Deng, S. and Elyasiani, E. (2008) 'Geographic diversification, bank holding company value, and
risk', Journal of Money, Credit and Banking, 40(6), 1218-1238.
DeYoung, R. (2003) 'De novo bank exit', Journal of Money, Credit and Banking, 35(5), 711-728.
Dimitrov, V. and Tice, S. (2006) 'Corporate diversification and credit constraints: real effects across
the business cycle', Review of Financial Studies, 19(4), 1465–1498.
Drehmann, M. and Tarashev, N. (2011) 'Systemic Importance: Some Simple Indicators', Bank for
International Settlements, March, 25-37.
Duran, M, A. and Lozano-Vivas, A. (2014) ' Risk shifting in the US banking system: An empirical
analysis', Journal of Financial Stability, 13, 64-74.
Fauver, L., Houston, J. and Naranjo, A. (2003) 'Capital market development, international
integration, legal systems, and the value of corporate diversification: A cross-country
analysis', Journal of Financial and Quantitative Analysis, 38(1), 135-157.
Ferris, S. P., Kim, K. A. and Kitsabunnarat, P. (2003) 'The costs (and benefits?) of diversified
business groups: The case of Korean chaebols', Journal of Banking and Finance, 27(2), 251–
273.
Foos, D., Norden, L. and Weber, M. (2010) 'Loan growth and riskiness of banks', Journal of Banking
and Finance, 34(12), 2929–2940.
Frankel, T. (2013) 'Dismantling large bank holding companies for their own good and for the good
of the country', Banking and Financial Services Policy Report, 32(7), 12-26.
Gallo, J., Apilado, V. and Kolari, J. (1996) 'Commercial bank mutual fund activities: implications
for bank risk and profitability, Journal of Banking and Finance, 20(10), 1775-1792.
Gilbert, R. A. (1991) 'Do bank holding companies act as “source of strength" for their bank', Federal
Reserve Bank of St. Louis Review, 3-18.
Goetz, M.R., Laeven, L. and Levine, R. (2013) 'identifying the valuation effects and agency costs
of corporate diversification: Evidence from the geographic diversification of U.S. banks,
Review of Financial Studies, 26(7), 1788-1823.
Gopalan, R., Vikram, N. and Amit, S. (2007) 'Affiliated firms and financial support: evidence from
Indian business groups', Journal of Financial Economics, 86(3), 759–795.
Houston, J. and James, C. (1998) 'Do Bank Internal Capital Markets Promote Lending?', Journal of
Banking and Finance, 22(6-8), 899–918.
Houston, J., James, C. and Marcus, D. (1997) 'Capital market frictions and the role of internal capital
markets in banking', Journal of Financial Economics, 46(2), 135-164.
ACCEPTED MANUSCRIP
T
25
Huang, X., Zhou, H. and Zhu, H. (2012) 'Systemic risk contributions', Journal of Financial Services
Research, 42(1), 55-83.
Hughes, J. P., Lang, W., Mester, L. J. and Moon, C-G. (1996), ‘Efficient banking under interstate
branching’, Journal of Money, Credit and Banking, Vol. 28, No. 4, pp. 1045-1071.
Hughes, J. P., Lang, W., Mester, L. J. and Moon, C.-G. (1999) 'The dollars and sense of bank
consolidation', Journal of Banking and Finance, 23(2), 291–324.
Imai, K., Keele, L. and Tingley, D. (2010) 'A general approach to causal mediation analysis',
Psychological Methods, 15(4), 309-334.
Imai, K., Keele, L., Tingley, D. and Yamamoto, T. (2011) 'Unpacking the black box of causality:
Learning about casual mechanisms from experimental and observational studies', American
Political Science Review, 105(4), 765-789.
Jayaratne, J. and Strahan, P. E. (1996) 'The finance-growth nexus: Evidence from bank branch
deregulation', Quarterly Journal of Economics, 111(3), 639-970.
Jennings, J., H. Seo, and Tanlu, L. (2015) 'The effect of organizational complexity on earnings
forecasting behavior', Working Paper, Washington University in St. Louis.
Judd, C. M. and Kenny, D. A. (1981) 'Process analysis: Estimating mediation in treatment
evaluations', Evaluation Review, 5(5), 602-619.
Kahn, C. and Winton, A. (2004) 'Moral hazard and optimal subsidiary structure for financial
institutions', Journal of Finance, 56(6), 2531-2575.
Kaufman, G. G. (2014) 'Too big to fail in banking: What does it mean?', Journal of Financial
Stability, 13, 214-223.
Khanna, T. and Palepu, K. (2000) 'Is group affiliation profitable in emerging markets? An analysis
of diversified Indian business groups', Journal of Finance, 55(2), 867-891.
Khanna, T. and Yafeh, Y. (2005) 'Business groups and risk sharing around the world', Journal of
Business, 78(1), 301–340.
Khanna, T. and Yafeh, Y. (2007) 'Business groups in emerging markets: paragons or parasites?',
Journal of Economic Literature, 45(2), 331–372.
Korte, J. (2015) 'Catharsis - The real effects of bank insolvency and resolution', Journal of Financial
Stability, 16, 213-231.
Laeven, L. and Levine, R. (2009) 'Bank governance, regulation and risk-taking', Journal of Financial
Economics, 93(2), 259–275.
ACCEPTED MANUSCRIP
T
26
Lamont, O. (1997) 'Cash Flow and Investment: Evidence from Internal Capital Markets', Journal of
Finance, 52(1), 3–110.
Lepetit, L., Nys, E., Rous, P. and Tarazi, A. (2008) 'Bank income structure and risk: An empirical
analysis of European banks', Journal of Banking and Finance, 32(8), 1452-1467.
Lewellen, W. (1971) 'A pure financial rationale for the conglomerate merger', Journal of Finance
26(2), 521–537.
Lin, K. and Servaes, H. (2002) 'Is corporate diversification beneficial in emerging markets',
Financial Management, 31(2), 5-31.
Liu, H., Norden, L. and Spargoli, F. (2016) 'Why banks want to be complex', The American
Economic Association 2016 Meetings.
Marisetty, V. B. and Subrahmanyam, M. G. (2010) 'Group affiliation and the performance of initial
public offerings in the Indian stock market', Journal of Financial Markets, 13(1), 1–39.
Matsusaka, J. G. and Nanda, V. (2002) ' Internal capital markets and corporate refocusing', Journal
of Financial Intermediation, 11(2), 176-211.
Mayne, L. S. (1977) ‘A comparative study of bank holding company affiliates and independent
bank, 1969-1972’, Journal of Finance, 32(1), 147-158.
Memmel, C., Gunduz, Y. and Raupach, P. (2015) 'The common drivers of default risk', Journal of
Financial Stability, 16, 232-247.
Pina e Cunha, M. and Vieira da Cunha, J. (2006) 'Towards a complexity theory of strategy',
Management Decision, 44(7), 839-847.
Piper, T. R. and Weiss, S. J. (1974) ‘The profitability of multibank holding companies acquisitions’,
Journal of Finance, 29(1), 163-174.
Pozdena, R. J. (1988) 'Banks affiliated with bank holding companies: a new look at their
performance', Economic Review, (Fall), 29-40.
Rajan, R., Servaes, H. and Zingales, L. (2000) 'The cost of diversity: The diversification discount
and inefficient investments', Journal of Finance, 55(1), 35-80.
Rose, P. S. and Scott, W. L. (1979) ‘The performance of banks acquired by holding companies’,
Review of Business and Economic Research, 15(3), 18-37.
Scharfstein, D. and Stein, J. (2000) 'The dark side of internal capital markets: divisional rent seeking
and inefficient investment', Journal of Finance, 55(6), 2537-2564.
Shin, H.-H. and Stulz, R. (1998) 'Are Internal Capital Markets Efficient?', Quarterly Journal of
Economics, 113(2), 531–552.
ACCEPTED MANUSCRIP
T
27
Stein, J. C. (1997) 'Internal capital markets and the competition for corporate resources', Journal of
Finance, 52(1), 111-133.
Stiroh, K. J. (2004) 'Diversification in banking: Is noninterest income the answer?', Journal of
Money, Credit, and Banking, 36(5), 853–882.
Stiroh, K. J. and Rumble, A. (2006) 'The dark side of diversification: The case of US financial
holding companies', Journal of Banking and Finance, 30(8), 2131-2161.
Talley, S. H. (1972) ‘The effect of holding company acquisitions on bank performance’, Staff
Economic Study, Board of Governors of the Federal Reserve System, No. 69.
Tarashev, N., Borio, C. and Tsatsaronis, K. (2009) 'The systemic importance of financial
institutions', Bank for International Settlements, September, 75-87.
Wagner, W. (2010) 'Diversification at financial institutions and systemic crises', Journal of Financial
Intermediation, 19, 373-386.
Wall, L. D. (1987), ‘Has bank holding companies’ diversification affected their risk of failure?’,
Journal of Economics and Business, Vol. 39, pp. 313-326.
Ware, R. F. (1973) ‘Performance of banks acquired by multi-bank holding companies in Ohio’,
Economic Review, Federal Reserve Bank of Cleveland, March-April, 19-28.
Whited, T. M. (2001) 'Is it inefficient investment that causes the diversification discount?', Journal
of Finance, 56(5), 1667-1691.
Yamori, N., Harimaya, K. and Kondo, K. (2003) ‘Are banks affiliated with bank holding companies
more efficient than independent banks? The recent experience regarding Japanese Regional
BHCs’, Asia-Pacific Financial Markets, 10, 359-376.
Zang, Y. (2013) 'Are there diversification benefits of increasing noninterest income in the Chinese
banking industry', Journal of Empirical Finance 24, 151-165.
ACCEPTED MANUSCRIP
T
28
Table 1
Descriptive statistics
Variable All banks SBHC affiliates MBHC affiliates t-test for
difference
in means N Mean Std N Mean Std N Mean Std
Z-score 94,543 71.96 67.77 67,732 73.34 69.48 26,811 68.48 63.09 ***
Log Total assets 94,543 11.83 1.34 67,732 11.76 1.19 26,811 12.02 1.64 ***
Deposit/Total assets% 94,543 83.10 9.84 67,732 84.12 6.81 26,811 80.54 14.66 ***
Loan/Total assets% 94,543 63.15 15.25 67,732 63.19 14.48 26,811 63.04 17.05
OBS/Total assets% 94,543 1.68 2.35 67,732 1.49 2.07 26,811 2.14 2.92 ***
Non-interest income/Operating income% 94,543 26.31 30.93 67,732 25.53 28.08 26,811 28.27 37.09 ***
Cost-to-income% 94,543 101.64 88.93 67,732 106.58 90.24 26,811 89.16 84.24 ***
Log Total subsidiaries 87699 0.53 0.93 63,460 0.09 0.34 24,239 1.68 0.99 ***
Note: This table describes a number of observations, means and standard deviations on all the regression variables for all banks, SBHC affiliates and MBHC affiliates. The
dependent variable is insolvency risk measured by Z-score. Z-score equals (return on assets + capital ratio) / Standard deviation of return on assets. The standard deviation
of return on assets is calculated at the four-year rolling time. All independent variables are Log Total assets, Deposit/Total assets, Loan/Total assets, OBS/Total assets,
Non-interest income/Operating income, Cost-to-income and, Log Total subsidiaries. Log Total assets is the logarithm of total assets. Deposit/Total assets is total deposits
divided by total assets. Loan/Total assets is total loans divided by total assets. OBS/Total assets is off-balance-sheet activities divided by total assets. Non-interest
income/Operating income is non-interest income divided by operating income. Cost-to-income is non-interest expense divided by operating income. Log Total subsidiaries
is the logarithm of total subsidiaries (bank subsidiaries plus non-bank subsidiaries). In the last column, *** indicate a significant difference of mean at 1% levels between
SBHC and MBHC affiliates.
ACCEPTED MANUSCRIP
T
29
Table 2
Main result: Analysis of insolvency risks between SBHC affiliates and MBHC
affiliates
Variable 4-year rolling 5-year rolling
MBHC_affiliate -7.10*** -5.21***
(0.94) (0.79)
Log Total assetst-1 2.33*** 1.51***
(0.39) (0.32)
Deposit/Total assets%t-1 -0.10** -0.07
(0.05) (0.04)
Loan/Total assets%t-1 -0.55*** -0.48***
(0.03) (0.03)
OBS/Total assets%t-1 -1.41*** -1.07***
(0.18) (0.15)
Non-interest income/Operating income%t-1 -0.08*** -0.05***
(0.02) (0.01)
Cost-to-income%t-1 -0.12*** -0.10***
(0.01) (0.00)
Year fixed effects Yes Yes
Number of observations 84,582 77,993
R2 0.06 0.08
Note: This table presents the results of insolvency risk comparison between SBHC affiliates and
MBHC affiliates. The dependent variable is Z-score. Z-score is equal to (return on assets + capital
ratio) / Standard deviation of return on assets. The standard deviation of return on assets is
calculated at four-year and five-year rolling time. MBHC_affiliate is a dummy variable equal to
1 if banks are MBHC affiliates and equal to 0 if banks are SBHC affiliates. All control variables
are Log Total assets, Deposit/Total assets, Loan/Total assets, OBS/Total assets, Non-interest
income/Operating income and Cost-to-income. Log Total assets is the logarithm of total assets.
Deposit/Total assets is total deposits divided by total assets. Loan/Total assets is total loans
divided by total assets. OBS/Total assets is off-balance-sheet activities divided by total assets.
Non-interest income/Operating income is non-interest income divided by operating income. Cost-
to-income is non-interest expense divided by operating income. Standard errors are robust and
clustered at bank level. The results for year fixed effects are not reported in the table. ***, ** and
* denote significance at 1%, 5% and 10% levels.
ACCEPTED MANUSCRIP
T
30
Table 3
Propensity score matching-based pairwise difference-in-differences for insolvency risk and status changes
Variable 1-year window 2-year window 3-year window
(1) (2) (3) (4) (5) (6)
Post*Status_change -14.91*** -15.41** -14.55*** -10.04** -10.48*** -6.09*
(4.38) (6.53) (4.14) (4.12) (3.94) (3.48)
Post -2.98 -4.30 -5.96**
(3.75) (2.73) (2.30)
Status_change -9.95*** -11.18*** -13.10***
(3.77) (2.77) (2.36)
Log Total assets -0.63 3.34** -4.41 3.12*** -0.50 2.86***
(6.17) (1.32) (5.07) (0.97) (4.66) (0.82)
Deposit /Total assets% -0.42 -0.40** -0.50** -0.37** -0.48** -0.32***
(0.35) (0.19) (0.25) (0.14) (0.21) (0.12)
Loan/Total assets% -0.16 -0.48*** -0.04 -0.45*** -0.09 -0.49***
(0.26) (0.09) (0.17) (0.07) (0.14) (0.06)
OBS/Total assets% 0.79 -1.42** -1.26* -1.37*** -1.40** -1.15***
(1.32) (0.66) (0.72) (0.49) (0.62) (0.41)
Non-interest income/Operating income% 0.04 -0.13* 0.01 -0.09 0.00 -0.08
(0.07) (0.08) (0.06) (0.06) (0.05) (0.05)
Cost-to-income% -0.07*** -0.15*** -0.07*** -0.16*** -0.08*** -0.16***
(0.03) (0.02) (0.02) (0.02) (0.02) (0.01)
Year fixed effects Yes No Yes No Yes No
Bank fixed effects Yes No Yes No Yes No
Number of observations 2,409 2,409 4,471 4,471 6,247 6,247
Number of banks 1,256 1,256 1,256 1,256 1,256 1,256
R2 0.05 0.08 0.04 0.07 0.04 0.07 Note: This table presents the effect of status change on insolvency risk by using propensity score matching-based pairwise difference-in-differences. The
dependent variable is Z-score. Z-score equals to (return on assets + capital ratio) / Standard deviation of return on asset. Standard deviation of return on asset
is calculated at four-year rolling time. Post is dummy variable equals to 1 if year is the year after bank changes status. Status_change reflects the status
transition from SBHC affiliates to MBHC affiliates. Status_change equals to 1 if banks change their status and 0 if banks do not change their status. Regression
(1) and (2) compares 1 year before and 1 year after changing status. Regression (3) and (4) compares 2 years before and 2 years after changing status.
Regression (5) and (6) compares 3 years before and 3 years after changing status. Log Total assets is logarithm of total asset. Deposit/Total assets is total
deposits divided by total assets. Loan/Total assets is total loans divided by total assets. OBS/Total assets is off-balance-sheet activities divided by total assets.
Non-interest income/Operating income is non-interest income divided by operating income. Cost-to-income ratio is non-interest expense divided by operating
income. ***, **, * denote significance at 1%, 5% and 10% level.
ACCEPTED MANUSCRIP
T
31
Table 4
Complexity
Variable 4-year rolling 5-year rolling (1) (2) (3) (4) (5) (6) (7) (8) (9) (10)
MBHC_affiliate -6.84*** 1.22 3.20 -14.90*** 1.53 -5.04*** 0.62 2.55 -10.29*** 4.52
(0.97) (1.55) (2.44) (1.90) (4.82) (0.78) (1.27) (2.11) (1.53) (3.78)
MBHC_affiliate * Organizational complexityt-1 -1.70*** -2.10*** -1.40*** -1.36***
(1.48) (1.86) (1.14) (1.43)
MBHC_affiliate * Geographic complexityt-1 -28.24*** -28.77*** -20.07*** -20.69***
(5.87) (5.71) (4.93) (4.40)
MBHC_affiliate * Business complexityt-1 0.11*** 0.12*** 0.07** 0.07**
(0.03) (0.04) (0.03) (0.03)
Log Total assetst-1 2.03*** 2.76*** 1.45** 1.76*** 2.55*** 1.46*** 2.11*** 0.93** 1.40*** 2.29***
(0.39) (0.42) (0.69) (0.54) (0.70) (0.31) (0.34) (0.60) (0.45) (0.55)
Deposit /Total assets%t-1 -0.10* -0.14*** 0.005 0.09 -0.06 -0.06 -0.10** 0.07 0.08 -0.01
(0.05) (0.05) (0.07) (0.06) (0.07) (0.04) (0.04) (0.06) (0.05) (0.06)
Loan/Total assets%t-1 -0.56*** -0.56*** -0.34*** -0.35*** -0.37*** -0.47*** -0.48*** -0.31*** -0.31*** -0.30***
(0.03) (0.03) (0.06) (0.05) (0.06) (0.03) (0.03) (0.05) (0.04) (0.04)
OBS/Total assets%t-1 -1.30*** -1.21*** -1.02*** -1.14*** -0.69** -1.04*** -0.97*** -0.67*** -0.89*** -0.58***
(0.19) (0.18) (0.27) (0.23) (0.27) (0.15) (0.15) (0.24) (0.19) (0.21)
Non-interest income/Operating income%t-1 -0.07*** -0.06*** 0.007 -0.007 0.06 -0.05*** -0.05*** 0.01 -0.009 0.05
(0.02) (0.02) (0.03) (0.03) (0.04) (0.01) (0.01) (0.02) (0.02) (0.03)
Cost-to-income%t-1 -0.12*** -0.12*** -0.14*** -0.12*** -0.14*** -0.10*** -0.10*** -0.11*** -0.09*** -0.11***
(0.01) (0.01) (0.01) (0.01) (0.01) (0.00) (0.004) (0.01) (0.01) (0.00)
Organizational complexityt-1 -5.94*** -9.87*** -4.85*** -8.24***
(1.35) (1.55) (1.85) (1.16)
Geographical complexityt-1 -18.98*** -22.51*** -14.39*** -18.08***
(4.06) (3.85) (3.53) (3.01)
Business complexityt-1 -0.11*** -0.09*** -0.06** -0.05**
(0.03) (0.03) (0.02) (0.02)
Year fixed effects Yes Yes Yes Yes Yes Yes Yes Yes Yes Yes
Number of observations 78,266 78,266 20,986 30,204 20,674 77,565 77,565 19.376 27,782 20,447
R2 0.06 0.07 0.08 0.07 0.09 0.08 0.08 0.10 0.08 0.10 Note: This table presents the results of channels via organizational complexity, geographical complexity and business complexity. The dependent variable is Z-score. Z-score equals to (return on assets + capital ratio) /
Standard deviation of return on asset. Standard deviation of return on asset is calculated at four-year and five-year rolling time. MBHC_affiliate is a dummy variable equal to 1 if banks are MBHC affiliates and equal to
0 if banks are SBHC affiliates. Log Total assets is logarithm of total asset. Deposit/Total assets is total deposits divided by total assets. Loan/Total assets is total loans divided by total assets. OBS/Total assets is off-balance-sheet activities divided by total assets. Non-interest income/Operating income is non-interest income divided by operating income. Cost-to-income ratio is non-interest expense divided by operating income.
Organizational complexity is Log Total subsidiaries equal to logarithm of total subsidiaries (bank subsidiaries plus non-bank subsidiaries). Geographic complexity equals one minus the Herfindahl–Hirschman index of
BHC’s assets across states. Business complexity is non-interest income/Operating income at the BHC level. Standard errors are robust and clustered at bank level. The results for year fixed effects are not reported in the table. ***, **, * denote significance at 1%, 5% and 10% level.
ACCEPTED MANUSCRIP
T
32
Table 5
Analysis of insolvency risk between stand-alone commercial banks, SBHC affiliates
and MBHC affiliates
Variable 4-year rolling 5-year rolling
SBHC_affiliate 0.09 1.37
(1.26) (1.04)
MBHC_affiliate -6.64*** -3.45**
(1.40) (1.17)
Log Total assetst-1 1.93*** 1.14***
(0.37) (0.30)
Deposit/Total assets%t-1 -0.11** -0.07*
(0.04) (0.04)
Loan/Total assets%t-1 -0.60*** -0.51***
(0.03) (0.02)
OBS/Total assets%t-1 -1.47*** -1.15***
(0.17) (0.14)
Non-interest income/Operating income%t-1 -0.13*** -0.09***
(0.02) (0.01)
Cost-to-income%t-1 -0.11*** -0.09***
(0.01) (0.004)
Year fixed effects Yes Yes
Number of observations 103,159 94,640
R2 0.07 0.08
Note: This table presents the results of insolvency risk comparison among stand-alone banks, SBHC
affiliates and MBHC affiliates. The dependent variable is Z-score. Z-score equals (return on assets +
capital ratio) / Standard deviation of return on assets. The standard deviation of return on assets is
calculated at four-year and five-year rolling time. SBHC_affiliate is a dummy variable equal to 1 if
banks are SBHC affiliates and 0 otherwise. MBHC_affiliate is a dummy variable equal to 1 if banks
are MBHC affiliates and 0 otherwise. All control variables are Log Total assets, Deposit/Total assets,
Loan/Total assets, OBS/Total assets, Non-interest income/Operating income and Cost-to-income. Log
Total assets is the logarithm of total assets. Deposit/Total assets is total deposits divided by total assets.
Loan/Total assets is total loans divided by total assets. OBS/Total assets is off-balance-sheet activities
divided by total assets. Non-interest income/Operating income is non-interest income divided by
operating income. Cost-to-income is non-interest expense divided by operating income. Standard
errors are robust and clustered at the bank level. The results for year fixed effects are not reported in
the table. ***, ** and * denote significance at 1%, 5% and 10% levels.
ACCEPTED MANUSCRIP
T
33
Table 6
Analysis of insolvency risk between SBHCs and MBHCs at parent level
Variable 4-year rolling 5-year rolling
MBHC 8.58*** 7.61***
(2.56) (2.28)
Log Total assetst-1 -1.31 -2.11**
(0.99) (0.86)
Loan/Total assets%t-1 -0.56*** -0.50***
(0.08) (0.07)
OBS/Total assets%t-1 -0.31 -0.17
(0.79) (0.68)
Non-interest income/Operating income%t-1 0.10*** 0.10***
(0.04) (0.03)
Cost-to-income%t-1 -0.23*** -0.21***
(0.02) (0.01)
Log Total subsidiariest-1 -7.01*** -5.85***
(1.42) (1.24)
Year fixed effects Yes Yes
Number of observations 15,289 15,296
R2 0.11 0.12
Note: This table presents the results of insolvency risk comparison between SBHCs and MBHCs at a
parent level. The dependent variable is Z-score. Z-score equals (return on assets + capital ratio) / Standard
deviation of return on assets. The standard deviation of return on assets is calculated at four-year and five-
year rolling time. MBHC is a dummy variable equal to 1 if banks are MBHCs and 0 if banks are SBHCs.
All control variables are Log Total assets, Loan/Total assets, OBS/Total assets, Non-interest
income/Operating income, Cost-to-income and Log Total subsidiaries. Log Total assets is the logarithm
of total assets. Loan/Total assets is total loans divided by total assets. OBS/Total assets is off-balance-
sheet activities divided by total assets. Non-interest income/Operating income is non-interest income
divided by operating income. Cost-to-income ratio is non-interest expense divided by operating income.
Log Total subsidiaries is the logarithm of total subsidiaries (bank subsidiaries plus non-bank subsidiaries).
Standard errors are robust and clustered at the bank level. The results for year fixed effects are not reported
in the table. ***, ** and * denote significance at 1%, 5% and 10% levels.
ACCEPTED MANUSCRIP
T
34
Appendix
Correlation matrix
(1) (2) (3) (4) (5) (6) (7) (8) (9)
(1) MBHC dummy 1
(2) Z-score -0.03* 1
(3) Log Total assets 0.09* -0.01* 1
(4) Deposit/Total assets% -0.16* -0.02* -0.26* 1
(5) Loan/Total assets% -0.004 -0.09* 0.17* 0.09* 1
(6) OBS/Total assets% 0.12* -0.06* 0.49* -0.15* 0.19* 1
(7) Non-interest income/Operating income% 0.04* -0.13* 0.12* -0.24* -0.19* 0.09* 1
(8) Cost-to-income% -0.09* -0.19* -0.05* 0.006 -0.14* 0.0009 0.66* 1
(9) Log Total subsidiaries 0.76* -0.04* 0.32* -0.29* 0.02* 0.26* 0.10* -0.09* 1
Note: (1) MBHC dummy, (2) Z-score, (3) Log Total assets, (4) Deposit/Total assets%, (5) Loan/Total assets%, (6) OBS/Total assets%, (7) Non-interest
income/Operating income%, (8) Cost-to-income%, (9) Log Total subsidiaries. MBHC dummy variable equals 1 if banks are MBHC affiliates and 0 if banks are SBHC
affiliates. Z-score equals (return on assets + capital ratio) / Standard deviation of return on assets. The standard deviation of return on assets is calculated at the four-
year rolling time. Log Total assets is the logarithm of total assets. Deposit/Total assets is total deposits divided by total assets. Loan/Total assets is total loans divided
by total assets. OBS/Total assets is off-balance-sheet activities divided by total assets. Non-interest income/Operating income is non-interest income divided by
operating income. Cost-to-income is non-interest expense divided by operating income. Log Total subsidiaries is the logarithm of total subsidiaries (bank subsidiaries
plus non-bank subsidiaries). * denotes significance at the 1% level.
ACCEPTED MANUSCRIP
T


![ELEVENTH ANNUAL - ACTEC · INTRODUCTION — COMPARISON OF THE DO MESTIC ASSET PROTECT ION TRUST STATUTES [1] INTRODUCTION. A domestic asset …](https://img.pdfslide.net/doc/110x75/5b566c317f8b9a835c8c77e7/eleventh-annual-introduction-comparison-of-the-do-mestic-asset-protect.jpg)