Embed Size (px)
Citation preview
APPROVED: Rudy R. Seward, Major Professor Eric Fritsch, Minor Professor Cynthia M. Cready, Committee Member David A. Williamson, Committee
Member Daniel Rodeheaver, Chair of the
Department of Sociology Tom Evenson, Dean of College of
Public Affairs and Community Service
James D. Meernik, Acting Dean of the Toulouse Graduate School
CAN SOCIAL DISORGANIZATION AND SOCIAL CAPITAL FACTORS HELP
EXPLAIN THE INCIDENCES OF PROPERTY CRIMES IN TURKEY?
Fatih Irmak, B.A., M.S.
Dissertation Prepared for the Degree of
DOCTOR OF PHILOSOPHY
UNIVERSITY OF NORTH TEXAS
December 2011
Irmak, Fatih. Can Social Disorganization and Social Capital Factors Help Explain
the Incidences of Property Crimes in Turkey? Doctor of Philosophy (Sociology),
December 2011, 108 pp., 5 tables, 4 figures, references, 78 titles.
Organized crime and terrorism taking place in the Turkish provinces get more
attention in the public agenda than other type of crimes. Although property crimes
receive less attention, they pose a serious threat to public order and the social welfare
of Turkish society. Academic researchers have also paid little attention to the analysis of
property crimes at the macro level in Turkey. For these reasons, this study focused on
the analysis of property crimes for three years period, 2005, 2006 and 2007 in Turkey,
using a conceptual model of social disorganization. Provincial level data from Turkish
governmental agencies were used. The findings of multivariate analyses showed that
social disorganization approach, as measured in this study, provided a partial
explanation of property crime rates in Turkey. Family disruption and urbanization had
significant effects on property crime rate, while remaining exogenous elements of social
disorganization (i.e., SES, population heterogeneity and residential mobility) did not
have any expected effects. In mediation analysis, using faith-based engagement and
political participation rates as mediators between the structural factors of social
disorganization and property crime rate provided marginal support for the theory.
Political participation rate partially mediated the relationship between property crime
rate and urbanization rate, while faith-based engagement rate did not mediate the
effects of social disorganization variables on property crime rate. These findings were
consistent with the findings of research that has been completed in other nations, and
made a unique contribution to the Turkish research on crime.

ii
Copyright 2011
by
Fatih Irmak
iii
TABLE OF CONTENTS
Page
LIST OF TABLES ............................................................................................................ v
LIST OF FIGURES .......................................................................................................... vi
CHAPTER I INTRODUCTION ......................................................................................... 1
Statement of Problem ........................................................................................... 1
Purpose of Study .................................................................................................. 2
Significance of Study ............................................................................................ 3
Research Questions and Hypotheses .................................................................. 4
CHAPTER II THEORETICAL FRAMEWORK ................................................................. 8
First Interpretations of Social Disorganization ...................................................... 8
Theorization and Emergence of the Social Disorganization Theory ................... 11
Reformulation and New Directions in the Social Disorganization Theory ........... 13
Review of the Social Disorganization Theory ..................................................... 15
Social Capital and Its Various Interpretations ..................................................... 16
Relevance of Theoretical Structure .................................................................... 19
CHAPTER III LITERATURE REVIEW ........................................................................... 22
Social Disorganization ........................................................................................ 22
Social Capital ...................................................................................................... 27
CHAPTER IV DATA AND METHODOLOGY ................................................................ 31
Data and Data Collection .................................................................................... 31
Definition and Measurement of the Variables ..................................................... 32
Property Crime ......................................................................................... 32
iv
Social Disorganization Variables ............................................................. 33
Social Capital Variables ........................................................................... 39
Control Variables ..................................................................................... 40
Reliability and Validity Issues ............................................................................. 43
Analytic Strategy ................................................................................................. 45
Statistical Techniques .............................................................................. 45
Temporal Order in the Regression Models .............................................. 48
CHAPTER V ANALYSES AND FINDINGS ................................................................... 49
Descriptive Statistics .......................................................................................... 49
Bivariate Analysis ............................................................................................... 53
Multivariate Analysis ........................................................................................... 56
Political Participation Rate ....................................................................... 58
Faith-based Engagement Rate ................................................................ 59
Property Crime Rate ................................................................................ 59
Mediation Analysis .............................................................................................. 60
Mediation Effects of Political Participation Rate ....................................... 61
Mediation Effects of Faith-based Engagement Rate ................................ 63
CHAPTER VI CONCLUSION ........................................................................................ 66
Discussion .......................................................................................................... 66
Policy Recommendations ................................................................................... 69
Limitations and Recommendations for Further Research ................................... 72
APPENDICES ............................................................................................................... 77
REFERENCES ............................................................................................................ 101
v
LIST OF TABLES
Page Table 1 Descriptive Statistics ........................................................................................ 52
Table 2 Bivariate Correlations ....................................................................................... 55
Table 3 Estimates of OLS Regression Models Predicting Political Participation (2004),
Faith-based Engagement (2004) and Property Crime Rates (2005-2007) in
Turkey, Provinces ............................................................................................... 57
Table 4 Decomposition of the Effects of Social Disorganization Variables and Political
Participation Rate on Property Crime Rate ......................................................... 63
Table 5 Decomposition of the Effects of Social Disorganization Variables and Faith-
based Engagement Rate on Property Crime Rate ............................................. 65
vi
LIST OF FIGURES
Page
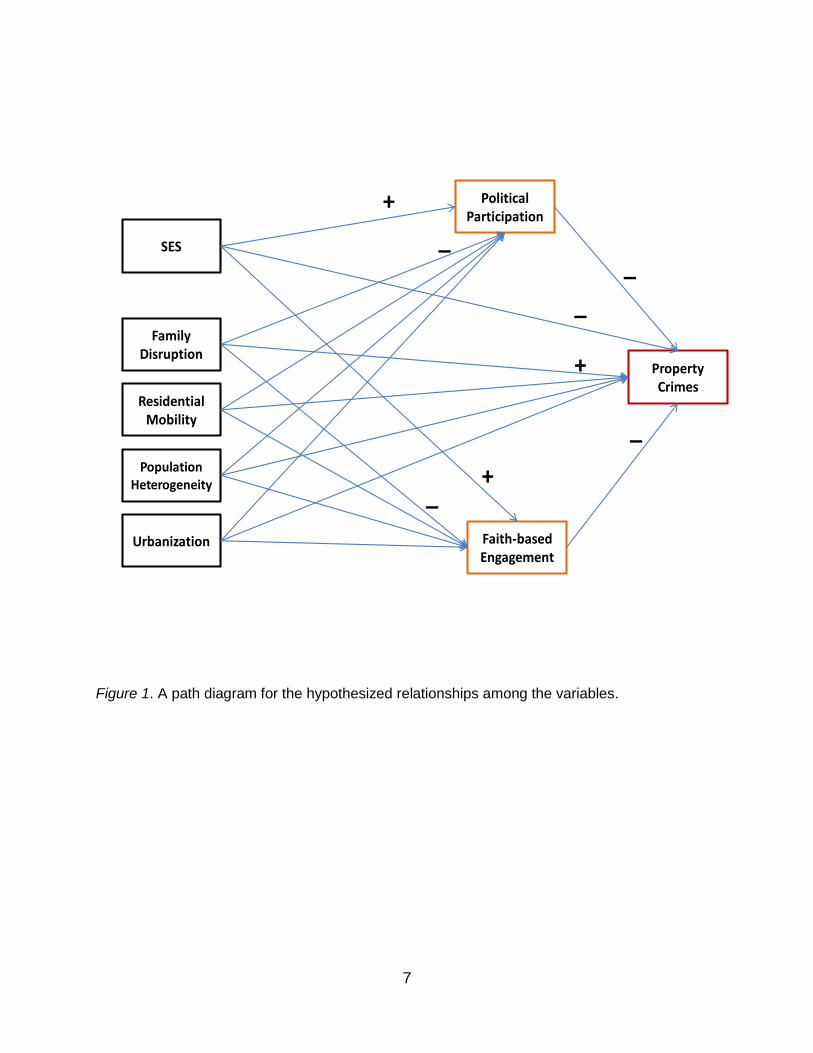
Figure 1 A path diagram for the hypothesized relationships among the variables .......... 7
Figure 2 Mediation model .............................................................................................. 47
Figure 3 Standardized regression coefficients for the determinants of property crime
rate ..................................................................................................................... 61
Figure 4 A conceptual model on the social processes linking social disorganization to
crime & delinquency ........................................................................................... 75
1
CHAPTER I
INTRODUCTION
Statement of Problem
In Turkey, crime rates have been gradually increasing in the provinces since
2004. Primary reason was a sharp rise in the number of criminal incidents, but recent
developments in criminal justice system have also played a role. The improvement of
recording and measurement of the crimes helped show the increase in the number of
crimes (Bahar & Fert, 2008).
Organized crime and terrorism taking place in the provinces get more attention in
the Turkish public agenda than other types of crimes. Property crimes received less
attention but pose a serious threat to public order and the social welfare of society.
Accordingly, property crimes known to police comprised 56% of all public order crimes
between the years 2000 and 2006 in the provinces of Turkey. Violent crimes constituted
the rest of public order crimes (44%) for the same period. It is highly significant that
property crimes gradually increased across these years in the provincial areas. The
number of property crimes has grown four times during the period between 2000 and
2006 (Altay, 2007).
Concern about recent dramatic increases in property crimes must go beyond just
considering it a problem for public agencies; it needs to be taken into consideration in
academia. Academic researchers have paid little attention to property crimes at the
macro level in Turkey. Descriptive studies are the most prominent in delineating this
type of crime in Turkish literature (Aslan, 2008; Bahar & Fert, 2008). Many studies lack
theoretical framework. Available explanatory studies typically focus on the variables of
2
social structure related to crimes without testing any theoretical framework. A few
studies use models from the field of economics to explain crime (Comertler & Kar, 2007;
Pazarlıoğlu & Turgutlu, 2007). Other studies use thematic maps to show the dispersion
of crime across the provinces (Fert, 2007; Günal & Şahinalp, 2009). What is lacking is a
macro study that simultaneously evaluates overall trend of property crimes across the
provinces in Turkey, and tests a theoretical framework to help explain property crimes in
Turkey.
For that reason, this study paid attention to the analysis and understanding of
property crimes in Turkey by adopting an analytical approach based on social
disorganization theory. The most accurate crime rates available for the years 2005,
2006 and 2007 were used. Finally, the impact of social disorganization on the variation
of property crimes across the provinces in Turkey was explored.
Purpose of Study
Primary goal of this study was to analyze the explanatory power of social
disorganization theory for property crimes committed in the provincial centres and
districts of Turkey. A replicated version of Sampson and Grove’s (1989) conceptual
model of social disorganization was tested. A second purpose was to investigate the
relevance of social capital in the explanation of property crimes in Turkey. A third
purpose was to explore the mediation role of social capital between social structure
factors and property crimes. Finally, this study provided an analysis of property crimes
across the provinces in Turkey by using a comprehensive theoretical framework.
3
Significance of Study
The procedures and findings of this study made several contributions to the
literature. Previous studies in Turkey, basically, analyzed property crimes with only one
or a few elements of social disorganization such as unemployment, poverty, migration,
socio-economic status (SES), and urban population density. In contrast, this research
applied social disorganization theory including all essential indicators such as family
disruption, residential mobility, SES, population heterogeneity, and urbanization in the
explanation of property crimes. The explanatory power of social disorganization theory
on property crimes in a different cultural setting was tested for the first time.
To explain the heterogeneity of crime across space and time, many social and
economic factors were used in previous studies (Akcomak & Weel, 2008). However,
only a number of studies analyzed the relationship between levels of social capital and
crime rates (Rosenfeld, Messner & Baumer, 2001). Therefore, varying levels of social
capital was used in an attempt to explain observed variation in property crime rates
across the provinces in Turkey.
In extant body of knowledge, little was known about the impact of social capital
on the relationship between social disorganization and property crimes in Turkey.
However, previous studies in the United States (U.S.) found that collective efficacy (as a
form of social capital) played a mediation role between the community structural
characteristics and crime incidents (Feinberg, Browning & Dietz, 2005; Morenoff,
Sampson & Raudenbush, 2001; Sampson, Morenoff & Earls, 1999; Sampson,
Raudenbush & Earls, 1997). For that reason, social capital framework was inserted into
assessment of the relationship between social disorganization and property crimes in
4
this study. Adapted from Putnam’s social capital framework (2000), social capital was
conceptualized with political participation and faith-based engagement. Furthermore,
these concepts were employed in the full model developed in an attempt to understand
possible determinants of property crimes. Finally, social capital was also used as a
mediator between characteristics of social structure and property crimes.
Research Questions and Hypotheses
In the exploration of the relationship between structural factors of social
disorganization and property crimes, the relationship between social capital and
property crimes, and the mediation effect of social capital on the relationship between
social disorganization variables and property crimes, this research tested the following
hypotheses in line with the proposed theoretical model in Figure 1:
Q.1. To what extent social disorganization variables are related to the variation of
property crimes across the provinces in Turkey?
H1. Socio-economic status (SES) is negatively related to property crimes.
H2. Family disruption is positively related to property crimes.
H3. Residential mobility is positively related to property crimes.
H4. Urbanization is positively related to property crimes.
H5. Population heterogeneity is positively related to property crimes.
Q.2. Can social capital really exert any influence on the incidences of property crimes
across the provinces in Turkey?
H6. Political participation is negatively related to property crimes.
H7. Faith-based engagement is negatively related to property crimes.
5
Q.3. How do the indicators of social disorganization affect the levels of social capital
across the provinces in Turkey?
H8. Socio-economic status (SES) is positively related to political participation.
H9. Family disruption is negatively related to political participation.
H10. Residential mobility is negatively related to political participation.
H11. Urbanization is negatively related to political participation.
H12. Population heterogeneity is negatively related to political participation.
H13. Socio-economic status (SES) is positively related to faith-based engagement.
H14. Family disruption is negatively related to faith-based engagement.
H15. Residential mobility is negatively related to faith-based engagement.
H16. Urbanization is negatively related to faith-based engagement.
H17. Population heterogeneity is negatively related to faith-based engagement.
Q.4. In what way might a province’s social capital mediate the effects of social
disorganization on property crimes across the provinces in Turkey?
H18. Political participation partially mediates the relationship between family
disruption and property crimes.
H19. Political participation partially mediates the relationship between residential
mobility and property crimes.
H20. Political participation partially mediates the relationship between urbanization
and property crimes.
H21. Political participation partially mediates the relationship between SES and
property crimes.
H22. Political participation partially mediates the relationship between population
6
heterogeneity and property crimes.
H23. Faith-based engagement partially mediates the relationship between family
disruption and property crimes.
H24. Faith-based engagement partially mediates the relationship between
residential mobility and property crimes.
H25. Faith-based engagement partially mediates the relationship between
urbanization and property crimes.
H26. Faith-based engagement partially mediates the relationship between SES and
property crimes.
H27. Faith-based engagement partially mediates the relationship between
population heterogeneity and property crimes.
7
SES
Urbanization
FamilyDisruption
ResidentialMobility
PopulationHeterogeneity
Faith-basedEngagement
Political Participation
PropertyCrimes
+
+
_
_
_
_
+
_
Figure 1. A path diagram for the hypothesized relationships among the variables.
8
CHAPTER II
THEORETICAL FRAMEWORK
First Interpretations of Social Disorganization
Social disorganization perspective emerged during 1900s as a systematic way of
studying social problems resulting from failure of social rules essentially coordinating
parts of society and interaction among them. Contributing to the sociology literature with
their original ideas, Charles H. Cooley, W. I. Thomas and Florian Znaniecki, and William
F. Ogburn profoundly influenced the writings of social disorganization theorists. Viewing
society as a complex and dynamic system, these researchers examined the impact of
cultural, demographic and technological changes on equilibrium of social system.
According to their observations, cultural conflict and breakdown of social control in
communities are the root causes for social disorganization (Rubington & Weinberg,
2010, pp. 52-55).
In The Polish Peasant in Europe and America, Thomas and Znaniecki (1927)
discussed the social problems resulting from Polish immigration to the U.S. According to
authors, Polish immigrants have difficulties in adopting new rules and establishing social
control in their unique community (as cited in Rubington & Weinberg, 2010). Moreover,
immigrants severely experience cultural conflict and dissolution of family structures.
Therefore, the immigrant community is infected by criminality and delinquency as well
as alcoholism and mental problems. In the case of Polish immigration, social
disorganization stems from community’s inability to adapt to new conditions and to
control the members of immigrant society (as cited in Rubington & Weinberg, 2010, pp.
53-55). Therefore, considering Polish immigration, Thomas and Znaniecki (1927)
9
defined social disorganization as “the breakdown of the influence of rules on the
individual” (as cited in Rubington & Weinberg, 2010, p. 53).
In a similar manner, in The City, Robert Park (1924) related social
disorganization to social change. For Park, any form of change alters the routine of
social life, thereby breaking up the habits, traditions and customs that are the basis of
social organization. Urbanization, industrialization and immigration especially disrupt
social norms and values on the community as well as decreasing the informal control of
social system. Therefore, all alterations experienced in modern society also leads to
social disorganization (as cited in Rubington & Weinberg, 2010, pp. 57-58).
In The City, Park and Burgess (1924) established a relationship between ecology
and disorganization in the community. According to them, people living in certain areas
of the city have similar socio-demographic characteristics. Moreover, social problems
such as disrupted families, poverty, and criminality are observed only in disorganized
and industrialized parts of the cities. Hence, disorganization is limited to certain areas of
the cities (as cited in Rubington & Weinberg, 2010, p. 61).
Park and Burgess (1924) used the city of Chicago as a social laboratory and
divided the city into concentric zones. According to system of concentric zones
developed by Park and Burgess (1924), the city of Chicago comprises of five concentric
zones that have different characteristics. Zone 1, the centre of the concentric zones, is
occupied by businesses, light industry and entertainment places. Residents of the
central zone are homeless and transient people residing in the hotels. Zone 2 is called
as “zone in transition” in the sense that industrial areas enlarge toward this zone. This
zone is characterized with deteriorated residential buildings, and their residents that are
10
unskilled laborers and foreign immigrants. Buildings in this area are not kept in proper
condition with the expectation that they will be sold for factories. However, land values
are quite high as the area is very close to businesses and factories in Zone 1. Zone 2
covers the most disorganized areas labeled with poverty, family disruption, unstable and
heterogeneous population. Zone 3 is mainly occupied by working class people, which is
more stable than Zone 1 and Zone 2. This zone is a bridge between the slum and
residential areas. Zone 4 and Zone 5 are the residential areas for upper-middle classes.
All accommodations in these zones are described as stable and long time residential
areas. Therefore, social disorganization is rarely observed in these areas (as cited in
Rubington & Weinberg, 2010, p. 61).
In Human Communities, Park (1952) also stated that territorial zones are labeled
by the social conditions of their residents in the metropolitan community. Yet, the
population is not stable in concentric zones (Park, 1952, pp. 144-155). During the
course of time, especially the immigrants move toward the suburbs and more stable
areas (Park, 1952, pp. 221-225). Population flows move from inner zones toward outer
zones in the city. The new population flows force previous residents to leave their
places for the closest outer zone (as cited in Rubington & Weinberg, 2010, p.63). In
that, the previous immigrants escape from criminality, poor public schools, and
deteriorated housing. Therefore, these suburban neighborhoods in outer zones are also
known as crime-free areas (as cited in Rubington & Weinberg, 2010, p. 79).
11
Theorization and Emergence of the Social Disorganization Theory
Clifford R. Shaw and Henry D. McKay have contributed much to the development
of social disorganization theory (Rubington & Weinberg, 2010). In Juvenile Delinquency
and Urban Areas (1942), Shaw and McKay focused on juvenile delinquency in certain
areas of Chicago that have deteriorated socio-economic and cultural characteristics.
Observing the city of Chicago for three different periods between 1900 and 1933, they
discover the causes of increasing crime rates in inner city (p. 102). Accordingly, higher
rates of delinquency in inner parts of the city are related with the social life in those
areas. Moreover, delinquency and crimes are observed in some neighborhoods with
certain structural characteristics. These structural characteristics are residential
instability, population heterogeneity and low economic status. In that sense, the zones
with these characteristics are deprived of social organization and these zones suffer
from delinquency (p. 61).
Furthermore, Shaw and McKay (1942) analyzed structural characteristics of the
communities and delinquent acts in relation to low socioeconomic status of residents,
physical environment in neighborhoods and population characteristics. Shaw and
McKay (1942) revealed that delinquency cases are observed in areas characterized
with scarce population, poor families, foreign-born residents, high residential mobility,
lower rental costs, low economic status, and migrants (pp. 51-52). Their findings also
show that higher rates of delinquency are persistent in disorganized areas of the city
regardless of population mobility. Additionally, it is notable that delinquency and
criminality are consistent across generations residing in deteriorated areas of the city.
The causes of crime are significantly related to the changes in the structural
12
characteristics of the community and the growth of the city.
Based on the findings of their study, Shaw and McKay (1942) formulated a
theory based on three elements of structural disorganization in the community, which
are low economic status, residential mobility and ethnic heterogeneity. Low economic
status of the families and the community at large prevent formation of local agencies
and institutions. Due to the deteriorated conditions of the inner concentric zones,
majority of the residents migrate to the outer affluent zones at the first possible
opportunity (pp. 137-139). Mobility creates institutional instability, which is a hindrance
to the discovery of common interests. Therefore, the migrant communities could not
unify around common values and interests due to lack of stable community institutions.
Similarly, ethnic heterogeneity leads to isolation of migrant residents from each other,
as there are no common values and norms providing social cohesion and solidarity
among them. As a result, the poor migrant communities lack all socio-economic
resources to share a common goal, and hence the communities fail to establish a local
organization to pursue their own interests and values (pp. 177-180). Without local
organizations, the communities also loose the chance of connecting to other
communities and cannot control themselves to prevent delinquent acts of their
residents.
Finally, Shaw and McKay (1942) focused on how deteriorated neighborhood
conditions and weak community organization facilitate higher levels of delinquency in
the community, and underlined that due to lack of effective informal control mechanisms
and functional local organizations, structural disorganization emerges in migrant
communities of Chicago. Shaw and McKay (1942) proved that urban ecology is
13
substantial determinant of social events that lead to crime and delinquency in the urban
communities.
Reformulation and New Directions in the Social Disorganization Theory
Sampson and Groves (1989) argued that ecological studies analyzing the
relationship between racial structure income, mobility and crime are inadequate in
understanding the concept of social disorganization. Therefore, they considered
“exogenous structural factors and mediating dimensions of social disorganization” (p.
777) together in explanation of the variation of crime rates in a community. In this vein,
in addition to residential mobility, ethnic heterogeneity, low economic status,
urbanization and family disruption are also significant structural characteristics that may
decrease the level of informal social control and weaken social organization in local
communities.
Moreover, for Sampson and Groves (1989), loose local friendship networks,
lower levels of organizational participation and uncontrolled teenage peer groups in
streets are also mediating factors between structural indicators of social disorganization
and crime in a community. These dimensions of disorganization also indicate the
absence of social control. Furthermore, communities with lower levels of social control
are more exposed to higher levels of crime and delinquency. Therefore, Sampson and
Groves (1989) stressed the importance of informal social control, which is sustained by
the internal dynamics of a community and define social disorganization as the failure of
a community in sustaining common values, and in maintaining effective social controls
in the community. In short, their study reveals that social disorganization theory is still
applicable and relevant for explaining crime and delinquency in relation to social
14
structure of a community.
Kubrin and Weitzer (2003) evaluated the development and current situation of
social disorganization theory, and proposed that social disorganization theory should
also include culture and formal social control as well as characteristics of urban political
economy (pp. 374-375). For them, neighborhoods are not as homogenized as depicted
in previous literature. In the same neighborhood, residents significantly differ from each
other either adapting conventional norms or embracing local cultural codes. In that
sense, structural factors along with subcultural and normative responses determine the
propensity to delinquency and crime. Hence, Kubrin and Weitzer (2003) proposed that
cultural factors might be taken into account in social disorganization theory (p. 380).
Moreover, although social control is largely discussed in many studies, formal
social control is a missing part of this theory. For Kubrin and Weitzer, formal control is
functional in both directly alleviating crime and disorder, and influencing informal control
capacity of the residents in a neighborhood (p. 382). Without formal control
mechanisms, when community action is needed, intervention of community members
will not take place due to reluctance or fear of victimization. Formal control through
policing is also of great importance in terms of maintaining social control and confidence
in law and state as well as deterring future criminals. Therefore, Kubrin and Weitzer
suggested that theoretical importance of formal social controls be considered in further
studies. In that, they discovered that no study tested the relationship between formal
and informal social control (pp. 383-384).
Depending on recent studies, Kubrin and Weitzer (2003) finally claimed that
urban reorganization indirectly affects neighborhood crimes. Deindustrialization of cities,
15
emergence of jobless people in cities, and generally economic deprivation, lead to
growth of illegal markets and criminality in neighborhoods. In that sense, Kubrin and
Weitzer suggested that urban political and economic forces be given enough attention
in order to understand the macro-micro level effects on neighborhoods (p. 387).
Review of the Social Disorganization Theory
Thomas and Znaniecki (1918) first introduced the concept of social
disorganization to the sociology literature (Rubington & Weinberg, 2010). Later, the
leading figure of Chicago school, Robert E. Park (1924) added that social
disorganization is resulted from breakdown of social control due to social change. In
systemic concentric zone model, Park and Burgess (1924) proposed that social
disorganization is final product of industrialization, migration flows, neighborhood
deterioration and lack of social control (Rubington & Weinberg, 2010).
Taking this one-step further, Shaw and McKay (1942) theorized based on the
findings of their long-term study that structural factors such as ethnic heterogeneity, low
economic status and residential stability have certain effects on social organization of
local communities. The scholars relate delinquency and crime to the developments in
the ecology of city. Finally, Sampson and Groves (1989) tested Shaw and McKay’s
social disorganization theory including new structural factors, family disruption and
urbanization. Their new model use community characteristics such as unsupervised
youth groups, lower levels of local friendships and local organizational participation as
mediating factors between structural elements of social disorganization and delinquency
and crime. As a result, Sampson and Groves (1989) found enough evidence for social
disorganization to become a viable theory.
16
Social Capital and Its Various Interpretations
Many social scientists have widely described and discussed social capital in
extant literature. However, it is widely agreed on that this concept was popularized by
Bourdieu in 1985 (Portes, 1998) and Coleman in 1988 (Portes, 1998; Berger & Murphy,
2000) and Putnam in 1993 (Portes, 1998).
Bourdieu explained social capital as aggregates of resources related to
permanent or transitory social networks (Portes, 1998). For Bourdieu, social capital is
instrumental for individuals in the sense that they participate in social networks for
building the network as well as pursuing their interest in return to their endeavors in the
creation of the network. Bourdieu’s social capital has two dimensions: First, individuals
access resources through their relationships, and second, the quality of resources.
Therefore, utility provided by social capital to the members of social network is also
basis of social network (Portes, 1998).
In Social Economics, Becker and Murphy (2000) focused on the function of social
capital rather than its various meanings in literature, and they stated that social capital
shapes individual behaviors positively or negatively in each layer of social structure.
Moreover, individuals are also endowed with the selection of social capital. In the
selection of social capital, utility maximization is determinant of individual choices in a
specific society. In line with this, selection of neighborhood, school, occupation,
marriage and friends are products of rational decision process. For them, selection of
living in a wealthier neighborhood is as rational as the selection of establishing
associations with criminals (p. 23). In the selection, individuals are greatly influenced by
social environment in which they lived. Including family, in every social cluster,

17
individuals are under the influence of spillover effect of social capital. Furthermore,
Berger and Murphy (2000) also underlined the importance of informal social control
maintained by social capital. As a result, better families, neighborhood and occupation
provide better opportunities to its members. Contrarily, neighborhoods with lower social
capital will produce unpleasant living environment (p. 48). In fact, each selection
process contributes to different types of social capital and determines the future choices
of next generations as well.
Similar to Becker and Murphy (2000), Coleman defined social capital by its
function (1988, p. 98; Portes, 1998). Adopting from the field of economics, Coleman
used principle of rational action in the analysis of social systems, mainly the analysis of
social capital and its usefulness (1998, p. 97). For Coleman, social capital depicts one
aspect of social system and enables individual actions within that social system. Unlike
other forms of capital such as economic and human capital mentioned by Bourdieu
(1985) and Becker (1962), social capital exists in the network of relations between
actors and organizations (1998, p. 98). It is not lodged in persons or in physical entities.
While human capital is created by investing in persons through enhancements of their
skills and abilities (Becker, 1962, p. 9), social capital emerges through building of
relations among persons, which promotes the ability to act for the utility of all individuals
(Coleman, 1988, p. 100). As an example, social trust and norms are different forms of
social capital facilitating certain actions of individuals as well as constraining deviant
actions in the community (pp. 102-105). Besides, as different sources of social capital,
social networks and voluntary organizations are functional in increasing the quality of
life by providing a wide range of utilities for their members (p. 108).
18
As noted in discussion above, Bourdieu (1985), Becker (1962, 2000) and
Coleman (1988) concluded that social capital exists in the relationships among
individuals, organizations as well as between individuals and organizations. The
function of social capital within these networks is to create a utility for participating
actors. In contrast to this approach, Putnam (1993) defined social capital as social
networks, social trust, and social norms as general features of social organizations. He
also shared that social capital facilitates action and cooperation for mutual benefits of all
related parties. For him, social capital enhances the investment into both physical and
human capital (1993, pp. 35-36).
Moreover, in Bowling Alone, Putnam (2000) used social capital for all types of
community efforts, and proposed multidimensional nature of social capital in the
explanation of social problems. According to Putnam, two main types of social capital
are of great importance: trust and social participation. In that, these types of social
capital function as a binding mechanism among social order mechanisms in the
community. Social participation is also available in different forms: political (party
membership, voting, participation to rallies and riots), civic (associational membership,
clubs), religious (church attendance or membership) and other informal social ties.
Moreover, Putnam (2000) stressed that decline in social capital would result in the
emergence of crime or any increase in the crime rates. He directly relates crimes rates
to inadequacy of social capital in the society. Putnam (2000) concluded that social
networks, as the basis of social capital, strengthen the communal ties, and sustains
social order (pp. 308-318).
In the same manner, Sampson, Raudenbush and Earls (1997) introduced the
19
notion of collective efficacy. According to Sampson et al. (1997), the term ‘collective
efficacy’ refers to cohesion of the community for the benefit of all community (similar to
the idea proposed by Bourdieu, Berger & Coleman). The researchers stress the
importance of informal social control, which completely depends on the abilities of
community. These abilities are interpreted as collective efficacy, which may be deemed
as a form of social capital. In that sense, this type of social capital functions as an
informal social control mechanism that enhance the community’s ability to achieve
desired goals and reach common values. More clearly, Sampson and Raudenbush
(1999) explained that collective efficacy is the informal ties among residents in a
neighborhood that enable residents to respond to delinquency and crime with a
collective conscious (p. 603). Hence, attachment to the community and collective action
are prerequisites of collective efficacy.
Relevance of Theoretical Structure
As a macro level theory, social disorganization has become a major tool in the
explanation of crimes in neighborhoods, communities, cities and nations. It draws
attention to deterioration of social structure, and breakdown of social ties and group
solidarity that may lead to deviance and criminal events. In that, structural elements in a
society are closely linked to social organization as well as emergence of deviant acts
and crimes (Howard, Newman & Pridemore, 2000).
Similarly, Sampson and Groves (1989) claimed that this theoretical framework
combines external (ethnic heterogeneity, low SES, family disruption, residential mobility
and urbanization) and internal structural factors (local networks, organizational
participation and teenage groups) leading a community to both social organization and
20
disorganization. Therefore, social disorganization framework is one of the most
appropriate approaches that enable the researchers to use structural factors, in other
words, macro level facts, in the explanation of spatial patterns of crime.
With its more structured framework, social disorganization theory appears to be
an applicable theory for explanation of urban level facts. Abrupt changes in social
structure such as political and economic shifts may have certain impact on social
integration and cohesion in the community as well as in a certain geographical area.
Therefore, this theory is also applicable higher levels of unit of analysis such as
countrywide or cross-national (Howard, Newman & Pridemore, 2000). In a supportive
manner, in their analysis of macro level theories of crime, Pratt and Cullen (2005) found
that among other macro-level theories (social support/altruism, rational
choice/deterrence, routine activity, anomie/strain, subcultural) social disorganization
theory has received a strong empirical support across the quantitative criminological
research conducted between 1960 and 1999.
Moreover, social disorganization indicators in theoretical model are easily
measurable and therefore, production of a measurement model is quite simple.
Availability of data on social disorganization concepts is also an important element that
makes this theoretical framework viable for even cross-national studies (Howard,
Newman & Pridemore, 2000). Rationale for this study is also based on availability of
data on social disorganization for the researcher.
Finally, many contemporary researchers have adopted this approach in the
examination of correlates of urban crimes (Bursik, 1988; Sampson & Groves, 1989;
Veysey & Messner, 1999). In that sense, social disorganization framework has become
21
functional in the explanation of ecological facts. Although validity of macro-level theories
is still questioned by some researchers (Pratt & Cullen, 2005), social disorganization
theory appears to be the most applicable approach for many researchers to analyze
urban ecology and urban crimes (Lowenkamp, Cullen & Pratt, 2003; Sampson &
Groves, 1989; Veysey & Messner, 1999).
22
CHAPTER III
LITERATURE REVIEW
Social Disorganization
Based on available literature, it is quite apparent that social disorganization
theory has evolved and developed during the last century. Many researchers have
contributed to the formation of this macro theory (Rubington & Weinberg, 2010). Recent
efforts also included intervening dimensions into social disorganization framework
(Barnett & Mencken, 2002; Lowenkamp, Cullen & Pratt, 2003; Osgood & Chambers,
2000; Sampson & Groves, 1989; Sun, Triplet & Gainey, 2004; Veysey & Messner,
1999). With its more structured framework, social disorganization theory appears to be
an applicable theory for future studies focusing on the explanation of crimes.
Sampson and Groves (1989) reformulated and directly tested Shaw and McKay’s
theory of social disorganization for a different cultural setting by using British Crime
Survey (BCS) of 1982. Their findings showed that all exogenous structural
characteristics have significant effects on the supervision of peer groups, while only two
of them, residential stability and urbanization, significantly predict local friendship
networks. Additionally, socioeconomic status is the only predictor of organizational
participation. In this regard, Sampson and Groves (1989) found a relatively strong
support for the relationship between exogenous structural characteristics and
intervening dimensions of social disorganization.
Similarly, the scholars discovered that apart from residential stability, all other
structural characteristics have a positive significant effect on burglary. Auto theft is only
predicted by socioeconomic status, residential stability and family disruption, and
23
vandalism is predicted by residential stability and socioeconomic status. As to criminal
offending, family disruption is the strongest predictor of property offending, while other
structural characteristics do not exert any significant direct effect on offending rates.
Again, family disruption is consistently a significant predictor of both personal violence
and total victimization. Similarly, urbanization has a significant effect on both robbery
and total victimization. Additionally, Sampson and Groves (1989) also analyzed indirect
and total effects of exogenous structural characteristics on total victimization rates
through intervening dimensions of social disorganization. Contrary to the increasing
total effect of other structural variables, they found that residential mobility alone does
not exert any indirect effect on total victimization. In general, their findings provided
enough support for social disorganization theory in the sense that structural
characteristics of the community have certain effects on the variation of criminal
victimization and offending rates across British neighborhoods. Their findings also
proved that the effects of structural characteristics of the communities on crime and
delinquency are significantly intervened by different dimensions of social
disorganization.
Veysey and Messner (1999) used British Crime Survey (1982) to retest the
theoretical model proposed by Sampson and Groves (1989) with a different statistical
method and software (LISREL). Analyzing total victimization in British communities, they
found partial support for the mediating effects of three dimensions of social
disorganization, which are unsupervised peer groups, local participation and friendship
networks. Among these dimensions, unsupervised peer groups has the strongest direct
effect on total victimization of crime, while the other two dimensions have moderate
24
direct effects on it. As to the structural characteristics of social disorganization, family
disruption and urbanization have stronger direct effect on total victimization of crime.
Surprisingly, SES, ethnic heterogeneity and residential stability do not exert any
significant effect on crime rates. These findings are contradictory to that of Sampson
and Groves’ study. Therefore, Veysey and Messner (1999) criticized the statement that
the findings of Sampson and Groves provided a strong support for the social
disorganization theory. Based on their findings, Veysey and Messner (1999) contended
that theoretical models analyzing crime with macro level structural variables could be
further specified, as the findings in their study were not supported by conventional
theory of social disorganization.
Osgood and Chambers (2000) took traditional study of social disorganization one
step further by analyzing arrest rates of violence among juveniles in rural areas of four
states (Florida, Georgia, Nebraska, South Carolina) in the U.S. Their findings are
consistent with the previous literature in the sense that three exogenous characteristic
of social disorganization, residential instability, ethnic heterogeneity and family
disruption are significantly related to different forms of juvenile violence. Similarly, size
of population is a significant predictor of arrest rates, that is, arrest rates decrease in
areas with a small juvenile population. However, poverty rate, unemployment and
proximity to urban areas do not predict arrest rates as expected. With this study,
Osgood and Chambers (2000) proved that social disorganization theory is applicable
and generalizable to rural communities as well as the communities in urban areas.
Similar to the study of Osgood and Chambers (2000) on non-metropolitan areas,
Barnett and Mencken (2002) compared the effects of various social disorganization
25
factors on both property and violent crimes in non-metropolitan areas by using Uniform
Crime Reports (1998-1991). Accordingly, SES measures exert effects on both crime
types in different directions. Based on the analysis of interaction effects in their model,
SES measures positively predict property crimes for non-metropolitan counties losing
population, while negatively for the counties with a growing population. Contrary to this,
SES is positively related to violent crimes in non-metropolitan areas where population
growth is high. For Barnett and Mencken (2002), interaction of lower levels of SES and
population loss negatively effects social organization in non-metropolitan counties, while
decreasing social support for the poor and producing different social outcomes including
crime. Barnett and Mencken (2002) finalized that their findings based on the interaction
effects of SES measures and population loss may not be consistent with previous
literature, therefore suggested that further studies use household and individual surveys
to measure the indicators of social disorganization and crime.
Lowenkamp, Cullen and Pratt (2003) replicated Sampson and Groves’ study by
using data from British Crime Survey (1994), and tested the validity of their theoretical
model and check the consistency of the results. Majority of their findings are consistent
with Sampson and Groves’ findings for the direct effects of structural characteristics
(SES, residential stability, ethnic heterogeneity, family disruption and urbanization) on
mediating dimension of social disorganization (local friendship networks, organizational
participation and unsupervised peer groups). However, ethnic heterogeneity is
negatively related to local friendship networks, and residential stability is positively
related to organizational participation. Similarly, SES and urbanization has no significant
direct effect on organizational participation, while residential stability does not exert any
26
significant direct effect on unsupervised peer groups. Consequently, these findings are
not consistent with the original model proposed by Sampson and Groves (1989). As for
the estimates of total victimization rate, Lowenkamp, Cullen and Pratt (2003) obtained
that SES and residential stability have non-significant and inverse effects on total
victimization rate as oppose to the findings of Sampson and Groves (1989). These
results are also not consistent with the tenets of the original social disorganization
theory. In general, the study of Lowenkamp, Cullen and Pratt (2003) provided support
for both viability of social disorganization theory and the results from Sampson and
Groves’ (1989) study of British Crime Survey (1982).
Using data from 36 urban neighborhoods in the U.S, Sun, Triplet and Gainey
(2004) examined assault and robbery rates in urban neighborhoods with the social
disorganization model proposed by Sampson and Groves (1989). They found that all
structural indicators of social disorganization are significantly related to robbery, while
only two of them, residential mobility and racial heterogeneity, significantly predict
assault. The researchers enlarged the theoretical path model formed by Sampson and
Groves(1989) including indirect effects of residential mobility, local social ties and
organizational participation on crime rates through unsupervised youths and indirect
effect of family disruption on crime rates through organizational participation. Their
mediation analysis yielded that apart from the effects of SES, intervening dimensions of
social disorganization (local social ties, unsupervised youths, organizational
participation) mediate the effects of other social structure characteristics (residential
mobility, racial heterogeneity, family disruption) on both assault and robbery rates as
expected. Similarly, unsupervised youths do not successfully mediate the effects of
27
organizational participation on both assault and robbery. However, in line with
theoretical expectations, the effect of local social ties on both crime types is mediated
by unsupervised youths. The results of their analysis partially support Sampson and
Groves’ study in the sense that intervening dimensions of social disorganization
successfully mediate the effects of social structure on assault, while their intervention
effect is weak on the relationship between social structure and robbery crimes.
Previous studies mentioned in this study analyze variation of crime rates across
different units (e.g. communities, counties) in respect to structural characteristics of
communities in both urban and rural areas. Their findings provide a relative support to
traditional social disorganization approach. In this regard, this study is also designed to
explore the relationship between social disorganization and crime across the provinces
in Turkey.
Social Capital
Social capital has received considerable attention in many social studies. It has
become a key concept in understanding of different abilities of communities as well as
in finding solutions for various social problems in different communities. Social capital is
also a significant indicator of how well a community is socially organized. Lower levels
of social capital may also be related to disorganization in a community. Therefore,
current studies have used different level of measurements and indicators of social
capital in the analysis of social problems in communities (Rosenfeld, Messner &
Baumer, 2001).
In Bowling Alone, Putnam (2000) conceptualized social capital with social trust,
informal sociability, volunteerism, political, and civic engagement. In this work, Putnam
28
(2000) related rising level of crimes in the United States to declining social capital in
American communities. In a similar vein, Rosenfeld, Messner and Baumer (2001) used
electoral participation and organizational membership rates in the measurement of
social trust, and look for the relationship between social trust and homicide in the US.
Considering social disorganization, anomie and strain theories together, Rosenfeld,
Messner and Baumer (2001) contended that social trust and civic engagement
decrease crime rates by strengthening formal and informal social control. In line with
this, the researchers discovered that social capital is negatively related to homicide
rates.
Lederman, Loayza and Menéndez (2002) used common indicators of social
capital (social trust and voluntary participation) in order to examine effect of social
capital on violent crimes in 39 countries. The researchers found that higher levels of
social trust among community members are related to lower levels of violent crimes.
Similarly, Akcomak and Weel (2008) analyzed the heterogeneity of crimes across
municipalities in Netherlands by employing a number of social capital indicators (such
as voting rates, social trust, blood donations, and charity). They found that
municipalities with higher levels of social capital experience less crime in Netherlands.
In the same way, Galea, Karpati and Kennedy (2002) used cross-sectional data in order
to analyze the relationship between homicide rates and social capital in the US. Among
other social capital indicators, perceived trust has a strong negative effect on homicide
rates.
29
Adopting from Putnam’s study (2000), Buonanno, Pasini and Vanin (2006)
measured social capital in Italy with political participation (referenda turnout),
recreational associations, voluntary associations and blood donation. Especially, they
considered referenda turnout and blood donations as safe proxies of social capital. The
study showed that social capital is not related to robberies; however, it is significantly
and positively related to thefts, but negatively related to car thefts.
In another study, Messner, Rosenfeld and Baumer (2004) used social trust and
social activism as multiple indicators of social capital, and modeled the relationship
between social capital and homicide rates in 40 geographical areas of the US. The
researchers found that social capital measures have significant impact on homicide
rates. It is also observed that social trust has a negative impact on homicide rates
(Messner, Rosenfeld & Baumer, 2004). In a similar manner, Chamlin and Cochran
(1997) operationalized social altruism with the number of charity donations, which is
thought to be an indicator of social capital, and discovered that social altruism
significantly and negatively predicts both violent and property crimes in U.S. cities
(Chamlin & Cochran, 1997).
To sum up, social trust, social networks and informal social control are closely
related to social organization in a community. Availability of these elements in a society
strengthens social organization, while decreasing frequency of crime incidents
(Rosenfeld, Messner & Baumer, 2001; Sampson & Raudenbush, 1999). However,
depleted stocks of social capital will result in higher rates of crimes (Rosenfeld, Messner
and Baumer, 2001). As articulated by Bursik (1999) and mentioned by Sampson (2006),
social ties, social network and more comprehensively social capital hold a significant
30
role, and therefore social capital is a part of social disorganization theory. In that sense,
above-mentioned conceptual framework provided this study a rationale for using social
capital as a part of social disorganization model in the explanation of property crimes in
Turkey.
31
CHAPTER IV
DATA AND METHODOLOGY
Data and Data Collection
This study investigated the impact of social disorganization and social capital on
property crimes across the provinces in Turkey. This study therefore used provinces as
the unit of analysis. Provinces are the highest local administrative entities established
across all geographical areas of Turkey. The number of the provinces in Turkey is 81,
and the number of cases is the same in this study. According to Turkish administrative
structure, Turkey is divided into 81 provinces managed by the governors assigned by
the central government in Ankara, the capital province of Turkey. Each province
includes a province centre, districts, towns and villages.
This study employed official data recorded by Turkish Police (TNP) and two
prominent public agencies (Turkish Statistical Institute and State Planning
Organization). Accordingly, the number of property crimes is provided by TNP. TNP
records the crimes in its jurisdiction (centers of the provinces and majority of districts).
These records exclude the number of crimes committed in the areas within the
jurisdiction of Gendarmerie, which is the second law enforcement force with a militarist
structure. Gendarmerie mainly operates in rural areas which are rarely populated places
(mostly in villages) as well as in some districts and towns determined by the
governorship of the province and the Ministry of Interior.
Majority of data employed in this study are retrieved from the website of the
Turkish Statistical Institute (TurkStat, 2010), which is most available official data source.
Data are also accessible online and downloadable free of charge. In this regard,
32
majority of the variables (divorce rates, the number of people migrating in and out of the
provinces, GNP per capita at the provincial level, provincial population with a graduate
degree, provincial population with managerial and professional position, the number of
foreign-born residents in the provinces, voting rates for the provinces, the number of
young males aged between 15-29 in the provinces) were downloaded from the website
of Turkish Statistical Institute. Urbanization rate and socio-economic development index
score (SEDI) were obtained from the reports of State Planning Organization.
Exceptionally, the number of mosques (faith-based engagement) was requested from
the Presidency of Religious Affairs.
Finally, property crimes data were limited with police jurisdiction, which covers
province centers and districts, while all independent variables refer to the whole
province including province centre, districts, towns and villages. This was also a
limitation for this study, which was discussed in Chapter VI.
Definition and Measurement of the Variables
Property Crime
Property crime is the dependent variable of the study. Property crimes fall under
the main heading of public order crimes in policing literature in Turkey. Turkish Penal
Code defines property crimes as the crimes committed against individual and public
properties. In Turkish context, property crimes specifically refer to arson, larceny-theft,
burglary, auto theft, theft from auto, pick pocketing, snatching, robbery, swindling and
other unclassified similar offences. In this study, property crime is measured with the
total number of offences falling under this group. Therefore, this variable has face
validity, as it covers every aspect of this type of crime in Turkey. Property crimes are
33
recorded by Turkish Police according to related articles of Turkish Penal Code (2004).
Categorization of property crimes in Turkey is more comprehensive than uniform crime
reports recorded by Federal Bureau of Investigation (FBI) in the U.S. While FBI limits
property crimes with arson, larceny-theft, burglary and motor vehicle theft, in Turkey,
category of property crimes covers more crime types as previously stated.
In the ecological studies on crime, it is quite common that crime measures are
averaged in order to minimize fluctuations over the years (Messner & Sampson, 1991;
Beyerlein & Hipp, 2005). Therefore, the average number of crimes for 2005, 2006 and
2007 is used and rates for property crimes per 1000 inhabitants at the province level is
calculated. As the population of several provinces in Turkey is about 80.000, crime rates
are calculated per 1000 inhabitants. The formula for property crime rates is as follows:
Property Crime Rate= (Average Number of Crimes for 2005-2007/Provincial Population
2000)/1000. This formula is adopted from the Bureau of Justice Statistics, the U.S.
Department of Justice.
Social Disorganization Variables
Based on Sampson and Groves’ (1989 ) expanded model of social
disorganization, this study uses following five variables, socio-economic status (SES),
family disruption, population heterogeneity, urbanization and residential mobility as the
structural factors of social disorganization in the provinces of Turkey.
Socio-economic status (SES) has become an indispensable element of social
disorganization framework. Shaw and McKay (1942) characterized poor neighborhoods
with lack of wealth, inadequate resources, and social disorganization. These
34
communities are also not able to maintain formal and informal control, thus this
facilitates delinquency in the neighborhood (as cited in Sampson & Groves, 1989).
Therefore, Sampson and Groves (1989) employed SES as an exogenous element of
social disorganization in their theoretical approach. Similar to their way of measurement,
this study constructs a scale of three social class indicators: education, occupational
status and income.
In this vein, SES variable in this study has face validity as it covers three main
indicators in line with previous literature. Accordingly, education is the percentage of
population with a college and graduate degree. Occupation is the percentage of
population with managerial and professional positions. Previous studies have used
median family income in the construction of SES index at community/neighborhood
level (Bellair, 1997; Bernburg & Thorlindsson, 2007; Sampson & Groves, 1989).
However, at the aggregate level, gross national product per capita has been also used
as a proxy measure of income and wealth in previous literature (Buonanno, Pasini &
Vanin 2006; LaFree & Tseloni, 2006; Shah, 2010). In that sense, this study uses gross
national product per capita (GNP in US dollars) in the provinces as an available and
valid indicator at the provincial level.
SES index is formed based on these indicators obtained from Census 2000. SES
scale is obtained by summing z-scores of these three indicators (education,
occupational status, and gross national product per capita in the provinces). These
indicators are measured in different units (education and occupational status in
percentage, and gross national product per capita in the provinces in US dollar units).
Summing raw scores of these indicators leads to the domination of the value of gross
35
national product per capita in the provinces in total score of SES index. Therefore, these
variables are converted into z-scores in order to give these indicators equal weight in
SES index. By using z-scores of these indicators, a unit weighted composite measure of
SES is formed (Warner, 2008). SES index is calculated by the researcher and the
formula for SES index is as follows: SES index = Z education + Z occupational status + Z GNP.
This formula is adopted from Sampson and Groves (1989, p.784).
Reliability of this scale is also tested with cronbach alpha reliability. Reliability for
the scale constructed by z-scores of the items is .85 (cronbach α for standardized
items=.85). Nunnaly (1978) accepts .70 as a cutoff point for reliable scales (as cited in
Santos, 1999). Therefore, it can be assumed that SES index has adequate reliability.
Validity of SES index is also analyzed by factor analysis (Sun, Triplett& Gainey, 2004).
The principal component analysis was resulted with only one component (components
rotated by Varimax) with an eigenvalue value greater than 1. SES indicators explained
77 % of the total variance. Correlations between all indicators were above .70. Findings
of factor analysis showed that SES index has also a content validity.
Family disruption is an exogenous element in social disorganization framework. It
is one of the prominent factors leading to decrease in the level of informal social control
in the community. Bloom (1966) found that participation to community organizations and
educational and recreational activities is low in localities with disrupted families (as cited
in Sampson, 1987). Sampson (1987) further discussed that family disruption may
weaken social ties as well as social organizations which link the members each other
and nourish social norms and values. Additionally, Messner and Rosenfeld (1994) also
36
stated that disrupted families are less effective in imposing common values and norms
to their members, and therefore, family disruption decreases informal social control in
community. Similarly, family disruption facilitates social disorganization decreasing
levels of collective efficacy in the community (Sampson, Morenoff & Earls, 1999). In
that, disrupted families are less active in intervening to the problems of the
neighborhood alongside neighborhood watch, questioning strangers and supervision of
the youngsters (Sampson, 1987). Therefore, family disruption has direct effects on
disorganization in the community as well as on delinquent acts and emergence of crime
(Sampson 1987; Sampson & Groves, 1989).
In many studies, family disruption has been measured with divorce rates
(Andresen, 2009; Baller, Anselin, Messner, Deane & Hawkins, 2001; Chamlin &
Cochran, 1995; Maume & Lee, 2003; Ochsen, 2010; Schoepfer & Piquero, 2006).
Similarly, in this study, family disruption is measured with divorce rates at the province
level. It is the number of divorced per a thousand people in the same calendar year.
This study uses divorce rates calculated by TurkStat, and takes an average of divorce
rates for the years 2001, 2002 and 2003 for a strong measurement of family disruption
in Turkey. Divorce rates are calculated by TurkStat and the formula used by TurkStat is
as follows: Divorce rate = (Number of divorces / Mid-year Provincial Population) x 1000.
Population heterogeneity is thought to be a negative element thwarting the
community to organize itself (Shaw and McKay, 1942). Due to fear and lack of trust
among racial or ethnic groups in the community, social ties and network remains to be
undeveloped. Moreover, diversity of norms and cultural traits also impede social
37
integration. Therefore, social organization cannot be achievable or becomes ineffective.
As an outcome of this social process, delinquency is inevitable (as cited in Sampson &
Groves, 1989; Wong, 2007). Some studies have taken into account the percentage of
ethnic groups in population as an indicator of heterogeneity (Cochran & Chamblin,
1994; Sampson & Groves, 1989). Some others have used the percentage of foreign-
born residents in a country (Karakus, 2008; Ochsen, 2010; Sampson, Raudenbush &
Earls, 1997).
Scientific data about ethnic groups (as numbers or as percentages) in Turkey is
not available for the researchers. Even though knowledge about these groups is used in
literature, actual numbers of ethnic groups and the number of members in each group
are not attainable for academic purposes. Therefore, this study adopts the term
‘population heterogeneity’ rather than ‘ethnic heterogeneity’. As a proxy indicator of
heterogeneity in Turkey, population heterogeneity is used, and measured with the
percentage of foreign-born residents in each province in 2000 (Karakus, 2008).
Population heterogeneity variable is calculated by the researcher based on previous
literature (Karakus, 2008; Ochsen, 2010; Sampson, Raudenbush & Earls, 1997) and the
formula of population heterogeneity is as follows: Population Heterogeneity = (Number
of Foreign-born Residents/ Province Population 2000) x 100.
Residential mobility has a strong influence on social organization (Bursik &
Grasmick, 1993). Residential mobility destabilizes a community decreasing the
probability of social cohesion and development of community values. It increases
anonymity among residents, thus leading to erosion of social control in the community.
38
Sampson, Raudenbush and Earls (1997) underlined that rapid population changes is
another negative factor for social organization. In that, high levels of residential mobility
‘‘fosters institutional disruption and weakened social control over collective life’’ (p.919).
Empirical research has found direct effect of residential mobility on different types of
crime at different unit of analysis. Especially, at the aggregate level, residential mobility
has stronger effect on property crimes than other crimes (Smith & Jarjoura, 1988).
Some scholars have used the number of residents moving in and out of a
province as a measure of residential mobility (Akyuz & Armstrong, 2011; Barnett &
Mencken, 2002; Karakus, 2008; Basibuyuk, 2008; Kose, 2010). In-migration and out-
migration in a province can adequately express population turnover in a community
(Karakus, 2008). In that sense, this study uses total number of residents who migrated
in and out of the provinces between 1995 and 2000. Residential mobility is calculated
by the researcher and measured as follows: Residential Mobility = Total number of
migrants/ Province Population 2000.
Urbanization: Shaw and McKay (1942) characterized urbanized areas with lower
levels of social participation, integration and control alongside various delinquent acts
(as cited in Sampson & Groves, 1989). Moreover, these areas produce criminal
opportunities, while socio-economic development and higher levels of population
turnover take place. Lack of social control as well as anonymity of residents to each
other may induce crime in urban areas (Cole & Gramajo, 2009). Due to its significant
direct effect on community structure and crime, this study employs urbanization as the
final exogenous variable of social disorganization. In compliance with previous studies
39
(Comertler & Kar, 2007; Henderson & Wang, 2006; Karakus, 2008; Li, 1995),
urbanization is measured with the proportion of population living in the province and
district centre to total population of the province in 2000. This study uses urbanization
rate calculated by TurkStat. The formula used by TurkStat for urbanization is as follows:
Urbanization = Total Population of Province and District Centers 2000 / Total Province
Population 2000.
Social Capital Variables
Social capital is accepted as a composite function of individual and community
level elements such as civic participation, altruism and social trust (Akcomak & Weel,
2008). In measuring levels of social capital in different societies, researchers have used
different indicators such as social trust, the level of civic engagement and political
participation, religious institutions and religious affiliation in communities (Beyerlein &
Hipp, 2005; Buonanno, Pasini & Vanin, 2006; Hudson & Chapman, 2002; Putnam,
2000; Rosenfeld, Messner & Baumer, 2001; Rose, 2000).
Similarly, in this study, social capital variables are determined in line with extant
social capital literature. In this vein, faith-based engagement and political participation
are selected as available social capital indicators in 2004 in Turkey.
Faith-based engagement: Rose (2000) defined religious institutions as parochial
control mechanisms organizing social life in the communities. These institutions function
as an essential instrument for developing other community organizations and enhancing
social capital through community action and integration. Religious institutions also show
to what extent members of a local community are engaged to each other based on
40
religious faith. Yet, lack of or insufficient number of religious organizations in a
community may lead to social disorganization (Rose, 2000). In Turkish context, the
number of religious institutions (mosques) in all provinces is taken as a proxy measure
for faith-based engagement in line with previous studies (Basibuyuk, 2008; Guclu, 2010;
Kose, 2010). The fact that mosques are built with the support of local communities in all
provinces refers to local communities’ willingness to ‘‘act together to pursue a shared
goal’’ (Putnam, 1995). Faith-based engagement is measured with the number of
mosques in 2004. It is calculated by the researcher and the formula for faith-based
engagement is as follows: Faith-Based Engagement= (The number of mosques/
Provincial Population 2000)/ 1000.
Political participation is defined as a form of civic engagement (Putnam, 1995;
Putnam, 2000). For Coleman (1990) and Elster (1989), it is an indicator of social
conformity at one point in time (as cited in Coleman, 2002). Political participation is also
a civic duty, which shows the willingness of citizens to intervene daily life for a common
good. In this study, political participation is measured with voting rates in line with
previous studies (Akcomak & Weel, 2008; Buonanno, Pasini & Vanin, 2006; Coleman,
2002; Sabatini, 2005). Voting rates for each province are electoral turnouts in local
elections in 2004. This study uses voting rates reported by TurkStat. The formula used
by TurkStat for the measurement of political participation is as follows: Political
Participation = (Total number of citizen voted/ Total number of voters) / 100.
Control Variables
This study includes socio-economic and demographic variables that may be
41
related to crime rates in Turkey. Controlling for these variables, it is analyzed whether
social disorganization and social capital may impose any significant impact on crime
rates.
Young male population has been used as a standard demographic control
variable in many studies (Akcomak & Weel, 2008; Buonanno, Pasini & Vanin, 2006;
Demirci, 2007; Karakus, 2008; Land, McCall & Cohen, 1990; Rosenfeld, Messner &
Baumer, 2001). Young males between the ages of 15 and 29 more likely engage in
criminal activities than other males and females (Cole & Gramajo, 2009). Therefore, as
a measure of young male population, this study employs the percentage of male
population between 15-29 ages recorded in Census 2000. Majority of studies define the
age group of youth between 15 and 29 as young adulthood age (Buonanno, Pasini &
Vanin, 2006; Cole & Gramajo, 2009; Gartner, 1990; Land, McCall & Cohen, 1990;
Rosenfeld, Messner & Baumer, 2001). This study also uses this group of age in order to
include a larger variance of young males in the analysis. The percentage of male
population is calculated by the researcher and the formula for this variable is as follows:
Young Male Population = (The number of young males aged 15-29 in Census 2000/
Province Population 2000)/100.
Socio-economic development index : Many studies use geographical and
population characteristics of the provinces as control variables in their studies. In these
studies, it is observed that cities and counties are grouped according to their
geographical location (north, south etc.) or population size (urban, rural, metropolitan
42
etc.). However, in this study, the provinces in Turkey are grouped in two categories:
more-developed and less-developed (Onder & Ozyildirim, 2009) based on socio-
economic development index score (SEDI) which shows socio-economic development
of the provinces in Turkey.
As a strong construct, many scholars have used SEDI in order to measure
socio-economic development of cities, counties and countries (Gattini, Sanderson,
Castillo-Salgado, 2002; Mehrotra and Peltonen, 2005; Ozaslan, Dincer and Ozgur,
2006; Onder and Ozyildirim, 2009). In Turkey, SEDI is calculated by State Planning
Organization (SPO), and this index includes 58 indicators selected out of 100 indicators
measuring socio-demographic, structural and economic structure in Turkey. SEDI has a
reliable and valid construct based on standardized values of these indicators. State
Planning Organization uses principal component analysis to reduce the number of
indicators into an index variable, and obtains SEDI scores for each province (Ozaslan,
Dincer and Ozgur, 2006).
SEDI studies in Turkey have become an effective method of reflecting disparities
across the provinces in Turkey since 1996 (Onder & Ozyildirim, 2009). State Planning
Organization (SPO) has used SEDI scores in order to group provinces according to
their development scores. In the first planning strategies developed by SPO, the
provinces in Turkey are grouped into two groups: priority (less developed) and non-
priority (more developed) provinces. In that sense, priority provinces have received
more investment, incentive and subsidies in order to reduce disparities at the provincial
level (Onder & Ozyildirim, 2009).
Similarly, this study adopts this categorization to group the provinces based on
43
their SEDI scores. As SEDI covers a variety of indicators, which may be related to the
main variables of social disorganization such as SES and urbanization rate, SEDI
variable is therefore dichotomized. This approach also prevents multicollinearity
problem among the variables in the analysis. SEDI scores range between - 1.4 and 4.8.
As minus scores indicate less development (Dincer, Özaslan & Kavasoğlu, 2003); this
study treats provinces with a minus SEDI score as less developed, and with a plus
SEDI score as more developed. SEDI score is dummy-coded as more developed
provinces and less developed provinces. The latter is taken as the reference category. If
SEDI score is lower than 0, it is coded as less developed province (0), if it is higher than
0, then it is coded as more developed province (1). Finally, in the regression analysis of
the variables, using SEDI as a dummy variable resulted with a significant relationship
with property crime rate (see Table 3).
Reliability and Validity Issues
Maxfield and Babbie (2008) expressed that official data recorded by public
agencies is widely used in criminal justice studies. Although official data provides the
researchers with many research alternatives, agency records must be used carefully
due to any possible reliability and validity problem. Use of data collected for official use
may produce validity problem, as data may not appropriately fit for a specific research
interest. Therefore, replication of previous studies lessens any validity issue that may be
experienced in the use of secondary data (Maxfield & Babbie, 2008).
Considering this approach, this study replicated the conceptualization and
operationalization of independent variables in accordance with previous literature
(Akcomak and Weel, 2008; Basibuyuk, 2008; Buonanno, Pasini and Vanin, 2006;
44
Dincer, Özaslan & Kavasoğlu, 2003; Guclu, 2010; Karakus, 2008; Kose, 2010; Onder &
Ozyildirim, 2009; Sampson &Groves, 1989). In this regard, all variables had face and
content validity.
Moreover, this study also used data obtained from governmental agencies. The
independent variables used in this study are measured with socio-demographic data
regularly collected from all registered citizens in the country. Data regarding all
independent variables (SES index, family disruption, residential mobility, population
heterogeneity, urbanization rate, faith-based engagement and political participation rate)
are recorded continuously by census authority and TurkStat in Turkey. TurkStat uses
standardized techniques for measurement of these variables. This approach also
improves reliability and validity of the variables.
On the other hand, official crime statistics may have some measurement errors
due to the problems experienced during data collection (e.g. underreporting and
miscategorization problems). Quality of data cannot be sustained due to inconsistent
reporting from law enforcement agencies (Maxfield & Babbie, 2008; Skogan, 1975). In
that sense, property crimes recorded by TNP may not reflect actual crime rates in the
community. However, in Turkey, recent developments in criminal justice system and
use of effective methods in data collection and measurement of crimes led to a sharp
increase in the records of crime rates after 2004 (Bahar & Fert, 2008). Considering this
development in the system, this study used crime records of 2005, 2006 and 2007. To
prevent any fluctuation problem, average number of crimes recorded in these years was
used in the analysis.
Finally, Maxfield and Babbie (2008) discussed that if a specific crime record is
45
exclusive and exhaustive, then measurement quality is satisfied and the measurement
is accepted as a valid measure. In this context, property crimes variable, as the
dependent variable of this study, had a content validity, as it covered all crime types
falling into the categorization of property crimes in the criminal justice system of Turkey.
Analytic Strategy
Statistical Techniques
Descriptive analysis was firstly used to indicate the central tendencies and
standard deviations of the variables. Secondly, bivariate analysis was employed to
discover strength and direction of relationships between the dependent and the
independent variables. Allison (1999) suggested that any correlation above or closer to
0.8 is problematic. Hence, this study used 0.8 as a threshold for collinearity among the
variables. In preliminary analysis of the variables, no correlation among the variables
was above this cut-off point.
As a third statistical method, ordinary least squares (OLS) regression was
employed as a technique to determine the relationship between the dependent variable
and all other variables. More explicitly, OLS was selected as a suitable method to
analyze the impact of the social disorganization and the social capital variables on
property crimes. Accordingly, in three separate steps, regression models were run in
order to test hypotheses of the study.
In the first step, property crime rate was regressed on the social disorganization
and the social capital variables in order to understand their impacts on property crimes,
controlling for age structure and socio-economic development of the provinces. The
equation for this step was as follows:
46
Ŷ (Property Crimes) = a+ b1 X (SES) + b2 X (Family Disruption) + b3 X (Residential
Mobility) + b4 X (Population Heterogeneity) + b5 X (Urbanization) + b6 X (Political
Participation) + b7 X (Faith-based engagement) + b8 X (Young Males) + b9 X (SEDI)
In the second step, political participation rate was regressed on the social
disorganization variables in order to analyze impact of the structural characteristics of
social disorganization variables on political participation, controlling for age structure
and socio-economic development of the provinces. The equation for this step was as
follows:
Ŷ (Political Participation) = a+ b1 X (SES) + b2 X (Family Disruption) + b3 X (Residential
Mobility) + b4 X (Population Heterogeneity) + b5 X (Urbanization) + b6 X (Young Males)
+ b7 X (SEDI)
In the third step, faith-based engagement rate was regressed on the social
disorganization variables in order to understand their impacts on faith-based
engagement, controlling for age structure and socio-economic development of the
provinces. The equation for this step was as follows:
Ŷ (Faith-based engagement) = a+ b1 X (SES) + b2 X (Family Disruption) + b3 X
(Residential Mobility) + b4 X (Population Heterogeneity) + b5 X (Urbanization) + b6 X
(Young Males) + b7 X (SEDI)
As a last statistical analysis method, mediation analysis was used to test
mediation effects of the social capital variables on the relationship between the social
disorganization and property crime variables. To form a mediation model with the social
capital variables, this study followed the criteria proposed by Baron and Kenny (1986).
Accordingly, first, the independent variables (social disorganization) must significantly
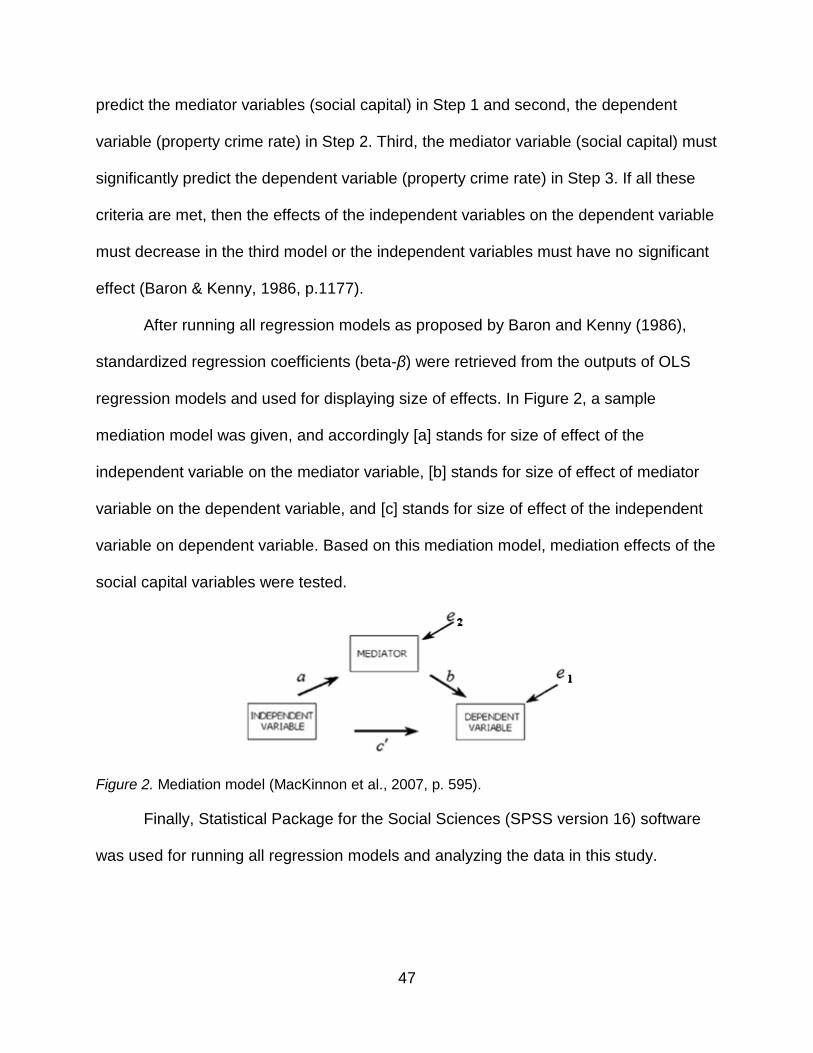
47
predict the mediator variables (social capital) in Step 1 and second, the dependent
variable (property crime rate) in Step 2. Third, the mediator variable (social capital) must
significantly predict the dependent variable (property crime rate) in Step 3. If all these
criteria are met, then the effects of the independent variables on the dependent variable
must decrease in the third model or the independent variables must have no significant
effect (Baron & Kenny, 1986, p.1177).
After running all regression models as proposed by Baron and Kenny (1986),
standardized regression coefficients (beta-β) were retrieved from the outputs of OLS
regression models and used for displaying size of effects. In Figure 2, a sample
mediation model was given, and accordingly [a] stands for size of effect of the
independent variable on the mediator variable, [b] stands for size of effect of mediator
variable on the dependent variable, and [c] stands for size of effect of the independent
variable on dependent variable. Based on this mediation model, mediation effects of the
social capital variables were tested.
Figure 2. Mediation model (MacKinnon et al., 2007, p. 595).
Finally, Statistical Package for the Social Sciences (SPSS version 16) software
was used for running all regression models and analyzing the data in this study.
48
Temporal Order in the Regression Models
Mediation analysis not only requires a causal or associational relationship, but
also a temporal order among the variables (Baron & Kenny, 1986, p. 1176; Menard,
2010, p. 145). In that sense, this study followed a temporal order in the sequence of the
variables in the regression models. Based on theoretical assumptions, first, social
disorganization takes place, and then levels of social capital decreases, and at the final
stage, property crimes occur. Accordingly, in chronological order, the social
disorganization variables of Census 2000 (except divorce rates for 2001-2003), the
social capital variables of 2004, and property crimes of 2005-2007 were used in the
regression and mediation models.
Moreover, use of census data is also quite common in the studies on crime
analysis. Sampson, Raudenbush and Earls (1997) used data from Census 1990 of the
U.S. in the explanation of homicide cases in 343 neighborhoods of Chicago in 1995.
Basibuyuk (2008), Karakus (2008), Kose (2010), Guclu (2010) used Census 2000 of
Turkey in the prediction of different types of crimes committed in 2005 and 2006.
Finally, due to the nature of theory and statistical use of temporal order in
regression analysis in previous literature, the researcher did not assume any reliability
and validity issue about the specification of the models in a temporal order in the study.
49
CHAPTER V
ANALYSES AND FINDINGS
This chapter presents the findings of the study and the analysis of the
relationship between social disorganization, social capital and property crimes.
Distribution of property crimes across the provinces and the structural characteristics of
the provinces are firstly examined. The initial relationship between property crimes and
the independent variables are secondly observed in correlation analyses. Thirdly, the
analyses run in three regression models test research hypotheses and answer the
research questions of the study. Finally, mediation analysis shows the effects of social
disorganization on property crimes via the social capital variables.
Descriptive Statistics
Descriptive statistics displayed in Table 1 indicated that there was a notable
variation among the provinces in Turkey based on the variables of the study. Property
crime rate per 1000 residents in the provinces varied between 0.37 and 10.94. This
indicated that average rate of property crimes for 2005, 2006 and 2007 significantly
varied across the provinces in Turkey. The average of property crime rate for these
years was 3.15 per 1000 residents.
Social disorganization variables also displayed a wide range of variation across
the provinces in Turkey. Relatively, family disruption rate measured with divorce rates
varied from 0.07 to 2.83. The average divorce rate for the years 2001-2003 was 1.14
per 1000 residents. Residential mobility rate measured with the proportion of the
number of immigrants and emigrants within the country to total province population
(Census 2000) varied from 0.09 to 0.37. The average of residential mobility rate was
50
0.15 per 1000 residents. Urbanization rate measured with the proportion of population
living in the centre of the provinces and districts to total province population varied from
26% to 90.7%. The average of urbanization rate was 55.48%. Population heterogeneity
rate measured with the proportion of number of foreign-born residents to total province
population ranged from 0.002% to 1.36%. The average of population heterogeneity rate
was 0.14%. Socio-economic status index (SES) also displayed a significant variation
among the provinces of Turkey, ranging from -3.84 to 10.88. This finding indicated that
there was a spectacular socio-economic gap among the provinces according to Census
2000.
Social capital variables also showed that differing levels of social capital was
observed across the provinces in Turkey. Political participation rate measured with
percentage of residents participating to local elections ranged from 61.1% to 86.8%.
The average rate of participation was 74.8% in 2004. Faith-based engagement rate
measured with the number of mosques ranged from 0.28 to 6.51. The average rate for
faith-based engagement was 1.64 per 1000 residents in 2004.
Similar to the previous variables, two control variables proved that the provinces
displayed different demographic and socio-economic development characteristics.
Based on the mean value of socio-economic development index (SEDI) variable, 40%
of the provinces were developed, while 60% of the provinces were underdeveloped.
Additionally, as a demographic indicator, young male population rate measured with the
percentage of young males aged between 15 and 29 ranged from 10.58% to 28.06%.
This finding also showed that there was a wide range of dispersion of young male
population across the provinces in Turkey.
51
Finally, Table 1 also shows that property crime rate and faith-based engagement
rate are not normally distributed. Previous literature shows that some studies
transformed variables of intervening dimension of social disorganization and crime rates
to induce normality (Barnett & Mencken, 2002; Sampson & Groves, 1989; Sun, Triplet &
Gainey, 2004). Therefore, faith-based engagement rate (as one of the intervening
variables in the study), and property crime rate were log transformed in line with
previous studies. This transformation method was employed as solution for positive
skewness observed in the distribution of these variables (Tabachnick & Fidell, 2007).
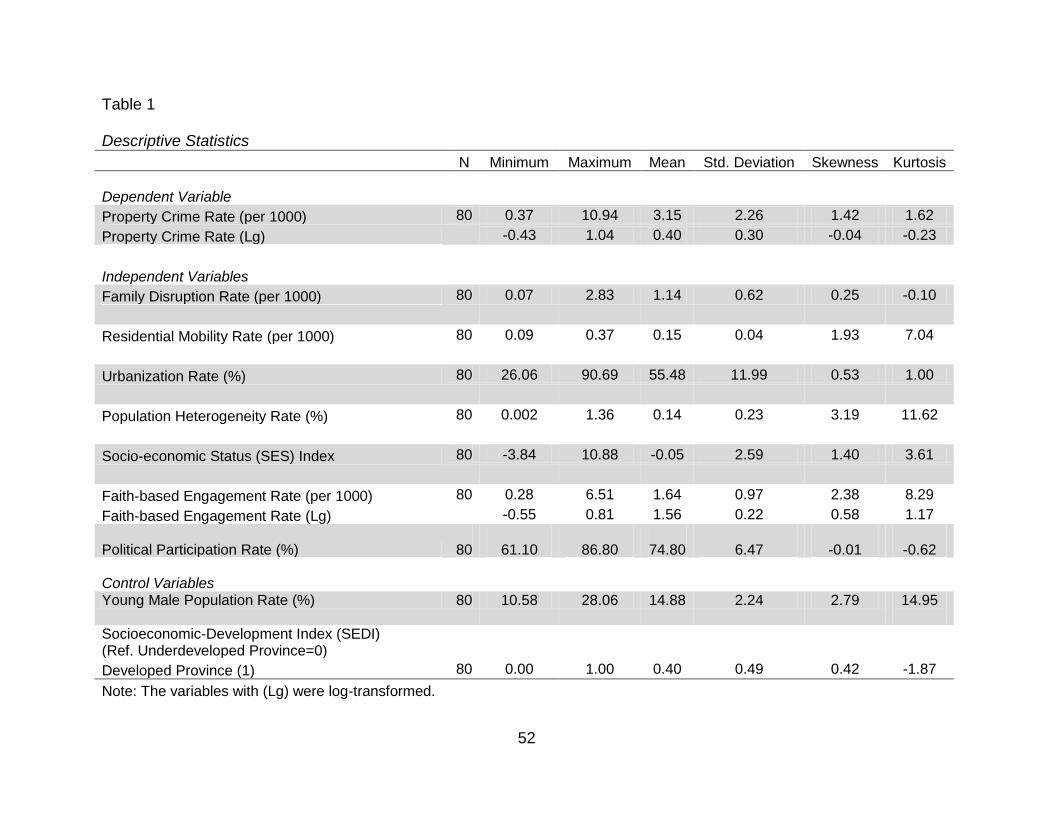
52
Table 1 Descriptive Statistics
N Minimum Maximum Mean Std. Deviation Skewness Kurtosis
Dependent Variable
Property Crime Rate (per 1000) 80 0.37 10.94 3.15 2.26 1.42 1.62
Property Crime Rate (Lg) -0.43 1.04 0.40 0.30 -0.04 -0.23
Independent Variables Family Disruption Rate (per 1000) 80 0.07 2.83 1.14 0.62 0.25 -0.10
Residential Mobility Rate (per 1000) 80 0.09 0.37 0.15 0.04 1.93 7.04
Urbanization Rate (%) 80 26.06 90.69 55.48 11.99 0.53 1.00
Population Heterogeneity Rate (%) 80 0.002 1.36 0.14 0.23 3.19 11.62
Socio-economic Status (SES) Index 80 -3.84 10.88 -0.05 2.59 1.40 3.61
Faith-based Engagement Rate (per 1000) 80 0.28 6.51 1.64 0.97 2.38 8.29
Faith-based Engagement Rate (Lg) -0.55 0.81 1.56 0.22 0.58 1.17
Political Participation Rate (%)
80
61.10
86.80
74.80
6.47
-0.01
-0.62 Control Variables Young Male Population Rate (%) 80 10.58 28.06 14.88 2.24 2.79 14.95
Socioeconomic-Development Index (SEDI) (Ref. Underdeveloped Province=0)
Developed Province (1) 80 0.00 1.00 0.40 0.49 0.42 -1.87
Note: The variables with (Lg) were log-transformed.
53
Bivariate Analysis
Table 2 shows the results of bivariate correlations between property crime rate,
social disorganization (family disruption, residential mobility, urbanization, population
heterogeneity, and SES) and social capital (faith-based engagement and political
participation) and control variables (SEDI and young male population). The findings of
bivariate analysis indicated that majority of research hypotheses were supported in line
with the research hypotheses.
Property crimes rate was significantly correlated with the social disorganization
variables except for residential mobility rate (r = -.11, p > 0.05). Family disruption rate
(r =.59, p < 0.01), population heterogeneity rate (r = .33, p < 0.01), urbanization rate
(r = .56, p < 0.01) and SES (r = .71, p < 0.01) were positively related to property crimes.
However, SES was not related to property crime rate as hypothesized. These findings
supported the Research Hypotheses H2, H4 and H5, and indicated that the provinces
with higher levels of family disruption, population heterogeneity and urbanization had
the higher rates of property crime.
Surprisingly, the findings on the relationship between property crime rate and one
of the social capital variables did not support the research hypotheses. Political
participation rate (r = .20, p > 0.05) was not related to property crime rates as
hypothesized (H6). Nevertheless, the finding for faith-based engagement rate (r =-.25, p
< 0.05) supported the hypothesis as expected (H7).
On the other hand, the social disorganization variables were not related to the
social capital variables as predicted. Social disorganization variables imposed separate
effects on both social capital variables.
54
Accordingly, SES was the only social disorganization variable that had a
significant and positive relationship with political participation rate (r = .26, p < 0.05). As
expected, this finding supported the Research Hypothesis (H8). Family disruption rate (r
= .57, p < 0.01) were significantly and positively correlated with political participation
rate. However, this finding did not support the Research Hypothesis (H9). Unfortunately,
urbanization rate, residential mobility rate and population heterogeneity rate also did not
have any significant relationship with political participation rate, while rejecting the
Hypotheses H10, H11 and H12.
Moreover, population heterogeneity rate (r = -.28, p < 0.05) and urbanization (r =
-.56, p < 0.01) were related to faith-based engagement rate as hypothesized (H16 and
H17). Contrary to the hypotheses (H13 and H15), residential mobility rate (r = .22, p <
0.05) and SES (r = -.40, p < 0.05) were not related to faith-based engagement rate.
Lastly, family disruption rate did not have any significant relationship with faith-based
engagement rate in accordance with the Research Hypothesis (H14).
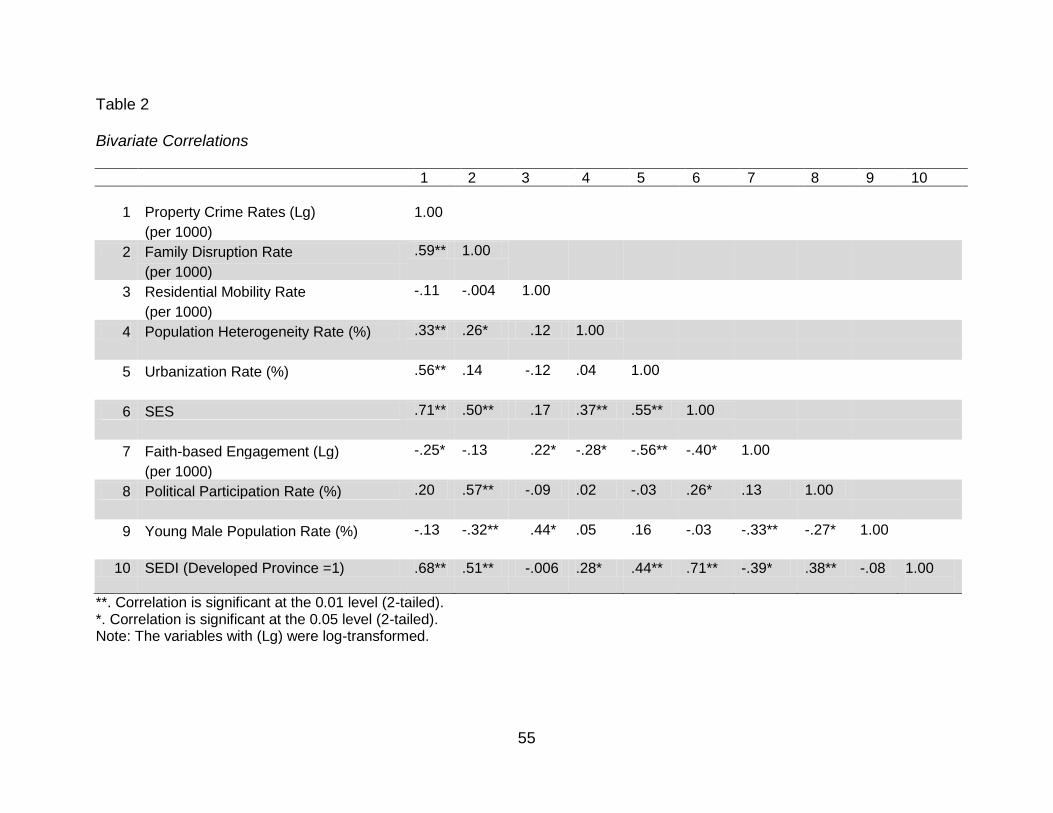
55
Table 2 Bivariate Correlations
1 2 3 4 5 6 7 8 9 10
1 Property Crime Rates (Lg) 1.00
(per 1000)
2 Family Disruption Rate .59** 1.00
(per 1000)
3 Residential Mobility Rate -.11 -.004 1.00
(per 1000)
4 Population Heterogeneity Rate (%) .33** .26* .12 1.00
5 Urbanization Rate (%) .56** .14 -.12 .04 1.00
6 SES .71** .50** .17 .37** .55** 1.00
7 Faith-based Engagement (Lg) -.25* -.13 .22* -.28* -.56** -.40* 1.00
(per 1000)
8 Political Participation Rate (%) .20 .57** -.09 .02 -.03 .26* .13 1.00
9 Young Male Population Rate (%) -.13 -.32** .44* .05 .16 -.03 -.33** -.27* 1.00
10 SEDI (Developed Province =1) .68** .51** -.006 .28* .44** .71** -.39* .38** -.08 1.00
**. Correlation is significant at the 0.01 level (2-tailed). *. Correlation is significant at the 0.05 level (2-tailed). Note: The variables with (Lg) were log-transformed.
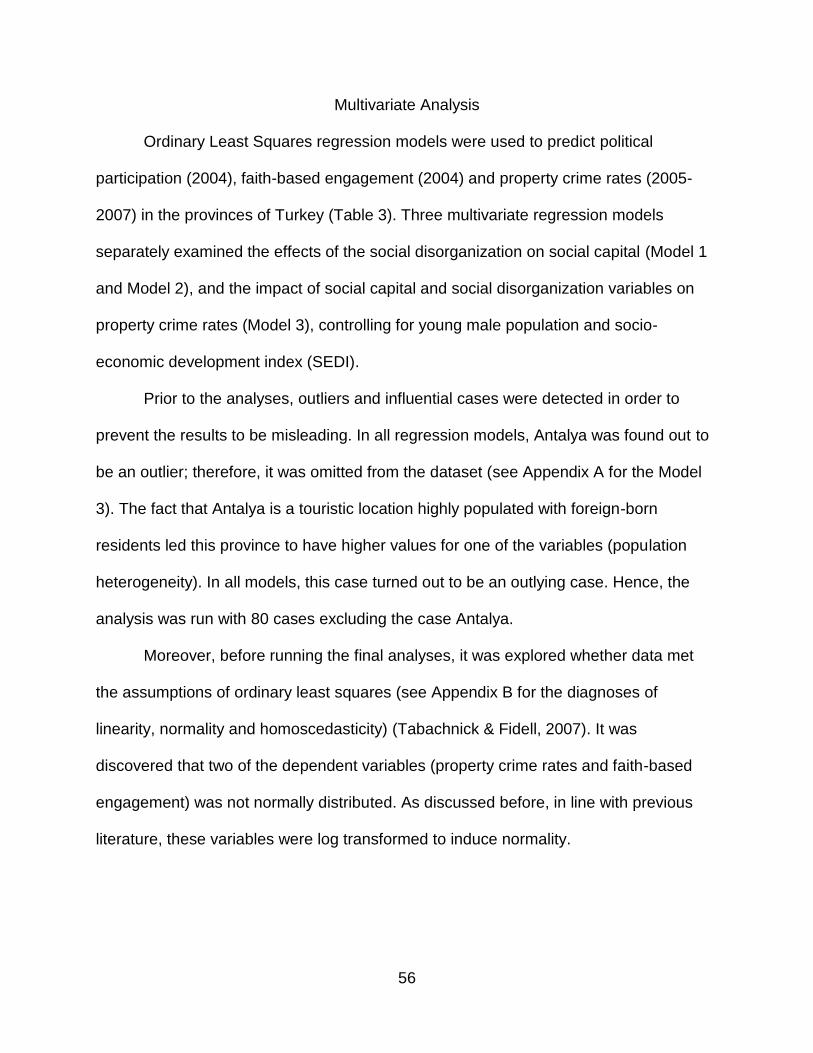
56
Multivariate Analysis
Ordinary Least Squares regression models were used to predict political
participation (2004), faith-based engagement (2004) and property crime rates (2005-
2007) in the provinces of Turkey (Table 3). Three multivariate regression models
separately examined the effects of the social disorganization on social capital (Model 1
and Model 2), and the impact of social capital and social disorganization variables on
property crime rates (Model 3), controlling for young male population and socio-
economic development index (SEDI).
Prior to the analyses, outliers and influential cases were detected in order to
prevent the results to be misleading. In all regression models, Antalya was found out to
be an outlier; therefore, it was omitted from the dataset (see Appendix A for the Model
3). The fact that Antalya is a touristic location highly populated with foreign-born
residents led this province to have higher values for one of the variables (population
heterogeneity). In all models, this case turned out to be an outlying case. Hence, the
analysis was run with 80 cases excluding the case Antalya.
Moreover, before running the final analyses, it was explored whether data met
the assumptions of ordinary least squares (see Appendix B for the diagnoses of
linearity, normality and homoscedasticity) (Tabachnick & Fidell, 2007). It was
discovered that two of the dependent variables (property crime rates and faith-based
engagement) was not normally distributed. As discussed before, in line with previous
literature, these variables were log transformed to induce normality.
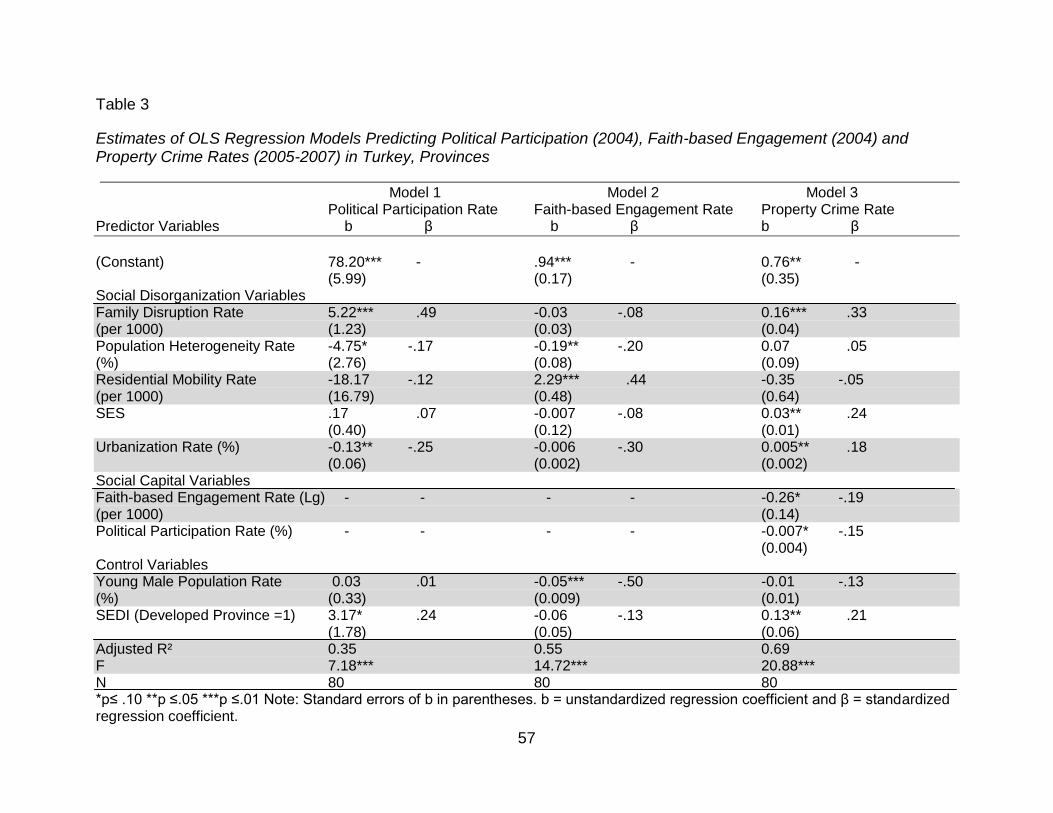
57
Table 3
Estimates of OLS Regression Models Predicting Political Participation (2004), Faith-based Engagement (2004) and Property Crime Rates (2005-2007) in Turkey, Provinces
Model 1 Model 2 Model 3 Political Participation Rate Faith-based Engagement Rate Property Crime Rate
Predictor Variables b β b β b β
(Constant) 78.20*** - .94*** - 0.76** - (5.99) (0.17) (0.35) Social Disorganization Variables Family Disruption Rate 5.22*** .49 -0.03 -.08 0.16*** .33 (per 1000) (1.23) (0.03) (0.04) Population Heterogeneity Rate -4.75* -.17 -0.19** -.20 0.07 .05 (%) (2.76) (0.08) (0.09) Residential Mobility Rate -18.17 -.12 2.29*** .44 -0.35 -.05 (per 1000) (16.79) (0.48) (0.64) SES .17 .07 -0.007 -.08 0.03** .24 (0.40) (0.12) (0.01) Urbanization Rate (%) -0.13** -.25 -0.006 -.30 0.005** .18 (0.06) (0.002) (0.002) Social Capital Variables Faith-based Engagement Rate (Lg) - - - - -0.26* -.19 (per 1000) (0.14) Political Participation Rate (%) - - - - -0.007* -.15 (0.004) Control Variables Young Male Population Rate 0.03 .01 -0.05*** -.50 -0.01 -.13 (%) (0.33) (0.009) (0.01) SEDI (Developed Province =1) 3.17* .24 -0.06 -.13 0.13** .21 (1.78) (0.05) (0.06) Adjusted R² 0.35 0.55 0.69 F 7.18*** 14.72*** 20.88*** N 80 80 80 *p≤ .10 **p ≤.05 ***p ≤.01 Note: Standard errors of b in parentheses. b = unstandardized regression coefficient and β = standardized regression coefficient.
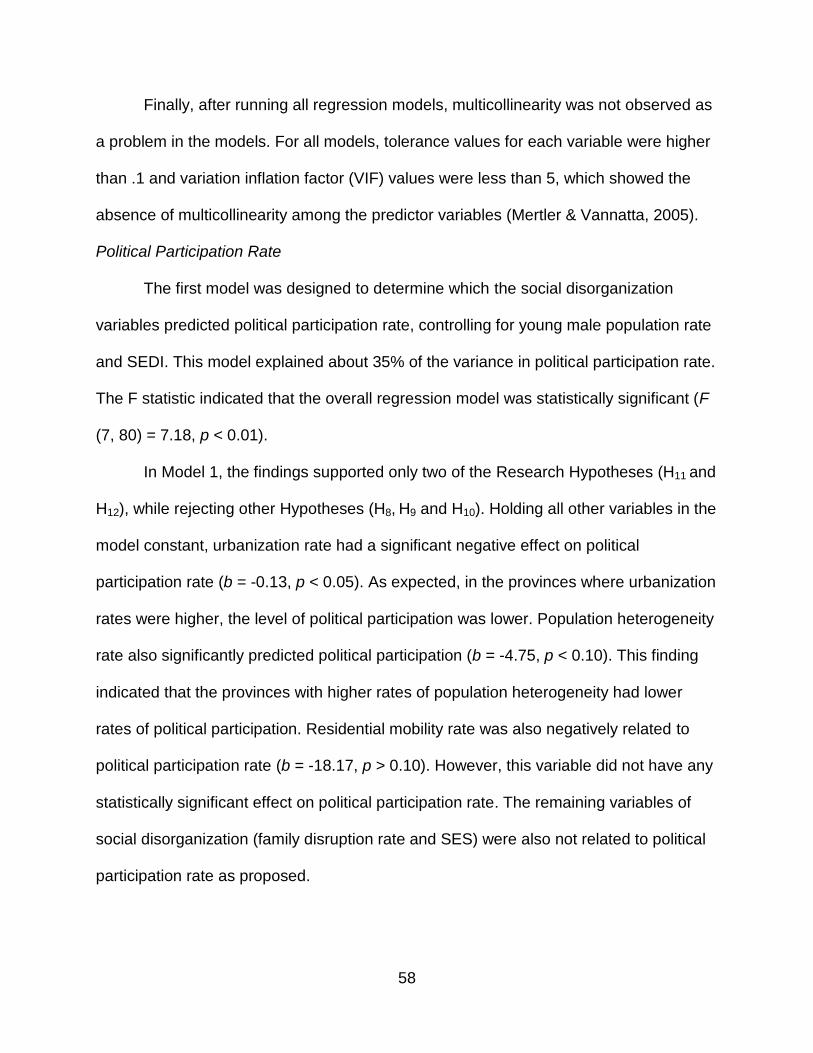
58
Finally, after running all regression models, multicollinearity was not observed as
a problem in the models. For all models, tolerance values for each variable were higher
than .1 and variation inflation factor (VIF) values were less than 5, which showed the
absence of multicollinearity among the predictor variables (Mertler & Vannatta, 2005).
Political Participation Rate
The first model was designed to determine which the social disorganization
variables predicted political participation rate, controlling for young male population rate
and SEDI. This model explained about 35% of the variance in political participation rate.
The F statistic indicated that the overall regression model was statistically significant (F
(7, 80) = 7.18, p < 0.01).
In Model 1, the findings supported only two of the Research Hypotheses (H11 and
H12), while rejecting other Hypotheses (H8, H9 and H10). Holding all other variables in the
model constant, urbanization rate had a significant negative effect on political
participation rate (b = -0.13, p < 0.05). As expected, in the provinces where urbanization
rates were higher, the level of political participation was lower. Population heterogeneity
rate also significantly predicted political participation (b = -4.75, p < 0.10). This finding
indicated that the provinces with higher rates of population heterogeneity had lower
rates of political participation. Residential mobility rate was also negatively related to
political participation rate (b = -18.17, p > 0.10). However, this variable did not have any
statistically significant effect on political participation rate. The remaining variables of
social disorganization (family disruption rate and SES) were also not related to political
participation rate as proposed.
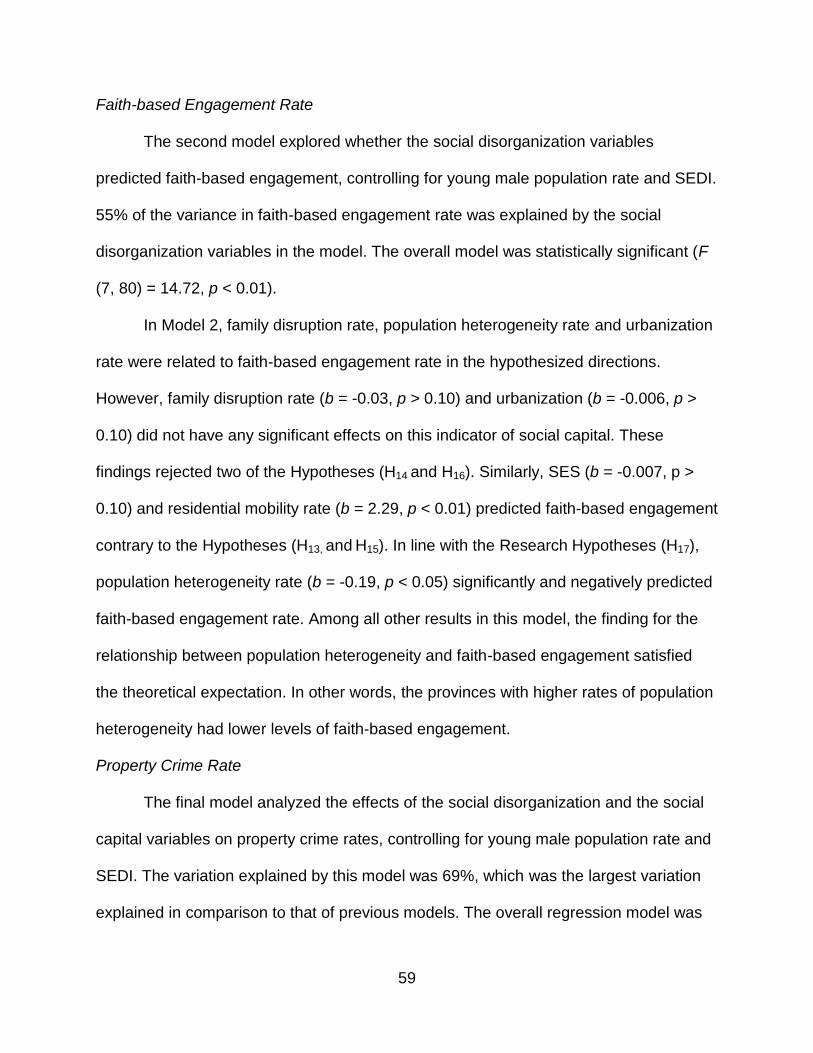
59
Faith-based Engagement Rate
The second model explored whether the social disorganization variables
predicted faith-based engagement, controlling for young male population rate and SEDI.
55% of the variance in faith-based engagement rate was explained by the social
disorganization variables in the model. The overall model was statistically significant (F
(7, 80) = 14.72, p < 0.01).
In Model 2, family disruption rate, population heterogeneity rate and urbanization
rate were related to faith-based engagement rate in the hypothesized directions.
However, family disruption rate (b = -0.03, p > 0.10) and urbanization (b = -0.006, p >
0.10) did not have any significant effects on this indicator of social capital. These
findings rejected two of the Hypotheses (H14 and H16). Similarly, SES (b = -0.007, p >
0.10) and residential mobility rate (b = 2.29, p < 0.01) predicted faith-based engagement
contrary to the Hypotheses (H13, and H15). In line with the Research Hypotheses (H17),
population heterogeneity rate (b = -0.19, p < 0.05) significantly and negatively predicted
faith-based engagement rate. Among all other results in this model, the finding for the
relationship between population heterogeneity and faith-based engagement satisfied
the theoretical expectation. In other words, the provinces with higher rates of population
heterogeneity had lower levels of faith-based engagement.
Property Crime Rate
The final model analyzed the effects of the social disorganization and the social
capital variables on property crime rates, controlling for young male population rate and
SEDI. The variation explained by this model was 69%, which was the largest variation
explained in comparison to that of previous models. The overall regression model was
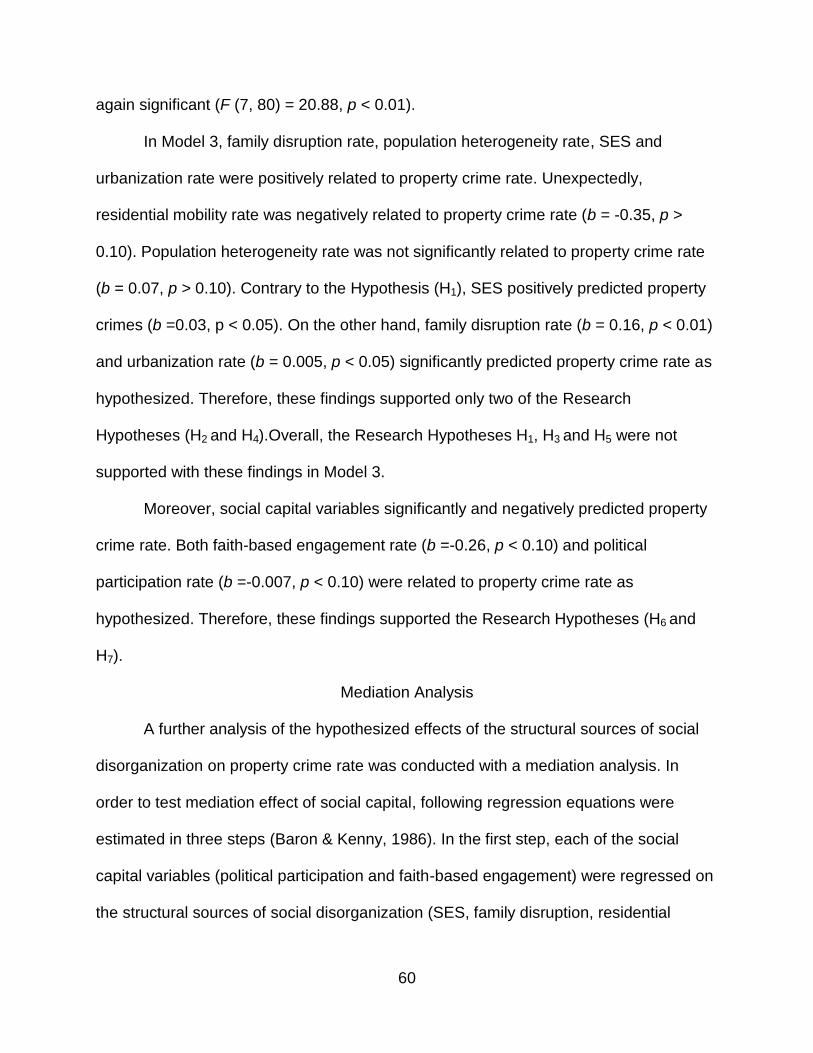
60
again significant (F (7, 80) = 20.88, p < 0.01).
In Model 3, family disruption rate, population heterogeneity rate, SES and
urbanization rate were positively related to property crime rate. Unexpectedly,
residential mobility rate was negatively related to property crime rate (b = -0.35, p >
0.10). Population heterogeneity rate was not significantly related to property crime rate
(b = 0.07, p > 0.10). Contrary to the Hypothesis (H1), SES positively predicted property
crimes (b =0.03, p < 0.05). On the other hand, family disruption rate (b = 0.16, p < 0.01)
and urbanization rate (b = 0.005, p < 0.05) significantly predicted property crime rate as
hypothesized. Therefore, these findings supported only two of the Research
Hypotheses (H2 and H4).Overall, the Research Hypotheses H1, H3 and H5 were not
supported with these findings in Model 3.
Moreover, social capital variables significantly and negatively predicted property
crime rate. Both faith-based engagement rate (b =-0.26, p < 0.10) and political
participation rate (b =-0.007, p < 0.10) were related to property crime rate as
hypothesized. Therefore, these findings supported the Research Hypotheses (H6 and
H7).
Mediation Analysis
A further analysis of the hypothesized effects of the structural sources of social
disorganization on property crime rate was conducted with a mediation analysis. In
order to test mediation effect of social capital, following regression equations were
estimated in three steps (Baron & Kenny, 1986). In the first step, each of the social
capital variables (political participation and faith-based engagement) were regressed on
the structural sources of social disorganization (SES, family disruption, residential
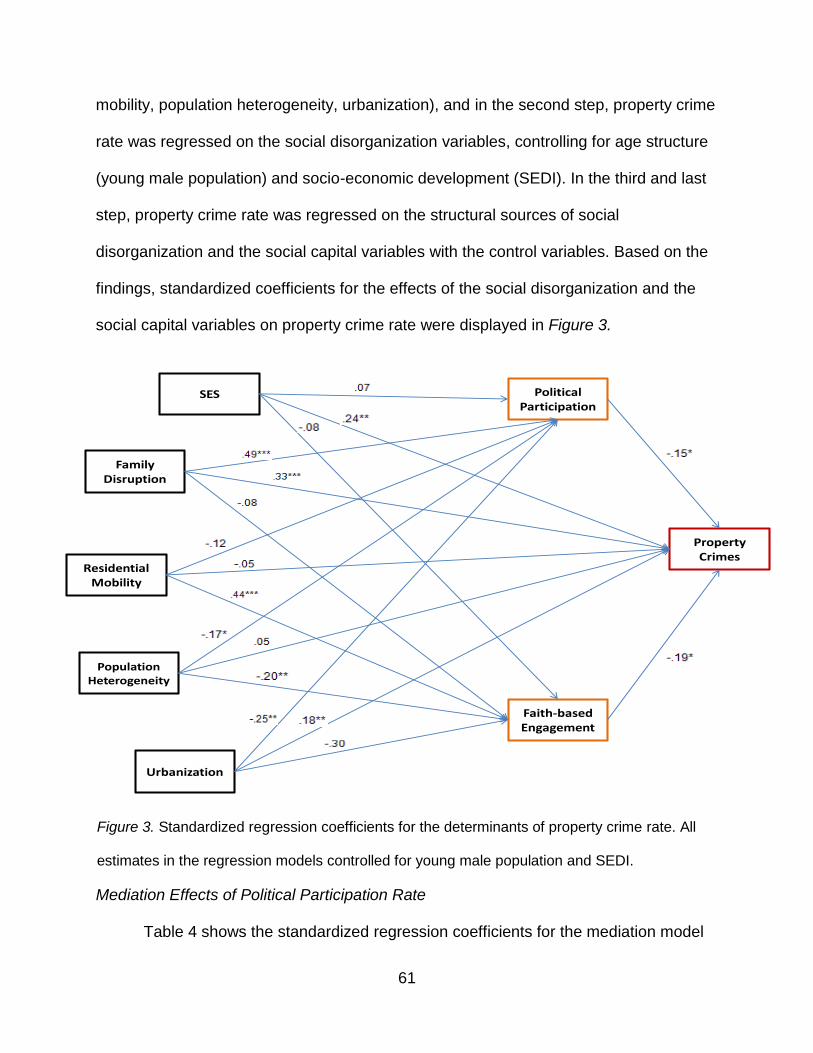
61
mobility, population heterogeneity, urbanization), and in the second step, property crime
rate was regressed on the social disorganization variables, controlling for age structure
(young male population) and socio-economic development (SEDI). In the third and last
step, property crime rate was regressed on the structural sources of social
disorganization and the social capital variables with the control variables. Based on the
findings, standardized coefficients for the effects of the social disorganization and the
social capital variables on property crime rate were displayed in Figure 3.
SES
Urbanization
FamilyDisruption
ResidentialMobility
PopulationHeterogeneity
Faith-basedEngagement
Political Participation
PropertyCrimes
Figure 3. Standardized regression coefficients for the determinants of property crime rate. All
estimates in the regression models controlled for young male population and SEDI.
Mediation Effects of Political Participation Rate
Table 4 shows the standardized regression coefficients for the mediation model
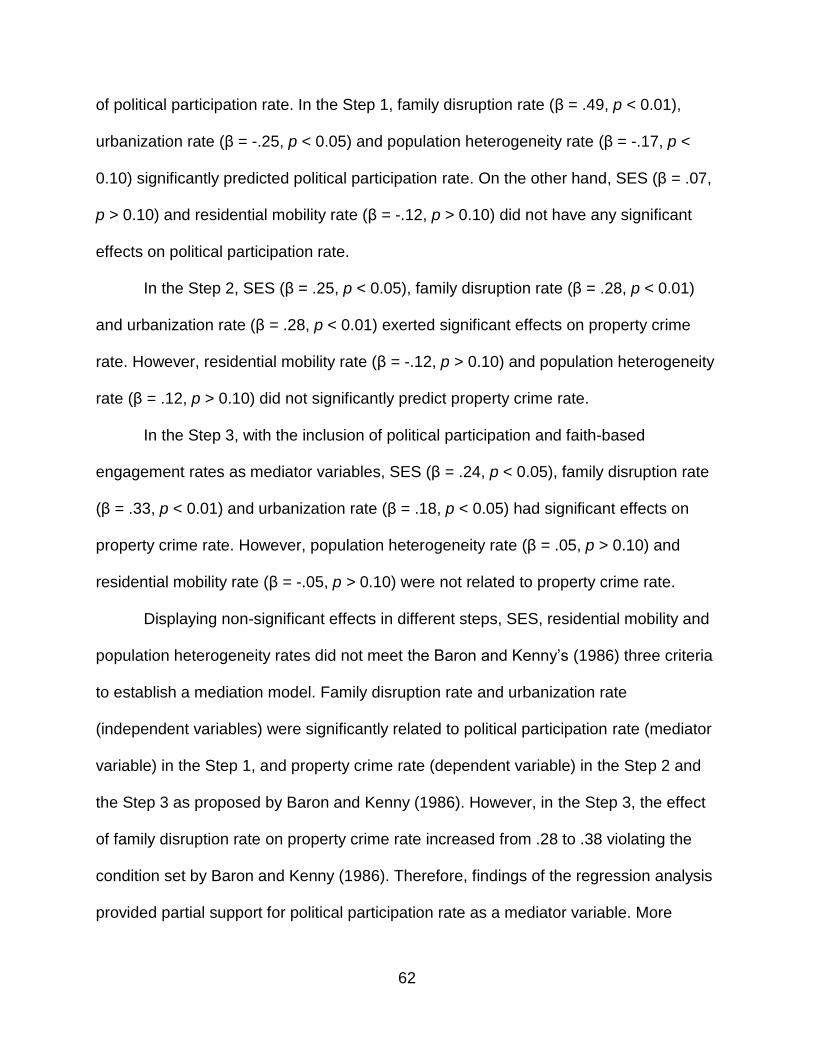
62
of political participation rate. In the Step 1, family disruption rate (β = .49, p < 0.01),
urbanization rate (β = -.25, p < 0.05) and population heterogeneity rate (β = -.17, p <
0.10) significantly predicted political participation rate. On the other hand, SES (β = .07,
p > 0.10) and residential mobility rate (β = -.12, p > 0.10) did not have any significant
effects on political participation rate.
In the Step 2, SES (β = .25, p < 0.05), family disruption rate (β = .28, p < 0.01)
and urbanization rate (β = .28, p < 0.01) exerted significant effects on property crime
rate. However, residential mobility rate (β = -.12, p > 0.10) and population heterogeneity
rate (β = .12, p > 0.10) did not significantly predict property crime rate.
In the Step 3, with the inclusion of political participation and faith-based
engagement rates as mediator variables, SES (β = .24, p < 0.05), family disruption rate
(β = .33, p < 0.01) and urbanization rate (β = .18, p < 0.05) had significant effects on
property crime rate. However, population heterogeneity rate (β = .05, p > 0.10) and
residential mobility rate (β = -.05, p > 0.10) were not related to property crime rate.
Displaying non-significant effects in different steps, SES, residential mobility and
population heterogeneity rates did not meet the Baron and Kenny’s (1986) three criteria
to establish a mediation model. Family disruption rate and urbanization rate
(independent variables) were significantly related to political participation rate (mediator
variable) in the Step 1, and property crime rate (dependent variable) in the Step 2 and
the Step 3 as proposed by Baron and Kenny (1986). However, in the Step 3, the effect
of family disruption rate on property crime rate increased from .28 to .38 violating the
condition set by Baron and Kenny (1986). Therefore, findings of the regression analysis
provided partial support for political participation rate as a mediator variable. More
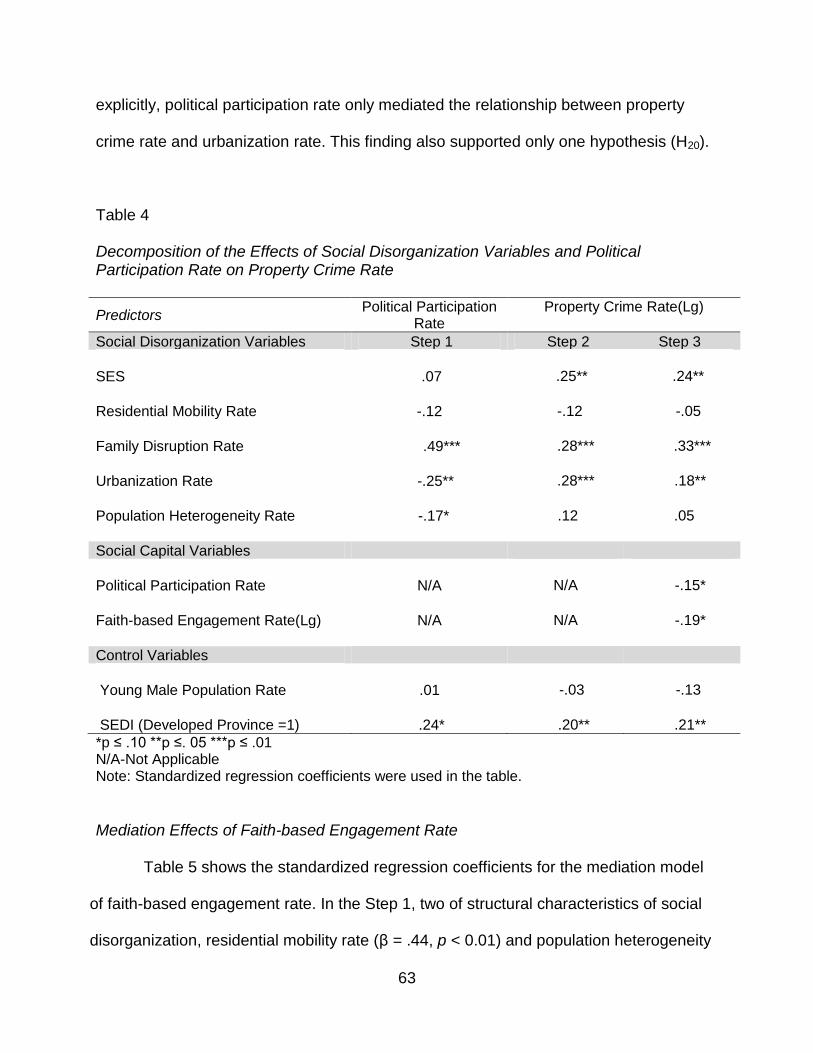
63
explicitly, political participation rate only mediated the relationship between property
crime rate and urbanization rate. This finding also supported only one hypothesis (H20).
Table 4
Decomposition of the Effects of Social Disorganization Variables and Political Participation Rate on Property Crime Rate
Predictors Political Participation
Rate Property Crime Rate(Lg)
Social Disorganization Variables Step 1 Step 2 Step 3
SES .07 .25** .24**
Residential Mobility Rate -.12 -.12 -.05
Family Disruption Rate .49*** .28*** .33***
Urbanization Rate -.25** .28*** .18**
Population Heterogeneity Rate -.17* .12 .05
Social Capital Variables
Political Participation Rate N/A N/A -.15*
Faith-based Engagement Rate(Lg) N/A N/A -.19*
Control Variables
Young Male Population Rate .01 -.03 -.13
SEDI (Developed Province =1) .24* .20** .21**
*p ≤ .10 **p ≤. 05 ***p ≤ .01 N/A-Not Applicable Note: Standardized regression coefficients were used in the table.
Mediation Effects of Faith-based Engagement Rate
Table 5 shows the standardized regression coefficients for the mediation model
of faith-based engagement rate. In the Step 1, two of structural characteristics of social
disorganization, residential mobility rate (β = .44, p < 0.01) and population heterogeneity
64
rate (β = -.20, p < 0.05) were found to be significant predictors of faith-based
engagement rate. Contrarily, SES (β = -.08, p > 0.10), family disruption rate (β = -.08, p >
0.10) and urbanization rate (β = -.30, p > 0.10) did not have any significant effects on
faith-based engagement rate.
The findings for the Step 2 and the Step 3 in the mediation model for political
participation rate were the same for the Step 2 and the Step 3 in this mediation model for
faith-based engagement. Even though, SES, family disruption and urbanization rates
significantly predicted property crime rate in the Steps 2 and 3, these variables were not
significantly related to faith-based engagement rate in the Step 1. Conversely, residential
mobility and population heterogeneity rates significantly predicted faith-based
engagement rate in the Step 1, but did not predict property crime rate in the Steps 2 and
3. Therefore, all of the social disorganization variables violated Baron and Kenny’s
criteria (1986) for the establishment of a mediation model.
Finally, the second part of analysis did not provide any support for faith-based
engagement rate as a mediator variable. More clearly, faith-based engagement rate did
not transmit the effects of structural characteristics of social disorganization on property
crime rate. These findings rejected the Hypotheses (H23, H24, H25, H26 and H27).
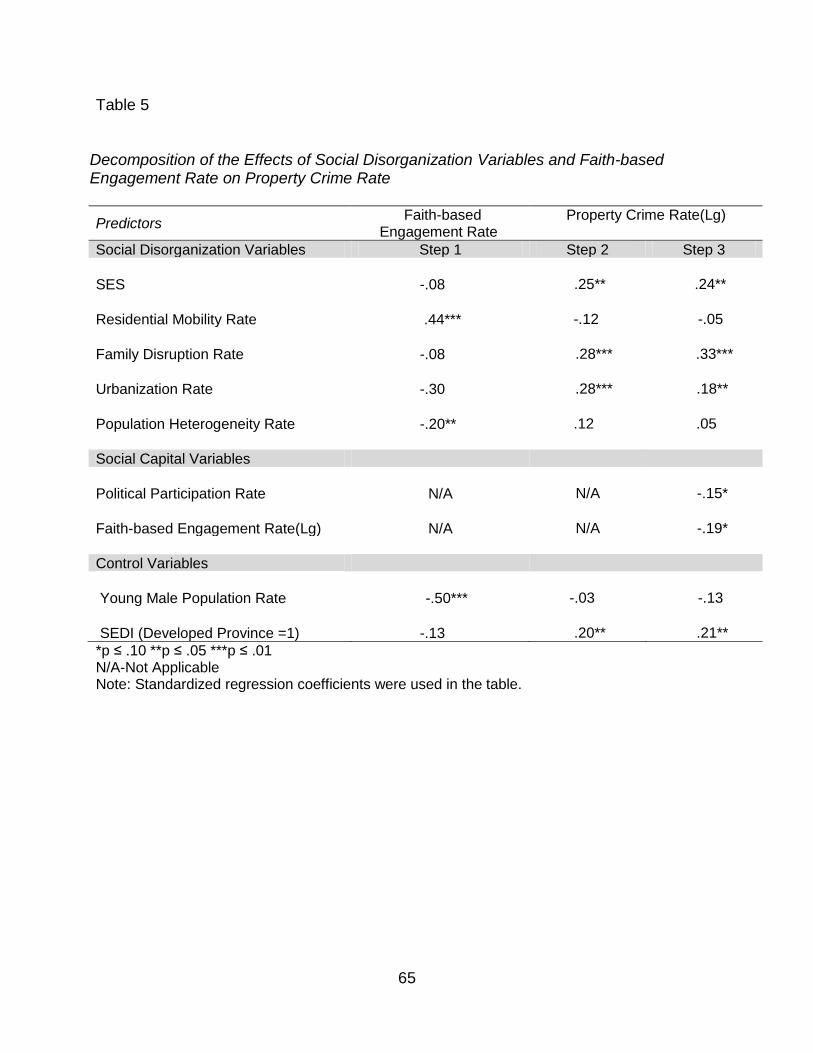
65
Table 5
Decomposition of the Effects of Social Disorganization Variables and Faith-based Engagement Rate on Property Crime Rate
Predictors Faith-based
Engagement Rate Property Crime Rate(Lg)
Social Disorganization Variables Step 1 Step 2 Step 3
SES -.08 .25** .24**
Residential Mobility Rate .44*** -.12 -.05
Family Disruption Rate -.08 .28*** .33***
Urbanization Rate -.30 .28*** .18**
Population Heterogeneity Rate -.20** .12 .05
Social Capital Variables
Political Participation Rate N/A N/A -.15*
Faith-based Engagement Rate(Lg) N/A N/A -.19*
Control Variables
Young Male Population Rate -.50*** -.03 -.13
SEDI (Developed Province =1) -.13 .20** .21**
*p ≤ .10 **p ≤ .05 ***p ≤ .01 N/A-Not Applicable Note: Standardized regression coefficients were used in the table.
66
CHAPTER VI
CONCLUSION
The final chapter presented a discussion of the findings of the study. The
discussion mainly focused on the relevance of social disorganization theory in the
explanation of property crime rate in Turkey. Accordingly, the findings for each
exogenous element of social disorganization were compared with the previous
literature. A further discussion focused on the use of social capital as an intervening
dimension between structural characteristics of social disorganization and property
crime rate. Moreover, based on the findings of the current study, some policy
recommendations were provided. Finally, limitations of the study were explained, and
suggestions for further studies were mentioned.
Discussion
The extended social disorganization model proposed by Sampson and Groves
(1989) was rarely tested in previous literature (Lowenkamp, Cullen & Pratt, 2003; Sun,
Triplet & Gainey, 2004; Veysey & Messner, 1999). Therefore, this study sought
evidence for the viability of this framework by replicating their theoretical framework and
testing it for the analysis of property crimes in Turkey. Except for the inclusion of social
capital as an intervening dimension between exogenous characteristics of social
disorganization and crime rates, their original model was run in three multivariate
regression models. Each of social capital indicators were regressed on social
disorganization factors and then, property crime rate was regressed on both social
capital and social disorganization variables. The findings of this study showed that
67
social disorganization approach as measured here provided partial explanation of
property crime rates in Turkey.
Socioeconomic status (SES) had a significant effect on property crime rate. The
provinces with a higher socio-economic status had the highest level of property crime
rate. Even though this finding did not support the research hypothesis, it was consistent
with the extant literature (Sampson & Groves, 1989; Sun, Triplet & Gainey, 2004).
Previous literature found that family disruption contributed to the weakening of
social ties and local organizations in urban and rural communities, and therefore led to
disorganization and crime (Barnett & Mencken, 2002; Messner & Rosenfeld, 1994;
Sampson, 1987; Sampson, Morenoff & Earls, 1999). Similarly, in this study, family
disruption was positively related to property crime rate. The finding on the relationship
between family disruption rate and property crime rate was in line with the previous
studies. Like family disruption, urbanization rate had a significant positive effect on
property crime rate. In the same way, Sampson and Groves (1989) found a significant
relationship between urbanization and total victimization rate.
Population heterogeneity, as another exogenous element of social
disorganization, had a positive but non-significant effect on property crime rate. This
result was not consistent with the literature. Osgood and Chambers (2000), Sampson
and Groves (1989), Shaw and McKay (1942), and Sun, Triplet and Gainey (2004) found
that ethnic heterogeneity was a strong predictor of crime rates due to its effects on
social cohesion and social trust.
Residential mobility rate were not related to property crimes. In original
formulation of Shaw and McKay (1942), residential mobility was a root cause of social
68
disorganization in the community, thwarting the share of common values and
establishment of local organizations. In a supportive manner, Bursik and Grasmick
(1993) and Sampson, Earls and Raudenbush (1997) furthered that residential mobility
destabilizes the social control in a community. In this regard, this finding of study did not
provide a plausible support to the original theoretical assumption. However, this finding
was also in accordance with the finding of Osgood and Chambers (2000). For Osgood
and Chambers, the reason for this non-significant relationship may be related to other
characteristics of a community. Warner (1999) explains this inconsistency by underlying
the fact that effects of residential mobility are circumvented by urban subculture that
provides survival techniques for its members, and ignores traditional value system
shared within the larger society.
At first glance, based on the effects of these variables on property crime rate, the
findings of this study only supported two main propositions (family disruption and
urbanization) inserted by Sampson and Groves (1989) into the original social
disorganization model of Shaw and McKay (1942). The remaining exogenous elements
of social disorganization (SES, population heterogeneity and residential mobility) did not
have any expected effects on property crime rate.
Similarly, in the mediation analysis, use of faith-based engagement and political
participation rates as mediators between the structural factors of social disorganization
and property crime rate provided marginal support to the theory. Political participation
rate partially mediated the relationship between property crime rate and urbanization
rate, while faith-based engagement rate did not mediate the effects of social
disorganization variables on property crime rate. Yet, these findings were also
69
consistent with the findings of previous literature (Sampson & Groves, 1989; Veysey &
Messner, 1999, Sun, Triplet & Gainey, 2004) noting a relative support for intervening
dimensions in the theoretical model.
Policy Recommendations
Macro level social facts remain constant determinants of social disorganization in
the urban areas. Family disruption, changes in socio-economic status of the individuals,
residential mobility, population heterogeneity and population growth in urban areas are
ever-changing factors of social disorganization and becoming indicators of a well
functioning social system. Crime and delinquency are also social facts emerging with
above-mentioned aspects of life in the communities. Above all, crime and delinquency
are still expected outcomes of social disorganization in the community. In spite of
projects and programs designed by local and federal governments for the prevention of
crimes in socially disorganized areas of the cities, crime as a social fact continuously
co-exists with the causes and indicators of social disorganization. Therefore, any kind of
intervention to the root causes of disorganization has to be comprehensive and planned
in a long-term manner.
However, in practice, the role of the social capital as an intervention mechanism
appears to be undermined or never considered as important as Putnam (2000)
stressed. Undoubtedly, community efforts in the form of social capital have the key role
in solving crime problems in the disorganized societies. In a supportive manner, earlier
studies use notions of collective efficacy and social capital as the indicators of
community social organization. Both collective efficacy and social capital are necessary
social mechanisms for community organization and for prevention of delinquency and
70
crime (Putnam, 2000; Sampson & Groves, 1989, Sampson, Raudenbush & Earls,
1997).
Therefore, this study used social capital as a mediating structure between social
disorganization and property crimes, and operationalized social capital with the levels of
faith-based engagement and political participation in the provinces of Turkey. Both
notions of social capital relatively refer to social unity and social conformity to the rules
of democracy. In line with this understanding, the implications of this study can be
interpreted to the development of social unity and social conformity in the community.
The findings of current research may not directly imply policies and practical
solutions for law enforcement bodies regarding deterrence of crime incidents and crime
analysis. However, in compliance with the essence of the research, it may be advisable
for police departments to improve community policing in their jurisdictions with the idea
of contributing to community social capital and, in return, creating a safer neighborhood.
In other words, police may look for opportunities to develop relationships with the
community organizations and members of the community. Participation to community
activities (e.g. festivals, religious celebrations) may build a bridge between police and
the community. In other words, it may help increase bridging social capital in the
community (Akcomak & Weel, 2008). To this end, citizen police academies may also be
encouraged to establish in the provinces of Turkey. In coordination with provincial
directorates of public education, seminars, briefings and conferences about policing
activities and public security may be held for raising awareness of the citizens in the
community. These activities may be productive in two ways: First, social trust and public
perceptions towards police will develop in a positive direction (Hawdon, 2008). Second,

71
the citizens get closer to the law enforcement bodies and help the police in preventing
and solving future cases. This effort will also increase the willingness of citizens to
cooperate with police (e.g. number of calls for notifying police about the suspected
persons and events in the neighborhood). Second, they learn how to prevent property
crimes in the community and not to become a victim of property crimes.
Moreover, a public safety class may be inserted into the curricula of primary and
secondary schools in order to help the children have a sense of law-abiding citizenship
at a very early age. All educational activities may improve the image of police and the
understanding of policing in public eye and decrease the distance between police and
the citizens in the minds of the citizens.
Furthermore, in Turkey, municipalities and district governorates should hold the
main responsibility of creating opportunities for social networks and encouraging
individuals to participate to community organizational life, and of increasing the sense of
community membership (Putnam, 2000). Thus, creating social networks in a community
will unify the members from different cultural backgrounds (Wong, 2007), and make
them familiar to each other and work together to the benefit of the community.
Communities act as biological bodies, and with their functional internal systems,
communities not only control but also diagnose any indication of social problem before
its existence. In that sense, a community may prevent or decrease the frequency of any
property crime incidence with an effective neighborhood watch conducted on a
voluntary basis. Moreover, community efforts to support the residents in need and
sharing the goods with the poor people in the community may help decrease socio-
economic strain on the families. Otherwise, some members of the community will be
72
more likely to commit a property crime to meet their basic needs (Wong, 2007).
Likewise, promoting the chances of attending school for the youth and organizing
more extracurricular activities for the teenagers in the community are possible with the
joint efforts of the community members and school administrations. Attachment of youth
to the community will also help decrease juvenile delinquency and the number of
property crimes committed by juveniles (Sampson & Groves, 1989).
Finally, it is essential to underlie that increasing levels of social unity and
conformity as a binding form of social capital are more likely to decrease property
crimes in the community. As Putnam (2000) mentioned, devastating effects of
exogenous dimensions of social disorganization on society will be absorbed by social
capital (e.g. social trust, networks, engagement), and the community itself will create
safer areas to live for its residents (p.307).
Limitations and Recommendations for Further Research
The study of property crimes in Turkey provided partial support for the social
disorganization model proposed by Sampson and Groves (1989). Enough support was
found to indicate the applicability of the theory in a different cultural setting other than
the United Kingdom and the United States. However, some limitations of the study
should also be mentioned here.
First, this study was limited to a small number of cases (81), which is the number
of the provinces in Turkey. Unit of analysis was also the provinces. Therefore, this study
tested for linear relationships between predictor and dependent variables at the
aggregate level. Second, this study had a cross-sectional design in essence, however,
the analysis was run with the variables from different years in a temporal order. Property
73
crime rate was the average of three-year period (2005-2007), and social capital
variables were from 2004, while predictor variables were obtained from Census 2000
and divorce rate was the average of 2001-2003.
Finally, use of police records of crime revealed a few issues as a limitation of this
study. As Maxfield and Babbie (2008) argued, property crime rate measured based on
the police records might have reliability issues. Moreover, crime rates employed in the
study only referred to the number of crimes known to police. The analysis excluded
crimes known to gendarmerie, which operates in less populated rural areas. Therefore,
crimes recorded by police solely covered the police jurisdiction, not all the country.
Similarly, property crimes (dependent variable) data was limited to the province centers
and districts, while all independent variables referred to the whole province including
province centre, districts, towns and villages. Hence, statistical inference and
generalization of the results was only valid for the parts of the provinces and districts
within police jurisdiction.
In spite of limitations, this study by testing social disorganization theory as a full
model was an important step toward a better understanding of the factors that
determine property crimes in Turkey. Using social capital indicators as an intervening
dimension also contributed to the development of theoretical framework. Therefore,
some suggestions may also be given for further studies.
In this study, using a secondary dataset collected from governmental agencies
helped analyze the relationship between social disorganization and property crimes at
the aggregate level, and provided the researcher a certain understanding of the topic.
For a further study, therefore, conducting a survey (e.g. British Crime Survey and
74
National Crime Victimization Survey) with a representative sample size will be more
fruitful in the explanation of social disorganization in the communities. Additionally, a
longitudinal design or time series analysis may be more useful to observe the variation
of crime rates across the years in relation to the variables of social disorganization
framework.
Due to the nature of official dataset, developing measurement of social
disorganization variables such as family disruption, residential mobility, and population
heterogeneity turned out to be a significant methodological aspect for this study. Hence,
using different indicators to measure these variables may provide a better analysis of
social disorganization in future studies. Similarly, further analysis of mediating impact of
social capital on the relationship between social disorganization and property crimes will
only be possible by adding new social capital variables. In that, two dimensions of social
capital (political participation and faith-based engagement) used in this study might not
measure social capital exactly and explain the whole variation of property crimes.
Findings of this study also suggested that a model specification provides better
analysis of the social processes leading to crime. Inclusion of new dimensions omitted
in previous studies may also improve the explanatory power of theoretical model. A
proposed conceptual model for further analysis of crime in relation to social
disorganization may be as follows:
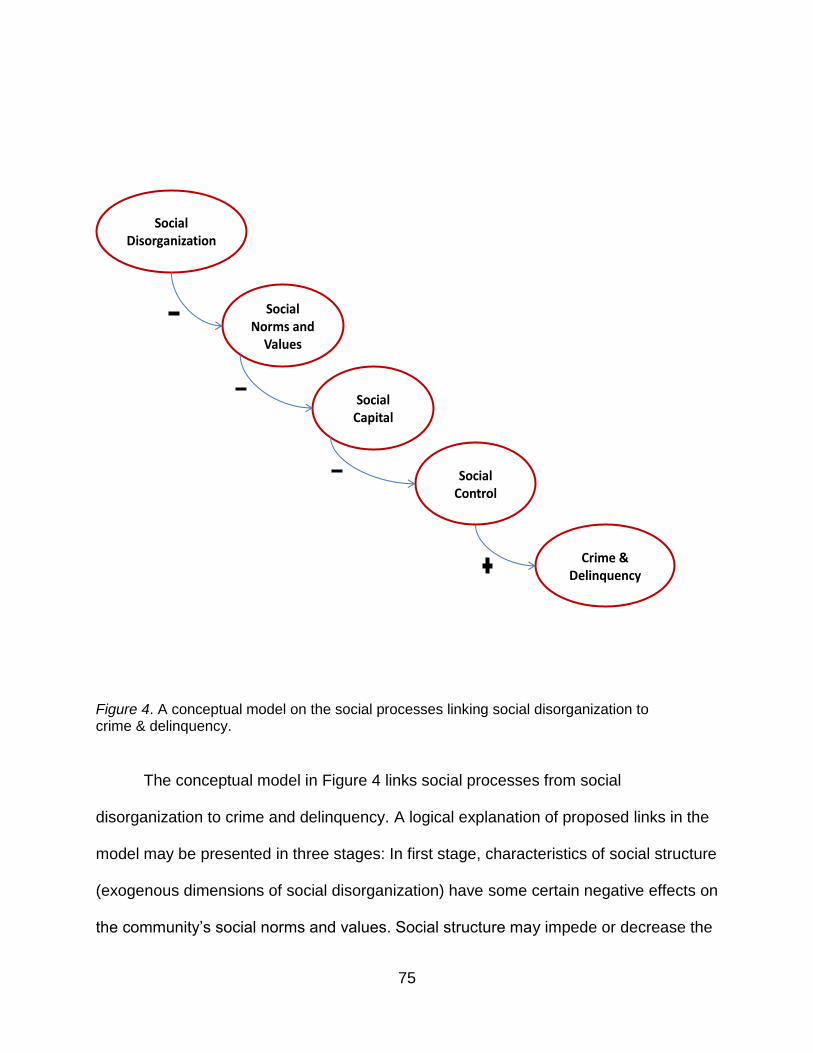
75
SocialDisorganization
SocialNorms and
Values
Crime & Delinquency
Social Control
SocialCapital
Figure 4. A conceptual model on the social processes linking social disorganization to crime & delinquency.
The conceptual model in Figure 4 links social processes from social
disorganization to crime and delinquency. A logical explanation of proposed links in the
model may be presented in three stages: In first stage, characteristics of social structure
(exogenous dimensions of social disorganization) have some certain negative effects on
the community’s social norms and values. Social structure may impede or decrease the
76
chances of sharing of these norms and values, communication and interaction among
the members of the community. In second stage, social capital cannot be accumulated
due to the inability of the community to share the same norms, values and a common
goal for the benefit of the community. In third stage, the absence or lower levels of
positive social capital in the form of social networks, social cohesion, and collective
efficacy may exert a negative influence on social control within the community. More
specifically, informal social control mechanisms may not function to the needs of the
community. At the end of these social processes, crime and delinquency may emerge
due to lack of informal social control. Further research may consider these social
processes for better understanding and analysis of the link between social
disorganization and crime and delinquency. Using multiple indicators for the
measurement of the variables in this conceptual model will also increase the overall
reliability of the study and facilitate use of different statistical techniques such as
structural equation model (Veysey & Messner, 1999). Finally, advances in theoretical
research will present different approaches for the study of social disorganization at
different units of analysis.
77
APPENDIX A
REGRESSION DIAGNOSTICS
78
Outliers and influential points were explored by following these two steps. First, the
impact of outliers on the regression results was observed with leverage and Cook's D
values. Second, DFBETA was used to assess the impact of each observation on the
regression coefficients.
In the first model, “Antalya” was found to be the most influential case. Cook’s D value
was 2.46, which was the largest value, and higher than the cut-off point (.22). Leverage
value also showed that “Antalya” (.92) exceeded the cut-off value (.20) for this model.
DFBETA value for population heterogeneity rate for "Antalya" (4.30) was higher than the
cut-off value of .22 for all regression models.
As in the first model, in the second model, it was observed that “Antalya” had the
largest value of Cook’s D (Cook’s Di = 3.08). Leverage value for this case (.92) exceeded
the cut-off value (.20) for this model. Similarly, DFBETA for population heterogeneity rate for
"Antalya" (6.52) was higher than the cut-off value of .22.
In the final model, again, Antalya was flagged as the most outlying case with the
largest Cook’s D value (Cook’s Di = 3.08), which also exceeded the cutoff value of .05.
Additionally, Antalya had also highest Leverage value (.92), which was also higher than cut-
off value for this model (.25). DFBETA for population heterogeneity rate for "Antalya" was
about 5.31, which was larger than the cut-off point (.22). Inclusion of "Antalya" would also
increase regression coefficients by 5.31 standard error points when compared to a model
omitting "Antalya". This evidence also supported that the observation for "Antalya" is very
problematic.
As a result of outlier and influential case diagnostics for three regression models in
the study, Antalya was found to be a very problematic case. Two regression models were
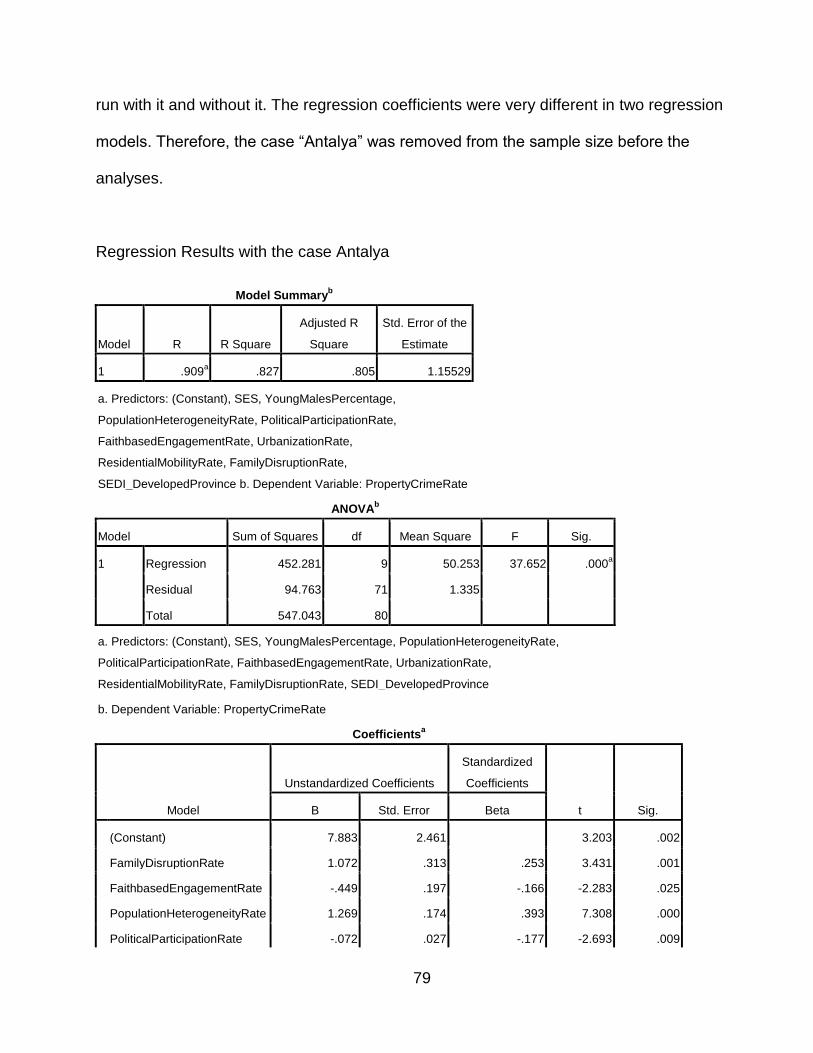
79
run with it and without it. The regression coefficients were very different in two regression
models. Therefore, the case “Antalya” was removed from the sample size before the
analyses.
Regression Results with the case Antalya
Model Summaryb
Model R R Square
Adjusted R
Square
Std. Error of the
Estimate
1 .909a .827 .805 1.15529
a. Predictors: (Constant), SES, YoungMalesPercentage,
PopulationHeterogeneityRate, PoliticalParticipationRate,
FaithbasedEngagementRate, UrbanizationRate,
ResidentialMobilityRate, FamilyDisruptionRate,
SEDI_DevelopedProvince b. Dependent Variable: PropertyCrimeRate
ANOVAb
Model Sum of Squares df Mean Square F Sig.
1 Regression 452.281 9 50.253 37.652 .000a
Residual 94.763 71 1.335
Total 547.043 80
a. Predictors: (Constant), SES, YoungMalesPercentage, PopulationHeterogeneityRate,
PoliticalParticipationRate, FaithbasedEngagementRate, UrbanizationRate,
ResidentialMobilityRate, FamilyDisruptionRate, SEDI_DevelopedProvince
b. Dependent Variable: PropertyCrimeRate
Coefficientsa
Model
Unstandardized Coefficients
Standardized
Coefficients
t Sig. B Std. Error Beta
(Constant) 7.883 2.461
3.203 .002
FamilyDisruptionRate 1.072 .313 .253 3.431 .001
FaithbasedEngagementRate -.449 .197 -.166 -2.283 .025
PopulationHeterogeneityRate 1.269 .174 .393 7.308 .000
PoliticalParticipationRate -.072 .027 -.177 -2.693 .009
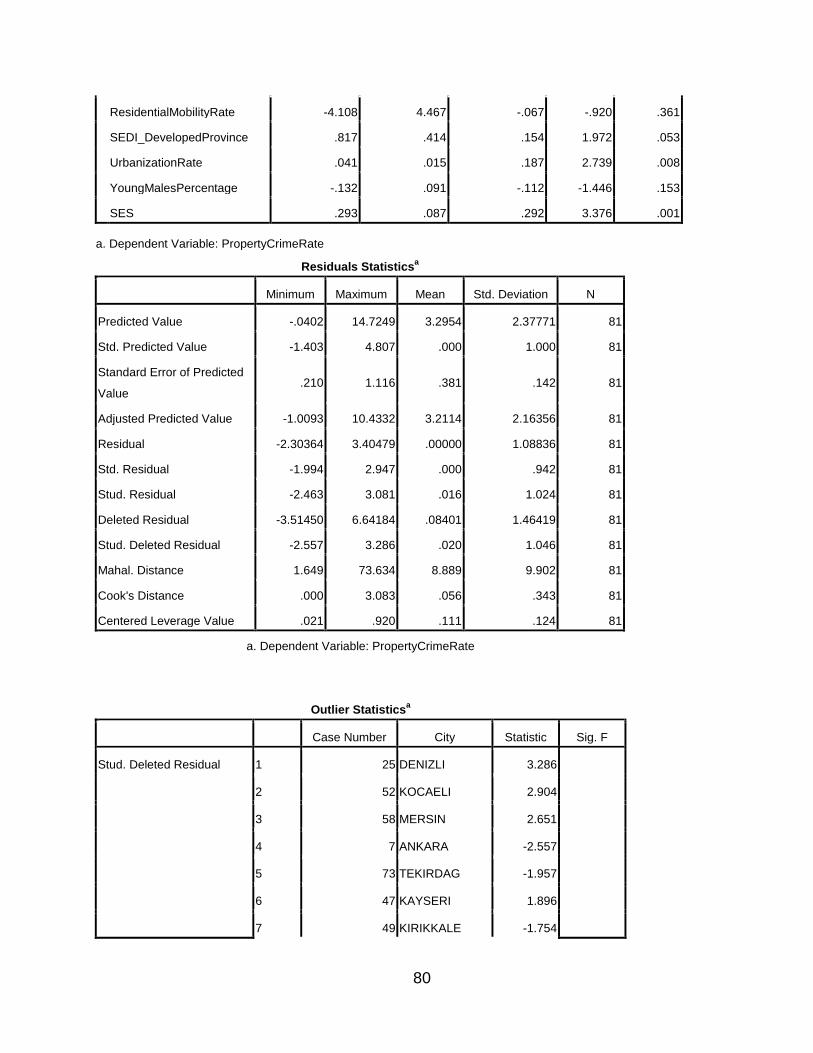
80
ResidentialMobilityRate -4.108 4.467 -.067 -.920 .361
SEDI_DevelopedProvince .817 .414 .154 1.972 .053
UrbanizationRate .041 .015 .187 2.739 .008
YoungMalesPercentage -.132 .091 -.112 -1.446 .153
SES .293 .087 .292 3.376 .001
a. Dependent Variable: PropertyCrimeRate
Residuals Statisticsa
Minimum Maximum Mean Std. Deviation N
Predicted Value -.0402 14.7249 3.2954 2.37771 81
Std. Predicted Value -1.403 4.807 .000 1.000 81
Standard Error of Predicted
Value .210 1.116 .381 .142 81
Adjusted Predicted Value -1.0093 10.4332 3.2114 2.16356 81
Residual -2.30364 3.40479 .00000 1.08836 81
Std. Residual -1.994 2.947 .000 .942 81
Stud. Residual -2.463 3.081 .016 1.024 81
Deleted Residual -3.51450 6.64184 .08401 1.46419 81
Stud. Deleted Residual -2.557 3.286 .020 1.046 81
Mahal. Distance 1.649 73.634 8.889 9.902 81
Cook's Distance .000 3.083 .056 .343 81
Centered Leverage Value .021 .920 .111 .124 81
a. Dependent Variable: PropertyCrimeRate
Outlier Statisticsa
Case Number City Statistic Sig. F
Stud. Deleted Residual 1 25 DENIZLI 3.286
2 52 KOCAELI 2.904
3 58 MERSIN 2.651
4 7 ANKARA -2.557
5 73 TEKIRDAG -1.957
6 47 KAYSERI 1.896
7 49 KIRIKKALE -1.754
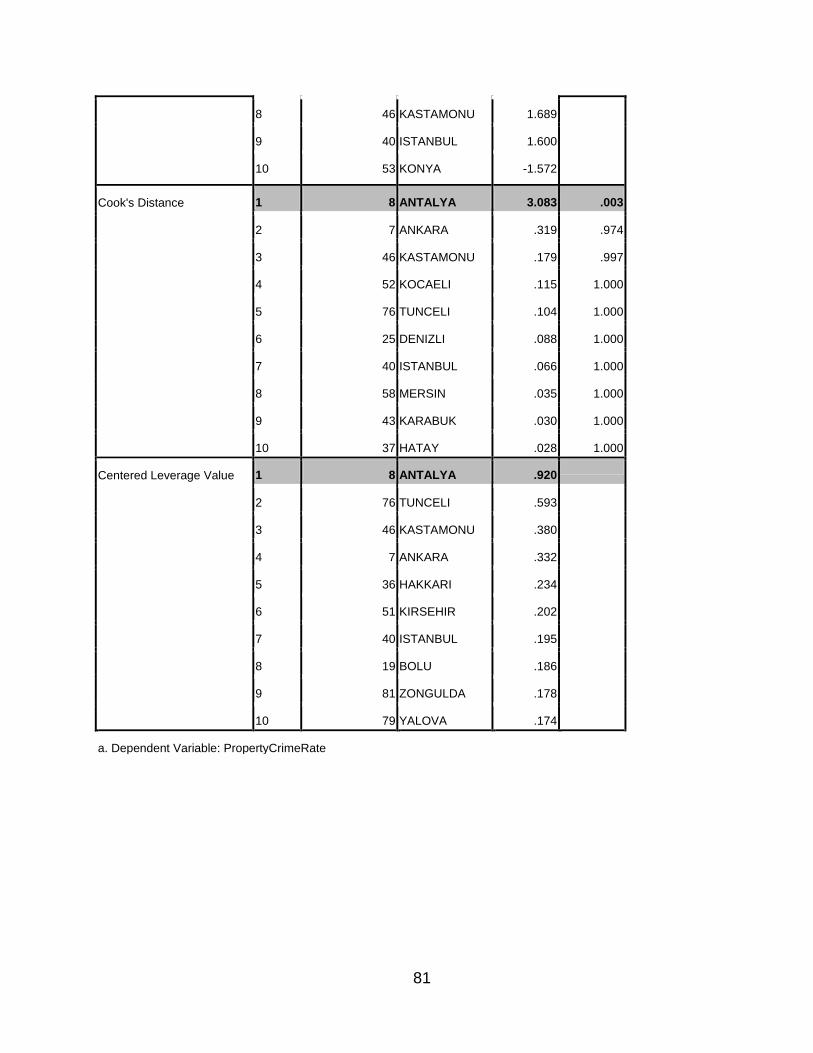
81
8 46 KASTAMONU 1.689
9 40 ISTANBUL 1.600
10 53 KONYA -1.572
Cook's Distance 1 8 ANTALYA 3.083 .003
2 7 ANKARA .319 .974
3 46 KASTAMONU .179 .997
4 52 KOCAELI .115 1.000
5 76 TUNCELI .104 1.000
6 25 DENIZLI .088 1.000
7 40 ISTANBUL .066 1.000
8 58 MERSIN .035 1.000
9 43 KARABUK .030 1.000
10 37 HATAY .028 1.000
Centered Leverage Value 1 8 ANTALYA .920
2 76 TUNCELI .593
3 46 KASTAMONU .380
4 7 ANKARA .332
5 36 HAKKARI .234
6 51 KIRSEHIR .202
7 40 ISTANBUL .195
8 19 BOLU .186
9 81 ZONGULDA .178
10 79 YALOVA .174
a. Dependent Variable: PropertyCrimeRate
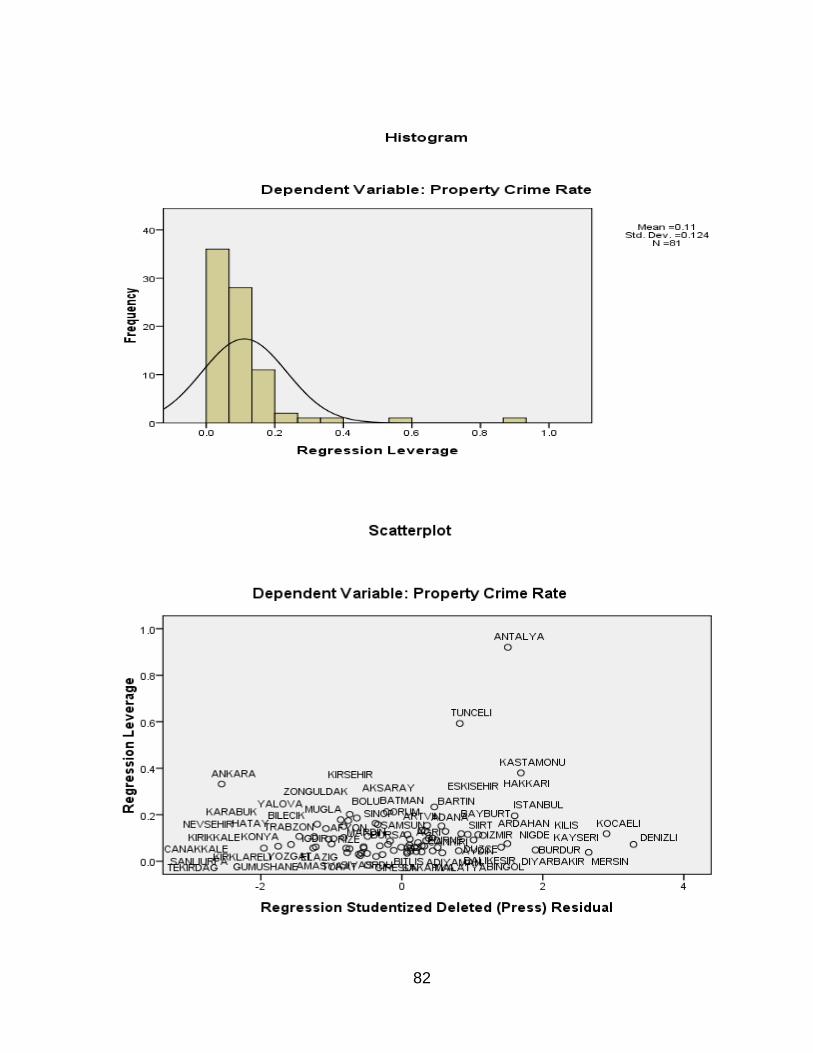
82
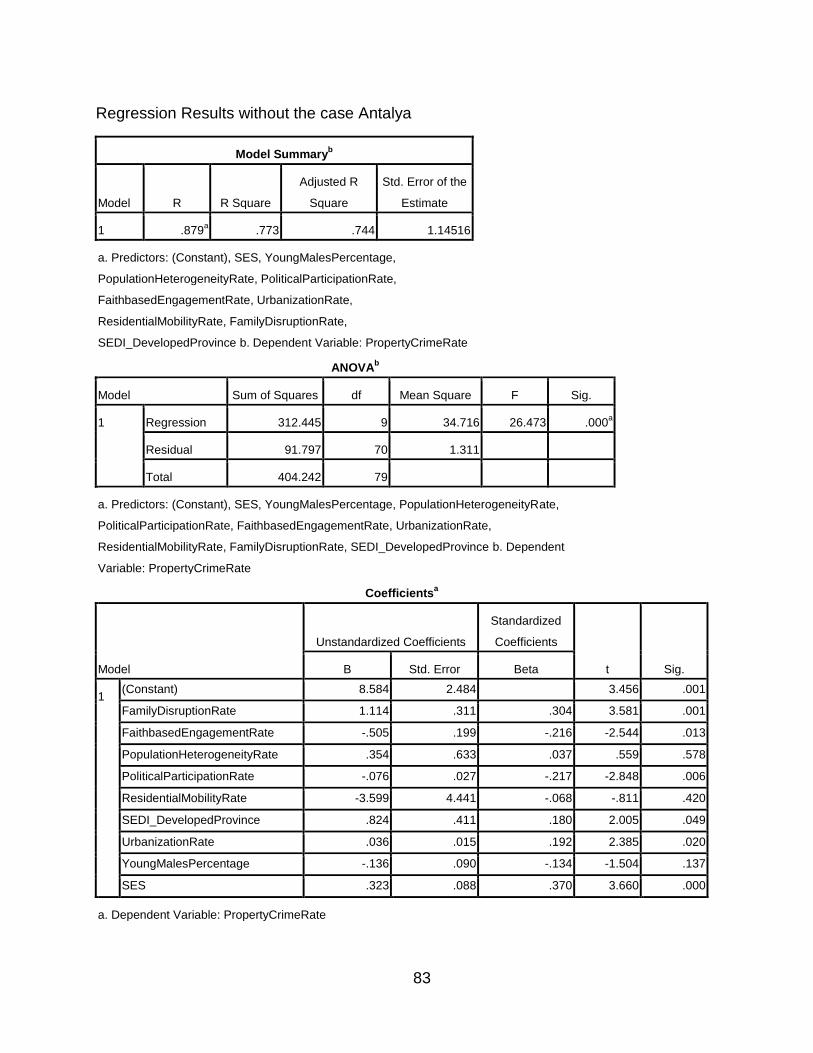
83
Regression Results without the case Antalya
Model Summaryb
Model R R Square
Adjusted R
Square
Std. Error of the
Estimate
1 .879a .773 .744 1.14516
a. Predictors: (Constant), SES, YoungMalesPercentage,
PopulationHeterogeneityRate, PoliticalParticipationRate,
FaithbasedEngagementRate, UrbanizationRate,
ResidentialMobilityRate, FamilyDisruptionRate,
SEDI_DevelopedProvince b. Dependent Variable: PropertyCrimeRate
ANOVAb
Model Sum of Squares df Mean Square F Sig.
1 Regression 312.445 9 34.716 26.473 .000a
Residual 91.797 70 1.311
Total 404.242 79
a. Predictors: (Constant), SES, YoungMalesPercentage, PopulationHeterogeneityRate,
PoliticalParticipationRate, FaithbasedEngagementRate, UrbanizationRate,
ResidentialMobilityRate, FamilyDisruptionRate, SEDI_DevelopedProvince b. Dependent
Variable: PropertyCrimeRate
Coefficientsa
Model
Unstandardized Coefficients
Standardized
Coefficients
t Sig. B Std. Error Beta
1 (Constant) 8.584 2.484 3.456 .001
FamilyDisruptionRate 1.114 .311 .304 3.581 .001
FaithbasedEngagementRate -.505 .199 -.216 -2.544 .013
PopulationHeterogeneityRate .354 .633 .037 .559 .578
PoliticalParticipationRate -.076 .027 -.217 -2.848 .006
ResidentialMobilityRate -3.599 4.441 -.068 -.811 .420
SEDI_DevelopedProvince .824 .411 .180 2.005 .049
UrbanizationRate .036 .015 .192 2.385 .020
YoungMalesPercentage -.136 .090 -.134 -1.504 .137
SES .323 .088 .370 3.660 .000
a. Dependent Variable: PropertyCrimeRate
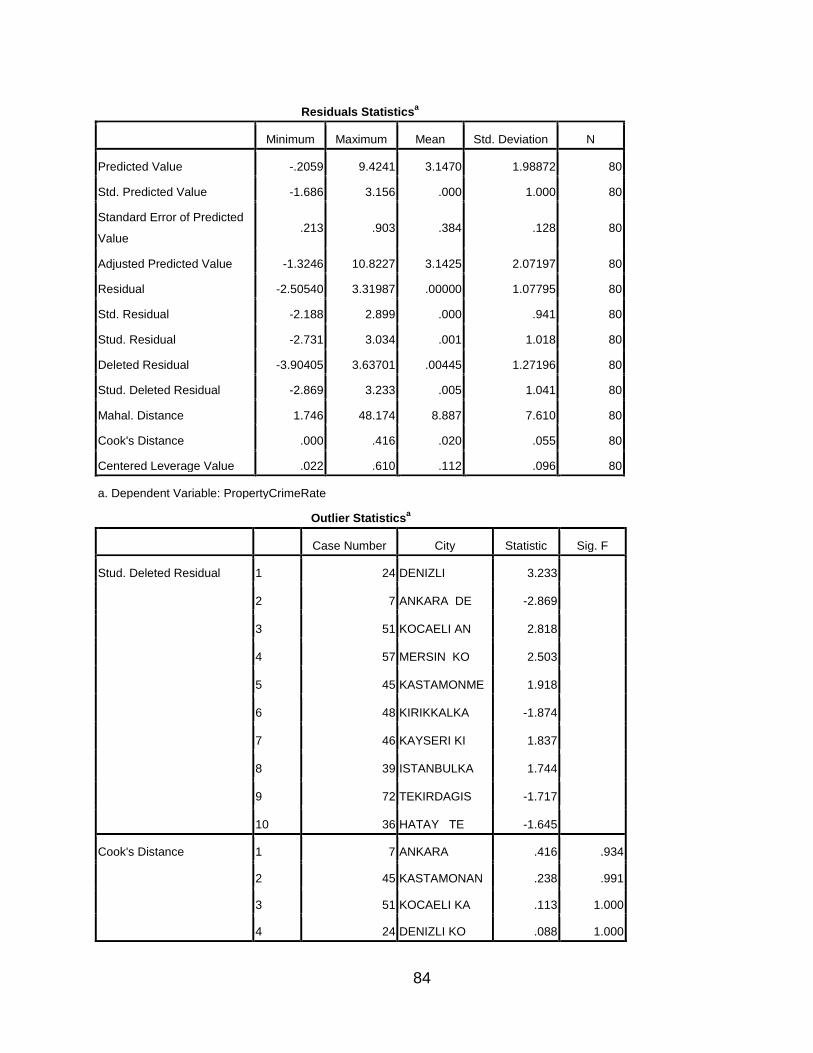
84
Residuals Statisticsa
Minimum Maximum Mean Std. Deviation N
Predicted Value -.2059 9.4241 3.1470 1.98872 80
Std. Predicted Value -1.686 3.156 .000 1.000 80
Standard Error of Predicted
Value .213 .903 .384 .128 80
Adjusted Predicted Value -1.3246 10.8227 3.1425 2.07197 80
Residual -2.50540 3.31987 .00000 1.07795 80
Std. Residual -2.188 2.899 .000 .941 80
Stud. Residual -2.731 3.034 .001 1.018 80
Deleted Residual -3.90405 3.63701 .00445 1.27196 80
Stud. Deleted Residual -2.869 3.233 .005 1.041 80
Mahal. Distance 1.746 48.174 8.887 7.610 80
Cook's Distance .000 .416 .020 .055 80
Centered Leverage Value .022 .610 .112 .096 80
a. Dependent Variable: PropertyCrimeRate
Outlier Statisticsa
Case Number City Statistic Sig. F
Stud. Deleted Residual 1 24 DENIZLI 3.233
2 7 ANKARA DE -2.869
3 51 KOCAELI AN 2.818
4 57 MERSIN KO 2.503
5 45 KASTAMONME 1.918
6 48 KIRIKKALKA -1.874
7 46 KAYSERI KI 1.837
8 39 ISTANBULKA 1.744
9 72 TEKIRDAGIS -1.717
10 36 HATAY TE -1.645
Cook's Distance 1 7 ANKARA .416 .934
2 45 KASTAMONAN .238 .991
3 51 KOCAELI KA .113 1.000
4 24 DENIZLI KO .088 1.000
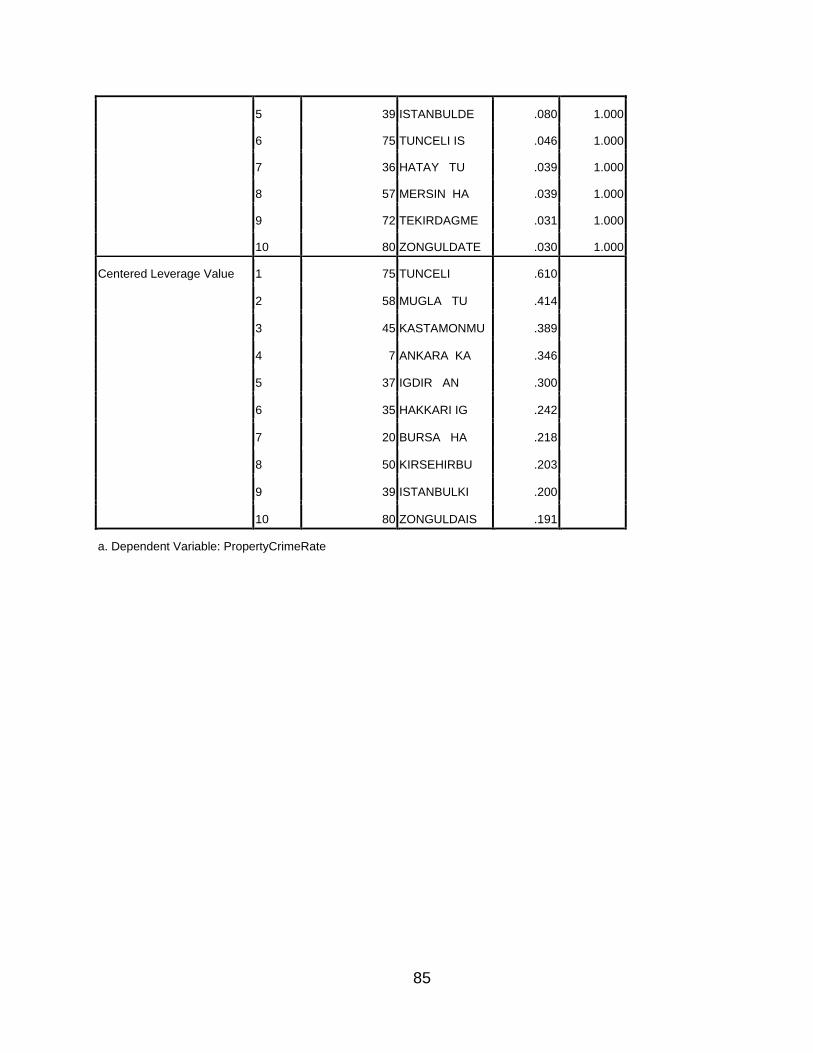
85
5 39 ISTANBULDE .080 1.000
6 75 TUNCELI IS .046 1.000
7 36 HATAY TU .039 1.000
8 57 MERSIN HA .039 1.000
9 72 TEKIRDAGME .031 1.000
10 80 ZONGULDATE .030 1.000
Centered Leverage Value 1 75 TUNCELI .610
2 58 MUGLA TU .414
3 45 KASTAMONMU .389
4 7 ANKARA KA .346
5 37 IGDIR AN .300
6 35 HAKKARI IG .242
7 20 BURSA HA .218
8 50 KIRSEHIRBU .203
9 39 ISTANBULKI .200
10 80 ZONGULDAIS .191
a. Dependent Variable: PropertyCrimeRate
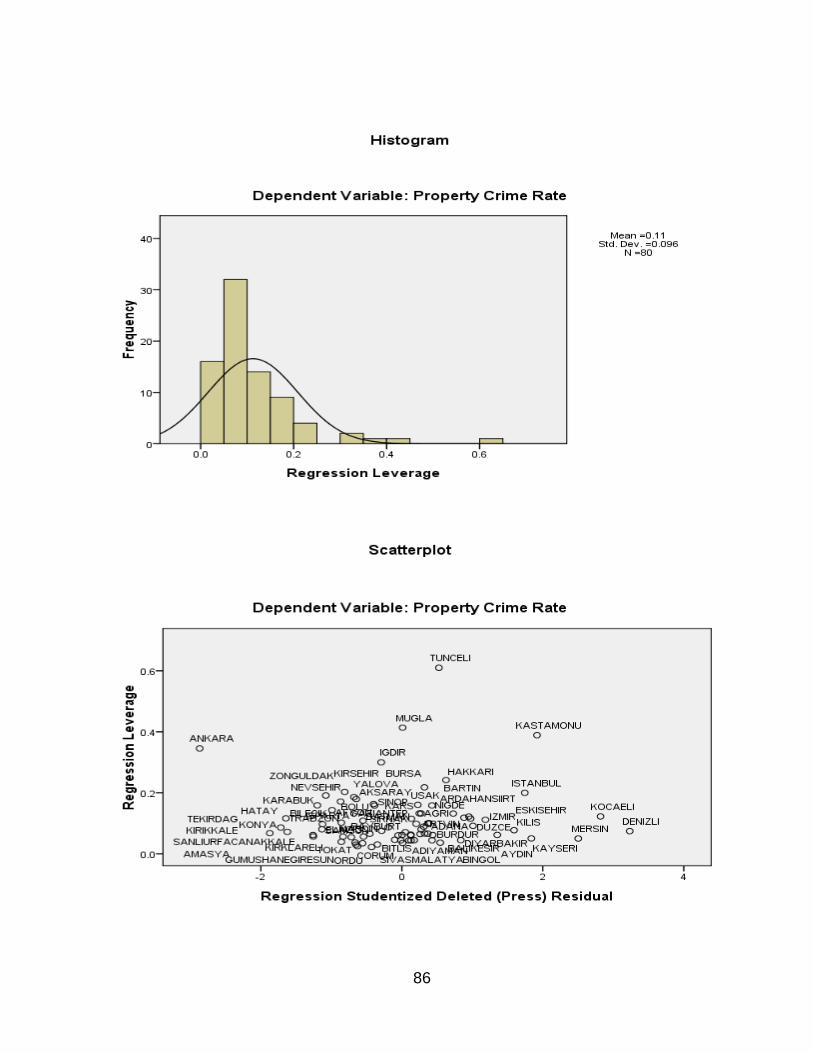
86
87
APPENDIX B
DIAGNOSES OF LINEARITY, NORMALITY AND HOMOSCEDASTICITY
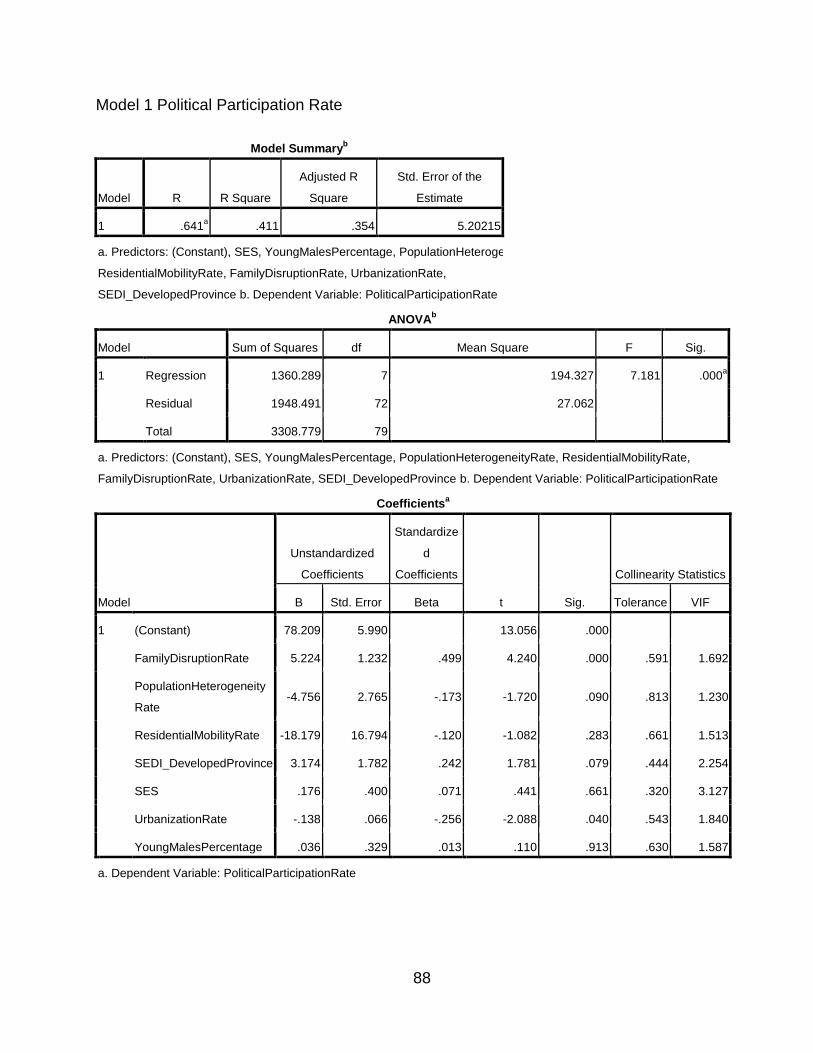
88
Model 1 Political Participation Rate
Model Summaryb
Model R R Square
Adjusted R
Square
Std. Error of the
Estimate
1 .641a .411 .354 5.20215
a. Predictors: (Constant), SES, YoungMalesPercentage, PopulationHeterogeneityRate,
ResidentialMobilityRate, FamilyDisruptionRate, UrbanizationRate,
SEDI_DevelopedProvince b. Dependent Variable: PoliticalParticipationRate
ANOVAb
Model Sum of Squares df Mean Square F Sig.
1 Regression 1360.289 7 194.327 7.181 .000a
Residual 1948.491 72 27.062
Total 3308.779 79
a. Predictors: (Constant), SES, YoungMalesPercentage, PopulationHeterogeneityRate, ResidentialMobilityRate,
FamilyDisruptionRate, UrbanizationRate, SEDI_DevelopedProvince b. Dependent Variable: PoliticalParticipationRate
Coefficientsa
Model
Unstandardized
Coefficients
Standardize
d
Coefficients
t Sig.
Collinearity Statistics
B Std. Error Beta Tolerance VIF
1 (Constant) 78.209 5.990
13.056 .000
FamilyDisruptionRate 5.224 1.232 .499 4.240 .000 .591 1.692
PopulationHeterogeneity
Rate -4.756 2.765 -.173 -1.720 .090 .813 1.230
ResidentialMobilityRate -18.179 16.794 -.120 -1.082 .283 .661 1.513
SEDI_DevelopedProvince 3.174 1.782 .242 1.781 .079 .444 2.254
SES .176 .400 .071 .441 .661 .320 3.127
UrbanizationRate -.138 .066 -.256 -2.088 .040 .543 1.840
YoungMalesPercentage .036 .329 .013 .110 .913 .630 1.587
a. Dependent Variable: PoliticalParticipationRate
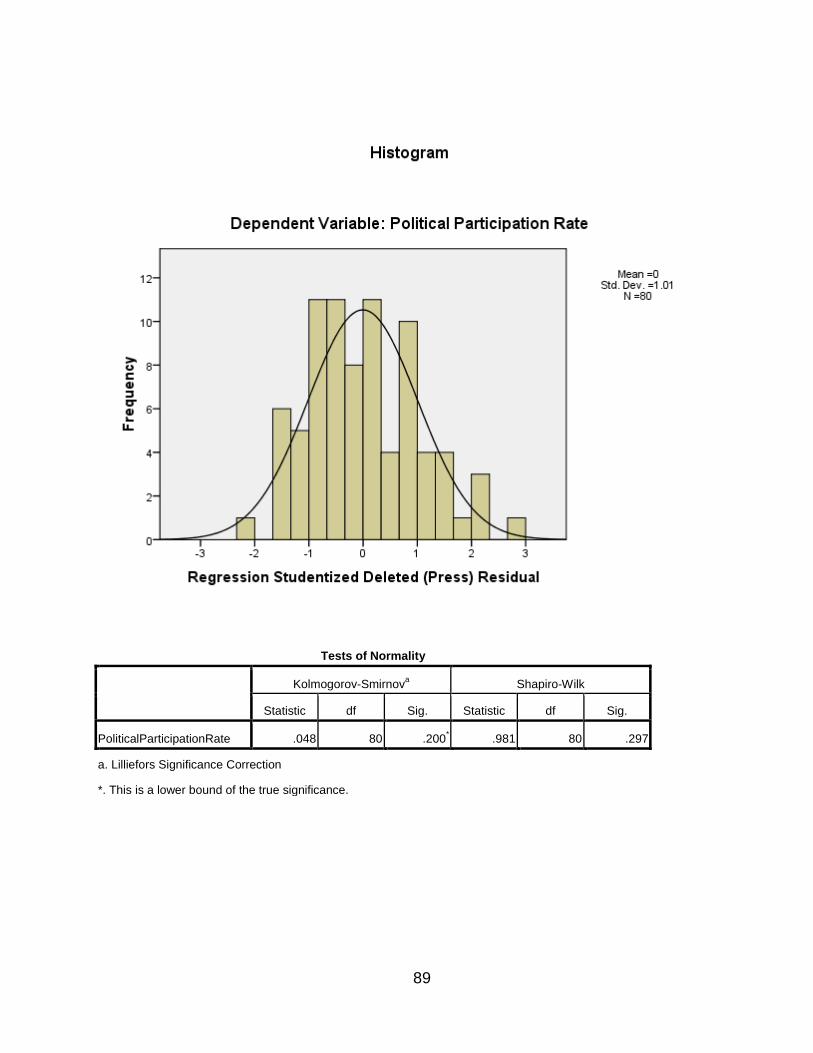
89
Tests of Normality
Kolmogorov-Smirnov
a Shapiro-Wilk
Statistic df Sig. Statistic df Sig.
PoliticalParticipationRate .048 80 .200* .981 80 .297
a. Lilliefors Significance Correction
*. This is a lower bound of the true significance.
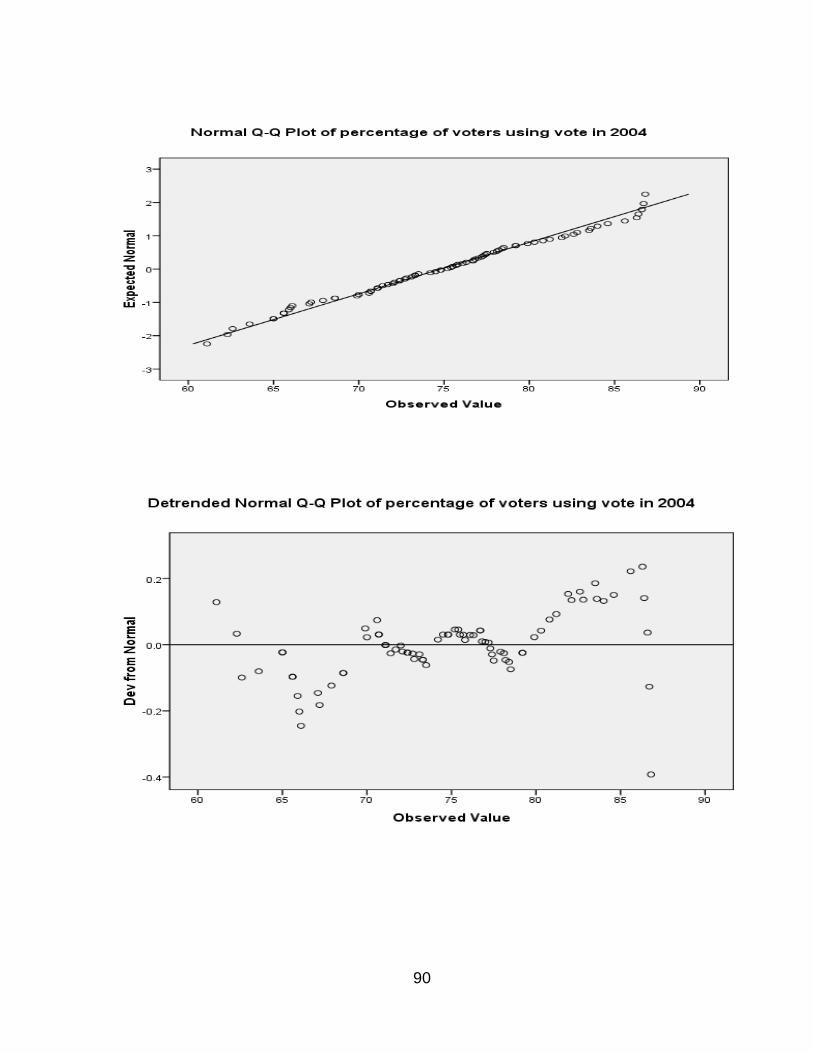
90
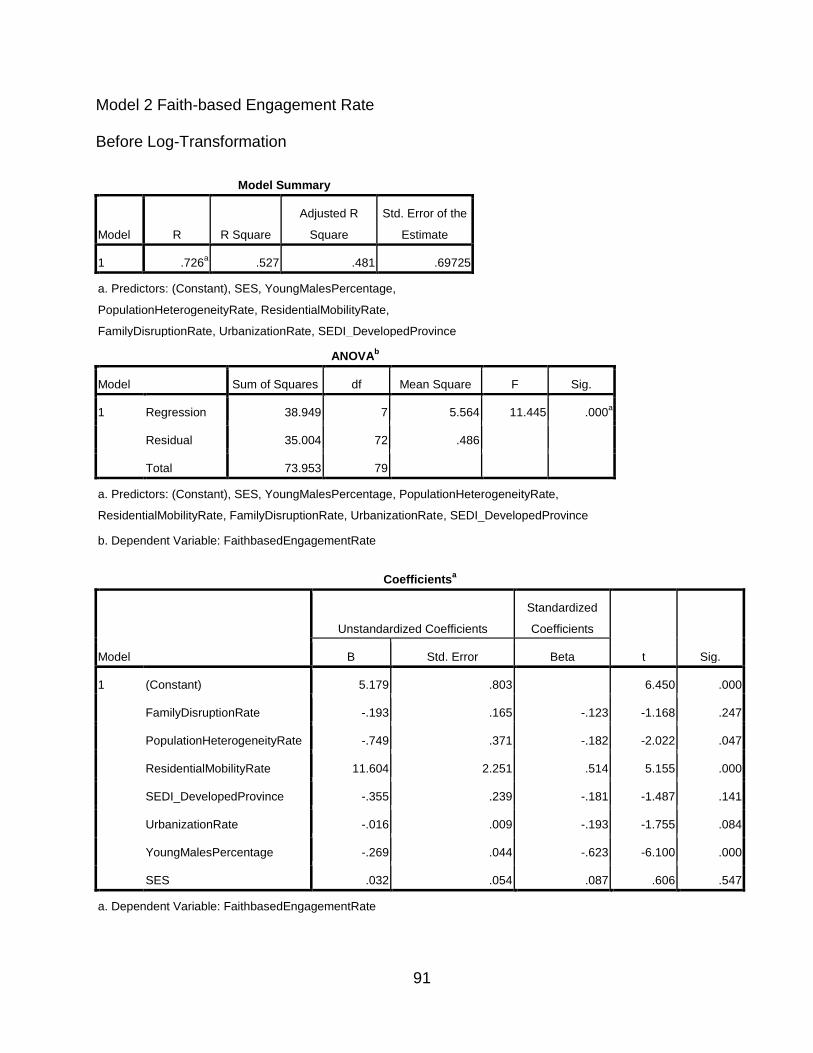
91
Model 2 Faith-based Engagement Rate
Before Log-Transformation
Model Summary
Model R R Square
Adjusted R
Square
Std. Error of the
Estimate
1 .726a .527 .481 .69725
a. Predictors: (Constant), SES, YoungMalesPercentage,
PopulationHeterogeneityRate, ResidentialMobilityRate,
FamilyDisruptionRate, UrbanizationRate, SEDI_DevelopedProvince
ANOVAb
Model Sum of Squares df Mean Square F Sig.
1 Regression 38.949 7 5.564 11.445 .000a
Residual 35.004 72 .486
Total 73.953 79
a. Predictors: (Constant), SES, YoungMalesPercentage, PopulationHeterogeneityRate,
ResidentialMobilityRate, FamilyDisruptionRate, UrbanizationRate, SEDI_DevelopedProvince
b. Dependent Variable: FaithbasedEngagementRate
Coefficientsa
Model
Unstandardized Coefficients
Standardized
Coefficients
t Sig. B Std. Error Beta
1 (Constant) 5.179 .803
6.450 .000
FamilyDisruptionRate -.193 .165 -.123 -1.168 .247
PopulationHeterogeneityRate -.749 .371 -.182 -2.022 .047
ResidentialMobilityRate 11.604 2.251 .514 5.155 .000
SEDI_DevelopedProvince -.355 .239 -.181 -1.487 .141
UrbanizationRate -.016 .009 -.193 -1.755 .084
YoungMalesPercentage -.269 .044 -.623 -6.100 .000
SES .032 .054 .087 .606 .547
a. Dependent Variable: FaithbasedEngagementRate
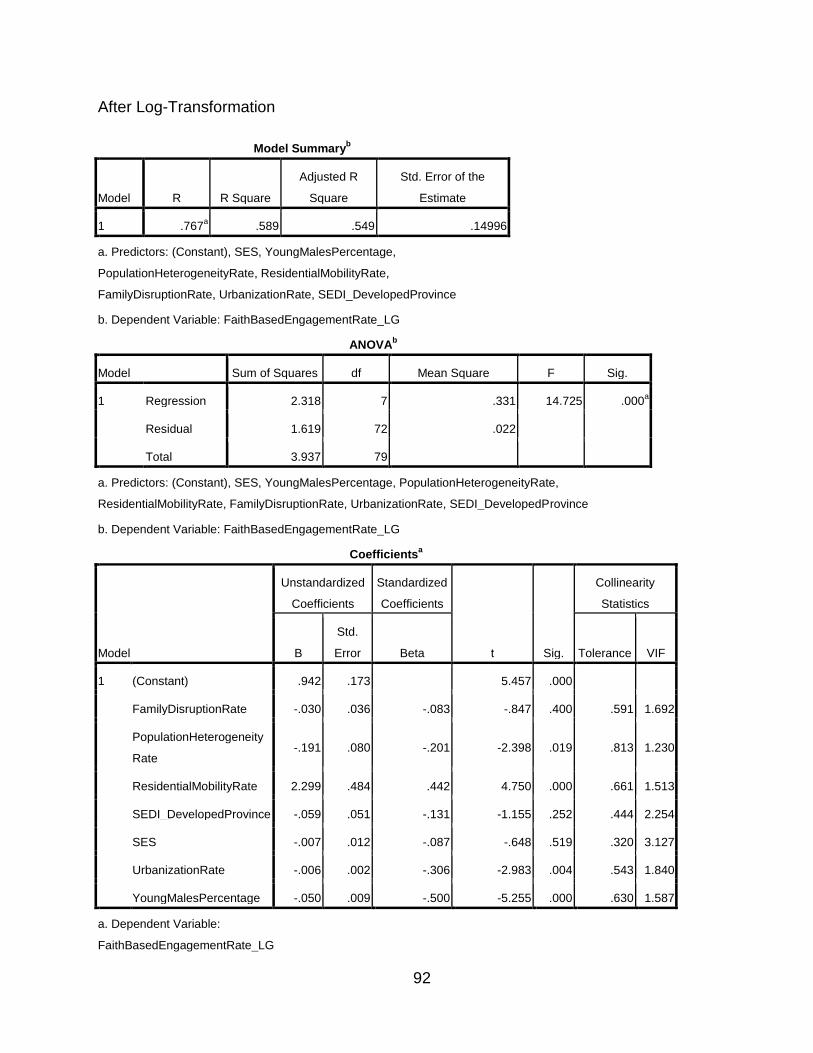
92
After Log-Transformation
Model Summaryb
Model R R Square
Adjusted R
Square
Std. Error of the
Estimate
1 .767a .589 .549 .14996
a. Predictors: (Constant), SES, YoungMalesPercentage,
PopulationHeterogeneityRate, ResidentialMobilityRate,
FamilyDisruptionRate, UrbanizationRate, SEDI_DevelopedProvince
b. Dependent Variable: FaithBasedEngagementRate_LG
ANOVAb
Model Sum of Squares df Mean Square F Sig.
1 Regression 2.318 7 .331 14.725 .000a
Residual 1.619 72 .022
Total 3.937 79
a. Predictors: (Constant), SES, YoungMalesPercentage, PopulationHeterogeneityRate,
ResidentialMobilityRate, FamilyDisruptionRate, UrbanizationRate, SEDI_DevelopedProvince
b. Dependent Variable: FaithBasedEngagementRate_LG
Coefficientsa
Model
Unstandardized
Coefficients
Standardized
Coefficients
t Sig.
Collinearity
Statistics
B
Std.
Error Beta Tolerance VIF
1 (Constant) .942 .173
5.457 .000
FamilyDisruptionRate -.030 .036 -.083 -.847 .400 .591 1.692
PopulationHeterogeneity
Rate -.191 .080 -.201 -2.398 .019 .813 1.230
ResidentialMobilityRate 2.299 .484 .442 4.750 .000 .661 1.513
SEDI_DevelopedProvince -.059 .051 -.131 -1.155 .252 .444 2.254
SES -.007 .012 -.087 -.648 .519 .320 3.127
UrbanizationRate -.006 .002 -.306 -2.983 .004 .543 1.840
YoungMalesPercentage -.050 .009 -.500 -5.255 .000 .630 1.587
a. Dependent Variable:
FaithBasedEngagementRate_LG
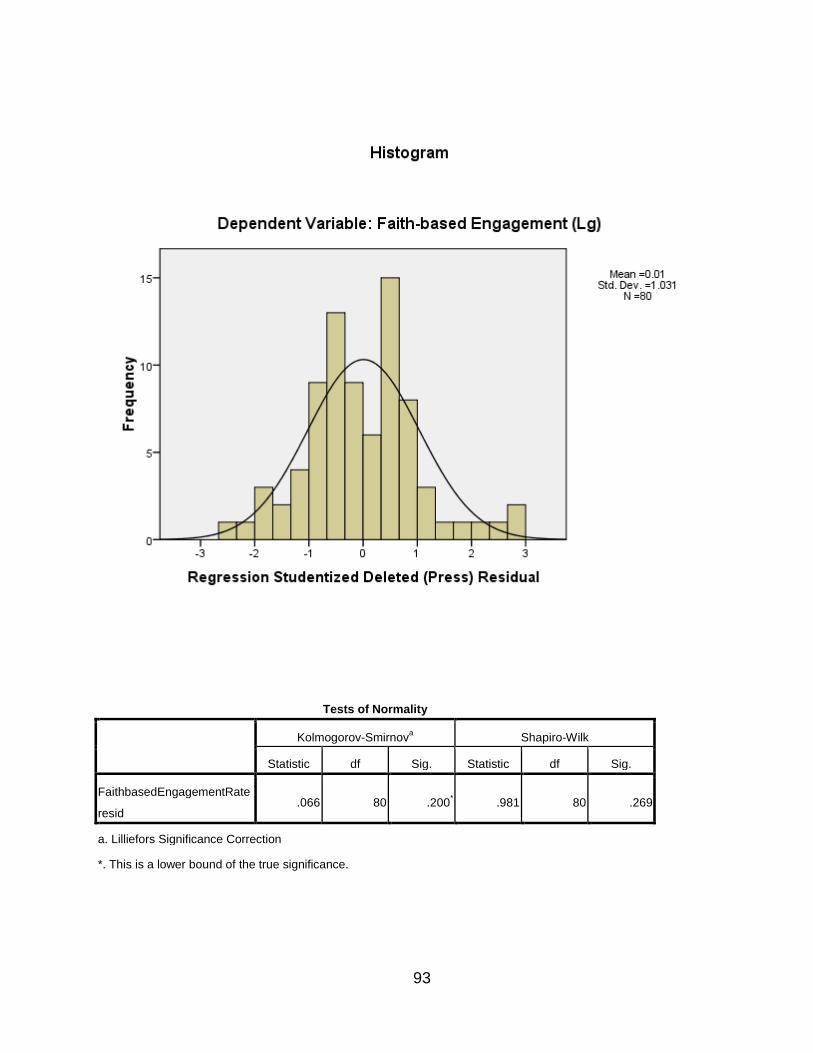
93
Tests of Normality
Kolmogorov-Smirnov
a Shapiro-Wilk
Statistic df Sig. Statistic df Sig.
FaithbasedEngagementRate
resid .066 80 .200
* .981 80 .269
a. Lilliefors Significance Correction
*. This is a lower bound of the true significance.
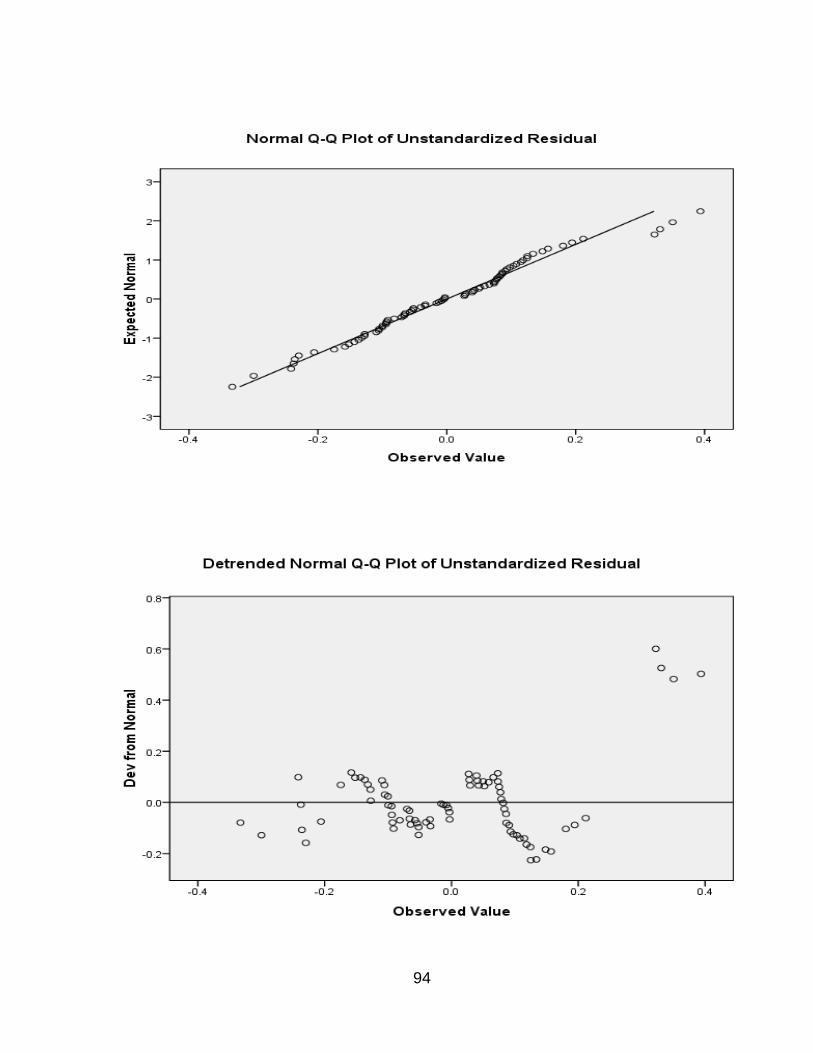
94
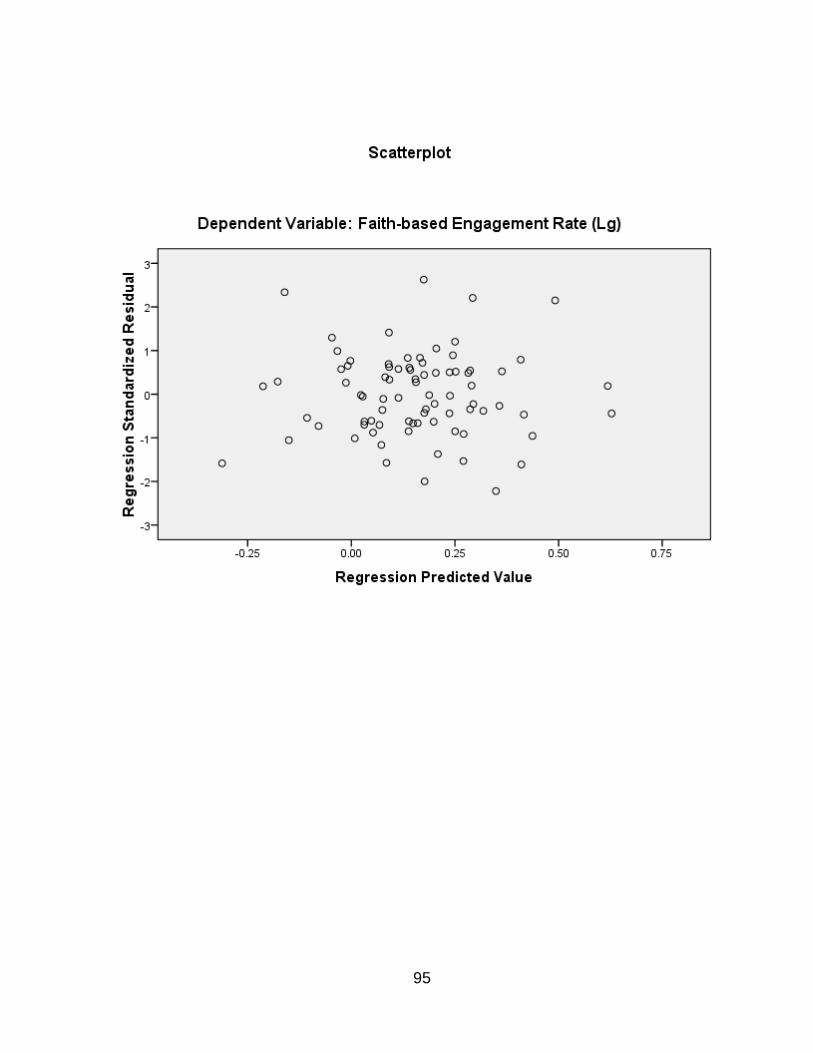
95
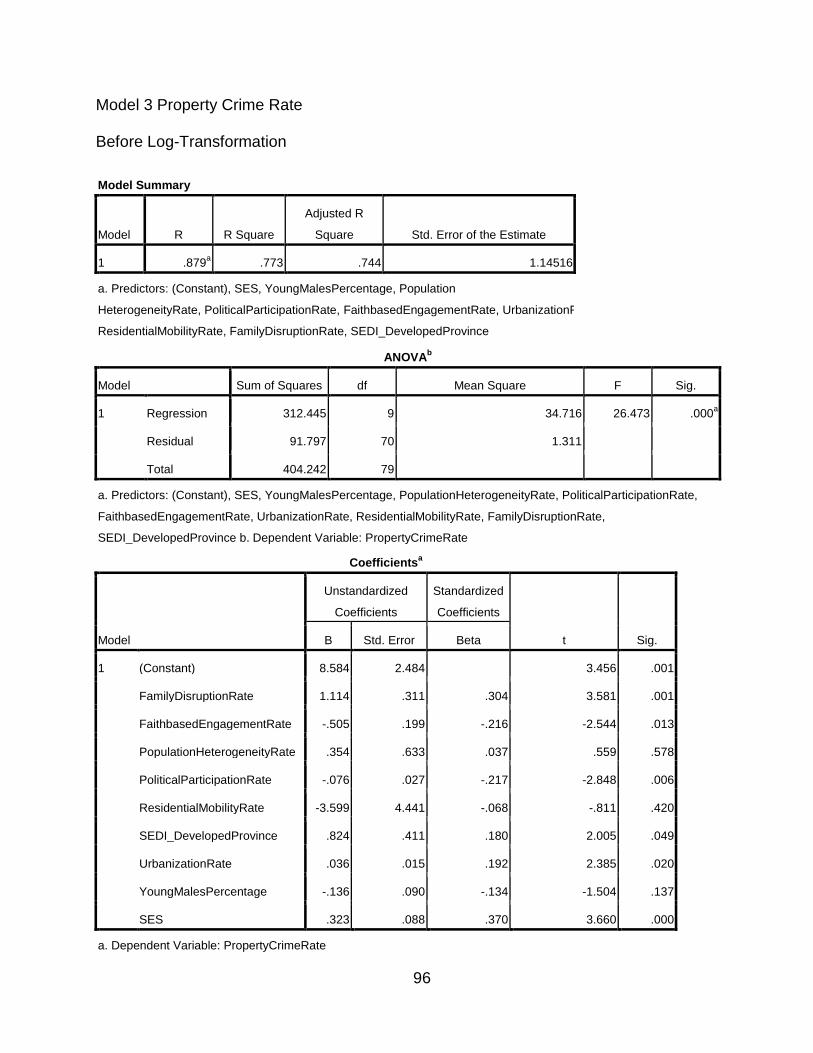
96
Model 3 Property Crime Rate
Before Log-Transformation
Model Summary
Model R R Square
Adjusted R
Square Std. Error of the Estimate
1 .879a .773 .744 1.14516
a. Predictors: (Constant), SES, YoungMalesPercentage, Population
HeterogeneityRate, PoliticalParticipationRate, FaithbasedEngagementRate, UrbanizationRate,
ResidentialMobilityRate, FamilyDisruptionRate, SEDI_DevelopedProvince
ANOVAb
Model Sum of Squares df Mean Square F Sig.
1 Regression 312.445 9 34.716 26.473 .000a
Residual 91.797 70 1.311
Total 404.242 79
a. Predictors: (Constant), SES, YoungMalesPercentage, PopulationHeterogeneityRate, PoliticalParticipationRate,
FaithbasedEngagementRate, UrbanizationRate, ResidentialMobilityRate, FamilyDisruptionRate,
SEDI_DevelopedProvince b. Dependent Variable: PropertyCrimeRate
Coefficientsa
Model
Unstandardized
Coefficients
Standardized
Coefficients
t Sig. B Std. Error Beta
1 (Constant) 8.584 2.484
3.456 .001
FamilyDisruptionRate 1.114 .311 .304 3.581 .001
FaithbasedEngagementRate -.505 .199 -.216 -2.544 .013
PopulationHeterogeneityRate .354 .633 .037 .559 .578
PoliticalParticipationRate -.076 .027 -.217 -2.848 .006
ResidentialMobilityRate -3.599 4.441 -.068 -.811 .420
SEDI_DevelopedProvince .824 .411 .180 2.005 .049
UrbanizationRate .036 .015 .192 2.385 .020
YoungMalesPercentage -.136 .090 -.134 -1.504 .137
SES .323 .088 .370 3.660 .000
a. Dependent Variable: PropertyCrimeRate
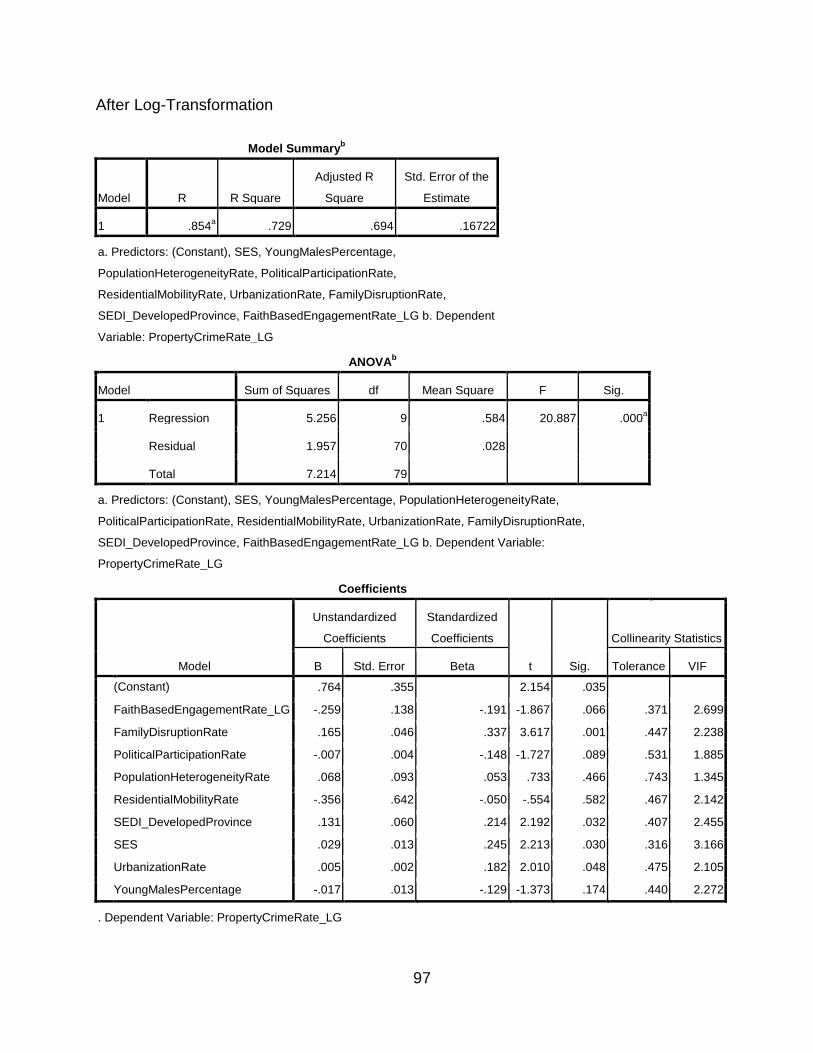
97
After Log-Transformation
Model Summaryb
Model R R Square
Adjusted R
Square
Std. Error of the
Estimate
1 .854a .729 .694 .16722
a. Predictors: (Constant), SES, YoungMalesPercentage,
PopulationHeterogeneityRate, PoliticalParticipationRate,
ResidentialMobilityRate, UrbanizationRate, FamilyDisruptionRate,
SEDI_DevelopedProvince, FaithBasedEngagementRate_LG b. Dependent
Variable: PropertyCrimeRate_LG
ANOVAb
Model Sum of Squares df Mean Square F Sig.
1 Regression 5.256 9 .584 20.887 .000a
Residual 1.957 70 .028
Total 7.214 79
a. Predictors: (Constant), SES, YoungMalesPercentage, PopulationHeterogeneityRate,
PoliticalParticipationRate, ResidentialMobilityRate, UrbanizationRate, FamilyDisruptionRate,
SEDI_DevelopedProvince, FaithBasedEngagementRate_LG b. Dependent Variable:
PropertyCrimeRate_LG
Coefficients
Model
Unstandardized
Coefficients
Standardized
Coefficients
t Sig.
Collinearity Statistics
B Std. Error Beta Tolerance VIF
(Constant) .764 .355 2.154 .035
FaithBasedEngagementRate_LG -.259 .138 -.191 -1.867 .066 .371 2.699
FamilyDisruptionRate .165 .046 .337 3.617 .001 .447 2.238
PoliticalParticipationRate -.007 .004 -.148 -1.727 .089 .531 1.885
PopulationHeterogeneityRate .068 .093 .053 .733 .466 .743 1.345
ResidentialMobilityRate -.356 .642 -.050 -.554 .582 .467 2.142
SEDI_DevelopedProvince .131 .060 .214 2.192 .032 .407 2.455
SES .029 .013 .245 2.213 .030 .316 3.166
UrbanizationRate .005 .002 .182 2.010 .048 .475 2.105
YoungMalesPercentage -.017 .013 -.129 -1.373 .174 .440 2.272
. Dependent Variable: PropertyCrimeRate_LG
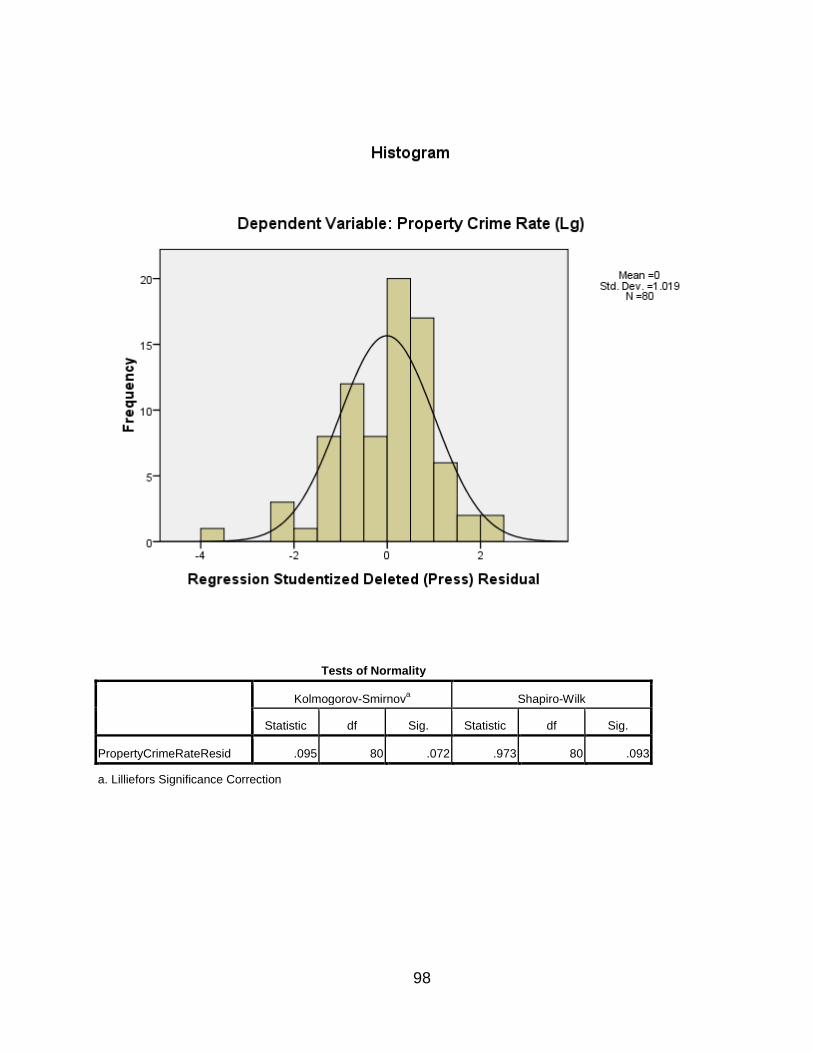
98
Tests of Normality
Kolmogorov-Smirnov
a Shapiro-Wilk
Statistic df Sig. Statistic df Sig.
PropertyCrimeRateResid .095 80 .072 .973 80 .093
a. Lilliefors Significance Correction
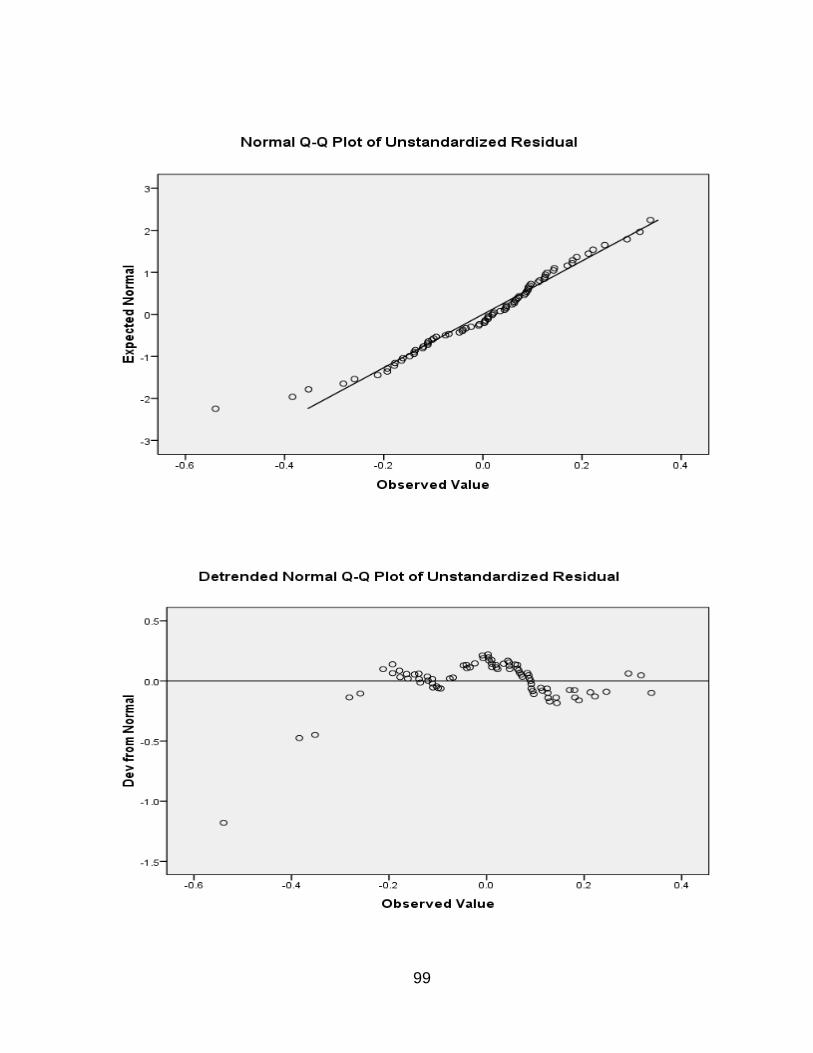
99
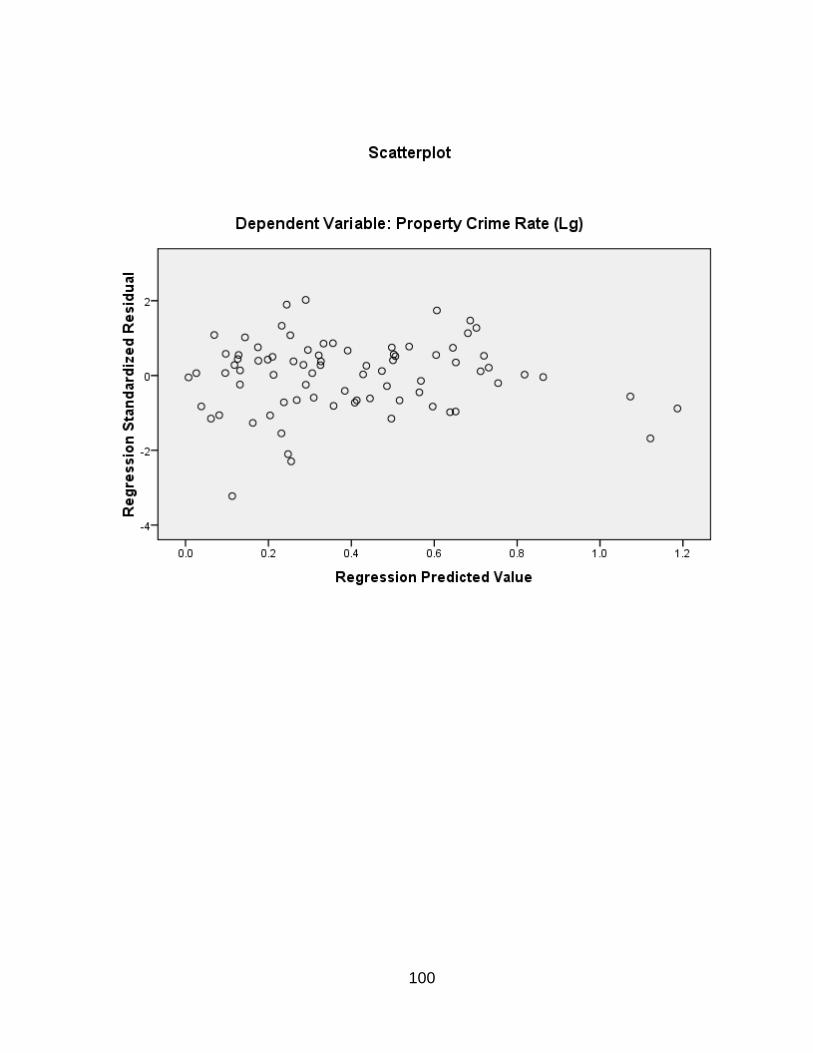
100
101
REFERENCES
Akcomak, S. & Weel, B. (2008). The impact of social capital on crime: Evidence from
the Netherlands. IZA Discussion Paper No. 3603. Retrieved November, 9, 2010
from http://ssrn.com/abstract=1214909 or doi:10.1111/j.0042-7092.2007.00700.x.
Akyuz, K., & Armstrong, T. (2011). Understanding the sociostructural correlates of terrorism
in Turkey. International Criminal Justice Review, 21(2), 134.
Allison, P.D. (1999). Multiple regression: A primer. Thousand Oaks, CA: Sage.
Altay, A. (2007). Türkiye’de mala karsi suçlar ve bu suçlari isleyenlerin sosyo-kültürel ve
ekonomik özellikleri [Property crimes in Turkey and socio-economic and cultural
characteristics of offenders of property crimes]. Master’s thesis, Polis Akademisi,
Ankara.
Andresen, M. A. (2009). Crime in Lithuania: The impact of accession to the European
Union. European Journal of Criminology, 6(4), 24.
Aslan, A. (2008). Türkiye’de suç oranlari sürekliliğinin analizi, Munich Personal RePEch
Archive (MPRA), No. 10610, [Continuity analysis of crime rates in Turkey]. Retrieved
April 9, 2011 from http://mpra.ub.uni-muenchen.de/10610/.
Bahar, H. I. & Fert, I. (2008). The debate over recent recorded crime in Turkey. International
Journal of Social Inquiry, 1(1), 89-104.
Baller, R. D., Anselin, L., Messner, S. F., Deane, G., & Hawkins, D. F. (2001). Structural
covariates of US county homicide rates: Incorporating spatial effects. Criminology,
39(3), 561-588.
102
Baron, R. M., & Kenny, D. A. (1986). The moderator–mediator variable distinction in social
psychological research: Conceptual, strategic, and statistical considerations. Journal of
Personality and Social Psychology, 51(6), 1173.
Basibuyuk, O. (2008). Social (dis)organization and terror related crimes in Turkey.
Doctoral dissertation, University of North Texas, Denton, TX.
Becker, G. S. (1962). Investment in human capital: A theoretical analysis. Journal of
Political Economy, 70(5), 9-49.
Becker, G. S., & Murphy, K. M. (2000). Social economics: Market behavior in a social
environment. England: Harvard University Press.
Bellair, P. E. (1997). Social interaction and community crime: Examining the importance of
neighbor networks. Criminology, 35, 677.
Beyerlein, K., & Hipp, J. R. (2006). Social capital, too much of a good thing? American
religious traditions and community crime. Social Forces, 84(2), 995-1013.
Bursik, R. J. (1988). Social disorganization and theories of crime and delinquency:
Problems and prospects. Criminology, 26, 519-552.
Bursik, R. J. (1999). The informal control of crime through neighborhood networks.
Sociological Focus, 32(1), 85-97.
Bursik, R. J. & Grasmick, H.G. (1993). Neighborhoods and crime: The dimensions of
effective community control. New York: Lexington Books.
Buonanno, P., Pasini G. & Vanin, P. (2006). Does social capital reduce crime?
Working Papers 0605, University of Bergamo, Department of Economics.
Retrieved October, 9, 2009 from http://www.decon.unipd.it/assets/pdf/wp/20060029.pdf
103
Chamlin, M. B. & John K. Cochran. (1995). Assessing Messner and Rosenfeld’s institutional
anomie theory: A partial test. Criminology, 33, 411-429.
Cole, J. H., & Gramajo, A. M. (2009). Homicide rates in a cross-section of countries:
Evidence and interpretations. Population and Development Review, 35(4), 749-776.
Coleman, J. S. (1988). Social capital in the creation of human capital. American Journal of
Sociology, 94(1), 95-120.
Coleman, S. (2002). A test for the effect of conformity on crime rates using voter turnout.
Sociological Quarterly, 43(2), 257-276.
Cömertler, N. & Kar, M. (2007). Türkiye’de suç oraninin sosyo-ekonomik belirleyicileri: Yatay
kesit analizi. [Socio-economic determinants of crime rates in Turkey: Cross-sectional
analysis] Ankara Üniversitesi SBF Dergisi, 62(2), 37-57.
Dincer B., Özaslan M. & Kavasoğlu, T. (2003). İllerin ve bölgelerin sosyo-ekonomik
gelişmişlik siralamasi araştirmasi. [Study of socio-economic development ranking of
provinces and regions]. Ankara: DPT-BGYUGM.
Feinberg, S. L., Browning, C. R., & Dietz, R. D. (2005). The paradox of social organization:
Networks, collective efficacy, and violent crime in urban neighborhoods. Social Forces,
83(2), 503-534.
Fert, I. (2007). Sosyal politika ve suç ilişkisi ülkemiz suç profili açisindan genel bir
değerlendirme. [Social policy and crime – A general evaluation of crime profiles]
Doctoral dissertation, Dokuz Eylul Universitesi, Izmir.
Galea, S., Karpati, A. & Kennedy, B. (2002). Social capital and violence in the United
States, 1974-1993. Social Science & Medicine, 55(8), 1373-1383.
104
Gartner, R. (1990). The victims of homicide: A temporal and cross-national comparison.
American Sociological Review, 92.
Guclu, I. (2010). The function of social structure in controlling violent crime in Turkey.
Doctoral dissertation, University of North Texas, Denton, TX.
Günal V. & Şahinalp, M. S. (2009). Şanlıurfa şehrindeki hirsizlik suçlarinin
mekansal analizi [A spatial analysis of theft crimes in Şanlıurfa city]. Polis Bilimleri
Dergisi, 11 (1).
Henderson, J. V., & Wang, H. G. (2007). Urbanization and city growth: The role of
institutions. Regional Science and Urban Economics, 37(3), 283-313.
Howard, G.J., Newman, G., & Pridemore, W.A. (2000). Theory, method, and data in
comparative criminology. Criminal Justice, 4, 139-211.
Hawdon, J. (2008). Legitimacy, trust, social capital, and policing styles. Police Quarterly,
11(2), 182.
Karakus, O. (2008). A quantitative analysis of growing business of organized crime:
Structural predictors of cross-national distribution of human trafficking markets and
trafficking women in Turkey. Doctoral dissertation, Michigan State University, MI.
Kose, Y. (2010). Social (dis)organization and organized crime in Turkey. Doctoral
dissertation, University of Texas at Dallas, TX.
LaFree, G., & Tseloni, A. (2006). Democracy and crime: A multilevel analysis of homicide
trends in forty-four countries, 1950-2000. Annals of the American Academy of Political
and Social Science, 605(1), 25.
105
Land, K. C., McCall, P. L., & Cohen, L. E. (1990). Structural covariates of homicide rates:
Are there any invariances across time and social space? American Journal of
Sociology, 95(4), 922-963.
Lederman D., Loayza, N. & Menéndez, A. M. (2002). Violent crime: Does social capital
matter? Economic Development and Cultural Change, 50, 509–539.
Li, De. (1995). Economic development, social control, and murder rates: A cross-national
approach. Cross Cultural Research, 29, 361-382.
Lowenkamp, C.T., Cullen, F.T. & Pratt, T.C. (2003). Replicating Sampson and Groves's test
of social disorganization theory: Revisiting a criminological classic. Journal of Research
in Crime and Delinquency, 40 (4), 351-373.
MacKinnon, D. P., Fairchild, A. J., & Fritz, M. S. (2007). Mediation analysis. Annual Review
of Psychology, 58, 593.
Maume, M. O. & Lee, M. R. (2003). Social institutions and violence: A sub-national test of
institutional anomie theory. Criminology, 41, 1137-1172.
Maxfield, M. G., & Babbie, E. R. (2008). Research methods for criminal justice and
criminology (5th ed.). Belmont, CA: Wadsworth Pub.
Menard, S. (2010). Logistic regression: From introductory to advanced concepts and
applications. Thousand Oaks, CA: Sage.
Mertler, C. A. & Vannatta, R. A. (2005). Advanced and multivariate statistical methods:
Practical application and interpretation (3rd ed.). Los Angeles: Pyrczak Publishing.
Messner, S. F., & Sampson, R. J. (1991). The sex ratio, family disruption, and rates of
violent crime: The paradox of demographic structure. Social Forces, 69(3), 693-713.
106
Messner, S. F., Rosenfeld, R., & Baumer, E. P. (2004). Dimensions of social capital and
rates of criminal homicide. American Sociological Review, 69(6), 882.
Morenoff, J. D., Sampson, R. J., & Raudenbush, S.W. (2001). Neighborhood inequality,
collective efficacy, and the spatial dynamics of urban violence. Criminology, 39, 517-
560.
Ochsen, C. (2010). Crime and labor market policy in Europe. International Review of Law
and Economics, 30(1), 52-61.
Önder, Z., & Özyıldırım, S. (2010). Banks, regional development disparity and growth:
Evidence from Turkey. Cambridge Journal of Economics, 34(6), 975.
Osgood, D. W., & Chambers, J. M. (2000). Social disorganization outside the metropolis: An
analysis of rural youth violence. Criminology, 38(1), 81-116.
Park, R. E. (1952). Human communities: The city and human ecology. Glencoe: The Free
Press.
Pazarlıoğlu, M. V. & Turgutlu, T. (2007). Gelir, işsizlik ve suç: Türkiye örneği. 8. Türkiye
Ekonometri ve Istatistik Kongresi, 24-25 Mayıs 2007, [Income, unemployment and
crime: Econometrics and Statistics Conference, Turkey, 24-25 May 2007]. İnönü
Üniversitesi, Malatya.
Portes, A. (1998). Social capital: Its origins and applications in modern sociology. Annual
Review of Sociology, 24(1).
Pratt, T. C., & Cullen, F. T. (2005). Assessing macro-level predictors and theories of crime:
A meta-analysis. Crime and Justice, 32(1), 373-450.
Putnam, R. D. (1993). The prosperous community: Social capital and public life. American
Prospect, 13(4), 35-42.
107
Putnam, R. D. (1995). Tuning in, tuning out: The strange disappearance of social capital in
America. Political Science and Politics, 28(4), 664-683.
Putnam, R.D. (2000). Bowling alone: The collapse and revival of American
community. New York: Simon & Schuster.
Rose, D. R. (2000). Social disorganization and parochial control: Religious institutions and
their communities. Sociological Forum, 15, 339-358.
Rosenfeld R., Messner S. F. & Baumer E.P. (2001). Social capital and homicide. Social
Forces, 80(1), 283-309.
Rubington E. & Weinberg M. S. (2010). The study of social problems: Seven
perspectives (7th ed.). New York: Oxford University Press.
Sampson, R. J. (1987). Urban black violence: The effect of male joblessness and family
disruption. American Journal of Sociology, 93(2), 348-382.
Sampson, R. J. (2006). Collective efficacy theory, In F.T. Cullen, J.P. Wright, and K.R.
Blevins (Ed.), Taking stock (pp. 149-168). New Brunswick: Transaction.
Sampson R. J. & Groves W. B. (1989). Community structure and crime: Testing
social disorganization theory. American Journal of Sociology, 94(4),774-802.
Sampson, R. J., & Raudenbush, S. W. (1999). Systematic social observation of public
spaces: A new look at disorder in urban neighborhoods. American Journal of
Sociology, 105(3), 603-651.
Sampson, R. J., Raudenbush, S. W., & Earls, F. (1997). Neighborhoods and violent
crime: A multilevel study of collective efficacy. Science, 277, 918–924.
Sampson, R. J., Morenoff, J. D., & Earls, F. (1999). Beyond social capital: Spatial
dynamics of collective efficacy. American Sociological Review, 64, 633-660.
108
Schoepfer, A. & Piquero, N.L. (2006). Exploring white-collar crime and the American dream:
A partial test of institutional anomie theory. Journal of Criminal Justice, 34, 227-235.
Shah, A. (2010). Further evidence for epidemiological transition hypothesis for elderly
suicides. Journal of Injury and Violence Research, 3(1), 29-34.
Shaw, C. R. & McKay, H. D. (1942). Juvenile delinquency and urban areas. Chicago:
University of Chicago Press.
Smith, D. A., & Jarjoura, G. R. (1988). Social structure and criminal victimization. Journal of
Research in Crime and Delinquency, 25(1), 27.
Skogan, W. G. (1975). Measurement problems in official and survey crime rates. Journal of
Criminal Justice, 3(1), 17-31.
Tabachnick, B., & Fidell, L. (2007). Using multivariate statistics (5th ed.). Boston, MA: Allyn
and Bacon.
Turkish Penal Code (2004). Retrieved April, 27, 2011 from
http://www.tbmm.gov.tr/kanunlar/k5237.html.
TurkStat (2010). Regional statistics. Retrieved October, 10, 2010 from
http://tuikapp.tuik.gov.tr/Bolgesel/sorguSayfa.do?target=tablo.
Veysey B. M. & Messner, S. F. (1999). Further testing of social disorganization
theory: An elaboration of Sampson and Groves's community structure and
crime. Journal of Research in Crime and Delinquency, 36 (2), 156-174.
Warner, B. D. (1999). Whither poverty? Social disorganization theory in an era of urban
transformation. Sociological Focus, 32(1), 99-113.
Warner, R. M. (2008). Applied statistics: From bivariate through multivariate techniques. Los
Angeles: Sage.