Embed Size (px)
Citation preview
Can technology and productivity save the day?
James Manyika
Extracts from McKinsey Global Institute research
1
A brief history of economic
growth and prosperity
2
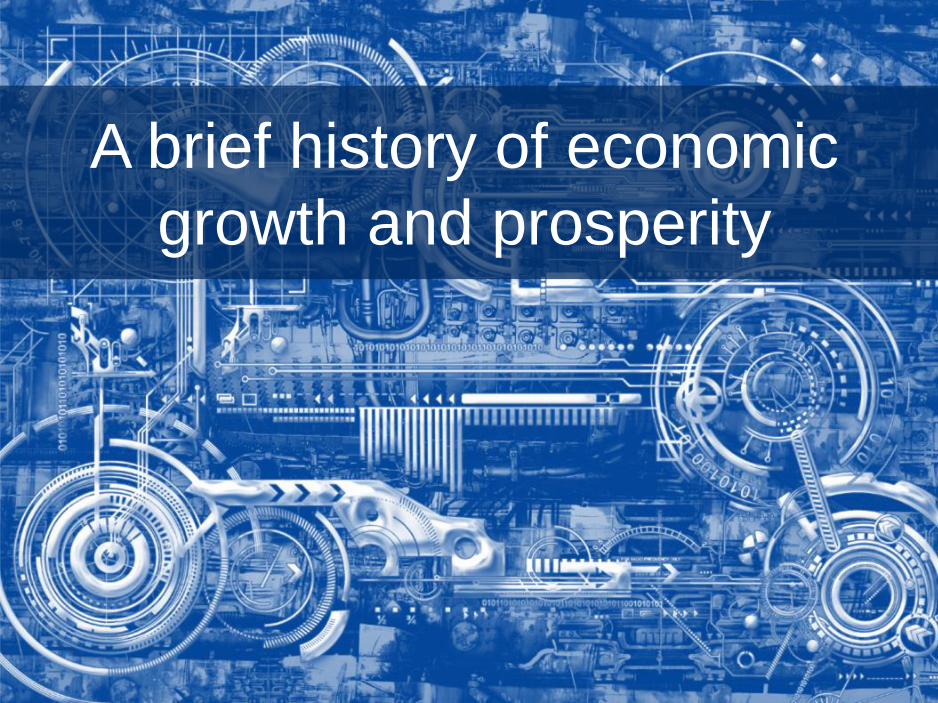
Estimated Global GDP per capita, real USD
Since 1750, the world has experienced an unprecedented rise in economic growth, fueled by innovation
0
1,000
2,000
3,000
4,000
5,000
6,000
7,000
8,000
9,000
10,000
50 1600 17002001000 150 1550 200019001800 19501750 18501650
SOURCE: Angus Maddison's "World Population, GDP and Per Capita GDP, 1-2003 AD”; Projection based on Global
Insight economic data; WIPO IP Statistics
Printing
press
Efficient
steam
engine
Mass
steel
Internet &
world wide web
First steam
engine
Internal
combustion
engine
1450
TODAY
1769 18551698 1860 1970s – 80s
Technology
Advancements
3
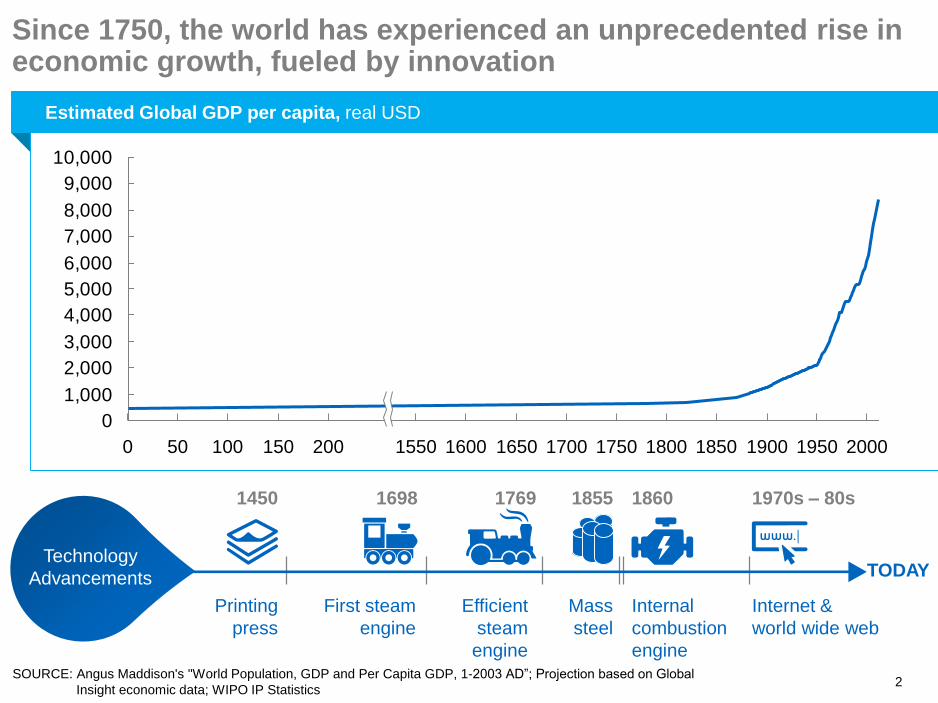
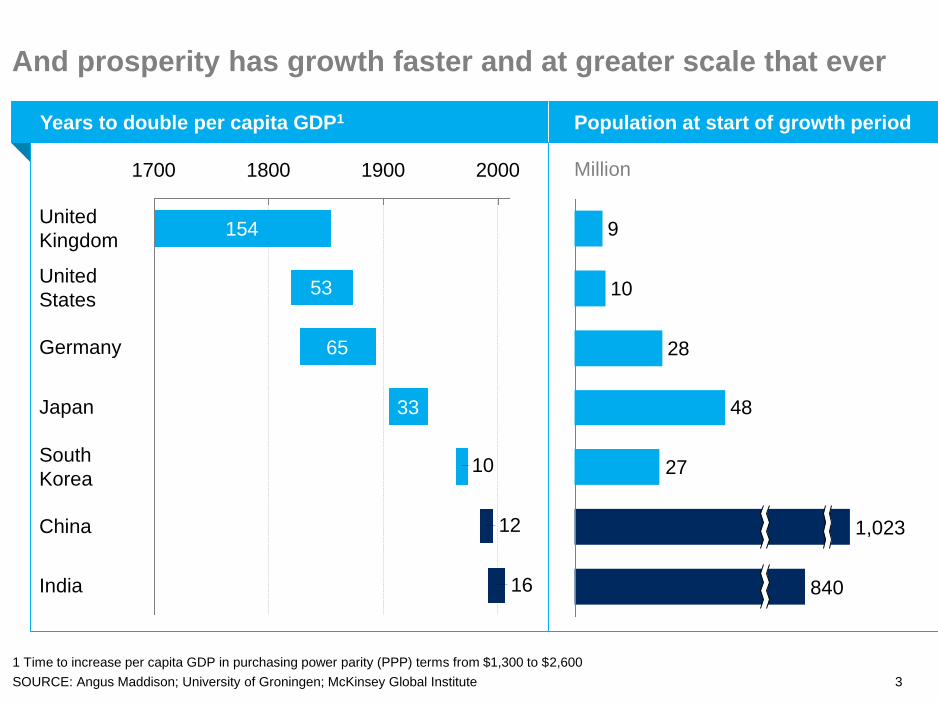
And prosperity has growth faster and at greater scale that ever
154
53
65
33
16
12
10
1700 1800 1900 2000
India
China
South
Korea
Japan
Germany
United
States
United
Kingdom
SOURCE: Angus Maddison; University of Groningen; McKinsey Global Institute
1 Time to increase per capita GDP in purchasing power parity (PPP) terms from $1,300 to $2,600
27
48
28
10
9
1,023
840
Million
Years to double per capita GDP1 Population at start of growth period
4
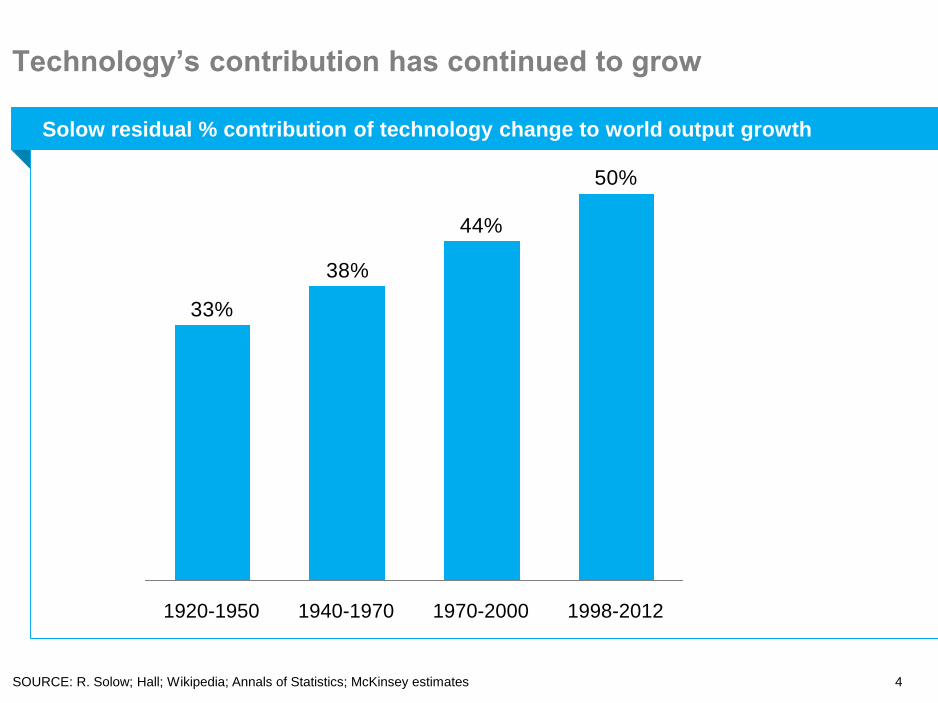
Technology’s contribution has continued to grow
SOURCE: R. Solow; Hall; Wikipedia; Annals of Statistics; McKinsey estimates
Solow residual % contribution of technology change to world output growth
50%
44%
38%
33%
1970-20001920-1950 1940-1970 1998-2012
5
More transformational
technologies on the way(the next decade+)
6
▪ By 2029, 11 petabytes of storage will be available for $100
▪ In the next 10 years, we will see a 20-time increase in home networking speeds.
▪ By 2013, wireless network traffic will reach 400 petabytes a month.
▪ By the end of 2010, there will be a billion transistors per human—each costing one ten-millionth of a cent.
▪ The Internet will evolve to perform instantaneous communication, regardless of distance.
▪ The first commercial quantum computer will be available by mid-2020.
▪ By 2020, a $1,000 personal computer will have the raw processing power of a human brain.
▪ By 2030, it will take a village of human brains to match a $1,000 computer.
▪ By 2050 (assuming a global population of 9 billion), $1,000 worth of computing power will equal the processing power of all human
brains on earth.
▪ Today, we know 5 percent of what we will know in 50 years. In other words, in 50 years, 95 percent of what we will know will have
been discovered in the past 50 years.
▪ The world’s data will increase sixfold in each of the next two years, while corporate data will grow fiftyfold.
▪ By 2015, Google will index approximately 775 billion pages of content.
▪ By 2015, we will create the equivalent of 92.5 million Libraries of Congress in one year.
▪ By 2020 worldwide, the average person will maintain 130 terabytes of personal data (today it is ~128 gigabytes).
▪ By 2015, movie downloads and peer-to-peer file sharing will explode to 100 exabytes, equivalent to 5 million Libraries of Congress.
▪ By 2015, video calling will be pervasive, generating 400 exabytes of data—the equivalent of 20 million Libraries of Congress.
▪ By 2015, the phone, web, email, photos, and music will explode to generate 50 exabytes of data.
▪ Within two years, information on the Internet will double every 11 hours.
▪ By 2010, 35 billion devices will be connected to the Internet (nearly six devices per person on the planet).
▪ By 2020, there will be more devices than people online.
▪ With IPv6, there will be enough addresses for every star in the known universe to have 4.8 trillion addresses.
▪ By 2020, universal language translation will be commonplace in every device.
▪ In the next five years, any surface will become a display.
▪ By 2025, teleportation at the particle level will begin to occur.
▪ By 2030, artificial implants for the brain will take place.
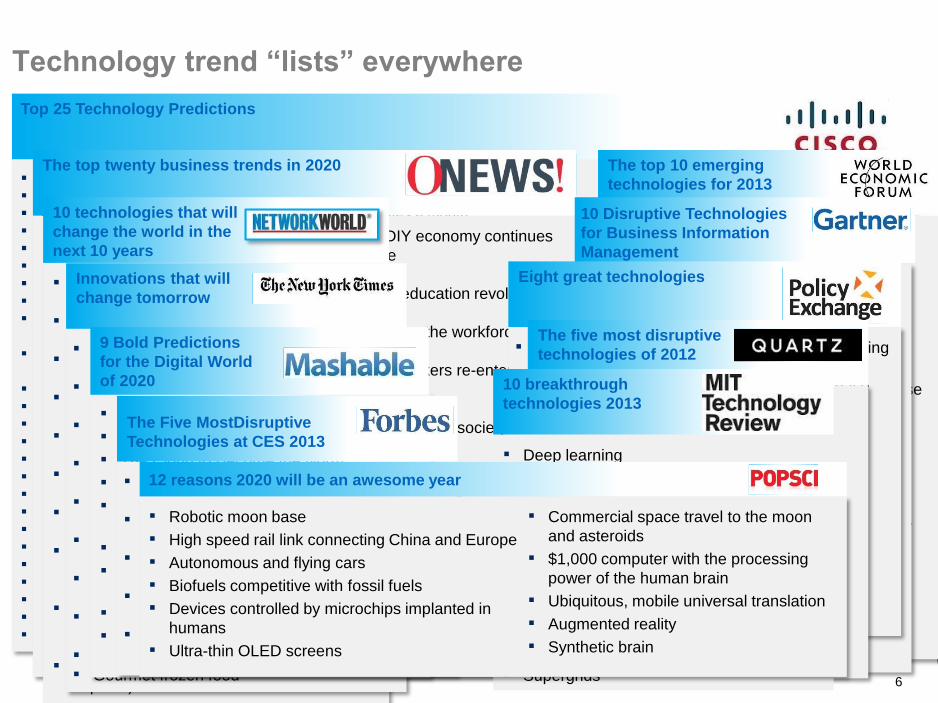
Top 25 Technology Predictions
Technology trend “lists” everywhere
▪ OnLine Electric Vehicles (OLEV)
▪ 3D printing and remote manufacturing
▪ Self-healing materials
▪ Energy-efficient water purification
▪ Carbon dioxide (CO2) conversion and use
▪ Enhanced nutrition to drive health at the
molecular level
▪ Remote sensing
▪ Precise drug delivery through nanoscale
engineering
▪ Organic electronics and photovoltaics
▪ Fourth-generation reactors and nuclear-
waste recycling
The top 10 emerging
technologies for 2013
▪ Robots taking our jobs
▪ The Internet of machines
▪ Flatter organisations
▪ 3D printing
▪ Nano-technology
▪ Mobile apps redefining service
industries
▪ The fight for control of the mobile
payments system
▪ Reinventing entertainment
▪ The fall and rise of social media
▪ Newspapers cease to exist
▪ Data rights become an issue
The top twenty business trends in 2020
▪ The DIY economy continues
to rise
▪ A new education revolution
▪ Reskilling the workforce
▪ Older workers re-entering the
workforce
▪ Dealing with a society at
retirement age
▪ China moving up the value
chain
▪ Rising incomes in South Asia
and Africa
▪ The great deleveraging
▪ Taming the Big Data tsunami
▪ Media tablets and beyond
▪ Mobile-centric applications and
interfaces
▪ Contextual and social user experience
▪ Internet of Things
▪ App stores and marketplaces
▪ Next-generation analytics
▪ Big data
▪ In-memory computing
▪ Extreme low-energy servers
▪ Cloud computing
10 Disruptive Technologies
for Business Information
Management
▪ The Internet of Things
▪ Not just Big Data, but a zettaflood
▪ Wisdom of the cloud
▪ The next ‘Net’
▪ The world gets smaller
▪ The power of power
▪ Tea. Earl Grey. Hot (3D printing)
▪ Another family tree (Advanced robotics and
virtual ‘avatars’)
▪ Yes, there's a cure for that (Medical
technologies)
▪ Humans or Borg? (Augmented homo
sapiens)
10 technologies that will
change the world in the
next 10 years
▪ Electric clothes
▪ Adaptive cruise control
▪ Better bikes
▪ Predictive medical analysis in cars
▪ Planes made of carbon fiber
▪ Subway entertainment
▪ Better looking movies
▪ Teeth with sensors
▪ Smart disinfectants
▪ Gourmet frozen food
Innovations that will
change tomorrow
▪ Big data revolution and energy-efficient computing
▪ Satellites and commercial applications of space
▪ Robotics and autonomous systems
▪ Life sciences, genomics and synthetic biology
▪ Regenerative medicine
▪ Agri-science
▪ Advanced materials and nano-technology
▪ Energy and its storage
Eight great technologies
▪ Virtual Avatars
▪ Intelligence in Anything
▪ The Cloud to Become the Norm
▪ Connecting the Cloud With the Crowd
▪ Virtual Hospitals Thanks to Bio-
Connectivity
▪ Ultra-Intelligent Electronic Agents
▪ New Image and Video Analysis
Algorithms and Tools
▪ Improved Call Sound Quality
▪ Digital Jewelry, e.g. Augmented Reality
devices
9 Bold Predictions
for the Digital World
of 2020
▪ Gesture based interfaces: Controlling
computers without touching them
▪ Augmented reality: Fusing the real and
the virtual
▪ Compressed air batteries: The world’s
most cost-effective energy storage
▪ Autonomous electric vehicles: The end
of cars as we know them
▪ Ultra-cheap web devices: Five billion
people with internet access
The five most disruptive
technologies of 2012
▪ Fighting the Power
▪ The Intelligent Home
▪ The Interface of You
▪ You’re the Doctor
▪ Technology that Knows You Better than
You Know Yourself
The Five MostDisruptive
Technologies at CES 2013▪ Deep learning
▪ Temporary social media
Prenatal DNA screening
▪ Additive manufacturing
▪ Baxter: The Blue Collared Robot
▪ Memory Implants
▪ Smart Watches
▪ Ultra-Efficient Solar Power
▪ Big Data from Cheap Phones
▪ Supergrids
10 breakthrough
technologies 2013
▪ Robotic moon base
▪ High speed rail link connecting China and Europe
▪ Autonomous and flying cars
▪ Biofuels competitive with fossil fuels
▪ Devices controlled by microchips implanted in
humans
▪ Ultra-thin OLED screens
12 reasons 2020 will be an awesome year
▪ Commercial space travel to the moon
and asteroids
▪ $1,000 computer with the processing
power of the human brain
▪ Ubiquitous, mobile universal translation
▪ Augmented reality
▪ Synthetic brain
7
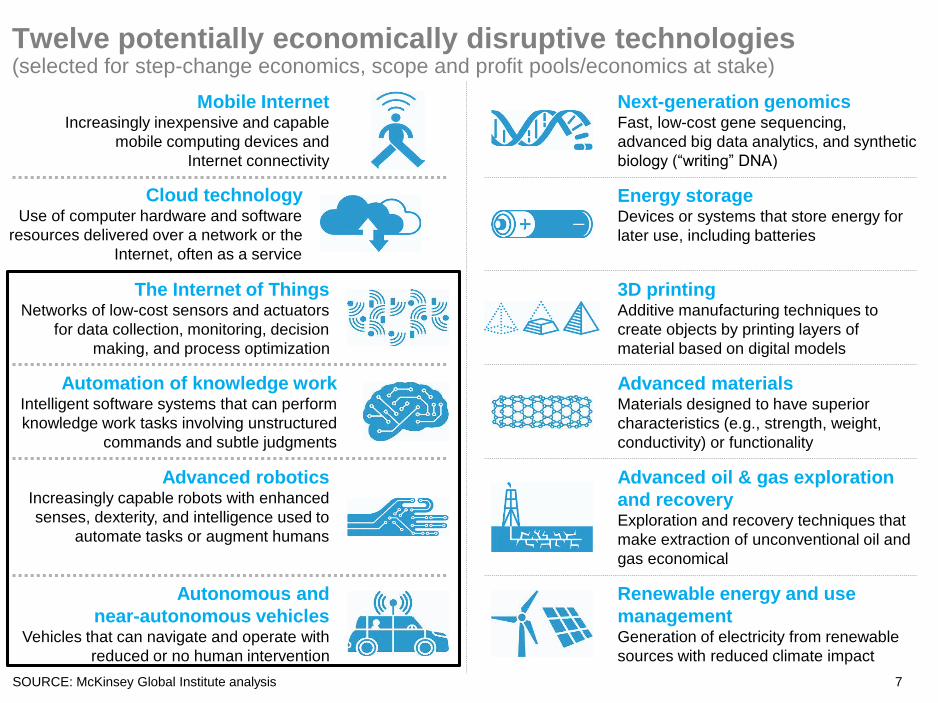
Twelve potentially economically disruptive technologies(selected for step-change economics, scope and profit pools/economics at stake)
SOURCE: McKinsey Global Institute analysis
3D printingAdditive manufacturing techniques to
create objects by printing layers of
material based on digital models
The Internet of ThingsNetworks of low-cost sensors and actuators
for data collection, monitoring, decision
making, and process optimization
Energy storageDevices or systems that store energy for
later use, including batteries
Automation of knowledge workIntelligent software systems that can perform
knowledge work tasks involving unstructured
commands and subtle judgments
Cloud technologyUse of computer hardware and software
resources delivered over a network or the
Internet, often as a service
Advanced materialsMaterials designed to have superior
characteristics (e.g., strength, weight,
conductivity) or functionality
Next-generation genomicsFast, low-cost gene sequencing,
advanced big data analytics, and synthetic
biology (“writing” DNA)
Mobile InternetIncreasingly inexpensive and capable
mobile computing devices and
Internet connectivity
Advanced oil & gas exploration
and recoveryExploration and recovery techniques that
make extraction of unconventional oil and
gas economical
Advanced roboticsIncreasingly capable robots with enhanced
senses, dexterity, and intelligence used to
automate tasks or augment humans
Renewable energy and use
managementGeneration of electricity from renewable
sources with reduced climate impact
Autonomous and
near-autonomous vehiclesVehicles that can navigate and operate with
reduced or no human intervention
8
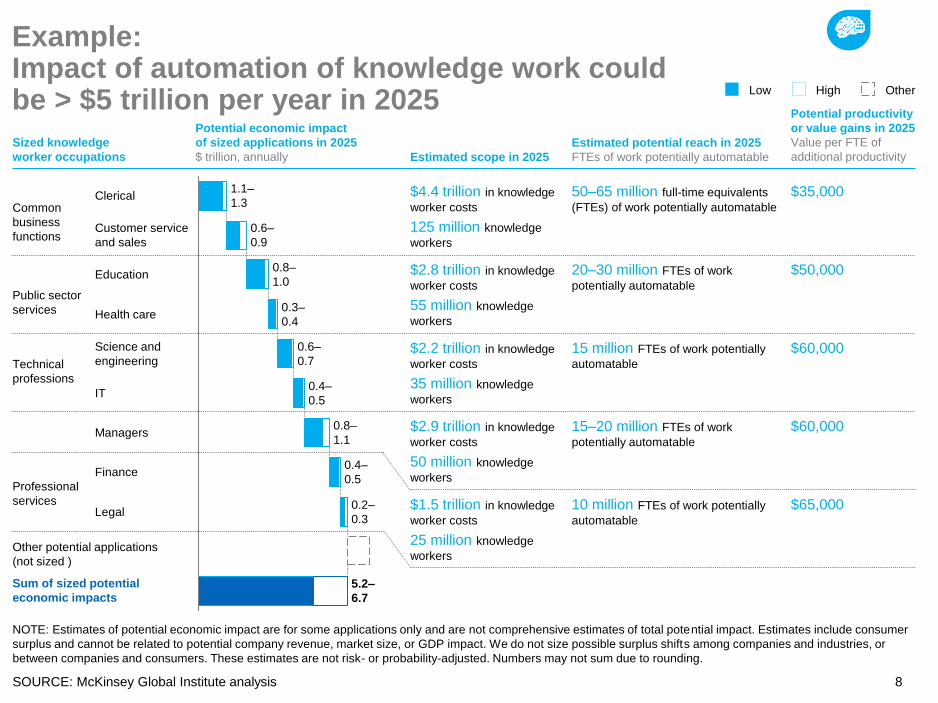
5.2–
6.7
Legal0.2–
0.3
Finance0.4–
0.5
Managers0.8–
1.1
IT0.4–
0.5
Science and
engineering
0.6–
0.7
Health care0.3–
0.4
Education0.8–
1.0
Customer service
and sales
0.6–
0.9
Clerical1.1–
1.3
Example: Impact of automation of knowledge work could be > $5 trillion per year in 2025
SOURCE: McKinsey Global Institute analysis
Sized knowledge
worker occupations
Potential economic impact
of sized applications in 2025
$ trillion, annually
OtherLow High
NOTE: Estimates of potential economic impact are for some applications only and are not comprehensive estimates of total potential impact. Estimates include consumer
surplus and cannot be related to potential company revenue, market size, or GDP impact. We do not size possible surplus shifts among companies and industries, or
between companies and consumers. These estimates are not risk- or probability-adjusted. Numbers may not sum due to rounding.
Other potential applications
(not sized )
Sum of sized potential
economic impacts
Common
business
functions
Public sector
services
Technical
professions
Professional
services
Estimated potential reach in 2025
FTEs of work potentially automatable
Potential productivity
or value gains in 2025
Value per FTE of
additional productivityEstimated scope in 2025
50–65 million full-time equivalents
(FTEs) of work potentially automatable
$35,000$4.4 trillion in knowledge
worker costs
125 million knowledge
workers
20–30 million FTEs of work
potentially automatable
$50,000$2.8 trillion in knowledge
worker costs
55 million knowledge
workers
15 million FTEs of work potentially
automatable
$60,000$2.2 trillion in knowledge
worker costs
35 million knowledge
workers
15–20 million FTEs of work
potentially automatable
$60,000$2.9 trillion in knowledge
worker costs
50 million knowledge
workers
10 million FTEs of work potentially
automatable
$65,000$1.5 trillion in knowledge
worker costs
25 million knowledge
workers

9
By 2025 overall impact could be in the trillions
SOURCE: McKinsey Global Institute analysis
$ trillion, annual
HighLow
0.2–0.3Renewable energy
Advanced oil and gas
exploration and recovery0.1–0.5
Advanced materials 0.2–0.5
3D printing 0.2–0.6
Energy storage 0.1–0.6
Next-generation
genomics0.7–1.6
Autonomous and near-
autonomous vehicles0.2–1.9
Advanced robotics 1.7–4.5
Automation of knowledge work 1.7–6.7
Internet of Things 2.7–6.2
Cloud technology 5.2–6.2
Mobile Internet 3.7–10.8
Impact from other
potential applications Low High
Partial economic impacts of sized applications in each category
MACHINES
& US
Notes on sizing
▪ Estimates of economic impact are not
comprehensive and include potential direct
impact of sized applications only.
▪ These estimates do not represent GDP or
market size (revenue), but rather economic
potential, including consumer surplus.
▪ We do not quantify transfer of surplus among
or across companies or consumers.
▪ These estimates are not directly additive due
to partially overlapping applications and/or
value drivers across technologies.
10
Some business and
economic implications
11
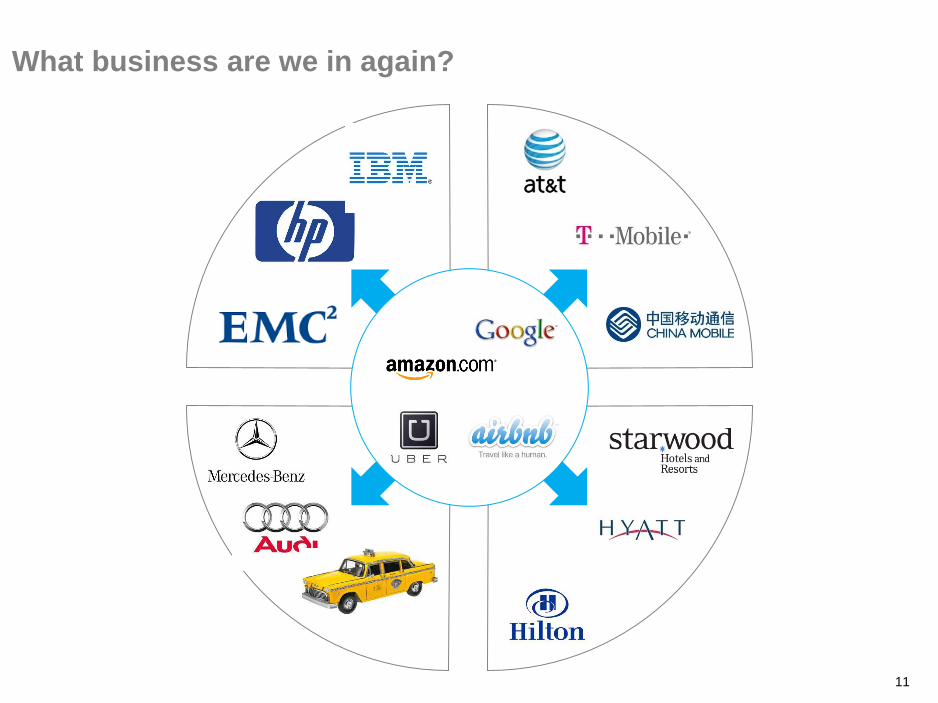
What business are we in again?
1212
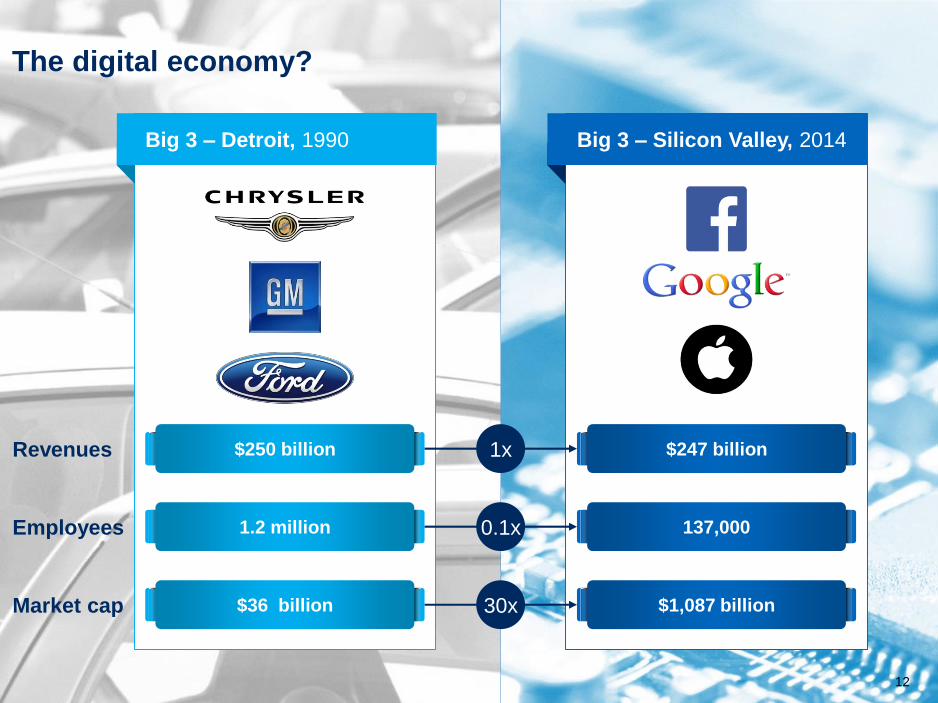
The digital economy?
Big 3 – Detroit, 1990 Big 3 – Silicon Valley, 2014
Revenues $247 billion$250 billion 1x
Employees 137,0001.2 million 0.1x
Market cap $1,087 billion$36 billion 30x
13
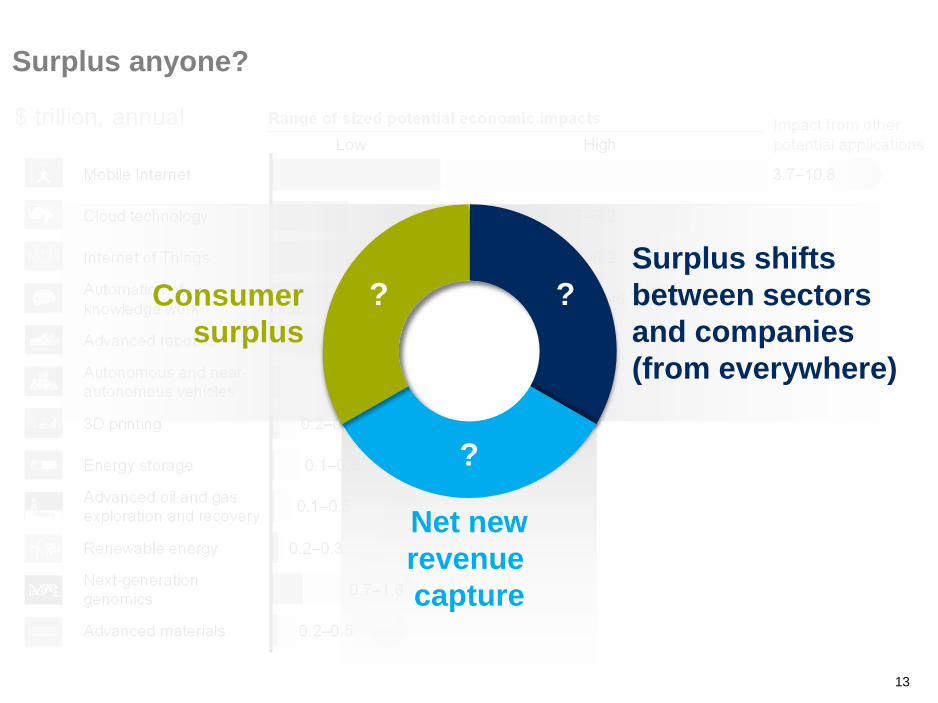
Surplus anyone?
Net new
revenue
capture
Consumer
surplus
Surplus shifts
between sectors
and companies
(from everywhere)
? ?
?

14
Prospects for economic
growth and prosperity

15
Exceptional growth of the last 50 years
SOURCE: McKinsey Global Institute analysis
NOTE: Numbers may not sum due to rounding.
1.7
1.8
Sustain historical
productivity growth
-40%
Historical growth
(past 50 years)
3.6
0.3
1.8
2.1
Sustain historical
productivity growth
Historical growth
(past 50 years)
-19%
G19 and Nigeria
GDP growth Per capita GDP growth
Productivity growth Employment growth Employment per capita growth
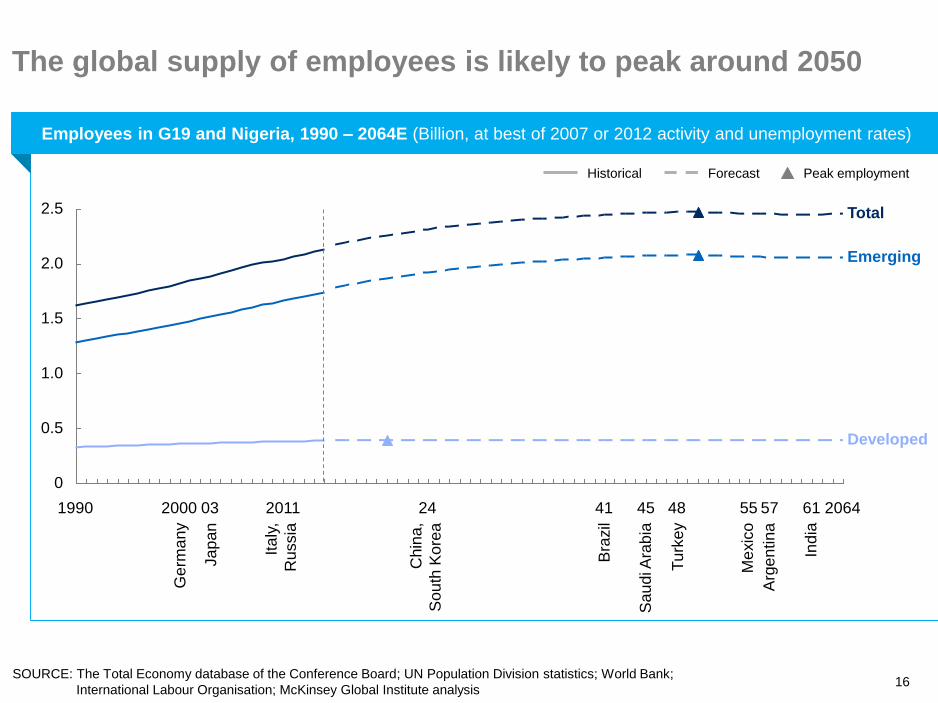
16SOURCE: The Total Economy database of the Conference Board; UN Population Division statistics; World Bank;
International Labour Organisation; McKinsey Global Institute analysis
2.5
0.5
2.0
0
1.5
1.0
242011031990 2000 206457 6155484541
Historical Forecast Peak employment
Bra
zil
Sa
ud
i Ara
bia
Tu
rkey
Me
xic
o
Arg
en
tin
a
Ind
ia
Total
Emerging
Developed
The global supply of employees is likely to peak around 2050
Employees in G19 and Nigeria, 1990 – 2064E (Billion, at best of 2007 or 2012 activity and unemployment rates)
Ge
rma
ny
Ja
pa
n
Ita
ly,
Russia
Chin
a,
So
uth
Ko
rea
17
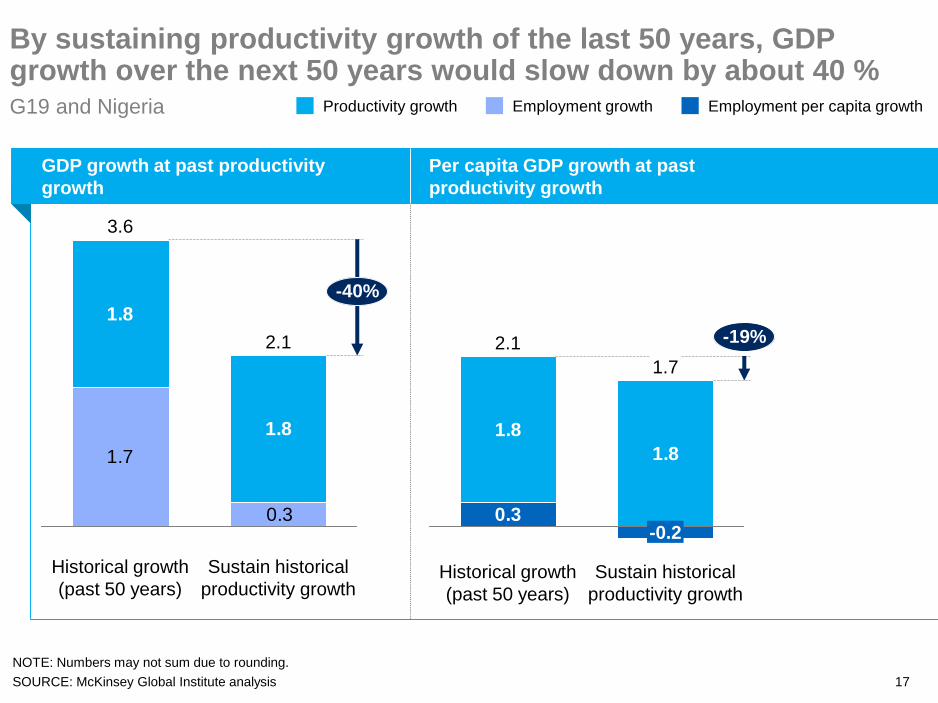
By sustaining productivity growth of the last 50 years, GDP growth over the next 50 years would slow down by about 40 %
SOURCE: McKinsey Global Institute analysis
NOTE: Numbers may not sum due to rounding.
1.7
1.8
1.8
0.3
3.6
Historical growth
(past 50 years)
Sustain historical
productivity growth
2.1
-40%
1.8
1.8
0.3
Sustain historical
productivity growth
1.7
-19%
-0.2
Historical growth
(past 50 years)
2.1
G19 and Nigeria
GDP growth at past productivity
growth
Per capita GDP growth at past
productivity growth
Productivity growth Employment growth Employment per capita growth
18
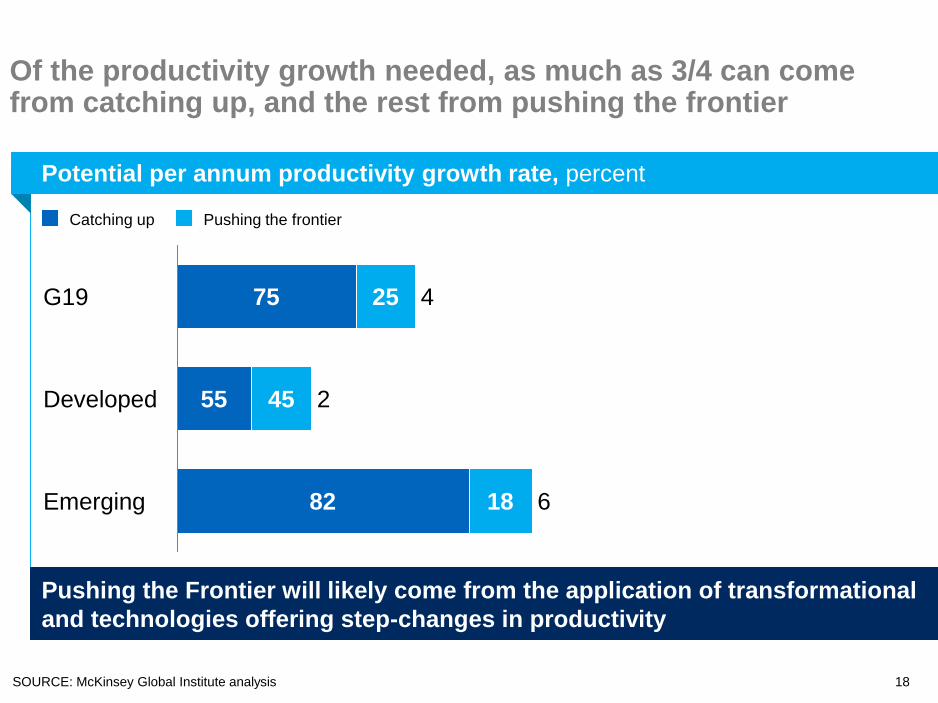
Of the productivity growth needed, as much as 3/4 can come from catching up, and the rest from pushing the frontier
SOURCE: McKinsey Global Institute analysis
Emerging 682 18
Developed 255 45
G19 475 25
Pushing the frontierCatching up
Potential per annum productivity growth rate, percent
Pushing the Frontier will likely come from the application of transformational
and technologies offering step-changes in productivity
19
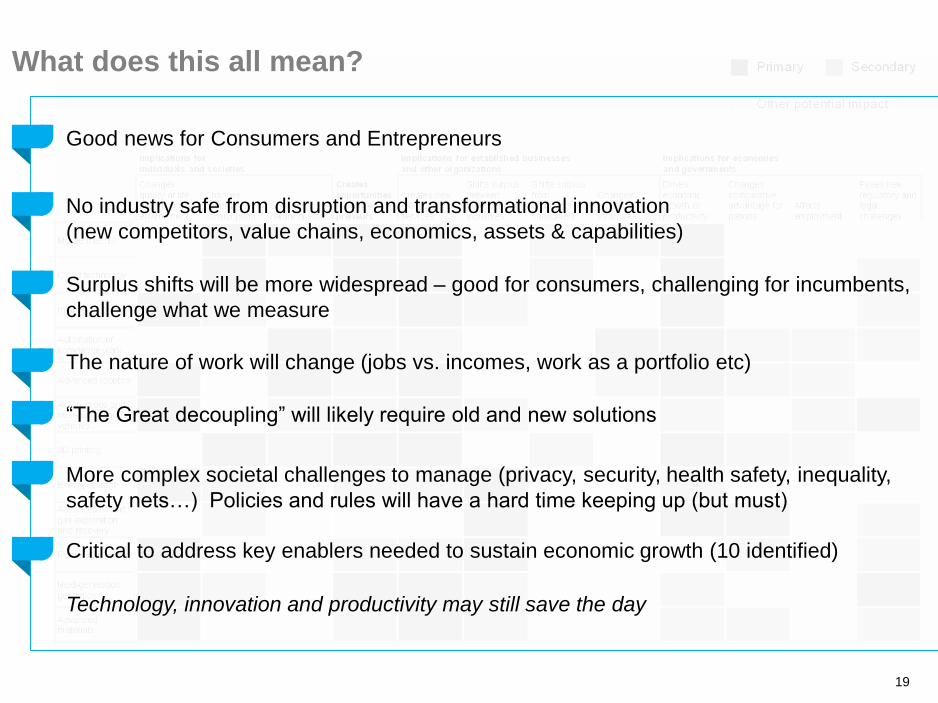
What does this all mean?
Surplus shifts will be more widespread – good for consumers, challenging for incumbents,
challenge what we measure
“The Great decoupling” will likely require old and new solutions
More complex societal challenges to manage (privacy, security, health safety, inequality,
safety nets…) Policies and rules will have a hard time keeping up (but must)
Critical to address key enablers needed to sustain economic growth (10 identified)
Technology, innovation and productivity may still save the day
Good news for Consumers and Entrepreneurs
No industry safe from disruption and transformational innovation
(new competitors, value chains, economics, assets & capabilities)
The nature of work will change (jobs vs. incomes, work as a portfolio etc)