Embed Size (px)
Citation preview
Policy Research Working Paper 7186
Can the Knowledge Capital Model Explain Foreign Investment in Services?
The Case of Singapore
Gnanaraj ChellarajAaditya Mattoo
Development Research GroupTrade and International Integration TeamJanuary 2015
WPS7186P
ublic
Dis
clos
ure
Aut
horiz
edP
ublic
Dis
clos
ure
Aut
horiz
edP
ublic
Dis
clos
ure
Aut
horiz
edP
ublic
Dis
clos
ure
Aut
horiz
ed
Produced by the Research Support Team
Abstract
The Policy Research Working Paper Series disseminates the findings of work in progress to encourage the exchange of ideas about development issues. An objective of the series is to get the findings out quickly, even if the presentations are less than fully polished. The papers carry the names of the authors and should be cited accordingly. The findings, interpretations, and conclusions expressed in this paper are entirely those of the authors. They do not necessarily represent the views of the International Bank for Reconstruction and Development/World Bank and its affiliated organizations, or those of the Executive Directors of the World Bank or the governments they represent.
Policy Research Working Paper 7186
This paper is a product of the Trade and International Integration Team, Development Research Group. It is part of a larger effort by the World Bank to provide open access to its research and make a contribution to development policy discussions around the world. Policy Research Working Papers are also posted on the Web at http://econ.worldbank.org. The authors may be contacted at [email protected] and [email protected].
Singapore has been a powerful magnet for foreign direct investment and in recent years has also made significant investments abroad, especially in developing countries and increasingly in services. This paper analyzes the determinants of Singapore’s investment using the Knowledge-Capital Model and compares the impact of skill endowments on manufacturing and service sector investments. The results suggest that inward and outward investment with respect to industrialized countries in manufacturing and services was skill-seeking. A 10 percent decline in skill differences with industrialized countries resulted in a 19 percent rise in inbound manufacturing investment stocks, but only a 7 percent rise in inbound services stocks. Inward investment from developing countries in services was also skill-seeking,
but outward investment to developing countries in both sectors was labor-seeking. A 10 percent increase in skill differences with developing countries resulted in a 23 per-cent rise in outbound manufacturing investment stocks and a 13 percent rise in outbound services stocks. Further-more, when the analysis distinguishes between services on the basis of skill intensity, there is a significant difference between the determinants of foreign direct investment in skill-intensive services and foreign direct investment in other services and goods. However, when services are disaggregated on the basis of “proximity” needs, there is no significant difference in the determinants of for-eign direct investment in proximity services compared with foreign direct investment in non-proximity services.
Can the Knowledge Capital Model Explain Foreign Investment in Services?
The Case of Singapore
Gnanaraj Chellaraj
Aaditya Mattoo
Gnanaraj Chellaraj is an independent consultant for the World Bank. [email protected]
Aaditya Mattoo is Research Manager, Trade and Integration Department, Development Economics
Research Group, World Bank. [email protected]
Research for this paper was partially undertaken while Gnanaraj Chellaraj was a Visiting Scholar
at the School of Economics at the University of Adelaide, Australia, and the East-West Center,
Hawaii. The authors are grateful to the University of Colorado, University of Adelaide, the East-
West Center and the World Bank office in Singapore and Washington DC, particularly Michelle
Chester, Ilmita Hutagalung, Mary Means, Eileen Stratford and Josette Vizmanos for technical
support, and to the Multi-Donor Trust Fund of the DECRG and the Research Support Budget for
financial support. Finally, comments from Keith Maskus, Shawn Arita, Ingo Bochert, Caroline
Freund, Hiau Looi Kee, Wolfgang Keller, Sumner LaCroix, Sang Hyop Lee, Shiva Makki, James
Markusen, Alberto Portugal, Jordan Schwartz, Sudhir Shetty, David Tarr, and Jian Zhang are
gratefully acknowledged. Research for this paper has been supported in part by the governments
of Norway, Sweden, and the United Kingdom through the Multidonor Trust Fund for Trade and
Development, and by the UK Department for International Development (DFID).

2
1. Introduction
Singapore, in its fiftieth year of existence as a nation-state, has been remarkably successful
in attracting foreign direct investment (FDI) and in recent years has also become a significant
foreign investor, especially in developing countries (Chellaraj et al. 2013; Shin 2006). This two-
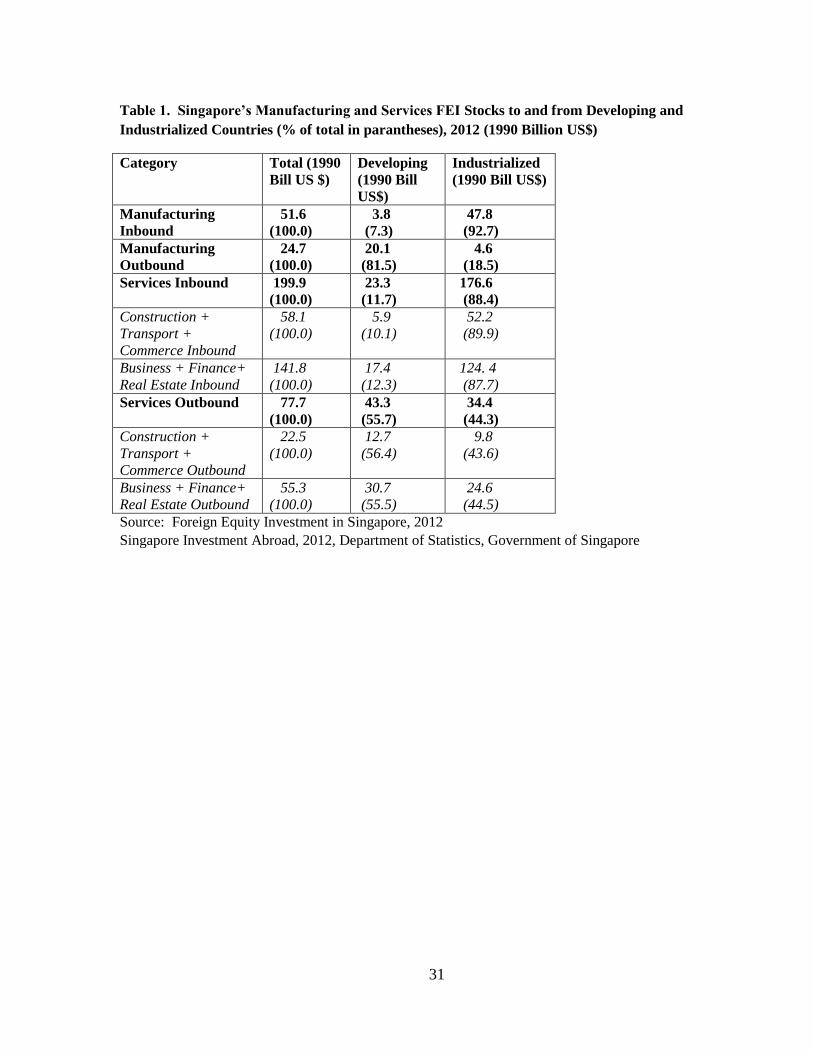
way investment has increasingly been in services. In 2012, the share of services was four times
larger than manufacturing in Singapore’s inbound investment stock, and three times greater in its
outbound investment stock (Table 1). In this paper we apply the Knowledge-Capital (KK) model
of multinational enterprises (MNEs) to compare the determinants of manufacturing and services
foreign investment to and from Singapore. The KK model has been previously applied to
aggregate and manufacturing investment (Carr et al., 2001 (hereafter CMM); Chellaraj et al.,
2013), but it has not to our knowledge been tested for bilateral services investment even though the
latter has grown in importance globally.
Singapore has rapidly closed its skills gap with most industrialized countries over the past
three decades through the expansion of higher education and by facilitating the inflow of foreign
talent (Sim, forthcoming; Hanushek and Woessmann, 2015; Yusuf and Nabeshima, 2012; Anwar,
2008). As a result, the nature of Singapore’s aggregate inward foreign investment from
industrialized countries has shifted from a labor-seeking orientation to a skill-seeking orientation,
while its outward investments in developing countries, particularly in the ASEAN region, is more
focused on labor-seeking activities (Chellaraj et al., 2013). While there is evidence on the
determinants of aggregate FDI (Chellaraj et al., 2013), studies on FDI in specific sectors such as
services are rare. The application of the KK model separately to Singapore’s manufacturing and
3
service sectors is both novel and appropriate, because it incorporates market-seeking, skill-seeking
and labor-seeking motivations into a single model.
It is plausible that Singapore’s increasing relative skill endowments also underlay the
increase in inbound service sector investment from both industrialized and developing countries.
Outbound services investment in developing countries is expected to be labor-seeking and in
industrialized countries skill-seeking. We explore further the significance of two key distinctions
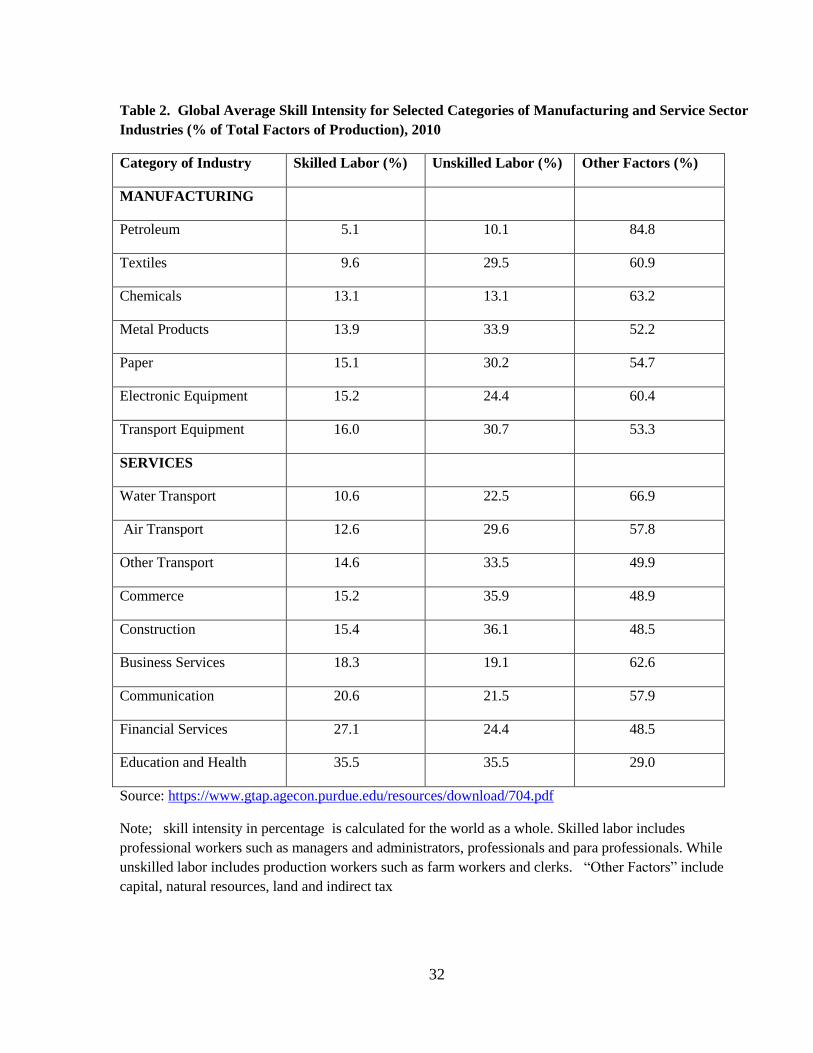
between services and manufacturing. First, services, especially financial, education and health,
communications and business services, are on average much more skill intensive than
manufacturing (Table 2).1 Therefore, we would expect a stronger skill-seeking motivation for FDI
in skill intensive services compared to manufacturing and less skill intensive services. Second,
services, particularly construction and commerce, but also to some extent business and finance,
need greater face-to-face contact between suppliers and customers than goods. Apart from the
technological imperative for proximity, there may also be a regulatory imperative: preference in
bidding for publicly-funded service sector projects (e.g. light rail projects) in countries such as
Thailand is given to firms located in the ASEAN region including Singapore.2 Therefore there is
likely to be a stronger market-seeking or horizontal orientation to FDI in face-to-face services.
Our results indicate that the direct coefficient on relative skill differences, specified as the
percentage of the labor force with a tertiary education in the parent country, less the corresponding
ratio in the host country, is negative and significant for the services inbound sample, but
insignificant for the manufacturing inbound sample. These findings suggest that services inbound
1 As Table 2 shows, there is significant heterogeneity within services and within manufacturing in skill intensity. But
even the most skill intensive sectors in manufacturing, such as transport equipment and electronics equipment, have
skill intensities comparable with the relatively less skill intensive services sectors such as transport and commerce and
much lower skill intensities than sectors such as finance, education and health.
2 http://www.eria.org/projects/PPP_ComparativeTable_February_2013.pdf
4
investment stocks rose with a relative increase in Singapore skills compared to parent nations,
which were predominantly industrialized economies. Disaggregated results suggest that both
inward and outward investment with respect to industrialized countries in both manufacturing and
services was skill-seeking. Inward investment from developing countries in services was also
skill-seeking, but outward investment to developing countries in both sectors was labor-seeking.
Furthermore, when we distinguish between services on the basis of skill-intensity, we find a
significant difference between the determinants of FDI in skill-intensive services and FDI in other
services and goods. However, when services are disaggregated on the basis of “proximity” needs,
we do not find any significant difference in the determinants of FDI in proximity services
compared to FDI in non-proximity services.
This paper proceeds as follows. In the next section we briefly review the KK model to
motivate the analysis. In Section 3 we specify the model for estimation and in Section 4 we
provide the econometric results. In the final section we discuss the potential economic and policy
significance of the findings and offer concluding` remarks.
2. The Knowledge-Capital Model and Prior Empirical Literature
Since Markusen (1984) and Helpman (1984), the general-equilibrium theory of MNEs has
focused on two motivations for FDI: to access markets to circumvent trade frictions (horizontal
FDI) and to employ low-wage labor for labor-intensive portions of the production process (vertical
FDI)3. In the former case, multiple plants producing similar goods and services are located in
different markets and produce either for local or regional markets. In the latter, headquarters are
split from at least some production, and goods are traded in different stages of fabrication.
3 Baltagi et al. (2007) , Bergstrand and Egger (2007) and Bergstrand and Pfaffermayr (2005) included a three factor
model, labor, skills and physical capital.
5
The general-equilibrium KK model of FDI (Markusen and Maskus, 2002; Markusen, 2002)
makes three principal assumptions. First, services of knowledge-based activities can be
geographically separated from production of goods and services, and supplied to production facilities
at low cost. Second, these knowledge-intensive activities are skilled-labor-intensive relative to
production of goods and services. These assumptions generate incentives for firms to fragment
production into vertical phases, locating R&D activities where skilled labor is relatively abundant
and production of goods and services where unskilled labor is well endowed. Thus a retail service
sector firm will locate its marketing research where there is plenty of skilled labor, while stores for
selling products are located close to customers. Similarly in the financial sector firms may perform
complicated research in the skill abundant country while locating subsidiaries or branches to sell
financial products in proximity to its clients. The third assumption is that knowledge-based assets are
inherently joint inputs and may be deployed simultaneously at multiple production facilities. This
characteristic generates firm-level scale economies and supports horizontal investments in facilities
that produce the same goods and services in different locations.
Specifically, the KK model combines factor endowments with complex economies of scale
to explain FDI location decisions. It presumes two countries and two homogeneous factors,
unskilled labor and skilled labor, which cannot move across borders. The model also assumes two
homogeneous goods or services, one of which is labor-intensive and subject to constant returns to
scale. The other is skilled-labor-intensive and demonstrates increasing returns to scale (IRS). Firms
in this sector can separate headquarters services from production, which may be located in either the
home or foreign countries, or both. These services can be shared across plants, which support firm-
level economies of scale in this sector. Finally, there are transport costs in trading goods or services
and fixed costs of investing in a new plant.

6
The model predicts the potential existence of several firm types in the IRS good or service in
equilibrium. First, there may be national firms that operate a single plant and headquarters in one
country and may export to the other. Second, horizontal MNEs maintain plants in both countries but
have headquarters in a single location. Finally, vertical MNEs operate headquarters in one nation
and a single plant in the other country
In this context, the determination of which firms produce in which location and the
decision to split headquarters from plants depends on various sector, country and market
characteristics. For example, in certain service sectors, the investment may be country and time
specific where the investment ends when the project is complete. Thus, a port development project
may be specific to a country and the contract may specify that the project be completed during a
specific time. Second, national firms will be more prevalent in a relatively large country because
size supports local production while permitting firms to avoid the fixed costs of investing in the
smaller nation. National firms are also prominent where the two countries have similar factor
endowments, which diminishes incentives for labor-seeking vertical FDI. They also predominate
where transport costs are low or foreign investment barriers are high, characteristics that reduce
returns to market-seeking horizontal FDI.
Horizontal MNEs become important if the nations are similar in size and relative
endowments, transport costs are high and investment costs are low. In this environment firms
prefer to place production capacity of goods and services in both locations, taking advantage of
firm-level scale economies, while selling primarily in local or regional markets to avoid transport
costs. Thus research activities in finance and marketing related to two different regions may be
carried out in two skill abundant countries located in those two regions in order to sell primarily in
the local or regional market to reduce transport costs. However, if the countries vary in factor
7
supplies, MNEs would concentrate headquarters in the skilled-labor-abundant country and
production in the skilled-labor-scarce country. This incentive is strongest where trade costs are
low, for then it is economic to supply both markets from the single foreign plant. Vertical FDI is
particularly likely if one country is small and skilled-labor abundant, in which case headquarters
locate there and produce both goods and services in the other location. Thus a retail firm in a
small skill abundant country will locate its headquarters in that country to undertake activities such
as complex market research, while only locating stores for selling the product in the labor
abundant location.
2a. Application to Singapore
Between 1984 and 2011 Singapore, despite experiencing rapid economic growth, remained
small in terms of its own market size (domestic consumption) in comparison with the other
countries in our sample. However, the economy dramatically increased its relative skill
endowments by sharply increasing the number of college graduates in its population and through
the importation of foreign talent to offset brain drain (Ahsan et al., 2014). Singapore also built an
increasing skills gap relative to the developing economies in our sample. A positive impact of skill
differences on inward investment observed between 1984 and 1996 reflected the tendency of
foreign investment to seek low-cost labor in Singapore. However, after 1996 inward foreign
investment from industrialized partners expanded with a rise in Singapore’s skill endowment
because such investment is skill-seeking in nature (Chellaraj et al. 2013).
Table 1 shows the breakdown of Singapore’s real manufacturing and services foreign
equity investment (FEI) stocks to and from industrialized and developing countries in 2012.
Around 90 percent of the manufacturing and services inbound FEI stocks came from industrialized
countries. However, developing countries are much more important for outbound investment. As
8
much as 81.5 percent of all manufacturing outbound investment went to developing countries in
our sample, and close to 56 percent of the services investment went to these countries. Overall,
services dominate both inward and outward investment, with both industrial and developing
countries.
2b. Prior Estimation
Carr et al. (2001), using a 1986–1994 panel data set involving both US manufacturing
affiliates abroad and foreign manufacturing affiliates in the USA, found that a convergence in
income (GDP) between the USA and any investment partner (holding the sum of their incomes
constant) increased affiliate sales in both directions. There was substantially greater evidence of
horizontal FDI than of vertical FDI, with affiliate sales rising in host countries with skill
endowments closer to those of the USA. Similar results were found by Markusen and Maskus
(2002). These results may have been due partly to the selection of countries, which did not include
many lower income developing nations. For other countries, Gao (2003) found that ethnic Chinese
networks played a significantly positive role in inward FDI into China. Braconier et al. (2005) also
found evidence to support the KK model using European and Japanese data. Tanaka (2009) found
that Japanese MNEs exhibit a vertical motivation while the US MNEs exhibit a horizontal
motivation. However, a more recent study indicates that the vertical component of the KK model
is relevant even for countries with similar endowments (Mariel et al., 2009). Another study
(Awokuse et al., 2012) found that US FDI abroad at the industry level exhibits a complex mixture
of motivations. Finally, Lankhuizen (2014) suggests that skill differences per se do not accurately
explain FDI, and the actual skill levels of the host country are also important.
Carr et al. (2001) pooled bilateral data which could disguise the actual relationships
between endowment differences and MNE activity. The reason is that the USA was the host in half

9
the observations and the parent in the rest, implying that the sign of their skill-endowments
variable (the difference between parent and host in the ratio of skilled to total labor) depended on
the direction of the investment. Thus, where the USA was a skill-abundant host (parent), an
increase in skill differences implied a convergence (divergence) in endowments. This difference
makes interpretation of coefficients difficult and calls for splitting the sample into inward and
outward investment (Blonigen et al., 2003).
A second criticism of such studies is the potentially inappropriate pooling of data from
developing and industrialized countries. Blonigen and Wang (2004) found that the US outward
FDI to large industrialized countries is strongly attracted to countries with higher skill abundance,
suggesting a horizontal motivation but the effect was reversed for FDI in developing countries.
The above criticisms were addressed in a study by Chellaraj et al. (2013) using aggregate bilateral
foreign investment stocks data for Singapore. It found strong evidence that the nature of
Singapore’s two-way investment with the industrialized nations has shifted into skill-seeking
activities over the 1984-2007 period. Meanwhile, Singapore’s investments in developing countries
have increased sharply and become concentrated in labor-seeking activities.
Although Chellaraj et al. (2013) applied the KK model to aggregate Singapore FDI, they
did not apply it to the service sector. This research is the first attempt to estimate the KK model
for the service sector for any country and also the first attempt to separately compare the impact of
skills on manufacturing and service sector investments and within differing classes of services
such as transport and business services based on skill intensity. As this research incorporates
investment objectives for both sectors separately and service sectors grouped by skill intensity, it is
an extension of the studies applying the KK model, discussed earlier.
10
3. Empirical Framework and Data
Here we specify the econometric approach that represents the KK model and address a
number of questions. We then describe our data set, which was developed specifically for this
analysis and seems unique in its comprehensive coverage of a panel of two-way manufacturing
and services FEI stocks for Singapore.
3a. Basic Specification
The KK model provides an econometric specification, grounded in theory, for explaining
the general determinants of foreign investment activities. It is sufficiently flexible to permit the
data to reveal, indirectly, whether investment into and out of Singapore is driven by factor-cost
(vertical) motivations, market-seeking (horizontal) motivations, or both. Following Carr et al.
(2001) our initial specification is as follows:
FEIijt = β0 + β1 (GDPit +GDPjt) + β2 (GDPit –GDPjt)2 + β3 (SKit – SKjt)
+β4 (GDPit –GDPjt) * (SKit – SKjt) + β5 ICjt + β6 INSTjt + β7 INFRAjt + β8 TCjt + β9 TCjt * (SKit –
SKjt)2+ β10 TCit + β11 DISTij+ β12 COMLANGij + eijt (1)
In this specification the dependent variable is the stock of manufacturing and services
foreign equity investment (FEI) invested by country i (the parent) in country j (the host).4 For
inward investment, Singapore is always the host country and for outward investment Singapore is
always the parent country. Carr et al. (2001) employed majority-owned affiliate sales in
manufacturing as their measure of FDI activity. This measure is not available for Singapore for all
years in the sample, and hence we choose to analyze investment stocks instead. Note that focusing
on stocks instead of activity flows may actually be an advantage, for the former measures reflect
4 Definitions of variables and data sources are provided in the following subsection.
11
long-term decisions to invest and are less volatile, and less dependent on omitted variables, than
are annual activity measures (Braconier et al., 2005).
The first right-hand side variable is the sum of parent-country and host-country real gross
domestic product, which we label GDP Sum. In both cases, it captures joint market size and the
coefficient is expected to be positive. The next variable is the squared difference in GDP between
parent and host nations. This variable captures changes in relative size, holding relative factor
endowments fixed, and the theory implies that incentives for market-seeking investment should
increase as two countries become more similar in size. Thus, in principle there should be an
inverted U-shaped relationship between FEI stock and size differences between two partner
countries, suggesting that the coefficient should have a negative sign.
The next variable is the difference in relative skill endowments between the parent and host
countries. Thus, if the parent country is skill-abundant and the recipient country is abundant in
lower-skilled labor, an increase in skill differences should raise incentives for vertical FEI, or
fragmentation, implying a positive coefficient. However, if countries are relatively similar in their
endowments, supporting horizontal incentives for FEI, an increase in this difference would tend to
diminish investment, generating a negative coefficient. Finally, if the recipient nation is skill-
abundant, implying that the skill differences variable is negative, a rise in its endowment would
attract skill-seeking FEI. In that case the coefficient would be negative. The interaction between
market size differences and skilled labor differences is expected to have a negative impact since
FEI stocks should be smaller where market size differences are large, for a given difference in
skills between Singapore and its partner industrialized country. This variable is designed to
capture some of the non-linearities implicit in the KK model.
12
The variable ICjt captures the costs of investing in the host country, whether that is
Singapore for inbound FEI stocks or partner nations for outbound FEI stocks. Higher host-country
investment costs should reduce investment. The variable INSTjt accounts for institutional costs or
constraints which are roadblocks to investment in the host country. Higher host-country
institutional constraints should also reduce investment. Similarly, INFRAjt captures the
infrastructure barriers in the host country and should have a negative impact on FEI. Numerous
studies (e.g., Dollar et al., 2004) have indicated that development of infrastructure is vital to
attracting foreign investment, particularly in developing countries and NICs. The next variable,
TCjt, is a measure of trade costs (import restrictions) in the host country. To the extent that
investment is driven by market-seeking incentives, higher host-country trade costs should increase
it in order to avoid them. However, where investment is undertaken to fragment production
networks, higher trade costs can deter FEI. Finally, parent-nation trade costs (TCit) should have a
negative impact on FEI stocks since they make exporting output back home more costly. The
interaction term between host-country trade costs and squared skill differences is designed to
capture the fact that such costs should encourage horizontal, but not vertical, investment, in which
case they should matter less when skill differences are large. But, as Carr et al. (2001) point out,
this is not a theoretically sharp hypothesis. DISTij is the distance in kilometers between Singapore
and the capital cities of partner countries. Generally, one would anticipate a negative coefficient
on this variable. However, it is also possible that MNEs from remote countries such as the US
could set up regional headquarters in Singapore and reinvest in neighboring countries while nearby
countries such as Australia and Taiwan, China have easy access to regional markets without
having to relocate to a country such as Singapore. Under those circumstances, the coefficient is
likely to be positive. Finally, COMLANGij is the common language that is spoken in both
13
Singapore and the partner countries and is a dummy variable. It takes on a value of 1 if Singapore
and the partner country have a common language; otherwise it takes on the value of zero5. This
variable is expected to have a positive impact on both inbound and outbound FDI.
While coefficient β3 captures the direct marginal impact of skill differences between the
parent country and host on investment stocks, the total marginal effect depends on other economic
determinants, as suggested by the non-linearities captured in interaction terms. For example, if β4
is negative and the parent country is larger than the host country or region, a reduction in the
difference in country or region size (i.e., an increase in the size of the host country) should reduce
the sensitivity of investment stocks to host country skill differences. In terms of our application, if
over time Singapore (as host) grows in size relative to parent investors, the relationship between
skill differences with parent country, and investment stocks should get smaller or become negative,
reflecting a shift in incentives away from vertical to horizontal FEI.
This basic framework is applied to data samples involving both inbound and outbound
manufacturing and services FEI stocks in Singapore. This estimation should capture the basic
influences of the KK model. However, we also split the sample into inbound and outbound stocks
separately for industrialized-country and developing-country partners and investigate foreign
investment behavior for these groups separately. In addition we also aggregate (1) different
categories of services based on need for face to face contact with customers i.e., those that cannot
be delivered across borders– construction, commerce and real estate - and by those that do not
need as much face to face contact-business services, finance and transport; (2) the service sector
categories with high skill intensity-business services, finance and real estate- and those with lower
5 Economies that have a common language with Singapore are China; Taiwan, China; Hong Kong SAR, China
(Chinese); and the United Kingdom, Canada, Australia, the United States, and the Philippines (English) and these take
on the value of 1 while other countries such as Germany, France and Switzerland take on the value of zero.

14
skill intensity-commerce, construction and transport-are aggregated and re-estimated separately.
For inbound investment from industrialized countries, the motivation is expected to be skill-
seeking. Outbound investment to industrialized countries is also expected to be skill-seeking.
Investment by developing countries in Singapore is small, coming mostly from neighboring
ASEAN countries and China, compared to Singapore’s corresponding outbound investment.
Hence, outbound investment from Singapore to developing countries is expected to be
predominantly vertical and we have no particular expectation about inbound investment for
manufacturing and services from developing countries. Finally, we also do not have any
expectations regarding inbound and outbound investment when FDI is aggregated using different
categories of sectors.
3b. Data Sources and Description
The dependent variable in the KK model should be a measure of bilateral stocks of FDI.
Unfortunately, Singapore only sporadically compiled outbound and inbound FDI data for some
countries in the sample before 1999. Information from 1993-2012 available on bilateral stocks of
foreign equity investment (FEI) between Singapore and partner countries is defined as the sum of
direct equity investment and portfolio equity investment. Direct equity investment incorporates all
investments made in ownership entailing a measure of management control, with a minimum
ownership threshold of 10 percent, while portfolio investment involves financial stakes unrelated
to management control. Thus, the measure we analyze, FEI stocks, is somewhat broader than FDI.
However, in Singapore portfolio investment was relatively small in this period. Stocks of such
investment amounted to no more than 9 percent of total FEI stocks from 1997 to 2012 and
averaged less than 4.7 percent. Moreover, the correlation between FEI stocks and FDI stocks from
1997 through 2012 is 0.95. We employ data on investment stocks separately for manufacturing
15
and services. The sources of the FEI data are the Statistical Yearbook of Singapore, Foreign
Equity Investment in Singapore and Singapore’s Investment Abroad, published by the Department
of Statistics, GOS6. They are converted into millions of 1990 US dollars using contemporaneous
exchange rates and the US GDP deflator.
Data on the right-hand side variables come from sources detailed in Carr et al. (2001),
updated through 2012. Real GDP is measured in millions of 1990 US dollars for each country.
Annual real GDP figures in local currency were converted into dollars using the market exchange
rate. Both GDP and exchange rate data are from the International Financial Statistics of the IMF.
Skilled labor abundance is defined as the proportion of the labor force with tertiary (college or
university) education. These figures are compiled from the various statistical and labor force
yearbooks for individual developing countries and from the Department of Statistics, GOS for
Singapore. They are taken from the OECD Education at a Glance for various years for the OECD
countries. In cases where some annual figures were missing, the skilled-labor ratios were taken to
equal the period averages for each country.. Our skill-difference variable is the relative skill
endowment of the country less that of the host country.
The cost of investing in the affiliate country is a simple average of several indices of
perceived impediments to investment reported in the World Competitiveness Report (1993-1994) and
Global Competitiveness Report (1995-2012) of the World Economic Forum. The investment
barriers include restrictions on the ability to acquire control in a domestic company, limitations on
the ability to employ foreign skilled labor, restraints on negotiating joint ventures, strict controls of
hiring and firing practices, market dominance by a small number of enterprises, an absence of fair
6 The partner economies included in this study are Australia; Canada; USA; Taiwan, China; Germany; France; Japan;
Hong Kong SAR, China; United Kingdom; the Netherlands; Switzerland; Thailand; Malaysia; Indonesia; China; and
the Philippines. Some data points were not publicly available and these were obatained from the Ministry of Statistics,
Government of Singapore.

16
administration of justice, difficulties in acquiring local bank credit, restrictions on access to local and
foreign capital markets, and inadequate protection of intellectual property. The resulting indices are
computed on a scale from zero to 100, with a higher number indicating higher investment costs. The
institutional constraints include lack of transparency, lack of exchange rate stability, high levels of
bribery and corruption in the political system, poor legal and regulatory framework (extent of
corruption in the legal system, civil or criminal), politicized and elected law enforcement and
judiciary (Chellaraj, 2000), widespread gender and ethnic discrimination and high prevalence of
unethical practices. The infrastructure barriers refer to the quality of infrastructure in the host
country and include the quality of railroad, ports, air transport, waterways, roads, and electric supply
as well as telecommunications and telephones. They are also computed on a scale of zero to 100
with zero being the most efficient and 100 being the least efficient. Finally, the trade cost index is
taken from the same source and is defined as a measure of national protectionism or efforts to
prevent importation of competitive products. It also runs from zero to 100, with 100 being the
highest trade costs. Finally, distance is the number of kilometers of each country’s capital city from
Singapore and is available online from CEPII (the French Center for Research and Studies on the
World Economy).7
Overall both manufacturing and services outbound FEI stocks to developing countries were
far higher than the reverse activity. In contrast, manufacturing and services inbound FEI stocks from
industrialized countries were much higher than Singapore’s outbound FEI to those nations. It is
important to note that there are some years where outward investment stocks to industrialized
countries were reported to be zero. Thus, our estimation procedure is Tobit with time and country
7 http://www.cepii.fr/anglaisgraph/bdd/distances.htm, Paris, France.
17
fixed effects. The fixed effects control for unobserved influences on FEI stocks that are constant
over time or country.
The skill intensity for different sectors was calculated by GTAP (Global Trade Assistance
and Production) of Purdue University. It is the global average for all sectors broadly classified as
agriculture, services, government and private. Primary agriculture and service sectors such as
construction were intensive in unskilled labor, whereas government and private sectors were
highly skill intensive. Private sectors include finance and business services while services include
transport and construction8.
As there are a number of years early in the period where either inward or outward
investment stocks were reported to be zero, we use a Tobit estimation procedure. We include year
and country fixed effects to control for unobserved influences on FEI stocks that vary over time or
are characteristic of a particular investment partner country.
3c. Endogeneity and Instrumental Variables
It is evident that causation may run both ways between skill differences, which is our
primary determinant of interest, and foreign investment. For example, an increase in inbound FEI
may raise the level of skills in Singapore due to professional training within MNEs. Moreover,
flows of investment may be accompanied by the transfer of skilled engineers and managers within
the firm between countries. Thus, the skill-differences variable is likely to be endogenous to
investment to some degree. To address this issue we develop instruments that are correlated with
skill differences but plausibly not correlated with the regression error term.
8 “In Singapore, construction and real estate are classified separately. Some of the tasks in the real estate sector include
managing and overseeing construction of property as well as facilities management once the construction is complete,
while the actual construction of buildings involves tasks which do not require much beyond a high school education
(Chin, 2007). Hence, for the purposes of this research real estate is classified as skill intensive and construction is
classified as less skill intensive.”

18
The instrument used in this analysis is the female fertility rate in the parent and host
countries, which we lag 20 years to approximate the period between birth and university
graduation. Long-lagged fertility rates are likely correlated with later educational attainment, as
noted by Becker et al. (2009). For example, studies from poor countries indicate that higher
fertility rates increase the likelihood of a family remaining in poverty, making it difficult to
procure education for children (Black et al., 2005; Rosenzweig and Schultz, 1987). However,
lagged fertility presumably is exogenous with respect to current FEI-location decisions.
Initial experimentation suggests that the fertility rate is an appropriate instrument. For
example, in a regression of skill differences on lagged fertility rates the coefficients was highly
significant. However, in a related regression of inbound FEI on lagged fertility rates the
coefficient was insignificantly different from zero.9 We offer further instrument validation in the
results tables below.
4. Results
We apply the basic framework to the inbound and outbound manufacturing and services
FEI. We then repeat the analysis separately for developing and industrialized country partners for
the period, 1993-2012.
4a. Regression Estimates
Our instrumental-variables procedure is to run the first-stage regressions of relative skill
differences on the instrumental variable discussed above, along with other exogenous variables, for
each sample and use the predicted values to estimate second-stage Tobit regressions. General
specification tests are listed at the bottom of each second-stage regression in the tables below. As
may be noted, the Sargan tests indicate that with few exceptions, the variables are uncorrelated
9 These results are available on request.
19
with the residuals and serve as appropriate instruments. The F tests for weak instruments suggest
that, except for a few cases confined to investment to and from developing countries, the
instruments perform well. The first-stage equations are available upon request.
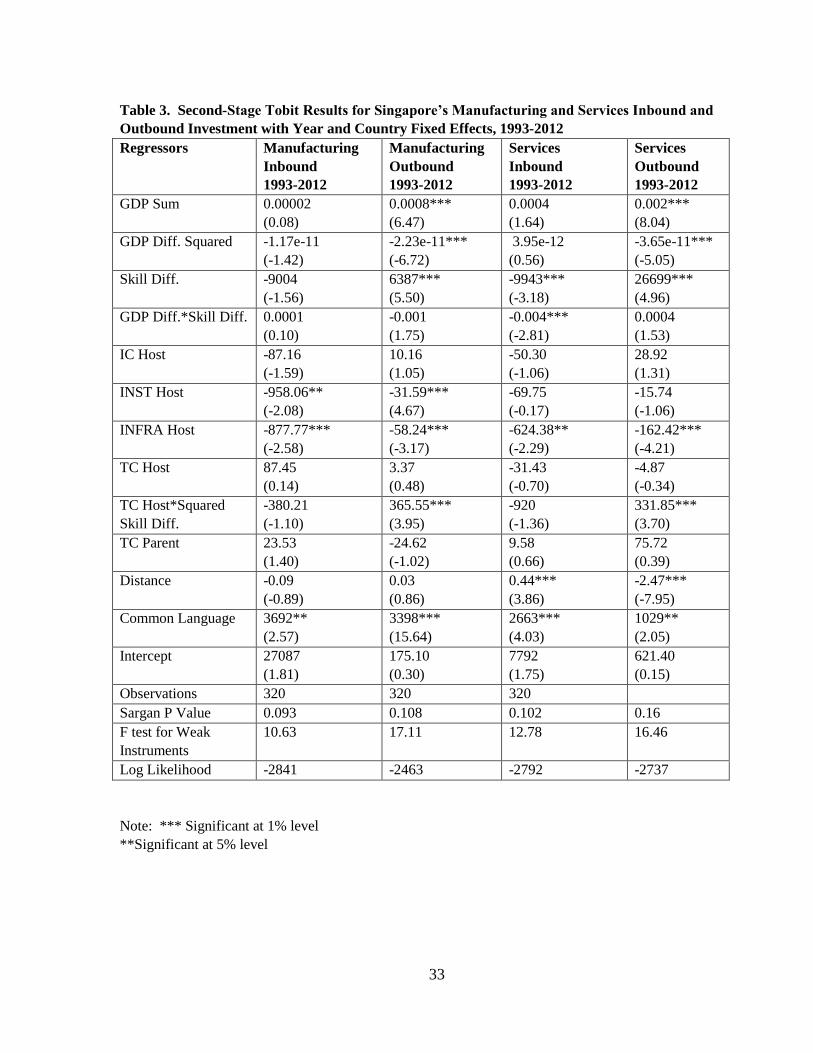
The first and second columns of Table 3 present second-stage Tobit regression results for
manufacturing inbound and outbound FEI stocks respectively in Singapore for the period 1993-
2012, while the third and the fourth columns present the corresponding results for services. The
effect of joint market size, measured by the sum of GDP, on inbound manufacturing and services
investment and the coefficient on squared difference in real GDP are insignificant in both cases
(columns 1 and 3). Also we find that outbound manufacturing and services investment (columns
2 and 4) from Singapore rises in market size and falls in GDP size differences, as expected by the
KK model.
The investment-cost index in the host country is insignificant in all cases. The parent and
host country trade costs are also insignificant in all cases. The variable capturing infrastructure
quality is negative and significant in both the manufacturing and services inbound sample,
suggesting that reductions in such costs encouraged inward investments. There were also strongly
negative impacts of infrastructure barriers in host countries on outbound manufacturing and
services investment from Singapore. Thus, both Singapore’s manufacturing and services
investment abroad and foreign investment in Singapore seeks to avoid infrastructure bottlenecks.
The institutional constraints were negative and significant for inbound and outbound investments
only in the case of the manufacturing sector. Distance had a negative but insignificant impact on
inbound manufacturing investment stocks but had a positive and significant impact for inbound
services stocks. This may indicate that more remote parent countries, such as the United States
and the UK, invested significantly more in Singapore in the service sector relative to nearby
20
industrialized countries such as Japan to establish regional headquarters from which to re- invest in
neighboring countries. However, distance significantly reduced both aggregate services
investment from Singapore while it had an insignificant impact on outbound manufacturing
investment. Finally, common language English and Chinese had a positive and significant impact
in all cases suggesting that it facilitates investment between Singapore and the countries with
which it has a common language.
Our main interest lies in the impact of relative skill endowments. The direct coefficient on
relative skill differences, specified as the percentage of the labor force with a tertiary education in
the parent country less the corresponding ratio in the host country, is negative and significant at the
one percent level for the services inbound sample, but insignificant for the manufacturing inbound
sample. These findings suggest that services inbound investment stocks rose with a relative
increase in Singapore skills compared to parent nations, which were predominantly industrialized
economies as shown in Table 1. In contrast, the coefficients on skill differences are significantly
positive at the one percent level for both manufacturing and services outbound regressions,
implying that an increase in Singapore’s skills compared to the countries in which it invests tended
to increase FEI stocks. As we saw in Table 1, Singapore’s outbound investment in both
manufacturing and services has largely gone to developing countries and in that sample the skill-
differences variable is positive for all observations. Thus, an increase in this variable would
suggest a rising relative skill endowment in Singapore, which induces a rise in both services and
manufacturing outbound FEI stocks. This finding supports the view that Singapore’s investment
abroad is concentrated in labor-intensive manufacturing and services.
Table 4 offers a different cut of the data by considering manufacturing and services
inbound and outbound FEI stocks with developing countries. The first and second columns list

21
results for manufacturing data with developing countries and the third and fourth the
corresponding services data. The joint market size is significant at the one percent level for only
the services outbound investment. In all other cases it was insignificant. The squared GDP
difference was insignificant in all cases.
Once again the impact of skill differences on FEI to and from developing countries is of
interest here. The direct impact on outbound manufacturing and services FEI to developing
countries is positive and significant at the one percent level. Meanwhile, the impact on inbound
services investment from developing countries is also negative and significant at the one percent
level suggesting a horizontal motivation while the impact on inbound manufacturing investment is
insignificant similar to the results for aggregate inbound manufacturing investment in Table 3. As
Singapore’s skill endowments rose compared to those in neighboring developing economies,
outbound manufacturing FEI stocks grew larger. The negative coefficient in the case of inbound
services FEI from developing countries implies that as Singapore becomes more skill abundant
relative to partner developing countries they invested more in Singapore, suggesting that skill
shortages in developing countries in the region and China are resulting in outward investment from
these countries into Singapore. The results presented in Table 4 should be interpreted with caution
as the developing country sample size is small.
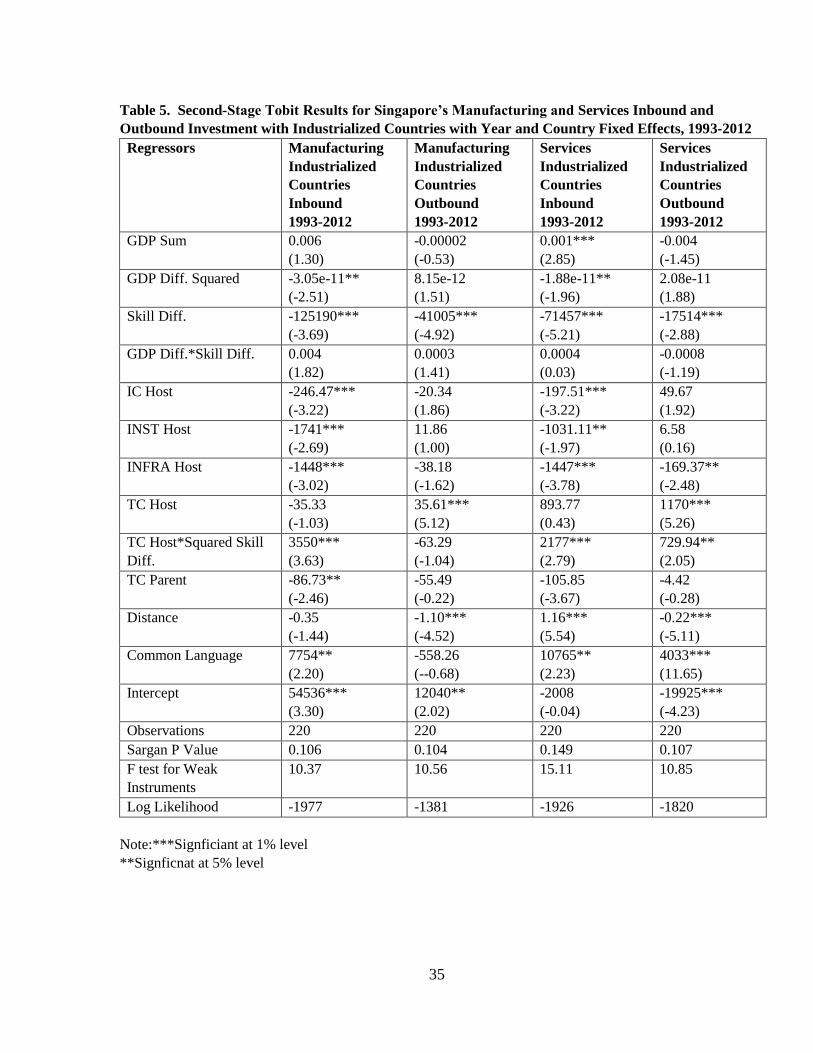
Table 5 presents similar regressions for data covering manufacturing and services inbound
and outbound FEI stocks with industrialized countries. The first and second columns list results
for manufacturing FEI data with industrialized countries and the third and fourth columns the
corresponding results using services data. The joint market size is insignificant for all equations
except inbound services investment, while the squared GDP difference is negative and significant
22
at the five percent level, as expected by the KK model, for both services and manufacturing
inbound investment.
Once again the impact of skill differences is of interest here. The direct impact on inbound
and outbound manufacturing FEI is negative and significant at the one percent level with regards
to industrialized countries. Overall inbound investment in skill-intensive manufacturing, such as
pharmaceuticals and electronics, also increased during the 1993-2012 period, when Singapore
sharply increased its skill abundance (Chellaraj et al., 2013). This trend more than offset
investment declines in primary manufacturing industries.10 The situation was similar for services.
Finally, while distance had a negative and insignificant impact on inbound FEI in the case of
manufacturing sectors, it had a negative and significant impact on both outbound manufacturing
and services FEI to industrialized countries. However, as in the case of aggregate inbound services
investment presented in Table 3, distance had a positive and significant impact (at the one percent
level) for inbound services FEI from the industrialized countries in our sample indicating that
multinationals from remote places such as the US and the UK likely have a regional emphasis.
They are likely to invest in Singapore to reinvest in neighboring countries particularly in the
ASEAN region relative to nearby industrialized countries such as Australia and Taiwan, China.
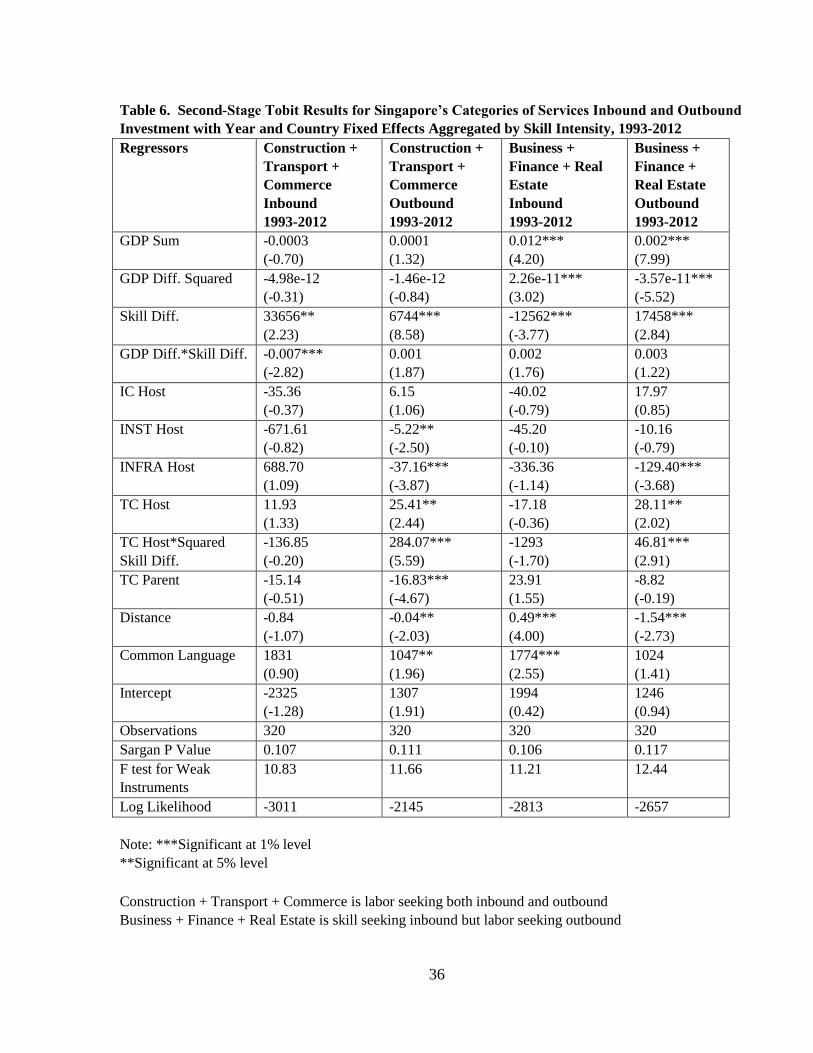
The basic results are reinforced by the regressions in Tables 6, which break the aggregate
inbound and outbound service sector samples into two groups based on skill intensity shown in
Table 2. Construction, transport and commerce sectors are classified as less skill intensive and are
aggregated into one group while business, finance and real estate are classified as highly skill
intensive and aggregated into another group. The results for the aggregate inbound and outbound
10 The regression results arise from the sample of total manufacturing. Unfortunately, separate data for investment by
industrialized countries in Singapore by various categories of manufacturing are not available.
23
FEI for the aggregate construction, transport and commerce sectors are presented in Table 6
columns and 1 and 2 while the corresponding results for the aggregate business services, finance
and real estate are presented in columns 3 and 4. The joint market size is positive and significant at
the one percent level only for inbound and outbound skill intensive service sector FEI, while the
squared GDP difference is negative and significant for the same set of equations. For the less skill
intensive construction, transport and commerce sectors both variables are insignificant.
Once again the impacts of skill differences and distance are of interest here. While
aggregate services inbound FEI exhibited a horizontal skill-seeking motivation in Table 3, the
results from the disaggregated data indicate that the motivations depended on the categories of
services. The inbound FEI for the less skill intensive sectors-transport, construction and commerce
display a vertical motivation, i.e., as Singapore becomes relatively less skill abundant compared to
its partner countries, it receives more FEI in those sectors. Meanwhile, as Singapore becomes
relatively more skill abundant in the aggregate skill intensive sectors – business services, finance
and real estate, partner industrialized countries invest relatively more in the country, suggesting a
horizontal motivation. Meanwhile, outbound investment in both categories of services displays a
vertical motivation. As discussed earlier, Singapore’s investment abroad has gone mostly to
developing countries and hence this result is not surprising.
Distance had a negative and significant impact on outbound investment for both the less
and more skill intensive service sector categories. However, while distance had an insignificant
impact on inbound FEI in the less skill intensive sectors, it had a positive and significant impact on
inbound FEI in the more skill intensive aggregate business services, finance and real estate service
sectors. This further confirms the earlier results for aggregate inbound services investments
strongly suggesting that MNEs from remote industrialized countries such as the US and UK are
24
more likely to invest in Singapore to reinvest in other countries in the region by setting up regional
headquarters. Thus, investment from far off countries likely has a regional orientation11.
Finally, when we aggregated the different categories of services by proximity services –
construction, commerce and real estate - based on need for face to face contact with customers,
and non-proximity services-business, finance and transport- there were no significant differences
between the two groups on inbound FEI. The results are presented in Table 7. In both cases, the
impact of skill differences was insignificant.
4b. Economic Significance
As noted earlier, the total impact of skill differences depends on both the direct coefficient
and the interaction coefficients. Thus, the average annual impact of changes in manufacturing and
services FEI stocks as a result of changes in skill differences may be derived as follows:
∂FEI/∂(SKit – SKjt) = β3+ β4 (GDPit –GDPjt)+ 2*β8 (TCit * (SKit – SKjt)) (2)
We are interested in assessing the economic importance of the effects of changes in skill
differences for inbound FEI from industrialized countries. In the case of equation (2), a unit
change in (SKit – SKjt) is an extremely large variation relative to the underlying sizes of skill ratios
and the direct derivative is not meaningful. Accordingly, we calculate the implied total elasticity
at the sample means of all variables in equation (2). Since our primary regression results are, first,
that both Singapore’s manufacturing and services outward FEI to developing countries is strongly
labor-seeking and, second, that both inward manufacturing and services FEI from the
industrialized nations has a skill-seeking focus, we compute the relevant elasticities. In particular,
11 The samples were split into developing and industrialized countries separately and the results did not change much
and hence they are not reported here. While the less skill intensive sectors displayed a vertical motivation for both
inbound and outbound investment regarding both industrialized and developing countries, they displayed a horizontal
motivation for both inbound and outbound investment from industrialized countries and inbound investment from
developing countries in the more skill intensive sectors.
25
we report computations for the cases of outbound services and manufacturing FEI to developing
nations, using the results from columns 2 and 4 in Table 4. For inbound manufacturing and
services FEI from industrialized countries we compute elasticities using coefficients shown in
Table 5, columns 1 and 3.
The elasticity calculated from Table 4 indicates that a ten-percent increase in skill
differences with developing countries, which occurred as Singapore became more skill abundant
relative to that group, resulted in a 23.2 percent rise in outbound manufacturing FEI stocks, or $
461.19 million, to the average recipient over the period 1993-2012. Similarly, from Table 4, a ten-
percent increase in skill differences with developing countries resulted in a 12.8 percent rise in
outbound services FEI stocks, or $ 414.37 million, to the average recipient. Thus, we find an
elastic and economically large response of outward Singaporean manufacturing and services
investment in the neighboring developing economies, suggesting a clear vertical orientation to that
activity. Turning to inward FEI from the industrialized nations for manufacturing, in Table 5,
column 1, a ten-percent decline in skill differences with industrialized countries resulted in a 19.4
percent rise in inbound manufacturing FEI stocks, or $569.61 million from the average parent.
Similarly, a ten-percent decline in skill differences with industrialized countries resulted in a 7.1
percent rise in inbound services FEI stocks, or $ 325.84 million from the average parent (Table 5,
column 3).
5. Implications and Concluding Remarks
Singapore’s inbound investment with all countries in the sample is skill-seeking in both
manufacturing and services sectors while for outbound investment it is labor seeking. With
industrialized countries, both inbound and outbound investment displayed a skill-seeking
motivation. Meanwhile, Singapore’s skill share rose considerably relative to the neighboring
26
developing countries in ASEAN and China supporting outward vertical investment in those
countries in both sectors. While skill differences have an insignificant impact on inbound
manufacturing investment from developing countries, they have a negative and significant impact
on inbound services investment, suggesting that Singapore’s abundant skills and shortages of skills
in partner developing countries result in horizontal investment from those countries.
The motivation for investment in the service sector is related to skill intensity rather than
on the need for proximity. With respect to the less skill intensive categories – aggregate transport,
construction and commerce - both inbound and outbound investments are labor seeking.
Furthermore, while inbound investment in the skill intensive categories, business, finance and real
estate is skill-seeking, outbound investment is labor seeking. Most of Singapore’s outbound
investment has gone to the ASEAN region as well as China and hence this result is not surprising.
Finally, services are distinguished on the basis of skill intensity, there is a significant difference
between the determinants of FDI in skill-intensive services and FDI in other services and goods.
However, when services are disaggregated on the basis of “proximity” needs, there is no
significant difference in the determinants of FDI in proximity services compared to FDI in non-
proximity services.
Finally, our results show that MNEs from remote industrialized countries such as the US
and the UK may invest more in Singapore to reinvest in neighboring developing countries for
services but not for manufacturing. There are indications that there is a regional orientation from
MNEs located in remote industrialized countries such as the US and the UK regarding the service
sectors. Nearby countries such as Australia have the luxury of directly investing in the ASEAN
region from their own countries without having to invest first in Singapore. However, it should be
noted that the results vary by the category of service sectors. While MNEs in less skill intensive

27
service sectors do not exhibit this pattern, i.e., distance reduces investment, MNEs in more skill
intensive sectors such as finance do, i.e., distance increases investment. Thus, while MNEs in the
service sectors such as banking and finance likely invest in Singapore to reinvest, this is not the
case regarding sectors such as transport.

28
References
Alderman, H., Berhrman, J.R., Lavy, V. and Menon, R. 2001. “Child Health and School Enrollment: A
Longitudinal Analysis.” Journal of Human Resources 36, 185-205.
Ahsan, A., Abella, M., Beath, A., Huang, Y., Luthria, M. and Nguyen, T.V. 2014. “International Migration
and Development in East Asia and the Pacific.” World Bank, Washington DC.
Anwar, S. 2008. “Foreign Investment, Human Capital and Manufacturing Sector Growth in Singapore.”
Journal of Policy Modeling, 30: 447-453.
Awokuse, T.O. Maskus, K. E. and Yiting A. 2012. “Knowledge Capital, International Trade and
Foreign Direct Investment: A Sectoral Analysis,” Economic Inquiry 50:707-23.
Baltagi, B.H., Egger, P. and Pfaffermayr, M. 2007. “Estimating Models of Complex FDI: Are
there Third-Country Effects.” Journal of Econometrics, 140: 26-281.
Becker, S.O., Cindirella, F. and Woessmann, L. 2009. “The Tradeoff between Fertility
and Education: Evidence from before the Demographic Transition.” IZA Working Paper Series,
Bonn, Germany.
Behrman, J., Hoddinott, J.F., Maluccio, J.A., Soler-Hampejsek, E., Behrman, E.L.,
Martorell, R., Ramirez-Zia, M. and Stein, A.D. 2006. “What Determines Adult Cognitive Skills?
Impacts of Pre-Schooling Experiences in Guatemala.” Population Studies Center Working Paper
Series, University of Pennsylvania, Philadelphia.
Bergstrand, J.H. and Egger, P. 2007. “A Knowledge-and Physical Capital Model of International Trade
Flows, Foreign Direct Investment, and Multinational Enterprises.” Journal of International
Economics 73: 278-308.
Bergstrand, J.H. and Pfaffermayr, M. 2005. “Trade, Multinational Sales, and FDI in a Three-Factor Model.”
Review of International Economics, 13: 659-675.
Bharadwaj, P., Loken, K.V. and Neilson, C. 2013. “Early Life Health Interventions and Academic
Achievement.” American Economic Review, 103: 1862-1891.
Black, S. E., Devereux, P.J., and Salvanes, K.G. 2005. “The More the Merrier?
The Effect of Family Size and Birth Order on Children’s Education.” Quarterly Journal of
Economics 120 (2): 669-700.
Blonigen, B.A., Davies, R.B. and Head, K. 2003. “Estimating the Knowledge-Capital Model of the
Multinational Enterprise: Comment.” American Economic Review 93: 980-994.
Blonigen, B.A. and Wang, M. 2004. “Inappropriate Pooling of Wealthy and Poor Countries in Empirical
FDI Studies.” In T.H. Moran, E.M. Graham and M. Blomstrom, editors, Does Foreign Direct
Investment Promote Development? Washington DC: Peterson Institute for International Economics.
Braconier, H., Norback, P-J and Urban, D. 2005. “Reconciling the Evidence on the Knowledge Capital
Model.” Review of International Economics 13: 770-786.
29
Carr, D.,Markusen, J.R. and Maskus, K.E. 2001. “Estimating the Knowledge-Capital Model of the
Multinational Enterprise.” American Economic Review, 91: 693-708.
Chellaraj, G., K.E. Maskus and A. Mattoo. 2013. “Labor Skills and Foreign Direct Investment in a
Dynamic Economy: Estimating the Knowledge-Capital Model for Singapore.” Review of
Development Economics, 17: 627-643.
Chellaraj, A. 2000. “Justice for Sale or Justice for all?” Unpublished Document, John F. Kennedy School of
Government, Harvard University, Cambridge, MA. USA.
Chin, L. 2007. “Facility Management in Singapore: Training and Education.” Paper Presented at the 14th
Pacific Rim Real Estate Conference, National University of Singapore.
Dollar, D., Hallward-Driemeier, M. and Mengistae, T. 2004. “Investment Climate and International
Integration,” Policy Research Working Paper, No. 3323, World Bank, Washington, DC.
Gao, T. 2003. “Ethnic Chinese Networks and International Investment: Evidence from Inward FDI in
China.” Journal of Asian Economics, 14: 611-629.
Glewwe, P., Jacoby, H.G. and Kim, E.M. 2001. “Early Childhood Nutrition and Academic Achievement: A
Longitudinal Analysis.” Journal of Public Economics 81(2), 345-368.
Hanushek, E.A. and Woesmann, L. 2015. “The Knowledge Capital of Nations: Education and the
Economics of Growth.” The MIT Press, Cambridge, MA, USA.
Helpman, E. 1984. “A Simple Theory of International Trade with Multinational Corporations.” Journal of
Political Economy 92: 451-471.
Lankhuizen, M. 2014. “The (Im) possibility of Distinguishing Horizontal and Vertical Motivations of FDI.”
Review of Development Economics, 18: 139-151.
Mariel, P., Orbe, S. and Rodriguez, C. 2009. “The Knowledge-Capital Model of FDI: A Time Varying
Coefficients Approach.” Scottish Journal of Political Economy, 56: 196-212.
Markusen, J.R. 2002. Multinational Firms and the Theory of International Trade. MIT Press, Cambridge,
MA.
Markusen, J.R. 1984. “Multinationals, Multi-Plant Economies, and the Gains from Trade.” Journal of
International Economics 16: 205-226.
Markusen, J.R. and Maskus, K.E. 2002. “Discriminating Among Alternative Theories of the Multinational
Enterprise.” Review of International Economics, 10: 694-707.
Rosenzweig, M. R. and Schultz, T. P. 1987. "Fertility and Investments in Human
Capital: Estimates of the Consequences of Imperfect Fertility Control in Malaysia," Journal of
Econometrics, 36: 163–184.
Shin, J-S. 2005. “The Role of State in the Increasingly Globalized Economy: Implications for Singapore.”
The Singapore Economic Review, 50: 103-116.

30
Sim, N. Forthcoming. “Astronomics in Action: The Graduate Earnings Premium and the Dragon Effect in
Singapore.” Economic Inquiry.
Tanaka, K. 2009. “Re-estimating the Knowledge-Capital Model: Evidence from Japanese and US
Multinational Enterprises.” Hitsobashi University Technical Report.
Yusuf, S. and Nabeshima, K. 2012. Some Small Countries Do It Better: Rapid Growth and
Its Causes in Singapore, Finland and Ireland, Washington DC: World Bank.
31
Table 1. Singapore’s Manufacturing and Services FEI Stocks to and from Developing and
Industrialized Countries (% of total in parantheses), 2012 (1990 Billion US$)
Category Total (1990
Bill US $)
Developing
(1990 Bill
US$)
Industrialized
(1990 Bill US$)
Manufacturing
Inbound
51.6
(100.0)
3.8
(7.3)
47.8
(92.7)
Manufacturing
Outbound
24.7
(100.0)
20.1
(81.5)
4.6
(18.5)
Services Inbound 199.9
(100.0)
23.3
(11.7)
176.6
(88.4)
Construction +
Transport +
Commerce Inbound
58.1
(100.0)
5.9
(10.1)
52.2
(89.9)
Business + Finance+
Real Estate Inbound
141.8
(100.0)
17.4
(12.3)
124. 4
(87.7)
Services Outbound 77.7
(100.0)
43.3
(55.7)
34.4
(44.3)
Construction +
Transport +
Commerce Outbound
22.5
(100.0)
12.7
(56.4)
9.8
(43.6)
Business + Finance+
Real Estate Outbound
55.3
(100.0)
30.7
(55.5)
24.6
(44.5)
Source: Foreign Equity Investment in Singapore, 2012
Singapore Investment Abroad, 2012, Department of Statistics, Government of Singapore
32
Table 2. Global Average Skill Intensity for Selected Categories of Manufacturing and Service Sector
Industries (% of Total Factors of Production), 2010
Category of Industry Skilled Labor (%) Unskilled Labor (%) Other Factors (%)
MANUFACTURING
Petroleum 5.1 10.1 84.8
Textiles 9.6 29.5 60.9
Chemicals 13.1 13.1 63.2
Metal Products 13.9 33.9 52.2
Paper 15.1 30.2 54.7
Electronic Equipment 15.2 24.4 60.4
Transport Equipment 16.0 30.7 53.3
SERVICES
Water Transport 10.6 22.5 66.9
Air Transport 12.6 29.6 57.8
Other Transport 14.6 33.5 49.9
Commerce 15.2 35.9 48.9
Construction 15.4 36.1 48.5
Business Services 18.3 19.1 62.6
Communication 20.6 21.5 57.9
Financial Services 27.1 24.4 48.5
Education and Health 35.5 35.5 29.0
Source: https://www.gtap.agecon.purdue.edu/resources/download/704.pdf
Note; skill intensity in percentage is calculated for the world as a whole. Skilled labor includes
professional workers such as managers and administrators, professionals and para professionals. While
unskilled labor includes production workers such as farm workers and clerks. “Other Factors” include
capital, natural resources, land and indirect tax
33
Table 3. Second-Stage Tobit Results for Singapore’s Manufacturing and Services Inbound and
Outbound Investment with Year and Country Fixed Effects, 1993-2012
Regressors Manufacturing
Inbound
1993-2012
Manufacturing
Outbound
1993-2012
Services
Inbound
1993-2012
Services
Outbound
1993-2012
GDP Sum 0.00002
(0.08)
0.0008***
(6.47)
0.0004
(1.64)
0.002***
(8.04)
GDP Diff. Squared -1.17e-11
(-1.42)
-2.23e-11***
(-6.72)
3.95e-12
(0.56)
-3.65e-11***
(-5.05)
Skill Diff. -9004
(-1.56)
6387***
(5.50)
-9943***
(-3.18)
26699***
(4.96)
GDP Diff.*Skill Diff. 0.0001
(0.10)
-0.001
(1.75)
-0.004***
(-2.81)
0.0004
(1.53)
IC Host -87.16
(-1.59)
10.16
(1.05)
-50.30
(-1.06)
28.92
(1.31)
INST Host -958.06**
(-2.08)
-31.59***
(4.67)
-69.75
(-0.17)
-15.74
(-1.06)
INFRA Host -877.77***
(-2.58)
-58.24***
(-3.17)
-624.38**
(-2.29)
-162.42***
(-4.21)
TC Host 87.45
(0.14)
3.37
(0.48)
-31.43
(-0.70)
-4.87
(-0.34)
TC Host*Squared
Skill Diff.
-380.21
(-1.10)
365.55***
(3.95)
-920
(-1.36)
331.85***
(3.70)
TC Parent 23.53
(1.40)
-24.62
(-1.02)
9.58
(0.66)
75.72
(0.39)
Distance -0.09
(-0.89)
0.03
(0.86)
0.44***
(3.86)
-2.47***
(-7.95)
Common Language 3692**
(2.57)
3398***
(15.64)
2663***
(4.03)
1029**
(2.05)
Intercept 27087
(1.81)
175.10
(0.30)
7792
(1.75)
621.40
(0.15)
Observations 320 320 320
Sargan P Value 0.093 0.108 0.102 0.16
F test for Weak
Instruments
10.63 17.11 12.78 16.46
Log Likelihood -2841 -2463 -2792 -2737
Note: *** Significant at 1% level
**Significant at 5% level

34
Table 4. Second-Stage Tobit Results for Singapore’s Manufacturing and Services Inbound and
Outbound Investment with Developing Countries with Year and Country Fixed Effects, 1993-2012
Regressors Manufacturing
Developing
Countries
Inbound
1993-2012
Manufacturing
Developing
Countries
Outbound
1993-2012
Services
Developing
Countries
Inbound
1993-2012
Services
Developing
Countries
Outbound
1993-2012
GDP Sum -0.0001
(-1.58)
-0.002
(-1.80)
-0.001
(-1.89)
0.006***
(7.85)
GDP Diff. Squared 1.60e-10
(1.65)
9.39e-09
(1.87)
6.05e-09
(1.86)
-3.84e-09
(-1.46)
Skill Diff. -171.40
(-0.77)
25759***
(8.86)
-21040***
(-6.15)
23207***
(2.93)
GDP Diff.*Skill Diff. 0.0003
(1.89)
0.001
(1.51)
-0.17***
(-8.29)
-0.002***
(-3.95)
IC Host 1.58
(1.10)
-1.00
(-0.06)
-40.68
(-0.96)
-45.44**
(-2.12)
INST Host -15.62
(-1.20)
-17.52***
(-2.53)
430.71
(1.12)
18.04
(1.89)
INFRA Host 9.46
(1.04)
13.42
(0.65)
134.34
(0.50)
-53.51**
(-1.99)
TC Host -1.43
(-0.63)
87.45***
(5.74)
71.08
(1.14)
751.23**
(2.37)
TC Host*Squared Skill
Diff.
23.90**
(1.96)
-215.63
(-1.72)
2739***
(3.25)
-1290
(-0.27)
TC Parent 0.27
(0.54)
89.19
(1.69)
0.17
(0.01)
-4.47
(-0.21)
Distance -0.14***
(-10.29)
-2.01***
(-8.06)
-1.34***
(-2.78)
-1.80***
(-4.43)
Common Language 177.79***
(9.78)
2864***
(4.50)
972.52***
(3.09)
1366***
(3.30)
Intercept 235.86
(1.47)
-3616**
(-2.52)
-5629
(-1.14)
-13314**
(-2.06)
Observations 100 100 100 100
Sargan P Value 0.088 0.103 0.102 0.103
F test for Weak
Instruments
9.21 11.22 10.78 10.01
Log Likelihood -442 -782 -781 -811
Note: ***Significant at 1% level
**Significant at 5% level
35
Table 5. Second-Stage Tobit Results for Singapore’s Manufacturing and Services Inbound and
Outbound Investment with Industrialized Countries with Year and Country Fixed Effects, 1993-2012
Regressors Manufacturing
Industrialized
Countries
Inbound
1993-2012
Manufacturing
Industrialized
Countries
Outbound
1993-2012
Services
Industrialized
Countries
Inbound
1993-2012
Services
Industrialized
Countries
Outbound
1993-2012
GDP Sum 0.006
(1.30)
-0.00002
(-0.53)
0.001***
(2.85)
-0.004
(-1.45)
GDP Diff. Squared -3.05e-11**
(-2.51)
8.15e-12
(1.51)
-1.88e-11**
(-1.96)
2.08e-11
(1.88)
Skill Diff. -125190***
(-3.69)
-41005***
(-4.92)
-71457***
(-5.21)
-17514***
(-2.88)
GDP Diff.*Skill Diff. 0.004
(1.82)
0.0003
(1.41)
0.0004
(0.03)
-0.0008
(-1.19)
IC Host -246.47***
(-3.22)
-20.34
(1.86)
-197.51***
(-3.22)
49.67
(1.92)
INST Host -1741***
(-2.69)
11.86
(1.00)
-1031.11**
(-1.97)
6.58
(0.16)
INFRA Host -1448***
(-3.02)
-38.18
(-1.62)
-1447***
(-3.78)
-169.37**
(-2.48)
TC Host -35.33
(-1.03)
35.61***
(5.12)
893.77
(0.43)
1170***
(5.26)
TC Host*Squared Skill
Diff.
3550***
(3.63)
-63.29
(-1.04)
2177***
(2.79)
729.94**
(2.05)
TC Parent -86.73**
(-2.46)
-55.49
(-0.22)
-105.85
(-3.67)
-4.42
(-0.28)
Distance -0.35
(-1.44)
-1.10***
(-4.52)
1.16***
(5.54)
-0.22***
(-5.11)
Common Language 7754**
(2.20)
-558.26
(--0.68)
10765**
(2.23)
4033***
(11.65)
Intercept 54536***
(3.30)
12040**
(2.02)
-2008
(-0.04)
-19925***
(-4.23)
Observations 220 220 220 220
Sargan P Value 0.106 0.104 0.149 0.107
F test for Weak
Instruments
10.37 10.56 15.11 10.85
Log Likelihood -1977 -1381 -1926 -1820
Note:***Signficiant at 1% level
**Signficnat at 5% level
36
Table 6. Second-Stage Tobit Results for Singapore’s Categories of Services Inbound and Outbound
Investment with Year and Country Fixed Effects Aggregated by Skill Intensity, 1993-2012
Regressors Construction +
Transport +
Commerce
Inbound
1993-2012
Construction +
Transport +
Commerce
Outbound
1993-2012
Business +
Finance + Real
Estate
Inbound
1993-2012
Business +
Finance +
Real Estate
Outbound
1993-2012
GDP Sum -0.0003
(-0.70)
0.0001
(1.32)
0.012***
(4.20)
0.002***
(7.99)
GDP Diff. Squared -4.98e-12
(-0.31)
-1.46e-12
(-0.84)
2.26e-11***
(3.02)
-3.57e-11***
(-5.52)
Skill Diff. 33656**
(2.23)
6744***
(8.58)
-12562***
(-3.77)
17458***
(2.84)
GDP Diff.*Skill Diff. -0.007***
(-2.82)
0.001
(1.87)
0.002
(1.76)
0.003
(1.22)
IC Host -35.36
(-0.37)
6.15
(1.06)
-40.02
(-0.79)
17.97
(0.85)
INST Host -671.61
(-0.82)
-5.22**
(-2.50)
-45.20
(-0.10)
-10.16
(-0.79)
INFRA Host 688.70
(1.09)
-37.16***
(-3.87)
-336.36
(-1.14)
-129.40***
(-3.68)
TC Host 11.93
(1.33)
25.41**
(2.44)
-17.18
(-0.36)
28.11**
(2.02)
TC Host*Squared
Skill Diff.
-136.85
(-0.20)
284.07***
(5.59)
-1293
(-1.70)
46.81***
(2.91)
TC Parent -15.14
(-0.51)
-16.83***
(-4.67)
23.91
(1.55)
-8.82
(-0.19)
Distance -0.84
(-1.07)
-0.04**
(-2.03)
0.49***
(4.00)
-1.54***
(-2.73)
Common Language 1831
(0.90)
1047**
(1.96)
1774***
(2.55)
1024
(1.41)
Intercept -2325
(-1.28)
1307
(1.91)
1994
(0.42)
1246
(0.94)
Observations 320 320 320 320
Sargan P Value 0.107 0.111 0.106 0.117
F test for Weak
Instruments
10.83 11.66 11.21 12.44
Log Likelihood -3011 -2145 -2813 -2657
Note: ***Significant at 1% level
**Significant at 5% level
Construction + Transport + Commerce is labor seeking both inbound and outbound
Business + Finance + Real Estate is skill seeking inbound but labor seeking outbound

37
Table 7. Second-Stage Tobit Results for Singapore’s Categories of Services Inbound and Outbound
Investment Aggregated by Proximity with Year and Country Fixed Effects, 1993-2012
Regressors Construction +
Real Estate +
Commerce
Inbound
1993-2012
Construction +
Real Estate +
Commerce
Outbound
1993-2012
Business +
Finance +
Transport
Inbound
1993-2012
Business +
Finance +
Transport
Outbound
1993-2012
GDP Sum -0.00001
(-1.19)
0.0007***
(8.03)
0.0004
(1.39)
-0.004
(-0.91)
GDP Diff. Squared 4.30e-13
(1.24)
-2.11e-11***
(-9.53)
4.44e-11***
(4.94)
5.51e-12
(-0.49)
Skill Diff. 630.49
(1.21)
1380***
(2.33)
7725
(1.46)
1992***
(2.60)
GDP Diff.*Skill Diff. 0.0001
(1.12)
0.0002
(0.47)
0.002
(1.60)
-0.01
(-0.44)
IC Host 185.56
(1.45)
15.47
(1.41)
-91.66
(--1.23)
-33.61
(-1.01)
INST Host -385.88**
(-2.15)
-7.82**
(-2.03)
-2504***
(-4.20)
-61.99**
(-2.84)
INFRA Host -76.70
(-1.84)
8.06
(0.83)
-6201***
(-4.53)
2.26
(-0.04)
TC Host 2.15
(1.70)
-3.72
(-0.34)
1142
(0.56)
-32.68
(-1.73)
TC Host*Squared
Skill Diff.
32.98***
(3.27)
-170.22
(-1.36)
-69.41
(-0.21)
239.97
(0.67)
TC Parent -27.95***
(-2.70)
-11.77***
(-3.22)
-56.85
(-1.33)
0.44
(0.01)
Distance 0.01
(0.14)
-1.22***
(-4.44)
-0.37
(-1.29)
-2.72**
(-1.96)
Common Language 2.48
(0.06)
1354
(4.46)
482.99
(0.74)
1073
(0.70)
Intercept 2400
(1.88)
-527.33
(-1.11)
4148***
(5.04)
4412**
(2.30)
Observations 320 320 310 320
Sargan P Value 0.095 0.100 0.087 0.098
F test for Weak
Instruments
9.77 10.03 9.22 10.06
Log Likelihood -1287 -1879 -1484 -2263
Construction + Real Estate + Commerce and Business + Finance + Transport has no impact on skills for
inbound but vertical for outbound.
Note: ***Significant at 1% level
**Significant at 5% level