Embed Size (px)
Citation preview

THE JOURNAL OF FINANCE • VOL. , NO. 00 • JANUARY 2020
Can Unemployment Insurance SpurEntrepreneurial Activity? Evidence from France
JOHAN HOMBERT, ANTOINETTE SCHOAR, DAVID SRAER,and DAVID THESMAR∗
ABSTRACT
We evaluate the effect of downside insurance on self-employment. We exploit a large-scale reform of French unemployment benefits that insured unemployed workersstarting businesses. The reform significantly increased firm creation without decreas-ing the quality of new entrants. Firms started postreform were initially smaller, buttheir employment growth, productivity, and survival rates are similar to those prere-form. New entrepreneurs’ characteristics and expectations are also similar. Finally,jobs created by new entrants crowd out employment in incumbent firms almost one-for-one, but have a higher productivity than incumbents. These results highlight thebenefits of encouraging experimentation by lowering barriers to entry.
The problem with the French is that they have no word for entrepreneur.Attributed to George W. Bush.
OVER THE LAST TWO DECADES, policymakers and academics alike have em-braced the idea that reducing barriers to self-employment and entrepreneur-ship is important for promoting job creation.1 The primary focus of empiricalresearch has been on understanding how such barriers affect the level of en-trepreneurial activity (i.e., the number of new firms created). Many recent stud-ies find evidence of significant heterogeneity among potential entrepreneurs’
∗Johan Hombert is with HEC Paris. Antoinette Schoar is with MIT-Sloan, NBER, and CEPR.David Sraer is with UC Berkeley, NBER, and CEPR. David Thesmar is with MIT-Sloan andCEPR. This article is the substantially revised version of a paper previously circulated underthe title “Should the Government Make it Safer to Start a Business? Evidence From a FrenchReform.” We thank participants at many conferences and seminars for comments and suggestions.In particular, we are indebted to Ashwini Agrawal, Steve Davis, Guy Laroque, David Matsa, TobyMoskowitz, Marina Niessner, Elena Simintzi, and Amit Seru for their valuable insights. The dataused in this paper are confidential but not the authors’ exclusive access. We have read The Journalof Finance disclosure policy and have no conflicts of interest to disclose.
Correspondence: David Thesmar, MIT Sloan School of Management, CEPR, 100 Main Street,Cambridge, MA 02142; e-mail: [email protected]
1 See the fast-growing literature on the impact of financial market and regulatory reforms onentrepreneurship, for example, Bertrand, Schoar, and Thesmar (2007), Cole (2009), Djankov et al.(2002), and Klapper, Laeven, and Rajan (2006).
DOI: 10.1111/jofi.12880C© 2020 the American Finance Association
1
2 The Journal of Finance R©
ability to grow, risk tolerance, ambition, and even optimism.2 In light of suchheterogeneity, the welfare implications of reducing barriers to entrepreneur-ship become unclear, as they depend crucially on how such policies affect thequality of new entrepreneurs. On the one hand, if individuals have privateinformation about their entrepreneurial abilities, lower barriers to entry maydecrease the quality of the average entrepreneur. On the other hand, reduc-ing start-up costs can lead skilled but risk-averse individuals to enter self-employment (Kihlstrom and Laffont (1979)) by allowing them to experimentand learn about their ability (as in Jovanovic (1982), Caves (1998), Manso(2011)).
In this paper, we empirically investigate how large reductions in the costof entry affect selection into entrepreneurship and allocative efficiency moregenerally. To do so, we exploit a large-scale reform of the French unemploy-ment insurance (UI) system that provides downside insurance to unemployedworkers starting a business. To derive testable predictions, we first develop anequilibrium model of occupational choice that features risk-averse individualswith heterogeneous entrepreneurial skills. Individuals decide between wageemployment or self-employment. The success of the firm is determined by acombination of skill (known in advance) and chance. In the model, provid-ing downside insurance to entrepreneurs increases entry, but the number andquality of new businesses depend on the dispersion of talent. When talent isrelatively heterogeneous, decreasing downside risk has a modest effect on newfirm creation, reduces entrepreneurial quality, and leads to a smaller reductionin the size of incumbent firms competing for the same resources. We refer tothis explanation as the selection view. In contrast, when the talent distributionis more homogeneous, providing downside insurance has a pronounced effecton new firm creation, a modest effect on entrepreneurial quality, and a signif-icant crowding-out effect on incumbents. In the latter case, facilitating entryincreases allocative efficiency by allowing relatively skilled but risk-averse indi-viduals to become entrepreneurs. Importantly, the model requires that workerscannot engage in risk-sharing contracts with outside financiers (e.g., throughrevolving credit or outside equity), so that the provision of downside insur-ance by the UI system generates real benefits for unemployed workers. In thissense, our model, and hence our interpretation of the data, is consistent withthe reform completing a missing insurance market (Rampini and Viswanathan(2010)). While the provision of downside insurance may also relax new firms’financial constraints, for example, by allowing entrepreneurs to pledge futureunemployment benefits, we reject this alternative interpretation in the data.
We empirically evaluate these trade-offs by exploiting a reform that facil-itated the transition of unemployed individuals into self-employment—Pland’Aide au Retour a l’Emploi (PARE). Prior to the PARE, unemployed workersstarting a business would lose all access to their UI benefits. After the reform,
2 See, among others, Haltiwanger, Jarmin, and Miranda (2013), Nanda (2008), Hurst and Pugs-ley (2011), Landier and Thesmar (2009), Holtz-Eakin, Joulfaian, and Rosen (1994a), and Schoar(2010).
Can Unemployment Insurance Spur Entrepreneurial Activity? 3
the UI agency filled the gap between unemployment benefits and realized en-trepreneurial income, thereby offering temporary protection against potentiallosses from entrepreneurship. We leverage firm- and individual-level admin-istrative data to evaluate how this large-scale reform affected not only firmcreation, but also the characteristics of newly created firms and industry-wideemployment. Our identification strategy relies on the heterogeneity across in-dustries in “exposure” to the reform. Unemployed individuals are empiricallymore likely to start zero-employee firms and/or register as sole proprietorships.Accordingly, we define exposure to the reform as the fraction of sole proprietorsamong all newly created firms in an industry, where we measure this “treat-ment intensity” in the years preceding the reform.3 Our empirical strategy isakin to a difference-in-difference analysis that compares changes in the num-ber and characteristics of newly created firms following the adoption of PAREacross industries with different treatment intensity. Our identifying assump-tion is that absent the reform, the dynamics of business creation would nothave been systematically related to industry treatment intensity.4
Our first empirical analysis establishes that the reform significantly boostednew business creation by unemployed workers. Relative to the prereform pe-riod, the registration of new firms in the postreform period is 14 percentagepoints higher in industries belonging to the top quartile of treatment intensity,relative to industries in the bottom quartile. This estimate is robust to a varietyof robustness checks, in particular to alternative definitions of treatment inten-sity or event window and to controls for industries exposure to business cycleshocks. We also find support for our causal interpretation of this estimate byshowing that, in the cross section of industries, the postreform increase in newfirm creation strongly correlates with the entry of unemployed entrepreneurs.
We next document that firms created in response to the reform are not of(observable) worse quality. We first measure quality using ex post outcomes andshow that, relative to the prereform period, there are no significant changesin failure rates, hiring rates, or growth rates of firms started after the reformin the most versus least treated industries. Using administrative survey data,we also measure quality using ex ante characteristics of entrepreneurs such aseducation and self-reported growth expectations. We find no significant effectof the reform on the composition of entrepreneurs’ educational backgroundsand we find a small, positive effect on subjective growth expectations. Overall,the evidence supports the experimentation view, whereby providing downsideinsurance induces new firm creation without significantly reducing the averagequality of the new entrepreneurs.
3 In Internet Appendix III, we show that our analysis is robust to defining treatment intensity asthe fraction of firms with zero employees among newly created firms in an industry. The InternetAppendix is available in the online version of the article on The Journal of Finance website.
4 We explore the validity of this assumption by conducting numerous robustness checks. Inparticular, our relatively high-frequency data allow us to include industry-specific trends in theregression analysis. Including these trends does not affect our main estimates, which providessupport for the parallel trends assumption.
4 The Journal of Finance R©
Since our sample covers the universe of private and public firms in France,we can also evaluate how the entry of a large number of new firms due tothe reform affected industry-wide employment, and in particular the growthof incumbent firms. While we find no evidence of spillovers on large incumbentfirms, the reform did lead to a 2.6 percentage point decline in employmentamong small incumbents, which are more likely to compete in the product andlabor markets with these new entrants. This crowding-out effect among smallincumbents is economically large, as it mostly offsets the direct effects of thereform on employment creation by start-ups.5 We also document that wagesand productivity (measured as value-added or sales per worker) are signifi-cantly larger in newly created firms relative to the incumbents they crowd out:value-added per worker is €7,000 per year higher in recently created firmsrelative to shrinking incumbent firms. This productivity differential does notdecrease after the reform. Overall, while the reform led to small employmentgains in aggregate—as jobs created by new firms mostly crowded out existingjobs at incumbent firms—it led to a reallocation of resources from less pro-ductive incumbents to more productive young firms, contributing positively toaggregate productivity (in a similar vein, see also Adelino, Ma, and Robinson(2017)).
Related Literature
Our results make two novel contributions to the existing literature on bar-riers to entry into entrepreneurship: (i) we provide detailed microevidence onthe composition of entrepreneurs who enter self-employment when barriersto enter are relaxed and (ii) we document how removing barriers to entry af-fects incumbent firms. Previous literature looks at cross-country differencesin barriers to entry and their aggregate implications for entry rates (Djankovet al. (2002), Desai, Gompers, and Lerner (2003), Klapper, Laeven, and Rajan(2006)). Because of its focus on cross-country outcomes, this literature has notbeen able to test how barriers to entry affect the composition of the pool ofentrepreneurs (Mullainathan and Schnabl (2010), Bruhn (2011), Branstetteret al. (2014)).
Our paper also contributes to the literature on selection into entrepreneur-ship (Kihlstrom and Laffont (1979), Blanchflower and Oswald (1998), Hamilton(2000), Moskowitz and Vissing-Jørgensen (2002), Hurst and Pugsley (2011)).These papers document large heterogeneity in the talent, ambition, and riskpreferences of entrepreneurs, which translates into different investment andeffort choices following entry. We extend this literature by showing how anincrease in downside insurance affects self-selection into entrepreneurship.We also complement a large literature on the role of financing constraints on
5 These results bear some similarity to the literature on financial reforms, which also shows thatincreased entry is detrimental to incumbent firms. See Cetorelli and Strahan (2006), Bertrand,Schoar, and Thesmar (2007), and Kerr and Nanda (2009a).
Can Unemployment Insurance Spur Entrepreneurial Activity? 5
entrepreneurship.6 Closest to our paper is Gottlieb, Townsend, and Xu (2016),who study the effect of an extension of protected employment leave to one yearfor female employees who give birth. Like us, they find that downside protec-tion promotes transition into self-employment and that these newly createdfirms are not less likely to create jobs.
Finally, our paper is related to the vast literature that examines how un-employment benefits distort labor supply, and in particular unemployment du-ration (Moffitt (1985), Solon (1985), Katz and Meyer (1990), Card and Levine(2000), among many others). Relative to these papers, our contribution high-lights an often-ignored distortionary effect of UI on the transition into self-employment. In the same way that UI can reduce the incentives of unemployedworkers to find a new job, the risk of losing unemployment benefits can reducethe incentives of unemployed individuals to start a new firm and create theirown job. Our results show that this margin is quantitatively large.
The rest of the paper is organized as follows. We describe the reform inSection I. We develop our simple economic framework in Section II, and wediscuss the data and the empirical strategy in Sections III and IV. We reportresults on the direct effect of the reform on the number and quality of newfirms in Section V and on the aggregate effect of the reform on employmentand productivity in Section VI. Finally, in Section VII, we conclude.
I. The Reform and Institutional Details
A. Description of the PARE Reform
Before describing the reform, it is important to define what we refer to asentrepreneurs in the paper. An entrepreneur is an individual who registers alegal structure (sole proprietorship or LLC) to receive entrepreneurial income.Many of these entrepreneurs are “self-employed,” in the sense that they haveno employee beyond themselves. In France, all self-employed individuals mustbe “entrepreneurs” according to this definition—it is illegal to receive pay-ments without a formal legal structure, even for low-skill/low-scale activities.We therefore measure entrepreneurship using the number of legal structurescreated. Note that entrepreneurs (whether self-employed or not) do not haveaccess to the public UI scheme that we study here.7 Thus, the reform de-scribed below did not mechanically affect (i) the propensity to create a firmconditional on being self-employed (it is illegal not to) or (ii) the eligibility ofself-employed/entrepreneurs to enroll in the UI system (such individuals arenot eligible).
6 See, among others, Evans and Jovanovic (1989), Holtz-Eakin, Joulfaian, and Rosen (1994a,b), Hurst and Lusardi (2004), de Mel, McKenzie, and Woodruff (2008), Kerr and Nanda (2009b),Bianchi and Bobba (2013), Adelino, Schoar, and Severino (2015), and Schmalz, Sraer, and Thesmar(2017).
7 A private, optional UI system exists for entrepreneurs, but the participation rate is extremelylow and it was not affected by the reform we study.
6 The Journal of Finance R©
The PARE reform (Plan d’Aide au Retour a l’Emploi) consisted of a newagreement between labor unions and employer organizations.8 The main ob-jective of this agreement was to make unemployment benefits more generousin exchange for tighter supervision of unemployed individuals and lower con-tributions of firms to the UI body (Crepon, Dejemeppe, and Gurgand (2005)).In addition to changes in unemployment benefits, an important provision ofthis new agreement was to reduce the implicit disincentives for unemployedworkers to start a new business. The agreement was signed by unions in Jan-uary 2001 and became effective on July 1 (for the text, see UNEDIC (2001)).However, its provisions, as described below, were not advertised before thebeginning of 2002.
Turning to its provisions, the PARE reform allows unemployed entrepreneursto claim unemployment benefits in the case of business failure. Before thereform, an unemployed worker would lose eligibility to the accumulated un-employment benefits when starting a business, even if the business subse-quently failed. The new agreement allows formerly unemployed entrepreneursto retain their rights to the remaining unemployment benefits for up to threeyears if their business fails.9 Second, the reform also stipulates that unem-ployed entrepreneurs can supplement their income with unemployment bene-fits. However, the income derived from their entrepreneurial activity crowds outunemployment benefits one-for-one: each additional euro of income reduces un-employment benefits by exactly 1 euro, until unemployment benefits are zero(Rieg (2004)). As a result, an unemployed entrepreneur has unearned bene-fits if she generates positive entrepreneurial income. Finally, these unearnedbenefits are not voided but remain actionable for up to three years after thebeginning of the unemployment spell.10
In sum, following the PARE reform, unemployed individuals who decideto start a business are guaranteed to receive an amount equal to their un-employment benefits for at least two years and up to three years. Becauseentrepreneurial income crowds out unemployment benefits one-for-one, theimplicit subsidy under this new regime comes only through downside insur-ance. For an unemployed entrepreneur certain to generate more income thanits unemployment benefits, the reform does not change anything: before thereform, such an entrepreneur would not be eligible to unemployment benefits,while after the reform, she would be eligible but would not earn any additionalincome since her entrepreneurial income exceeds her unemployment benefits.Similarly, an unemployed individual certain to generate entrepreneurial in-come lower than her unemployment benefits would have no incentive to start
8 In France, labor and employer unions jointly run the UI agency.9 See Articles 1-5 in UNEDIC (2001).10 Each month, the unemployment agency uses the daily preunemployment wage, w, as a bench-
mark. It then divides monthly entrepreneurial income by the daily wage, w, to obtain the numberof days, d, in the months in which the jobless person receives the equivalent of her former salary.The agency then pays unemployment benefits based on 28 − d days of unemployment. However,the individual retains the “rights” to unpaid unemployment benefits corresponding to d workeddays, which she can claim for up to three years.
Can Unemployment Insurance Spur Entrepreneurial Activity? 7
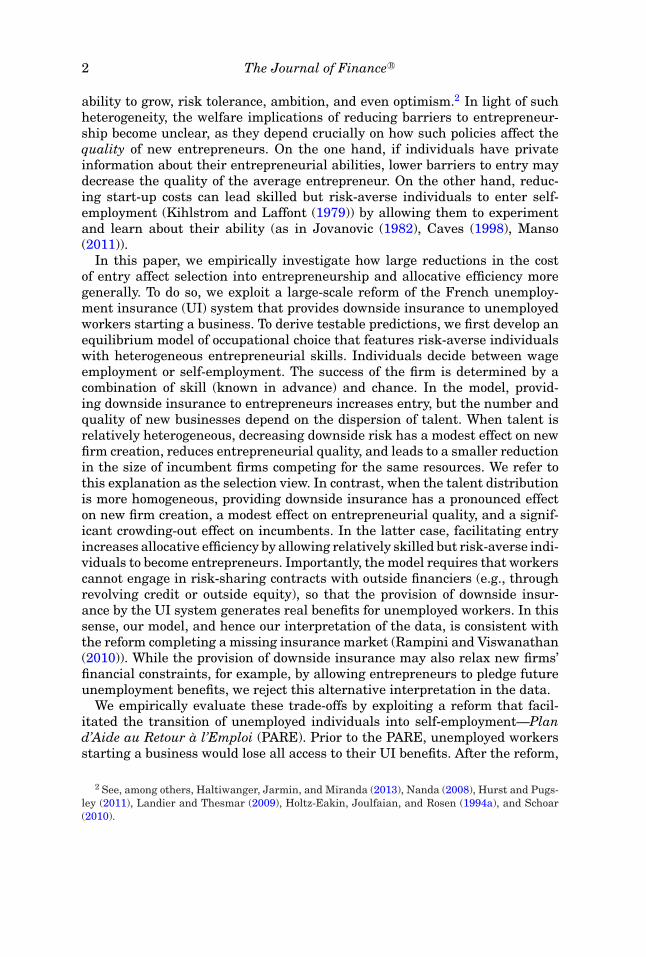
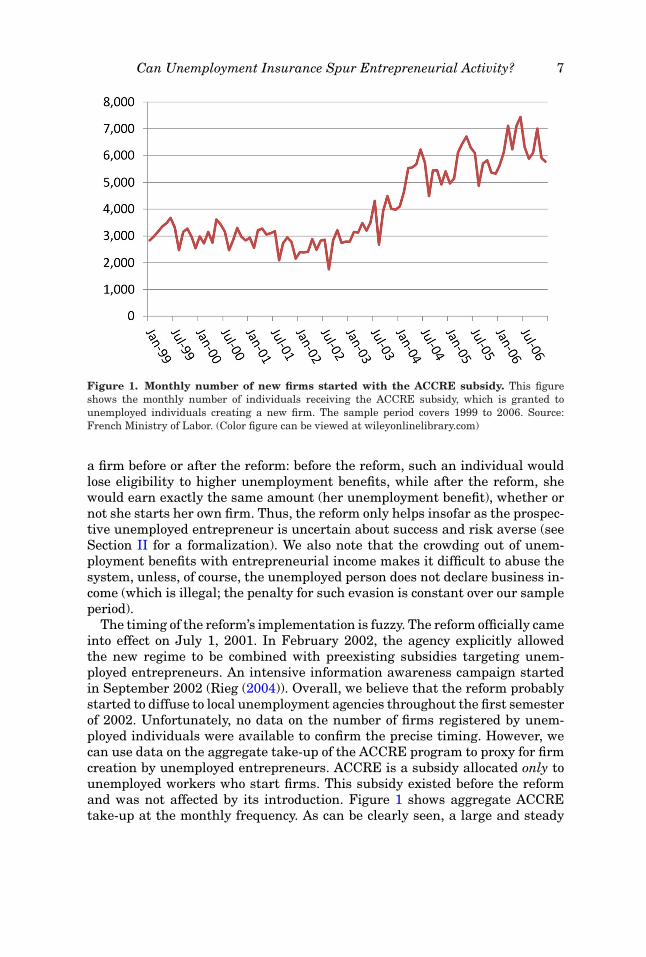
Figure 1. Monthly number of new firms started with the ACCRE subsidy. This figureshows the monthly number of individuals receiving the ACCRE subsidy, which is granted tounemployed individuals creating a new firm. The sample period covers 1999 to 2006. Source:French Ministry of Labor. (Color figure can be viewed at wileyonlinelibrary.com)
a firm before or after the reform: before the reform, such an individual wouldlose eligibility to higher unemployment benefits, while after the reform, shewould earn exactly the same amount (her unemployment benefit), whether ornot she starts her own firm. Thus, the reform only helps insofar as the prospec-tive unemployed entrepreneur is uncertain about success and risk averse (seeSection II for a formalization). We also note that the crowding out of unem-ployment benefits with entrepreneurial income makes it difficult to abuse thesystem, unless, of course, the unemployed person does not declare business in-come (which is illegal; the penalty for such evasion is constant over our sampleperiod).
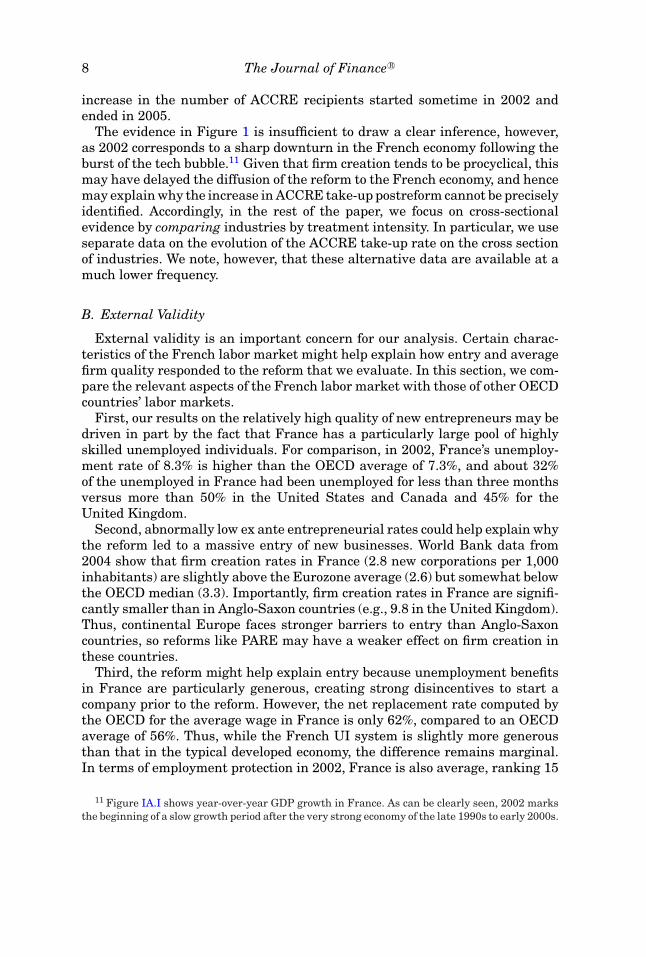
The timing of the reform’s implementation is fuzzy. The reform officially cameinto effect on July 1, 2001. In February 2002, the agency explicitly allowedthe new regime to be combined with preexisting subsidies targeting unem-ployed entrepreneurs. An intensive information awareness campaign startedin September 2002 (Rieg (2004)). Overall, we believe that the reform probablystarted to diffuse to local unemployment agencies throughout the first semesterof 2002. Unfortunately, no data on the number of firms registered by unem-ployed individuals were available to confirm the precise timing. However, wecan use data on the aggregate take-up of the ACCRE program to proxy for firmcreation by unemployed entrepreneurs. ACCRE is a subsidy allocated only tounemployed workers who start firms. This subsidy existed before the reformand was not affected by its introduction. Figure 1 shows aggregate ACCREtake-up at the monthly frequency. As can be clearly seen, a large and steady
8 The Journal of Finance R©
increase in the number of ACCRE recipients started sometime in 2002 andended in 2005.
The evidence in Figure 1 is insufficient to draw a clear inference, however,as 2002 corresponds to a sharp downturn in the French economy following theburst of the tech bubble.11 Given that firm creation tends to be procyclical, thismay have delayed the diffusion of the reform to the French economy, and hencemay explain why the increase in ACCRE take-up postreform cannot be preciselyidentified. Accordingly, in the rest of the paper, we focus on cross-sectionalevidence by comparing industries by treatment intensity. In particular, we useseparate data on the evolution of the ACCRE take-up rate on the cross sectionof industries. We note, however, that these alternative data are available at amuch lower frequency.
B. External Validity
External validity is an important concern for our analysis. Certain charac-teristics of the French labor market might help explain how entry and averagefirm quality responded to the reform that we evaluate. In this section, we com-pare the relevant aspects of the French labor market with those of other OECDcountries’ labor markets.
First, our results on the relatively high quality of new entrepreneurs may bedriven in part by the fact that France has a particularly large pool of highlyskilled unemployed individuals. For comparison, in 2002, France’s unemploy-ment rate of 8.3% is higher than the OECD average of 7.3%, and about 32%of the unemployed in France had been unemployed for less than three monthsversus more than 50% in the United States and Canada and 45% for theUnited Kingdom.
Second, abnormally low ex ante entrepreneurial rates could help explain whythe reform led to a massive entry of new businesses. World Bank data from2004 show that firm creation rates in France (2.8 new corporations per 1,000inhabitants) are slightly above the Eurozone average (2.6) but somewhat belowthe OECD median (3.3). Importantly, firm creation rates in France are signifi-cantly smaller than in Anglo-Saxon countries (e.g., 9.8 in the United Kingdom).Thus, continental Europe faces stronger barriers to entry than Anglo-Saxoncountries, so reforms like PARE may have a weaker effect on firm creation inthese countries.
Third, the reform might help explain entry because unemployment benefitsin France are particularly generous, creating strong disincentives to start acompany prior to the reform. However, the net replacement rate computed bythe OECD for the average wage in France is only 62%, compared to an OECDaverage of 56%. Thus, while the French UI system is slightly more generousthan that in the typical developed economy, the difference remains marginal.In terms of employment protection in 2002, France is also average, ranking 15
11 Figure IA.I shows year-over-year GDP growth in France. As can be clearly seen, 2002 marksthe beginning of a slow growth period after the very strong economy of the late 1990s to early 2000s.
Can Unemployment Insurance Spur Entrepreneurial Activity? 9
out of 28 according to the OECD Employment Protection Index. Finally, at thetime of the reform, France does not have an experience rating scheme, whichis common for most E.U. countries.
II. Economic Framework
In this section, we lay out the theoretical framework that will guide our em-pirical strategy. Starting from the model of entrepreneurship in Lucas (1978),we introduce two modifications. First, we allow entrepreneurship to be risky,which provides a role for entrepreneurial insurance. Second, we introduce twodistinct industries, which differ by their scale of production, to capture the in-tuition behind our empirical strategy that some industries are naturally moreexposed to UI reforms.
The two industries, T (Treatment) and C (Control), produce differentiatedgoods. Let xs be the consumption of the good produced in industry s ∈ {T , C}.All agents maximize a constant elasticity of substitution (CES) utility function,
U (xT , xC) = log((xσ−1
σ
T + xσ−1
σ
C )σ
σ−1 ), where σ > 0. Let ps be the price of each goods and y be the income of an agent. Indirect utility is then given by
U (y, pT , pC) = log(y) + 1σ − 1
log(
p1−σT + p1−σ
C
).
The model has two periods. In the first, agents choose between starting afirm or supplying labor. In the second, production takes place, entrepreneursin each industry receive profits, and workers receive salaries, which we normal-ize to one without loss of generality. All agents in the economy are potentialentrepreneurs. A measure one of potential entrepreneurs is tied to each in-dustry s. Industry knowledge is crucial for entrepreneurs but irrelevant forworkers. An agent tied to s can work in any industry, but can only start afirm in s. Starting a firm is risky: when an individual decides to become anentrepreneur, she first needs to determine whether there is a market for heridea. If there is no such market (with probability 1 − q), it is too late to becomea worker and she gets b, a government subsidy given to failed entrepreneurs.This subsidy is financed through a proportional income tax, which creates nodistortion since we have assumed log utility.
With probability q, the business survives, but its profit depends on abil-ity. The entrepreneur hires l workers and produces g(θ )A1−βlβ , where A is anaggregate productivity parameter, θ is entrepreneurial ability, and β ∈ (0, 1).We posit that g(θ ) ≡ θ1−β
(1−β)1−βββ to simplify notation. In each industry, en-trepreneurial ability is distributed according to a Pareto distribution with c.d.f.F(θ ) = 1 − (θ0/θ )φ , φ ≥ 1. Total costs consist of the wage bill l and a fixed costcs that depends on the industry. Industry T has a lower scale of production,that is, a lower fixed cost: cT < cC . Entrepreneurial profit is thus given byπs(θ, l, ps) = ps A1−βg(θ )lβ − l − cs.
As in Lucas (1978), the equilibrium is characterized by an ability thresholdθs in each industry, above which all agents become entrepreneurs and belowwhich all agents become workers. We model the reform as an increase in the
10 The Journal of Finance R©
downside protection for failed entrepreneurs b. We examine how this changein b affects entry, firm quality, and incumbent size across the two industries Tand C. We solve the model in closed form in Internet Appendix I. Proposition 1summarizes the results.
PROPOSITION 1: Assume that the reform consists of a marginal increase in b of�b. Then:
(1) The differential increase in the number of firms, Ns = 1 − F(θs), is givenby
� log(NT ) − � log(NC) = E(φ).
(2) The differential increase in firms’ average quality, qs = E(log(θ )|θ ≥ θs), isgiven by
�qT − �qC = −Q(φ).
(3) The average size of “incumbent” firm log(Ls) = E(log(l(θ ))|θ > θs) is givenby
� log(LT ) − � log(LC) = −S(φ).
The expectation E is positive and increasing, function Q is positive, decreas-ing, and tends to zero when φ → ∞, and function S is positive and increasing,where S(1) = 0. Neither E, Q, nor S depends on aggregate productivity A.
Proposition 1 first shows that the reform has a stronger effect on the low-scaleindustry T . This is the underlying principle behind our identification strategy.Quite intuitively, the minimum ability necessary to start a business is lowerin the low-scale sector. In addition, the distribution of ability has a decreasinghazard rate F ′(θ )/(1 − F(θ )) (similar to Pareto). As a result, the number of“marginal entrepreneurs” right below the threshold is larger in the treatedsector T , and thus, the reform brings in a heavier mass of entrepreneurs tothat industry. This induces more entry, more crowding out in industry T , anda larger decline in entrepreneurial quality.
Proposition 1 also shows that the reform’s effect on the economy depends onthe heterogeneity in skill distribution. When the shape parameter φ is closeto 1, entrepreneurial skill is highly heterogeneous and the reform only hasa small (positive) effect on entry: an increase in insurance b decreases theability threshold above which agents become entrepreneurs, but this effect islimited since agents are more “spread out” on the ability spectrum. Averagequality, however, does show a significant response to an increase in insur-ance, since marginal entrepreneurs are much worse than inframarginal ones.Because entry is limited, there is very little crowding out of incumbents (inthe limit, none since S(1) = 0). These predictions are consistent with the se-lection view described in the Introduction. Conversely, when entrepreneurialskill is homogeneous (large φ), an increase in insurance leads to a large ef-fect on entry, significant crowding out of existing firms, and a small decline
Can Unemployment Insurance Spur Entrepreneurial Activity? 11
in entrepreneurial quality, consistent with the experimentation view describedabove.
III. Data
We employ three sources of data, which we obtain from the French StatisticalOffice (INSEE): the exhaustive firm registry, accounting data on firm perfor-mance and employment, and a survey that is conducted every four years on asixth of all French entrepreneurs who register that year.
A. Registry
The firm registry contains the universe of firms registered in France eachmonth from 1993 to 2008. For each newly created firm, the registry includes theindustry the firm operates based on a four-digit classification system similar tothe four-digit NAICS. It also provides the firm’s legal status (Sole Proprietor-ship, Limited Liability Corporation, or Corporation). In addition, the registrydata contain an exhaustive list of French firms at the end of each year, whichwe use to construct an exit dummy.
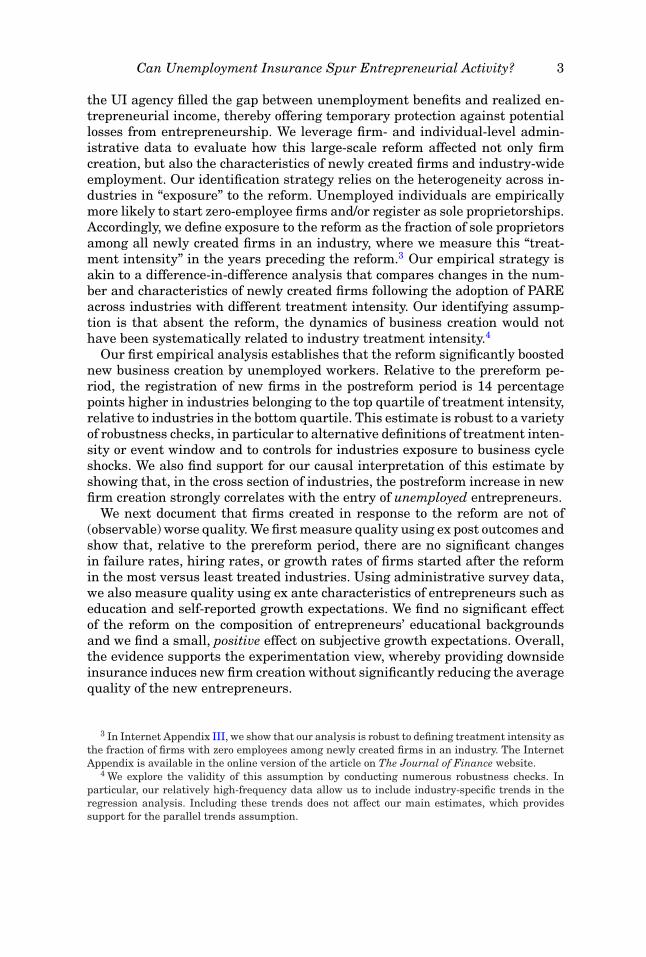
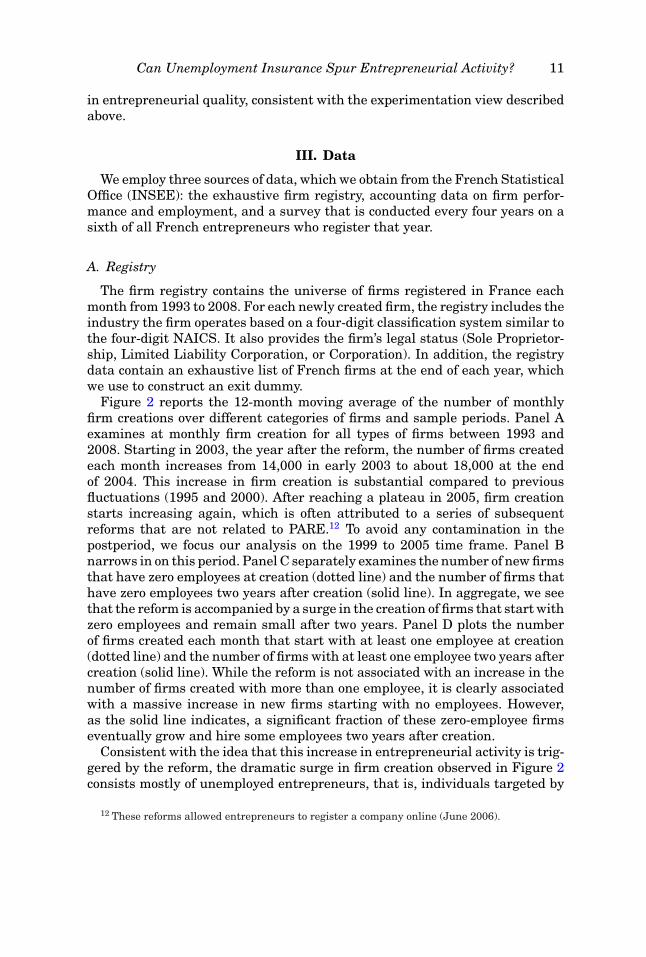
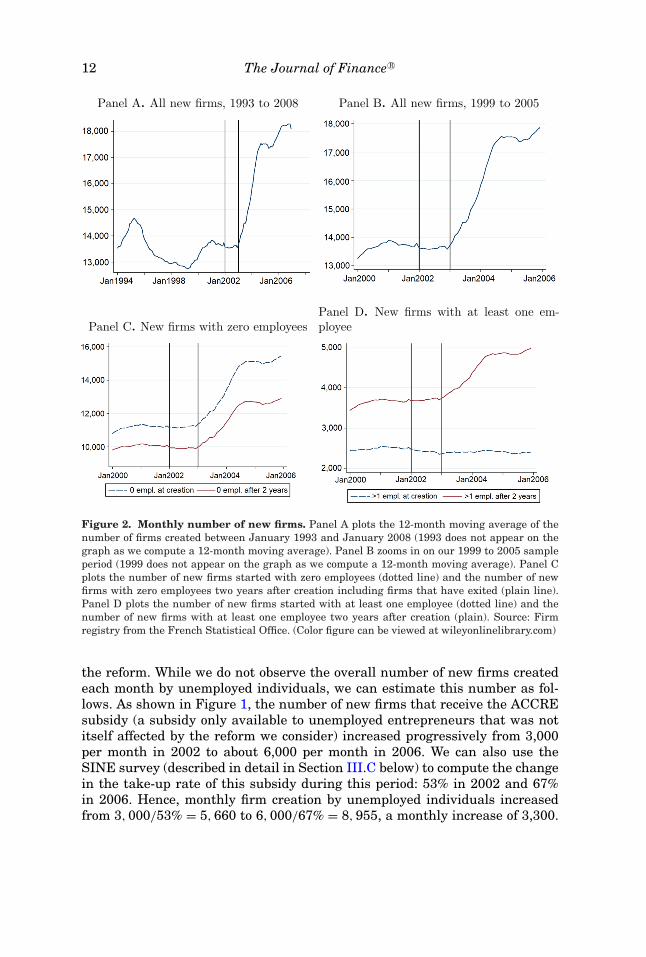
Figure 2 reports the 12-month moving average of the number of monthlyfirm creations over different categories of firms and sample periods. Panel Aexamines at monthly firm creation for all types of firms between 1993 and2008. Starting in 2003, the year after the reform, the number of firms createdeach month increases from 14,000 in early 2003 to about 18,000 at the endof 2004. This increase in firm creation is substantial compared to previousfluctuations (1995 and 2000). After reaching a plateau in 2005, firm creationstarts increasing again, which is often attributed to a series of subsequentreforms that are not related to PARE.12 To avoid any contamination in thepostperiod, we focus our analysis on the 1999 to 2005 time frame. Panel Bnarrows in on this period. Panel C separately examines the number of new firmsthat have zero employees at creation (dotted line) and the number of firms thathave zero employees two years after creation (solid line). In aggregate, we seethat the reform is accompanied by a surge in the creation of firms that start withzero employees and remain small after two years. Panel D plots the numberof firms created each month that start with at least one employee at creation(dotted line) and the number of firms with at least one employee two years aftercreation (solid line). While the reform is not associated with an increase in thenumber of firms created with more than one employee, it is clearly associatedwith a massive increase in new firms starting with no employees. However,as the solid line indicates, a significant fraction of these zero-employee firmseventually grow and hire some employees two years after creation.
Consistent with the idea that this increase in entrepreneurial activity is trig-gered by the reform, the dramatic surge in firm creation observed in Figure 2consists mostly of unemployed entrepreneurs, that is, individuals targeted by
12 These reforms allowed entrepreneurs to register a company online (June 2006).
12 The Journal of Finance R©
Panel A. All new firms, 1993 to 2008 Panel B. All new firms, 1999 to 2005
Panel C. New firms with zero employeesPanel D. New firms with at least one em-ployee
Figure 2. Monthly number of new firms. Panel A plots the 12-month moving average of thenumber of firms created between January 1993 and January 2008 (1993 does not appear on thegraph as we compute a 12-month moving average). Panel B zooms in on our 1999 to 2005 sampleperiod (1999 does not appear on the graph as we compute a 12-month moving average). Panel Cplots the number of new firms started with zero employees (dotted line) and the number of newfirms with zero employees two years after creation including firms that have exited (plain line).Panel D plots the number of new firms started with at least one employee (dotted line) and thenumber of new firms with at least one employee two years after creation (plain). Source: Firmregistry from the French Statistical Office. (Color figure can be viewed at wileyonlinelibrary.com)
the reform. While we do not observe the overall number of new firms createdeach month by unemployed individuals, we can estimate this number as fol-lows. As shown in Figure 1, the number of new firms that receive the ACCREsubsidy (a subsidy only available to unemployed entrepreneurs that was notitself affected by the reform we consider) increased progressively from 3,000per month in 2002 to about 6,000 per month in 2006. We can also use theSINE survey (described in detail in Section III.C below) to compute the changein the take-up rate of this subsidy during this period: 53% in 2002 and 67%in 2006. Hence, monthly firm creation by unemployed individuals increasedfrom 3, 000/53% = 5, 660 to 6, 000/67% = 8, 955, a monthly increase of 3,300.

Can Unemployment Insurance Spur Entrepreneurial Activity? 13
Table IIndustry Composition: Annual Data
This table reports the number of firms created each year during the prereform period (1999 to2001, column (1)) and the postreform period (2003 to 2005, column (3)) at the one-digit industrylevel. Columns (2) and (4) normalize these numbers by the total number of firms created in thepre- and postreform periods, respectively. Column (5) reports the growth in new firm creation inthe postreform period relative to the prereform period. Source: Firm registry from the FrenchStatistical Office.
Prereform % of Pre Postreform % of Post Pre-Post# Entries # Entries # Entries # Entries Growth
Industry (1) (2) (3) (4) (5)
Transport/utilities 4,937 3.3 5,031 2.6 2%Wholesale trade 11,942 7.9 12,711 6.6 6%Manufacturing 9,119 6.0 10,006 5.2 10%Mining 21 0.0 19 0.0 10%Services 68,266 45.0 84,317 44.0 23%Retail trade 25,498 16.8 34,683 18.1 36%Construction 25,454 16.8 34,970 18.3 37%FIRE 6,546 4.3 9,768 5.1 49%Total 151,787 100 191,506 100 26%
This number corresponds almost exactly to the increase in total firm creationobserved at the aggregate level, which goes from 14,000 to 17,500 (Figure 2).Hence, a detailed examination of the data allows us to trace the entirety of the2003 to 2005 surge in firm creations to unemployed entrepreneurs.
Table I provides annual data on firm creation for eight broad industries from1999 to 2005. Both pre- and postreform, newly created firms concentrate largelyin services, construction, and retail trade. These three industries compriseabout 70% of all firm creations in the prereform years. We also show thatthe industries with the largest growth of new entrants postreform are services,retail trade, construction, and finance, insurance, and real estate (FIRE), whichare labor-intensive, low-fixed-cost industries.13
Table II, Panel A, aggregates creation data at the four-digit industry level(290 industries) and then averages the monthly number of newly created firmsacross all months from January 1, 1999 to December 31, 2001 (our prereformperiod). The results show that, prereform, the average industry observes ap-proximately 43.6 creations per month, which leads to about 152,000 newlycreated firms per year.
B. Accounting Data
To analyze the long-term performance of new ventures, we complement theregistry data with accounting information from tax files (see Bertrand, Schoar,and Thesmar (2007) for a detailed description). Tax files provide us with the
13 A finer exploration of the data shows that, within the FIRE industries, most of the increasein the number of newly created firms occurs in real estate agencies.
14 The Journal of Finance R©
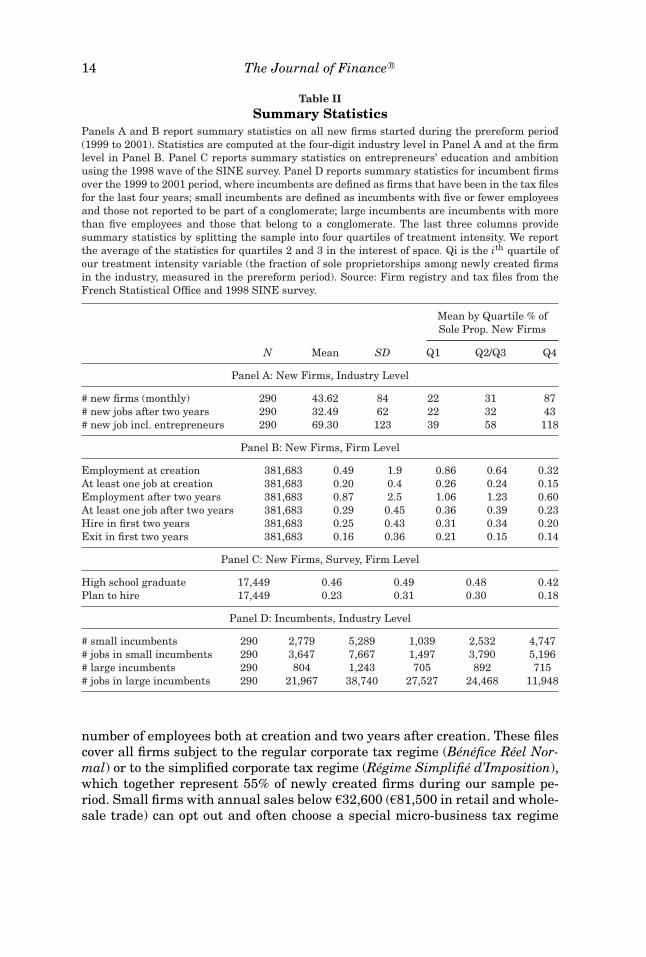
Table IISummary Statistics
Panels A and B report summary statistics on all new firms started during the prereform period(1999 to 2001). Statistics are computed at the four-digit industry level in Panel A and at the firmlevel in Panel B. Panel C reports summary statistics on entrepreneurs’ education and ambitionusing the 1998 wave of the SINE survey. Panel D reports summary statistics for incumbent firmsover the 1999 to 2001 period, where incumbents are defined as firms that have been in the tax filesfor the last four years; small incumbents are defined as incumbents with five or fewer employeesand those not reported to be part of a conglomerate; large incumbents are incumbents with morethan five employees and those that belong to a conglomerate. The last three columns providesummary statistics by splitting the sample into four quartiles of treatment intensity. We reportthe average of the statistics for quartiles 2 and 3 in the interest of space. Qi is the ith quartile ofour treatment intensity variable (the fraction of sole proprietorships among newly created firmsin the industry, measured in the prereform period). Source: Firm registry and tax files from theFrench Statistical Office and 1998 SINE survey.
Mean by Quartile % ofSole Prop. New Firms
N Mean SD Q1 Q2/Q3 Q4
Panel A: New Firms, Industry Level
# new firms (monthly) 290 43.62 84 22 31 87# new jobs after two years 290 32.49 62 22 32 43# new job incl. entrepreneurs 290 69.30 123 39 58 118
Panel B: New Firms, Firm Level
Employment at creation 381,683 0.49 1.9 0.86 0.64 0.32At least one job at creation 381,683 0.20 0.4 0.26 0.24 0.15Employment after two years 381,683 0.87 2.5 1.06 1.23 0.60At least one job after two years 381,683 0.29 0.45 0.36 0.39 0.23Hire in first two years 381,683 0.25 0.43 0.31 0.34 0.20Exit in first two years 381,683 0.16 0.36 0.21 0.15 0.14
Panel C: New Firms, Survey, Firm Level
High school graduate 17,449 0.46 0.49 0.48 0.42Plan to hire 17,449 0.23 0.31 0.30 0.18
Panel D: Incumbents, Industry Level
# small incumbents 290 2,779 5,289 1,039 2,532 4,747# jobs in small incumbents 290 3,647 7,667 1,497 3,790 5,196# large incumbents 290 804 1,243 705 892 715# jobs in large incumbents 290 21,967 38,740 27,527 24,468 11,948
number of employees both at creation and two years after creation. These filescover all firms subject to the regular corporate tax regime (Benefice Reel Nor-mal) or to the simplified corporate tax regime (Regime Simplifie d’Imposition),which together represent 55% of newly created firms during our sample pe-riod. Small firms with annual sales below €32,600 (€81,500 in retail and whole-sale trade) can opt out and often choose a special micro-business tax regime
Can Unemployment Insurance Spur Entrepreneurial Activity? 15
(Micro-Entreprise), in which case they do not appear in the tax files. Since ex-penses, and in particular wages, cannot be deducted from taxable profits underthe microbusiness tax regime, firms that choose this regime are likely to havezero employees. For this reason, in the empirical analysis, we assume thatfirms that do not appear in the tax files do not have employees.
Table II, Panel B, presents descriptive statistics from the tax files. The aver-age firm has 0.49 employees at creation. This number includes the entrepreneurif she pays herself a salary. However, there is considerable skewness. Only 20%of firms have at least one employee at creation. Two years after creation, firmshave on average 0.87 employees. In the prereform sample, 25% of new firmshire at least one employee in the first two years and 16% of firms exit thesample before the end of the second fiscal year.
C. SINE Survey
To obtain additional demographic and personal information on en-trepreneurs, we use the SINE survey, a large-scale survey run by the FrenchStatistical Office every four years (see Landier and Thesmar (2009) for an ex-tensive description of this survey). The SINE survey is a detailed questionnairesent out to individuals registering new firms that contains questions about theentrepreneur and the firm she creates.14 We obtain three cross sections of thesurvey in the relevant time period: 1998, 2002, and 2006. The first of theseyears, 1998, clearly belongs to the prereform period. The second, 2002, belongsto the very beginning of the postreform period—the survey is conducted duringthe first semester of 2002, while the reform is progressively affecting firmsthroughout 2002.15 Year 2006 corresponds to the postreform period. SINE cov-ers approximately one-third of newly created firms in the first six months of asurvey year (some 20,000 observations in 1998, 26,000 in 2002, and 30,000 in2006) and has a response rate of about 85%.16
We first use the SINE survey to measure entrepreneurs’ highest level ofeducational attainment. We also use the response to the survey question “Doyou plan to hire in the next twelve months?” as a measure of subjective growthexpectations or “ambition.” Table II, Panel C, reports descriptive statistics forthe survey variables. As can be seen, 46% of the entrepreneurs surveyed inSINE are at least high school graduates, and 23% of surveyed entrepreneursplan to hire in the year following creation. For robustness purposes, we alsoconstruct two additional variables: a dummy variable that indicates when theentrepreneur declares being “a supplier or client of his former employer,” and adummy variable that indicates when the entrepreneur responds that her firm“has at most 2 different customers.”
14 The survey uses stratified sampling, where the strata are the headquarter’s region and thetwo-digit industry of the firm.
15 In unreported regressions, we use only firms created in January and February of 2002 as ourprereform observations. We obtain similar results to those reported in the paper.
16 The response rate is high because the survey is administered by the statistical office INSEE.

16 The Journal of Finance R©
IV. Empirical Strategy
A. Identification Strategy
The PARE reform was aimed at unemployed individuals who have limitedstart-up capital and are more likely to start low-scale firms, which we classifyas sole proprietorships.17 In the 2002 wave of the SINE survey, 70% of unem-ployed workers who started a firm chose to register as a sole proprietorship,while only 45% of previously employed entrepreneurs made this election. Weexpect industries with a larger fraction of sole proprietorships to be more af-fected by the reform, a prediction of our model in Section II. Following thisintuition, we define treatment intensity as the fraction of sole proprietorshipsamong newly created firms at the industry level and measure it at the four-digitindustry level in the prereform period. We then rank industries in ascendingorder of treatment intensity and construct four quartiles (Q1 to Q4) that shouldbe increasingly affected by the PARE reform. Our identification strategy thensimply involves comparing how the number and characteristics of newly cre-ated firms changed from the pre- to the postreform periods depending on thetreatment intensity quartile to which the industry belongs.18 The identifyingassumption is that absent the reform, changes in the number and character-istics of newly created firms around 2002 would not have been systematicallyrelated to our measure of treatment intensity.
Internet Appendix Table IA.I lists industries that belong to the least (i.e., bot-tom quartile Q1) versus most (i.e., top quartile Q4) treated industries. Highlyexposed industries consist of, for example, taxi drivers, health care special-ists, and personal services. Low-exposure industries consist instead of realestate developers, movie and TV producers, and wholesale trades. In Table II,we present summary statistics for firms and industries in each of these fourquartiles of treatment intensity. In industries belonging to Q4, firms have 0.54fewer employees at creation and are 11 percentage points less likely to hireat least one employee in their first two years relative to firms in Q1 indus-tries. On average, entrepreneurs in Q4 industries are also less educated (sevenpercentage points less likely to have a high school degree) and less ambitious(16 percentage points less likely to hire in the next 12 months) than those inQ1 industries.
To illustrate our empirical strategy, in Internet Appendix Table IA.II, wereport the top 20 four-digit industries in terms of their contribution to thepostreform surge in new firm creation. For each industry s over the 2002to 2005 period, we compute �Ns
�N , where �Ns is the increase in the averagemonthly number of creations and �N = ∑
s �Ns. Consistent with our iden-tification strategy, the increase in new firm creation concentrates among Q4
17 We also repeat our analysis using an alternative definition of treatment intensity—the frac-tion of firms created with zero employees within a four-digit industry. Tables IA.IX to IA.XV inInternet Appendix III report regression results using this alternative treatment definition. Theresults are qualitatively similar to our main results.
18 In robustness checks, we also split industries using deciles and vigintiles of treatment inten-sity and obtain similar results.
Can Unemployment Insurance Spur Entrepreneurial Activity? 17
industries: (i) the top 20 four-digit industries contribute to more than half of theaggregate surge in new firm creations and (ii) of these 20 industries, 13 belongto the fourth quartile of treatment intensity (Q4) and 18 belong to either Q4 orQ3. The top contributing industries are the usual suspects for such a reform:masonry and electricity contractors, business consulting services, plumbers,retail trade, and real estate intermediaries.
B. Empirical Specification
Our main specification for industry-level outcomes is19
Yst =4∑
k=1
αk · Qks × postt +
4∑k=1
βk · Qks × t + μs + MONTHt + εst, (1)
where Qks is the quartile of treatment intensity to which industry s belongs,
postt is a dummy equal to 1 for outcomes measured after January 2002, andMONTHt denotes month-of-creation fixed effects.
For firm-level outcomes, we use a similar specification where i refers to afirm in industry s created at date t:
Yist =4∑
k=1
αk · Qks × postt +
4∑k=1
βk · Qks × t + μs + MONTHt + εist. (2)
When using the SINE survey, where cross sections of data are only availablein 2002 and 2006, our main specification becomes
Yist =4∑
k=1
αk · Qks × postt + μs + εist, (3)
where the post dummy is equal to 1 for outcomes measured in the 2006 waveof the SINE survey and 0 when measured in the 2002 wave.
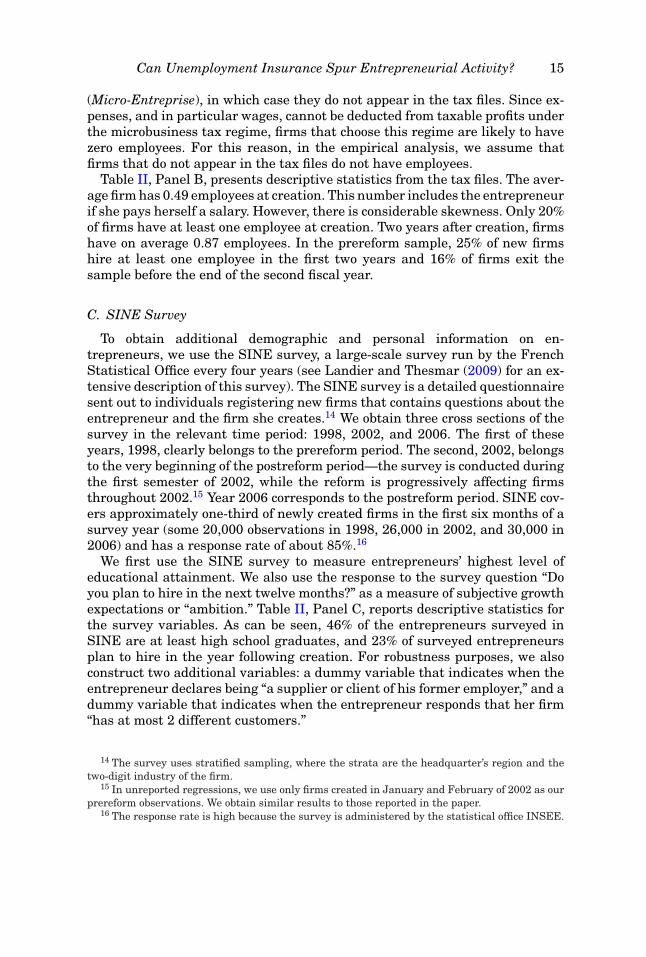
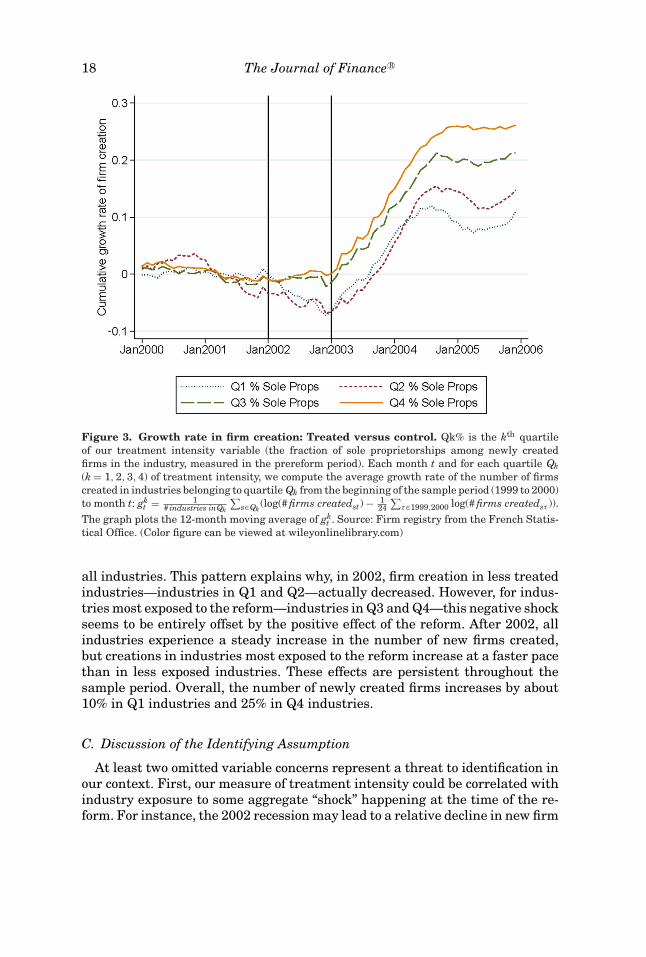
In all specifications, we cluster standard errors at the industry level.Figure 3 provides a graphical illustration of the identification strategy. For
each industry, we compute the log number of firms created each month from1999 to 2005 minus the average monthly log number of firms created in thesame industry from January 1, 1999 to December 31, 2000. We then averagethese log changes across industries within each quartile of our treatment inten-sity variable and plot the 12-month moving average of these four growth rates.
Figure 3 shows that firm creation in treated industries surged, relative toless treated sectors, during the first half of 2002. Recall that 2002 correspondsto an economic downturn in the French economy.20 Because firm creation tendsto be procyclical, this aggregate shock weighs negatively on firm creation in
19 Since our sample of industries is balanced, the inclusion of time fixed effects in this difference-in-difference model does not affect the estimated treatment effects.
20 See Figure IA.I for a plot of quarterly year-over-year GDP growth.
18 The Journal of Finance R©
Figure 3. Growth rate in firm creation: Treated versus control. Qk% is the kth quartileof our treatment intensity variable (the fraction of sole proprietorships among newly createdfirms in the industry, measured in the prereform period). Each month t and for each quartile Qk(k = 1, 2, 3, 4) of treatment intensity, we compute the average growth rate of the number of firmscreated in industries belonging to quartile Qk from the beginning of the sample period (1999 to 2000)to month t: gk
t = 1# industries inQk
∑s∈Qk
(log(# firms createdst) − 124
∑τ∈1999,2000 log(# firms createdsτ )).
The graph plots the 12-month moving average of gkt . Source: Firm registry from the French Statis-
tical Office. (Color figure can be viewed at wileyonlinelibrary.com)
all industries. This pattern explains why, in 2002, firm creation in less treatedindustries—industries in Q1 and Q2—actually decreased. However, for indus-tries most exposed to the reform—industries in Q3 and Q4—this negative shockseems to be entirely offset by the positive effect of the reform. After 2002, allindustries experience a steady increase in the number of new firms created,but creations in industries most exposed to the reform increase at a faster pacethan in less exposed industries. These effects are persistent throughout thesample period. Overall, the number of newly created firms increases by about10% in Q1 industries and 25% in Q4 industries.
C. Discussion of the Identifying Assumption
At least two omitted variable concerns represent a threat to identification inour context. First, our measure of treatment intensity could be correlated withindustry exposure to some aggregate “shock” happening at the time of the re-form. For instance, the 2002 recession may lead to a relative decline in new firm
Can Unemployment Insurance Spur Entrepreneurial Activity? 19
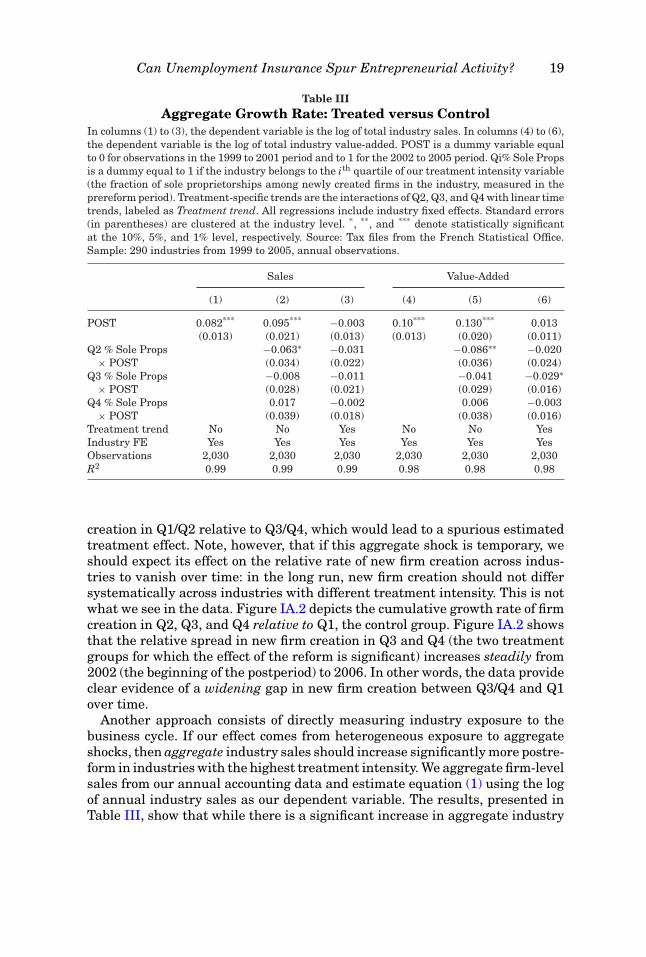
Table IIIAggregate Growth Rate: Treated versus Control
In columns (1) to (3), the dependent variable is the log of total industry sales. In columns (4) to (6),the dependent variable is the log of total industry value-added. POST is a dummy variable equalto 0 for observations in the 1999 to 2001 period and to 1 for the 2002 to 2005 period. Qi% Sole Propsis a dummy equal to 1 if the industry belongs to the ith quartile of our treatment intensity variable(the fraction of sole proprietorships among newly created firms in the industry, measured in theprereform period). Treatment-specific trends are the interactions of Q2, Q3, and Q4 with linear timetrends, labeled as Treatment trend. All regressions include industry fixed effects. Standard errors(in parentheses) are clustered at the industry level. *, **, and *** denote statistically significantat the 10%, 5%, and 1% level, respectively. Source: Tax files from the French Statistical Office.Sample: 290 industries from 1999 to 2005, annual observations.
Sales Value-Added
(1) (2) (3) (4) (5) (6)
POST 0.082*** 0.095*** −0.003 0.10*** 0.130*** 0.013(0.013) (0.021) (0.013) (0.013) (0.020) (0.011)
Q2 % Sole Props −0.063∗ −0.031 −0.086∗∗ −0.020× POST (0.034) (0.022) (0.036) (0.024)
Q3 % Sole Props −0.008 −0.011 −0.041 −0.029∗× POST (0.028) (0.021) (0.029) (0.016)
Q4 % Sole Props 0.017 −0.002 0.006 −0.003× POST (0.039) (0.018) (0.038) (0.016)
Treatment trend No No Yes No No YesIndustry FE Yes Yes Yes Yes Yes YesObservations 2,030 2,030 2,030 2,030 2,030 2,030R2 0.99 0.99 0.99 0.98 0.98 0.98
creation in Q1/Q2 relative to Q3/Q4, which would lead to a spurious estimatedtreatment effect. Note, however, that if this aggregate shock is temporary, weshould expect its effect on the relative rate of new firm creation across indus-tries to vanish over time: in the long run, new firm creation should not differsystematically across industries with different treatment intensity. This is notwhat we see in the data. Figure IA.2 depicts the cumulative growth rate of firmcreation in Q2, Q3, and Q4 relative to Q1, the control group. Figure IA.2 showsthat the relative spread in new firm creation in Q3 and Q4 (the two treatmentgroups for which the effect of the reform is significant) increases steadily from2002 (the beginning of the postperiod) to 2006. In other words, the data provideclear evidence of a widening gap in new firm creation between Q3/Q4 and Q1over time.
Another approach consists of directly measuring industry exposure to thebusiness cycle. If our effect comes from heterogeneous exposure to aggregateshocks, then aggregate industry sales should increase significantly more postre-form in industries with the highest treatment intensity. We aggregate firm-levelsales from our annual accounting data and estimate equation (1) using the logof annual industry sales as our dependent variable. The results, presented inTable III, show that while there is a significant increase in aggregate industry
20 The Journal of Finance R©
sales in the postreform period (8.2% in column (1)), this increase is not signif-icantly different across the four quartiles of treatment intensity (columns (2)and (3)). Columns (4) to (6) yield a similar conclusion when using aggregateindustry value-added.21
Our identifying assumption may fail if (i) the shock is persistent and (ii)exposure to this persistent shock is correlated with the treatment. We addressthis concern in several ways in the next section. First, we can directly controlfor industry characteristics that might correlate with treatment intensity andmake industries more sensitive to a permanent shock. We augment equation(1) to include interactions of both the post dummy and a trend variable witha measure of industry capital intensity (the average assets-to-labor ratio offirms in the industry from 1999 to 2001) and industry growth (the averagesales growth rate for firms in the industry from 1999 to 2001). As we show inTable IV, these added controls do not affect our main estimates. However, theremay remain unobserved characteristics that we cannot control for and thatcreate a bias in our estimation. We therefore also consider a second approachwhereby we tie the increase in new firm creation directly to the increase inunemployed entrepreneurs. We explain this approach in detail in Section V.B.The results of this analysis imply that a confounding shock would have to bepersistent, occur at the time the PARE reform is adopted, affect industries thatare more exposed to this reform disproportionately, and change the propensityto start new firms of unemployed workers only. We cannot think of a plausiblecandidate for such a shock.
A second threat to identification arises from potential changes in the pool ofunemployed individuals. For instance, if skilled individuals tend to create firmsin small-scale industries and the postreform period coincides with an increasein the fraction of skilled individuals in the pool of unemployed workers, thenindustries with high treatment intensity could experience increased entry forreasons unrelated to the PARE reform. To test this hypothesis, we use the 2002wave of the SINE survey to show that the fraction of educated entrepreneursdoes not differ significantly across industries (Internet Appendix Table IA.III).In addition, we do not find that, on average, entrepreneurs become more ed-ucated or more “ambitious” after the reform, as shown in Table VII. Takentogether, these results imply that changes in the skill composition of the pool ofunemployed individuals cannot be driving the postreform increase in new firmcreation observed in industries with high treatment intensity.22 Of course, we
21 In Internet Appendix Table IA.XVI, we run an additional robustness test that directly controlsfor industries’ exposure to the business cycle. We compute industry “βs” with respect to GDP inthe prereform period (1993 to 1999). We reestimate equation (1) after including a control for theinteraction of industry β and the post dummy. Our estimates are not affected by the inclusion ofthese controls.
22 A related concern could be that the 2002 recession increased the number of unemployed indi-viduals disproportionately in high-treatment-intensity industries. This could result in a mechan-ical increase in the number of unemployed entrepreneurs in these industries. Using the FrenchLabor Force survey, however, we see that, if anything, unemployment rates in Q4 industries in-crease less in 2002.
Can Unemployment Insurance Spur Entrepreneurial Activity? 21
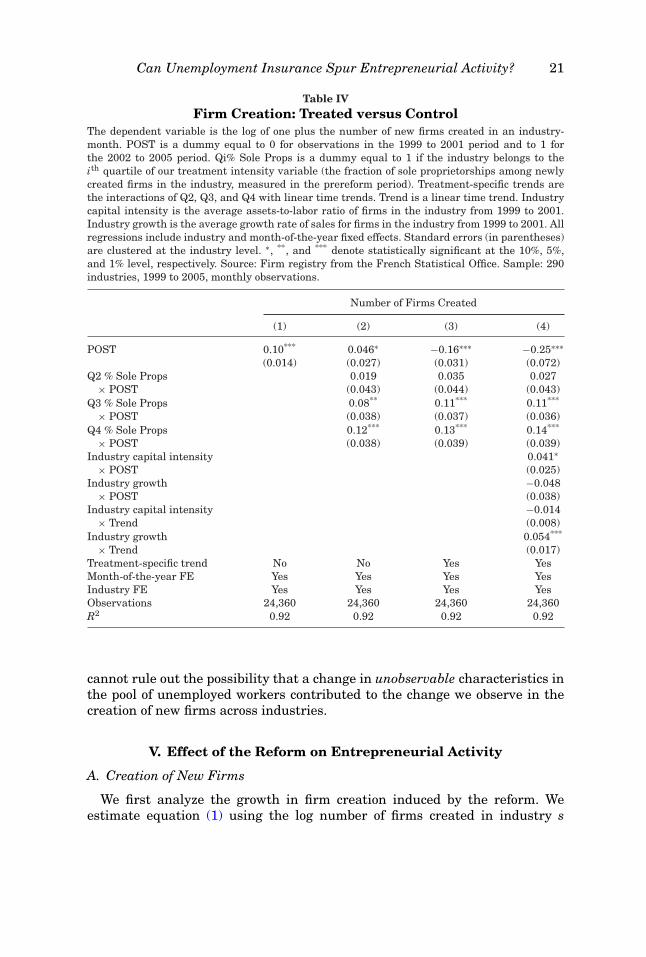
Table IVFirm Creation: Treated versus Control
The dependent variable is the log of one plus the number of new firms created in an industry-month. POST is a dummy equal to 0 for observations in the 1999 to 2001 period and to 1 forthe 2002 to 2005 period. Qi% Sole Props is a dummy equal to 1 if the industry belongs to theith quartile of our treatment intensity variable (the fraction of sole proprietorships among newlycreated firms in the industry, measured in the prereform period). Treatment-specific trends arethe interactions of Q2, Q3, and Q4 with linear time trends. Trend is a linear time trend. Industrycapital intensity is the average assets-to-labor ratio of firms in the industry from 1999 to 2001.Industry growth is the average growth rate of sales for firms in the industry from 1999 to 2001. Allregressions include industry and month-of-the-year fixed effects. Standard errors (in parentheses)are clustered at the industry level. ∗, **, and *** denote statistically significant at the 10%, 5%,and 1% level, respectively. Source: Firm registry from the French Statistical Office. Sample: 290industries, 1999 to 2005, monthly observations.
Number of Firms Created
(1) (2) (3) (4)
POST 0.10*** 0.046∗ −0.16∗∗∗ −0.25∗∗∗(0.014) (0.027) (0.031) (0.072)
Q2 % Sole Props 0.019 0.035 0.027× POST (0.043) (0.044) (0.043)
Q3 % Sole Props 0.08** 0.11*** 0.11***
× POST (0.038) (0.037) (0.036)Q4 % Sole Props 0.12*** 0.13*** 0.14***
× POST (0.038) (0.039) (0.039)Industry capital intensity 0.041∗
× POST (0.025)Industry growth −0.048
× POST (0.038)Industry capital intensity −0.014
× Trend (0.008)Industry growth 0.054***
× Trend (0.017)Treatment-specific trend No No Yes YesMonth-of-the-year FE Yes Yes Yes YesIndustry FE Yes Yes Yes YesObservations 24,360 24,360 24,360 24,360R2 0.92 0.92 0.92 0.92
cannot rule out the possibility that a change in unobservable characteristics inthe pool of unemployed workers contributed to the change we observe in thecreation of new firms across industries.
V. Effect of the Reform on Entrepreneurial Activity
A. Creation of New Firms
We first analyze the growth in firm creation induced by the reform. Weestimate equation (1) using the log number of firms created in industry s
22 The Journal of Finance R©
and month t as our dependent variable.23 The regressions use a balancedsample of 290 industries from January 1999 to December 2005. The re-sults are reported in Table IV. Column (1) only includes the post dummy,along with industry and month-of-creation fixed effects. The results showthat following the reform, the monthly number of newly created firms in-creased by a significant 10% across all industries. This effect is slightlysmaller than what we find in Figure 2. The difference can be attributed tothe fact that we start the postreform period in January 2002, while the re-form was massively advertised by local unemployment agencies starting onlyin mid-2002.
Column (2) adds interactions for the post dummy and quartiles of treat-ment intensity. Column (3) adds interactions for linear trends and quartilesof treatment intensity. Column (4) additionally interacts both the post dummyand linear trends with industry characteristics (capital intensity and indus-try growth). The results in columns (2) to (4) are not significantly different.Q4 (Q3) industries experience a significant increase in new firm creation of12 to 14 (8 to 11) percentage points in the postreform period relative to Q1industries. Grouping Q3 and Q4 industries together, these estimates implyan increase in firm creation following the reform of about 1,000 newly cre-ated firms per month. While this number is only one-fourth of the aggregateincrease in firm creation (about 3,500 new firms per month in Figure 2), wenote that these estimates are quite conservative since they assume that anyincrease in new firm creation observed in Q1 and Q2 industries is unrelated tothe reform.
Since the reform was implemented gradually over time with no clear startingdate, in the Internet Appendix, we check that our results are robust to alterna-tive definitions of the event window. We show that: (i) when we exclude 2002from the sample, the estimated effects are actually larger, as expected since thereform is massively advertised by local unemployment agencies starting only inmid-2002 (Internet Appendix Table IA.IV); (ii) when we assign 2002 to the pre-reform period, the estimated effects are smaller, which is not surprising sincepart of the “treatment” period is now classified as the “control” period (Inter-net Appendix Table IA.V); and (iii) when we exclude 2005 from the postreformsample, the results are virtually unchanged (Internet Appendix Table IA.VI).
B. Additional Evidence: Unemployed Entrepreneurs and Firm Creation
In this section, we provide further evidence that ties down the dynamics offirm creation postreform to the population of unemployed workers. This is animportant step in our analysis because it helps confirm the causal interpre-tation of the results in Section V.A and invalidates the hypothesis that theresults are driven by confounding factors such as heterogeneous exposures to
23 A low number of small industries experience months without any creation. To keep a balancedpanel, we use as our dependent variable log(1 + # firms created). The results are similar whenusing log(# firms created).
Can Unemployment Insurance Spur Entrepreneurial Activity? 23
business cycle fluctuations. First, recall from Section III.A that we use data onthe take-up of the ACCRE subsidy (a subsidy for unemployed entrepreneursthat is unrelated to the PARE reform) to show that more than 90% of the ag-gregate increase in new firm creation observed postreform could be attributedto unemployed individuals. Such time-series evidence strongly points towardthe reform.
Here, we complement time-series evidence with cross-sectional evidence. Wecheck that firm creation increases more in industries with a larger increasein the fraction of unemployed entrepreneurs. If our results were spurious, forexample, capturing heterogeneous exposures to business cycle fluctuations,then within-industry shifts in the share of unemployed entrepreneurs shouldnot correlate with firm creation rates. To test this hypothesis, we estimate theequation
n2006s − n2002
s
n2002s
= β �Unemps + γ AggGrowths + εs, (4)
where nts is the total number of creations in industry s in the first half of year t,
�Unemps is the change in the fraction of unemployed entrepreneurs measuredin the SINE survey in industry s between 2002 and 2006,24 and AggGrowths isthe growth rate over the 2002 to 2006 period of industry s total value-added,which we add to equation (4) as a natural control.25
Table V reports results of this estimation. Column (1) includes all unem-ployed entrepreneurs in the calculation of �Unemps and shows that the in-crease in firm creation observed between 2002 and 2006 is significantly morepronounced in industries in which the fraction of unemployed entrepreneursincreased the most from 2002 to 2006.26 Columns (2) and (3) extend the anal-ysis in column (1) by decomposing the industry-level change in unemployedentrepreneurs (�Unemps) based on whether these entrepreneurs take up theACCRE subsidy. Since ACCRE is a pure subsidy for unemployed entrepreneursthat entails no constraint, those failing to claim the ACCRE subsidy are pre-sumably ill-informed and therefore less likely to be aware of the PARE reform.27
Thus, if the increase in industry-level entrepreneurship post-2002 is, in fact,due to the PARE, this increase should consist of informed entrepreneurs, that
24 We focus on the first semester of 2002 and 2006 because the SINE survey, which we use tocompute �Unemps, only surveys firms created in the first half of the survey year.
25 Some industries may naturally grow faster, which would boost the growth in new firm cre-ation. At the same time, these industries lay off fewer workers and thus have fewer potentialentrepreneurs who are formerly unemployed, creating a spurious negative correlation between
�Unemps and n2006s −n2002
sn2002
s. This correlation arises only if entrepreneurs tend to start businesses in
industries they have worked in previously.26 Note that to obtain precise estimates of �Unemps, we restrict the sample to industries that
have at least 20 firms in both waves of the SINE survey, which leads us to consider only 195industries, as opposed to the 290 industries included in our main specification.
27 These policies were publicized largely by local unemployment agencies, which likely leads toa correlation in the propensity to know about the different programs.
24 The Journal of Finance R©
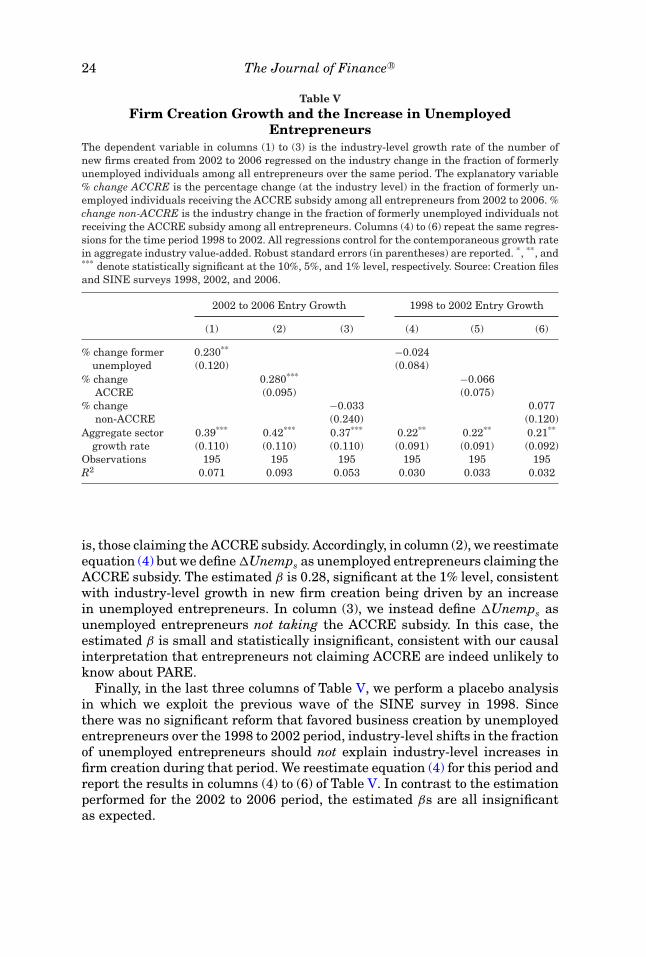
Table VFirm Creation Growth and the Increase in Unemployed
EntrepreneursThe dependent variable in columns (1) to (3) is the industry-level growth rate of the number ofnew firms created from 2002 to 2006 regressed on the industry change in the fraction of formerlyunemployed individuals among all entrepreneurs over the same period. The explanatory variable% change ACCRE is the percentage change (at the industry level) in the fraction of formerly un-employed individuals receiving the ACCRE subsidy among all entrepreneurs from 2002 to 2006. %change non-ACCRE is the industry change in the fraction of formerly unemployed individuals notreceiving the ACCRE subsidy among all entrepreneurs. Columns (4) to (6) repeat the same regres-sions for the time period 1998 to 2002. All regressions control for the contemporaneous growth ratein aggregate industry value-added. Robust standard errors (in parentheses) are reported. *, **, and*** denote statistically significant at the 10%, 5%, and 1% level, respectively. Source: Creation filesand SINE surveys 1998, 2002, and 2006.
2002 to 2006 Entry Growth 1998 to 2002 Entry Growth
(1) (2) (3) (4) (5) (6)
% change former 0.230** −0.024unemployed (0.120) (0.084)
% change 0.280*** −0.066ACCRE (0.095) (0.075)
% change −0.033 0.077non-ACCRE (0.240) (0.120)
Aggregate sector 0.39*** 0.42*** 0.37*** 0.22** 0.22** 0.21**
growth rate (0.110) (0.110) (0.110) (0.091) (0.091) (0.092)Observations 195 195 195 195 195 195R2 0.071 0.093 0.053 0.030 0.033 0.032
is, those claiming the ACCRE subsidy. Accordingly, in column (2), we reestimateequation (4) but we define �Unemps as unemployed entrepreneurs claiming theACCRE subsidy. The estimated β is 0.28, significant at the 1% level, consistentwith industry-level growth in new firm creation being driven by an increasein unemployed entrepreneurs. In column (3), we instead define �Unemps asunemployed entrepreneurs not taking the ACCRE subsidy. In this case, theestimated β is small and statistically insignificant, consistent with our causalinterpretation that entrepreneurs not claiming ACCRE are indeed unlikely toknow about PARE.
Finally, in the last three columns of Table V, we perform a placebo analysisin which we exploit the previous wave of the SINE survey in 1998. Sincethere was no significant reform that favored business creation by unemployedentrepreneurs over the 1998 to 2002 period, industry-level shifts in the fractionof unemployed entrepreneurs should not explain industry-level increases infirm creation during that period. We reestimate equation (4) for this period andreport the results in columns (4) to (6) of Table V. In contrast to the estimationperformed for the 2002 to 2006 period, the estimated βs are all insignificantas expected.
Can Unemployment Insurance Spur Entrepreneurial Activity? 25
C. The Quality of Postreform Start-Ups
C.1. Job Creation and Exit
We have firmly established that our treatment intensity variable is valid,so we can now examine whether the reform led to a significant change in thecharacteristics of newly created firms (the second prediction of our model andthe main purpose of the paper). We first use ex post measures of firm quality,namely, job creation, and exit probability. If the main effect of the reform was toattract individuals of lower ability, start-ups created after the reform should beless likely to create jobs and more likely to exit, particularly in industries withhigh treatment intensity (the selection view). Alternatively, if entrepreneurialtalent is homogeneous and entrepreneurial success is hard to predict ex ante,then after the reform start-ups should be as likely to create jobs or to exit asbefore the exit (the experimentation channel).
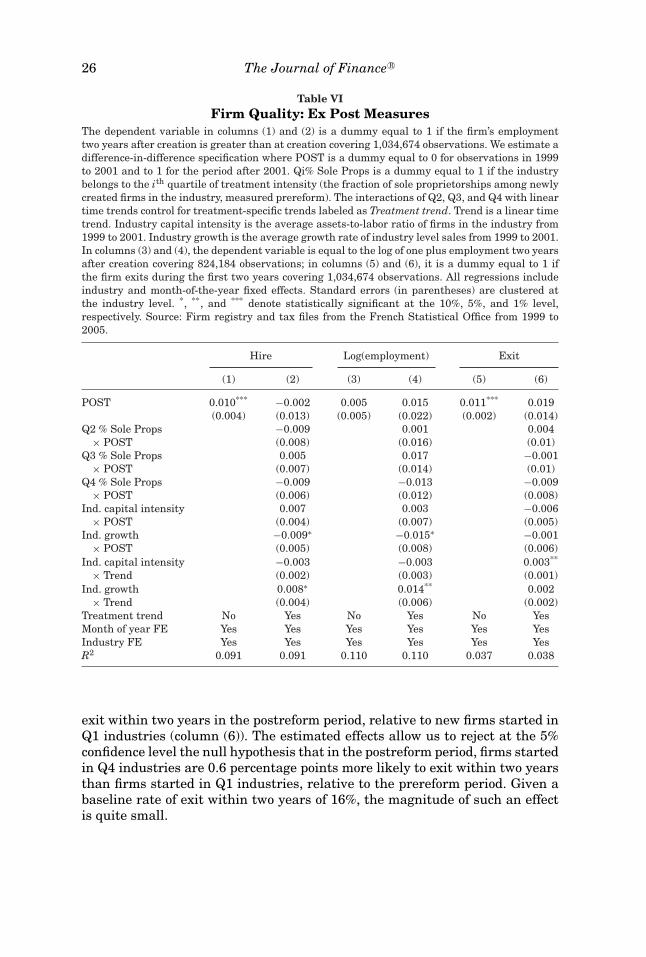
We estimate equation (2) using as the dependent variable a firm-level indi-cator equal to 1 when the firm hires at least one employee between its creationdate and the end of the second calendar year after creation. We chose two yearssince firms that ever hire typically begin to do so within the first two years.The estimation results are reported in Table VI. While there is an increasein a start-up’s propensity to hire postreform (column (1)), we find that firmsstarted in Q4 industries (Q3 and Q2) do not experience a significant changein the propensity to hire in their first two years relative to new firms startedin Q1 industries (column (2)). We can reject at the 5% confidence level thenull hypothesis that firms started in Q4 industries have a lower propensity tohire in the first two years (by 2.5 percentage points) than firms started in Q1industries, which is a small effect since the average propensity to hire in thefirst two years is 25% (Table II). In addition, Table VI shows that the estimatedeffect of the reform on Q3 industries is positive and insignificant, so groupingQ3 and Q4 industries together would lead to an even smaller effect. Resultsare similar using log employment two years after creation instead of the hiringdummy as the dependent variable (columns (3) and (4)). Overall, the evidencein Table VI is inconsistent with the view that the reform led to the creation ofnew firms that are significantly less likely to hire.
The second measure of ex post quality that we use is the probability of exit.In our sample, 16% of newly created firms exit in the first two years followingcreation. This attrition rate is consistent with existing cross-country evidenceand is typically interpreted as the failure rate of new firms.28 In Table VI,columns (5) and (6), we estimate equation (2) using a dummy for exit withintwo years as our dependent variable. The results are similar to those ones abovefor hiring patterns: while there is a significant increase in the probability ofexit within the first two years in the postreform period (column (5)), firmsstarted in Q4 industries (Q3 and Q2) do not become significantly more likely to
28 The 1998 wave of the SINE survey shows that only 5% of newly created firms that no longerexist two years after creation have been purchased or transmitted, that is, 95% correspond to firmsthat have closed down permanently.
26 The Journal of Finance R©
Table VIFirm Quality: Ex Post Measures
The dependent variable in columns (1) and (2) is a dummy equal to 1 if the firm’s employmenttwo years after creation is greater than at creation covering 1,034,674 observations. We estimate adifference-in-difference specification where POST is a dummy equal to 0 for observations in 1999to 2001 and to 1 for the period after 2001. Qi% Sole Props is a dummy equal to 1 if the industrybelongs to the ith quartile of treatment intensity (the fraction of sole proprietorships among newlycreated firms in the industry, measured prereform). The interactions of Q2, Q3, and Q4 with lineartime trends control for treatment-specific trends labeled as Treatment trend. Trend is a linear timetrend. Industry capital intensity is the average assets-to-labor ratio of firms in the industry from1999 to 2001. Industry growth is the average growth rate of industry level sales from 1999 to 2001.In columns (3) and (4), the dependent variable is equal to the log of one plus employment two yearsafter creation covering 824,184 observations; in columns (5) and (6), it is a dummy equal to 1 ifthe firm exits during the first two years covering 1,034,674 observations. All regressions includeindustry and month-of-the-year fixed effects. Standard errors (in parentheses) are clustered atthe industry level. *, **, and *** denote statistically significant at the 10%, 5%, and 1% level,respectively. Source: Firm registry and tax files from the French Statistical Office from 1999 to2005.
Hire Log(employment) Exit
(1) (2) (3) (4) (5) (6)
POST 0.010*** −0.002 0.005 0.015 0.011*** 0.019(0.004) (0.013) (0.005) (0.022) (0.002) (0.014)
Q2 % Sole Props −0.009 0.001 0.004× POST (0.008) (0.016) (0.01)
Q3 % Sole Props 0.005 0.017 −0.001× POST (0.007) (0.014) (0.01)
Q4 % Sole Props −0.009 −0.013 −0.009× POST (0.006) (0.012) (0.008)
Ind. capital intensity 0.007 0.003 −0.006× POST (0.004) (0.007) (0.005)
Ind. growth −0.009∗ −0.015∗ −0.001× POST (0.005) (0.008) (0.006)
Ind. capital intensity −0.003 −0.003 0.003**
× Trend (0.002) (0.003) (0.001)Ind. growth 0.008∗ 0.014** 0.002
× Trend (0.004) (0.006) (0.002)Treatment trend No Yes No Yes No YesMonth of year FE Yes Yes Yes Yes Yes YesIndustry FE Yes Yes Yes Yes Yes YesR2 0.091 0.091 0.110 0.110 0.037 0.038
exit within two years in the postreform period, relative to new firms started inQ1 industries (column (6)). The estimated effects allow us to reject at the 5%confidence level the null hypothesis that in the postreform period, firms startedin Q4 industries are 0.6 percentage points more likely to exit within two yearsthan firms started in Q1 industries, relative to the prereform period. Given abaseline rate of exit within two years of 16%, the magnitude of such an effectis quite small.
Can Unemployment Insurance Spur Entrepreneurial Activity? 27
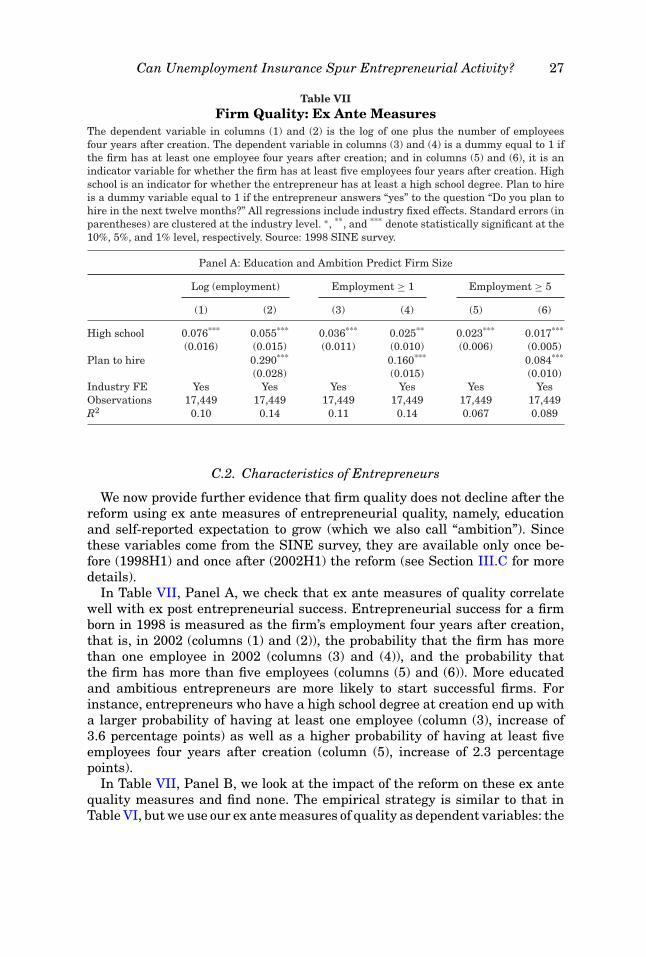
Table VIIFirm Quality: Ex Ante Measures
The dependent variable in columns (1) and (2) is the log of one plus the number of employeesfour years after creation. The dependent variable in columns (3) and (4) is a dummy equal to 1 ifthe firm has at least one employee four years after creation; and in columns (5) and (6), it is anindicator variable for whether the firm has at least five employees four years after creation. Highschool is an indicator for whether the entrepreneur has at least a high school degree. Plan to hireis a dummy variable equal to 1 if the entrepreneur answers “yes” to the question “Do you plan tohire in the next twelve months?” All regressions include industry fixed effects. Standard errors (inparentheses) are clustered at the industry level. ∗, **, and *** denote statistically significant at the10%, 5%, and 1% level, respectively. Source: 1998 SINE survey.
Panel A: Education and Ambition Predict Firm Size
Log (employment) Employment ≥ 1 Employment ≥ 5
(1) (2) (3) (4) (5) (6)
High school 0.076*** 0.055*** 0.036*** 0.025** 0.023*** 0.017***
(0.016) (0.015) (0.011) (0.010) (0.006) (0.005)Plan to hire 0.290*** 0.160*** 0.084***
(0.028) (0.015) (0.010)Industry FE Yes Yes Yes Yes Yes YesObservations 17,449 17,449 17,449 17,449 17,449 17,449R2 0.10 0.14 0.11 0.14 0.067 0.089
C.2. Characteristics of Entrepreneurs
We now provide further evidence that firm quality does not decline after thereform using ex ante measures of entrepreneurial quality, namely, educationand self-reported expectation to grow (which we also call “ambition”). Sincethese variables come from the SINE survey, they are available only once be-fore (1998H1) and once after (2002H1) the reform (see Section III.C for moredetails).
In Table VII, Panel A, we check that ex ante measures of quality correlatewell with ex post entrepreneurial success. Entrepreneurial success for a firmborn in 1998 is measured as the firm’s employment four years after creation,that is, in 2002 (columns (1) and (2)), the probability that the firm has morethan one employee in 2002 (columns (3) and (4)), and the probability thatthe firm has more than five employees (columns (5) and (6)). More educatedand ambitious entrepreneurs are more likely to start successful firms. Forinstance, entrepreneurs who have a high school degree at creation end up witha larger probability of having at least one employee (column (3), increase of3.6 percentage points) as well as a higher probability of having at least fiveemployees four years after creation (column (5), increase of 2.3 percentagepoints).
In Table VII, Panel B, we look at the impact of the reform on these ex antequality measures and find none. The empirical strategy is similar to that inTable VI, but we use our ex ante measures of quality as dependent variables: the

28 The Journal of Finance R©
Table VII—Continued
In columns (1) and (2), the dependent variable is a dummy variable equal to 1 if the entrepreneurhas at least a high school degree. In columns (3) and (4), the dependent variable is a dummy equalto 1 if the entrepreneur answers “yes” to the question “Do you plan to hire in the next twelvemonths?” POST is a dummy equal to 0 for observations from the 1998 wave of the survey andto 1 for observations from the 2002 wave of the survey. Qi% Sole Props is a dummy equal to 1if the industry belongs to the ith quartile of our treatment intensity variable (the fraction of soleproprietorships among newly created firms in the industry, measured in the prereform period).Industry capital intensity is the average assets-to-labor ratio of firms in the industry from 1999 to2001. Industry growth is the average growth rate of sales for firms in the industry from 1999 to2001. All regressions include industry fixed effects. Standard errors (in parentheses) are clusteredat the industry level. *, **, and *** denote statistically significant at the 10%, 5%, and 1% level,respectively. Source: 1998 and 2002 SINE surveys. Sample: Random sample of 47,088 new firmsstarted in the first semester of 1998 and the first semester of 2002.
Panel B: Education and Ambition after the Reform
High school Plan to hire
(1) (2) (3) (4)
POST 0.070*** 0.039 −0.016 −0.007(0.017) (0.035) (0.019) (0.039)
Q2 % Sole Props −0.008 −0.021 0.010 0.006× POST (0.026) (0.024) (0.027) (0.027)
Q3 % Sole Props −0.004 −0.006 0.013 0.012× POST (0.021) (0.018) (0.023) (0.024)
Q4 % Sole Props −0.003 −0.014 0.020 0.015× POST (0.020) (0.019) (0.022) (0.023)
Industry capital intensity 0.025** 0.0022× POST (0.012) (0.012)
Industry growth −0.041∗∗∗ −0.023× POST (0.015) (0.015)
Industry FE Yes Yes Yes YesObservations 47,088 47,088 47,088 47,088R2 0.250 0.250 0.059 0.059
probability of having a high school diploma (columns (1) and (2)) and the prob-ability of plans to hire in the coming year (columns (3) and (4)). The regressionresults consistently show that these measures of quality did not deteriorate inthe postreform period in Q4 industries relative to Q1 industries.
C.3. Marginal Versus Average Effect
The results on firm quality documented above are obtained by comparing theaverage quality of newly created firms across industries following the reform.These averages do not isolate the effect of the reform on the quality of marginalentrants, that is, those newly created firms that would not have been createdabsent the reform. In this section, we attempt to quantify the effect of thereform on the quality of these marginal new entrants.
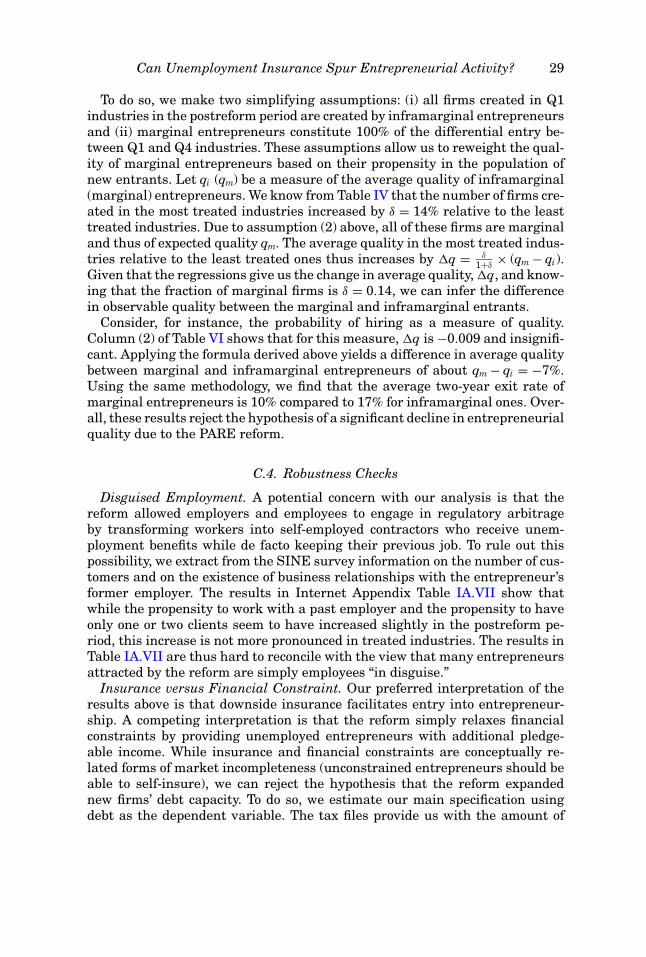
Can Unemployment Insurance Spur Entrepreneurial Activity? 29
To do so, we make two simplifying assumptions: (i) all firms created in Q1industries in the postreform period are created by inframarginal entrepreneursand (ii) marginal entrepreneurs constitute 100% of the differential entry be-tween Q1 and Q4 industries. These assumptions allow us to reweight the qual-ity of marginal entrepreneurs based on their propensity in the population ofnew entrants. Let qi (qm) be a measure of the average quality of inframarginal(marginal) entrepreneurs. We know from Table IV that the number of firms cre-ated in the most treated industries increased by δ = 14% relative to the leasttreated industries. Due to assumption (2) above, all of these firms are marginaland thus of expected quality qm. The average quality in the most treated indus-tries relative to the least treated ones thus increases by �q = δ
1+δ× (qm − qi).
Given that the regressions give us the change in average quality, �q, and know-ing that the fraction of marginal firms is δ = 0.14, we can infer the differencein observable quality between the marginal and inframarginal entrants.
Consider, for instance, the probability of hiring as a measure of quality.Column (2) of Table VI shows that for this measure, �q is −0.009 and insignifi-cant. Applying the formula derived above yields a difference in average qualitybetween marginal and inframarginal entrepreneurs of about qm − qi = −7%.Using the same methodology, we find that the average two-year exit rate ofmarginal entrepreneurs is 10% compared to 17% for inframarginal ones. Over-all, these results reject the hypothesis of a significant decline in entrepreneurialquality due to the PARE reform.
C.4. Robustness Checks
Disguised Employment. A potential concern with our analysis is that thereform allowed employers and employees to engage in regulatory arbitrageby transforming workers into self-employed contractors who receive unem-ployment benefits while de facto keeping their previous job. To rule out thispossibility, we extract from the SINE survey information on the number of cus-tomers and on the existence of business relationships with the entrepreneur’sformer employer. The results in Internet Appendix Table IA.VII show thatwhile the propensity to work with a past employer and the propensity to haveonly one or two clients seem to have increased slightly in the postreform pe-riod, this increase is not more pronounced in treated industries. The results inTable IA.VII are thus hard to reconcile with the view that many entrepreneursattracted by the reform are simply employees “in disguise.”
Insurance versus Financial Constraint. Our preferred interpretation of theresults above is that downside insurance facilitates entry into entrepreneur-ship. A competing interpretation is that the reform simply relaxes financialconstraints by providing unemployed entrepreneurs with additional pledge-able income. While insurance and financial constraints are conceptually re-lated forms of market incompleteness (unconstrained entrepreneurs should beable to self-insure), we can reject the hypothesis that the reform expandednew firms’ debt capacity. To do so, we estimate our main specification usingdebt as the dependent variable. The tax files provide us with the amount of
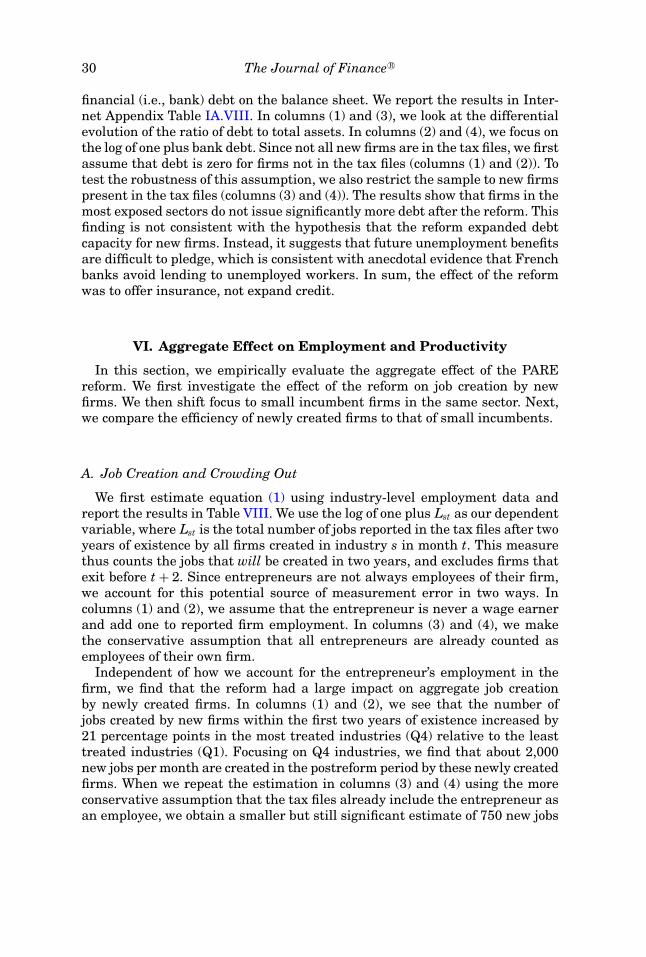
30 The Journal of Finance R©
financial (i.e., bank) debt on the balance sheet. We report the results in Inter-net Appendix Table IA.VIII. In columns (1) and (3), we look at the differentialevolution of the ratio of debt to total assets. In columns (2) and (4), we focus onthe log of one plus bank debt. Since not all new firms are in the tax files, we firstassume that debt is zero for firms not in the tax files (columns (1) and (2)). Totest the robustness of this assumption, we also restrict the sample to new firmspresent in the tax files (columns (3) and (4)). The results show that firms in themost exposed sectors do not issue significantly more debt after the reform. Thisfinding is not consistent with the hypothesis that the reform expanded debtcapacity for new firms. Instead, it suggests that future unemployment benefitsare difficult to pledge, which is consistent with anecdotal evidence that Frenchbanks avoid lending to unemployed workers. In sum, the effect of the reformwas to offer insurance, not expand credit.
VI. Aggregate Effect on Employment and Productivity
In this section, we empirically evaluate the aggregate effect of the PAREreform. We first investigate the effect of the reform on job creation by newfirms. We then shift focus to small incumbent firms in the same sector. Next,we compare the efficiency of newly created firms to that of small incumbents.
A. Job Creation and Crowding Out
We first estimate equation (1) using industry-level employment data andreport the results in Table VIII. We use the log of one plus Lst as our dependentvariable, where Lst is the total number of jobs reported in the tax files after twoyears of existence by all firms created in industry s in month t. This measurethus counts the jobs that will be created in two years, and excludes firms thatexit before t + 2. Since entrepreneurs are not always employees of their firm,we account for this potential source of measurement error in two ways. Incolumns (1) and (2), we assume that the entrepreneur is never a wage earnerand add one to reported firm employment. In columns (3) and (4), we makethe conservative assumption that all entrepreneurs are already counted asemployees of their own firm.
Independent of how we account for the entrepreneur’s employment in thefirm, we find that the reform had a large impact on aggregate job creationby newly created firms. In columns (1) and (2), we see that the number ofjobs created by new firms within the first two years of existence increased by21 percentage points in the most treated industries (Q4) relative to the leasttreated industries (Q1). Focusing on Q4 industries, we find that about 2,000new jobs per month are created in the postreform period by these newly createdfirms. When we repeat the estimation in columns (3) and (4) using the moreconservative assumption that the tax files already include the entrepreneur asan employee, we obtain a smaller but still significant estimate of 750 new jobs
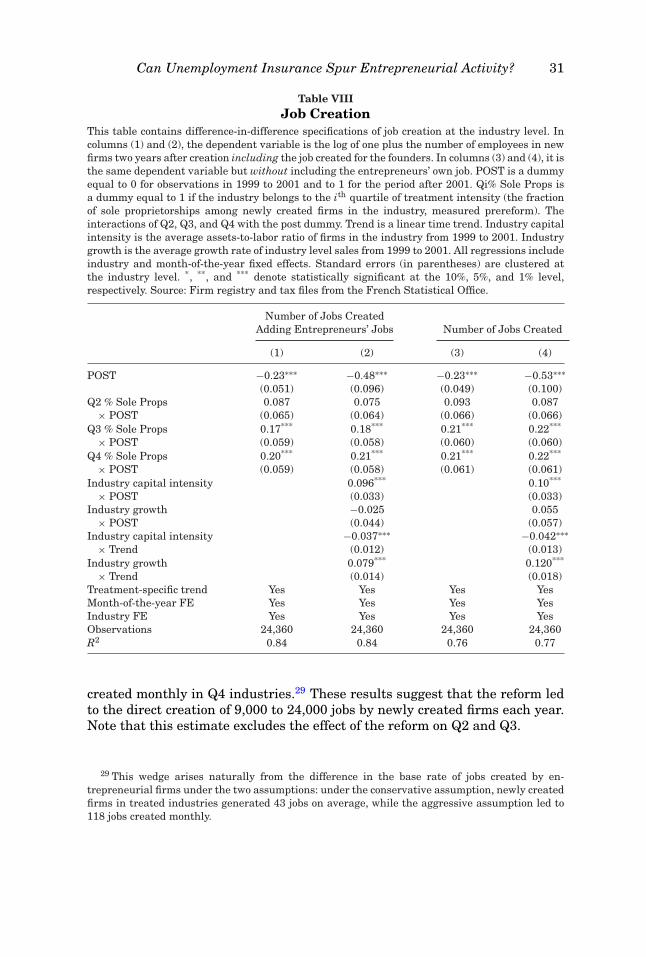
Can Unemployment Insurance Spur Entrepreneurial Activity? 31
Table VIIIJob Creation
This table contains difference-in-difference specifications of job creation at the industry level. Incolumns (1) and (2), the dependent variable is the log of one plus the number of employees in newfirms two years after creation including the job created for the founders. In columns (3) and (4), it isthe same dependent variable but without including the entrepreneurs’ own job. POST is a dummyequal to 0 for observations in 1999 to 2001 and to 1 for the period after 2001. Qi% Sole Props isa dummy equal to 1 if the industry belongs to the ith quartile of treatment intensity (the fractionof sole proprietorships among newly created firms in the industry, measured prereform). Theinteractions of Q2, Q3, and Q4 with the post dummy. Trend is a linear time trend. Industry capitalintensity is the average assets-to-labor ratio of firms in the industry from 1999 to 2001. Industrygrowth is the average growth rate of industry level sales from 1999 to 2001. All regressions includeindustry and month-of-the-year fixed effects. Standard errors (in parentheses) are clustered atthe industry level. *, **, and *** denote statistically significant at the 10%, 5%, and 1% level,respectively. Source: Firm registry and tax files from the French Statistical Office.
Number of Jobs CreatedAdding Entrepreneurs’ Jobs Number of Jobs Created
(1) (2) (3) (4)
POST −0.23∗∗∗ −0.48∗∗∗ −0.23∗∗∗ −0.53∗∗∗(0.051) (0.096) (0.049) (0.100)
Q2 % Sole Props 0.087 0.075 0.093 0.087× POST (0.065) (0.064) (0.066) (0.066)
Q3 % Sole Props 0.17*** 0.18*** 0.21*** 0.22***
× POST (0.059) (0.058) (0.060) (0.060)Q4 % Sole Props 0.20*** 0.21*** 0.21*** 0.22***
× POST (0.059) (0.058) (0.061) (0.061)Industry capital intensity 0.096*** 0.10***
× POST (0.033) (0.033)Industry growth −0.025 0.055
× POST (0.044) (0.057)Industry capital intensity −0.037∗∗∗ −0.042∗∗∗
× Trend (0.012) (0.013)Industry growth 0.079*** 0.120***
× Trend (0.014) (0.018)Treatment-specific trend Yes Yes Yes YesMonth-of-the-year FE Yes Yes Yes YesIndustry FE Yes Yes Yes YesObservations 24,360 24,360 24,360 24,360R2 0.84 0.84 0.76 0.77
created monthly in Q4 industries.29 These results suggest that the reform ledto the direct creation of 9,000 to 24,000 jobs by newly created firms each year.Note that this estimate excludes the effect of the reform on Q2 and Q3.
29 This wedge arises naturally from the difference in the base rate of jobs created by en-trepreneurial firms under the two assumptions: under the conservative assumption, newly createdfirms in treated industries generated 43 jobs on average, while the aggressive assumption led to118 jobs created monthly.
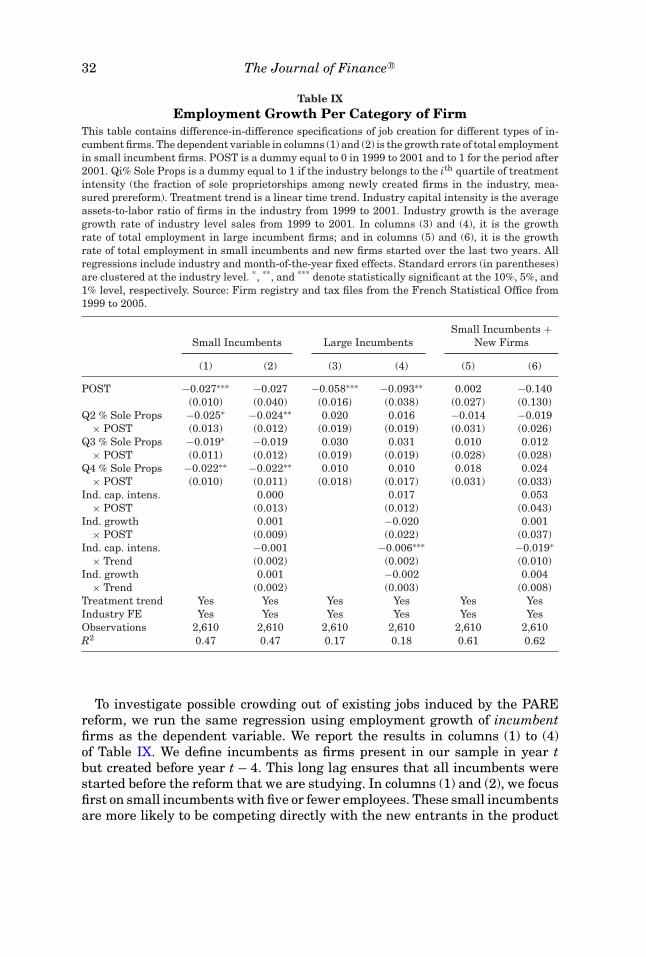
32 The Journal of Finance R©
Table IXEmployment Growth Per Category of Firm
This table contains difference-in-difference specifications of job creation for different types of in-cumbent firms. The dependent variable in columns (1) and (2) is the growth rate of total employmentin small incumbent firms. POST is a dummy equal to 0 in 1999 to 2001 and to 1 for the period after2001. Qi% Sole Props is a dummy equal to 1 if the industry belongs to the ith quartile of treatmentintensity (the fraction of sole proprietorships among newly created firms in the industry, mea-sured prereform). Treatment trend is a linear time trend. Industry capital intensity is the averageassets-to-labor ratio of firms in the industry from 1999 to 2001. Industry growth is the averagegrowth rate of industry level sales from 1999 to 2001. In columns (3) and (4), it is the growthrate of total employment in large incumbent firms; and in columns (5) and (6), it is the growthrate of total employment in small incumbents and new firms started over the last two years. Allregressions include industry and month-of-the-year fixed effects. Standard errors (in parentheses)are clustered at the industry level. *, **, and *** denote statistically significant at the 10%, 5%, and1% level, respectively. Source: Firm registry and tax files from the French Statistical Office from1999 to 2005.
Small Incumbents Large IncumbentsSmall Incumbents +
New Firms
(1) (2) (3) (4) (5) (6)
POST −0.027∗∗∗ −0.027 −0.058∗∗∗ −0.093∗∗ 0.002 −0.140(0.010) (0.040) (0.016) (0.038) (0.027) (0.130)
Q2 % Sole Props −0.025∗ −0.024∗∗ 0.020 0.016 −0.014 −0.019× POST (0.013) (0.012) (0.019) (0.019) (0.031) (0.026)
Q3 % Sole Props −0.019∗ −0.019 0.030 0.031 0.010 0.012× POST (0.011) (0.012) (0.019) (0.019) (0.028) (0.028)
Q4 % Sole Props −0.022∗∗ −0.022∗∗ 0.010 0.010 0.018 0.024× POST (0.010) (0.011) (0.018) (0.017) (0.031) (0.033)
Ind. cap. intens. 0.000 0.017 0.053× POST (0.013) (0.012) (0.043)
Ind. growth 0.001 −0.020 0.001× POST (0.009) (0.022) (0.037)
Ind. cap. intens. −0.001 −0.006∗∗∗ −0.019∗× Trend (0.002) (0.002) (0.010)
Ind. growth 0.001 −0.002 0.004× Trend (0.002) (0.003) (0.008)
Treatment trend Yes Yes Yes Yes Yes YesIndustry FE Yes Yes Yes Yes Yes YesObservations 2,610 2,610 2,610 2,610 2,610 2,610R2 0.47 0.47 0.17 0.18 0.61 0.62
To investigate possible crowding out of existing jobs induced by the PAREreform, we run the same regression using employment growth of incumbentfirms as the dependent variable. We report the results in columns (1) to (4)of Table IX. We define incumbents as firms present in our sample in year tbut created before year t − 4. This long lag ensures that all incumbents werestarted before the reform that we are studying. In columns (1) and (2), we focusfirst on small incumbents with five or fewer employees. These small incumbentsare more likely to be competing directly with the new entrants in the product
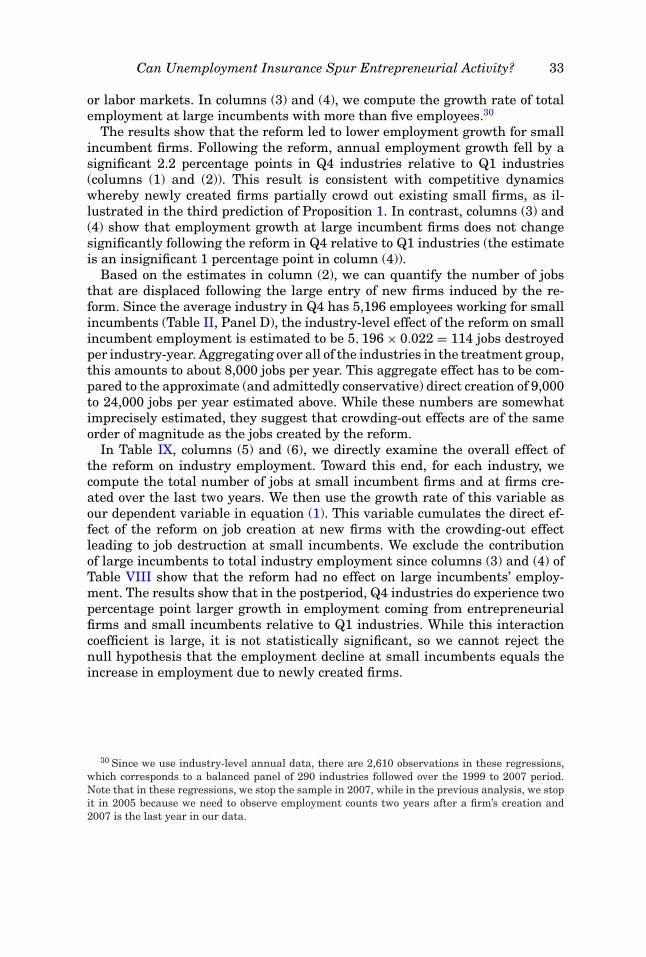
Can Unemployment Insurance Spur Entrepreneurial Activity? 33
or labor markets. In columns (3) and (4), we compute the growth rate of totalemployment at large incumbents with more than five employees.30
The results show that the reform led to lower employment growth for smallincumbent firms. Following the reform, annual employment growth fell by asignificant 2.2 percentage points in Q4 industries relative to Q1 industries(columns (1) and (2)). This result is consistent with competitive dynamicswhereby newly created firms partially crowd out existing small firms, as il-lustrated in the third prediction of Proposition 1. In contrast, columns (3) and(4) show that employment growth at large incumbent firms does not changesignificantly following the reform in Q4 relative to Q1 industries (the estimateis an insignificant 1 percentage point in column (4)).
Based on the estimates in column (2), we can quantify the number of jobsthat are displaced following the large entry of new firms induced by the re-form. Since the average industry in Q4 has 5,196 employees working for smallincumbents (Table II, Panel D), the industry-level effect of the reform on smallincumbent employment is estimated to be 5, 196 × 0.022 = 114 jobs destroyedper industry-year. Aggregating over all of the industries in the treatment group,this amounts to about 8,000 jobs per year. This aggregate effect has to be com-pared to the approximate (and admittedly conservative) direct creation of 9,000to 24,000 jobs per year estimated above. While these numbers are somewhatimprecisely estimated, they suggest that crowding-out effects are of the sameorder of magnitude as the jobs created by the reform.
In Table IX, columns (5) and (6), we directly examine the overall effect ofthe reform on industry employment. Toward this end, for each industry, wecompute the total number of jobs at small incumbent firms and at firms cre-ated over the last two years. We then use the growth rate of this variable asour dependent variable in equation (1). This variable cumulates the direct ef-fect of the reform on job creation at new firms with the crowding-out effectleading to job destruction at small incumbents. We exclude the contributionof large incumbents to total industry employment since columns (3) and (4) ofTable VIII show that the reform had no effect on large incumbents’ employ-ment. The results show that in the postperiod, Q4 industries do experience twopercentage point larger growth in employment coming from entrepreneurialfirms and small incumbents relative to Q1 industries. While this interactioncoefficient is large, it is not statistically significant, so we cannot reject thenull hypothesis that the employment decline at small incumbents equals theincrease in employment due to newly created firms.
30 Since we use industry-level annual data, there are 2,610 observations in these regressions,which corresponds to a balanced panel of 290 industries followed over the 1999 to 2007 period.Note that in these regressions, we stop the sample in 2007, while in the previous analysis, we stopit in 2005 because we need to observe employment counts two years after a firm’s creation and2007 is the last year in our data.
34 The Journal of Finance R©
Table XNew Firms versus Shrinking Incumbents
This table analyzes the crowding out of incumbent firms in response to new entrants. In PanelA, the dependent variable in columns (1) and (2) is total wages divided by number of employeesacross 265,586 observations; in columns (3) and (4), it is value-added per employee across 1,269,812observations; and in columns (5) and (6), sales per employee across 1,258,595 observations. Shrink-ing incumbents are defined as incumbents whose employment decreased over the prior year. Newfirm is a dummy variable equal to 0 if the observation corresponds to a shrinking incumbent andto 1 if it corresponds to a newly created firm. POST is a dummy equal to 0 in the 1999 to 2001period and to 1 for the 2002 to 2005 period. Qi% Sole Props is a dummy equal to 1 if the industrybelongs to the ith quartile of our treatment intensity variable. Quartile treatment × New firm arethe interactions of Q2, Q3, and Q4 with the new firm dummy. In Panel B, the dependent variablesare: In columns (1) and (2), TFP1 is the residual of a Cobb-Douglas production function estimatedindustry by industry. In columns (3) and (4), TFP2 uses the industry-level labor share as a coeffi-cient in the industry-level Cobb-Douglas production function. All regressions include industry ×year fixed effects. Standard errors (in parentheses) are clustered at the industry level. *, **, and*** denote statistically significant at the 10%, 5%, and 1% level, respectively. Source: Firm registryand tax files from the French Statistical Office, 1999 to 2005.
Panel A: Simple Measures of Productivity
Value-Added SalesWage Per Worker Per Worker
(1) (2) (3) (4) (5) (6)
New firm 5.2*** 5.7*** 7.0*** 6.6*** 9.3*** 5.4***
(0.39) (1.6) (0.37) (0.78) (0.51) (1.9)New firm × POST 0.014 0.18 0.19 0.62 0.23 1.8
(0.18) (0.39) (0.15) (0.55) (0.29) (1.1)Q2 % Sole Props −0.41 −0.22 −2.2
× New firm × POST (0.54) (0.65) (1.3)Q3 % Sole Props −0.72 −0.94 −2.3∗
× New firm × POST (0.47) (0.63) (1.2)Q4 % Sole Props 0.56 −0.25 −1.4
× New firm × POST (0.53) (0.6) (1.2)Industry × Year FE Yes Yes Yes Yes Yes YesQuartile treatment No Yes No Yes No Yes
× New firmR2 0.16 0.16 0.12 0.12 0.20 0.20
B. Efficiency
This section investigates how the PARE reform affected overall allocative ef-ficiency. Section V shows that the reform led to the massive entry of new firmsin the most exposed industries. The previous section provides evidence thatthis entry of new firms led to a significant reallocation of resources across newand old firms. The overall effect of the reform on allocative efficiency dependson the relative productivity of entrants attracted by the reform and incum-bents displaced by these entrants. In Table X, Panel A, we define displacedincumbents as (small) incumbents whose employment has been shrinking and
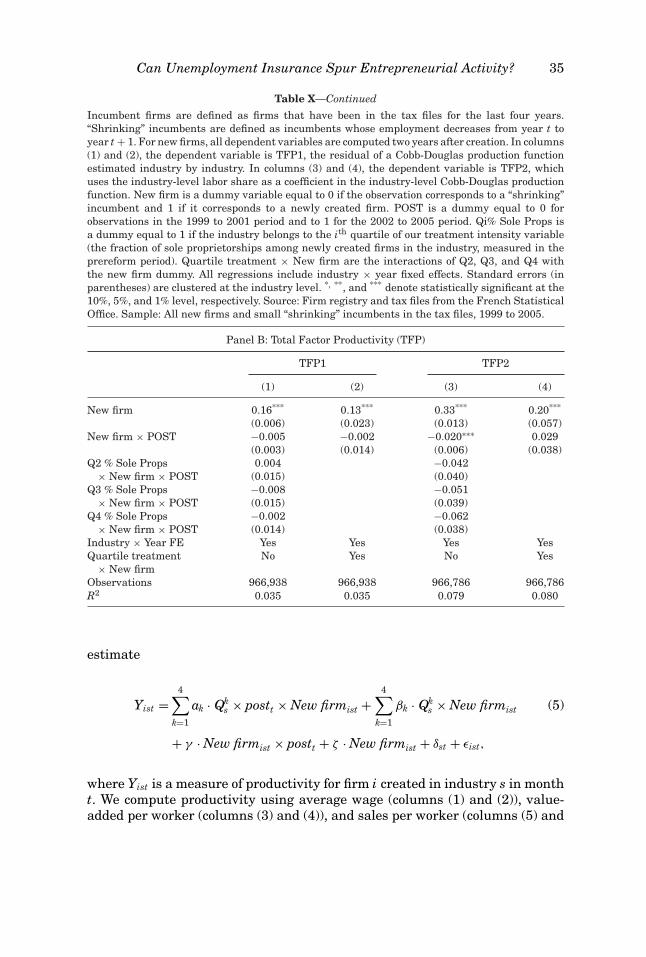
Can Unemployment Insurance Spur Entrepreneurial Activity? 35
Table X—Continued
Incumbent firms are defined as firms that have been in the tax files for the last four years.“Shrinking” incumbents are defined as incumbents whose employment decreases from year t toyear t + 1. For new firms, all dependent variables are computed two years after creation. In columns(1) and (2), the dependent variable is TFP1, the residual of a Cobb-Douglas production functionestimated industry by industry. In columns (3) and (4), the dependent variable is TFP2, whichuses the industry-level labor share as a coefficient in the industry-level Cobb-Douglas productionfunction. New firm is a dummy variable equal to 0 if the observation corresponds to a “shrinking”incumbent and 1 if it corresponds to a newly created firm. POST is a dummy equal to 0 forobservations in the 1999 to 2001 period and to 1 for the 2002 to 2005 period. Qi% Sole Props isa dummy equal to 1 if the industry belongs to the ith quartile of our treatment intensity variable(the fraction of sole proprietorships among newly created firms in the industry, measured in theprereform period). Quartile treatment × New firm are the interactions of Q2, Q3, and Q4 withthe new firm dummy. All regressions include industry × year fixed effects. Standard errors (inparentheses) are clustered at the industry level. *, **, and *** denote statistically significant at the10%, 5%, and 1% level, respectively. Source: Firm registry and tax files from the French StatisticalOffice. Sample: All new firms and small “shrinking” incumbents in the tax files, 1999 to 2005.
Panel B: Total Factor Productivity (TFP)
TFP1 TFP2
(1) (2) (3) (4)
New firm 0.16*** 0.13*** 0.33*** 0.20***
(0.006) (0.023) (0.013) (0.057)New firm × POST −0.005 −0.002 −0.020∗∗∗ 0.029
(0.003) (0.014) (0.006) (0.038)Q2 % Sole Props 0.004 −0.042
× New firm × POST (0.015) (0.040)Q3 % Sole Props −0.008 −0.051
× New firm × POST (0.015) (0.039)Q4 % Sole Props −0.002 −0.062
× New firm × POST (0.014) (0.038)Industry × Year FE Yes Yes Yes YesQuartile treatment No Yes No Yes
× New firmObservations 966,938 966,938 966,786 966,786R2 0.035 0.035 0.079 0.080
estimate
Yist =4∑
k=1
ak · Qks × postt × New firmist +
4∑k=1
βk · Qks × New firmist (5)
+ γ · New firmist × postt + ζ · New firmist + δst + εist,
where Yist is a measure of productivity for firm i created in industry s in montht. We compute productivity using average wage (columns (1) and (2)), value-added per worker (columns (3) and (4)), and sales per worker (columns (5) and
36 The Journal of Finance R©
(6)).31 The variable New firmist is a dummy equal to 1 for entrepreneurial firmscreated in year t and to 0 for “shrinking incumbents,” that is, firms whose laborforce decreases by at least one person count between t and t + 1—includingthose incumbents who exit the sample in t + 1. For each new firm created inyear t, productivity is measured as of year t + 2. We cluster standard errors atthe industry level.
Columns (1), (3), and (5) of Panel A show that, prior to the reform, wagesand productivity in newly created firms are larger than those of shrinking in-cumbents. Annual wages are about €5,200 larger, and value-added per workeris about €7,000 higher per year. These differences are sizable, considering thatthe average wage (including payroll taxes, as in our data) in France is about€50,000 per year. These estimations also show that the productivity advantageof newly created firms does not change in the postreform period. The interactionof the new firm dummy with the post dummy is quantitatively small and statis-tically insignificant. Of course, this result could mask a relative decrease in theproductivity of newly created firms in Q4 industries and a relative increase inthe productivity of newly created firms in Q1 industries. However, columns (2),(4), and (6) show that this is not the case. The larger productivity observed fornewly created firms does not increase differentially in the postreform periodfor firms in Q1, Q2, Q3, and Q4 industries.
In Panel B of Table X, we repeat these tests using total factor productivity(TFP). While TFP is more standard, we believe it less directly applicable toour set of very small firms, and thus we present this set of regressions forrobustness. We obtain T FP1 as the residual of the following regression, wherei is a firm in industry s and year t, and we use the universe of firms present inthe tax files:
log(Yist) = αst + βst log(List) + γst log(Kist) + εist,
where List is one plus firm i’s total employment (thus setting employmentof zero-employee firms to one), Kist is firm i’s fixed assets, and Yist is firmi’s value-added. We obtain T FP2 directly by computing T FP2ist = log(Yist) −ws log(List) + (1 − ws) log(Kist), where ws is the average labor share in value-added in industry s. We then reestimate equation (5) comparing the produc-tivity of new entrants to that of incumbent firms using these TFP measuresas dependent variables and report the results in Table X, Panel B. The resultsare very similar to those in Panel A: the TFP of new firms is higher, but thedifference between entrants and incumbents does not change significantly inresponse to the reform.32
Overall, despite low aggregate employment gains (Section VI.A), the evi-dence in this section suggests that the significant reallocation of labor from
31 In principle, value-added per worker is a better measure of productivity than sales per worker,as it excludes intermediate input purchases, but for small firms, total sales may be better reported.
32 In Internet Appendix Table IA.XVII, we obtain similar results when comparing the profitabil-ity of new firms to that of incumbents (Operating profit/Sales and Operating profit/Total assets).

Can Unemployment Insurance Spur Entrepreneurial Activity? 37
small incumbent firms to new firms led to significant productivity gains at theindustry level.
VII. Conclusion
In this paper, we look at a large-scale policy reform that provided signifi-cant downside insurance to unemployed workers who enter into entrepreneur-ship. The reform led to a large increase in firm creation. Surprisingly, thereform did not lead to a significant deterioration in the composition of thepool of entrepreneurs. While most firms start out small at creation, they showno differences in survival rates, growth, or likelihood to hire workers in theyears following creation. Similarly, personal characteristics of entrepreneurialquality such as educational attainment or ambition are not lower for the en-trepreneurs attracted by the reform. New firms are estimated to create between9,000 and 24,000 jobs annually. These results are in line with the experimen-tation view, which argues that the reform allows talented but potentially morerisk-averse people to explore self-employment. We do not find that the down-side insurance provided by the reform leads to significant adverse selectioninto self-employment.
The results also emphasize the importance of going beyond a partial equilib-rium analysis of these types of reforms. We document that the large entry ofnew firms had strong crowding-out effects, especially among small incumbents,which experienced a reduction in employment growth due to the reform. Thiscrowding-out effect is of the same order of magnitude as the direct creationeffect, so the overall effect on job creation is quite small. At the same time, weshow that newly created firms are significantly more productive than incum-bents. In a tentative cost-benefit analysis (see Internet Appendix II for details),we show that the reforms had a positive impact on the French economy. Weweigh the benefits of the reform due to shorter unemployment spells and la-bor reallocation to more productive and higher paying jobs against the costsof subsidizing the move of marginal and inframarginal unemployed into self-employment. We find that the benefits are roughly €350 million, while €100million are transferred from the unemployment agency to unemployed en-trepreneurs. Overall, the net cost of the reform is estimated to be about 10,000euro per job. We note that several factors are missing from this analysis. Forinstance, accounting for greater industry dynamism and nonpecuniary benefitsfrom shorter unemployment spells would lead to higher aggregate benefits.
Initial submission: January 10, 2018; Accepted: August 3, 2019Editors: Stefan Nagel, Philip Bond, Amit Seru, and Wei Xiong
REFERENCES
Adelino, Manuel, Song Ma, and David Robinson, 2017, Firm age, investment opportunities, andjob creation, Journal of Finance 72, 999–1038.
Adelino, Manuel, Antoinette Schoar, and Felipe Severino, 2015, House prices, collateral, and self-employment, Journal of Financial Economics 117, 288–306.
38 The Journal of Finance R©
Bertrand, Marianne, Antoinette Schoar, and David Thesmar, 2007, Banking deregulation andindustry structure: Evidence from the French banking reforms of 1985, Journal of Finance 62,597–628.
Bianchi, Milo, and Matteo Bobba, 2013, Liquidity, risk, and occupational choices, Review of Eco-nomic Studies 80, 491–511.
Blanchflower, David G., and Andrew J. Oswald, 1998, What makes an entrepreneur? Journal ofLabor Economics 16, 26–60.
Branstetter, Lee, Francisco Lima, Lowell J. Taylor, and Ana Venancio, 2014, Do entry regulationsdeter entrepreneurship and job creation? Evidence from recent reforms in Portugal, EconomicJournal 124, 805–832.
Bruhn, Miriam, 2011, License to sell: The effect of business registration reform on entrepreneurialactivity in Mexico, Review of Economics and Statistics 93, 382–386.
Card, David, and Phillip B. Levine, 2000, Extended benefits and the duration of UI spells: Evidencefrom the New Jersey extended benefit program, Journal of Public Economics 78, 107–138.
Caves, Richard E., 1998, Industrial organization and new findings on the turnover and mobility offirms, Journal of Economic Literature 36, 1947–1982.
Cetorelli, Nicola, and Philip E. Strahan, 2006, Finance as a barrier to entry: Bank competition andindustry structure in local U.S. markets, Journal of Finance 61, 437–461.
Cole, Shawn, 2009, Financial development, bank ownership, and growth: Or, does quantity implyquality?, Review of Economics and Statistics 91, 33–51.
Crepon, Bruno, Muriel Dejemeppe, and Marc Gurgand, 2005, Counseling the unemployed: Does itlower unemployment duration and recurrence? IZA Working Paper 1796.
de Mel, Suresh, David McKenzie, and Christopher Woodruff, 2008, Returns to capital in microen-terprises: Evidence from a field experiment, Quarterly Journal of Economics 123, 1329–1372.
Desai, Mihir, Paul Gompers, and Josh Lerner, 2003, Institutions, capital constraints and en-trepreneurial firm dynamics: Evidence from Europe, NBER Working Paper 10165.
Djankov, Simeon, Rafael La Porta, Florencio Lopez-De-Silanes, and Andrei Shleifer, 2002, Theregulation of entry, Quarterly Journal of Economics 117, 1–37.
Evans, David S., and Boyan Jovanovic, 1989, An estimated model of entrepreneurial choice underliquidity constraints, Journal of Political Economy 97, 808–827.
Gottlieb, Joshua D., Richard R. Townsend, and Ting Xu, 2016, Does career risk deter potentialentrepreneurs? NBER Working Paper 22446.
Haltiwanger, John, Ron S. Jarmin, and Javier Miranda, 2013, Who creates jobs? Small versuslarge versus young, Review of Economics and Statistics 95, 347–361.
Hamilton, Barton H., 2000, Does entrepreneurship pay? An empirical analysis of the returns toself-employment, Journal of Political Economy 108, 604–631.
Holtz-Eakin, Douglas, David Joulfaian, and Harvey S. Rosen, 1994a, Entrepreneurial decisionsand liquidity constraints, RAND Journal of Economics 25, 334–347.
Holtz-Eakin, Douglas, David Joulfaian, and Harvey S. Rosen, 1994b, Sticking it out: En-trepreneurial survival and liquidity constraints, Journal of Political Economy 102, 53–75.
Hurst, Erik, and Annamaria Lusardi, 2004, Liquidity constraints, household wealth, and en-trepreneurship, Journal of Political Economy 112, 319–347.
Hurst, Erik, and Benjamin Wild Pugsley, 2011, What do small businesses do? Brookings Paperson Economic Activity 43, 73–142.
Jovanovic, Boyan, 1982, Selection and the evolution of industry, Econometrica 50, 649–670.Katz, Lawrence F., and Bruce D. Meyer, 1990, Unemployment insurance, recall expectations, and
unemployment outcomes, Quarterly Journal of Economics 105, 973–1002.Kerr, William, and Ramana Nanda, 2009a, Financing constraints and entrepreneurship, NBER
Working Paper 15498.Kerr, William R., and Ramana Nanda, 2009b, Democratizing entry: Banking deregulations, financ-
ing constraints, and entrepreneurship, Journal of Financial Economics 94, 124–149.Kihlstrom, Richard E., and Jean-Jacques Laffont, 1979, A general equilibrium entrepreneurial
theory of firm formation based on risk aversion, Journal of Political Economy 87, 719–748.Klapper, Leora, Luc Laeven, and Raghuram Rajan, 2006, Entry regulation as a barrier to en-
trepreneurship, Journal of Financial Economics 82, 591–629.
Can Unemployment Insurance Spur Entrepreneurial Activity? 39
Landier, Augustin, and David Thesmar, 2009, Financial contracting with optimistic entrepreneurs,Review of Financial Studies 22, 117–150.
Lucas, Robert E., 1978, On the size distribution of business firms, Bell Journal of Economics 9,508–523.
Manso, Gustavo, 2011, Motivating innovation, Journal of Finance 66, 1823–1860.Moffitt, Robert, 1985, Unemployment insurance and the distribution of unemployment spells,
Journal of Econometrics 28, 85–101.Moskowitz, Tobias J., and Annette Vissing-Jørgensen, 2002, The returns to entrepreneurial in-
vestment: A private equity premium puzzle? American Economic Review 92, 745–778.Mullainathan, Sendhil, and Philipp Schnabl, 2010, Does less market entry regulation generate
more entrepreneurs? Evidence from a regulatory reform in Peru, in Josh Lerner and An-toinette Schoar, eds.: International Differences in Entrepreneurship (University of ChicagoPress, Chicago, IL).
Nanda, Ramana, 2008, Cost of external finance and selection into entrepreneurship, HarvardBusiness School Working Paper 08-047.
Rampini, Adriano, and S. Viswanathan, 2010, Collateral, risk management, and the distributionof debt capacity, Journal of Finance 65, 2293–2322.
Rieg, Christian, 2004, Forte hausse des creations d’entreprises en 2003, INSEE Premiere 994.Schmalz, Martin C., David Alexandre Sraer, and David Thesmar, 2017, Housing collateral and
entrepreneurship, Journal of Finance 71, 99–132.Schoar, Antoinette, 2010, The divide between subsistence and transformational entrepreneurship,
in Joshua Lerner and Scott Stern, eds.: Innovation Policy and the Economy, Volume 10, pp. 57–81 (The University of Chicago Press, Chicago, IL).
Solon, Gary R., 1985, Work incentive effects of taxing unemployment benefits, Econometrica 53,295–306.
UNEDIC, 2001, Convention du 1er janvier 2001 relative a l’aide au retour a l’emploi et al’indemnisation du chomage, Technical report.
Supporting Information
Additional Supporting Information may be found in the online version of thisarticle at the publisher’s website:
Appendix S1: Internet Appendix.Replication code.