Embed Size (px)
Citation preview

University of Pennsylvania University of Pennsylvania
ScholarlyCommons ScholarlyCommons
Publicly Accessible Penn Dissertations
2016
Can Vigorous Shaking Cause Extra-Axial Hemorrhage in Can Vigorous Shaking Cause Extra-Axial Hemorrhage in
Newborns? A Detailed Human and Porcine Study. Newborns? A Detailed Human and Porcine Study.
Stephanie Ann Pasquesi University of Pennsylvania, [email protected]
Follow this and additional works at: https://repository.upenn.edu/edissertations
Part of the Biomedical Commons
Recommended Citation Recommended Citation Pasquesi, Stephanie Ann, "Can Vigorous Shaking Cause Extra-Axial Hemorrhage in Newborns? A Detailed Human and Porcine Study." (2016). Publicly Accessible Penn Dissertations. 1934. https://repository.upenn.edu/edissertations/1934
This paper is posted at ScholarlyCommons. https://repository.upenn.edu/edissertations/1934 For more information, please contact [email protected].

Can Vigorous Shaking Cause Extra-Axial Hemorrhage in Newborns? A Detailed Can Vigorous Shaking Cause Extra-Axial Hemorrhage in Newborns? A Detailed Human and Porcine Study. Human and Porcine Study.
Abstract Abstract Traumatic brain injury (TBI) is the most prominent cause of death and disability in infants. Extra-axial hemorrhage (EAH) is a common finding among infants diagnosed with abusive head trauma, but is confounded by similar findings in accidental injuries. We conducted detailed biomechanical studies to determine whether the kinematics of vigorous shaking could rupture the parasagittal bridging veins (BVs), one cause of EAH. We performed BV mechanical property tests, in situ and in vivo rapid head rotation animal experiments, infant surrogate head kinematic studies, and finite element (FE) model simulations of the neonatal porcine and infant human heads to reveal whether BV rupture may occur due to vigorous shaking. Under longitudinal tension, we found that BV mechanical properties and behavior do not depend on age, but vary with species, stretch rate, and a history of cyclic loading. In situ brain-skull displacements in the neonatal porcine head under rapid nonimpact sagittal rotations are lower than those observed in axial rotations, and altering BV properties yielded no appreciable difference in FE model brain-skull displacement. We correlated FE-predicted BV element failures during sagittal rapid nonimpact head rotations in the piglet with EAH pathology from corresponding animal studies, and identified and independently validated a threshold of 6 failed BV elements in our model were associated with detectable EAH. Finally, using this threshold and human infant BV mechanical properties in a human infant head FE model, we determined a response corridor for BV rupture, and found that rotational acceleration influences BV rupture. Our results suggest that it may be possible to generate a combination of sagittal head kinematics during vigorous shaking that could produce EAH in the human infant. Prior to legal application, additional analyses are required to validate these predictions of BV rupture against real-world data, such as torn BVs at autopsy in cases of admitted shaking without impact. Together, the integrated studies presented in this dissertation illuminate biomechanical factors that may cause BV rupture in the infant.
Degree Type Degree Type Dissertation
Degree Name Degree Name Doctor of Philosophy (PhD)
Graduate Group Graduate Group Bioengineering
First Advisor First Advisor Susan S. Margulies
Subject Categories Subject Categories Biomedical
This dissertation is available at ScholarlyCommons: https://repository.upenn.edu/edissertations/1934

CAN VIGOROUS SHAKING CAUSE EXTRA-AXIAL HEMORRHAGE IN NEWBORNS? A DETAILED
HUMAN AND PORCINE STUDY
Stephanie Ann Pasquesi
A DISSERTATION
in
Bioengineering
Presented to the Faculties of the University of Pennsylvania
in
Partial Fulfillment of the Requirements for the
Degree of Doctor of Philosophy
2016
Supervisor of Dissertation
_______________________
Susan S. Margulies
Professor of Bioengineering
Graduate Group Chairperson
________________________
Jason A. Burdick, Professor of Bioengineering
Dissertation Committee
David F. Meaney, Solomon R. Pollack Professor and Chair of Bioengineering (Committee Chair) Kristy Arbogast, Research Associate Professor of Pediatrics Brittany Coats, Associate Professor of Mechanical Engineering, University of Utah D. Kacy Cullen, Research Assistant Professor of Neurosurgery

CAN VIGOROUS SHAKING CAUSE EXTRA-AXIAL HEMORRHAGE IN NEWBORNS? A
DETAILED HUMAN AND PORCINE STUDY
COPYRIGHT
2016
Stephanie Ann Pasquesi
This work is licensed under the Creative Commons Attribution- NonCommercial-ShareAlike 3.0 License To view a copy of this license, visit
https://creativecommons.org/licenses/by-nc-sa/3.0/us/

iii
In loving memory of my grandparents, Carlo and Costanza Pasquesi, who understood hard work and the value of education.

iv
ACKNOWLEDGMENTS
I would not have been able to complete this dissertation without the constant support,
guidance, and encouragement of those close to me.
First, I would like to thank my advisor, Susan Margulies, who has challenged me and
fostered my growth as an independent research scientist. I am grateful for her time, patience,
invaluable insight, guidance, and encouragement, especially when I was unsure of myself. Next, I
would like to thank my dissertation committee members, Dave Meaney, Brittany Coats, Kacy
Cullen, and Kristy Arbogast for their useful suggestions, support, and time helping me sort
through various project dilemmas over the years. Though not on my committee, Lucy Rorke-
Adams was also integral to my research efforts, and a true inspiration as a trailblazing woman in
science.
To all of the Margulies lab members, many thanks. To those who came before me,
notably Michael Prange, Brittany Coats (again!), Stephanie Eucker, and Nicole Ibrahim, thank you
for providing me with a solid foundation upon which to build. To those I worked closely with:
Sarah Sullivan, Kathy Liu, Connor Bradfield, Matt Maltese, Dianne Weeks, Lorre Atlan, and
Marzieh Memar, thank you for sharing your ideas and your willingness to lend an ear. Finally, to
Jill Ralston, Gladys Gray-Lawrence, and Melissa Byro thank you for keeping the lab a safe and
efficient place to conduct research, and most of all for being great friends.
I would also like to recognize my friends outside of the lab, including Maria Murray, Julia
Pavone, Rosa Alvarez, members of the Penn Advancing Women in Engineering Advisory Board,
those who served with me on the Graduate and Professional Student Assembly, countless
soccer, kickball, and softball teammates, and all of the sisters of Alpha Omega Epsilon, especially
those with whom I served on the International Executive Board and my senior year (undergrad)
apartment-mates (Rose, Jen, and Julie). I cherish the time we spend together and cannot
express how important your friendships are to me. Thank you for your endless support during my
time in graduate school.

v
I have also been incredibly fortunate to have many influential teachers and mentors
throughout my education, without whom I likely would never have attempted a doctoral degree. In
particular, I would like to recognize Mike Downey, Laura Nickerson, Don Porzio, Micah Fogel,
Shar Puskala, Ken Gall, and Kurt Jacobus for their encouragement and belief in my abilities at
different points in my journey.
Most importantly, I would like to thank my family. A special thanks goes to Lex Mercado,
who I can always count on to lift my spirits, for always believing in me and supporting me through
difficult times in my graduate education. To my siblings, Lauren and Dominic, your achievements
on the soccer field, in the classroom, and professionally continue to amaze me and push me to
be a better scientist and big sister. To my parents, Christy and Oz, thank you for teaching me to
have great work ethic, for allowing me to determine my own path, and for providing me with the
greatest support and guidance along the way. Mom, thanks for all the sacrifices you made to be
the biggest cheerleader a (three) kid(s) could ever wish for and encouraging me (us) to dream
big. Dad, thanks for constantly sparking my (our) curiosity and inspiring my (our) thirst for
knowledge, and for always doing it in the form of a game.
None of this would have been possible without all of you. I am so grateful.

vi
ABSTRACT
CAN VIGOROUS SHAKING CAUSE EXTRA-AXIAL HEMORRHAGE IN NEWBORNS? A
DETAILED HUMAN AND PORCINE STUDY
Stephanie Ann Pasquesi
Susan S. Margulies, PhD
Traumatic brain injury (TBI) is the most prominent cause of death and disability in infants.
Extra-axial hemorrhage (EAH) is a common finding among infants diagnosed with abusive head
trauma, but is confounded by similar findings in accidental injuries. We conducted detailed
biomechanical studies to determine whether the kinematics of vigorous shaking could rupture the
parasagittal bridging veins (BVs), one cause of EAH. We performed BV mechanical property
tests, in situ and in vivo rapid head rotation animal experiments, infant surrogate head kinematic
studies, and finite element (FE) model simulations of the neonatal porcine and infant human
heads to reveal whether BV rupture may occur due to vigorous shaking. Under longitudinal
tension, we found that BV mechanical properties and behavior do not depend on age, but vary
with species, stretch rate, and a history of cyclic loading. In situ brain-skull displacements in the
neonatal porcine head under rapid nonimpact sagittal rotations are lower than those observed in
axial rotations, and altering BV properties yielded no appreciable difference in FE model brain-
skull displacement. We correlated FE-predicted BV element failures during sagittal rapid
nonimpact head rotations in the piglet with EAH pathology from corresponding animal studies,
and identified and independently validated a threshold of 6 failed BV elements in our model were
associated with detectable EAH. Finally, using this threshold and human infant BV mechanical
properties in a human infant head FE model, we determined a response corridor for BV rupture,
and found that rotational acceleration influences BV rupture. Our results suggest that it may be
possible to generate a combination of sagittal head kinematics during vigorous shaking that could
produce EAH in the human infant. Prior to legal application, additional analyses are required to
validate these predictions of BV rupture against real-world data, such as torn BVs at autopsy in

vii
cases of admitted shaking without impact. Together, the integrated studies presented in this
dissertation illuminate biomechanical factors that may cause BV rupture in the infant.
viii
TABLE OF CONTENTS
ACKNOWLEDGMENTS ............................................................................................. IV
ABSTRACT ................................................................................................................ VI
LIST OF TABLES .....................................................................................................XIV
LIST OF ILLUSTRATIONS ........................................................................................XV
CHAPTER 1: BACKGROUND AND SIGNIFICANCE ................................................... 1
References ................................................................................................................... 5
CHAPTER 2: MECHANICAL PROPERTIES OF INFANT HUMAN AND NEWBORN PORCINE PARASAGITTAL BRIDGING VEINS ......................................................... 12
Abstract ......................................................................................................................12
Introduction.................................................................................................................12
Methods ......................................................................................................................14 Test Apparatus ..........................................................................................................14 Specimen Preparation ................................................................................................14 Test Protocol .............................................................................................................16 Data Analysis ............................................................................................................18
Cyclic Loading Analysis ...........................................................................................18 Failure Analysis ......................................................................................................19
Results........................................................................................................................21 Cyclic Loading ...........................................................................................................21 Failure Tests .............................................................................................................22
Discussion ..................................................................................................................26
Limitations ..................................................................................................................31
Conclusions ................................................................................................................32
Acknowledgements......................................................................................................33
References ..................................................................................................................33
CHAPTER 3: MEASUREMENT OF SAGITTAL PLANE BRAIN-SKULL DISPLACEMENTS AND VALIDATION OF A CORRESPONDING FINITE ELEMENT MODEL BOUNDARY CONDITION IN THE NEONATAL PIG ..................................... 39
Abstract ......................................................................................................................39

ix
Introduction.................................................................................................................40
Methods ......................................................................................................................41 Physical Model ..........................................................................................................41
Construction ..........................................................................................................41 Rotation ................................................................................................................43 Image Processing ...................................................................................................44 Data Analysis .........................................................................................................44
Finite Element Model ..................................................................................................46 Construction and Simulation .....................................................................................46 Data Analysis .........................................................................................................51
Results........................................................................................................................52 Physical Model ..........................................................................................................52
Measurement Error .................................................................................................52 Brain-Skull Displacement .........................................................................................55
Finite Element Model Optimization ................................................................................57
Discussion ..................................................................................................................59
Limitations ..................................................................................................................64
Conclusions ................................................................................................................66
References ..................................................................................................................66
CHAPTER 4: RAPID HEAD ROTATIONS CAUSE BRIDGING VEIN RUPTURE AND EXTRA-AXIAL HEMORRHAGE IN THE NEONATAL PIG ......................................... 70
Abstract ......................................................................................................................70
Introduction.................................................................................................................70
Methods ......................................................................................................................71 Rapid Nonimpact Rotational Neonatal Porcine Brain Injury Studies....................................71 Finite Element Model Development and Simulation .........................................................74 Data Analysis ............................................................................................................80
Porcine Rotational Brain Injury Kinematics..................................................................80 Relationship between Injury Parameters and Finite Element Model Predictions of Bridging Vein Rupture..........................................................................................................81 Development and Validation of EAH Prediction ...........................................................81
Results........................................................................................................................82 Neonatal Porcine Rotational TBI Study Kinematics..........................................................82 Relationship between Injury Kinematics and Nfail .............................................................87 Development of EAH Prediction Criterion .......................................................................90 Validation of EAH Prediction Criterion ...........................................................................90 Extension of EAH Prediction Criterion to Cyclic Rotational Injuries .....................................90
Discussion ..................................................................................................................90
Limitations ..................................................................................................................94

x
Conclusions ................................................................................................................96
References ..................................................................................................................96
CHAPTER 5: FINITE ELEMENT MODEL PREDICTIONS OF BRIDGING VEIN RUPTURE RESULTING FROM VIGOROUS SHAKING IN THE HUMAN INFANT...... 99
Abstract ......................................................................................................................99
Introduction.................................................................................................................99
Methods .................................................................................................................... 101 Construction of an Instrumented Human Infant Anthropomorphic Surrogate ...................... 101 Measurement and Analysis of Head Shaking Kinematics................................................ 102 Human Infant Finite Element Model Development ......................................................... 103 Finite Element Model Simulations of Vigorous Shaking in the Human Infant ...................... 107
Results...................................................................................................................... 114 Head Shaking Kinematics Measured from a Human Infant Anthropomorphic Surrogate ...... 114 Finite Element Model Predictions of Bridging Vein Rupture ............................................. 115
Discussion ................................................................................................................ 119
Limitations ................................................................................................................ 121
Conclusions .............................................................................................................. 124
References ................................................................................................................ 124
CHAPTER 6: CONCLUSIONS AND FUTURE DIRECTIONS ................................... 129
Introduction............................................................................................................... 129
Bridging Vein Tissue Mechanical Properties and Mechanical Disruption ....................... 129
The Brain-Skull Boundary During Rapid Head Rotations .............................................. 131
Predictions of Bridging Vein Rupture and Subsequent Extra -Axial Hemorrhage ............ 133
Additional Areas for Future Investigation .................................................................... 137
Conclusion ................................................................................................................ 138
References ................................................................................................................ 138
APPENDIX A: EFFECT OF CRYOPRESERVATION CONDITIONS ON ELASTIC MODULUS OF IMMATURE PORCINE SAPHENOUS VEINS................................... 140
Introduction............................................................................................................... 140 Motivation ............................................................................................................... 140 Objective ................................................................................................................ 140

xi
Experimental Design .................................................................................................. 141 Effect of Freeze/Thaw Rate ....................................................................................... 141 Effect of Cryopreservation Solution ............................................................................. 141 Effect of Strain Rate ................................................................................................. 142 Effect of Post-Mortem Delay ...................................................................................... 142
Methods .................................................................................................................... 143 Cryopreservation...................................................................................................... 143 Post-Mortem Delay................................................................................................... 143 Mechanical Testing .................................................................................................. 144
Results...................................................................................................................... 145 Effect of Freeze/Thaw Rate ....................................................................................... 145 Effect of Strain Rate ................................................................................................. 146 Effect of Cryopreservation Solution ............................................................................. 147 Effect of Post-Mortem Delay ...................................................................................... 148
Conclusions .............................................................................................................. 148
Acknowledgements.................................................................................................... 148
References ................................................................................................................ 149
APPENDIX B: BRIDGING VEIN MECHANICAL TEST CURVES.............................. 150
B.1 Porcine Newborn Bridging Vein Cyclic Loading Peak Stress Decay and Stress-Stretch Curves ...................................................................................................................... 150
B.2 Porcine Adult Bridging Vein Cyclic Loading Peak Stress Decay and Stress-Stretch Curves ...................................................................................................................... 155
B.3 Human Infant Bridging Vein Cyclic Loading Peak Stress Decay and Stress-Stretch Curves ...................................................................................................................... 161
B.4 Porcine Newborn Bridging Vein Failure Elongation Stress-Stretch Curves .............. 165
B.5 Porcine Adult Bridging Vein Failure Elongation Stress-Stretch Curves .................... 170
B.6 Human Infant Bridging Vein Failure Elongation Stress-Stretch Curves .................... 176
APPENDIX C: REPEATED LOADING BEHAVIOR OF PORCINE COMMON CAROTID ARTERIES .............................................................................................................. 180
Abstract .................................................................................................................... 181
Introduction............................................................................................................... 182
Methods .................................................................................................................... 182 Specimen Preparation .............................................................................................. 182 Test Apparatus ........................................................................................................ 184 Test Protocol ........................................................................................................... 185 Data Analysis .......................................................................................................... 185

xii
Results...................................................................................................................... 187
Discussion ................................................................................................................ 188
Limitations ................................................................................................................ 190
Conclusions .............................................................................................................. 191
Acknowledgements.................................................................................................... 191
References ................................................................................................................ 191
APPENDIX D: AVERAGED BRIDGING VEIN STRESS-STRETCH CURVES ........... 198
APPENDIX E: SAGITTAL PLANE PHYSICAL TRANSECTION BRAIN-SKULL DISPLACEMENT TIME-HISTORIES ........................................................................ 200
APPENDIX F: ALTERNATE MEASURES OF NEONATAL PORCINE ROTATIONAL INJURY KINEMATICS ............................................................................................. 206
F.1 Single Low Level Rotational Injury Kinematics Determined from Raw Angular Velocity and Gaussian Smoothed Angular Acceleration Traces ................................................. 206
F.2 Single High Level Rotational Injury Kinematics Determined from Raw Angular Velocity and Gaussian Smoothed Angular Acceleration Traces ................................................. 207
F.3 Cyclic Rotational Injury Kinematics Determined from the Entire Injury History Trace 208
APPENDIX G: PORCINE FINITE ELEMENT MODEL SIMULATED ANGULAR VELOCITY, SIMULATED ANGULAR ACCELERATION, AND BRIDGING VEIN FAILURE - TIME HISTORIES .................................................................................. 209
G.1 Single Low Level Sagittal Finite Element Simulated Kinematics and Resulting Bridging Vein Element Failures Across Time ............................................................................. 209
G.2 Single High Level Sagittal Finite Element Simulated Kinematics and Resulting Bridging Vein Element Failures Across Time ............................................................................. 220
G.1 Cyclic Finite Element Simulated Kinematics and Resulting Bridging Vein Element Failures Across Time ................................................................................................. 245
APPENDIX H: INSTRUMENTED SURROGATE SHAKING TRACES....................... 255
H.1 Trial 1 Shakes, without Instruction to use Maximum Neck Range of Motion ............. 255
H.2 Trial 2 Shakes, with Instruction to use Maximum Neck Range of Motion .................. 265

xiii
APPENDIX I: HUMAN FINITE ELEMENT MODEL SIMULATED VELOCITY, SIMULATED ACCELERATION, AND BRIDGING VEIN FAILURE - TIME HISTORIES ................................................................................................................................ 275

xiv
LIST OF TABLES
Table 2.1 Average exponential decay equation coefficients (Eq. 6) and coefficients of determination (R2) within subject types and across all subjects. ............................................21
Table 2.2 Average instantaneous peak stress (σpeak,0) and steady state peak stress (σpeak,SS) within subject types and across all subjects. ......................................................................22
Table 2.3 Average stretch rates for low rate, high rate, and post-cyclic failure tests by subject type. ............................................................................................................................24
Table 2.4 Average yield stretch (λy), yield stress (σy), ultimate stretch (λu), ultimate stress (σu), and elastic modulus (E), across subject and failure test types. ..............................................25
Table 3.1 Material properties used in the sagittally transected porcine head finite element model ...................................................................................................................................47
Table 3.2 Peak angular velocities, peak angular accelerations, peak angular decelerations, average maximum brain-skull displacements during motion, and average brain-skull displacement errors are shown for each transection experiment. ..............................................................54
Table 3.3 Previously conducted newborn piglet axial transection experiment peak angular velocities, peak angular accelerations, peak angular decelerations, and average maximum brain-skull displacements. .......................................................................................................56
Table 3.4 All stiffness values tested for general brain-skull/falx connectors in the sagittally transected finite element model, and corresponding slopes between finite element and physical transection experiment brain-skull displacements over all dots and superior-only dots. .............58
Table 4.1 Porcine finite element model simulation group sample sizes. ..................................72
Table 4.2 Material properties used in the neonatal porcine whole head finite element model. ....75
Table 4.3 True and hypothetical finite element model bridging vein stretch rates for comparison with high rate porcine newborn bridging vein stretch rates from Chapter 2. .............................77
Table 4.4 Single low level sagittal rotational injury kinematics as determined from velocity and acceleration traces filtered for finite element analysis, and resulting hemorrhage scores and number of failed bridging vein elements from finite element simulations (Nfail)..........................84
Table 4.5 Single high level sagittal rotational injury kinematics as determined from velocity and acceleration traces filtered for finite element analysis, and resulting hemorrhage scores and number of failed bridging vein elements from finite element simulations (Nfail)..........................85
Table 4.6 Cyclic rotational injury kinematics as determined from velocity and acceleration traces cropped for finite element analysis, and resulting hemorrhage scores and number of failed bridging vein elements from finite element simulations (Nfail). ................................................86
Table 5.1 Material Properties used in the Human Infant Finite Element Model....................... 105
Table 5.2 Surrogate Shaking Kinematics and Instances of Neck Failure. .............................. 115
Table 5.3 Kinematics of cropped simulated shaking traces and resulting number of bridging vein failures ....................................................................................................................... 118

xv
LIST OF ILLUSTRATIONS
Figure 1.1 Flowchart of studies contained in and questions answered by this dissertation ... Error! Bookmark not defined.
Figure 2.1 Stretch vs time and stress vs time plots of a typical cyclic loading protocol followed by post-cyclic failure test.. ...................................................................................................17
Figure 2.2 Diagram of vessel microscopy setup for dimension measurements.........................18
Figure 2.3 Representative human infant and porcine newborn curves showing the exponential decay of peak stresses with continued cycling. ...................................................................22
Figure 2.4 Failure test stress vs stretch plots for representative human infant and porcine newborn subjects...........................................................................................................24
Figure 3.1 Cross-sectional diagram of the physical sagittal plane transection configuration. ......42
Figure 3.2 Example of an initial cropped video frame of a physical transection experiment ........45
Figure 3.3 Sagittally transected finite element model of the 3-5 day old piglet..........................46
Figure 3.4 An example of angular velocity and angular acceleration time histories for one transection rotation and the associated brain-rigid dot displacement ......................................55
Figure 3.5 Box and whiskers plot of peak brain-skull displacements measured in first rotation sagittal transections from this study and first rotation axial transections detailed in previous work ...................................................................................................................................57
Figure 3.6 Optimized connector stiffness finite element versus physical model peak brain-skull displacements for post-cyclic and high rate bridging vein behavior as well as all and superior-only dot pairs. ......................................................................................................................59
Figure 3.7 Shape comparison of sagittal and axial transection physical models and finite element models. ........................................................................................................................62
Figure 3.8 Brain-Skull/Rigid Dot Maximum Physical Transection Displacements around Cerebrum Periphery......................................................................................................................63
Figure 4.1 Finite element model of the neonatal porcine head ..............................................74
Figure 4.2 Example whole cyclic injury angular velocity-time and angular acceleration-time plots with corresponding cropped angular velocity and angular acceleration time-history plots for finite element analysis............................................................................................................79
Figure 4.3 Nfail versus peak angular velocity (or maximum peak-to-peak velocity for cyclic simulations) across all studies. ........................................................................................87
Figure 4.4 Nfail versus maximum angular acceleration across all studies. ................................88
Figure 4.5 Nfail versus EAH% across all studies ..................................................................88
Figure 4.6 Representative example of a high load level finite element simulation angular velocity-time history, angular acceleration-time history, and resulting Nfail over time. ............................89

xvi
Figure 4.7 EAH versus peak angular velocity and EAH vs peak angular acceleration magnitudes across all studies. ..........................................................................................................93
Figure 5.1 Instrumented human surrogate, and surrogate neck and angular rate sensor mounting plate assembly ............................................................................................................ 102
Figure 5.2 Human Infant Finite Element Model ................................................................. 105
Figure 5.3 Entire and cropped high angular velocity – high angular acceleration surrogate shaking episode kinematics ...................................................................................................... 109
Figure 5.4 Entire and cropped low angular velocity – low angular acceleration surrogate shaking episode kinematics ...................................................................................................... 110
Figure 5.5 Fabricated low angular velocity – high angular acceleration surrogate shaking episode finite element model simulated kinematics. ...................................................................... 111
Figure 5.6 Entire and cropped high angular velocity – high angular acceleration surrogate shaking episode without neck damage kinematics. ....................................................................... 112
Figure 5.7 Idealized curve mass-scaled from porcine cyclic injury peak angular velocity and acceleration values to human infant. ............................................................................... 113
Figure 5.8 Example finite element model simulated angular velocity, angular acceleration and resulting bridging vein element failures over time .............................................................. 117

1
CHAPTER 1: BACKGROUND AND SIGNIFICANCE
Traumatic brain injury (TBI) is a leading cause of death and disability in children aged 0
to 4 years in the United States with over 250,000 emergency department visits (the highest of any
age group), over 15,000 hospitalizations, and nearly 1,000 deaths annually [1]. While accidental
falls are the most common cause of TBI among young children, motor vehicle accidents and
abusive head trauma (AHT) produce more severe injuries and fatalities [2]. More serious TBIs in
infants and toddlers are frequently due to AHT [3], and these cases often have worse outcomes
[4]. Extra-axial hemorrhage (EAH), a collection of blood between the brain and skull (including
both subdural and subarachnoid bleeds), is a common presentation among children who have
suffered AHT [2-4]. Unilateral EAH is more common in older children, while young children
display bilateral EAH more frequently [5], suggesting that the mechanism and pattern of injury in
AHT may vary with age. Past studies from our laboratory have shown that children do indeed
have injury mechanisms and tissue (brain, skull, and suture) material properties that are distinct
from adults [6-16].
One mechanism of injury responsible for EAH is thought to be the rupture or tearing of
the parasagittal bridging veins (BVs), which drain blood from brain tissue into the superior sagittal
sinus, housed in the falx cerebri, which is attached to the inner surface of the skull. Tearing of the
BVs may be caused by rapid head motions in which the movement of the brain lags that of the
skull, stretching the veins at high rates of deformation at their attachment points or within the
subdural space. Indeed, over forty years ago rotational accelerative trauma was identified as the
cause of diffuse brain injuries that were most severe at the periphery [17], whereas translational
accelerations produced more focal lesions. Thus, together with the prevalence of EAH in cases of
AHT, we hypothesize that vigorous shaking without impact in the human infant may
indeed cause BV rupture leading to EAH. Questions include whether vigorous shaking alone
can cause serious TBI including BV rupture and subsequent EAH, whether the mechanical
properties of BVs are rate and/or age-dependent, and whether BVs exhibit fatigue type wear due

2
to cyclic stretching which may occur in shaking type insults. In summary, the injury mechanism of
EAH and the contribution of shaking to EAH in pediatric TBI are not well characterized,
generating an abundance of scientific and legal debate [18-22]. As a consequence, prevention of
misdiagnosis, improvement of diagnosis criteria, and protection of abused children continue to be
clinical, societal, and legal challenges. The over-arching objective of this dissertation was to
determine whether BV failure and subsequent EAH may result from episodes of vigorous
shaking in the human infant. This goal was achieved by combining human and porcine bridging
vein mechanical property testing at low rates, high rates, and under repeated loading (Chapter
2), determination of a sagittal plane rotational brain-skull displacement boundary condition
(Chapter 3), porcine and human computational modeling to relate head kinematics to BV
elongations (Chapters 4 and 5), and anthropomorphic dummy studies to determine real world
AHT loading conditions (Chapter 5). A flowchart of research activities is shown in Figure 1.1.
Figure 1.0.1 Flowchart of studies contained in and questions answered by this dissertation
As background, the axial mechanical properties of BVs have been examined previously
in the adult [23-28], but to date no testing has been performed on specimens from subjects under
3
three years of age [24], with exception of an anecdotal report of bridging veins from three infant
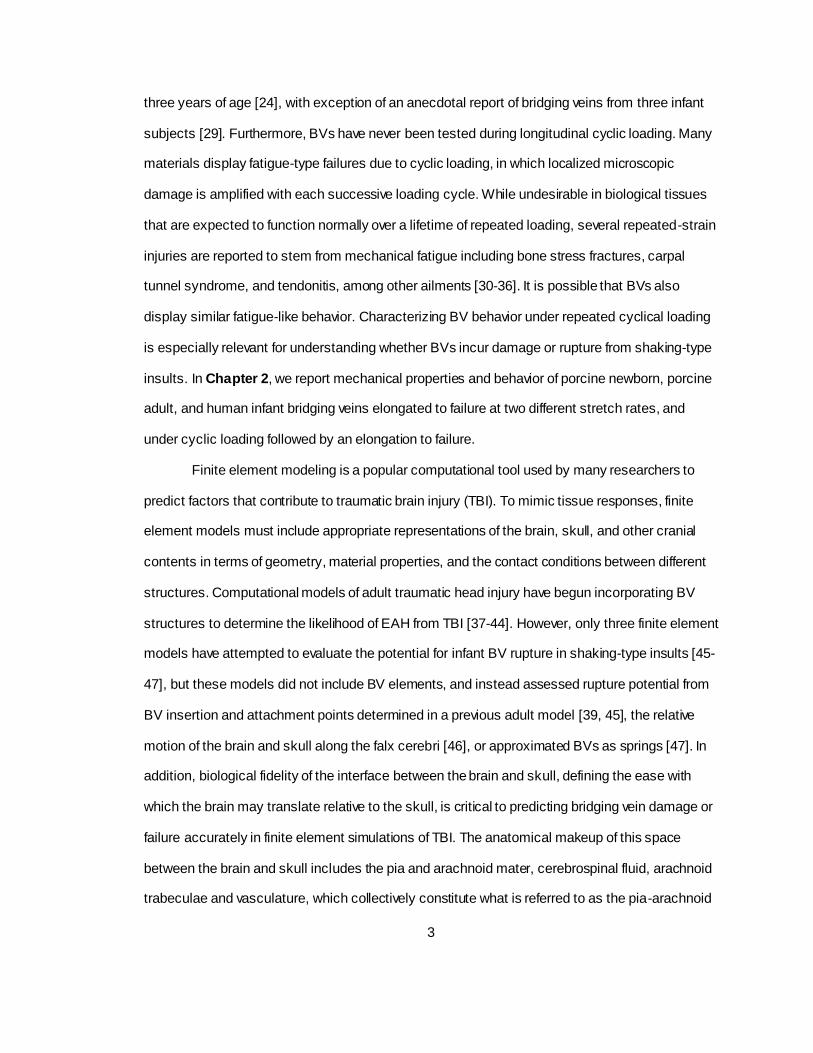
subjects [29]. Furthermore, BVs have never been tested during longitudinal cyclic loading. Many
materials display fatigue-type failures due to cyclic loading, in which localized microscopic
damage is amplified with each successive loading cycle. While undesirable in biological tissues
that are expected to function normally over a lifetime of repeated loading, several repeated-strain
injuries are reported to stem from mechanical fatigue including bone stress fractures, carpal
tunnel syndrome, and tendonitis, among other ailments [30-36]. It is possible that BVs also
display similar fatigue-like behavior. Characterizing BV behavior under repeated cyclical loading
is especially relevant for understanding whether BVs incur damage or rupture from shaking-type
insults. In Chapter 2, we report mechanical properties and behavior of porcine newborn, porcine
adult, and human infant bridging veins elongated to failure at two different stretch rates, and
under cyclic loading followed by an elongation to failure.
Finite element modeling is a popular computational tool used by many researchers to
predict factors that contribute to traumatic brain injury (TBI). To mimic tissue responses, finite
element models must include appropriate representations of the brain, skull, and other cranial
contents in terms of geometry, material properties, and the contact conditions between different
structures. Computational models of adult traumatic head injury have begun incorporating BV
structures to determine the likelihood of EAH from TBI [37-44]. However, only three finite element
models have attempted to evaluate the potential for infant BV rupture in shaking-type insults [45-
47], but these models did not include BV elements, and instead assessed rupture potential from
BV insertion and attachment points determined in a previous adult model [39, 45], the relative
motion of the brain and skull along the falx cerebri [46], or approximated BVs as springs [47]. In
addition, biological fidelity of the interface between the brain and skull, defining the ease with
which the brain may translate relative to the skull, is critical to predicting bridging vein damage or
failure accurately in finite element simulations of TBI. The anatomical makeup of this space
between the brain and skull includes the pia and arachnoid mater, cerebrospinal fluid, arachnoid
trabeculae and vasculature, which collectively constitute what is referred to as the pia-arachnoid

4
complex (PAC). While sophisticated models usually represent the PAC boundary condition using
solid or fluid elements, the effects of the chosen boundary conditions often have not been
validated against geometric, material property, or other experimental data. Recently, Coats et al
[48] optimized a representation of this brain-skull boundary condition against the relative
displacement of the brain and skull observed in axial plane rotational motion of an axially
transected piglet head [49]. While Coats et al found both linear elastic connectors and solid
isotropic elements between the brain and the skull provided good correlation of finite element
model brain-skull displacement with those observed in the physical transections, linear elastic
connectors resulted in better predictive capabilities for extra-axial hemorrhage [48]. While a few
microscale models have begun to address the individual and combined components of the PAC
[38, 50, 51], only one study has validated hemorrhage predictions by a full head finite element
model using PAC representative elements, but the model response was not validated against in
situ brain-skull displacements [50]. In Chapter 3, we measure porcine infant sagittal plane brain-
skull displacements at low level rotational velocities using head transection methods similar to
Ibrahim et al and Sullivan et al [49, 52], and determine an appropriate representation of this
boundary in a sagittal-transection configuration of our previously published porcine infant finite
element model [48] including bridging vein elements and properties determined in Chapter 2.
In Chapter 4, to identify the relationship between BV failure and EAH, we combine our
porcine bridging vein mechanical properties and behavior from Chapter 2, sagittal plane brain-
skull finite element model boundary condition determined in Chapter 3, and previously published
newborn piglet head rotation studies [52-54]. We simulated the animal experiments in our whole
head newborn porcine finite element model [48], and correlated findings of bridging vein failure
with the presence of EAH in experimental pathology. From this, we were able to determine a
threshold value for the number of failed bridging vein elements associated with detectable EAH.
In Chapter 5, to predict if vigorous shaking without impact can cause EAH, we modify a
finite element model of the human infant head previously developed in our lab [55, 56] to include
bridging vein elements with properties found in Chapter 2 for human infant vessels, and the

5
sagittal plane brain-skull boundary condition determined from newborn porcine transection
studies in Chapter 3. Utilizing an instrumented 1.5 month old human infant anthropomorphic
surrogate previously developed in our lab [16] with biofidelic neck improvements [57], we
measured head kinematics associated with vigorous shaking without impact. These shaking
episodes were then simulated in the human infant finite element model to estimate if the angular
velocities and accelerations associated with shaking an infant may cause bridging vein failure.
This study reveals important insight into the likelihood of EAH as a presenting injury associated
with abusive shaking without impact.
Finally, in Chapter 6, the major findings of this dissertation are summarized, the
limitations are addressed, and suggestions are given for future studies to aid in understanding
and identifying injury scenarios in infants that may produce bridging vein rupture and subsequent
EAH, with consideration towards objectively informing the biomechanical engineering science that
is critical to accurate clinical differential diagnoses of abusive head trauma.
References
1. Faul, M., Xu, L., Wald, M., and Coronado, V., Traumatic Brain Injury in the United States:
Emergency Department Visits, Hospitalizations and Deaths 2002-2006., 2010, Centers
for Disease Control and Prevention, National Center for Injury Prevention and Control:
Atlanta, GA.
2. Duhaime, A.C., Alario, A.J., Lewander, W.J., Schut, L., Sutton, L.N., Seidl, T.S.,
Nudelman, S., Budenz, D., Hertle, R., Tsiaras, W., and et al., Head injury in very young
children: mechanisms, injury types, and ophthalmologic findings in 100 hospitalized
patients younger than 2 years of age. Pediatrics, 1992. 90(2 Pt 1): p. 179-85.
3. Billmire, M. and Myers, P., Serious head injury in infants: accident or abuse? Pediatrics,
1985. 75(2): p. 340-2.
4. Ewing-Cobbs, L., Kramer, L., Prasad, M., Canales, D.N., Louis, P.T., Fletcher, J.M.,
Vollero, H., Landry, S.H., and Cheung, K., Neuroimaging, physical, and developmental

6
findings after inflicted and noninflicted traumatic brain injury in young children. Pediatrics,
1998. 102(2 Pt 1): p. 300-7.
5. Gilles, E.E. and Nelson, M.D., Jr., Cerebral complications of nonaccidental head injury in
childhood. Pediatr Neurol, 1998. 19(2): p. 119-28.
6. Coats, B. and Margulies, S.S., Material properties of human infant skull and suture at
high rates. Journal of Neurotrauma, 2006. 23(8): p. 1222-32.
7. Prange, M.T. and Margulies, S.S., Regional, directional, and age-dependent properties of
the brain undergoing large deformation. J Biomech Eng, 2002. 124(2): p. 244-52.
8. Coats, B. and Margulies, S.S. Characterization of pediatric porcine skull properties during
impact. in Int Conf of Biomech of Impacts. 2003.
9. Thibault, K.L. and Margulies, S.S., Age-dependent material properties of the porcine
cerebrum: effect on pediatric inertial head injury criteria. Journal of Biomechanics, 1998.
31(12): p. 1119-26.
10. Margulies, S.S. and Thibault, K.L., Infant skull and suture properties: measurements and
implications for mechanisms of pediatric brain injury. J Biomech Eng, 2000. 122(4): p.
364-71.
11. Gefen, A., Gefen, N., Zhu, Q., Raghupathi, R., and Margulies, S.S., Age-dependent
changes in material properties of the brain and braincase of the rat. Journal of
Neurotrauma, 2003. 20(11): p. 1163-77.
12. Prange, M.T., Coats, B., Duhaime, A.C., and Margulies, S.S., Anthropomorphic
simulations of falls, shakes, and inflicted impacts in infants. J Neurosurg, 2003. 99(1): p.
143-50.
13. Ibrahim, N.G. and Margulies, S.S., Biomechanics of the toddler head during low-height
falls: an anthropomorphic dummy analysis. J Neurosurg Pediatr. 6(1): p. 57-68.
14. Ibrahim, N.G., Wood, J., Margulies, S.S., and Christian, C.W., Influence of age and fall
type on head injuries in infants and toddlers. Int J Dev Neurosci, 2011.

7
15. Ibrahim, N.G., Ralston, J., Smith, C., and Margulies, S.S., Physiological and pathological
responses to head rotations in toddler piglets. Journal of Neurotrauma, 2010. 27(6): p.
1021-35.
16. Coats, B. and Margulies, S.S., Potential for head injuries in infants from low-height falls. J
Neurosurg Pediatr, 2008. 2(5): p. 321-30.
17. Ommaya, A.K. and Gennarelli, T.A., Cerebral concussion and traumatic
unconsciousness. Correlation of experimental and clinical observations of blunt head
injuries. Brain, 1974. 97(4): p. 633-54.
18. Rorke-Adams, L.B., The triad of retinal haemorrhage, subdural haemorrhage and
encephalopathy in an infant unassociated with evidence of physical injury is not the result
of shak ing, but is most likely to have been caused by a natural disease: No. J Prim
Health Care, 2011. 3(2): p. 161-3.
19. Squier, W., The triad of retinal haemorrhage, subdural haemorrhage and encephalopathy
in an infant unassociated with evidence of physical injury is not the result of shaking, but
is most likely to have been caused by a natural disease: Yes. J Prim Health Care, 2011.
3(2): p. 159-61.
20. Duhaime, A.C., Christian, C.W., Rorke, L.B., and Zimmerman, R.A., Nonaccidental head
injury in infants--the "shaken-baby syndrome". N Engl J Med, 1998. 338(25): p. 1822-9.
21. Nadarasa, J., Deck, C., Meyer, F., Willinger, R., and Raul, J.S., Update on injury
mechanisms in abusive head trauma--shaken baby syndrome. Pediatr Radiol, 2014. 44
Suppl 4: p. S565-70.
22. Jaspan, T., Current controversies in the interpretation of non-accidental head injury.
Pediatr Radiol, 2008. 38 Suppl 3: p. S378-87.
23. Monson, K.L., Goldsmith, W., Barbaro, N.M., and Manley, G.T., Significance of source
and size in the mechanical response of human cerebral blood vessels. Journal of
Biomechanics, 2005. 38(4): p. 737-44.

8
24. Meaney, D.F., Biomechanics of Acute Subdural Hematoma in the Subhuman Primate
and Man, in Bioengineering1991, University of Pennsylvania: Philadelphia.
25. Delye, H., Goffin, J., Verschueren, P., Vander Sloten, J., Van der Perre, G., Aleaerts, H.,
Verpoest, I., and Berckmans, D., Biomechanical properties of the superior sagittal sinus-
bridging vein complex. Stapp Car Crash Journal, 2006. 50: p. 625-636.
26. Lee, M. and Haut, R., Insensitivity of tensile failure properties of human bridging veins to
strain rate: implications in biomechanics of subdural hematoma. J Biomech, 1989. 22: p.
537-542.
27. Lowenhielm, P., Dynamic properties of the parasagittal bridging veins. Z Rechtsmed,
1974. 74: p. 55-62.
28. Monea, A.G., Baeck, K., Verbeken, E., Verpoest, I., Sloten, J.V., Goffin, J., and
Depreitere, B., The biomechanical behaviour of the bridging vein-superior sagittal sinus
complex with implications for the mechanopathology of acute subdural haematoma. J
Mech Behav Biomed Mater, 2014. 32: p. 155-65.
29. Morison, C.N., The Dynamics of Shaken Baby Syndrome, in Manufacturing and
Mechanical Engineering2002, University of Birmingham: Birmingham, UK.
30. Yassi, A., Repetitive strain injuries. Lancet, 1997. 349(9056): p. 943-7.
31. Warden, S.J., Burr, D.B., and Brukner, P.D., Stress fractures: pathophysiology,
epidemiology, and risk factors. Curr Osteoporos Rep, 2006. 4(3): p. 103-9.
32. Martin, R.B., Fatigue microdamage as an essential element of bone mechanics and
biology. Calcif Tissue Int, 2003. 73(2): p. 101-7.
33. Bennell, K.L., Malcolm, S.A., Wark, J.D., and Brukner, P.D., Models for the pathogenesis
of stress fractures in athletes. Br J Sports Med, 1996. 30(3): p. 200-4.
34. Chapurlat, R.D. and Delmas, P.D., Bone microdamage: a clinical perspective.
Osteoporos Int, 2009. 20(8): p. 1299-308.
35. Eisele, S.A. and Sammarco, G.J., Fatigue fractures of the foot and ankle in the athlete. J
Bone Joint Surg Am, 1993. 75(2): p. 290-8.

9
36. Jones, G.L., Upper extremity stress fractures. Clinics in sports medicine, 2006. 25(1): p.
159-74, xi.
37. Huang, H., Lee, M., Chiu, W., Chen, C., and Lee, S., Three-dimensional finite element
analysis of subdural hematoma. Journal of Trauma-Injury Infection & Critical Care, 1999.
47(3): p. 538-544.
38. Zoghi-Moghadam, M. and Sadegh, A.M., Global/local head models to analyse cerebral
blood vessel rupture leading to ASDH and SAH. Comput Methods Biomech Biomed
Engin, 2009. 12(1): p. 1-12.
39. Kleiven, S., Influence of impact direction on the human head in prediction of subdural
hematoma. Journal of Neurotrauma, 2003. 20: p. 365-379.
40. Zhou, C., Khalil, T., and King, A. A new model comparing impact responses of the
homogeneous and inhomogeneous human brain. in 39th Stapp Car Crash Conference.
1995. San Diego, California.
41. Zhang, L., Bae, J., Hardy, W., Monson, K., Manley, G., Goldsmith, W., Yang, K., and
King, A., Computational study of the contribution of the vasculature on the dynamic
response of the brain. Stapp Car Crash Journal, 2002. 46: p. 145-163.
42. Raul, J.S., Deck, C., Willinger, R., and Ludes, B., Finite-element models of the human
head and their applications in forensic practice. Int J Legal Med, 2008. 122(5): p. 359-66.
43. Mao, H., Zhang, L., Jiang, B., Genthikatti, V.V., Jin, X., Zhu, F., Makwana, R., Gill, A.,
Jandir, G., Singh, A., and Yang, K.H., Development of a finite element human head
model partially validated with thirty five experimental cases. J Biomech Eng, 2013.
135(11): p. 111002.
44. Giordano, C. and Kleiven, S., Evaluation of Axonal Strain as a Predictor for Mild
Traumatic Brain Injuries Using Finite Element Modeling. Stapp Car Crash J, 2014. 58: p.
29-61.
45. Couper, Z. and Albermani, F., Mechanical response of infant brain to manually inflicted
shak ing. Proc Inst Mech Eng H. 224(1): p. 1-15.

10
46. Raul, J.S., Roth, S., Ludes, B., and Willinger, R., Influence of the benign enlargement of
the subarachnoid space on the bridging veins strain during a shaking event: a finite
element study. Int J Legal Med, 2008. 122(4): p. 337-40.
47. Roth, S., Raul, J.S., Ludes, B., and Willinger, R., Finite element analysis of impact and
shak ing inflicted to a child. Int J Legal Med, 2007. 121(3): p. 223-8.
48. Coats, B., Eucker, S.A., Sullivan, S., and Margulies, S.S., Finite element model
predictions of intracranial hemorrhage from non-impact, rapid head rotations in the piglet.
Int J Dev Neurosci, 2012. 30(3): p. 191-200.
49. Ibrahim, N.G., Natesh, R., Szczesny, S.E., Ryall, K., Eucker, S.A., Coats, B., and
Margulies, S.S., In situ deformations in the immature brain during rapid rotations. J
Biomech Eng. 132(4): p. 044501.
50. Scott, G.G., Margulies, S.S., and Coats, B., Utilizing multiple scale models to improve
predictions of extra-axial hemorrhage in the immature piglet. Biomech Model
Mechanobiol, 2015.
51. Ma, C., Jin, X., Zhang, J., and Huang, S., Development of the Pia-Arachnoid Complex
Finite Element Model. 2008 2nd International Conference on Bioinformatics and
Biomedical Engineering, 2008: p. 1717 - 1720.
52. Sullivan, S., Eucker, S.A., Gabrieli, D., Bradfield, C., Coats, B., Maltese, M.R., Lee, J.,
Smith, C., and Margulies, S.S., White matter tract-oriented deformation predicts traumatic
axonal brain injury and reveals rotational direction-specific vulnerabilities. Biomech Model
Mechanobiol, 2015. 14(4): p. 877-96.
53. Eucker, S.A., Smith, C., Ralston, J., Friess, S.H., and Margulies, S.S., Physiological and
histopathological responses following closed rotational head injury depend on direction of
head motion. Exp Neurol, 2011. 227(1): p. 79-88.
54. Coats, B., Binenbaum, G., Smith, C., Peiffer, R.L., Christian, C.W., Duhaime, A.C., and
Margulies, S.S., Cyclic Head Rotations Produce Modest Brain Injury in Infant Piglets.
Journal of Neurotrauma, 2016.

11
55. Coats, B., Margulies, S.S., and Ji, S., Parametric study of head impact in the infant.
Stapp Car Crash J, 2007. 51: p. 1-15.
56. Coats, B., Mechanics of head impact in infants, in Bioengineering2007, University of
Pennsylvania: Philadelphia, PA.
57. Sullivan, S., Coats, B., and Margulies, S.S., Biofidelic neck influences head kinematics of
parietal and occipital impacts following short falls in infants. Accid Anal Prev, 2015. 82: p.
143-53.

12
CHAPTER 2: MECHANICAL PROPERTIES OF INFANT HUMAN AND NEWBORN
PORCINE PARASAGITTAL BRIDGING VEINS
Abstract
In distinguishing between accidental and abusive traumatic brain injuries (TBIs) in
children, extra-axial hemorrhage (EAH, including both subdural and subarachnoid bleeds) is often
considered a critical presenting feature. Tearing of the parasagittal bridging veins (BVs) is thought
to be one source of EAH associated with TBI. However, there is a dearth of pediatric bridging
vein mechanical property data, preventing accurate biomechanical predictions of EAH in
accidental and abusive scenarios. Porcine adult, porcine infant, and human infant BVs were
subjected to either a low rate pull to failure, a high rate pull to failure, or 30 seconds of cyclic
loading followed by a pull to failure. We find that human infant BVs are stronger than porcine BVs,
and that BV mechanical properties are rate dependent, but not age dependent. Successive cyclic
loading to a uniform level of stretch softened BVs with decaying peak stresses. Importantly, BVs
that had been cyclically loaded displayed a shifted stress-stretch behavior. These data will inform
future computational modeling efforts to enhance understanding of injury scenarios causing
bridging vein failure. Clarifying the role of BV failure in the realm of TBI will significantly impact the
public health, clinical, and legal aspects associated with improving the welfare of young children.
Introduction
Traumatic brain injury (TBI) is a leading cause of death and disability in children aged 0
to 4 years in the United States with over 250,000 emergency department visits (the highest of any
age group), over 15,000 hospitalizations, and nearly 1,000 deaths annually [1]. Extra-axial
hemorrhage (EAH), a collection of blood between the brain and skull (including both subdural and
subarachnoid hemorrhage), is one presentation of TBI. While incompletely understood, one
etiology of EAH is thought to be the rupture or tearing of the parasagittal bridging veins (BVs)
which drain blood from the brain into the superior sagittal sinus. Tearing of BVs may be caused
13
by rapid head motions in which the movement of the brain lags that of the skull, stretching the
veins at increased rates of deformation to supraphysiological displacements at their attachment
points or within the subdural space.
EAH is currently an important presenting finding used to distinguish between accidental
and abusive injury etiologies in young children [2, 3]. TBI in infants and toddlers is frequently due
to abusive head trauma (AHT) [4], and these cases often have poor outcomes [5, 6]. It follows
that whether BV rupture and subsequent EAH may be produced from vigorous shaking alone (no
impact) is subject to significant debate [7-11]. Axial mechanical properties and behavior of BVs
have been examined previously in the human adult [12-17] with conflicting reports on whether
properties depend on stretch rate. Although previous studies have identified age-dependent
properties of brain, skull, and suture [18-25], to date no testing has been performed on BV
specimens from subjects under three years of age [12] with exception of a limited study of
samples from three infant subjects [26]. Thus it is important to elucidate whether BVs also exhibit
age-dependent properties and/or behavior.
Many engineering materials exhibit fatigue, or changes in stiffness and strength after
being exposed to repeated sub-catastrophic deformations. Fatigue is undesirable in biological
tissues that are expected to function normally during a lifetime exposure of repeated deformations
(e.g. cardiac tissue, pulmonary epithelium). In fact, fatigue has been a proposed mechanism for
some repeated-exposure injuries, like bone stress fractures [27-33] and a variety of other
repeated strain injuries including musculoskeletal disorders (e.g. tendonitis, osteoarthritis,
bursitis), peripheral-nerve entrapment (e.g. carpal tunnel syndrome) and vascular syndromes
(e.g. Raynaud’s syndrome) [34]. In vigorous shaking associated with AHT and in recurring head
impacts in sports, BVs are believed to experience repeated elongations, but their behavior has
never been evaluated under cyclic or repeated loading.
In this study, we measure the axial mechanical properties and behavior of parasagittal
bridging veins in three subject types: porcine newborn, porcine adult, and human infant. Subjects
were evaluated under three loading protocols: high and low stretch rates to failure, and cyclic

14
loading followed by elongation to failure. These data are analyzed for age, species, rate, and
cyclic loading contributions to the elastic modulus, yield, and failure properties of bridging veins,
establishing the foundation for future computational studies of accidental and abusive TBI in
youth.
Methods
Test Apparatus
A custom device coupling a rotary motor to a gear chain drive described previously [35]
was used to perform elongation tests. Briefly, a computer-controlled closed loop stepper motor
(Vexta #AS46AAP, Oriental motor, Braintree, MA) was used to rotate threaded shafts coupled to
a gear-chain system to move a plate up and down in a linear fashion. The bottom grip was
attached to the moving plate, while the top grip was attached to a 250g capacity load cell (Model
31 with shock and vibration resistance option, Honeywell-Sensotec, Columbus, OH). The load
cell was fastened to a lab jack mounted on the ceiling of a cage surrounding the entire device
which allowed for gage length adjustment of the specimen. A laser displacement sensor (LC
1607-50, Micro-Epsilon, Ortenburg, Germany) measured the global elongation of the vessel by
tracking the position of the translating plate. The lab jack was adjusted until the BV specimen was
taut and the load cell just began to register a load. Bridging veins were gripped by flat plate-type
grips similar to previous investigations [13-17, 26] as cannulation and fluid perfusion were overly
cumbersome and risked pre-test damage to the delicate BVs. Hyperterminal scripts for low rate,
high rate, and cyclic elongation provided appropriate rate and frequency inputs to the motor driver
(Vexta #ASD13A-AP, Oriental motor, Braintree, MA).
Specimen Preparation
All pig euthanasia and procurement procedures were approved by the University of
Pennsylvania and Children’s Hospital of Philadelphia Institutional Animal Care and Use
Committees. Parasagittal bridging veins were harvested from newborn (≤1 week old, n=9) and

15
adult (≥2 month old, n=12) farm pigs immediately after sacrifice by removing an intact brain-
meninges-skull section from the cranium en bloc. Brain tissue was cautiously dissected away
from the dura/superior sagittal sinus-skull complex to expose the bridging veins, which were cut
from their brain connection point using surgical scissors. Next, the dura was peeled from the
skull, and finally, bridging veins were cut at their point of attachment to the dura/superior sagittal
sinus.
Human infant sample procurement and testing procedures were approved by the
Children’s Hospital of Philadelphia and University of Pennsylvania Institutional Review Boards.
Human infant parasagittal bridging veins were procured at autopsy by a pathologist within 24
hours of death. Care was taken to minimize distortion of the veins during excision. Human subject
inclusion criteria were an age of 0-12 months and autopsy performed less than 24 hours after
death, without bias to race, gender, ethnicity, or socio-economic status. Exclusion criteria were
history of head trauma, HIV, or hepatitis.
After excision, bridging vein samples were placed in serial dilutions of 2.5, 5, and 7.5%
dimethyl sulfoxide (DMSO) in Dulbecco’s Modified Eagle Media (DMEM) for ten minutes each,
followed by a final concentration of 10% DMSO-90% DMEM for 20 minutes prior to freezing in
Eppendorf tubes at -80°C. Samples remained frozen until testing at a later date. Previous studies
have shown that cryopreservation does not significantly alter the material properties of blood
vessels [36-42]. In a preliminary study of n=10 immature porcine saphenous veins using our
cryopreservation method, we confirmed that there was no significant difference between the
moduli of fresh and frozen vessels (Appendix A).
On the day of testing, samples were removed from -80°C storage and thawed at room
temperature until the medium melted, then rinsed of DMSO by placement in serial dilutions of 7.5,
5, 2.5, and 0% DMSO in DMEM for ten minutes each. After rinsing, specimens were placed in
fresh DMEM prior to testing.

16
Test Protocol
Bridging veins were first secured in the top grip, which was then attached to the test
apparatus. The lab jack was lowered until the opposite end of the bridging vein could be secured
in the bottom grip. Once the bridging vein sample was fully fastened, the lab jack was adjusted
until the specimen was taut and the load cell just began to register a load. Specimen gage length
was measured from grip to grip with calipers and five cycles of preconditioning to a stretch ratio of
1.05 were performed. Then the lab jack was readjusted until a load signal was registered once
again and the test gage length was measured from grip to grip with calipers. The specimen was
tested immediately after the appropriate adjustments were made to match experimental
parameters between tests in the Hyperterminal loading protocols. Specimens were continuously
hydrated with DMEM via a transfer pipette up until the elongation test.
One bridging vein specimen from each porcine and human subject was used per loading
protocol. Three different test protocols were conducted: high rate pulls to failure (averaging
13.91±2.84 s-1), low rate pulls to failure (averaging 1.36±0.26 s-1), and cyclic loading followed by a
pull to failure (averaging 2.56±0.32 s-1). Based on preliminary porcine ultimate stretch ratios, the
cyclic loading protocol was conducted at near-failure peak stretch ratios of 1.188±0.005 (Figure
2.1). A cycling frequency of 3Hz was chosen to match that of simulated abusive trauma via
vigorous shaking of an anthropomorphic surrogate representative of a 1 month old human infant
[43, 44], while a cycling duration of 30 seconds (~90 cycles) was chosen as a hypothetical
extreme (Figure 2.1). Load and displacement values were sampled at 10 kHz for high rate tests
and 1 kHz for low rate and cyclic tests, and recorded on a computer.

17
Figure 2.1 Stretch vs time and stress vs time plots of a typical cyclic loading protocol followed by post-cyclic failure test. Cyclic loading peak stretch ratios are highly repeatable between cycles. Peak stresses decay exponentially with continued cycling.
Cross-sectional area of each specimen was obtained post-test using optical methods.
Each specimen fragment was placed on a microscope slide and covered with coverglass.
Bridging vein fragments were imaged at 10x magnification (TCS SP5 MP, Leica Microsystems,
Wetzlar, Germany), and image slices were taken every 1µm from slide to coverglass (Figure 2.2).
Specimen thickness was determined by multiplying the number of slices containing the bridging
vein specimen by the 1µm step resolution. Using a projection of all slices, bridging vein width was
measured at two points along the length of the specimen contained in each frame. Most often, a
bridging vein fragment was too long to fit in a single frame. As such this protocol was repeated
from end to end of each fragment. Each measurement (thickness, width) was averaged across all
frames and both fragments of a specimen. The circumference was defined as twice the specimen
width and wall thickness was half of the measured specimen thickness. From the average

18
measurements of wall thickness (h) and circumference (C), cross-sectional area (A) was
approximated as that of a hollow cylinder as follows:
𝑟𝑜 =𝐶
2𝜋 [1]
𝑟𝑖 = 𝑟𝑜 − ℎ [2]
𝐴 = 𝜋(𝑟𝑜2 − 𝑟𝑖
2) [3]
where ro is the outer radius and ri is the inner radius.
Figure 2.2 Diagram of vessel microscopy setup for dimension measurements
Data Analysis
Cyclic Loading Analysis
To obtain appropriate cutoff frequencies for low pass filtering, the power spectral
densities of the raw load and displacement signals were compared across all subjects and the
highest cutoff frequency was defined as the cutoff for a given test type. Cyclic raw load and
displacement signals were low-pass filtered (second order Butterworth) at 10 Hz. Stretch ratio
and stress were then calculated from the displacement and load traces, as follows:
𝜆(𝑡) =𝑙(𝑡)
𝑙0
[4]

19
𝜎(𝑡) =𝐹(𝑡)
𝐴 [5]
where λ is stretch ratio, t is time, l is the instantaneous length of the specimen, l0 is the gage
length, σ is stress, F is instantaneous load, and A is cross-sectional area as defined in Eq. 3.
The decay of peak stress with successive cycles was fit to a mono-exponential
relationship for each sample using the following equation:
𝜎𝑝𝑒𝑎𝑘 = 𝑎𝑒−𝑏∗𝑛 + 𝑐 [6]
where σpeak is the peak stress, n is cycle number, and a, b, and c are constant coefficients.
Parameter optimization was performed using a custom Matlab program. A nonlinear least-
squares formulation was used to fit the data to Equation 6 (above) by implementing the
Levenberg-Marquardt algorithm to determine convergence of coefficients a, b and c. A series of
fits with initial values of a, b, and c ranging from 0 to 1 in increments of 0.05 was performed, and
a combination of initial values which minimized the sum of squared errors was chosen for the final
fit. Average values for a, b, and c were calculated within each subject group, as well as across all
subjects. “Instantaneous” peak stress, σpeak,0 (a + c in Equation 6), and steady state peak stress,
σpeak,SS (c in Equation 6) were determined for each fit. Differences between σpeak,0 and σpeak,SS
across subject types (newborn porcine, adult porcine, and infant human) were evaluated by
repeated measures ANOVA and post hoc Tukey-Kramer analyses with significance defined as p
≤ 0.05.
Failure Analysis
For each failure test type (high rate, low rate, or post-cyclic), the power spectral densities
of the raw load and displacement signals were compared across all subjects and the highest
cutoff frequency was chosen as the cutoff for a given test type, similar to cyclic loading analysis.
Raw load signals were low-pass filtered (second order Butterworth) at 150Hz for high rate tests
and 35Hz for both low rate and post-cyclic tests. Raw displacement signals were filtered at 60Hz
for high rate tests and 20Hz for both low rate and post-cyclic tests.

20
Stretch ratio and stress were calculated in the same manner as cyclic loading tests, using
Equations 4 and 5. Traces were then cropped from the point where stretch ratio began
monotonically increasing above 1 to the point of maximum stress. Stretch rate was defined as the
slope of the stretch-time relationship. Ultimate stress (σu) and ultimate stretch (λu) were defined at
the point of peak stress.
Most previous studies investigating parasagittal bridging veins only reported ultimate
failure properties [12, 14, 16, 26], but recent work has also measured modulus and yield
properties [13, 15, 17]. Often, yield is defined at the point of maximum modulus along the stress-
stretch ratio or stress-strain curve [13, 15, 17, 45]. The maximum modulus has been identified as
elastic modulus [13], or the elastic modulus at yield [15, 45], but it is unclear whether reported
values were calculated over a region of the stress-stretch/strain curve or derived from a single
point. Elastic modulus has also been reported over the most linear region of the stress-strain
curve [17], but again, determination of the end-points of the linear region remains ambiguous.
Thus, we sought to provide a well-defined method for determining the yield point and linear region
of the stress-stretch curve, with guidance from previous investigations. A multi-step protocol was
employed. First, to ensure the selection of a linear region after the “toe” region and before plastic
deformation, the point of peak modulus occurring above a stretch ratio of 1.075 and before which
instantaneous modulus did not fall below -10MPa was identified. This negative modulus cut-off
was used to systematically analyze a load trace that was not always monotonically increasing
(Figure 2.4, human low rate, representative example), as large transient negative moduli may be
indicative of failure of individual fibers or other components of the vessel wall [13, 17]. A linear
regression was fit to the point of peak modulus and the four points immediately preceding it. This
linear fit was then applied to the entire length of the stress-stretch ratio curve, and the magnitude
of the residuals (or absolute value of the difference) between the measured stress values and the
linear fit were extracted. The linear region was defined as the segment, including the point of
peak modulus, where residual magnitudes remained within 0.05 MPa. The last point in the linear
region, or proportional limit, was defined as the yield point from which yield stress (σy) and yield

21
stretch (λy) were extracted. A second linear regression was performed, this time over the defined
linear region, and the elastic modulus (E) was defined as the slope of this fit.
Yield stress, yield stretch, elastic modulus, ultimate stress, and ultimate stretch were
compared between failure test type (high rate, low rate, and post-cyclic), subject type (newborn
porcine, adult porcine, and infant human), and their interactions using a series of two-way
ANOVAs with statistical significance defined for p<0.05. When statistical significance was
detected, post-hoc Tukey-Kramer analyses were conducted to determine group-wise differences.
Results
Cyclic Loading
Qualitatively similar to previous blood vessel mechanical property studies, the stress-
stretch behavior of the bridging veins was nonlinear (Figure 2.3, inset, representative human
infant and newborn porcine curves), with the vessel displaying stiffer behavior at higher stretches.
In all cases, peak stress decayed exponentially (Eq. 6, Table 2.1, Figures 2.1 and 2.3), with
coefficients of determination (R2) averaging 0.913, and never less than 0.791. Instantaneous
peak stresses (σpeak,0) were significantly higher than steady state peak stresses (σpeak,SS, Table
2.2). There was no significant variation in either instantaneous or steady state peak stress with
subject type nor an interaction effect between subject type (porcine newborn, porcine adult, and
human infant) and time point (instantaneous and steady state). All bridging vein cyclic loading
stress-stretch and peak stress decay plots are presented in Appendix B.
Table 2.1 Average exponential decay equation coefficients (Eq. 6) and coefficients of determination (R2) within subject types and across all subjects.
Subject Type a b c R2
Porcine Newborn (n=9) 2.759±4.708 0.326±0.596 0.822±0.829 0.906±0.044
Porcine Adult (n=12) 0.880±0.341 0.087±0.031 0.898±0.371 0.918±0.032 Human Infant (n=7) 1.148±0.820 0.106±0.040 1.110±1.145 0.894±0.055
Overall (n=28) 1.551±2.737 0.189±0.397 0.866±0.593 0.913±0.037

22
Figure 2.3 Representative human infant and porcine newborn curves showing the exponential decay of peak stresses with continued cycling. Peak stress points are blue dots and exponential curve fits (Eq. 6) are indicated by solid red lines. Representative human infant and porcine newborn cyclic stress vs stretch curves are inset showing cyclic loading and post-cyclic failure curves. Note that the y-axis limit of the inset stress vs stretch curves differ between human and porcine subjects. While human and porcine cyclic loading was conducted to the same level of peak stretch, because human failure stretches occurred at significantly higher values than porcine, human specimens experienced cyclic loads further from their failure limit than porcine tests.
Table 2.2 Average instantaneous peak stress (σpeak,0) and steady state peak stress (σpeak,SS) within subject types and across all subjects. No differences were observed between subject types, but instantaneous peak stresses were significantly higher than steady state peak stresses, indicated by bracketed letters, alphabetized from low to high values.
Failure Tests
As expected, during failure tests (low rate, high rate, post-cyclic) up to the yield point, we
observed nonlinear stress-stretch curves with stiffer behavior as stretch increases, similar to the
nondestructive cyclic tests (Figure 2.4, representative human infant and newborn porcine curves).
BV behavior was not dependent on age, but did differ with species. Specifically, for all of
the outcome metrics (λy, σy, E, λu, and σu), there were no differences between porcine newborn
and porcine adult bridging veins, but human infant bridging vein values were always significantly
Subject Type σpeak,0 (MPa) σpeak,SS (MPa) Porcine Newborn (n=9) 3.581±4.705 0.822±0.829 Porcine Adult (n=12) 1.778±0.678 0.898±0.371 Human Infant (n=7) 2.258±1.786 1.110±1.145
Overall (n=28) 2.248±2.845 [B] 0.927±0.751 [A]

23
higher than porcine tissue for all metrics except elastic modulus, where they were
indistinguishable. Human infant stretch rates were also slightly higher than porcine newborn
rates, while porcine adult rates were indistinguishable from both human infant and porcine
newborn. The custom device did not provide an instantaneous constant stretch rate, taking a
fraction of the total test time to ramp up to final speed, and rates were benchmarked from
expected failure stretch of porcine tissue. Because the ultimate stretch of human infant bridging
veins was higher than porcine tissue, this resulted in modestly, but significantly, higher stretch
rates in human infant bridging vein failure testing than in porcine newborn tests (Table 2.3).
Though statistically significant, this stretch rate difference was small compared to those between
low rate, high rate and post-cyclic failure loading protocol rates, and no interaction effect between
failure loading protocol and subject type was found. Thus the differences in stretch rate between
subject types are unlikely to explain the finding that human infant BV behavior differed
significantly from porcine tissue.
BV behavior changed significantly between test types (low rate, high rate, post-cyclic) for
both human and porcine tissues. As planned, stretch rates prescribed to high, low, and post-
cyclic failure pulls differed significantly, with �̇�high > �̇�post-cyclic > �̇�low (Table 2.3), though �̇�high was
much higher than both �̇�post-cyclic and �̇�low which were of the same order of magnitude. Significant
differences were detected between test types for λy, σy, E, and σu, as might be expected for
viscoelastic materials that demonstrate fatigue-like behavior, but, interestingly, not for λu (Table
2.4). Specifically, yield stretches were greater in post-cyclic failure pulls than in low and high rate
tests, which were indistinguishable from one another (Figure 2.4, black ‘x’ indicates yield point).
Yield stress and ultimate stress were higher in high rate tests than low rate and post-cyclic
(Figure 2.4, black ‘x’ indicates yield point, black circle indicates ultimate parameter point), which
were similar. Elastic modulus was larger in high rate tests than low rate tests, while post-cyclic
elastic modulus was not significantly different from both high and low rate (Figure 2.4, black line
indicates linear region over which E was calculated). In all cases, the shape of the stress-stretch
curve for post-cyclic failure pulls was also qualitatively different than those for high rate and low

24
rate tests, with a longer low-stress regime, often referred to as the “toe” region (Figure 2.4). All
bridging vein failure pull stress-stretch curves are presented in Appendix B. These findings
indicate that both rate and load-history affect BV behavior in both species.
Figure 2.4 Failure test stress vs stretch plots for representative human infant and porcine newborn subjects. Yield points are indicated by “x” and ultimate points are indicated by circles. Solid black lines indicate the determined linear region over which elastic modulus was calculated.
Table 2.3 Average stretch rates for low rate, high rate, and post-cyclic failure tests by subject type. Porcine newborn rates were significantly, though modestly, lower than human infant rates, while porcine adult rates were indistinguishable from both porcine newborn and human infant. High stretch rates were significantly higher than post-cyclic stretch rates, which in turn were significantly higher than low stretch rates. Significant differences are indicated by bracketed letters A-E. Values with A and B show differences between rate and subject type, and values with C, D, and E reveal differences between test-type and rate.
Subject Type �̇�low (s-1) �̇�high (s-1) �̇�post-cyclic (s-1)
Porcine Newborn (n=9) [A] 1.248±0.203 12.745±2.046 2.552±0.387 Porcine Adult (n=12) [AB] 1.257±0.126 13.825±2.659 2.453±0.154 Human Infant (n=7) [B] 1.677±0.242 15.692±3.446 2.747±0.384
Overall (n=28) 1.358±0.258 [C] 13.911±2.845 [E] 2.556±0.318 [D]

25
Tab
le 2
.4 A
vera
ge y
ield
str
etc
h (
λy), y
ield
str
ess
(σ
y),
ultim
ate
str
etc
h (λ u
), u
ltim
ate
stress
(σ
u),
and e
lastic
modulu
s (E
), a
cro
ss s
ubje
ct a
nd failu
re test
typ
es.
For all
metric
s e
xcept e
last
ic m
odulu
s, h
um
an in
fant valu
es
were
sig
nific
antly
hig
her th
an p
orc
ine. T
hese
diff
ere
nce
s are
indic
ate
d by b
racke
ted le
tters
A-B
, alp
habetiz
ed fro
m
low
est to
hig
hest valu
es. L
oad
-rela
ted m
etric
s (σ
y, σ
u, and E
) are
sig
nific
antly
hig
her in
hig
h rate
test
s th
an in
low
ra
te tests
. P
ost
-cyc
lic y
ield
and u
ltim
ate
stress
es
were
sim
ilar to
low
rate
test
s and s
ignifi
cantly
sm
alle
r th
an those
in
hig
h rate
tests
, w
hile
post-
cyc
lic e
last
ic m
oduli
were
indis
tinguis
hable
fro
m those
calc
ula
ted in
both
low
and h
igh
rate
tests
. U
ltim
ate
stretc
h d
id n
ot vary
with test
typ
e, b
ut yie
ld s
tretc
h w
as g
reate
r in
post-
cyc
lic test
s th
an in
both
lo
w a
nd h
igh rate
tests
whic
h w
ere
indis
ting
uis
hable
. Diffe
rence
s in
failu
re test
mechan
ical p
ara
mete
rs b
y te
st t
ype
are
indic
ate
d b
y b
racke
ted le
tters
C-D
, alp
habetize
d fro
m lo
west t
o h
ighest
valu
es.
λy
σy (
MP
a)
λu
σu (
MP
a)
E (
MP
a)
Po
rcin
e N
ew
bo
rn
(n=
9)
[A]
[A]
[A]
[A]
[A]
Lo
w1.1
11±0.0
21
1.5
21±0.5
39
1.2
57±0.1
10
3.2
37±1.5
24
25.2
88±8.5
44
Hig
h1.1
62±0.0
86
3.3
66±1.8
68
1.2
61±0.0
36
4.8
42±2.4
56
37.2
77±29.1
37
Cycli
c1.2
49±0.0
28
2.3
08±1.3
03
1.3
61±0.1
54
3.0
43±1.7
41
24.2
62±16.6
63
Po
rcin
e A
du
lt
(n=
12)
[A]
[A]
[A]
[A]
[A]
Lo
w1.1
64±0.0
80
2.3
91±1.4
27
1.2
35±0.0
69
3.2
15±1.4
74
21.8
58±11.0
85
Hig
h1.1
98±0.0
76
4.1
47±1.9
07
1.2
95±0.1
32
5.7
99±2.9
27
33.1
01±9.5
96
Cycli
c1.2
26±0.0
28
2.2
15±0.6
70
1.2
50±0.0
35
2.4
46±0.7
89
24.4
39±7.8
86
Hu
man
In
fan
t
(n=
7)
[B]
[B]
[B]
[B]
[A]
Lo
w1.2
40±0.0
85
5.4
24±4.2
52
1.4
89±0.1
83
7.2
04±4.6
13
30.1
73±18.4
92
Hig
h1.2
56±0.0
65
7.8
37±6.2
40
1.4
28±0.1
72
9.8
85±6.7
52
49.0
44±39.7
64
Cycli
c1.2
96±0.0
52
5.7
58±4.4
79
1.4
27±0.1
34
7.6
45±4.7
55
48.1
06±32.9
08
Overa
ll (
n=
28)
Lo
w1.1
66±0.0
82 [
C]
2.8
70±2.7
08 [
C]
1.3
06±0.1
57 [
C]
4.2
19±3.0
63 [
C]
25.0
39±12.6
11 [
C]
Hig
h1.2
01±0.0
82 [
C]
4.8
18±3.7
99 [
D]
1.3
18±0.1
36 [
C]
6.5
13±4.4
18 [
D]
38.4
29±26.1
29 [
D]
Cycli
c1.2
51±0.0
44 [
D]
3.1
30±2.7
45 [
C]
1.3
30±0.1
31 [
C]
3.9
38±3.3
16 [
C]
30.2
99±21.3
98 [
CD
]

26
Discussion
This study deepens our understanding of potential biomechanical factors that contribute
to bridging vein rupture, and provides data essential to modeling bridging vein behavior under
scenarios in which a young child may sustain a head injury. First, bridging vein mechanical
properties did not display any age dependency. Second, except for elastic modulus, bridging vein
mechanical properties are species dependent, with human tissue producing higher values than
porcine. Third, we find that load-related mechanical properties (σy, σu, E) of bridging veins are
rate-dependent, with values increasing with rate. However, parameters that are purely
displacement-related (λy, λu) do not differ with changes in stretch rate. Fourth, prior load history
also has a significant effect on bridging vein failure loading such that in post-cyclic tests, stress-
stretch toe regions are longer, leading to an increase in yield stretch, but interestingly not in
ultimate stretch compared to tests without prior cyclic loading. Yield and ultimate stresses found
in post-cyclic failure loading are similar to those performed at lower stretch rates without a prior
history of cyclic loading. Indeed, during cyclic loading to a common level of displacement, peak
stress achieved by the bridging veins decreased exponentially with successive cycles. Together,
these data will increase the biofidelity of future computational modeling simulations of pediatric
TBI.
Our finding that BV properties are independent of age between newborn and adult
porcine tissue is in agreement with studies performed by Meaney on human bridging vein tissue
from toddler through adult aged subjects that showed ultimate stress, ultimate tension, and
ultimate stretch did not differ across this large range of ages (groups: 3-9 years, 27-47 years, and
>62 years)[12]. Monea et al also investigated age effects on biomechanical parameters in adults
and the elderly, and only found weak effects, indicating decreases in elastic modulus and yield
stress with age over a comparatively smaller range of advanced age subjects (63 to 92 years)
[17]. Based on the properties measured in infant through advanced age, we conclude that there is
no evidence for age dependence of bridging vein mechanical properties, and that any
predisposition to bridging vein rupture and subsequent extra-axial hemorrhage in certain age

27
groups may be due to the relative ease by which the brain and skull can move independently
(e.g. with brain atrophy in the elderly), or likelihood of rapid head rotations with or without impact
(e.g. child abuse in the young, falls in children and the elderly, playing football in childhood to
young adulthood, etc.).
We found that human bridging veins produced significantly higher values than porcine
tissue for all failure test mechanical parameters except elastic modulus. Prior to this study, only
Morison had examined the mechanical properties of both human and porcine bridging veins [26],
though only two porcine and three human subjects were evaluated, and porcine vessels included
other pial and arachnoid veins in addition to bridging veins. Though no statistics were performed,
Morison’s anecdotal findings showed that ultimate stress was higher in human bridging veins than
the array of porcine veins [26], consistent with this study. However, bridging veins from the three
human subjects had lower ultimate stretches than cerebral veins from the two porcine subjects,
which differs from our much larger subject population [26]. We conclude it is important to
incorporate species dependencies in bridging vein properties in order to accurately communicate
findings of extra-axial hemorrhage in animal models of TBI. Although species differences in
failure properties have implications for translating hemorrhage findings from animal studies to
humans, the similar elastic moduli across pigs and humans is a convenient finding for
computational modeling.
We observed no differences in displacement-related mechanical parameters (λy, λu) with
changes in stretch rate. In an early study investigating rates of approximately 1-1000 s-1,
Lowenheilm found much larger ultimate strains at low strain rates than at high strain rates, but
this trend was only observed for rates ~<100s-1 [14], which is within the range of rates tested in
our study. Monea et al found the reverse pattern with modest significant increases of ultimate
strain and yield strain with increasing rates (<3.4s-1, 10-60s-1, and 100-200s-1) [17]. In further
contrast, Meaney, Delye et al, and Lee and Haut found no dependence of the mechanical
properties of bridging veins on strain rate [12, 13, 16]. In conclusion, most studies find no rate

28
dependence in displacement-related parameters (λy, λu) in bridging veins with single studies
reporting properties increase or decrease with rate.
In contrast, we detected rate dependency in load-related mechanical properties (σy, σu,
E) of bridging veins, with values increasing at higher rates of deformation. Lowenhielm also
observed higher ultimate stresses at higher strain rates [14]. Monea et al recently found modest
significant increases in yield stress with higher rates, and this small increase was also observed
in ultimate stress, but was not significant [17]. Monea et al also commented that elastic modulus
increased between low (<3.4s -1) and intermediate (10-60s-1) strain rates (similar to the low and
high rate groups in this study, respectively, Table 2.3), with a subsequent decrease from
intermediate to high (100-200s-1) rates, and these differences were trending towards significance
(p=0.059) [17]. However, Monea et al only obtained ultimate stress data from three bridging veins
and yield and elastic modulus data from four bridging veins in their lowest rate group (<3.4 s -1)
[17]. Additional data at this rate level may provide better statistical power. In a study involving
bridging veins, middle cerebral arteries, and cortical arteries and veins, Monson et al found that
strain rate (groups: 0.03-0.21 s-1, and 20-138s-1) did have a significant effect on artery and vein
mechanical properties, but the authors state that these results were not consistent within various
groups of data (e.g. surgical- versus autopsy-obtained vessels, small versus large vessels, etc.)
[15]. Conversely, several studies did not find rate dependence in bridging vein load-related
mechanical properties (0.1-250s-1) [12, 13, 16]. We conclude that our results regarding load-
related mechanical properties agree with many studies in the literature, with increases in BV
ultimate stress, yield stress, and elastic modulus with increasing stretch rates.
We compared our measured values for human infant bridging vein elastic modulus,
ultimate stress, yield stress, ultimate stretch and yield stretch with those previously reported in
literature. The human infant elastic modulus value calculated at low rates in this study
(30.173±18.492 MPa) is remarkably similar to those in Delye et al (30.69±19.40 MPa) [13] and
also close to those in Monea et al (23.26±14.08 MPa, low rate) [17], both of whom tested at rates
similar to the low rate group presented here. The ultimate stresses found in this study

29
(7.204±4.613 MPa for low rates, 9.885±6.752 MPa for high rates) are between those reported by
Meaney (12.02±5.9 MPa for 3-9 year olds, 18.57±14.2 MPa for 27-47 year olds, 8.02±3.95 MPa
for subjects >62 years old; no age significant differences observed) [12] and those reported by
Delye et al (4.99±2.55 MPa) [13] and Monea et al (3.60±0.76 MPa for low rates <3.4s-1, and
4.78±2.82 MPa for intermediate rates 10-60s-1) [17]. However, yield stress in this study is
consistently higher than what has been found previously, as is high rate modulus (Meaney
reported neither yield properties nor elastic modulus.). Yield and ultimate stretch values for
human infant bridging veins found in this study (1.248±0.073 across similar low and high rate
tests, and 1.448±0.159 across similar low, high and post-cyclic tests, respectively) are similar to
those reported for human bridging veins from older subjects (1.13-1.29 yield stretch; 1.25-1.67
ultimate stretch) [12, 13, 15-17]. Furthermore, because these displacement-related mechanical
parameters conveniently did not vary with stretch rate in our study, we encourage their use in
future modeling endeavors.
To our knowledge, ours is the first study to examine the longitudinal mechanical
properties of bridging veins under cyclic loading. Furthermore, there have been few other studies
to measure longitudinal behavior of any blood vessel under cyclic loading [35, 46-49], and most
have not reported cyclic responses beyond five cycles [46-49]. Our study was designed to mimic
scenarios of repeated single loads or cyclic head rotations in both sports (e.g. boxing, football,
heading a soccer ball, etc.) and child abuse (shaking or repeated blows to the head) resulting in
multiple bridging vein elongations. With exposure to prolonged cyclic elongation to the same peak
displacement, we observe softening of the bridging veins characterized by decreasing peak
stresses (Figures 2.1 and 2.3), and lengthening of the low-stress “toe” region, such that stiffer
behavior occurs at increasingly higher stretch ratios (Figure 2.4), also observed in immature
porcine common carotid arteries [35] (Appendix C).
The nonlinear shape of the stress-stretch curves obtained in these experiments is
common for single elongation to failure in many soft tissues. At low stretches, typically referred to
as the “toe” region, crinkled collagen fibers straighten and elastin fibers elongate from the

30
traction-free state. At higher levels of stretch, the stiff collagen fibers become taut and dominate
the mechanical response of the vessel yielding much stiffer behavior. Yield stretches were higher
in elongation to failure tests performed after cyclic loading than failure tests without prior cyclic
loading, but interestingly, cyclic loading and its associated higher yield stretches and shifted
behavior did not significantly affect any other property measured. In summary, although elastic
modulus and failure properties did not differ between lower rate elongations to failure with or
without 30 seconds of cycling prior, because yield stretch was higher and toe regions were longer
after cycling, we conclude that cyclic loading conferred damage to the mechanical integrity of the
bridging veins prior to failure loading. The increased length of the toe region may imply that the
brain will continuously achieve greater momentum (and thus higher stretch rates) when bridging
veins are repeatedly elongated because they are unable to supply the same level of mechanical
resistance to motion at low stretch ratios as their previously unloaded counterparts.
In an investigation into the ultrastructure of bridging veins, Yamashima and Freide found
that the majority of collagen fibers are oriented circumferentially rather than longitudinally [50].
Thus, we posit that the observed changes in yield and toe region length of bridging vein behavior
with cyclic loading may be due to irreversible changes to the vessel wall as collagen fibers are
pulled apart from one another transverse to their axes, or as individual longitudinally-oriented
fibers are damaged. It is plausible that comparable damage may have occurred during cyclic
loading, but was not as readily detectable due to the relatively fast loading-unloading frequency.
Our observation of post-cyclic failure pull elastic moduli similar to those calculated for both low
and high rate tests may in turn be due to reorientation of some collagen fibers in the precise
direction of loading. Indeed, progressive collagen fiber alignment in the direction of loading has
been observed in cyclic testing of tendons and ligaments [51, 52]. In comparison to our cyclic
bridging vein experiments, Bell et al found that longitudinally over-stretching ovine middle
cerebral arteries to subcatastrophic levels beyond in vivo stretches resulted in decreased toe
region slope and increased high-stretch slope of the stress-stretch curve [53], similar to our
findings regarding longer toe regions and elastic moduli indistinguishable from high rate tests in

31
post-cyclic failure tests. Bell et al also found that ultimate stretch values obtained from a failure
test after over-stretch and a relaxation period were unaffected by the amount of over-stretch
applied to a middle cerebral artery specimen [53], similar to our finding of indistinguishable
ultimate stretches between post-cyclic failure tests and failure tests involving specimens with no
previous load history. Finally in the Bell et al study, after over-stretch, an increased amount of
stretch was required to obtain a target level of stress, and there was no viscoelastic recovery
within 60 minutes [53]. We hypothesize that analogous experiments investigating viscoelastic
effects in bridging veins would yield results similar to those found by Bell et al. To assess these
hypotheses, future studies should include: rate-matched failure tests with and without prior cyclic
loading, observation of collagen fiber orientation with successive cycling, histological
investigations of the unloaded and cyclically loaded vessel wall, and studies of multiple cyclic
loading protocols with prescribed periods of relaxation to account for any viscoelastic effects.
Limitations
The presented studies include several limitations. First, testing was conducted at room
temperature. Future investigations may evaluate bridging vein properties at body temperature.
Second, we measured grip to grip displacement to capture the average bridging vein response.
Investigators interested in more localized stretch behavior may use speckle patterning and video
capture techniques. Third, cyclic loading was displacement-controlled, and yielded decreasing
peak stress and longer low-stress toe regions in the stress-stretch curve with successive cycling.
Creep response may be evaluated in future stress or force-controlled studies; and/or multiple
cyclic loading protocols may be prescribed with periods of relaxation between them to assess the
presence of mechanical fatigue under repeated loading. A limitation of these proposed ex vivo
studies is that we are unable to measure the biomechanical influence of biological remodeling
after a single or a cyclic sub-failure elongation test. In vivo, remodeling may further soften or
possibly stiffen bridging vein mechanical properties and alter the vein behavior prior to a
subsequent elongation. We expect that the remodeling response may vary depending on

32
whether the next load occurs minutes, hours, or days later. Finally, the cyclic peak stretch level
was benchmarked from preliminary low rate porcine failure tests. Due to the higher ultimate
stretch values found for human infant compared to porcine bridging veins, the human infant tissue
was cycled to a proportionately lower stretch compared to its ultimate value than porcine tissue
(Figure 2.3). Although loading differences could contribute to observations that porcine bridging
veins were more likely to incur damage during cyclic loading than human bridging veins, similar
observations of softening bridging vein behavior was observed across species (Tables 2.1, 2.2,
and 2.4).
Conclusions
In this study, we have shown that the load-related failure properties of parasagittal
bridging veins are sensitive to rate within the range of ~1.2-16s-1, with high rates yielding higher
yield stress, ultimate stress, and elastic modulus than low rates. We have also shown that, with
the exception of elastic modulus, human bridging vein mechanical parameters (λy, λu, σy, σu) are
consistently higher than porcine. Thus, investigators utilizing animal models to describe
hemorrhage thought to stem from rupture of the bridging veins should interpret results according
to species-appropriate thresholds for bridging vein failure. In addition, we find a lack of age
dependency in bridging vein mechanical properties. We observe that bridging veins display
persistently altered mechanical behavior demonstrated by continuously decreasing peak stresses
and longer low stress “toe” regions in the stress-stretch curve with successive loading to a
repeated level of stretch, implying that bridging veins may experience mechanical fatigue with
recurring loads. Computational simulations of repeated insults that may cause TBI, similar to
those seen in sports and child abuse, should employ this altered BV behavior in order to
accurately describe incidences of BV failure and subsequent EAH.
This is the first study to examine the behavior of parasagittal bridging veins under cyclic
loading. However, repeated loading of the bridging veins may be a common mode of injury (e.g.
repeated tackling in football or heading of a soccer ball, and shaking-type incidences of child

33
abuse). The data presented here will inform future finite element and computational studies of
bridging vein failure during singular and repeated TBI events, and is an important first step in
investigating the presence of mechanical fatigue in the parasagittal bridging veins. Future studies
may use the data and observations shown in this study to simulate a variety of mechanical insults
and predict the occurrence or likelihood of bridging vein mechanical disruption and subsequent
extra-axial hemorrhage.
Acknowledgements
We are grateful to the families who consented to provide autopsy specimens of their
young children for research purposes. We would also like to thank Dr. Lucy Rorke-Adams, Jill
Ralston, George Bratinov, and Kevin Browne for their technical assistance procuring vessels.
Support was provided by the American Heart Association (12PRE12040315), the National
Institutes of Health (R21 HD078842), and the Children’s Hospital of Philadelphia Critical Care
Fund.
References
1. Faul, M., Xu, L., Wald, M., and Coronado, V., Traumatic Brain Injury in the United States:
Emergency Department Visits, Hospitalizations and Deaths 2002-2006., 2010, Centers
for Disease Control and Prevention, National Center for Injury Prevention and Control:
Atlanta, GA.
2. Guthkelch, A.N., Infantile subdural haematoma and its relationship to whiplash injuries.
Br Med J, 1971. 2(5759): p. 430-1.
3. Caffey, J., The whiplash shaken infant syndrome: manual shaking by the extremities with
whiplash-induced intracranial and intraocular bleedings, linked with residual permanent
brain damage and mental retardation. Pediatrics, 1974. 54(4): p. 396-403.
4. Billmire, M. and Myers, P., Serious head injury in infants: accident or abuse? Pediatrics,
1985. 75(2): p. 340-2.

34
5. Ewing-Cobbs, L., Kramer, L., Prasad, M., Canales, D.N., Louis, P.T., Fletcher, J.M.,
Vollero, H., Landry, S.H., and Cheung, K., Neuroimaging, physical, and developmental
findings after inflicted and noninflicted traumatic brain injury in young children. Pediatrics,
1998. 102(2 Pt 1): p. 300-7.
6. Herman, B.E., Makoroff, K.L., and Corneli, H.M., Abusive head trauma. Pediatr Emerg
Care. 27(1): p. 65-9.
7. Rorke-Adams, L.B., The triad of retinal haemorrhage, subdural haemorrhage and
encephalopathy in an infant unassociated with evidence of physical injury is not the result
of shak ing, but is most likely to have been caused by a natural disease: No. J Prim
Health Care, 2011. 3(2): p. 161-3.
8. Squier, W., The triad of retinal haemorrhage, subdural haemorrhage and encephalopathy
in an infant unassociated with evidence of physical injury is not the result of shaking, but
is most likely to have been caused by a natural disease: Yes. J Prim Health Care, 2011.
3(2): p. 159-61.
9. Duhaime, A.C., Christian, C.W., Rorke, L.B., and Zimmerman, R.A., Nonaccidental head
injury in infants--the "shaken-baby syndrome". N Engl J Med, 1998. 338(25): p. 1822-9.
10. Nadarasa, J., Deck, C., Meyer, F., Willinger, R., and Raul, J.S., Update on injury
mechanisms in abusive head trauma--shaken baby syndrome. Pediatr Radiol, 2014. 44
Suppl 4: p. S565-70.
11. Jaspan, T., Current controversies in the interpretation of non-accidental head injury.
Pediatr Radiol, 2008. 38 Suppl 3: p. S378-87.
12. Meaney, D.F., Biomechanics of Acute Subdural Hematoma in the Subhuman Primate
and Man, in Bioengineering1991, University of Pennsylvania: Philadelphia, PA.
13. Delye, H., Goffin, J., Verschueren, P., Vander Sloten, J., Van der Perre, G., Aleaerts, H.,
Verpoest, I., and Berckmans, D., Biomechanical properties of the superior sagittal sinus-
bridging vein complex. Stapp Car Crash Journal, 2006. 50: p. 625-636.

35
14. Lowenhielm, P., Dynamic properties of the parasagittal bridging veins. Z Rechtsmed,
1974. 74: p. 55-62.
15. Monson, K.L., Goldsmith, W., Barbaro, N.M., and Manley, G.T., Significance of source
and size in the mechanical response of human cerebral blood vessels. J Biomech, 2005.
38(4): p. 737-44.
16. Lee, M.C. and Haut, R.C., Insensitivity of tensile failure properties of human bridging
veins to strain rate: implications in biomechanics of subdural hematoma. J Biomech,
1989. 22(6-7): p. 537-42.
17. Monea, A.G., Baeck, K., Verbeken, E., Verpoest, I., Sloten, J.V., Goffin, J., and
Depreitere, B., The biomechanical behaviour of the bridging vein-superior sagittal sinus
complex with implications for the mechanopathology of acute subdural haematoma. J
Mech Behav Biomed Mater, 2014. 32: p. 155-65.
18. Coats, B. and Margulies, S.S. Characterization of pediatric porcine skull properties during
impact. in Int Conf of Biomech of Impacts. 2003.
19. Coats, B. and Margulies, S.S., Material properties of human infant skull and suture at
high rates. Journal of Neurotrauma, 2006. 23(8): p. 1222-32.
20. Thibault, K.L. and Margulies, S.S., Age-dependent material properties of the porcine
cerebrum: effect on pediatric inertial head injury criteria. Journal of Biomechanics, 1998.
31(12): p. 1119-26.
21. Margulies, S.S. and Thibault, K.L., Infant skull and suture properties: measurements and
implications for mechanisms of pediatric brain injury. J Biomech Eng, 2000. 122(4): p.
364-71.
22. Prange, M.T. and Margulies, S.S., Regional, directional, and age-dependent properties of
the brain undergoing large deformation. J Biomech Eng, 2002. 124(2): p. 244-52.
23. Prange, M.T., Meaney, D.F., and Margulies, S.S., Defining brain mechanical properties:
effects of region, direction, and species. Stapp Car Crash J, 2000. 44: p. 205-13.

36
24. Gefen, A., Gefen, N., Zhu, Q., Raghupathi, R., and Margulies, S.S., Age-dependent
changes in material properties of the brain and braincase of the rat. Journal of
Neurotrauma, 2003. 20(11): p. 1163-77.
25. Sullivan, S., Eucker, S.A., Gabrieli, D., Bradfield, C., Coats, B., Maltese, M.R., Lee, J.,
Smith, C., and Margulies, S.S., White matter tract-oriented deformation predicts traumatic
axonal brain injury and reveals rotational direction-specific vulnerabilities. Biomech Model
Mechanobiol, 2015. 14(4): p. 877-96.
26. Morison, C.N., The Dynamics of Shaken Baby Syndrome, in Manufacturing and
Mechanical Engineering2002, University of Birmingham: Birmingham, UK.
27. Warden, S.J., Burr, D.B., and Brukner, P.D., Stress fractures: pathophysiology,
epidemiology, and risk factors. Curr Osteoporos Rep, 2006. 4(3): p. 103-9.
28. Martin, R.B., Fatigue microdamage as an essential element of bone mechanics and
biology. Calcif Tissue Int, 2003. 73(2): p. 101-7.
29. Bennell, K.L., Malcolm, S.A., Wark, J.D., and Brukner, P.D., Models for the pathogenesis
of stress fractures in athletes. Br J Sports Med, 1996. 30(3): p. 200-4.
30. Chapurlat, R.D. and Delmas, P.D., Bone microdamage: a clinical perspective.
Osteoporos Int, 2009. 20(8): p. 1299-308.
31. Peris, P., Stress fractures. Best Pract Res Clin Rheumatol, 2003. 17(6): p. 1043-61.
32. Jones, G.L., Upper extremity stress fractures. Clinics in sports medicine, 2006. 25(1): p.
159-74, xi.
33. Eisele, S.A. and Sammarco, G.J., Fatigue fractures of the foot and ankle in the athlete. J
Bone Joint Surg Am, 1993. 75(2): p. 290-8.
34. Yassi, A., Repetitive strain injuries. Lancet, 1997. 349(9056): p. 943-7.
35. Pasquesi, S., Liu, Y., and Margulies, S., Repeated Loading Behavior of Pediatric Porcine
Common Carotid Arteries. J Biomech Eng, 2016.

37
36. Pukacki, F., Jankowski, T., Gabriel, M., Oszkinis, G., Krasinski, Z., and Zapalski, S., The
mechanical properties of fresh and cryopreserved arterial homografts. Eur J Vasc
Endovasc Surg, 2000. 20(1): p. 21-4.
37. Adham, M., Gournier, J.P., Favre, J.P., De La Roche, E., Ducerf, C., Baulieux, J., Barral,
X., and Pouyet, M., Mechanical characteristics of fresh and frozen human descending
thoracic aorta. J Surg Res, 1996. 64(1): p. 32-4.
38. Bia, D., Pessana, F., Armentano, R., Perez, H., Graf, S., Zocalo, Y., Saldias, M., Perez,
N., Alvarez, O., Silva, W., Machin, D., Sueta, P., Ferrin, S., Acosta, M., and Alvarez, I.,
Cryopreservation procedure does not modify human carotid homografts mechanical
properties: an isobaric and dynamic analysis. Cell Tissue Bank, 2006. 7(3): p. 183-94.
39. Bia, D., Zocalo, Y., Pessana, F., Armentano, R., Perez-Campos, H., Saldias, M., and
Alvarez, I., Femoral arteries energy dissipation and filtering function remain unchanged
after cryopreservation procedure. Transpl Int, 2005. 18(12): p. 1346-55.
40. Langerak, S.E., Groenink, M., van der Wall, E.E., Wassenaar, C., Vanbavel, E., van Baal,
M.C., and Spaan, J.A., Impact of current cryopreservation procedures on mechanical and
functional properties of human aortic homografts. Transpl Int, 2001. 14(4): p. 248-55.
41. Masson, I., Fialaire-Legendre, A., Godin, C., Boutouyrie, P., Bierling, P., and Zidi, M.,
Mechanical properties of arteries cryopreserved at -80 degrees C and -150 degrees C.
Med Eng Phys, 2009. 31(7): p. 825-32.
42. Stemper, B.D., Yoganandan, N., Stineman, M.R., Gennarelli, T.A., Baisden, J.L., and
Pintar, F.A., Mechanics of fresh, refrigerated, and frozen arterial tissue. J Surg Res,
2007. 139(2): p. 236-42.
43. Prange, M.T., Coats, B., Duhaime, A.C., and Margulies, S.S., Anthropomorphic
simulations of falls, shakes, and inflicted impacts in infants. J Neurosurg, 2003. 99(1): p.
143-50.

38
44. Duhaime, A.C., Gennarelli, T.A., Thibault, L.E., Bruce, D.A., Margulies, S.S., and Wiser,
R., The shaken baby syndrome. A clinical, pathological, and biomechanical study. J
Neurosurg, 1987. 66(3): p. 409-15.
45. Monson, K.L., Goldsmith, W., Barbaro, N.M., and Manley, G.T., Axial mechanical
properties of fresh human cerebral blood vessels. J Biomech Eng, 2003. 125(2): p. 288-
94.
46. Maher, E., Early, M., Creane, A., Lally, C., and Kelly, D.J., Site specific inelasticity of
arterial tissue. J Biomech, 2012. 45(8): p. 1393-9.
47. Garcia, A., Martinez, M.A., and Pena, E., Viscoelastic properties of the passive
mechanical behavior of the porcine carotid artery: influence of proximal and distal
positions. Biorheology, 2012. 49(4): p. 271-88.
48. Garcia, A., Martinez, M.A., and Pena, E., Determination and modeling of the inelasticity
over the length of the porcine carotid artery. J Biomech Eng, 2013. 135(3): p. 31004.
49. Horny, L., Gultova, E., Chulp, H., Sedlacek, R., Kronek, J., Vesely, J., and Zitny, R.,
Mullins Effect in Aorta and Limiting Extensibility Evolution. Bulletin of Applied Mechanics,
2010. 6(21): p. 1-5.
50. Yamashima, T. and Friede, R.L., Why do bridging veins rupture into the virtual subdural
space? J Neurol Neurosurg Psychiatry, 1984. 47(2): p. 121-7.
51. Miller, K.S., Edelstein, L., Connizzo, B.K., and Soslowsky, L.J., Effect of preconditioning
and stress relaxation on local collagen fiber re-alignment: inhomogeneous properties of
rat supraspinatus tendon. J Biomech Eng, 2012. 134(3): p. 031007.
52. Quinn, K.P. and Winkelstein, B.A., Preconditioning is correlated with altered collagen
fiber alignment in ligament. J Biomech Eng, 2011. 133(6): p. 064506.
53. Bell, E.D., Sullivan, J.W., and Monson, K.L., Subfailure overstretch induces persistent
changes in the passive mechanical response of cerebral arteries. Front Bioeng
Biotechnol, 2015. 3: p. 2.

39
CHAPTER 3: MEASUREMENT OF SAGITTAL PLANE BRAIN-SKULL
DISPLACEMENTS AND VALIDATION OF A CORRESPONDING FINITE ELEMENT
MODEL BOUNDARY CONDITION IN THE NEONATAL PIG
Abstract
Computational models are valuable tools for studying tissue level mechanisms of
traumatic brain injury, but in order to produce more accurate estimates of tissue deformation,
these models must be validated against experimental data. In this study, we present in situ
measurements of brain-skull displacement in the neonatal piglet head (n=3) at the sagittal midline
during six rapid nonimpact rotations (two rotations per specimen) with peak angular velocities
averaging 51.7±1.4 rad/s. Each rotation was captured via high speed video, marks on the
sagittally cut brain and skull/rigid potting surfaces were tracked throughout motion, and peak
values of relative brain-skull displacement were extracted. Maximum physical model brain-skull
displacements in the second rotation were significantly greater than those measured during the
first rotation, but this difference was not greater than our measurement error and thus it is
unknown whether this difference is meaningful. Comparison of maximum physical model brain-
skull displacements in this sagittal transection study were significantly less than values extracted
from a previous axial plane physical transection model. In a finite element model of the sagittally
transected neonatal porcine head, the brain-skull boundary condition was matched to the
measured physical experiment data, and the corresponding finite element boundary condition
optimized for sagittal plane rotations is far less stiff than its axial counterpart. Finally, bridging
veins were included in the finite element model and varying the bridging vein mechanical
behavior over the range of those observed in Chapter 2 had no influence on the brain-skull
boundary displacements. This direction-specific sagittal plane boundary condition will be
employed in future finite element models designed to develop thresholds for and predictions of
bridging vein rupture and extra-axial hemorrhage resulting from rapid sagittal head rotations in
Chapters 4 and 5.

40
Introduction
Finite element modeling is a popular computational tool used by many researchers to aid
in understanding and prediction of traumatic brain injury (TBI). To simulate injurious occurrences
accurately, finite element models must include appropriate representations of the brain, skull, and
other cranial contents in terms of geometry, material properties, and contact interactions between
different structures. Extra-axial hemorrhage is thought to stem from the rupture or tearing of the
parasagittal bridging veins that drain blood from the brain into the superior sagittal sinus, which is
housed within the falx cerebri, attached to the skull. Thus the boundary condition between the
brain and skull is of utmost importance when using finite element modeling to simulate and
predict the occurrence of extra-axial hemorrhage.
Anatomically, three meningeal layers lie between the brain and skull: the dura mater,
which is firmly attached to the skull, the arachnoid mater in the middle, and the pia mater which
adheres to the surface of the brain following all of the gyri and sulci. Together the arachnoid and
pia mater constitute the leptomeninges, or pia-arachnoid complex (PAC), consisting of
cerebrospinal fluid, vasculature, arachnoid trabeculae, and the membranes themselves. While
numerous sophisticated finite element models designed to investigate head injury are described
in the literature, most have not replicated properties of the PAC with precision. Our lab recently
found that linear elastic spring connectors imposed between the brain and skull provided good
agreement between axial plane physical model brain-skull displacements [1] and finite element
model brain-skull displacements [2]. Furthermore, this PAC representation predicted the
occurrence of extra-axial hemorrhage in a rapid nonimpact rotation model of TBI in porcine
neonates with 80% sensitivity and 85% specificity based on the peak strain levels observed in the
connector elements [2].
However, we have also shown that physiological and histopathological responses, clinical
presentations, and behavioral outcomes, are all dependent on the directional plane of rotational
injury in our porcine TBI model [3-5], and similar phenomena have been noted in other studies in
pigs [6, 7], rats [8], non-human primates [9, 10], and humans [11-13]. Thus it is critical to

41
investigate whether the brain-skull interface is also dependent on the direction of rotation or
region of the cranium, and if so, determine appropriate direction or region specific boundary
representations for finite element models of head rotation.
In this study, we determined brain-skull displacements from a series of sagittally
transected piglet heads subjected to sagittal plane rotations, developed a finite element model
mimicking the geometry of the sagittally transected piglet head, and determined a brain-skull
boundary condition in the finite element model that matched finite element displacements to
experimentally-derived values. We also compared our results to those found previously in axial
plane physical and finite element model transections [1, 2]. The optimized sagittal brain-skull
boundary condition will be used in future finite element models of the entire porcine head when
sagittal plane rotations are simulated in order to find estimated elongations of the parasagittal
bridging veins and determine the likelihood of extra-axial hemorrhage.
Methods
Physical Model
Construction
Using methods similar to those outlined in a previous studies [1, 2, 14], 3-5 day old
female piglets (n=3) were used to construct physical transection models to study sagittal plan
brain movements during rapid head rotation. Each piglet was anesthetized with isoflurane, and
then sacrificed by administration of a lethal dose (150 mg/kg) of sodium pentobarbital, approved
by the University of Pennsylvania Institutional Animal Care and Use Committee. Immediately after
sacrifice, the piglet was decapitated at the cervical spine, and all exterior soft tissue and the
mandible were removed. A cutting plane was marked in the sagittal plane along the midline of the
skull, and the skull was cut using a Dremel rotary tool with diamond wheel attachment with care
taken to leave the meninges and brain intact. Once the skull was breached, the meninges and
brain were sliced with a brain sectioning knife. The left side of the skull, meninges, and brain was
discarded.

42
The right side of the transected head was embedded in a 5-inch top inner diameter
aluminum pan using polymethylmethacrylate (PMMA, Dentsply, York, PA) and attached to a
custom aluminum canister via three set screws inserted through the side of the canister and
aluminum pan and into the PMMA. Due to heat release during the PMMA curing process,
preliminary tests were conducted to determine whether these high temperatures may affect the
mechanical integrity of the tissue. The similar thermal conductivity (k=0.42 W/mK) Plaster of Paris
compared to bone allowed the use of Plaster of Paris as a bone surrogate. Hemispherical molds
(n=2) of Plaster of Paris (Red Devil Inc., Union, NJ) with thickness similar to that of the porcine
infant skull (4-5mm) were embedded in curing PMMA and filled with water. Across both tests, the
peak temperature recorded on the inner surface of the Plaster of Paris mold during curing was
37.1°C, which is below the normal average body temperature of infant piglets (39°C [15]), and
therefore we conclude that no mechanical damage to the brain tissue occurred during PMMA
curing.
Figure 3.1 Cross-sectional diagram of the physical sagittal plane transection configuration.

43
Immediately after mixing 120 g of powder and 80 ml of liquid PMMA components, the
curing PMMA was poured into the tart pan/set screw/canister structure and the right side of the
transected head was potted in the PMMA with the cut surface facing outwards, and the skull edge
level with that of the aluminum canister. Once the PMMA had hardened, 24-48 dots, ~2-3 mm in
diameter, were applied to the exposed surface of the brain with India Ink (Speedball Art,
Statesville, NC). An additional 6-16 dots were placed on the skull and PMMA and used to assess
rigid body motion. A border of clear silicone caulk was applied on top of the exposed skull edge to
provide a seal around the brain and between the skull and a clear acrylic cover plate. The silicone
caulk and India Ink were allowed to dry for ~45 minutes. A thin layer of transparent lubricant (KY
Brand, Skillman, NJ) was applied to fill the space between the brain and the cover plate to
minimize friction between the brain and the plate. Finally, the cover plate was secured to the
canister. Throughout the preparation, the brain tissue was kept moist by periodic application of 1X
phosphate-buffered saline on the cut surface. All sagittal transection models were prepared and
tested within 6 hours of sacrifice. A schematic of the transection experimental configuration is
shown in Figure 3.1.
Rotation
The canister assembly was mounted on one side arm of a custom linkage that converts
linear motion generated by a HYGE device (Bendix Corporation, Southfield, MI) into a 65 degree
angular rotation [16]. The center of rotation of the linkage was within the piglet cervical spine
relative to the center of mass of the brain in the canister assembly. Each specimen was subjected
to two consecutive rotations with peak velocities averaging 51.3 ± 1.2 rad/s (rotation 1) and 52.0
± 1.7 rad/s (rotation 2). Experiments were filmed with a high speed video camera (HG TH,
Redlake, Tallahassee, FL) at 2500 frames per second with a resolution of 320 x 480 (~0.4
mm/pixel). Angular velocity was measured by two angular rate sensors (ARS-06, Applied
Technology Associates, Albuquerque, NM) mounted to the linkage side arm, and recorded at
10,000 Hz using LabView software (National Instruments, Austin, TX).

44
Image Processing
To enhance the visibility of the marker dots, image contrast and brightness were batch
adjusted in Adobe Photoshop CS4 (San Jose, CA) prior to analysis. A previously-developed
custom MATLAB script (The Mathworks, Natick, MA) was used to isolate and track the marker
dots frame-by-frame [1, 14]. Marker dots on the brain, skull, and PMMA surfaces were
segmented and labeled as objects in a binary black and white image. The perimeter and centroid
of each dot was calculated and superimposed on the original image for each frame to verify
segmentation accuracy. To match marker dots between frames, marker centroid coordinates in a
given frame were compared to those of the preceding frame and the marker centroid nearest to
and within a 10 pixel distance of a confirmed marker location in the preceding frame was
assigned the corresponding dot label. In each frame, the centroid x and y pixel coordinates for
each successfully segmented dot were defined in a global stationary reference system and
recorded.
Data Analysis
After marker dots were successfully isolated, dots on the periphery of the cut brain cortex
surface (Figure 3.2), excluding those on the cerebellum and brainstem, were matched to the
nearest skull or PMMA dot to assess brain displacement relative to the rigid skull throughout the
canister rotation. The distance between brain dot centroids and their respective rigid dot centroids
was calculated for each video frame from fifty frames before motion began until the frame in
which the brain had stopped moving. For each brain-rigid dot pair, the calculated distances over
the fifty frames before motion began was averaged to find a baseline distance for each brain-rigid
dot pair. The average baseline distance for each pair pre-motion was subtracted from the
respective brain-rigid dot pair’s calculated distance in each frame to find the relative
displacements between brain and rigid dots over the fifty frames before motion and the duration
of the rotation. The maximum relative displacement found in each brain-rigid dot pair in the fifty
frames prior to motion was extracted as an error measure correlating with the maximum

45
experimental displacements. The maximum relative displacement achieved by each brain-rigid
dot pair during rotation was extracted over the experimental frames.
Figure 3.2 Example of an initial cropped video frame of a physical transection experiment. A) Brain dots around whole cortex periphery are selected. B) Sagittal-only brain dots are selected.
The maximum experimental displacements and respective error measures for each brain-
rigid dot pair were pooled between subjects into two groups: those found in the first rotation, and
those found in the second rotation. A series of Wilcoxon signed-rank tests were conducted to
determine whether significant differences existed between the maximum displacements found
during a rotation and their respective pre-motion errors, maximum displacements observed in the
first and second rotations, and errors in the first and second rotations. Maximum displacements
observed during the first rotations were also compared to those from other transection
experiments performed previously in the axial plane at similar angular velocities [1, 2], again
using a Wilcoxon signed rank test.

46
Finite Element Model
Construction and Simulation
To create finite element model geometry similar to the sagittal transection physical
configuration, we modified a previously reported piglet finite element model [2, 14]. To mimic the
sagittal transection experimental configuration, the converged 3-5 day old piglet model was
transected at the sagittal midline, discarding the left side of the model. The resulting transection
model (Figure 3.3) had 6,509 brain elements, 732 falx elements, and 8,858 skull elements. The
frictionless boundary condition between the transected surface of the brain and the acrylic cover
plate was replicated by imposing a kinematic coupling constraint on the corresponding finite
element model surface such that the brain nodes on the cut surface were free to translate in the
cut plane, but were prevented from out of plane deformations.
Figure 3.3 Sagittally transected finite element model of the 3-5 day old piglet, brain (blue), skull (green), and falx (yellow).

47
The brain elements were defined as a homogenous, isotropic, nonlinear hyperelastic
material according to a first-order Ogden strain energy density function (Eq. 1): ’
𝑊 =2𝜇(𝑡)
𝛼2(𝜆1
𝛼 + 𝜆2𝛼 + 𝜆3
𝛼 − 3) [1]
where the λs are the principal stretch ratios, α is a nonlinear tissue-specific parameter dependent
on strain magnitude, and μ(t) is the brain shear relaxation modulus. The brain shear relaxation
viscoelastic response was modeled using a two-term Prony series function (Eq. 2):
𝜇(𝑡) = 𝜇0(1 − ∑ 𝐶𝑖(1 − 𝑒−𝑡 𝜏𝑖⁄ )2𝑖=1 ) [2]
where μ0 is the brain shear modulus, Ci are the relaxation moduli, and τi are time constants. The
relaxation moduli and time constants were selected based on those published in our previous
study investigating high strain deformation of porcine brain [17]. Brain shear modulus was
selected as the low end of an optimized range of 3-5 day old piglet brain shear moduli (553 Pa)
determined from prior in situ axial transection experiments [14]. This value is similar to previously
reported measures of in vitro shear modulus (526.9 Pa) [17] and in situ shear modulus (541 Pa)
[18]. The falx was defined as an isotropic, linear elastic material with elastic modulus half that of
adult human dura [19], based on a comparison of adult and fetal human dura [20] stiffness values
[2]. The skull was modeled as a rigid body. All material properties and constants are reported in
Table 3.1.
Table 3.1 Material properties used in the sagittally transected porcine head finite element model
Tissue Material Property Source Brain μ0 = 553 Pa Sullivan et al, 2015 [14] α = 0.01 Prange and Margulies, 2002 [17] C1 = 0.3322 Prange and Margulies, 2002 [17] C2 = 0.3890 Prange and Margulies, 2002 [17] τ1 = 2.9572 s Prange and Margulies, 2002 [17] τ2 = 0.1813 s Prange and Margulies, 2002 [17] ρ = 1.04 g/cm3 Sullivan et al, 2015 [14] ν = 0.49999 Sullivan et al, 2015 [14] Falx ρ = 1.13 g/cm3 Coats et al, 2012 [2] E = 15 MPa Sullivan et al, 2015 [14] ν = 0.45 Coats et al, 2012 [2] General Brain-Skull Connectors
k = 34.6-4,000 N/m N/A

48
A previous study using the axial transection and full head configurations of this newborn
porcine computational model examined the boundary condition between the brain and skull
during axial direction rotations, and found that linear elastic spring connectors linking every brain
surface node to the nearest skull node provided an approximate combined response of the pia-
arachnoid complex and cerebrospinal fluid such that brain tissue strain and brain-skull
displacement were similar between physical and finite element estimations [2]. Not including the
sagittal cut plane, the sagittally transected model had 1,398 brain surface nodes. Each brain
surface node was matched to the nearest node on the inner surface of the skull or falx. Eleven of
these node pairings were reserved for elements representing bridging veins, according to the
average number of bridging veins found per hemisphere in a study of human adult cadavers [21],
leaving 1,387 linear elastic connector elements to define the boundary condition between the
brain and skull. We hypothesize that brain-skull displacement in the axial plane may differ from
that in the sagittal plane, and our objective was to optimize the elastic stiffness of the connectors
based on measured brain-skull displacements from the physical transection experiments
(Results). A total of 15 different elastic stiffnesses ranging from 34.6 to 4,000 N/m for the general
brain connectors were simulated in all six sagittal transection simulations (n=3 piglets x 2
rotations/piglet, Table 3.4, Results).
In axial and coronal plane rotations, the falx cerebri may prevent lateral brain movement
near the superior cortical surface. Conversely, in sagittal plane rotations, the falx cerebri does
little to prevent brain-skull relative displacement and resulting bridging vein elongation and it is
important to include bridging vein elements to account for their potential tethering influence at the
brain-skull boundary. The eleven bridging veins were chosen from brain nodes that connected to
nodes on the inner surface of the falx as the superior sagittal sinus, into which the bridging veins
drain, is housed inside the falx. In the same study of adult cadavers, the bridging veins were
found to enter the superior sagittal sinus in two clusters, and this clustering also matched findings
from digital subtraction angiography patients [21]. Briefly, from anterior to posterior, the superior
sagittal sinus was divided into four segments, the first two of which each comprised about 20% of

49
the total length while the last two comprised 30% of the total length each [21]. The first and third
segments were tributary, while the second and fourth had few bridging connections [21]. Finally,
the first segment contained about five bridging veins and the third contained six bridging veins on
average per hemisphere [21]. Based on this observed clustering, the inner surface of the porcine
falx in our computational model was divided into four segments from anterior to posterior along its
length corresponding to 20%, 20%, 30%, and 30% of the total length of the falx. Falx nodes that
were part of brain tethering pairs in the first and third segments were selected as potential
bridging vein connection points. The transected falx inner surface nodes occurred in five medio-
lateral columns. Any connection points on the midline of the falx were rejected as bridging vein
connection points, as these were likely unrealistic connection points since bridging veins enter
from the hemispheres more laterally. From the remaining falx connection points eligible for
inclusion as bridging vein elements, bridging vein connection points were selected such that
bridging vein elements were evenly distributed in an anterior-posterior sense within their
respective falx segments (the first and third segments described earlier). Five bridging vein
connection locations were selected in the first falx segment, and six bridging vein connection
points were selected in the third falx segment. Together with their corresponding brain connection
points, these brain-falx node pairs comprised the eleven bridging vein elements in this sagittal
transection model.
Bridging veins were represented by nonlinear axial connector elements, with force-
displacement curves prescribed according to averaged post-cyclic porcine newborn stress-stretch
curves obtained Chapter 2. Post-cyclic stress-stretch curves were chosen as a worst case
scenario in terms of bridging vein ability to provide any mechanical resistance to displacement
between the brain and skull, due to the observed longer toe region in post-cyclic bridging vein
tests. After optimization of the brain-skull boundary condition with post-cyclic bridging vein
behavior, a simulation was performed using high rate bridging vein behavior to determine whether
the optimized boundary condition was reasonable for the span of bridging vein behaviors
measured in Chapter 2. To create averaged stress-stretch curves, the stretch ratio was

50
discretized in intervals of 0.005 from 1 until the maximum ultimate stretch ratio obtained over all
post-cyclic tests. Then, for individual stress-stretch curves, stress values at each discretized
stretch ratio point were found by linearly interpolating the original stress-stretch ratio curve points
immediately before and after each discretized stretch ratio value. Next, stresses at each stretch
ratio point were averaged across all subjects. Once the discretized stretch ratio point was beyond
an individual stress-stretch curve ultimate point, the subject’s stress-stretch curve was no longer
included in the average stress calculations. The initial length of each bridging vein element was
found based on the undisturbed positions of their respective brain and falx nodes. Averaged
stress-stretch curves for post-cyclic and high rate bridging vein failure tests are presented in
Appendix D. To create a force-displacement response for input into Abaqus, the discretized
stretch ratio curve was multiplied by the initial length of each bridging vein element and the initial
length of the bridging vein element was subtracted from this product to obtain individual
displacement curves for each bridging vein element. All bridging vein elements were assumed to
have the same cross-sectional area, assigned as the average cross-sectional area of all porcine
newborn bridging veins tested in Chapter 2. The averaged stress curve values were multiplied by
this average cross-sectional area to obtain an average force response. These individual force-
displacement curves were assigned to each bridging vein element. Bridging vein failure was
designated at the average ultimate stretch ratio of post-cyclic newborn porcine bridging veins
from Chapter 2, expressed as a failure position in Abaqus by multiplying this number by the
individual initial bridging vein lengths. If during a simulation, a bridging vein element exceeded
this length, it was eliminated from the simulation, as if ruptured.
Every brain perimeter and rigid ink dot centroid used in analysis of brain-skull
displacement in the physical transection experiments was matched to a corresponding node in
the finite element model by overlaying images of segmented dots in the physical experiment with
an image of the sagittal cut surface of the finite element model in Adobe Photoshop CS4 (San
Jose, CA). If an ink dot centroid did not align exactly with a sagittal plane finite element node, up
to four surrounding nodes were assigned such that their coordinates may average to the
51
approximate location of the ink dot. For rigid ink dots in the physical model that were outside the
boundary of the finite element skull, a circle was drawn with the ink dot centroid at the center of
the circle and the radius was expanded until the circle touched the sagittal edge of the finite
element model skull. The skull sagittal edge node closest to the point at which the circle
intersected the finite element model skull edge was matched to the corresponding rigid dot
centroid at the center of the circle. Again, if the circle intersection point did not align exactly with a
skull edge node, up to two surrounding skull edge nodes were assigned such that their
coordinates may average to the approximate location of the circle intersection point. The brain
and skull nodes corresponding to brain and rigid ink dot coordinates were tracked throughout the
simulation, and subsequently analyzed for maximum displacement for comparison with values
determined by the physical transection models (Section 2.2.2). These displacements were used
to refine the general linear elastic connector boundary condition by adjustment of the assigned
elastic stiffness such that finite element maximum displacements were representative of those
observed in the physical experiments.
The angular velocity-time histories from the physical transection experiments filtered at
CFC 200 were used as load inputs for the corresponding finite element model simulations. All
simulations were conducted in ABAQUS Explicit version 6.11 (Simulia, Providence, RI) with
double precision. To eliminate excessive brain deformation and negative element volumes,
distortion and enhanced hourglass control were activated for brain elements. While brain mass is
variable between individual animals, the finite element brain was not scaled as we were unable to
record individual brain masses from the physical transection experiments.
Data Analysis
For each general connector stiffness tested, the maximum relative displacement across
time between brain and skull nodes corresponding to physical experiment brain and rigid ink dots
was extracted. The maximum relative displacements were pooled across all simulations and

52
compared to the corresponding physical model maximum relative displacements using a linear
regression with intercept at zero:
𝑑𝐹𝐸𝑀 = 𝑎 ∗ 𝑑𝐸𝑋𝑃 [3]
where a is the slope of the linear regression. If the 95% confidence interval for slope contained
one, the stiffness was deemed to be a good choice for boundary condition between the brain and
skull. As several of the tested stiffnesses fit this criterion, the same linear regression analysis was
repeated on brain-skull node and brain-rigid dot pairs located on the superior surface of the brain
only (Figure 3.2), since the superior surface displacement determines bridging vein displacement.
The stiffness that resulted in slope values within the narrowest range of one for both all node and
dot pairs and superior only node and 95% confidence intervals for slope including one, was
chosen as the optimal boundary condition stiffness for future analyses.
In a final analysis, to determine if the bridging veins supplied some of the tethering
between the brain and skull, the averaged newborn porcine high rate bridging vein stress-stretch
curve and resulting force-displacement curves were specified in the bridging vein elements.
General connector stiffness was defined as the optimized stiffness. The resulting slope values
between finite element and experimental displacements for all brain-skull/rigid dot pairs and
superior-only brain-skull/rigid dot pairs were compared between the use of post-cyclic bridging
vein curves and high rate bridging vein curves.
Results
Physical Model
Measurement Error
Displacement measurement errors between dot pairs captured on video prior to motion
averaged across all dot pairs in each rotational experiment are reported in Table 3.2, as are
average measurement errors pooled across all subjects for first rotations, second rotations, and
all experiments combined. The overall average displacement measurement error was

53
0.31±0.23mm, which corresponded to <1 pixel difference in the video frames. No significant
differences were noted between the first and second rotations. We conclude that our ink dot pair
relative displacement measurement error is about 0.3 mm.

54
Tab
le 3
.2 P
eak a
ngula
r velo
citie
s, p
eak a
ngula
r acc
ele
rations,
peak a
ngula
r decele
rations,
avera
ge m
axi
mum
bra
in-s
kull
dis
pla
cem
ents
during m
otio
n, and a
vera
ge b
rain
-sku
ll dis
pla
cem
ent e
rrors
are
show
n for each tra
nse
ctio
n e
xperim
ent
. Valu
es
are
poole
d a
mong first and s
econd rota
tions,
as w
ell
as
acro
ss a
ll experim
ents
. Gro
ups s
haring
the s
am
e s
ymbol (
*, ‡
, †) are
sig
nific
antly
diffe
rent fr
om
one a
noth
er,
p<
0.0
1.

55
Figure 3.4 An example of angular velocity and angular acceleration time histories for one transection rotation and the associated brain-rigid dot displacement for 13 dot pairs. Pre-motion frames include time points up to 0.02s. Note the persistent increased displacements post motion, possibly indicating damage to the brain-skull boundary. While angular velocity and acceleration plots are on the same time scale as the displacement plot, the velocity and video camera data recording triggers were not simultaneous, thus the beginning of the angular velocity and acceleration time histories were aligned based on the displacement plot.
Brain-Skull Displacement
Brain-skull displacement appears to peak at two time points during the angular velocity
pulse, with maximal values at the end of rotation deceleration (Figure 3.4). All physical
transection brain-skull displacement time histories are presented in Appendix E. Average
maximum relative displacements between brain and rigid dots in each rotational experiment,
pooled across first rotations, pooled across second rotations, and across all experiments
combined, are shown in Table 3.2. Maximum relative displacements in each brain-rigid dot pair
during the first and second rotations were significantly greater than their respective error
measurements (p<0.000001 for both tests). Thus we conclude that there was measurable relative

56
translation between the brain and skull during rotational events. Furthermore, the maximum
displacements in each brain-rigid dot pair were greater in the second rotation than in the first
rotation (p=0.0094). Coupled with our previous finding that the error measures were not different
between the first and second rotations, we conclude that translation between the brain and skull
is greater in the second rotation than the first rotation, indicating possible damage to the tethering
leptomeninges between the brain and skull had occurred during the first rotation. However, the
difference in average maximum relative displacements between the firs t and second rotations
was less than our measured error level of 0.3mm. Thus, the finding that more translation between
the brain and skull occurred during the second rotation may be of negligible importance; however,
additional consecutive rotations (beyond 2) should be performed in future transection
preparations to determine if increasingly greater relative displacements occur with sequential
rotations.
Finally, maximum relative displacements that occurred during the first rotation were also
compared to those analyzed from previous experiments of axially transected piglet heads rotated
in the axial plane at similar levels of peak angular velocity [1, 2], reported here for the first time.
Average maximum displacements recorded in each axial transection experiment are shown in
Table 3.3. Maximum displacements in the axial transection experiments were significantly higher
than those recorded in the sagittal transections in this study (p<0.000001, Figure 3.5).
Table 3.3 Previously conducted newborn piglet axial transection experiment peak angular velocities, peak angular accelerations, peak angular decelerations, and average maximum brain-skull displacements. These axial transection experiments were conducted at peak velocities similar to those used in our sagittal transection experiments and had no prior load history. Kinematic data was previously reported in Ibrahim et al [1], and while brain-skull displacements were used in Coats et al [2], this is the first time they are being reported explicitly.
Animal Peak Angular
Velocity (rad/s)
Peak Angular Acceleration
(krad/s2)
Peak Angular Deceleration
(krad/s2)
Average of Maximum Brain-Skull
Displacements (mm) Axial – 1 52 6.2 6.9 1.71±0.40 Axial – 2 53 6.7 6.3 1.50±0.56 Axial – 3 54 5.5 6.6 1.31±0.56
Overall 53.0±1.0 6.1±0.6 6.6±0.3 1.50±0.53
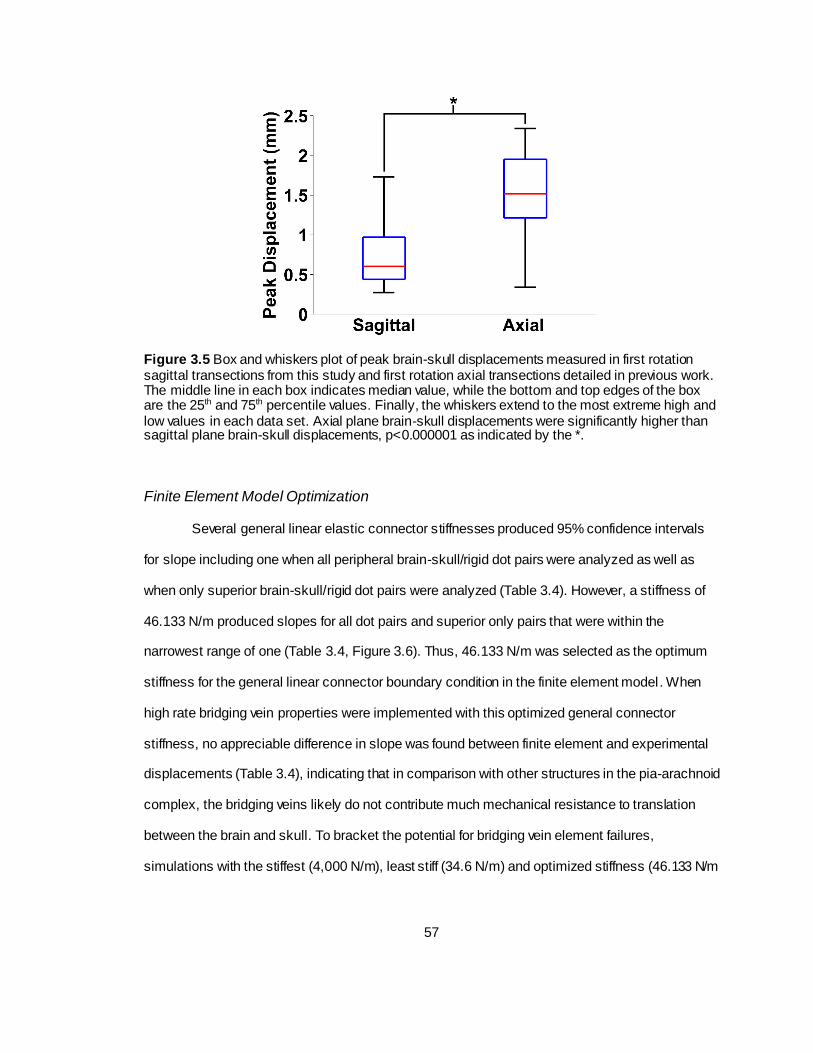
57
Figure 3.5 Box and whiskers plot of peak brain-skull displacements measured in first rotation sagittal transections from this study and first rotation axial transections detailed in previous work. The middle line in each box indicates median value, while the bottom and top edges of the box are the 25th and 75th percentile values. Finally, the whiskers extend to the most extreme high and low values in each data set. Axial plane brain-skull displacements were significantly higher than sagittal plane brain-skull displacements, p<0.000001 as indicated by the *.
Finite Element Model Optimization
Several general linear elastic connector stiffnesses produced 95% confidence intervals
for slope including one when all peripheral brain-skull/rigid dot pairs were analyzed as well as
when only superior brain-skull/rigid dot pairs were analyzed (Table 3.4). However, a stiffness of
46.133 N/m produced slopes for all dot pairs and superior only pairs that were within the
narrowest range of one (Table 3.4, Figure 3.6). Thus, 46.133 N/m was selected as the optimum
stiffness for the general linear connector boundary condition in the finite element model. When
high rate bridging vein properties were implemented with this optimized general connector
stiffness, no appreciable difference in slope was found between finite element and experimental
displacements (Table 3.4), indicating that in comparison with other structures in the pia-arachnoid
complex, the bridging veins likely do not contribute much mechanical resistance to translation
between the brain and skull. To bracket the potential for bridging vein element failures,
simulations with the stiffest (4,000 N/m), least stiff (34.6 N/m) and optimized stiffness (46.133 N/m
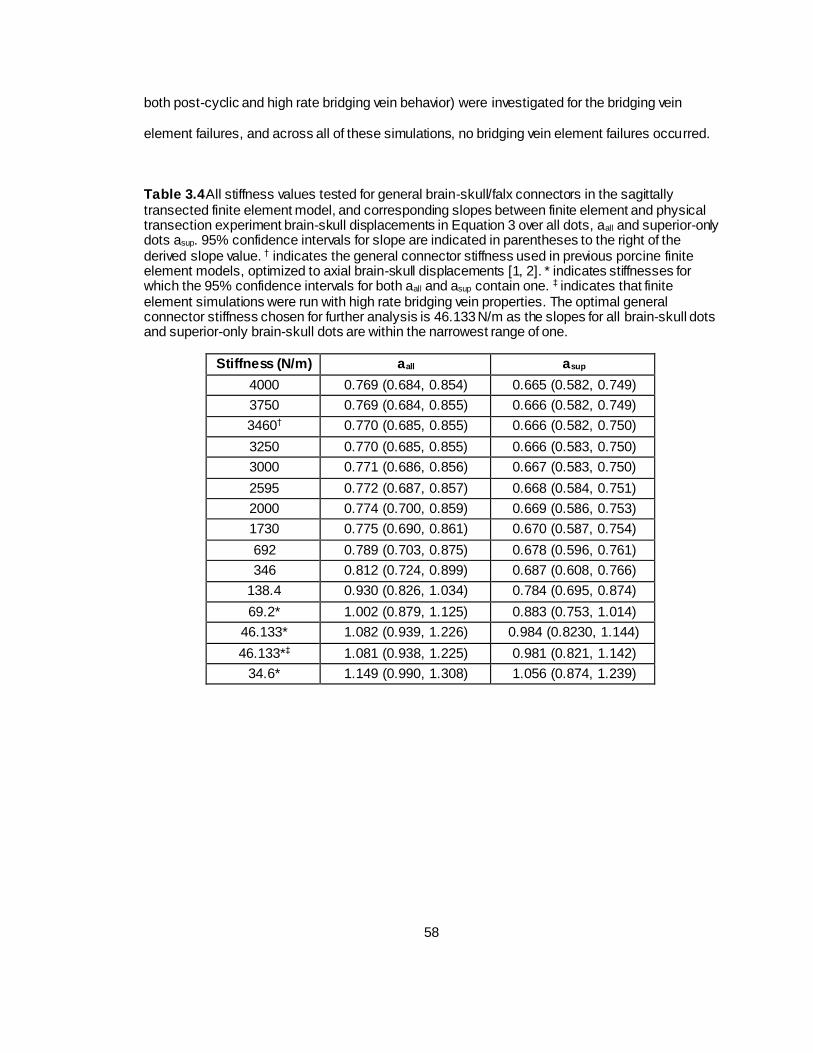
58
both post-cyclic and high rate bridging vein behavior) were investigated for the bridging vein
element failures, and across all of these simulations, no bridging vein element failures occurred.
Table 3.4 All stiffness values tested for general brain-skull/falx connectors in the sagittally transected finite element model, and corresponding slopes between finite element and physical transection experiment brain-skull displacements in Equation 3 over all dots, aall and superior-only dots asup. 95% confidence intervals for slope are indicated in parentheses to the right of the derived slope value. † indicates the general connector stiffness used in previous porcine finite element models, optimized to axial brain-skull displacements [1, 2]. * indicates stiffnesses for which the 95% confidence intervals for both aall and asup contain one. ‡ indicates that finite element simulations were run with high rate bridging vein properties. The optimal general connector stiffness chosen for further analysis is 46.133 N/m as the slopes for all brain-skull dots and superior-only brain-skull dots are within the narrowest range of one.
Stiffness (N/m) aall asup
4000 0.769 (0.684, 0.854) 0.665 (0.582, 0.749)
3750 0.769 (0.684, 0.855) 0.666 (0.582, 0.749)
3460† 0.770 (0.685, 0.855) 0.666 (0.582, 0.750)
3250 0.770 (0.685, 0.855) 0.666 (0.583, 0.750)
3000 0.771 (0.686, 0.856) 0.667 (0.583, 0.750)
2595 0.772 (0.687, 0.857) 0.668 (0.584, 0.751)
2000 0.774 (0.700, 0.859) 0.669 (0.586, 0.753)
1730 0.775 (0.690, 0.861) 0.670 (0.587, 0.754)
692 0.789 (0.703, 0.875) 0.678 (0.596, 0.761)
346 0.812 (0.724, 0.899) 0.687 (0.608, 0.766)
138.4 0.930 (0.826, 1.034) 0.784 (0.695, 0.874)
69.2* 1.002 (0.879, 1.125) 0.883 (0.753, 1.014)
46.133* 1.082 (0.939, 1.226) 0.984 (0.8230, 1.144)
46.133*‡ 1.081 (0.938, 1.225) 0.981 (0.821, 1.142)
34.6* 1.149 (0.990, 1.308) 1.056 (0.874, 1.239)

59
Figure 3.6 Optimized connector stiffness finite element versus physical model peak brain-skull displacements for post-cyclic and high rate bridging vein behavior as well as all and superior-only dot pairs. Data shown by blue dots, linear regressions by red lines, and black line of identity.
Discussion
In this study we measured the sagittal plane brain-skull displacement of the newborn
porcine head when subjected to sagittal plane rotations, and provided an appropriate brain-skull
boundary condition for finite element modeling of sagittal plane head rotations in the porcine
newborn. We observed significant brain-skull relative displacements in an in situ model with
sagittal plane rotations at peak velocities of ~52 rad/s. Brain-skull displacements during head
rotations are direction-dependent with those measured in the sagittal plane in this study
significantly lower than those measured previously in the axial plane. Interestingly, the brain-skull

60
boundary condition prescribed in order to match respective physical transection experimental
brain-skull displacements was far less stiff in a sagittally transected finite element model of the
porcine newborn head than that in a corresponding axial transection finite element model. Finally,
it appears that bridging veins do not dominate the mechanical tethering between the brain and
skull, while other structures may play a larger role. These data will inform future full head finite
element model simulations of rotational injury by providing a validated boundary condition for
sagittal plane motion.
Despite relatively large error measures in comparison to some maximum brain-rigid dot
displacements, paired Wilcoxon signed-rank tests consistently showed that maximum brain-rigid
dot displacements during rotation were higher than their respective error measures. This error
may be attributable to inconsistent lighting as the frame rate of the high speed camera was faster
than the frequency of ambient light in the laboratory, or small frame-to-frame discrepancies with
dot edge detection. Regardless, measurement error averaged slightly less than one pixel
distance (~0.3mm versus ~0.4 mm/pixel). While additional Wilcoxon signed-rank tests revealed
that the maximum relative displacements between brain-rigid dots in the second series of
rotations were higher than those in the first set of rotations, indicating that some structural
damage may have occurred as a result of the first rotation. However, the difference in maximum
displacements between the first and second rotations was less than our measurement error,
rendering this finding statistically significant, but of low importance. Future studies may examine
more than two consecutive rotations to the same load level to investigate if maximum brain-skull
displacements get progressively larger with an increasing number of rotations, such that they are
greater than measurement error. Findings from these proposed studies would provide valuable
information for modeling the brain-skull boundary condition in incidences of shaking or repeated
insults.
We observed that axial plane brain-rigid dot displacements from a previously studied
axial piglet head transection preparation (1.50±0.53 mm) are significantly higher than those
measured in this sagittal plane study (0.76±0.38 mm). Indeed, a plethora of previous human and

61
animal studies have shown that brain material properties [17, 22], TBI pathophysiological [3, 8]
and histopathological responses [3-7, 9, 10], TBI clinical sequelae [3, 5-7, 9-13] and required
treatment [13], and TBI behavioral outcomes [4, 8], vary with local direction of strain (material
properties) and direction of rotational injury plane/impact force (responses, sequelae, treatments,
and outcomes). Thus our finding of differing maximum brain-skull displacement by direction is not
surprising. Interestingly, although measured maximum brain-skull displacements in sagittal plane
physical transections were less than those measured in axial plane preparations, the general
connector stiffness prescribed to match the observed maximum displacements was much lower
in the sagittal plane transection finite element model than the corresponding axial plane
transection finite element model. This phenomenon is not explained by general connector
element density as both models had a similar number of connecters per square millimeter of brain
surface area over which the general connectors were imposed; in fact, connector density was
slightly less in the sagittal plane transection (0.37 connectors/ mm2) than in the axial plane
transection (0.40 connectors/mm2). Rather, we postulate that the irregular geometry of the
sagittal cross-section results in smaller brain-skull displacements than in the axially sectioned
brain and skull (Figure 3.7). Because the irregular geometry restricts motion of the brain, the
geometric boundary dominates the brain-skull motion response in the sagittal transection and a
lower connector stiffness (46.133 N/m) was required than in the axial section (3,460 N/m) [2].
Specifically, the axial plane cross-section is smoother and rounder, with few impediments to
movement. In contrast the sagittal brain-skull boundaries near the cerebellum, brainstem, inferior
frontal boundary near the porcine olfactory bulbs, and smooth superior surface, may each
uniquely and naturally restrain (possibly near the cerebellum, brainstem, olfactory bulbs) or
facilitate (possibly near the cerebellum or superior cerebrum surface) motion of the brain relative
to the skull. The relatively coarse resolution of the physical model ink dots prevents detailed
regional analysis of brain-skull displacements around the sagittal transection perimeter.
Nonetheless, we physical transection experiment plotted brain-skull/rigid dot pair displacements
with brain dots around the periphery of the transected cerebrum from inferior-posterior to

62
superior-posterior, and found increased maximum displacements near the brainstem/foramen
magnum, and near the superior surface (Figure 3.8). Future studies may attempt to obtain higher
resolution high speed videos for better analysis of regional brain-skull displacement in the sagittal
plane, and refinement of finite element model boundary condition.
Figure 3.7 Comparison of sagittal (left) and axial (right) transection physical models (top) and finite element models (bottom). Note the more symmetric shape of the axial cross-section compared to the sagittal cross-section.

63
Figure 3.8 Brain-Skull/Rigid Dot Maximum Physical Transection Displacements around Cerebrum Periphery
The use of high rate bridging vein properties compared to post-cyclic bridging vein
properties (both from the neonatal pig in Chapter 2) with the optimized general connector
stiffness did not provide an appreciable difference in sagittal transection finite element model
brain-skull tethering at peak angular velocities around ~52 rad/s. Because of the much longer toe
region in the post-cyclic bridging vein stress-stretch curves, and decreased ability in this low
stretch ratio realm to provide mechanical resistance to movement, we expected that their use
would necessitate a stiffer boundary condition than other bridging vein properties, but this was not
the case. Instead, we posit that the mechanical tethering response between the brain and skull is
likely governed by other elements of the pia-arachnoid complex (PAC), or again, the sagittal
plane shape of the brain and skull (Figures 3.7 and 3.8). Few material property tests have
examined the PAC, but the available data reveal that normal traction [23] and transverse shear
[24] moduli of the bovine PAC, where arachnoid trabeculae determine the mechanical response,
are lower than the longitudinal bridging vein elastic moduli measured for both pigs and humans in
Chapter 2. On the other hand, under in-plane tension, the elastic modulus of the bovine PAC (6-
40 MPa) [25] is similar to that of the porcine and human bridging vein longitudinal elastic moduli

64
from Chapter 2 (22-49 MPa), and both tissues display similar nonlinear elastic and rate-
dependent behaviors [25]. Furthermore, a microstructural imaging study of the neonatal porcine
PAC revealed high regional variability in arachnoid trabeculae and subarachnoid vasculature
volume fraction, indicating that PAC material properties may also vary across the brain surface
[26]. While a few microscale finite element models have begun to address the individual and
combined components of the PAC [27-29], only one study developed a corresponding
macroscale PAC representation based on regional and inter-individual PAC structural
distributions [26], validated in a full head model against the presence of hemorrhage [27]. While
some material properties of the PAC representative elements were based on literature-reported
values [23-25], the model response was not validated against in situ brain-skull displacements
[27]. Future combining of representations of the PAC with measured material properties and
biofidelic regional and inter-individual structural density ranges, and observed in situ brain-skull
displacements may provide an even more accurate simulation of the brain-skull boundary
condition in finite element models. Finally, in all material property and finite element studies, the
PAC is assumed to be transversely isotropic, but only in-plane tension tests have confirmed this
along both the sagittal and coronal planes [25]. Future studies should investigate the transverse
shear properties of the PAC by loading in the approximate directions of the sagittal and coronal
planes.
Limitations
The presented studies include several limitations. First, it was impossible to capture
brain-skull displacements orthogonal to the sagittal plane of rotation (and axial plane of rotation
for prior axial studies) in the physical model transections. However, we assume any orthogonal
displacements are likely minimal compared to those within the plane of rotation. Second, physical
model construction may have caused structural alterations to the transected cranial contents,
most notably the probable draining of cerebrospinal fluid, though care was taken to preserve the
mechanical integrity of the brain, skull, and interfacing tissues and fill the structures with buffered

65
saline. Third, brain-skull displacements were matched uniformly around the periphery of the
cerebrum in the sagittal plane, but coarse resolution data suggest there may be regional
dependencies. Future studies may investigate regional differences in brain-skull displacement
using higher resolution video and determine finite element model sagittal plane boundary
conditions by region. Finally, physical measurements of maximum brain-skull displacement and
the corresponding finite element boundary condition were only optimized for peak angular
velocities of ~52 rad/s in the sagittal plane. Whether the prescribed finite element model
boundary condition also holds for other load levels is unknown. Future physical sagittal plane
transection studies at different levels of peak angular velocity and acceleration and brain-skull
displacement analysis of previously conducted higher load level axial transection preparations
[14] may address this question.
It is also important to note two differences in analysis. In the axial physical transection
experiments, the baseline distance between brain and rigid dots was determined as the distance
found in the first frame before motion, rather than the first fifty frames before motion in this series
of sagittal physical transection experiments. We do not believe this contributed to our finding of
smaller displacements in the sagittal rotations. In the axially transected finite element model,
brain-skull displacement was matched to physical experiments using a linear regression with 95%
confidence intervals for slope containing one, and intercept containing zero, rather than assuming
an intercept of zero as was done in the sagittally transected studies. Similarly, we do not believe
this contributed to our finding of lower finite element connector stiffness in sagittal rotations.
Finally, in the axial transection studies, the boundary condition was validated separately in all
three axial transection studies, rather than by pooled analysis, and it was not optimized, but
rather estimated and found to be within acceptable criteria for linear regression similarity. Future
studies may optimize the axial transection general connector stiffness and pool all studies
together for improved statistical power, and this may result in a small change in the axial plane
boundary condition stiffness, but it is still doubtful that any changes would be drastic.

66
Conclusions
In summary, we have measured sagittal plane brain-skull displacements from an in situ
model of the neonatal piglet head, and determined a brain-skull boundary condition to match
these displacements in a neonatal pig head finite element model. In completing this correlation,
we also found that axial plane brain-skull displacements at similar load levels are larger than
those measured in the sagittal plane in this study. However, the finite element boundary condition
required to replicate the sagittal plane brain-skull displacements is far less stiff than that
employed in its axial plane finite element counterpart, possibly attributable to differences in
sagittal and axial plane brain and skull shape, or similarly, regional differences in brain-skull
displacement. We also found this boundary condition is unaffected by the use of the range of
bridging vein properties determined in Chapter 2, with high rate bridging vein properties yielding
no appreciable difference in brain-skull boundary condition compared to post-cyclic bridging vein
properties. This indicates that the sagittal plane brain-skull boundary condition may be governed
by other PAC structures, or, once more, the irregular shape of the brain and skull in the sagittal
plane (Figures 3.7 and 3.8). Accordingly, we encourage the use of appropriate brain-skull
boundary conditions in finite element models of the head, dependent on the direction of simulated
rotation. The data presented in this study provide critical insight into directional differences in
rotational brain-skull displacement, and will be employed in finite element models of the whole
neonatal porcine and human infant heads simulating sagittal plane rotational insults to best
predict tissue response, in particular the incidence of bridging vein failure.
References
1. Ibrahim, N.G., Natesh, R., Szczesny, S.E., Ryall, K., Eucker, S.A., Coats, B., and
Margulies, S.S., In situ deformations in the immature brain during rapid rotations. J
Biomech Eng. 132(4): p. 044501.

67
2. Coats, B., Eucker, S.A., Sullivan, S., and Margulies, S.S., Finite element model
predictions of intracranial hemorrhage from non-impact, rapid head rotations in the piglet.
Int J Dev Neurosci, 2012. 30(3): p. 191-200.
3. Eucker, S.A., Smith, C., Ralston, J., Friess, S.H., and Margulies, S.S., Physiological and
histopathological responses following closed rotational head injury depend on direction of
head motion. Exp Neurol, 2011. 227(1): p. 79-88.
4. Sullivan, S., Friess, S.H., Ralston, J., Smith, C., Propert, K.J., Rapp, P.E., and Margulies,
S.S., Behavioral deficits and axonal injury persistence after rotational head injury are
direction dependent. Journal of Neurotrauma, 2013. 30(7): p. 538-45.
5. Maltese, M.R., Traumatic Brain Injury Thresholds in the Pre-Adolescent Juvenile, in
Bioengineering2012, University of Pennsylvania: Philadelphia, PA.
6. Smith, D.H., Nonaka, M., Miller, R., Leoni, M., Chen, X.H., Alsop, D., and Meaney, D.F.,
Immediate coma following inertial brain injury dependent on axonal damage in the
brainstem. J Neurosurg, 2000. 93(2): p. 315-22.
7. Browne, K.D., Chen, X.H., Meaney, D.F., and Smith, D.H., Mild traumatic brain injury and
diffuse axonal injury in swine. Journal of Neurotrauma, 2011. 28(9): p. 1747-55.
8. Mychasiuk, R., Hehar, H., Candy, S., Ma, I., and Esser, M.J., The direction of the
acceleration and rotational forces associated with mild traumatic brain injury in rodents
effect behavioural and molecular outcomes. J Neurosci Methods, 2016. 257: p. 168-78.
9. Gennarelli, T.A., Thibault, L.E., Adams, J.H., Graham, D.I., Thompson, C.J., and
Marcincin, R.P., Diffuse axonal injury and traumatic coma in the primate. Ann Neurol,
1982. 12(6): p. 564-74.
10. Gennarelli, T.A., Thibault, L.E., Tomei, G., Wiser, R., Graham, D., and Adams, J.,
Directional Dependence of Axonal Brain Injury due to Centroidal and Non-Centroidal
Acceleration, in STAPP Car Crash Conference1987: New Orleans, LA. p. 49-53.

68
11. Broglio, S.P., Schnebel, B., Sosnoff, J.J., Shin, S., Fend, X., He, X., and Zimmerman, J.,
Biomechanical properties of concussions in high school football. Med Sci Sports Exerc,
2010. 42(11): p. 2064-71.
12. Pellman, E.J., Viano, D.C., Tucker, A.M., and Casson, I.R., Concussion in professional
football: location and direction of helmet impacts-Part 2. Neurosurgery, 2003. 53(6): p.
1328-40; discussion 1340-1.
13. Stephens, J.R., Holmes, S., Bulters, D., and Evans, B.T., The effect of direction of force
to the craniofacial skeleton on the severity of brain injury in patients with a fronto-basal
fracture. Int J Oral Maxillofac Surg, 2016. 45(7): p. 872-7.
14. Sullivan, S., Eucker, S.A., Gabrieli, D., Bradfield, C., Coats, B., Maltese, M.R., Lee, J.,
Smith, C., and Margulies, S.S., White matter tract-oriented deformation predicts traumatic
axonal brain injury and reveals rotational direction-specific vulnerabilities. Biomech Model
Mechanobiol, 2015. 14(4): p. 877-96.
15. Lossec, G., Herpin, P., and Le Dividich, J., Thermoregulatory responses of the newborn
pig during experimentally induced hypothermia and rewarming. Exp Physiol, 1998. 83(5):
p. 667-78.
16. Raghupathi, R. and Margulies, S.S., Traumatic axonal injury after closed head injury in
the neonatal pig. Journal of Neurotrauma, 2002. 19(7): p. 843-53.
17. Prange, M.T. and Margulies, S.S., Regional, directional, and age-dependent properties of
the brain undergoing large deformation. J Biomech Eng, 2002. 124(2): p. 244-52.
18. Bradfield, C., Estimating Stiffness of Infant and Toddler Age Porcine Brain Tissue
Subjected to High Rotational Velocities Using Computational and Experimental Methods,
in Bioengineering2013, University of Pennsylvania: Philadelphia, PA.
19. Galford, J.E. and McElhaney, J.H., A viscoelastic study of scalp, brain, and dura. J
Biomech, 1970. 3(2): p. 211-21.
20. Bylski, D.I., Kriewall, T.J., Akkas, N., and Melvin, J.W., Mechanical behavior of fetal dura
mater under large deformation biaxial tension. J Biomech, 1986. 19(1): p. 19-26.
69
21. Han, H., Tao, W., and Zhang, M., The dural entrance of cerebral bridging veins into the
superior sagittal sinus: an anatomical comparison between cadavers and digital
subtraction angiography. Neuroradiology, 2007. 49(2): p. 169-75.
22. Arbogast, K.B. and Margulies, S.S., Material characterization of the brainstem from
oscillatory shear tests. J Biomech, 1998. 31(9): p. 801-7.
23. Jin, X., Ma, C., Zhang, L., Yang, K.H., King, A.I., Dong, G., and Zhang, J., Biomechanical
response of the bovine pia-arachnoid complex to normal traction loading at varying strain
rates. Stapp Car Crash J, 2007. 51: p. 115-26.
24. Jin, X., Yang, K.H., and King, A.I., Mechanical properties of bovine pia-arachnoid
complex in shear. J Biomech, 2011. 44(3): p. 467-74.
25. Jin, X., Lee, J.B., Leung, L.Y., Zhang, L., Yang, K.H., and King, A.I., Biomechanical
response of the bovine pia-arachnoid complex to tensile loading at varying strain-rates.
Stapp Car Crash J, 2006. 50: p. 637-49.
26. Scott, G. and Coats, B., Microstructural characterization of the pia-arachnoid complex
using optical coherence tomography. IEEE Trans Med Imaging, 2015.
27. Scott, G.G., Margulies, S.S., and Coats, B., Utilizing multiple scale models to improve
predictions of extra-axial hemorrhage in the immature piglet. Biomech Model
Mechanobiol, 2015.
28. Ma, C., Jin, X., Zhang, J., and Huang, S., Development of the Pia-Arachnoid Complex
Finite Element Model. 2008 2nd International Conference on Bioinformatics and
Biomedical Engineering, 2008: p. 1717 - 1720.
29. Zoghi-Moghadam, M. and Sadegh, A.M., Global/local head models to analyse cerebral
blood vessel rupture leading to ASDH and SAH. Comput Methods Biomech Biomed
Engin, 2009. 12(1): p. 1-12.

70
CHAPTER 4: RAPID HEAD ROTATIONS CAUSE BRIDGING VEIN RUPTURE AND
EXTRA-AXIAL HEMORRHAGE IN THE NEONATAL PIG
Abstract
Finite element modeling is a technique often used to aid in understanding and prediction
of traumatic brain injury, and estimating tissue deformations during traumatic events provides
insight into kinematic injury thresholds. In this study, we used a finite element model of the
newborn porcine head, including species-appropriate bridging vein elements and properties to
simulate rapid nonimpact rotational brain injuries using our well-established model of single
rotation traumatic brain injury as well as a newer model of cyclic rotational traumatic brain injury
in the neonatal piglet. We found that as peak rotational acceleration magnitudes increased, the
number of bridging vein failures predicted by the finite element model also increased, indicating
that rotational acceleration levels may govern the occurrence of bridging vein rupture and
subsequent extra-axial hemorrhage. In addition, we determined a threshold of six failed bridging
vein elements predicted the occurrence of extra-axial hemorrhage with 100% sensitivity and
100% specificity under single rapid nonimpact rotation, and this critical value of fai led bridging
vein elements performed with 90% accuracy in simulations of cyclic rotational head injuries.
These findings will be used in the development of a finite element model of the human infant
head to simulate real-world trauma such as household accidental falls and abusive shaking-type
insults.
Introduction
The most consistent clinical finding in cases of childhood abusive head trauma is the
presence of subdural and subarachnoid hemorrhage [1], but diagnosis is confounded by similar
occurrences of hemorrhage in accidental trauma. Biomechanical studies can provide insight into
the kinematic thresholds required to produce injury, and injury prediction capabilities to inform
clinical differential diagnosis strategies.

71
Finite element modeling is common tool used to estimate or predict tissue deformations
during traumatic events. Indeed, previous finite element model studies have correlated brain-skull
boundary deformation thresholds with the presence of extra-axial hemorrhage in our porcine TBI
model [2, 3], but these simulations did not include elements representative of the parasagittal
bridging veins, which are thought to tear or rupture as they are stretched in the subdural space
during rapid head rotations when the movement of the brain lags that of the skull. More accurate
representations of the bridging veins are required in order to facilitate improved injury prediction,
and until now, progress toward this goal has been limited by a lack of pediatric bridging vein
mechanical property data.
In this study, we developed and validated a prediction criterion relating the amount of
bridging vein element failures with the presence of extra-axial hemorrhage using a finite element
model of the neonatal porcine head and a retrospective collection of newborn porcine rotational
brain injury experiments conducted previously in our lab [4-7]. Using neonatal porcine bridging
vein properties measured in Chapter 2, and the optimized finite element sagittal plane brain-skull
boundary condition determined in Chapter 3, we first simulated 24 rapid nonimpact rotations in
the sagittal plane over a wide range of load levels, and found the number of failed bridging vein
elements associated with the presence of extra-axial hemorrhage after in vivo injuries having the
highest sensitivity and specificity. We then validated our criterion in simulations of an additional
12 rapid nonimpact rotations in the sagittal plane and 10 cyclic rotational injuries in both the
sagittal and axial planes. Data from this study will inform future finite element models of the
human infant head by providing insight into injury prediction thresholds for extra-axial
hemorrhage.
Methods
Rapid Nonimpact Rotational Neonatal Porcine Brain Injury Studies
In order to correlate finite element model simulation of bridging vein elongations with the
presence of EAH in the neonatal pig, we compiled a retrospective group of 3-5 day old porcine

72
TBI studies from our lab in which animals experienced single or cyclic rapid nonimpact head
rotations in the sagittal plane (single) or sagittal and axial planes (cyclic). Single rotational injuries
were conducted at one of two load levels, with low loads averaging 40.2±5.9 rad/s and high loads
averaging 149.8±5.3 rad/s (Tables 4.4 and 4.5). Piglets with post-injury survival times of 3-8
hours and 24 hours were included as the occurrence and extent of EAH did not differ in these
groups [4, 6]. Axial plane rotations were included in the cyclic group due to low sample size of
sagittal plane cyclic rotations. Due to excessive computational expense, only 10 of the 17
available cyclic porcine studies were chosen for further analysis. First, all cyclic porcine studies
with EAH scores >0% (see Quantification of EAH) were included for analysis. Next studies that
did not complete a full 30 seconds of cycling, or those that had other abnormalities (e.g. animal
came loose on the injury device) were eliminated. Of the remaining available cyclic studies, the
two with the highest average peak-to-peak velocities in each of the following groups were
selected for analysis: 3-8 hour survival – sagittal, 3-8 hour survival – axial, 24 hour – axial, in
addition to those with EAH>0%. Table 4.1 provides details about group sample sizes.
Table 4.1 Group sample sizes. For single rotations, which were all in the sagittal plane, ndev indicates the number of studies in the EAH prediction criterion development group and nval indicates the number of studies in the EAH prediction criterion validation group. Cyclic simulations were evaluated using the EAH prediction criterion (Ncrit) validated in single rotation studies. No sagittal plane cyclic studies were performed in the 24 hour survival group.
Rotation Type Survival Time
3-8 hour 24 hour
Single Low n=5
(ndev=3, nval=2) n=6
(ndev=4, nval=2)
Single High n=11
(ndev=8,nval=3) n=14
(ndev=9,nval=5) Cyclic Sagittal n=4 -
Cyclic Axial n=2 n=4
All protocols from the retrospective studies were approved by the University of
Pennsylvania Institutional Animal Care and Use Committee. Neonatal piglets were anesthetized
with 4% isoflurane inhaled via snout mask. After proper depth of anesthesia was established as
determined by absence of a pinch reflex, the piglets were intubated and mechanically ventilated,
while anesthesia was maintained with 1-4% isoflurane. Heart rate, respiratory rate, rectal

73
temperature, oxygen saturation, and end tidal CO2 were continuously recorded during
anesthesia. Animals were mounted to either the single or cyclic head rotation device by securing
the piglet head to the device bite plate via padded snout straps. For single rotations, our
previously described head rotational acceleration device [8] was use to impart a rapid ventral-to-
dorsal 60 degree rotation in the sagittal plane with the center of rotation at the piglet mid-cervical
spine. Cyclic rotations were performed using our cyclic head rotation device, described previously
[4]. Sagittal plane cyclic rotations were applied through a ±30 degree arc, while axial plane cyclic
rotations were applied through a ±50 degree arc, to span the full range of motion of the porcine
cervical spine in each direction without hyperextension. The neutral axis position of the neck was
defined as 0 degrees. Cyclic head rotations were applied at a frequency of 2-3 Hz for 30 seconds,
similar to the cyclic bridging vein extension tests in Chapter 2. For all rotational head injuries,
angular velocity was recorded by an angular rate sensor (Model ARS-06, Applied Technology
Associates, Albuquerque, NM), sampled at 3,000-10,000 Hz, depending on intended load level
(cyclic, single low, or single high), with one cyclic study sampled at 250 Hz accidentally, though
this was sufficient to capture the signal.
After injury, animals in the 3-8 hour survival group were continuously anesthetized until
euthanasia, while those surviving 24 hours were weaned from anesthesia and upon
demonstration of ability to ambulate to food and water, returned to the animal housing facility. At
the designated survival time point, animals were anesthetized and sacrificed by overdose of
sodium pentobarbital. Brains were perfusion fixed, as described previously [5], and carefully
removed from the cranium making sure to preserve any blood in the subdural space. Brains were
weighed, and digital color photographs were taken of the superior, inferior, left, and right
surfaces.
Quantification of EAH
Extra-axial hemorrhage was quantified using a previously established protocol [2, 4, 6].
The digital photographs of the inferior, superior, left, and right brain surfaces were assessed for

74
surface blood as classified by pixel color in Adobe Photoshop (Adobe Systems, San Jose, CA).
To account for regions of the brain appearing in more than one view, the surface of the brain was
divided regionally using anatomic markers. The total pixel area of the cerebrum containing blood
was summed and divided by the total pixel area of the cerebrum to determine the EAH
percentage score. Blood on the surface of the cerebellum was not included in EAH analysis.
Finite Element Model Development and Simulation
A finite element model of the neonatal porcine head previously developed in our lab [2, 7]
was modified to include bridging vein elements with properties and behavior as determined in
Chapter 2. This full head model (Figure 4.1) included 13,018 linear hexahedral brain elements,
1,891 linear wedge falx elements, and 17,722 rigid shell skull elements. Material properties for
brain and falx were consistent with those described in Chapter 3 for the sagittally transected
newborn porcine head finite element model, as shown in Table 4.2. Again, the skull was
represented as a rigid body.
Figure 4.1 Finite element model of the neonatal porcine head, with brain (blue), skull (green), and falx (pink).

75
Table 4.2 Material properties used in the neonatal porcine whole head finite element model. Detailed parameter descriptions are presented in Chapter 3.
Tissue Material Property Source Brain μ0 = 553 Pa Sullivan et al, 2015 [7] α = 0.01 Prange and Margulies, 2002 [9] C1 = 0.3322 Prange and Margulies, 2002 [9] C2 = 0.3890 Prange and Margulies, 2002 [9] τ1 = 2.9572 s Prange and Margulies, 2002 [9] τ2 = 0.1813 s Prange and Margulies, 2002 [9] ρ = 1.04 g/cm3 Sullivan et al, 2015 [7] ν = 0.49999 Sullivan et al, 2015 [7] Falx ρ = 1.13 g/cm3 Coats et al, 2012 [2] E = 15 MPa Sullivan et al, 2015 [7] ν = 0.45 Coats et al, 2012 [2] General Brain-Skull Connectors
ksag = 46.133 N/m kax = 3460 N/m
Chapter 3 Coats et al, 2012 [2]
The brain-skull boundary condition was defined once again using linear elastic connector
elements linking each brain surface node to the nearest node on the inner surface of the skull or
falx. The whole head model included 2,680 nodes on the outer surface of the brain, 22 of which
were reserved for representation of the bridging veins, yielding 2,658 linear elastic connector
elements defining the boundary condition between the brain and skull. For finite element model
simulations of sagittal plane rotations, general connector stiffness was defined at 46.133 N/m as
determined in Chapter 3, while axial plane rotations included a general connector stiffness of
3,460 N/m as determined previously [2].
The eleven bridging vein elements used in the sagittally transected porcine finite element
model in Chapter 3 were retained in the whole head model we describe here. As the sagittal
transection model included only the right side of the head, the additional eleven bridging vein
elements in this whole head model were chosen from corresponding left side brain node
locations, and connection points along the falx remained in the appropriate tributary segments, as
described in Chapter 3. All together, 22 bridging vein elements were included in this whole head
model to match the average number and distribution of bridging veins observed in the human
adult [10]. Bridging vein elements were once again represented by nonlinear elastic connectors,

76
with force-displacement curves prescribed according to averaged porcine newborn bridging vein
stress-stretch curves, obtained in Chapter 2 and processed as described in Chapter 3.
In both low and high level single rotation simulations, high rate bridging vein force-
displacement relationships were used to describe bridging vein element behavior. This choice
was made based on benchmark calculations of bridging vein stretch rate in the sagittal
transection finite element model, presented in Chapter 3. The maximum stretch rates
experienced by each bridging vein element in the sagittal transection finite element model were
calculated from simulations with the optimized brain-skull boundary condition for both high rate
and post-cyclic bridging vein behaviors. Using bridging vein element initial lengths, we found
maximal bridging vein stretch rates were an order of magnitude higher than the high stretch rate
at which neonatal porcine bridging veins were tested in Chapter 2 (Table 4.3). Next, stretch rates
from these sagittal transection experiments were recalculated assuming an initial bridging vein
length of 25mm, which is the maximum length recorded in a previous study of human adult
bridging veins [11], and the maximum stretch rates were very similar to the high rates tested in
Chapter 2 (Table 4.3). Finally to confirm this finding, the simulation with the highest average
maximum stretch rate, was re-simulated with averaged high rate and post-cyclic bridging vein
force-displacement curves calculated assuming an initial bridging vein length of 25mm, and
again, the finite element bridging vein stretch rates were very similar to those used in the high
rate tests in Chapter 2 (Table 4.3), solidifying our choice of high rate bridging vein behavior in
single whole head rotation finite element models. Conversely, because post-cyclic bridging vein
stress-stretch behavior was significantly altered compared to the previously unloaded low and
high stretch rate behavior in Chapter 2, we chose to use post-cyclic bridging vein behavior in
cyclic whole head finite element simulations, despite its lower average failure test stretch rate.
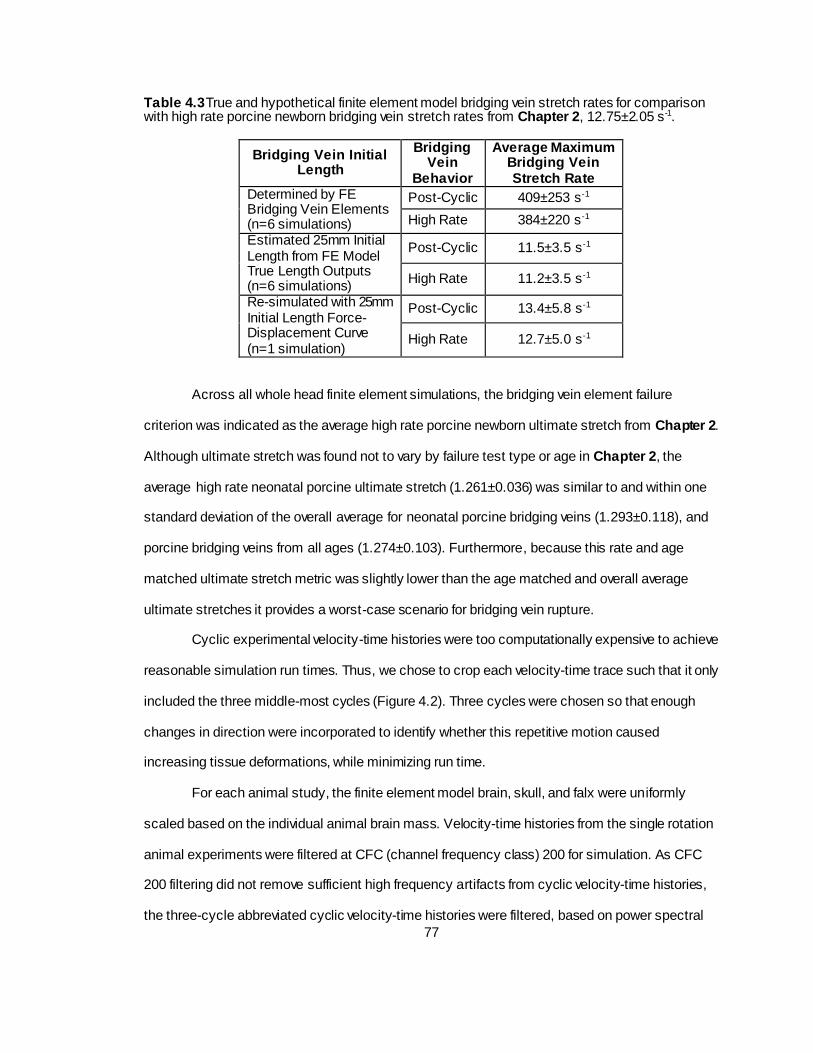
77
Table 4.3 True and hypothetical finite element model bridging vein stretch rates for comparison with high rate porcine newborn bridging vein stretch rates from Chapter 2, 12.75±2.05 s-1.
Bridging Vein Initial Length
Bridging Vein
Behavior
Average Maximum Bridging Vein Stretch Rate
Determined by FE Bridging Vein Elements (n=6 simulations)
Post-Cyclic 409±253 s-1
High Rate 384±220 s-1
Estimated 25mm Initial Length from FE Model True Length Outputs (n=6 simulations)
Post-Cyclic 11.5±3.5 s-1
High Rate 11.2±3.5 s-1
Re-simulated with 25mm Initial Length Force-Displacement Curve (n=1 simulation)
Post-Cyclic 13.4±5.8 s-1
High Rate 12.7±5.0 s-1
Across all whole head finite element simulations, the bridging vein element failure
criterion was indicated as the average high rate porcine newborn ultimate stretch from Chapter 2.
Although ultimate stretch was found not to vary by failure test type or age in Chapter 2, the
average high rate neonatal porcine ultimate stretch (1.261±0.036) was similar to and within one
standard deviation of the overall average for neonatal porcine bridging veins (1.293±0.118), and
porcine bridging veins from all ages (1.274±0.103). Furthermore, because this rate and age
matched ultimate stretch metric was slightly lower than the age matched and overall average
ultimate stretches it provides a worst-case scenario for bridging vein rupture.
Cyclic experimental velocity-time histories were too computationally expensive to achieve
reasonable simulation run times. Thus, we chose to crop each velocity-time trace such that it only
included the three middle-most cycles (Figure 4.2). Three cycles were chosen so that enough
changes in direction were incorporated to identify whether this repetitive motion caused
increasing tissue deformations, while minimizing run time.
For each animal study, the finite element model brain, skull, and falx were uniformly
scaled based on the individual animal brain mass. Velocity-time histories from the single rotation
animal experiments were filtered at CFC (channel frequency class) 200 for simulation. As CFC
200 filtering did not remove sufficient high frequency artifacts from cyclic velocity-time histories,
the three-cycle abbreviated cyclic velocity-time histories were filtered, based on power spectral

78
density analysis, at 30 Hz with a low-pass second-order Butterworth filter for use in finite element
model simulation. The filtered angular velocity-time histories from each animal experiment were
used as load inputs for the corresponding finite element model simulations, with the center of
rotation at the approximate location of experimental center of rotation. All simulations were
conducted in ABAQUS Explicit version 6.11 (Simulia, Providence, RI) with double precision. To
eliminate excessive brain deformation and negative element volumes, distortion and enhanced
hourglass control were activated for brain elements.

79
Figure 4.2 Example whole injury angular velocity-time and angular acceleration-time plots with dashed lines indicating cycles selected for finite element analysis. Corresponding cropped angular velocity and angular acceleration time-history plots are enlarged beneath the whole injury traces.

80
Data Analysis
Porcine Rotational Brain Injury Kinematics
For porcine single head rotational brain injury studies performed in our lab, we typically
report peak angular velocity extracted from the raw angular velocity-time history. Then the
angular velocity trace is processed through a 10-point Gaussian smoothing algorithm and
differentiated via central difference method to find angular acceleration. Finally, peak angular
accelerations and decelerations are extracted. For comparison, peak angular velocity values from
signals filtered for finite element simulation were extracted, and the finite element simulation
filtered angular velocity traces were differentiated via forward difference method to find
acceleration. Peak angular accelerations and decelerations calculated from velocity signals
prepared for finite element simulation were then extracted. Peak angular velocities, accelerations,
and decelerations in single rotations were compared between analysis methods using paired t-
tests for each kinematic metric.
For porcine cyclic head rotational injuries, kinematics extracted from the three cycles for
finite element simulation were also compared with those over the entire injury. First, the entire
cyclic velocity-time history was filtered at 30Hz, to match the filtering of the finite element input
trace. Both the full and cropped filtered angular velocity-time histories were differentiated using
the forward difference method to find angular acceleration. The cycling frequency, peak-to-peak
angular velocities, and peak acceleration magnitudes were extracted from both the full and finite
element simulation cropped kinematic histories, as follows. Average cycling frequency was
calculated by finding angular velocity zero-crossing time points immediately preceding points of
peak angular velocity, finding the difference between consecutive zero-crossing time points,
taking the reciprocal of these differences, and averaging all frequencies calculated over the
length of the velocity-time history. Peak-to-peak velocity was extracted from each cycle in both a
forward and backward sense by subtracting “valley” velocities from both the peak velocities
immediately following and immediately preceding the particular valley velocity, respectively. Then
the maximum peak-to-peak velocity over the angular-velocity time history was extracted, and

81
finally the average peak-to-peak velocity was found by averaging all peak-to-peak velocity values
over the length of the velocity-time history. Peak acceleration magnitudes were extracted by cycle
(two per cycle, one near each point of direction change) over the angular acceleration-time
histories, maximum values were extracted and average values were found by averaging al l peaks
over the length of the acceleration-time history. Average cycling frequency, average peak-to-peak
angular velocity, and average peak angular acceleration magnitude were compared between full
porcine cyclic study time histories and the cycles cropped for finite element analysis using paired
t-tests for each metric, to ensure the cycles selected for finite element analysis were
representative, or worst-case scenarios compared to the entire cyclic rotational injury.
Relationship between Injury Parameters and Finite Element Model Predictions of Bridging Vein
Rupture
For all simulations, scatterplots comparing the number of failed bridging vein elements
(Nfail) with the associated simulated peak angular velocity (or maximum peak-to-peak angular
velocity for cyclic simulations), simulated peak acceleration or deceleration (whichever was
greater for single rotations; maximum peak acceleration magnitude for cyclic simulations), and
total cerebrum EAH (%) after injury were generated to investigate relationships between injury
parameters and finite element model simulation results. An additional graphical analysis
investigating the cumulative number of bridging vein ruptures over simulation time as compared
to the prescribed angular velocity and acceleration time histories was performed in an effort to
understand the relationship between bridging vein rupture and injury kinematics.
Development and Validation of EAH Prediction
The presence of EAH was considered a binary variable. Based on prior analysis, where
brain regions were considered positive for EAH if ≥25% blood surface coverage was detected [2],
the smallest region analyzed by surface area was the midline, and retrospective analysis of
twelve 3-5 day old piglet brains scored for hemorrhage revealed that 25% of the midline region

82
surface corresponds to 2.01±0.40% of the whole cerebrum surface [2]. As it is possible that brain
surface blood may not have originated in a region, instead having traveled from a nearby region,
we chose to designate brains with whole cerebrum blood surface coverage ≥2% as positive for
EAH in this analysis (~1 cm diameter [2]), which is also a reasonable detection level for in vivo
imaging (personal communication, Dr. Cindy Christian, Children’s Hospital of Philadelphia). Any
brains with <2% of the cerebrum covered in blood were designated as negative for hemorrhage.
Of the 36 single sagittal rotation animal studies simulated, 24 were used to develop the
EAH prediction criterion (Ncrit) by determining the number of failed bridging vein elements (Nfail)
associated with the presence of EAH having the highest sensitivity and specificity. The 24 studies
chosen for the development group spanned both 3-8 hour and 24 hour survival time points
(Tables 4.4 and 4.5) with low level peak raw signal angular velocities averaging 40.6±5.4 rad/s
(Table 4.4), and high level raw signal peak angular velocities averaging 149.5±5.7 rad/s (Table
4.5), both near the overall average peak angular velocities for the low and high level single
rotation groups (40.2±5.9 and 149.8±5.3 rad/s, respectively, Tables 4.4 and 4.5). Once Ncrit was
selected, the remaining 12 studies were analyzed to confirm the ability of Ncrit to predict the
occurrence of EAH, evaluated by positive and negative predictive values. Finally, Ncrit, as
determined from single sagittal head rotations, was evaluated as an EAH predictor with results
from the cyclic porcine studies and finite element simulations, and its accuracy was assessed by
positive and negative predictive values.
Results
Neonatal Porcine Rotational TBI Study Kinematics
Kinematic measurements for low load level single head rotations are reported Table 4.4,
and high load level kinematics are reported in Table 4.5 for signals used in finite element model
analysis (CFC 200 filtered). Kinematic measurements for single head rotations as determined
from raw velocity-time histories and Gaussian smoothed accelerations are presented in Appendix
F. The peak angular velocities, peak angular accelerations, and peak angular decelerations in the

83
traces filtered for finite element model analysis were significantly smaller than their raw (velocity)
and Gaussian smoothed (acceleration, deceleration) counterparts. While differences in peak
velocity between the two measurement methods were modest, peak accelerations and
decelerations were quite a bit larger, especially deceleration measurements in the high load level
group, as can be expected when filtering signals to eliminate high frequency noise. In addition,
filtering of the angular velocity-time histories was required prior to finite element analysis for
computational stability and efficiency.
Cyclic injury kinematic metrics are reported Table 4.6 for the cropped traces used as
inputs for finite element model analysis. Values obtained over the entire injury trace are
presented in Appendix F. Average frequency, average peak-to-peak angular velocity, and
average peak angular acceleration magnitude were all significantly larger in the cropped trace for
finite element model simulation than over the whole cyclic injury history. The increased frequency,
average peak-to-peak angular velocity, and average peak acceleration magnitudes observed in
the cropped traces are likely due to the fact that they were taken from the middle of the injury time
history, and did not include device ramp up and ramp down time at the beginning and end of the
injury (Figure 4.2). While maximum overall peak to peak angular velocity and peak angular
acceleration magnitude over the entire injury often did not occur during the cropped trace, the
modestly higher average frequency, average peak-to-peak angular velocity, and average peak
acceleration magnitudes in the cropped traces indicate that they may be considered between
average and worst case cycles compared with the entire injury time history.

84
Table 4.4 Single low level sagittal rotational injury kinematics as determined from velocity and acceleration traces filtered for finite element analysis, and resulting hemorrhage scores and number of failed bridging vein elements from finite element simulations (Nfail). All values are averaged across Ncrit determination groups and all studies.
Subject
Ncrit
Determination
Group
Survival
Time
Peak Angular
Velocity
(rad/s)
Peak Angular
Acceleration
(krad/s2)
Peak Angular
Deceleration
(krad/s2)
Total
Cerebrum
EAH (%)
Nfail
090924; 1L Development 3-8 hour 34.6 3.2 4.5 0.0% 0
090929; 2L Development 3-8 hour 39.6 3.8 5.1 0.0% 0
091112; 3L Development 3-8 hour 39.7 3.7 5.7 0.0% 0
110504B-2; 4L Development 24 hour 51.1 4.9 13.1 0.0% 0
110511B-1; 5L Development 24 hour 42.8 4.4 9.9 0.0% 0
110511B-2; 6L Development 24 hour 40.5 3.1 8.8 0.0% 0
110520-2;7L Development 24 hour 36.1 3.1 7.4 0.0% 0
091110; 8L Validation 3-8 hour 33.3 2.8 4.2 0.0% 0
091124; 9L Validation 3-8 hour 37.5 3.0 6.3 0.0% 0
110504B-1; 10L Validation 24 hour 50.4 4.8 12.2 0.0% 0
110520-1; 11L Validation 24 hour 36.4 3.7 7.0 0.0% 0
40.6±5.4 3.7±0.7 7.8±3.1 0.0% 0
39.4±7.5 3.6±0.9 7.4±3.4 0.0% 0
40.2±5.9 3.7±0.7 7.7±3.0 0.0% 0
Development Group Average
Validation Group Average
Overall Average

85
Table 4.5 Single high level sagittal rotational injury kinematics as determined from velocity and acceleration traces filtered for finite element analysis, and resulting hemorrhage scores and number of failed bridging vein elements from finite element simulations (Nfail). All values are averaged across Ncrit determination groups and all studies.
Subject
Ncrit
Determination
Group
Survival
Time
Peak Angular
Velocity
(rad/s)
Peak Angular
Acceleration
(krad/s2)
Peak Angular
Deceleration
(krad/s2)
Total
Cerebrum
EAH (%)
Nfail
060517; 1H Development 3-8 hour 157.3 44.1 58.3 36.3% 8
060811; 2H Development 3-8 hour 159.3 43.5 57.1 51.6% 8
070830; 3H Development 3-8 hour 158.3 44.3 40.0 37.0% 16
090721-1; 4H Development 3-8 hour 149.3 36.4 54.4 33.7% 12
100408-1; 5H Development 3-8 hour 152.3 38.3 58.7 30.3% 9
100422D-2; 6H Development 3-8 hour 138.7 32.0 61.0 29.2% 19
110224; 7H Development 3-8 hour 148.6 31.7 59.9 54.8% 10
110520-4; 8H Development 3-8 hour 147.0 29.9 70.1 33.0% 8
080604; 9H Development 24 hour 137.9 34.9 40.5 3.4% 6
090729-1; 10H Development 24 hour 150.7 36.1 58.1 46.0% 8
090729-3; 11H Development 24 hour 149.9 36.0 55.7 35.8% 8
110202-1; 12H Development 24 hour 148.9 32.7 63.3 23.8% 12
110202-2; 13H Development 24 hour 149.2 33.3 62.1 37.8% 8
110217; 14H Development 24 hour 148.6 33.4 62.6 17.8% 11
110304-1; 15H Development 24 hour 145.8 29.4 63.0 9.8% 12
110615-1; 16H Development 24 hour 152.2 28.5 77.5 25.8% 16
110615-2; 17H Development 24 hour 147.6 29.8 72.3 41.8% 10
060914; 18H Validation 3-8 hour 155.0 43.3 48.5 43.5% 6
110128; 19H Validation 3-8 hour 154.5 34.6 65.3 32.8% 8
110520-3; 20H Validation 3-8 hour 145.4 29.3 66.8 48.0% 8
080606-1; 21H Validation 24 hour 143.1 34.9 45.8 6.5% 8
090722-1; 22H Validation 24 hour 150.6 36.1 55.6 16.4% 12
090722-2; 23H Validation 24 hour 149.6 36.4 54.8 34.1% 13
090729-2; 24H Validation 24 hour 150.2 36.1 57.2 38.8% 8
110304-2; 25H Validation 24 hour 156.0 31.1 67.4 30.8% 12
149.5±5.7 35.0±5.1 59.7±9.5 32.2±13.5% 10.6±3.5
150.6±4.6 35.2±4.2 57.7±8.2 31.4±13.8% 9.4±2.6
149.8±5.3 35.0±4.7 59.0±9.0 32.0±13.3% 10.2±3.3
Development Group Average
Validation Group Average
Overall Average

86
Tab
le 4
.6 C
yclic
rota
tiona
l inju
ry k
inem
atics
as d
ete
rmin
ed fro
m v
elo
city
and a
ccele
ration tra
ces
cro
pped for fini
te e
lem
ent analy
sis,
and resultin
g h
em
orr
hage s
core
s a
nd n
um
ber of fa
iled b
ridgin
g v
ein
ele
ments
fro
m fin
ite e
lem
ent s
imula
tions
(Nfa
il).
If a m
etr
ic w
as
avera
ged a
cro
ss a
ll cyc
les in
a s
ingle
tra
ce (e.g
. fre
quency
), the o
vera
ll avera
ge v
alu
e repre
sents
the m
ean o
f th
e a
vera
ge v
alu
es
for
each tra
ce.
Su
bje
ct
Ro
tati
on
al
Pla
ne
Su
rviv
al
Tim
e
Ave
rag
e
Fre
qu
en
cy
(Hz)
Ave
rag
e P
ea
k-
Pe
ak A
ng
ula
r
Ve
locit
y (
rad
/s)
Ma
xim
um
Pe
ak-
Pe
ak A
ng
ula
r
Ve
locit
y (
rad
/s)
Ave
rag
e P
ea
k
Acce
lera
tio
n
Ma
gn
itu
de
(ra
d/s
2)
Ma
xim
um
Pe
ak
Acce
lera
tio
n
Ma
gn
itu
de
(ra
d/s
2)
To
tal
Ce
reb
rum
EA
H (
%)
Nfa
il
090407;
1C
Sagitta
l3-8
hr
2.2
7±0.0
04
20.0
±0.2
20.3
502±63
573
0.0
%0
090618;
2C
Sagitta
l3-8
hr
2.6
1±0.0
224.1
±0.1
24.2
889±109
980
0.0
%0
091015;
3C
Sagitta
l3-8
hr
2.6
2±0.0
05
24.7
±0.3
25
571±18
595
0.7
%0
091105;
4C
Sagitta
l3-8
hr
2.9
1±0.0
228.2
±0.1
28.4
913±289
1147
0.3
%0
091218;
5C
Axia
l3-8
hr
2.8
7±0.0
329.2
±0.3
29.7
940±268
1202
0.0
%0
100526;
6C
Axia
l3-8
hr
2.9
5±0.0
332.3
±0.6
33.1
763±124
858
0.0
%0
100106;
7C
Axia
l24 h
r2.8
4±0.0
230.0
±0.2
30.2
1097±377
1401
1.8
%0
100213;
8C
Axia
l24 h
r2.8
9±0.0
127.5
±0.1
27.6
961±260
1153
2.7
%0
100610;
9C
Axia
l24 h
r2.8
7±0.0
832.4
±2.2
35.2
732±331
1249
0.0
%0
100630;
10C
Axia
l24 h
r2.8
8±0.0
728.7
±0.4
29.2
792±201
1002
0.0
%0
2.7
7±0.2
127.7
±3.8
28.3
±4.3
816±182
1016±273
0.5
±0.9
%0
Ove
rall
Ave
rag
e

87
Relationship between Injury Kinematics and Nfail
Nfail for each simulation are listed in Tables 4.4, 4.5, and 4.6. For both single low level
and cyclic rotation finite element simulations, no bridging vein element failures occurred. On the
other hand, for single high level rotation simulations, varying numbers of bridging vein failures
occurred. Investigating Nfail as a function of peak angular velocity (Figure 4.3) yielded no distinct
pattern, but there does appear to be a peak angular velocity at which bridging vein element failure
begins to occur, between the peak angular velocities observed in high and low level single
rotation injuries. This cutoff was also observed when inspecting the relationship between Nfail and
peak angular acceleration magnitude (Figure 4.4). Furthermore, Nfail appears to increase linearly
with peak accelerative load. Finally, Nfail increases with increasing EAH until approximately 10%
EAH cerebrum surface coverage, at which point there is no longer a distinct pattern (Figure 4.5).
Figure 4.3 Nfail versus peak angular velocity (or maximum peak-to-peak velocity for cyclic simulations) across all studies. The Ncrit development group is represented by blue circles, the Ncrit validation group is indicated by red triangles, and the cyclic simulations are shown with black ‘x’s. The discontinuity in peak angular velocities and Nfail indicates there may be a threshold level of angular velocity between those observed in the low and high single rotation load levels at which bridging vein failure is initiated.
02468
10121416182022
0.0 25.0 50.0 75.0 100.0 125.0 150.0 175.0
Nfa
il
Angular Velocity (rad/s)
Development Group Validation Group Cyclic Studies

88
Figure 4.4 Nfail versus the larger of maximum angular acceleration or deceleration for single rotations, or maximum peak angular acceleration magnitude for cyclic simulations. Again, blue circles represent the Ncrit development group, red triangles represent the Ncrit validation group, and cyclic simulations are indicated by black ‘x’s. A similar discontinuity is seen as that observed in Figure 4.3 with angular velocity, but increasing accelerations also appear to correlate with increasing Nfail, suggesting accelerative kinematics may be the cause of bridging vein rupture.
Figure 4.5 Nfail versus EAH% across all studies. Once again blue circles indicate studies in the Ncrit development group, red triangles represent the Ncrit validation group, and black ‘x’s show cyclic simulations. Increasing amounts of EAH appear to correlate with increasing Nfail until ~10% EAH brain surface coverage. Beyond 10% EAH, no discernable pattern is apparent.
02468
10121416182022
0.0 10.0 20.0 30.0 40.0 50.0 60.0 70.0 80.0
Nfa
il
Angular Acceleration (krad/s2)
Development Group Validation Group Cyclic Studies
02468
10121416182022
0.0% 10.0% 20.0% 30.0% 40.0% 50.0% 60.0%
Nfa
il
EAH

89
Bridging vein element failures occur at two distinct time points during single high level
rotations (Figure 4.6, representative example): first, after initial accelerations are sustained where
ruptures occur in the posterior cluster of bridging veins (with exception of one case which had a
mixture of anterior and posterior failures at this time) as the moving skull initially pulls away due to
inertia from the stationary posterior-superior brain surface during the neck extensional rotation,
and then again as the skull stops suddenly with peak head decelerations, at which point bridging
vein failures occur in the anterior cluster because the brain continues to rotate backward, again
due to inertia. In addition, bridging vein failure exhibits a local cascading phenomenon such that
not all failures are simultaneous at these two distinct time points in the angular velocity pulse. We
note that some simulations only exhibit bridging failures in the posterior cluster during the finite
element simulated rotation, which may have inadvertently truncated the latter portion of this
event. All bridging vein element failure time histories are presented in Appendix G.
Figure 4.6 Representative example of a high load level finite element simulation angular velocity-time history, angular acceleration-time history, and resulting Nfail over time. Bridging vein failures occur at two time points: once initial acceleration is sustained, and then just after peak decelerations occur.

90
Development of EAH Prediction Criterion
When examining simulations in the Ncrit development group, with a detection level of
EAH≥2%, sensitivity and specificity for values of Ncrit between 1 and 6 were both 100%. As there
were no development group simulations resulting in Nfail between 1 and 5, an Ncrit of 6 was
chosen as the number of failed bridging vein elements associated with the presence of EAH.
Validation of EAH Prediction Criterion
Again, with a detection level of EAH>2% and Ncrit of 6, evaluation of the validation group
yielded positive and negative predictive values of 100%, indicating that an Ncrit of 6 predicted the
occurrence of EAH perfectly in the validation group, as it did in the development group.
Extension of EAH Prediction Criterion to Cyclic Rotational Injuries
Cyclic rotational injuries produced very small amounts of EAH, with only one above the
2% whole cerebrum threshold. On the other hand, no bridging vein element failures occurred in
any cyclic injury finite element simulations. Thus, using the Ncrit of 6 validated in single head
rotations produced a negative predictive value of 90% for cyclic simulations, indicating that this
predictor is 90% accurate in hemorrhage predictive capabilities for cyclic rotational head injuries.
Discussion
In this study, we incorporated bridging veins into a finite element model of the neonatal
porcine head, and investigated the effect of an array of rotational kinematic loads on the
occurrence of bridging vein element failures. From this, we developed and independently
validated a threshold for the number of failed bridging veins associated with the presence of
extra-axial hemorrhage from newborn porcine in vivo rotational brain injury study pathology. We
find that there are likely kinematic thresholds for angular velocity and angular acceleration that
result in the failure of bridging veins between the load levels investigated in this study, and that
the number of bridging vein failures detected in a finite element analysis increases with increasing

91
peak rotational accelerations. The extent of EAH detected post-injury also begins to increase with
a modest number of finite element model predicted bridging vein failures, but as many bridging
vein elements begin to fail, there is no distinct pattern of increasing EAH with increasing numbers
of bridging vein failures across studies. We determined a critical value of six bridging vein
element failures is associated with 100% sensitivity and specificity for detection of EAH in our
newborn porcine rapid nonimpact rotation TBI model, but applying this criterion to a newborn
porcine cyclic rotational injury model only yielded 90% accuracy. The prediction criterion
determined in this study for the porcine newborn will be employed in future finite element models
of the human infant head to estimate the likelihood of extra-axial hemorrhage resulting from both
accidental and abusive trauma.
The loading condition at which bridging vein failures begin to occur in this finite element
model is between the low and high level rotational loading groups simulated in this study. Future
in vivo studies may be conducted in this realm, with peak angular velocities between 50 and 140
rad/s to determine a more definitive threshold level for extra-axial hemorrhage. However, our
finding of increasing numbers of finite element model bridging vein failures with higher rotational
acceleration magnitudes draws a parallel with classic studies indicating that rotational
accelerative trauma causes diffuse brain injury that is more severe at the surface of the brain,
thought to be due to differences in complex multi-component non-homogeneous tissue interfaces
[12]. Ommaya and Gennarelli go on to suggest that smooth surfaces of the brain would suffer the
least amount of damage while regions where surfaces and interfaces are rough would incur the
most damage [12], which may agree with our observation in Chapter 3 of decreased brain-skull
displacements and possibility of increased shear damage to the brain tissue near the porcine
frontal pole/olfactory bulbs, though this needs to be analyzed more rigorously. If increased brain
damage at the periphery is indeed caused by the obstruction of motion and contact with
surrounding tissue, the converse assumption that increased brain-skull displacements occurring
in regions of smoother cortical surfaces would lead to the hypothesis that increased displacement
of the brain relative to the skull at the superior margin would cause increased stretch to the

92
parasagittal bridging veins at this interface. Rotational injury experiments in rhesus monkeys
found that increasing levels of angular acceleration caused acute subdural hematoma via rupture
of the parasagittal bridging veins, but this observation was also dependent on the impulse
duration and rise time [13]. Thus, it may also be important to investigate bridging vein rupture
extra-axial hemorrhage thresholds as a function of rotational acceleration, rise time, and impulse
duration, rather than velocity.
We found that increasing levels of EAH were associated with increasing amounts of
bridging vein failures up until 10% EAH, after which the distribution of EAH was insensitive to an
increasing number of bridging vein element failures. In this study EAH was measured in terms of
two-dimensional surface areas, from photographs taken after the brains had been immersed in
10% formalin for at least five days [2]. Comparison of the extent of EAH with peak angular
velocities and peak angular acceleration magnitudes (Figure 4.7) reveals increasing EAH with
increasing velocity and acceleration, but these patterns are not strong for either kinematic metric.
A different trend may emerge if EAH was measured volumetrically. Future investigations may
quantify EAH via imaging techniques such as magnetic resonance imaging or computed
tomography to obtain a more descriptive volumetric measure. In addition, as some of the
subdural surface blood may have washed off in the formalin, pictures of superior surface of the
brains before formalin immersion, with skull removed and dura intact, just after sacrifice and
perfusion fixation were investigated for all but one porcine rotational injury for which photographs
were unavailable. Brains were designated positive for subdural hemorrhage when a large, dark,
consolidated mass of blood was visible over the sagittal midline. Neither any of the single low
level nor any cyclic rotation studies were designated as positive for subdural hemorrhage using
this analysis. Of note, the single cyclic study that was designated as positive for EAH (>2% brain
surface coverage) had a small cortical focal bleed lateral to the midline, consistent with the
hypothesis that this may have been caused by insertion of a thermal diffusion probe after injury
(see below). While all high level single rotation studies were designated in Results as positive for
EAH, exceeding our brain surface coverage threshold of >2%, 75% (18 of 24, one subject’s

93
photos were unavailable) of these studies had diffuse subdural hemorrhages just after injury in
this secondary analysis, often spilling away from the sagittal midline into surrounding regions,
while the remaining 25% (6 of 24) of high level single rotations did not have these large
coagulated masses, instead displaying more thin diffuse hemorrhage. This secondary analysis
indicates that subdural hemorrhage often occurred together with our measured extra-axial
hemorrhage in these high level injuries. Furthermore, the presence of these large subdural bleeds
centered on the sagittal midline is consistent with our previous analysis of regional EAH [2], and
also leads to the hypothesis that the bridging veins, draining into the superior sagittal sinus along
the midline, are indeed the cause of these hemorrhages.
Figure 4.7 EAH versus Peak Angular Velocity (left) and EAH vs Peak Angular Acceleration Magnitudes (right) across all studies. The Ncrit development group is represented by blue circles, the validation group is shown with red triangles and the cyclic injuries are represented by black ‘x’s. While EAH appears to increase with both increasing peak angular velocity and increasing peak angular acceleration magnitudes, these patterns are fairly non-specific and could be improved by volumetric measurement of EAH using in vivo imaging methods.
We determined that six failed bridging vein elements best correlated with the presence of
EAH detected after in vivo rotational brain injuries in the neonatal piglet, with both a sensitivity
and specificity of 100% for single rapid sagittal rotations, and a 90% predictive accuracy for cyclic
sagittal rotations. The single false negative produced in cyclic injury finite element simulations
may be confounded by cerebral blood flow measurements conducted on cyclically injured piglets
surviving 24 hours or longer, for which a 2mm hole was created in the skull near the sagittal
suture for insertion of a thermal diffusion probe [4]. It is possible that creation of the hole in the
skull or insertion of the measurement probe may have caused hemorrhage not associated with

94
the cyclic rotational injury. Indeed, we previously calculated EAH scores for four sham animals
that had cerebral blood flow measurements taken without a history of rotational head injury and
found that whole cerebrum EAH percentage scores ranged from 0-5% in these animals [6].
Nonetheless, our critical value of six failed bridging veins performed very well over a
myriad of experimental simulations, and is an improvement over a previous study which used
peak strains experienced by boundary condition connectors, finding 80% sensitivity and 85%
specificity for similar hemorrhage detection thresholds [2]. It is also an improvement, in terms of
predictive power, over another previous study employing a representative pia-arachnoid complex
element boundary condition, which found that cortical principal stresses predicted the occurrence
of EAH with 94% sensitivity and 100% specificity [3]. However, this model was more sensitive to
hemorrhage predictions in the sense that only 1% of a given region was required to be covered in
blood to detect EAH (translating to ~0.08% of the whole brain at minimum), though this small
amount of blood may not be detectable with conventional medical imaging. It is important to note,
however, that we cannot say whether detectable EAH may be associated with an amount of
bridging vein failures between one and five in the presented finite element model, as no
simulations produced these amounts of failed bridging vein elements. Again, we suggest future
investigations of in vivo injuries at peak velocities between the low and high level groups
investigated in this study to further refine the model presented in this study.
Limitations
The presented study includes some limitations. First, finite element model bridging vein
element length was not matched to in vivo lengths, and it is likely that in vivo neonatal porcine
bridging vein lengths are much larger than the initial lengths determined by our choices for
bridging vein elements. While porcine newborn bridging vein test gage lengths in Chapter 2
ranged between approximately 2 and 6mm, porcine newborn finite element model bridging vein
lengths ranged from about 0.4 to 1.4mm. Because the optimized finite element brain-skull
boundary condition determined in Chapter 3 is displacement based, it is possible that longer

95
bridging vein elements subjected to the same displacements as simulated in these models would
not reach their critical failure stretch. In addition, we assume that the bridging veins are taut at the
onset of rotation, while in vivo, there may be a considerable amount of slack in the vessel
between its brain and sinus attachment points, or pull out of the soft brain tissue during an insult.
However, it is also possible that the bridging veins may snag on or be entangled with other
structures between the brain and skull, namely the dura and arachnoid membranes and
arachnoid trabeculae [14], causing smaller gage lengths that require less displacement to cause
rupture. Thus we conclude that while the simulated bridging vein lengths are likely artificially low,
they represent a worst case scenario for rupture incidence. Importantly, this caveat simply
indicates that we may overestimate the total number of failed bridging veins, but does not impact
the validity of our EAH predictions. We assigned our EAH prediction criterion, Ncrit, based on the
number of bridging vein failures predicted by this model, and as such, the critical number of six is
specifically a product of this model. It follows that models employing bridging vein lengths closer
to those observed in vivo may obtain a different Ncrit threshold.
A second limitation is that the finite element model brain-skull boundary condition was
optimized in Chapter 3, at peak angular velocities similar to those in the single low level rotations
in this study, and it is unknown whether brain-skull displacements are rate dependent. As the
material properties of the pia-arachnoid complex have been characterized as rate-dependent in
tension [15], normal traction [16], and shear [17], future sagittal transection studies should
investigate brain-skull displacement at higher loads to ascertain whether this boundary condition
is also rate-dependent, and if so, appropriate rate-dependent boundary conditions should be
employed in future finite element analyses.
A third limitation is that all single rotation studies were performed with neck extension
head rotations, which lead to bridging vein element failures in the posterior cluster at the onset of
accelerative load as the movement of the skull preceded the motion of the posterior-superior
brain surface, and in the anterior cluster just after peak decelerations as the brain continued to
rotate backward after the skull stopped moving. Future studies may investigate neck flexion head

96
rotations to determine how inertial effects may influence the motion of the brain and, in turn, the
location and timing of bridging vein ruptures in this rotational direction within the sagittal plane.
Finally, although secondary analysis of subdural hemorrhage just after sacrifice showed
severe hemorrhage spanning the sagittal midline, it is possible that the observed hemorrhage
may originate from tears or damage in blood vessels other than the bridging veins. Future animal
studies may investigate the presence of ruptured bridging veins after high level loading, perhaps
by injecting dye into the superior sagittal sinus after sacrifice.
Conclusions
In the present study we found that peak angular acceleration magnitudes correlate with
the number of predicted bridging vein failures in a finite element model of neonatal porcine
rotational brain injury, and that a critical number of six bridging vein element failures provide
100% sensitivity and specificity for hemorrhage prediction in single rapid nonimpact head
rotations. This is an improvement over past models that yielded overall sensitivities of 80-94%
and specificities of 85-100% for single rapid nonimpact rotations. In addition, this predictor yielded
90% accuracy for hemorrhage prediction in cyclic head rotations. The findings and threshold
criteria determined in this study will be used in future finite element models of the human infant
head to ascertain the likelihood of EAH given varying injury scenarios. We conclude that finite
element models should include biofidelic representations of the parasagittal bridging veins to
better predict the occurrence of EAH.
References
1. Duhaime, A.C., Christian, C.W., Rorke, L.B., and Zimmerman, R.A., Nonaccidental head
injury in infants--the "shaken-baby syndrome". N Engl J Med, 1998. 338(25): p. 1822-9.
2. Coats, B., Eucker, S.A., Sullivan, S., and Margulies, S.S., Finite element model
predictions of intracranial hemorrhage from non-impact, rapid head rotations in the piglet.
Int J Dev Neurosci, 2012. 30(3): p. 191-200.

97
3. Scott, G.G., Margulies, S.S., and Coats, B., Utilizing multiple scale models to improve
predictions of extra-axial hemorrhage in the immature piglet. Biomech Model
Mechanobiol, 2015.
4. Coats, B., Binenbaum, G., Smith, C., Peiffer, R.L., Christian, C.W., Duhaime, A.C., and
Margulies, S.S., Cyclic Head Rotations Produce Modest Brain Injury in Infant Piglets.
Journal of Neurotrauma, 2016.
5. Eucker, S.A., Smith, C., Ralston, J., Friess, S.H., and Margulies, S.S., Physiological and
histopathological responses following closed rotational head injury depend on direct ion of
head motion. Exp Neurol, 2011. 227(1): p. 79-88.
6. Weeks, D., Sullivan, S., Kilbaugh, T., Smith, C., and Margulies, S.S., Influences of
developmental age on the resolution of diffuse traumatic intracranial hemorrhage and
axonal injury. Journal of Neurotrauma, 2014. 31(2): p. 206-14.
7. Sullivan, S., Eucker, S.A., Gabrieli, D., Bradfield, C., Coats, B., Maltese, M.R., Lee, J.,
Smith, C., and Margulies, S.S., White matter tract-oriented deformation predicts traumatic
axonal brain injury and reveals rotational direction-specific vulnerabilities. Biomech Model
Mechanobiol, 2015. 14(4): p. 877-96.
8. Raghupathi, R. and Margulies, S.S., Traumatic axonal injury after closed head injury in
the neonatal pig. Journal of Neurotrauma, 2002. 19(7): p. 843-53.
9. Prange, M.T. and Margulies, S.S., Regional, directional, and age-dependent properties of
the brain undergoing large deformation. J Biomech Eng, 2002. 124(2): p. 244-52.
10. Han, H., Tao, W., and Zhang, M., The dural entrance of cerebral bridging veins into the
superior sagittal sinus: an anatomical comparison between cadavers and digital
subtraction angiography. Neuroradiology, 2007. 49(2): p. 169-75.
11. Lee, M.C. and Haut, R.C., Insensitivity of tensile failure properties of human bridging
veins to strain rate: implications in biomechanics of subdural hematoma. J Biomech,
1989. 22(6-7): p. 537-42.

98
12. Ommaya, A.K. and Gennarelli, T.A., Cerebral concussion and traumatic
unconsciousness. Correlation of experimental and clinical observations of blunt head
injuries. Brain, 1974. 97(4): p. 633-54.
13. Gennarelli, T.A. and Thibault, L.E., Biomechanics of acute subdural hematoma. J
Trauma, 1982. 22(8): p. 680-6.
14. Yamashima, T. and Friede, R.L., Why do bridging veins rupture into the virtual subdural
space? J Neurol Neurosurg Psychiatry, 1984. 47(2): p. 121-7.
15. Jin, X., Lee, J.B., Leung, L.Y., Zhang, L., Yang, K.H., and King, A.I., Biomechanical
response of the bovine pia-arachnoid complex to tensile loading at varying strain-rates.
Stapp Car Crash J, 2006. 50: p. 637-49.
16. Jin, X., Ma, C., Zhang, L., Yang, K.H., King, A.I., Dong, G., and Zhang, J., Biomechanical
response of the bovine pia-arachnoid complex to normal traction loading at varying strain
rates. Stapp Car Crash J, 2007. 51: p. 115-26.
17. Jin, X., Yang, K.H., and King, A.I., Mechanical properties of bovine pia-arachnoid
complex in shear. J Biomech, 2011. 44(3): p. 467-74.

99
CHAPTER 5: FINITE ELEMENT MODEL PREDICTIONS OF BRIDGING VEIN
RUPTURE RESULTING FROM VIGOROUS SHAKING IN THE HUMAN INFANT
Abstract
For 45 years, there has been substantial scientific and legal debate about whether or not
traumatic brain injury in the infant can result from episodes of vigorous shaking without impact.
Clinically, extra-axial hemorrhage secondary to bridging vein rupture, together with ischemic
injury, and retinal hemorrhages are present in diagnosed cases of abusive head trauma. In this
study, we sought to determine whether rupture of the parasagittal bridging veins may occur as a
result of vigorous shaking without head impact. We measured head kinematics associated with
shaking an instrumented human infant surrogate and included human infant bridging vein
mechanical properties in a computational model of the human infant head to simulate episodes of
vigorous shaking, and predict that, in some instances of shaking, the number of bridging vein
failures exceeded a threshold associated with extra-axial hemorrhage from a porcine model of
traumatic brain injury. Higher angular accelerations increased bridging vein element failures, and
the addition of higher angular velocities further exacerbated bridging vein failures. The data
presented in this study will help inform clinical differential diagnoses of abusive head trauma in
infants.
Introduction
Whether or not vigorous shaking without impact can cause traumatic brain injuries in the
infant is subject to substantial scientific and legal debate [1-8], though the presence of extra-axial
hemorrhage (EAH) is often reported in cases of suspected and diagnosed abusive head trauma
in young children [9-11]. One mechanism of EAH is thought to be the rupture or tearing of the
parasagittal bridging veins, which drain blood from the brain into the superior sagittal sinus,
housed in the falx cerebri, rigidly attached to the inner surface of the skull [12-14]. The
hypothesized mechanism relating bridging vein failure to abusive head trauma is that during rapid

100
head rotations, the movement of the brain lags that of the skull, causing the bridging veins to
rapidly elongate and possibly tear, creating hemorrhage within the subdural space. Because of
the paucity of pediatric bridging vein mechanical properties reported in literature, biofidelic
measurements of head kinematics during shaking episodes, and accurate computational model
portrayals of the infant head, it has been difficult to determine objectively whether or not the head
kinematics associated with vigorous shaking in the infant may be sufficient to produce bridging
vein tears and subsequent EAH.
In this study, we measured head kinematics recorded during shaking of an instrumented
human infant surrogate and included human infant bridging vein mechanical properties in a
computational model of the human infant head to simulate episodes of vigorous shaking without
impact and predict whether the number of bridging vein failures exceeded a threshold associated
with EAH in a porcine model of traumatic brain injury. Our lab has developed increasingly
biofidelic versions of instrumented human infant surrogates to gain insight into the kinematics of
the head during accidental falls and abusive trauma [15-18]. In the present study, we asked ten
volunteers to shake the latest version of our infant surrogate [18] with maximal effort to measure
the kinematics of the human infant head under shaking. These shaking episodes were then used
as loading inputs for a finite element model (FEM) of the human infant head previously developed
in our lab [19]. We modified that FEM to include elements representative of human infant bridging
veins with age and species matched mechanical properties measured in Chapter 2, and as the
human infant brain-skull boundary condition is unknown, we simulated shakes using both axial
and sagittal plane equivalent boundary condition stiffnesses as determined in our porcine model
(Chapter 3, Coats et al [20]) to provide an injury possibility corridor in the human infant. The
number of bridging vein element failures resulting from the finite element model simulations of
shaking was then compared with the threshold of bridging vein element failures that best
correlated with the presence of EAH in pathology investigations after in vivo newborn porcine
brain injuries, determined in Chapter 4, to predict whether bridging veins rupture in sufficient
numbers to produce EAH during vigorous shaking without impact in the human infant. These
101
studies will provide objective biomechanical data to inform clinical diagnoses of abusive head
trauma.
Methods
Construction of an Instrumented Human Infant Anthropomorphic Surrogate
In order to estimate the kinematics of the infant head under shaking type insults,
volunteers were asked to shake an instrumented 1.5 month old human infant surrogate (Figure
5.1), previously developed in our lab [15-18]. The most recent edition of our surrogate was used
[18], with a total head and body mass of 4.4 kg, and head mass of 1 kg, yielding a head-to-body
mass ratio of 0.23, comparable to ratios based on measurements reported by Duhaime et al for
one month old infants [15].
The surrogate also included biofidelic skull, suture, and neck properties. Specifically, the
tensile and bending properties of the surrogate neck [18] were matched on corresponding
property measurements of infant cadaveric osteoligamentous cervical spine by Luck et al
(tension) [21] and Luck (bending) [22]. The surrogate neck was constructed from a 2.54 cm
diameter cylindrical mold of Ecoflex 00-30 super soft silicone rubber (SmoothOn) with a piece of
Chemical Resistant clear Tygon tubing (McMaster-Carr, 1.6mm inner diameter, 4.8mm outer
diameter, 75A durometer rating) embedded along the central axis. The rubber cylinder was then
potted into two 3.8cm diameter plastic pipe fittings with plaster, and three sets of two neoprene
rubber bands (McMaster-Carr, 0.8mm thick, 8mm wide, 50A durometer rating) were attached on
the ventrolateral surface of the neck to provide increased resistance to bending in extension. The
flexible length of the neck was approximately 3-4 cm, and the Tygon tubing governed tensile
response while the silicone rubber allowed bending in all three rotational directions.
A metal plate extended from the top of the neck to the center of the surrogate head for
rigid fixation of a tri-axial angular velocity transducer (ARS-06 Triaxial unit, Applied Technology
Associates, Albuquerque, NM). The tri-axial angular velocity transducer allowed for
measurements of sagittal, axial and coronal plane angular velocities. The surrounding head

102
volume was filled with a linear viscoelastic dielectric gel (Sylgard 527 A&B Silicone Dielectric Gel,
Dow Corning, 1:1 A to B mix ratio), to approximate the response of human infant brain tissue. The
gel has a shear modulus of 765±44Pa [23, 24], while human infant brain tissue is estimated to
have a shear modulus of 559 Pa, approximated by scaling the properties of human adult brain by
the adult-to-infant shear modulus ratio reported for porcine tissue previously [19, 25]. Additional
details on surrogate anthropometry and material properties are presented in Sullivan et al [18]
and Coats and Margulies [17].
Figure 5.1 Instrumented human surrogate (left), and surrogate neck and angular rate sensor mounting plate assembly (right)
Measurement and Analysis of Head Shaking Kinematics
Ten adult volunteers were asked to shake the 1.5 month old infant surrogate. The
volunteer pool was made up of five males and five females, ranging in age from 17 to 40 years
103
old (averaging 26.5±7.7 years), and ranging in weight from 56 to 93 kg (averaging 73.9±12.1 kg).
In order to estimate naïve and worst-case kinematics resulting from episodes of vigorous shaking,
each volunteer shook the surrogate twice, each with a different set of instructions. First,
volunteers were simply told to shake the surrogate with maximal effort and without impact. In a
second trial, volunteers were asked to shake the surrogate with maximal effort and without impact
again, but with an additional goal of ensuring complete flexion and extension of the neck during
shaking. In all cases, angular velocity was measured at a sampling rate of 7,500 Hz, and 10
shakes were recorded and analyzed in each trial.
While the rotation of the surrogate neck was not constrained to a single plane, only the
angular velocity associated with sagittal plane rotations was extracted for further analysis,
allowing direct comparison with previous studies [15, 16, 26], which only investigated sagittal
plane motion during shaking. Based on power spectral density analysis, angular velocity-time
histories were filtered at 40 Hz, with a low-pass second-order Butterworth filter. Angular velocity-
time histories were differentiated using the forward difference method to find angular acceleration.
The cycling frequency, peak-to-peak angular velocities, and peak acceleration magnitudes, were
extracted from each shaking trace using the same methods as presented for porcine cyclic
studies in Chapter 4. For each shaking sequence, average frequency, average peak-to-peak
angular velocity, maximum peak-to-peak angular velocity, average peak angular acceleration
magnitude, and maximum peak angular acceleration magnitude, were recorded and compared
between the first and second shaking trials using a series of paired t-tests.
Human Infant Finite Element Model Development
A finite element model of the human infant head previously developed in our lab [19] was
modified to include bridging vein elements with human infant properties and behavior measured
in Chapter 2, and a linear elastic connector brain-skull boundary condition, approximated with
both the optimized newborn porcine sagittal plane brain-skull boundary condition determined in
Chapter 3, and the previously determined porcine newborn axial plane brain-skull boundary

104
condition, in separate simulations. This model (Figure 5.2) included 11,067 4-node linear
tetrahedral brain elements, 12,726 6-node triangular or 8-node tetrahedral continuum shell skull
elements, and 2,485 3-node triangle or 4-node quadrilateral membrane suture elements. The
brain was defined as a nonlinear, homogeneous, isotropic hyperelastic material, using the first-
order Ogden strain energy density function, as described in Chapter 3, with a shear modulus of
559 Pa as estimated by Coats et al [19] based on published adult values scaled using the ratio
between adult and newborn porcine brain shear moduli reported by Prange and Margulies [25].
Viscoelastic response was defined using the two-term Prony series function, again described in
Chapter 3, with relaxation moduli and time constants estimated as those reported for neonatal
porcine tissue as measured by Prange and Margulies [25]. Poisson’s ratio for brain was defined
as 0.4999 according to Coats et al [19]. Suture was defined as a linear elastic material with an
elastic modulus of 8.1MPa as measured by Coats and Margulies [27], and density estimated as
that of human adult dura [28]. While in past studies using this finite element model, measured
material properties were used to define the human infant skull, because no impact was
associated with these shaking simulations, we elected to define the skull as a rigid body. This
simplification greatly reduced the long computational run time associated with the increased time
course of these shaking simulations compared with past impact simulations. All material
properties are listed in Table 5.1.

105
Figure 5.2 Human Infant Finite Element Model. The brain (blue) is pictured on the left, and the skull (red) and suture (yellow) are pictured on the right.
Table 5.1 Material Properties used in the Human Infant Finite Element Model
Tissue Material Property Source Brain μ0 = 559 Pa Coats et al, 2007 [19] α = 0.01 Prange and Margulies, 2002 [25] C1 = 0.3322 Prange and Margulies, 2002 [25] C2 = 0.3890 Prange and Margulies, 2002 [25] τ1 = 2.9572 s Prange and Margulies, 2002 [25] τ2 = 0.1813 s Prange and Margulies, 2002 [25] ρ = 1.04 g/cm3 Coats et al, 2007 [19] ν = 0.4999 Coats et al 2007 [19] Suture ρ = 1.13 g/cm3 Galford and McElhaney, 1970 [28] E = 8.1 MPa Coats and Margulies, 2006 [27] ν = 0.49 Coats et al, 2007 [19] General Brain-Skull Connectors
ksag =902.5 N/m N/A kax=67,686 N/m N/A
The brain-skull boundary condition was defined in a manner similar to those in Chapters
3 and 4 for porcine finite element models, using linear elastic connector elements linking each
brain surface node to the nearest node on the inner surface of the skull. The human finite element
model included 735 nodes on the outer surface of the brain, and again, 22 of these nodes were
reserved for bridging vein elements, yielding 713 linear elastic connector elements to define the
boundary condition between the brain and skull. To approximate the sagittal plane brain-skull

106
displacement response measured in the newborn pig in Chapter 3 and the previously determined
axial plane newborn pig brain-skull boundary condition, the general connectors were
approximated as springs in parallel. The number of general connector nodes in the porcine model
in Chapter 4 (2,658) was divided over the surface area of the modeled porcine brain (7,470
mm2), then multiplied by the surface area of the modeled human brain (39,198 mm2), to
determine the number of connector elements required in the human model (13,948) to match the
porcine model boundary condition. Because only 713 brain surface nodes were available, the
general connector stiffness was scaled linearly such that the effective stiffness of all general
connectors would match the boundary conditions determined for the newborn pig. Multiplying the
number of nodes required to match the porcine boundary condition (13,948) by the sagittal plane
optimized porcine general connector stiffness (46.133 N/m) and axial plane general connector
stiffness (3,460 N/m) to obtain effective stiffness values, and then dividing by the available
general connector nodes in the human model (713) yielded human model general connector
stiffnesses of 902.5 N/m to match the porcine infant sagittal boundary condition and 67,686 N/m
to match the axial boundary condition.
Bridging vein elements were assigned using similar methods as those described in
Chapters 3 and 4, but because the human model does not include a falx, the anterior-posterior
arc length of the brain on the superior surface was measured along the midline from the most
anterior point to the most posterior point. The length was split into four segments, from anterior to
posterior the first segments were 20% of the entire length and the last two were 30% of the entire
length, and the first and third segments were designated as tributary for bridging veins according
to the distribution of bridging veins observed in human adults [29]. Brain nodes just lateral to the
midline within the anterior-posterior first and third segment lengths were identified as potential
bridging vein attachment points, and chosen such that right and left side bridging veins were
evenly distributed along the length of both segments. Again, five bridging veins per side were
selected in the first segment, and six bridging veins per side were selected in the third segment,
for a total of 22 bridging veins, according to the average number and distribution of bridging veins

107
in the human adult [29]. The resulting length of the bridging vein elements ranged from 0.7-
1.9mm, which, similar to the porcine model in Chapter 4, are smaller than the experimental gage
lengths of the human infant bridging veins tested in Chapter 2 (2.7-6.5mm), and unknown
additional length was secured in the apparatus grips. Thus we conclude that the bridging vein
element lengths in this model are underestimations of in vivo length and as such this model will
likely overestimate the occurrence of bridging vein rupture. Bridging vein force-displacement
behavior was defined using an average human infant post-cyclic stress-stretch curve based on
measurements from Chapter 2 and processed according to the methods outlined in Chapter 3.
To match porcine finite element model conditions from Chapters 4, bridging vein failure criterion
was defined as the average human infant high rate ultimate stretch.
Finite Element Model Simulations of Vigorous Shaking in the Human Infant
Because increased amounts of bridging vein failure were associated with higher peak
accelerations in the porcine finite element model in Chapter 4, we sought to simulate an array of
peak accelerations in the human infant finite element model. Measured kinematics from the infant
surrogate shaking studies were examined to choose which shaking episodes to simulate in the
finite element model. Initially, two studies were selected, one with consistent low angular
accelerations and angular velocities, and a second with consistent high accelerations and
velocities. No infant surrogate shakes produced instances of mismatched low velocity and high
acceleration. Thus, to determine whether high angular accelerations without the presence of high
angular velocities were responsible for bridging vein failure, the low angular velocity-low angular
acceleration trace was modified such that peak accelerations were similar to those observed in
the high velocity-high acceleration trace, but peak velocities and angular excursion were
preserved. This was accomplished by reducing the time over which peak angular accelerations
were endured, and increasing the time spent at peak angular velocities to match angular
excursion between the original low velocity-low acceleration trace and this fabricated low velocity-
high acceleration trace. Because higher angular velocities and accelerations tended to occur in
108
shaking episodes in which the surrogate neck sustained considerable damage (Table 5.2), a
fourth shaking episode was chosen for simulation in which angular accelerations and velocities
were relatively high, but no neck damage was noted. Three consistent cycles along the time
history of the chosen shaking events were simulated, with exception of the last shaking event
(high velocity, high acceleration, no neck damage) in which four cycles were simulated in order to
capture two occurrences of particularly high acceleration. Finally, the sagittal plane porcine cyclic
injury trace with the largest peak-to-peak angular velocities and peak angular acceleration
magnitudes (subject 091105; 4C, Chapter 4) was examined in the human infant finite element
model to confirm the absence of hemorrhagic injury at this load level. Peak-to-peak angular
velocities (averaging 28.2±0.1 rad/s) and peak angular acceleration magnitudes (averaging
913±289 rad/s2) were scaled from the porcine brain mass in the chosen cyclic study (42.06 g) to
the approximate mass of the human infant brain (500 g) using conventional mass scaling
methods [30], and an idealized trace was created employing these scaled values (peak-to-peak
angular velocities of 12.4±0.1 rad/s, peak angular acceleration magnitudes of 175±56 rad/s2) for
simulation in the human infant finite element model. Simulated angular velocity and angular
acceleration cycles with respect to their entire shaking trace are shown in Figures 5.3-5.7 (with
exception of the fabricated low angular velocity – high angular acceleration trace shown in Figure
5.5, and the trace scaled from the porcine in vivo shaking study in Figure 5.7, which have no
respective full shaking histories), with all surrogate shakes presented in Appendix H. Each of the
selected velocity loading traces were simulated twice: once with the effective sagittal plane
boundary condition stiffness, and again with the effective axial plane boundary condition stiffness.

109
Figure 5.3 High angular velocity – high angular acceleration surrogate shaking episode kinematics. Entire angular velocity (A) and acceleration (C) traces, and corresponding cropped angular velocities (B) and angular accelerations (D) for finite element analysis.

110
Figure 5.4 Low angular velocity – low angular acceleration surrogate shaking episode kinematics. Entire angular velocity (A) and acceleration (C) traces, and corresponding cropped angular velocities (B) and angular accelerations (D) for finite element analysis.

111
Figure 5.5 Fabricated low angular velocity – high angular acceleration surrogate shaking episode finite element model simulated kinematics. Simulated angular velocity (A) and acceleration (B) traces. Velocity limits and excursion match the low angular velocity – low angular acceleration shake shown in Figure 5.4, while the time course of accelerative portions of the curve was shortened to produce angular accelerations similar to high acceleration episodes show in Figures 5.3 and 5.6.

112
Figure 5.6 High angular velocity – high angular acceleration surrogate shaking episode without neck damage kinematics. Entire angular velocity (A) and acceleration (C) traces, and corresponding cropped angular velocities (B) and angular accelerations (D) for finite element analysis.

113
Figure 5.7 Idealized curve mass-scaled from porcine cyclic injury (091105; 4C, Chapter 4) peak angular velocity and acceleration values to human infant. Simulated angular velocity-time history (A) and angular acceleration-time history (B).
The selected cropped angular velocity-time histories were used as inputs for finite
element simulation, with a center of rotation 2.8 cm below the center of the foramen magnum,
estimated by linearly interpolating between reported lengths of a 24 week old and 5 month old
cervical spine to 1.5 months [22], and then approximating the location of C4-C5 by assuming
equal height all cervical vertebrae and multiplying by 4/7. While several studies indicate that the
center of rotation of the cervical spine is much higher in young children, near C2-C3 [31, 32], we
chose to place the center of rotation in our model lower in the neck so as to create a longer
moment arm, corresponding to a worst-case scenario for dynamic injury. All simulations were
conducted in ABAQUS Explicit version 6.11 (Simulia, Providence, RI) with double precision.
The number of failed bridging veins occurring in each simulation were extracted.
Previously, we determined a threshold (Ncrit) for detectable EAH (≥2% of porcine cerebrum blood
surface coverage) to be six failed bridging vein elements in Chapter 4. We designated any
human infant finite element simulations in which at least six bridging vein elements had failed as
predictive of extra-axial hemorrhage.

114
Results
Head Shaking Kinematics Measured from a Human Infant Anthropomorphic Surrogate
All kinematic measurements across subject and shaking trial are presented in Table 5.2.
Average shake frequency was significantly lower in the second shaking trial compared to the first
shaking trial, with the second trial average frequencies approximately half those of the first trial. In
contrast, average peak to peak angular velocity, and maximum peak angular acceleration
magnitude were significantly higher in the second shaking trials than the first shaking trials. While
average peak angular acceleration magnitude was also higher in the second shaking trials than
the first, this observation was not statistically significant, though it is a considerable trend
(p=0.0798). Overall, the second trial resulted in approximately 22% higher average peak to peak
angular velocities, 24% higher average peak acceleration magnitudes, and 20% higher maximum
peak acceleration magnitudes than the first trial. Interestingly, maximum peak to peak angular
velocity did not differ between trials.
Of note, all but one of the second trial shaking episodes produced damage to the
surrogate neck, and seven of the ten first trial shaking episodes also produced damage to the
surrogate neck, quantified by the number of broken ventrolateral rubber bands in each trial (Table
5.2).
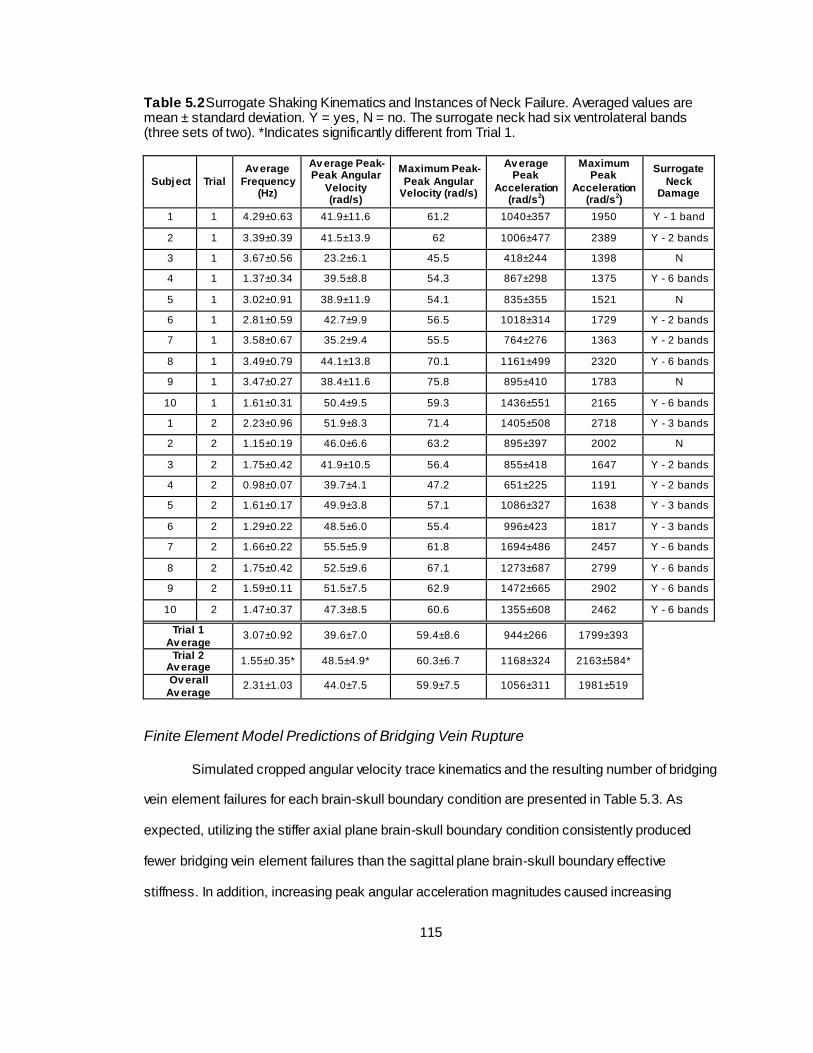
115
Table 5.2 Surrogate Shaking Kinematics and Instances of Neck Failure. Averaged values are mean ± standard deviation. Y = yes, N = no. The surrogate neck had six ventrolateral bands (three sets of two). *Indicates significantly different from Trial 1.
Subject Trial
Av erage
Frequency (Hz)
Av erage Peak-Peak Angular
Velocity (rad/s)
Maximum Peak-
Peak Angular Velocity (rad/s)
Av erage Peak
Acceleration (rad/s
2)
Maximum Peak
Acceleration (rad/s
2)
Surrogate
Neck Damage
1 1 4.29±0.63 41.9±11.6 61.2 1040±357 1950 Y - 1 band
2 1 3.39±0.39 41.5±13.9 62 1006±477 2389 Y - 2 bands
3 1 3.67±0.56 23.2±6.1 45.5 418±244 1398 N
4 1 1.37±0.34 39.5±8.8 54.3 867±298 1375 Y - 6 bands
5 1 3.02±0.91 38.9±11.9 54.1 835±355 1521 N
6 1 2.81±0.59 42.7±9.9 56.5 1018±314 1729 Y - 2 bands
7 1 3.58±0.67 35.2±9.4 55.5 764±276 1363 Y - 2 bands
8 1 3.49±0.79 44.1±13.8 70.1 1161±499 2320 Y - 6 bands
9 1 3.47±0.27 38.4±11.6 75.8 895±410 1783 N
10 1 1.61±0.31 50.4±9.5 59.3 1436±551 2165 Y - 6 bands
1 2 2.23±0.96 51.9±8.3 71.4 1405±508 2718 Y - 3 bands
2 2 1.15±0.19 46.0±6.6 63.2 895±397 2002 N
3 2 1.75±0.42 41.9±10.5 56.4 855±418 1647 Y - 2 bands
4 2 0.98±0.07 39.7±4.1 47.2 651±225 1191 Y - 2 bands
5 2 1.61±0.17 49.9±3.8 57.1 1086±327 1638 Y - 3 bands
6 2 1.29±0.22 48.5±6.0 55.4 996±423 1817 Y - 3 bands
7 2 1.66±0.22 55.5±5.9 61.8 1694±486 2457 Y - 6 bands
8 2 1.75±0.42 52.5±9.6 67.1 1273±687 2799 Y - 6 bands
9 2 1.59±0.11 51.5±7.5 62.9 1472±665 2902 Y - 6 bands
10 2 1.47±0.37 47.3±8.5 60.6 1355±608 2462 Y - 6 bands
Trial 1
Av erage 3.07±0.92 39.6±7.0 59.4±8.6 944±266 1799±393
Trial 2 Av erage
1.55±0.35* 48.5±4.9* 60.3±6.7 1168±324 2163±584*
Ov erall
Av erage 2.31±1.03 44.0±7.5 59.9±7.5 1056±311 1981±519
Finite Element Model Predictions of Bridging Vein Rupture
Simulated cropped angular velocity trace kinematics and the resulting number of bridging
vein element failures for each brain-skull boundary condition are presented in Table 5.3. As
expected, utilizing the stiffer axial plane brain-skull boundary condition consistently produced
fewer bridging vein element failures than the sagittal plane brain-skull boundary effective
stiffness. In addition, increasing peak angular acceleration magnitudes caused increasing
116
numbers of bridging vein element failures. In context of the threshold of bridging vein element
failures associated with the presence of EAH (≥ 2% coverage over the surface of the cerebrum)
in our newborn porcine model presented in Chapter 4 (Ncrit=6), we would expect EAH in the
human infant for the high velocity- high acceleration, fabricated low velocity-high acceleration,
and high velocity-high acceleration without neck damage shakes, regardless of the choice of
boundary condition. As anticipated, we would not expect hemorrhage in the newborn porcine
cyclic injury trace scaled to the mass of the human infant using either boundary condition. For the
low velocity-low acceleration shaking simulation, 20 bridging vein element failures occurred with
the sagittal boundary condition indicative of hemorrhage, while only 3 occurred when the axial
boundary condition was employed suggesting an absence of hemorrhage, and thus, prediction of
EAH is uncertain for this low velocity-low acceleration shaking condition.
When bridging vein failures occur, temporally, they do so near points of peak
acceleration, which occur at points of rotational direction changes in these cyclic shaking angular
velocity time histories (Figure 5.8, example; all simulations shown in Appendix I), either as the
motion of the brain impacts the inside of the skull just before a change in direction, or as the
motion of the skull begins to lead the brain again after a direction change.

117
Figure 5.8 Example finite element model simulated angular velocity, angular acceleration and resulting bridging vein element failures over time

118
Tab
le 5
.3 K
inem
atics
of cro
pped s
imula
ted s
haki
ng tra
ces a
nd resulti
ng n
um
ber of bridgin
g v
ein
failu
res
Te
st D
esc
rip
tio
nS
ub
ject
Tri
al
Nu
mb
er
of
Cycle
s
Sim
ula
ted
Ave
rag
e
Fre
qu
en
cy
(Hz)
Ave
rag
e P
ea
k-
Pe
ak A
ng
ula
r
Ve
locit
y (
rad
/s)
Ma
xim
um
Pe
ak-
Pe
ak A
ng
ula
r
Ve
locit
y (
rad
/s)
Ave
rag
e P
ea
k
Acce
lera
tio
n
(ra
d/s
2)
Ma
xim
um
Pe
ak
Acce
lera
tio
n
(ra
d/s
2)
Bra
in-S
ku
ll
Bo
un
da
ry
Co
nd
itio
n
Nfa
il
Sagitta
l22
Axia
l21
Sagitta
l20
Axia
l3
Sagitta
l22
Axia
l21
Sagitta
l20
Axia
l17
Sagitta
l5
Axia
l0
12.5
175±56
40.2
±22.5
63.2
1178±438
220
Idealiz
ed,
Mass-S
cale
d fro
m
Porc
ine C
yclic
N/A
N/A
32.7
9±0.1
812.4
±0.1
Hig
h V
elo
city -
Hig
h
Accele
ration,
No N
eck D
am
age
22
2002
22.6
±1.5
24.3
2250±559
2875
41.3
3±0.0
6
375±94
481
Fabricate
d L
ow
Velo
city -
Hig
h
Accele
ration
31
36.1
8±1.7
2
61.8
2069±417
2456
Low
Velo
city -
Low
Accele
ration
31
34.0
4±1.0
722.6
±1.5
24.3
Hig
h V
elo
city -
Hig
h
Accele
ration
72
31.6
4±0.0
458.7
±2.7

119
Discussion
In this study, we measured kinematics of the infant head during vigorous shaking with an
instrumented surrogate, and simulated episodes of vigorous shaking in a finite element model of
the human infant head. We found that kinematic metrics differed between shakes in which
volunteers were asked to shake with maximal effort and shakes in which volunteers were
instructed to shake with maximal effort while also ensuring complete flexion and extension of the
neck. In addition, regardless of which instructions were given, damage to the surrogate neck was
often produced during shaking. When episodes of shaking were simulated in the finite element
model, high angular accelerations produced multiple bridging vein failures, above a threshold
associated with extra-axial hemorrhage in a porcine finite element model validated with in vivo
injury pathology. These data will deepen our mechanistic understanding of brain injuries in infants
resulting from abusive trauma.
Our finding of significantly decreased average frequency when maximum range of motion
was used in instrumented surrogate shakes, is likely attributable to the longer amount of time
required to achieve maximum flexion and extension. The modestly higher average peak angular
acceleration magnitudes and significantly higher maximum peak angular acceleration magnitudes
in maximal range of motion shakes may be due to the increased effort required to produce
complete flexion and extension of the flexible surrogate neck, which could not support the weight
of the surrogate head. The higher average peak to peak angular velocities observed when
maximal range of motion was achieved are likely a consequence of the higher angular
accelerations and lower shaking frequencies (yielding a longer average duration of each shake).
These findings may be confounded by the fact that the maximal range of motion shaking trials
were always conducted after the shaking trials where maximal range of motion was not specified,
but it is unlikely that volunteers were acclimated to shaking the surrogate and shook more
efficiently after a single trial.
The average peak to peak angular velocities, average peak angular acceleration
magnitudes, and average shaking frequencies observed in our study (44.0±7.5 rad/s, 1056±311

120
rad/s2, and 2.31±1.03 Hz, respectively) are similar to those observed in a few anecdotal trials
used to benchmark metrics for the cyclic porcine in vivo brain injuries (47.12±13.96
rad/s,1512±1295 rad/s2, and 2.19±0.49 Hz, respectively) [33], simulated in Chapter 4. The same
measures are lower than the respective kinematics measured in a previous version of the
surrogate employing a hinge neck (61±9.6 rad/s, 3480±2467 rad/s2, and 3.08±1.00 Hz,
respectively) [16, 33]. The finding of lower average peak to peak angular velocities, average peak
angular acceleration magnitudes, and average shaking frequencies with the flexible neck in this
study, compared to the previous hinge neck correlates well with two studies investigating hinge
and flexible rubber necks [15, 26]. Indeed, our latest edition instrumented infant surrogate with a
more biofidelic neck has yielded significantly different kinematic responses in simulated falls than
previous versions, with decreased impact force and peak angular accelerations, lowering
estimated injury risk [18]. While we cannot conclude that the observation of surrogate neck
damage in the majority of all shaking trials (Table 5.2) is indicative of neck injury, recent clinical
investigations of abusive head trauma are increasingly reporting the presence of neck injury in
addition to the classic head injury presentations, even in the absence of other obvious external
injuries [34-37]. While the surrogate neck is state of the art with properties matched to those
measured in mechanical testing of the infant cervical spine, there are several shortcomings, such
that the observed damage may have confounded head kinematic measurements, as discussed
below in the Limitations section.
Because the properties of the brain-skull interface in the human infant are unknown, we
hypothesized that they are likely stronger than those in the newborn pig, as we found that human
infant bridging veins are significantly stronger than porcine in Chapter 2. Thus, we tested both
the sagittal plane boundary condition and the much stiffer axial plane boundary condition
determined for the newborn pig in our human infant finite element model, in an at tempt to define
an injury corridor. The number of bridging vein element failures in simulations employing the
sagittal plane boundary condition was consistently higher than those using the axial plane
boundary condition, but these differences only affected EAH prediction in the low velocity-low

121
acceleration surrogate shaking trace (sagittal Nfail=20, axial Nfail=3). We found that shaking
episodes involving high angular accelerations produced multiple bridging vein element failures,
greater than our threshold for the number of bridging vein element failures best correlating with
the presence of extra-axial hemorrhage (Ncrit=6) determined in the newborn pig in Chapter 4,
regardless of which brain-skull boundary condition was used. Indeed our observation of bridging
vein element failures associated with simulations of vigorous shaking agrees with a two previous
studies that found finite element model brain-skull displacement during a representative shaking
simulation was sufficient to cause bridging vein rupture [38, 39]. As expected, simulating an
idealized porcine cyclic injury trace with angular velocity and acceleration mass-scaled to the
human infant brain did not produce sufficient bridging vein failures for association with EAH
(sagittal boundary condition Nfail=5, axial boundary condition Nfail=0), which matches the results of
the porcine in vivo injury and finite element model in Chapter 4. Accurate brain-skull interface
properties may improve these measurements, but the availability of cadavers for measurement of
the mechanical properties of the human infant brain-skull interface and ethics surrounding such
studies likely prohibit collection of these data. Regardless, taken together, the presented data
indicate that, under certain circumstances, vigorous inflicted shaking without impact may produce
bridging vein ruptures and associated extra-axial hemorrhage in the human infant.
Limitations
Although comprehensive compared to the current literature, this study presents several
limitations. First, while the instrumented infant surrogate used in this study has improved neck
biofidelity compared to previous versions, the mechanical properties of the neck were validated
quasistatically [18], and may not be representative of human properties at higher rates. The
surrogate neck also lacks a hard bony structure representative of the cervical vertebrae. Coupled
together, these two idealizations may have affected shaking kinematics as the head moves back
and forth rapidly, allowing motion outside of what can be expected anatomically. Future iterations

122
of the infant surrogate may investigate the inclusion of a hard skeletal structure representative of
the vertebral column, or a neck with dynamic tension and bending properties, as available.
A second limitation of this study is that during surrogate shaking studies, only the
rotational motion of the head was captured, but volunteers likely also rotated the torso of the
surrogate in order to produce the back-and-forth motion of the head in the sagittal plane. As the
rotational motion of the torso was not accounted for, it may have confounded the sagittal
rotational head kinematics, and the angular velocity time histories used as inputs for finite
element model analyses may have over- or underestimated the actual velocity of the head
relative to the torso, but probably overestimated the angular excursion of the head relative to the
torso. Thus, using the global rotational motion of the head likely errs on the side of worst -case
scenario measurements, consistent with this study. Future examinations should include motion
capture of the surrogate torso to determine more precisely the relative angular motion of the head
relative to the body.
A third limitation is that no mesh convergence study was performed on the human finite
element model brain. As we specified the brain-skull boundary condition according to measured
displacements from Chapter 3, we believe any differences in finite element model bridging vein
element elongation between the current brain and a brain with optimized mesh would be minimal.
Nonetheless, as the motion of the brain plays an important role in dictating the elongation of the
bridging veins future studies should ensure that an appropriate brain mesh resolution is used.
A fourth limitation is that the human infant finite element model does not include
geometry and elements representative of the falx. While the motion of the brain in purely sagittal
plane rotations, like those simulated in these studies, was unlikely to be affected by the absence
of a falx, this model may be improper for rotations in other directions or off-axis loading, in which
the falx may restrict the motion of one or both hemispheres. Incorporation of geometry and
elements representative of the falx and other membranous structures (e.g. tentorium) is
suggested for future simulations investigating hemorrhage and other brain injuries including
motion that is not purely sagittal.

123
As an important caveat, we are likely overestimating bridging vein element failures due to
several assumptions and limitations. First, we assumed that the bridging veins are taut between
the brain and skull, while instead there may some slack length between their brain and sinus
attachment points. In addition, as explained previously, the human infant bridging vein element
lengths were shorter than documented excised lengths. As the brain-skull boundary condition
adapted from that measured in Chapter 3 for the newborn piglet was a displacement based
metric, it is possible that an underestimation of bridging vein element lengths caused an
overestimation of bridging vein failures. On the other hand, the interaction of the bridging veins
with surrounding tissue in the subdural space is not well documented. It is possible that the
bridging veins may snag or become entangled with surrounding t issue, namely the arachnoid
trabeculae and the dura and arachnoid membranes [14], resulting in shorter gage lengths that
require less relative displacement between the brain and skull to cause rupture. In addition, we
did not control bridging vein orientation for angle of entry into the superior sagittal sinus
(attachment to the skull in this model). In the human adult, an imaging study found that nearly all
of the bridging veins entering the sinus in the posterior cluster attached at acute angles against
the direction of blood flow in the sinus, while attachment angles in the anterior cluster were more
variable, with about 20% attaching in the direction of blood flow in the sinus, 40% at right angles,
and the remaining 40% at angles against the direction of blood flow in the sinus *cite Han*. The
angle of bridging vein attachment to the superior sagittal sinus may influence occurrence of and
time point at which bridging veins may fail due to the inertial motion of the brain relative to the
skull. Future modeling efforts should correct for entrance angle in addition to bridging vein length
for more accurate predictions of bridging vein rupture. Finally, we modeled bridging veins
assuming rigid connection points at the brain and skull, and the interaction of the bridging veins
with the dura and brain is unknown. We hypothesize that, especially with the soft brain tissue, the
bridging veins may pull out at their attachment points, without immediately incurring mechanical
loads, as the brain moves relative to the skull. This may yield an increased gage length between
the brain and dura, which could in turn protect against stretch-related rupture. Regardless, our

124
estimations rely on assumptions of worst-case scenarios for bridging vein rupture, and the
likelihood of an observation of extra-axial hemorrhage is based on the number of failed bridging
veins that best predicted hemorrhage in our porcine model in Chapter 4, which included similar
limitations.
Conclusions
In summary, we measured head kinematics during episodes of vigorous shaking using an
instrumented 1.5 month old infant surrogate, and found that employing the entire range of motion
of the neck yielded higher angular velocities and angular accelerations compared with
unspecified excursions. We simulated five shaking episodes with a range of angular velocity and
acceleration combinations in a finite element model of the human infant head with two brain-skull
boundary conditions, and found that high angular accelerations yielded multiple bridging vein
element failures, above a threshold level associated with extra-axial hemorrhage in a newborn
porcine finite element model validated with in vivo injury extra-axial hemorrhage pathology in
Chapter 4. Thus, we conclude, that under certain circumstances, it may be possible to produce
bridging vein ruptures and subsequent extra-axial hemorrhage in the human infant from a shaking
insult without impact. This data may be used to inform clinical differential diagnoses of abusive
head trauma in infants.
References
1. Rorke-Adams, L.B., The triad of retinal haemorrhage, subdural haemorrhage and
encephalopathy in an infant unassociated with evidence of physical injury is not the result
of shak ing, but is most likely to have been caused by a natural disease: No. J Prim
Health Care, 2011. 3(2): p. 161-3.
2. Squier, W., The triad of retinal haemorrhage, subdural haemorrhage and encephalopathy
in an infant unassociated with evidence of physical injury is not the result of shaking, but
125
is most likely to have been caused by a natural disease: Yes. J Prim Health Care, 2011.
3(2): p. 159-61.
3. Duhaime, A.C., Christian, C.W., Rorke, L.B., and Zimmerman, R.A., Nonaccidental head
injury in infants--the "shaken-baby syndrome". N Engl J Med, 1998. 338(25): p. 1822-9.
4. Nadarasa, J., Deck, C., Meyer, F., Willinger, R., and Raul, J.S., Update on injury
mechanisms in abusive head trauma--shaken baby syndrome. Pediatr Radiol, 2014. 44
Suppl 4: p. S565-70.
5. Jaspan, T., Current controversies in the interpretation of non-accidental head injury.
Pediatr Radiol, 2008. 38 Suppl 3: p. S378-87.
6. Strouse, P.J., Child abuse: we have problems. Pediatr Radiol, 2016. 46(5): p. 587-90.
7. Moreno, J.L. and Holmgren, B., The Supreme Court Screws Up the Science: There is No
Abusive Head Trauma/Shaken Baby Syndrome "Scientific" Controversy. Utah Law
Review, 2013. 2013(5): p. 1357-1435.
8. Findley, K.A., Barnes, P.D., Moran, D.A., and Squier, W., Shaken Baby Syndrome,
Abusive Head Trauma, and Actual Innocence: Getting it Right. Houston Journal of Health
Law & Policy, 2012. 12: p. 209-312.
9. Duhaime, A.C., Alario, A.J., Lewander, W.J., Schut, L., Sutton, L.N., Seidl, T.S.,
Nudelman, S., Budenz, D., Hertle, R., Tsiaras, W., and et al., Head injury in very young
children: mechanisms, injury types, and ophthalmologic findings in 100 hospitalized
patients younger than 2 years of age. Pediatrics, 1992. 90(2 Pt 1): p. 179-85.
10. Ewing-Cobbs, L., Kramer, L., Prasad, M., Canales, D.N., Louis, P.T., Fletcher, J.M.,
Vollero, H., Landry, S.H., and Cheung, K., Neuroimaging, physical, and developmental
findings after inflicted and noninflicted traumatic brain injury in young children. Pediatrics,
1998. 102(2 Pt 1): p. 300-7.
11. Billmire, M. and Myers, P., Serious head injury in infants: accident or abuse? Pediatrics,
1985. 75(2): p. 340-2.

126
12. Guthkelch, A.N., Infantile subdural haematoma and its relationship to whiplash injuries.
Br Med J, 1971. 2(5759): p. 430-1.
13. Caffey, J., The whiplash shaken infant syndrome: manual shaking by the extremities with
whiplash-induced intracranial and intraocular bleedings, linked with residual permanent
brain damage and mental retardation. Pediatrics, 1974. 54(4): p. 396-403.
14. Yamashima, T. and Friede, R.L., Why do bridging veins rupture into the virtual subdural
space? J Neurol Neurosurg Psychiatry, 1984. 47(2): p. 121-7.
15. Duhaime, A.C., Gennarelli, T.A., Thibault, L.E., Bruce, D.A., Margulies, S.S., and Wiser,
R., The shaken baby syndrome. A clinical, pathological, and biomechanical study. J
Neurosurg, 1987. 66(3): p. 409-15.
16. Prange, M.T., Coats, B., Duhaime, A.C., and Margulies, S.S., Anthropomorphic
simulations of falls, shakes, and inflicted impacts in infants. J Neurosurg, 2003. 99(1): p.
143-50.
17. Coats, B. and Margulies, S.S., Potential for head injuries in infants from low-height falls. J
Neurosurg Pediatr, 2008. 2(5): p. 321-30.
18. Sullivan, S., Coats, B., and Margulies, S.S., Biofidelic neck influences head kinematics of
parietal and occipital impacts following short falls in infants. Accid Anal Prev, 2015. 82: p.
143-53.
19. Coats, B., Margulies, S.S., and Ji, S., Parametric study of head impact in the infant.
Stapp Car Crash J, 2007. 51: p. 1-15.
20. Coats, B., Eucker, S.A., Sullivan, S., and Margulies, S.S., Finite element model
predictions of intracranial hemorrhage from non-impact, rapid head rotations in the piglet.
Int J Dev Neurosci, 2012. 30(3): p. 191-200.
21. Luck, J.F., Nightingale, R.W., Loyd, A.M., Prange, M.T., Dibb, A.T., Song, Y., Fronheiser,
L., and Myers, B.S., Tensile mechanical properties of the perinatal and pediatric PMHS
osteoligamentous cervical spine. Stapp Car Crash J, 2008. 52: p. 107-34.

127
22. Luck, J.F., The Biomechanics of the Perinatal, Neonatal and Pediatric Cervical Spine:
Investigation of the Tensile, Bending and Viscoelastic Response, in Biomedical
Engineering2012, Duke University: Durham, NC.
23. Gefen, A. and Margulies, S.S., Are in vivo and in situ brain tissues mechanically similar?
J Biomech, 2004. 37(9): p. 1339-52.
24. Arbogast, K.B., Thibault, K.L., Pinheiro, B.S., Winey, K.I., and Margulies, S.S., A high-
frequency shear device for testing soft biological tissues. J Biomech, 1997. 30(7): p. 757-
9.
25. Prange, M.T. and Margulies, S.S., Regional, directional, and age-dependent properties of
the brain undergoing large deformation. J Biomech Eng, 2002. 124(2): p. 244-52.
26. Cory, C.Z. and Jones, B.M., Can shaking alone cause fatal brain injury? A biomechanical
assessment of the Duhaime shaken baby syndrome model. Med Sci Law, 2003. 43(4): p.
317-33.
27. Coats, B. and Margulies, S.S., Material properties of human infant skull and suture at
high rates. Journal of Neurotrauma, 2006. 23(8): p. 1222-32.
28. Galford, J.E. and McElhaney, J.H., A viscoelastic study of scalp, brain, and dura. J
Biomech, 1970. 3(2): p. 211-21.
29. Han, H., Tao, W., and Zhang, M., The dural entrance of cerebral bridging veins into the
superior sagittal sinus: an anatomical comparison between cadavers and digital
subtraction angiography. Neuroradiology, 2007. 49(2): p. 169-75.
30. Ommaya, A.K. and Hirsch, A.E., Tolerances for cerebral concussion from head impact
and whiplash in primates. J Biomech, 1971. 4(1): p. 13-21.
31. Roche, C. and Carty, H., Spinal trauma in children. Pediatr Radiol, 2001. 31(10): p. 677-
700.
32. Kokoska, E.R., Keller, M.S., Rallo, M.C., and Weber, T.R., Characteristics of pediatric
cervical spine injuries. J Pediatr Surg, 2001. 36(1): p. 100-5.

128
33. Coats, B., Binenbaum, G., Smith, C., Peiffer, R.L., Christian, C.W., Duhaime, A.C., and
Margulies, S.S., Cyclic Head Rotations Produce Modest Brain Injury in Infant Piglets.
Journal of Neurotrauma, 2016.
34. Choudhary, A.K., Ishak, R., Zacharia, T.T., and Dias, M.S., Imaging of spinal injury in
abusive head trauma: a retrospective study. Pediatr Radiol, 2014. 44(9): p. 1130-40.
35. Brennan, L.K., Rubin, D., Christian, C.W., Duhaime, A.C., Mirchandani, H.G., and Rorke-
Adams, L.B., Neck injuries in young pediatric homicide victims. J Neurosurg Pediatr,
2009. 3(3): p. 232-9.
36. Porzionato, A., Macchi, V., Aprile, A., and De Caro, R., Cervical soft tissue lesions in the
shaken infant syndrome: a case report. Med Sci Law, 2008. 48(4): p. 346-9.
37. Hadley, M.N., Sonntag, V.K., Rekate, H.L., and Murphy, A., The infant whiplash-shake
injury syndrome: a clinical and pathological study. Neurosurgery, 1989. 24(4): p. 536-40.
38. Roth, S., Raul, J.S., Ludes, B., and Willinger, R., Finite element analysis of impact and
shak ing inflicted to a child. Int J Legal Med, 2007. 121(3): p. 223-8.
39. Couper, Z. and Albermani, F., Mechanical response of infant brain to manually inflicted
shak ing. Proc Inst Mech Eng H. 224(1): p. 1-15.

129
CHAPTER 6: CONCLUSIONS AND FUTURE DIRECTIONS
Introduction
The overarching goal of this dissertation research was to determine whether bridging vein
rupture and subsequent extra-axial hemorrhage may result from vigorous shaking without impact
in the human infant. To achieve this goal, we measured the longitudinal mechanical properties of
bridging veins, quantified in situ sagittal plane brain-skull displacements in the newborn pig,
developed a threshold number of bridging vein element failures in a finite element model of the
newborn porcine head that best correlated with extra-axial hemorrhage observed after in vivo
rapid rotational head injuries, and applied this threshold to finite element model simulat ions of the
human infant head during shaking to predict whether or not extra-axial hemorrhage may be
observed following shaking insults without impact in the human infant. Based on our findings,
under some conditions, it may be possible to generate a combination of sagittal head rotational
kinematics that could produce extra-axial hemorrhage in the human infant. A summary of key
findings, limitations, and areas for future investigation are outlined over the following topics:
Bridging Vein Tissue Mechanical Properties and Mechanical Disruption, The Brain-Skull
Boundary During Rapid Head Rotations, Predictions of Bridging Vein Rupture and Subsequent
Extra-Axial Hemorrhage, and Additional Areas for Future Investigation.
Bridging Vein Tissue Mechanical Properties and Mechanical Disruption
We found that longitudinal mechanical properties of bridging vein tissue did not display
any age dependency, but, with the exception of elastic modulus, did differ between human and
porcine species, with human tissue producing higher values than porcine. Load-related
mechanical properties (σy, σu, E) are rate-dependent, with values increasing with rate, but
parameters that are purely displacement-related (λy, λu) do not differ with changes in stretch rate.
A history of cyclic loading prior to elongation to failure had a significant effect on bridging vein
behavior, resulting in longer stress-stretch toe regions and an increase in yield stretch, but

130
interestingly not in ultimate stretch compared to tests without prior cyclic loading. Yield and
ultimate stresses found in post-cyclic failure loading are similar to those performed at lower
stretch rates without a prior history of cyclic loading. Finally, during cyclic loading to a common
level of displacement, peak stress achieved by the bridging veins decreased exponentially with
successive cycles.
We conclude that because bridging vein mechanical properties did not vary with age, any
predisposition to bridging vein rupture and subsequent extra-axial hemorrhage in certain age
groups may be due to the relative ease by which the brain and skull can move independently
(e.g. with brain atrophy in the elderly), or likelihood of rapid head rotations with or without impact
(e.g. child abuse in the young, falls in children and the elderly, playing football in childhood to
young adulthood, etc.). Based on our results, computational modeling efforts to determine the
likelihood of bridging vein rupture during traumatic events should incorporate: 1) species
dependencies to accurately communicate findings from animal models of traumatic brain injury,
2) rate-dependencies of load-related mechanical parameters, and 3) differences observed in
bridging vein mechanical behavior when modeling repeated-loading events. Finally, because no
differences were detected in bridging vein ultimate stretch with changes in stretch rate and prior
loading history, we recommend the use of ultimate stretch as a bridging vein rupture criterion in
computational modeling efforts.
We did not investigate changes to the bridging vein tissue structure during or after cyclic
loading, but our findings of longer toe region, increased yield stretch, and elastic moduli similar to
both high and low rate failure elongations in elongations to failure after a cyclic loading protocol
suggest that subcatastrophic cyclic loading may have conferred mechanical damage or
alterations to the bridging vein tissue structure, as collagen fibers are pulled apart from one
another transverse to their axes, as individual longitudinally-oriented fibers are damaged, and/or
as collagen fiber orientation progressively aligns with the direction of loading [1-3]. In addition,
although similar, post-cyclic failure elongation tests were conducted at stretch rates roughly
double those of the naïve low rate failure elongation group, and while these rates were still

131
comparatively lower than the high rate group, it is unknown whether rate-matched failure
elongation tests after cyclic loading would yield mechanical property measurements different than
those observed in naïve failure elongations, due to tissue structural alterations. Future
longitudinal tension testing of bridging vein tissue may include rate-matched failure elongation
tests with and without prior cyclic loading, observation of collagen fiber orientation with
successive cycling and comparative histological investigations of the unloaded, cyclically loaded,
and failure loaded vessel wall to determine ultrastructural changes to bridging vein tissue caused
by repeated loading.
We also did not fully examine whether bridging veins exhibit viscoelastic behavior.
Studies of multiple bridging vein loading protocols with prescribed periods of relaxation [4], and
load or stress-controlled studies to evaluate creep response are required to assess the presence
of viscoelastic recovery and mechanical fatigue. A confounding factor of these proposed ex vivo
studies is the inability to measure the biomechanical influence of potential in vivo biological
remodeling between bridging vein elongations. Nonetheless, together with the previously
recommended rate-matched naïve and post-cyclic failure elongation studies and ultrastructural
investigations with various loading protocols, these tests will give a complete profile of bridging
vein fatigue behavior.
The Brain-Skull Boundary During Rapid Head Rotations
Measurements of in situ sagittal plane brain-skull displacements of the neonatal pig head,
transected at the sagittal midline, were significantly lower than loading condition-matched brain-
skull displacements in axial plane transections, indicating that the response of the brain-skull
boundary is dependent on the direction of rotation and/or region of the brain. However, a brain-
skull boundary condition prescribed to match sagittal plane displacement measurements in a
finite element model of the neonatal porcine head was much less stiff than its axial plane
counterpart, and as such, the observed differences in brain-skull boundary response may be
attributable to the irregular shape of the sagittal plane head cross-section compared to the

132
relatively symmetric axial plane, regional dependencies within each cross-section, or direction
dependent properties of other structures in the pia-arachnoid complex (PAC). Furthermore, it is
unlikely that bridging veins dominate the mechanical tethering between the brain and skull in the
sagittal plane, as varying bridging vein properties according to observed rate dependencies did
not affect finite element model brain-skull displacements. Finally, a second rotation of the
sagittally transected newborn porcine head yielded significantly larger brain-skull displacements
than those observed in the initial rotation, but this difference was below our measurement error.
Based on our findings, we encourage the use of appropriate brain-skull boundary
conditions in finite element models of the head, dependent on the direction of simulated rotation
or brain region. To improve upon brain-skull boundary conditions prescribed in finite element
models of the head, the use of macroscale elements representative of regional and inter-
individual variability observed in the structure of the PAC [5, 6] and employing measured PAC
material properties [7-9] should be compared with observations of direction-dependent brain-skull
displacements during rapid head rotations. Additional material property investigations of the PAC
are also required to determine whether the PAC is isotropic in transverse shear.
Our observation of significantly higher brain-skull displacements in a second rotation of
the transected porcine newborn head, may indicate alterations or damage to the brain-skull
boundary condition had occurred as a result of the first rotation. However, this observation holds
little value as the difference between the brain-skull displacements observed in the first and
second rotations was smaller than our measurement error. To determine if multiple rapid rotations
alter the brain-skull boundary such that brain-skull displacements progressively increase with
multiple rotational loadings above measurement error, future studies may examine more than two
consecutive rotations of physical transections at the same load level. Findings from these
proposed studies would provide valuable information for modeling the brain-skull boundary
condition in incidences of shaking or repeated insults.
It is very important to note that in our investigation brain-skull displacements were
measured in sagittal plane rotations with peak angular velocities of approximately 52 rad/s. It is
133
unknown whether the brain-skull displacements and prescribed finite element boundary condition
would be similar at higher loading levels. As material properties of the PAC have been
characterized as rate-dependent [7-9], future physical transection studies at different levels of
peak angular velocity and acceleration are critical to fully characterizing the brain-skull boundary.
In addition, the density of PAC structural elements has been shown to vary across the surface of
the brain in the neonatal pig [5], and our sagittal plane transections suggest that the brain-skull
displacement may vary around the periphery of the brain in this plane as well. Future higher
resolution physical transection studies may attempt to determine regional variation in brain-skull
displacements to more accurately define computational model boundary conditions.
In summary, while we have determined that brain-skull displacements during rapid
rotations of the head are dependent on the direction of rotation and this finding necessitates that
finite element model investigations use appropriate representations of the brain-skull boundary
dependent on simulated rotational direction or region of the brain, substantial additional work is
required to fully characterize the brain-skull boundary, and results may have significant effects on
computational model predictions of traumatic brain injury.
Predictions of Bridging Vein Rupture and Subsequent Extra-Axial Hemorrhage
Using in vivo injury pathology from newborn porcine models of single and cyclic rapid
rotational traumatic brain injury, we developed and independently validated a threshold for the
number of failed bridging vein elements in a finite element model of the neonatal porcine head
associated with the presence of extra-axial hemorrhage. We determined a critical value of six
bridging vein element failures is associated with 100% sensitivity and specificity for detection of
EAH in our newborn porcine rapid nonimpact rotation TBI model, but applying this criterion to a
newborn porcine cyclic rotational injury model only yielded 90% accuracy. From these porcine
simulations, we also observed a trend of increasing angular accelerations producing larger
numbers of bridging vein element failures. We conclude that finite element models should include

134
biofidelic representations of the parasagittal bridging veins to better predict the occurrence of
extra-axial hemorrhage.
We also measured kinematics of the infant head during vigorous shaking using an
instrumented human infant surrogate, finding that shakes employing the entire range of motion of
the surrogate neck resulted in higher angular velocities and accelerations than shaking with
maximal effort without specifying range of motion instructions. We simulated a range of angular
velocity and acceleration combinations produced by the surrogate shaking tests in a finite
element model of the human infant head and found that shakes with high angular accelerations
produced multiple bridging vein element failures, above our threshold of six corresponding to the
presence of extra-axial hemorrhage in the neonatal pig. Although no bridging vein element
failures were predicted in our porcine model under cyclic head rotations, this may be expected, as
conventional mass scaling approaches [10] dictate that for the maximum peak acceleration
magnitudes observed in the simulated human infant shaking episodes (2,002-2,875 rad/s2,
Chapter 5, Table 5.3) applied to the ~500g human infant brain, equivalent cyclic rotations
experienced by the ~40g newborn porcine brain would include cycles with peak acceleration
magnitudes of 10,781-15,482 rad/s2, levels well above those applied in the in vivo cyclic piglet
rotational injury studies (Chapter 4, Table 4.6). As such, we simulated an idealized shaking
velocity history of a porcine cyclic injury trace with both peak angular velocities and accelerations
scaled to the mass of the human infant brain and confirmed a lack of predicted extra-axial
hemorrhage. Taken together these data indicate that, under certain circumstances, vigorous
inflicted shaking without impact may produce bridging vein ruptures and associated extra-axial
hemorrhage in the human infant.
In the porcine newborn model of traumatic brain injury used to develop a finite element
model threshold for the number of failed bridging vein elements associated with pathology
observations of extra-axial hemorrhage, there appear to be kinematic thresholds of angular
velocity and angular acceleration that result in the failure of bridging vein elements and
measurable extra-axial hemorrhage. However, the point at which finite element model bridging
135
vein element failure and in vivo injury extra-axial hemorrhage begin to occur was not represented
by our collection of retrospective studies, and in turn, we cannot say whether detectable extra-
axial hemorrhage may be associated with an amount of bridging vein failures between one and
five in the presented finite element model. Future in vivo studies of newborn porcine rapid head
rotations in the sagittal plane may be conducted in this realm, with peak angular velocities
between 50 and 140 rad/s, and more importantly, peak angular acceleration magnitudes between
15,000 and 30,000 rad/s2 (as calculated with CFC 200 filtering of velocity), to determine a more
definitive threshold level for extra-axial hemorrhage.
Both our neonatal porcine and human infant finite element models may have over-
predicted the occurrence of bridging vein element failures. Because the finite element model
brain-skull boundary conditions were matched to in situ brain-skull displacements and finite
element model bridging vein element initial lengths were shorter than those used in mechanical
property testing, it is possible that longer bridging vein elements subjected to the same
displacements as simulated in these models would not reach their critical failure stretch. Future
studies should examine average in vivo lengths of bridging veins and incorporate these in
computational analyses.
Similarly, the interface between the bridging veins and tissue they attach to (dura and
brain) is unknown. Specifically, it may be that the bridging veins pull out of the surrounding tissue
at their attachment points, especially in the case of the soft brain, without incurring mechanical
loads and effectively increasing the gage length of the bridging veins between the brain and skull.
This possible increased gage length may protect against stretch-related rupture. Future animal
investigations may attempt to determine the possibility of relative movement between the bridging
veins and the brain post-mortem by cutting a superior rectangular section of the skull spanning
the midline, and video recording the movement of the bridging veins as the cut skull section is
pulled away from the brain.
Our measurements of angular velocities and accelerations experienced by the head of a
1.5 month old human infant surrogate during shaking may be confounded by the properties and
136
assembly of the surrogate neck, which were validated with quasistatic infant cervical spine
properties, and lacks a hard structure representative of the cervical vertebrae, respectively. In
addition, the motion of the surrogate torso was not recorded during surrogate shaking studies,
and as such, the relative motion between the head and the body of the surrogate is unknown as
is how this omission affects the measured head kinematics. Future iterations of the infant
surrogate may include a hard skeletal structure representative of the vertebral column and/or a
neck with dynamic tension and bending properties as available, and kinematic examinations
should include motion capture of the surrogate torso to determine more precisely the relative
angular motion of the head relative to the body.
In our human infant finite element model, no mesh convergence study was performed on
the brain. As the motion of the brain plays an important role in dictating the elongation of the
bridging veins, future finite element modeling efforts should ensure that an appropriate brain
mesh is employed. The human infant finite element model also does not include geometry and
elements representative of the falx. Although the superior attachment point of the bridging vein
elements would have ideally been on an inner falx surface, because we employed purely sagittal
plane motion in our shaking simulations, the influence of the falx on the motion of the brain
relative to the skull is likely minimal. However, this model is not a good choice for any non-sagittal
or off-axis motions, in which the falx may restrict brain motion. Future computational modeling
efforts should include appropriate falx geometry and elements to more accurately describe the
brain-skull interface, especially when estimating or predicting the incidence of hemorrhage or
other peripheral brain injuries.
While there is certainly room for improvement in our predictions of bridging vein rupture
leading to extra-axial hemorrhage following rapid sagittal plane head rotations, our use of
measured pediatric bridging vein mechanical properties, and correlation of finite element model
predictions of bridging vein failure with in vivo animal injury pathology are novel. Accordingly, a
final step in validating finite element model predictions of bridging vein failure in the human infant
should include simulations of well-witnessed cases of traumatic brain injury in the human infant

137
(e.g. accidental falls) and comparison of any resulting bridging vein element failures with
corresponding case radiography. Taking this idea one step further, stronger validation this model
may include correlations of finite element bridging vein failures with observations of torn bridging
veins at autopsy in well-witnessed cases of trauma.
Additional Areas for Future Investigation
While we suggest several avenues for future studies closely related to the studies in this
dissertation throughout this final chapter, an additional two questions also come to mind. First,
measured extra-axial hemorrhage and subdural hemorrhage before immersion in formalin
observed in porcine in vivo injuries presented in Chapter 4 is often diffuse and quite severe. It
may be that increased pressure associated with this severe hemorrhage causes the hypoxic -
ischemic injury, and the excess of blood may track from the brain down the optic nerve to the eye,
resulting in the appearance of retinal hemorrhage. As hypoxic-ischemic injury and retinal
hemorrhages in addition to subdural and subarachnoid hemorrhage constitute the “triad” of
presenting injuries common to abusive head trauma, future physical and computational fluidic
modeling in animals may provide insight into the hypothesis of hemorrhage traveling from the
brain to the eye.
Second, during cyclic shaking type insults, frequency may have a significant effect on
tissue deformation regardless of other kinematic measures. It is likely that the complex shape of
the head causes the brain and other intracranial tissue to have multiple natural, or resonant,
frequencies. Dependent on the shake frequency and natural tissue frequencies, constructive
interference may amplify tissue deformations, or conversely destructive interference may diminish
tissue deformations. Specifically, if the frequency of the shaking was near a resonant frequency,
or harmonic, composite tissue deformations may be amplified beyond what is expected based on
velocities and accelerations alone. Variation of shake frequency in cyclic porcine (or other animal)
in vivo studies may produce different injuries or injury severity, regardless of velocity or
acceleration levels. Similar parametric alteration of shake frequency in computational models of
138
the head may provide insight into the effect of harmonic amplification in brain and other soft
tissue deformations during shaking. In any case, the complex kinematics of shaking type insults
should be more thoroughly investigated to produce better understanding of potential injury
modalities.
Conclusion
For many years, whether or not traumatic brain injury may result from vigorous shaking
without impact in the infant has been a topic of heated scientific and legal debate. The detailed
and comprehensive biomechanical studies presented in this dissertation suggest that high level
rotational acceleration events predispose bridging vein ruptures, and under certain
circumstances, it may be possible to cause bridging vein ruptures and subsequent extra-axial
hemorrhage in the human infant from vigorous inflicted shaking insults without impact. This
research should be considered in clinical differential diagnosis strategy for abusive head trauma
in infants, and may also inform educational public health initiatives and legal judgements
associated with improving the welfare of young children.
References
1. Yamashima, T. and Friede, R.L., Why do bridging veins rupture into the virtual subdural
space? J Neurol Neurosurg Psychiatry, 1984. 47(2): p. 121-7.
2. Miller, K.S., Edelstein, L., Connizzo, B.K., and Soslowsky, L.J., Effect of preconditioning
and stress relaxation on local collagen fiber re-alignment: inhomogeneous properties of
rat supraspinatus tendon. J Biomech Eng, 2012. 134(3): p. 031007.
3. Quinn, K.P. and Winkelstein, B.A., Preconditioning is correlated with altered collagen
fiber alignment in ligament. J Biomech Eng, 2011. 133(6): p. 064506.
4. Bell, E.D., Sullivan, J.W., and Monson, K.L., Subfailure overstretch induces persistent
changes in the passive mechanical response of cerebral arteries. Front Bioeng
Biotechnol, 2015. 3: p. 2.

139
5. Scott, G. and Coats, B., Microstructural characterization of the pia-arachnoid complex
using optical coherence tomography. IEEE Trans Med Imaging, 2015.
6. Scott, G.G., Margulies, S.S., and Coats, B., Utilizing multiple scale models to improve
predictions of extra-axial hemorrhage in the immature piglet. Biomech Model
Mechanobiol, 2015.
7. Jin, X., Lee, J.B., Leung, L.Y., Zhang, L., Yang, K.H., and King, A.I., Biomechanical
response of the bovine pia-arachnoid complex to tensile loading at varying strain-rates.
Stapp Car Crash J, 2006. 50: p. 637-49.
8. Jin, X., Ma, C., Zhang, L., Yang, K.H., King, A.I., Dong, G., and Zhang, J., Biomechanical
response of the bovine pia-arachnoid complex to normal traction loading at varying strain
rates. Stapp Car Crash J, 2007. 51: p. 115-26.
9. Jin, X., Yang, K.H., and King, A.I., Mechanical properties of bovine pia-arachnoid
complex in shear. J Biomech, 2011. 44(3): p. 467-74.
10. Ommaya, A.K. and Hirsch, A.E., Tolerances for cerebral concussion from head impact
and whiplash in primates. J Biomech, 1971. 4(1): p. 13-21.

140
APPENDIX A: EFFECT OF CRYOPRESERVATION CONDITIONS ON ELASTIC
MODULUS OF IMMATURE PORCINE SAPHENOUS VEINS
Presented at the Biomedical Engineering Society Annual Meeting, September 2013,
Seattle, WA (Poster)
Introduction
Motivation
Because autopsies may be performed up to 72 hours post mortem, the effect of the time
delay between death and human tissue acquisition on the vessel mechanical properties became
a concern. In fact, a prior study suggests that using cadaveric arterial tissue for mechanical
testing presents limitations due to this time delay as samples refrigerated for 24 of 48 hours
before mechanical testing displayed decreased elastic moduli compared to fresh and frozen
samples [1].
Objective
In a series of pilot studies to demonstrate feasibility and inform our studies of pediatric
porcine parasagittal bridging veins, we sought to optimize sample harvest, preservation, and
testing techniques by determining the effects of freeze/thaw rate, cryopreservation solution, strain
rate, and time delay before cryopreservation (to simulate post-mortem time before autopsy) on
the axial elastic modulus of pediatric (4 week old) porcine saphenous veins.

141
Experimental Design
Table A.1 shows a summary of the studies conducted.
Table A.1 Summary of pediatric porcine saphenous vein cryopreservation studies.
Realizing the loss of paired analysis and that in some cases more than one variable was
changed between sets of experiments, some groups were combined after initial analyses showed
no significant effect of a specific variable on the elastic modulus of saphenous veins. This aided
in better answering more questions than originally intended by the experimental design.
Effect of Freeze/Thaw Rate
To investigate the effect of freeze and thaw rate on vessel elastic modulus, saphenous
veins were harvested from N=5 piglets and cut into 4 pieces and frozen immediately (0-hour
delay) in a 10% dimethylsulfoxide (DMSO) - 90% Dulbecco’s Modified Eagle Media (DMEM)
cryopreserving solution. Two segments from each pig were frozen and thawed rapidly, while the
two others were frozen and thawed gradually. One vessel from each freeze/thaw rate group was
pulled to failure at a LOW rate, while the other was pulled to failure at a HIGH rate. Data was
analyzed using a two-way repeated measures ANOVA with significance defined as p<0.05 to
determine freeze/thaw method and strain rate effects and their interactions.
Effect of Cryopreservation Solution
Immediately frozen (0-hour delay) samples were pooled across experiments (frozen in
physiologic saline at -20°C, frozen in 10% DMSO - 90% DMEM gradually and rapidly) and
compared using a two-way ANOVA, with significance defined as p<0.05, to determine
cryopreservation solution (physiologic saline or 10% DMSO - 90% DMEM) and strain rate (LOW
or HIGH) effects on elastic modulus and their interactions.
Cryo-Method -20°C Gradual, -20°C→-80°C Rapid, -80°C
Cryo-Solution Physiologic Saline 10% DMSO-90% DMEM
Strain Rate LOW HIGH LOW LOW LOW HIGH LOW HIGH LOW LOW LOW LOW LOW LOW
Delay 0 hrs 24 hrs 72 hrs 0 hrs 0 hrs Fresh 0 hrs 6 hrs Fresh 0 hrs 18 hrs
# Pigs N=5 N=5 N=5 N=5

142
Effect of Strain Rate
To determine if the elastic modulus of veins was altered by strain rate, saphenous veins
that were frozen immediately (0-hour delay) were again pooled across experiments. Those pulled
at LOW strain rates were compared to those pulled at HIGH strain rates using an unpaired t -test,
with significance defined as p<0.05.
Effect of Post-Mortem Delay
Saphenous veins from N=5 piglets were cut into four samples and frozen to -20°C in
physiologic saline, two of which were frozen immediately (0-hour delay), one of which was frozen
after a 24-hour refrigerated delay, and the fourth of which was frozen after a 72-hour refrigerated
delay. One of the immediately frozen samples was pulled to failure at a HIGH strain rate, while all
other samples (the other 0-hour delay, 24-hour delay, and 72-hour delay) were pulled to failure at
a LOW strain rate.
Saphenous veins from an additional two groups of N=5 pigs were each cut into three
samples. In each of these groups of N=5 pigs, one vein segment per pig was tested fresh, without
freezing, and another was immediately frozen. In N=5 of these pigs, the remaining segment was
frozen with a 6-hour refrigeration delay, and in the other N=5 pigs, the remaining segment was
frozen with an 18-hour refrigeration delay. For these groups all vessels were frozen in 10%
DMSO - 90% DMEM using the rapid freeze/thaw method.
To examine the effect of delay to specimen acquisition caused by post-mortem time
before autopsy, saphenous vein specimens frozen at different delay time points after harvest: 0
hours, 6 hours, 18 hours, 24 hours, and 72 hours were compared to each other as well as
specimens tested freshly (without freezing) using a one-way ANOVA with significance defined as
p<0.05.

143
Methods
Cryopreservation
For experiments in which vessel segments were frozen in physiologic saline, specimens
were simply placed in 0.5ml Eppendorf tubes filled with physiologic saline and frozen in a -20°C
freezer. Before testing, these specimens were removed from the -20°C freezer and allowed to
thaw at room temperature.
Saphenous vein segments frozen in the 10% DMSO - 90% DMEM cryoprotective solution
were placed in increasing concentrations of DMSO in DMEM (2.5%, 5%, and 7.5%, v/v) for ten
minutes each and allowed to equilibrate at the final concentration (10% v/v) for twenty minutes
before freezing. Specimens were placed in 0.5ml Eppendorf tubes filled with 10% DMSO - 90%
DMEM solution and then those in the gradual freeze/thaw group were frozen in a -20°C freezer
for 1 hour before storage in a -80°C freezer, while specimens in the rapid freeze/thaw group were
frozen by direct placement in a -80°C freezer. Prior to testing, specimens in the gradual
freeze/thaw group were thawed in a -20°C freezer for 1 hour and removed and thawed to room
temperature. Those in the rapid freeze/thaw group were thawed to room temperature by removal
from the -80°C freezer. Specimens were rinsed of DMSO by placing them in decreasing
concentrations of DMSO in DMEM (7.5%, 5%, 2.5%, and 0%, v/v) for ten minutes each and then
placed in fresh DMEM (0% DMSO) before testing. This cryopreservation procedure and slight
variations are widely practiced [2-8].
Post-Mortem Delay
Samples not in the fresh (never frozen) or immediate freeze (0-hour delay) groups were
refrigerated during their respective delay times. For delay samples frozen in 10%DMSO -
90%DMEM solution, DMSO concentration began after refrigeration and before freezing.

144
Mechanical Testing
After rinsing specimens of DMSO, vessels were cleaned of any remaining exterior fascia
and fixed to two pieces of fine grit sandpaper with a small amount of cyanoacrylate on each end.
The ends were then gripped in flat-plate style grips and loaded into the testing apparatus. A
custom-designed drop test apparatus, previously used to test high rate material properties of
infant suture and skull [9] was used in this study, different from the apparatus used in the bridging
vein tests in the bridging vein mechanical tests in Chapter 2. The drop test apparatus consists of
a metal plate that slides down three shafts and hits a lever arm. The top specimen grip is
attached to the opposite end of the lever arm than that which is struck by the plate. To ensure a
fully linear extension, the top specimen grip is attached to the lever arm with a universal joint. The
bottom grip is attached to a load cell which sits on the lever arm platform. A laser displacement
sensor measures the global elongation of the vessel by tracking the height of the lever arm near
where the top grip is attached, calibrated to account for the non-linearity of this motion. Strain
rates in the LOW strain rate group were 85.87±3.1 s -1 and strain rates in the HIGH strain rate
group were 196.98±8.55 s-1 (mean ± SEM). Elastic modulus was calculated from strains of 0.2 to
0.6 or vessel failure, whichever occurred first.

145
Results
For all plots, N is the number of specimens, not the number of pigs. All plots show mean
± SEM.
Figure A.1 Effect of Freeze/Thaw Rate on Pediatric Porcine Saphenous Vein Elastic Modulus
Effect of Freeze/Thaw Rate
Freeze/thaw rate did not affect elastic modulus (p=0.9805, Figure A.1) and no significant
interaction was found between freeze/thaw rate and strain rate (p=0.5299).

146
Figure A.2 Effect of Strain Rate on Pediatric Porcine Saphenous Vein Elastic Modulus
Effect of Strain Rate
Because freeze/thaw rate and cryopreservation solution did not significantly affect elastic
modulus, the effect of strain rate (high: 196.98±8.55 s -1, or low: 85.87±3.1 s-1, mean ± SEM) was
assessed pooling freeze/thaw rates and cryopreservation solutions. Strain rate did not
significantly affect elastic modulus (p=0.8159, Figure A.2).

147
Figure A.3 Effect of Cryopreservation Solution on Pediatric Porcine Saphenous Vein Elastic Modulus
Effect of Cryopreservation Solution
Because freeze/thaw rate did not significantly affect elastic modulus, the effect of
cryopreservation solution was analyzed, pooling freeze/thaw rates. Choice of cryopreservation
solution had no significant effect on elastic modulus. (p=0.7665, Figure A.3), and there was no
significant interaction between cryopreservation solution and strain rate (p=0.1591, Figure A.3).

148
Figure A.4 Effect of Post-Mortem Delay on Pediatric Porcine Saphenous Vein Elastic Modulus
Effect of Post-Mortem Delay
Post-mortem delay did not significantly affect elastic modulus (p=0.0935, Figure A.4), but
was trending to decreased modulus with longer chilled storage prior to freezing. Small sample
sizes may limit our statistical power. Regardless we conclude that longer storage times should be
avoided.
Conclusions
Freeze/thaw rate, cryopreservation solution, and strain rate do not affect the elastic
modulus of pediatric porcine saphenous veins. Post-mortem delays before cryopreservation of up
to 72 hours reduced elastic modulus, but did not reach significance. Regardless, we would advise
against utilizing cadaveric venous tissue obtained more than 24 hours post-mortem.
Acknowledgements
This work was funded by an American Heart Association Pre-Doctoral Fellowship award
and NIH R01 NS039679. The authors thank Jill Ralston for her assistance in sample
procurement, and Sarah Sullivan for her assistance in statistical analysis.

149
References
1. Stemper, B.D., Yoganandan, N., Stineman, M.R., Gennarelli, T.A., Baisden, J.L., and
Pintar, F.A., Mechanics of fresh, refrigerated, and frozen arterial tissue. J Surg Res,
2007. 139(2): p. 236-42.
2. Adham, M., Gournier, J.P., Favre, J.P., De La Roche, E., Ducerf, C., Baulieux, J., Barral,
X., and Pouyet, M., Mechanical characteristics of fresh and frozen human descending
thoracic aorta. J Surg Res, 1996. 64(1): p. 32-4.
3. Brossollet, L.J. and Vito, R.P., The effects of cryopreservation on the biaxial mechanical
properties of canine saphenous veins. J Biomech Eng, 1997. 119(1): p. 1-5.
4. Bujan, J., Pascual, G., Lopez, R., Corrales, C., Rodriguez, M., Turegano, F., and Bellon,
J.M., Gradual thawing improves the preservation of cryopreserved arteries. Cryobiology,
2001. 42(4): p. 256-65.
5. Hunt, C.J., Song, Y.C., Bateson, E.A., and Pegg, D.E., Fractures in cryopreserved
arteries. Cryobiology, 1994. 31(5): p. 506-15.
6. Pegg, D.E., Wusteman, M.C., and Boylan, S., Fractures in cryopreserved elastic arteries.
Cryobiology, 1997. 34(2): p. 183-92.
7. Rendal, E., Santos, M.V., Rodriguez, M., Sanchez, J., Segura, R., Matheu, G., Filgueira,
P., Pertega, S., and Andion, C., Effects of cryopreservation and thawing on the structure
of vascular segment. Transplant Proc, 2004. 36(10): p. 3283-7.
8. Venkatasubramanian, R.T., Grassl, E.D., Barocas, V.H., Lafontaine, D., and Bischof,
J.C., Effects of freezing and cryopreservation on the mechanical properties of arteries.
Ann Biomed Eng, 2006. 34(5): p. 823-32.
9. Coats, B. and Margulies, S.S., Material properties of human infant skull and suture at
high rates. Journal of Neurotrauma, 2006. 23(8): p. 1222-32.

150
APPENDIX B: BRIDGING VEIN MECHANICAL TEST CURVES
B.1 Porcine Newborn Bridging Vein Cyclic Loading Peak Stress Decay and Stress-
Stretch Curves
Porcine Newborn Subject 1
Porcine Newborn Subject 2

151
Porcine Newborn Subject 3
Porcine Newborn Subject 4

152
Porcine Newborn Subject 5
Porcine Newborn Subject 6

153
Porcine Newborn Subject 7
Porcine Newborn Subject 8

154
Porcine Newborn Subject 9

155
B.2 Porcine Adult Bridging Vein Cyclic Loading Peak Stress Decay and Stress-
Stretch Curves
Porcine Adult Subject 1
Porcine Adult Subject 2

156
Porcine Adult Subject 3
Porcine Adult Subject 4

157
Porcine Adult Subject 5
Porcine Adult Subject 6

158
Porcine Adult Subject 7
Porcine Adult Subject 8

159
Porcine Adult Subject 9
Porcine Adult Subject 10

160
Porcine Adult Subject 11
Porcine Adult Subject 12

161
B.3 Human Infant Bridging Vein Cyclic Loading Peak Stress Decay and Stress-
Stretch Curves
Human Infant Subject 1
Human Infant Subject 2
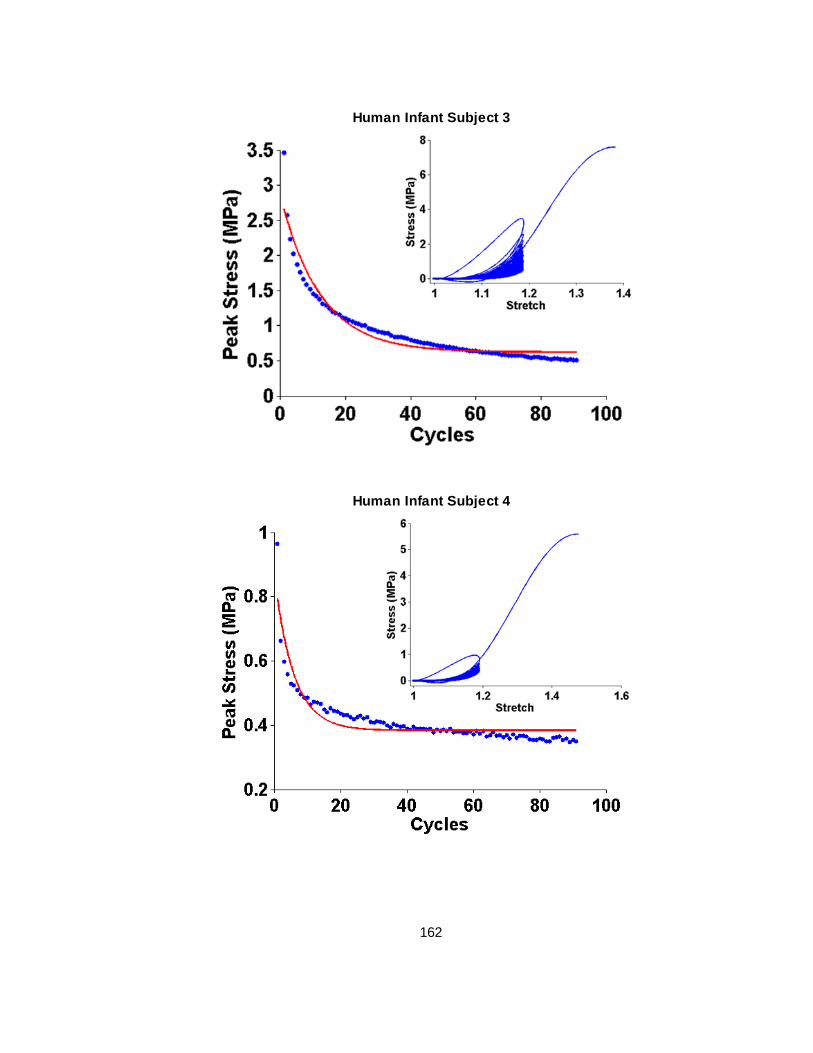
162
Human Infant Subject 3
Human Infant Subject 4

163
Human Infant Subject 5
Human Infant Subject 6

164
Human Infant Subject 7

165
B.4 Porcine Newborn Bridging Vein Failure Elongation Stress-Stretch Curves
Porcine Newborn Subject 1
Porcine Newborn Subject 2

166
Porcine Newborn Subject 3
Porcine Newborn Subject 4

167
Porcine Newborn Subject 5
Porcine Newborn Subject 6

168
Porcine Newborn Subject 7
Porcine Newborn Subject 8

169
Porcine Newborn Subject 9

170
B.5 Porcine Adult Bridging Vein Failure Elongation Stress-Stretch Curves
Porcine Adult Subject 1
Porcine Adult Subject 2

171
Porcine Adult Subject 3
Porcine Adult Subject 4
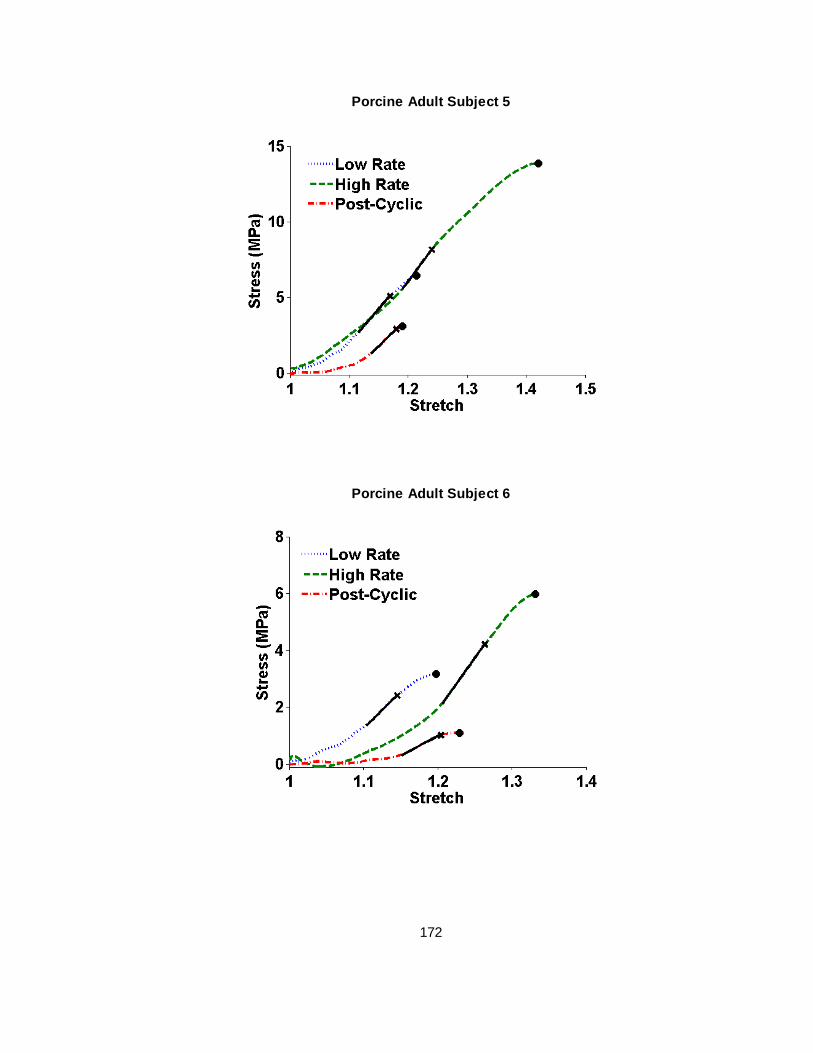
172
Porcine Adult Subject 5
Porcine Adult Subject 6
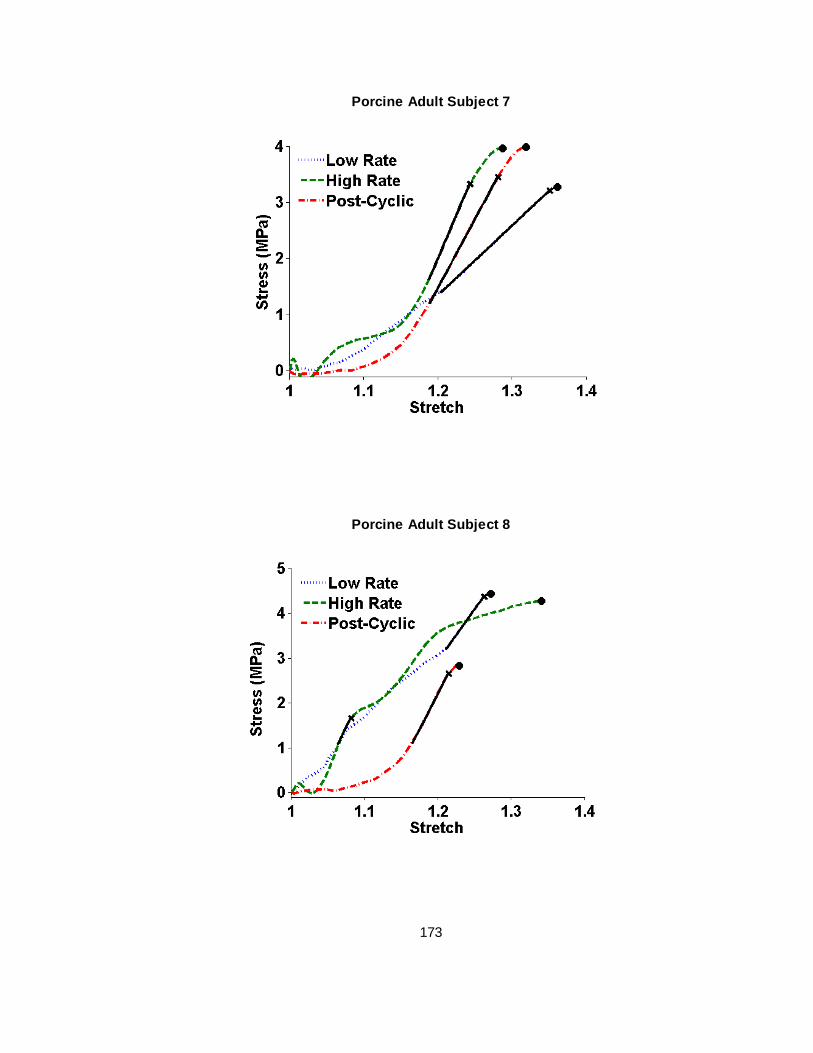
173
Porcine Adult Subject 7
Porcine Adult Subject 8

174
Porcine Adult Subject 9
Porcine Adult Subject 10

175
Porcine Adult Subject 11
Porcine Adult Subject 12

176
B.6 Human Infant Bridging Vein Failure Elongation Stress-Stretch Curves
Human Infant Subject 1
Human Infant Subject 2

177
Human Infant Subject 3
Human Infant Subject 4

178
Human Infant Subject 5
Human Infant Subject 6

179
Human Infant Subject 7

180
APPENDIX C: REPEATED LOADING BEHAVIOR OF PORCINE COMMON CAROTID
ARTERIES
Published in the Journal of Biomechanical Engineering
Copyright © ASME, 2016
Repeated Loading Behavior of Pediatric Porcine Common Carotid Arteries
Stephanie A. Pasquesi, Yishan Liu, and Susan S. Margulies
Department of Bioengineering, University of Pennsylvania, Philadelphia, PA, USA
Corresponding/Final Author: Susan S. Margulies, Ph.D.
Department of Bioengineering University of Pennsylvania
240 Skirkanich Hall 210 South 33rd Street
Philadelphia, PA 19104-6321 215-989-0882 (ph) 215-573-3808 (f)
First Author: Stephanie A. Pasquesi
Department of Bioengineering University of Pennsylvania
240 Skirkanich Hall 210 South 33rd Street
Philadelphia, PA 19104-6321
Second Author: Yishan Liu
Department of Bioengineering University of Pennsylvania
240 Skirkanich Hall 210 South 33rd Street
Philadelphia, PA 19104-6321

181
Abstract
Rapid flexion and extension of the neck may occur during scenarios associated with
traumatic brain injury (TBI), and understanding the mechanical response of the common carotid
artery (CCA) to longitudinal stretch may enhance understanding of contributing factors that may
influence CCA vasospasm and exacerbate ischemic injury associated with TBI. Immature (4
week old) porcine CCAs were tested under subcatastrophic (1.5 peak stretch ratio) cyclic loading
at 3Hz for 30s. Under subcatastrophic cyclic longitudinal extension, the immature porcine CCA
displays softening behavior. This softening can be represented by decreasing peak stress and
increasing corner stretch values with an increasing number of loading cycles. This investigation is
an important first step in the exploration of fatigue-like behavior in arterial tissue that may be
subjected to repeated longitudinal loads.
Keywords: vessel, stiffness, mechanical properties, vascular, longitudinal, whiplash

182
Introduction
With over 250,000 emergency department visits, 15,000 hospitalizations, and nearly
1,000 deaths annually in the U.S. [1], traumatic brain injury (TBI) in children aged 0-4 years is a
major public health concern. Some TBIs are caused by rapid rotations of the head about the neck
(whiplash, cyclic shaking-type injuries), and there is evidence that mechanical stretch of the
cerebral arteries is a trigger for vasoconstrictive responses [2-4]. Most studies have focused on
intracranial vasculature vasospasm in adult TBI patients, with a paucity examining vasospasm in
pediatric TBI [5]. Recently, we reported that the CCA displays prolonged constriction after a
single rapid sagittal head rotation in the immature pig [6]. It is possible that this CCA constriction
and reduction in blood flow may mediate decreased global cerebral blood flow [7], decreased
brain tissue oxygenation [8], and increased lactate/pyruvate ratio [8] observed following similar
injuries in this animal model.
Our goal was to elucidate the longitudinal mechanical behavior of the immature porcine
CCA during nondestructive cyclic extension. Mechanical properties of carotid arteries are known
to vary with age [9-14], and previous studies typically compare adult and advanced age. Most
studies report the pressure-diameter and circumferential compliance relationship of the adult CCA
[15-17]. Few have measured longitudinal mechanical properties [18-24], and only three have
evaluated adult behavior during cyclic loading [25-27].
Methods
Specimen Preparation
All euthanasia and procurement procedures were approved by the University of
Pennsylvania Institutional Animal Care and Use Committee. Right CCAs were harvested from 4-
week old female farm pigs, chosen to match subjects used in previous rapid non-impact rotation
studies [6, 8], immediately after sacrifice (n=8). Following removal of exterior fascia, each
specimen was cut perpendicular to the longitudinal axis into three sections of near equal length,
and placed in serial dilutions of 2.5, 5, and 7.5% dimethyl sulfoxide (DMSO) in Dulbecco’s

183
Modified Eagle Media (DMEM) for ten minutes each, followed by a final concentration of 10%
DMSO-90% DMEM for 20 minutes prior to freezing in Eppendorf tubes at -80°C. The location of
each sample along the carotid axis (proximal, middle, and distal) was not recorded so that no
systematic bias was introduced. Previous studies have shown that cryopreservation does not
significantly alter the material properties of blood vessels [28-35].
On the day of testing, samples were removed from -80°C storage, thawed at room
temperature, and rinsed of DMSO by placement in serial dilutions of 7.5, 5, 2.5, and 0% DMSO in
DMEM for ten minutes each. After rinsing, specimens were placed in fresh DMEM prior to testing.
Cross-sectional area varied along specimen length. To determine average specimen cross-
sectional area, the entire specimen was placed between two glass slides and the thickness and
width of the specimen was measured in triplicate using calipers to find outer circumference (C,
C=2πro) and wall thickness (h, h=ro-ri). Artery cross-sectional area (A) was approximated as that
of a hollow cylinder:
𝐴 = 𝜋(𝑟𝑜2 − 𝑟𝑖
2) [1]
where ro is the outer radius and ri is the inner radius.

184
Test Apparatus
Figure C.1 Vessel testing device including (A) lab jack, (B) load cell, (C) saline inlet, (D) pressure sensors, (E) 14G blunt-tipped needle grips, (F) gear-chain system, (G) rotary motor, (H) threaded shafts, (I) translating plate, and (J) laser displacement sensor.
In a setup similar to previous investigations [36, 37], CCA test specimens were
cannulated with 14G blunt-tipped needles and secured via silk suture (6-0) tied around the vessel
circumference at the level of a groove machined in the needle. A small amount of cyanoacrylate
was applied at both ends of the specimen distal to the suture fixation to secure the vessel on the
needles. Each of the blunt tipped needles was fastened to a Delrin block via a luer connection
with a rotating lock ring to prevent specimen twisting. The blocks had channels machined through
them to allow for fluid pressurization of the vessels and pressure sensor attachment
(26PCBFM6G, Honeywell, Columbus, OH). Physiologic saline was inserted through a syringe into
the channel in the first block, needle, vessel, opposite needle, and the second block, where the
channel ended.

185
A custom device was constructed to pull vessels cyclically (Figure C.1). Briefly, a
computer-controlled closed loop stepper motor (Vexta #AS46AAP, Oriental motor, Braintree, MA)
coupled to a gear-chain system was used to rotate threaded shafts to move a plate up and down
at a specified frequency. The bottom grip was attached to the moving plate, while the top grip was
attached to a 1000g capacity load cell (Model 31, Honeywell-Sensotec, Columbus, OH). The load
cell was fastened to a lab jack mounted on the ceiling of a cage surrounding the entire device,
which allowed for gage length adjustment of the specimen. A laser displacement sensor (LC
1607-50, Micro-Epsilon, Ortenburg, Germany) measured the global elongation of the vessel by
tracking the position of the translating plate. The lab jack was adjusted until the artery specimen
was taut and the load cell just began to register a load. The specimen gage length was measured
from suture tie to suture tie with calipers, as the in vivo length was not recorded at excision.
Test Protocol
Specimens were pressurized with physiologic saline to a target physiological pressure,
~100 mmHg [38-40], a stopcock on the saline inlet was closed, and stretch tests were conducted
at peak stretch ratios of 1.5 and a cycling frequency of 3Hz (yielding average stretch rates of 3s-1)
for 30 seconds (~90 cycles). For real-world scenarios with sustained cyclic loads we used
previous measurements of vigorous shaking (3Hz, 30 seconds) seen in child abuse [41, 42]. The
cycling stretch limit was chosen as a comparative benchmark for future studies where, at
extremes, vessels may reach stretch ratios of 1.5. Load and displacement values (sampled at 1
kHz) were recorded on a computer.
Data Analysis
Recorded load and displacement signals were low-pass filtered (second order
Butterworth) at 35 Hz and 20 Hz, respectively. Stretch ratio and First Piola-Kirchoff stress were
then calculated from the displacement and load traces for each cycle from displacement minimum
to load maximum, as follows:

186
𝜆(𝑡) =𝑙(𝑡)
𝑙0
[2]
𝜎(𝑡) =𝐹(𝑡)
𝐴 [3]
where λ is stretch ratio, t is time, l is the instantaneous length of the specimen, l0 is the gage
length, σ is stress, F is instantaneous load, and A is cross-sectional area as defined in Eq. 1.
Stretch rate was defined as the slope of the stretch-time relationship over the loading portion of
each cycle.
The stress-stretch behavior was a nonlinear and biphasic, with stiffer behavior at higher
stretch magnitudes (Figure C.2). We calculated modulus in the toe (low stretch) and linear (high
stretch) regions as well as the approximate corner stretch where the transition to sti ffer behavior
occurred (Figure C.2, inset). The toe region was defined in two steps. First, a linear regression
was calculated between 20-40% of the length of the loading portion of each cycle, omitting the
unloading segment (Figure C.2). Next, that regression was applied to the entire loading portion of
the cycle, and the magnitude of the residuals (or absolute value of the difference) between the
measured stress values and the linear fit were extracted. The toe region was defined as the
segment where residual magnitudes were not continuously above 0.05 MPa. Finally, the modulus
of the toe region, Etoe, was defined as the slope of the stress-stretch relationship in the toe region.
A similar two-step process was used to find the linear region for a given cycle, except this time a
linear regression was taken between 75% of the average peak stress of the last ten cycles and
the peak stress of the cycle being analyzed. After evaluating residual magnitudes over the entire
loading portion of the cycle, the slope of a second linear regression of linear region stress-stretch
was defined as the linear region modulus, E linear. The corner stretch, λcorner, was defined as the
stretch at which the toe region line of best fit and the linear region line of best fit were equal. Peak
stresses (σpeak) were also extracted for each cycle. Hysteresis was defined by the area
encompassed by each cycle’s loading and unloading curves. Because in some experiments (4
out of 8) we observed yield-like behavior during the first loading cycle occurring before reaching a

187
stretch ratio of 1.5, we report Etoe, Elinear, λcorner, and σpeak for the second cycle through the last
cycle (88 or 89).
A series of one-way ANOVAs were performed to examine differences between the
second cycle (Etoe,2, Elinear,2, λcorner,2, σpeak,2), sixth cycle (Etoe,2, Elinear,2, λcorner,2, σpeak,2; after
preconditioning), and corresponding fatigued parameters, defined as the average value of the last
ten cycles (Etoe,∞, Elinear, ∞, λcorner,∞, σpeak,∞). For all tests, significance was defined as p ≤ 0.05. If
significance was achieved, post hoc Tukey-Kramer analysis was performed to determine group-
wise differences.
Results
Figure C.2 Representative plot of cyclic stress vs stretch ratio and a single cycle loading portion (inset) defining the toe and linear regions. Peak stress decreases and corner stretch increases with successive cycles. A large amount of hysteresis is observed in the first cycle compared with subsequent cycles.
Peak stretch magnitude and cycle frequency were maintained for the duration of the
cyclic tests. With successive cycles, peak stress and hysteresis decreased and corner stretch
increased, moving rightward (Figure C.2). Typically, when testing the mechanical properties of
soft tissues a few (~5) preconditioning cycles are performed at experimental or sub-experimental

188
load levels to obtain repeatable results. We observe continued changes in peak stress and corner
stretch beyond the typical preconditioning realm.
We find that Etoe,2 is significantly higher than Etoe,6 and Etoe,∞, while σpeak,2 is significantly
higher than σpeak,6, which in turn is significantly higher σpeak,∞. In addition, λcorner,2 and λcorner,6 are
significantly less than λcorner,∞. On the other hand, no difference was observed between E linear,2,
Elinear,6, and Elinear,∞ (Table C.1, means and standard deviations). Taken together, these data
support evidence of classic fatigue behavior in the stress-stretch curve, with softening sustained
past the traditional preconditioning regime.
Table C.1 Mean ± standard deviation of second cycle (2), sixth cycle (6), and fatigued values (∞) of Etoe, Elinear, λcorner, and σpeak. ANOVA and post hoc Tukey-Kramer analyses show that Etoe,2 > Etoe,6 = Etoe,∞, λcorner,2 = λcorner,6 > λcorner,∞, and σpeak,2 > σpeak,6 > σpeak,∞, while there is no significant difference among E linear across cycles. p<0.006. Bracketed letters [A, B, or C] indicate which levels are significantly different. Those not sharing the same letter are significantly different from one another.
Etoe (MPa) Elinear (MPa) λcorner σpeak (MPa)
Second Cycle (2) 0.069±0.025 [A] 1.72±0.96 [A] 1.37±0.04 [A] 0.21±0.07 [A] Sixth Cycle (6) 0.037±0.022 [B] 1.68±0.92 [A] 1.38±0.04 [A] 0.17±0.06 [B] Fatigued (∞) 0.041±0.011 [B] 1.67±0.91 [A] 1.42±0.03 [B] 0.14±0.05 [C]
Discussion
We investigated the longitudinal behavior of CCAs from “toddler-like” 4 week old pigs [43]
under cyclic extension. Previous studies have reported axial displacement of the common carotid
artery wall in vivo during the normal cardiac cycle [44-53], with longitudinal strains between 1 and
8% (stretch ratios of 1.01-1.08) in the human CCA [46, 47] and between 1 and 6% (stretch ratios
of 1.01-1.06) in the adult pig [45]. Strain rate associated with this axial motion was only reported
in human CCAs, on the order of 0.2-0.4 s-1 [46]. Furthermore, the CCA is under axial tension in
vivo, and one study found axial pre-stretches of approximately 1.347 in adult porcine CCAs [54].
This pre-stretch (defined as the elongation from the traction-free length to in situ length) has also
been shown to increase with age during postnatal development in dogs [55]. Finally, in a study of
ferret CCAs the longitudinal ultimate stretch ratio as calculated from the in vitro relaxed length

189
varied between 2.53 for low rate (0.2-2 s-1) and 2.60 for high rate (~200s -1) tests [18]. Thus, our
prescribed maximum stretch ratio (1.5, relative to the traction-free state) is slightly larger than in
vivo pulsatile extension, and our stretch rate (3s -1) is about one order of magnitude higher than
pulsatile rates, anchoring our experiments as a nondestructive traumatic event rather than a
typical physiological condition.
Qualitatively similar to previous investigations [18, 19, 24, 27], we observed a biphasic
response, with a low modulus in the toe region at small stretches where crinkled collagen fibers
straighten and elastin fibers elongate from the traction-free state. At higher levels of stretch, the
stiff collagen fibers become taut and dominate the mechanical response of the artery yielding
much stiffer behavior. With continuous cycling, the biphasic behavior persisted, with a significant
decrease in toe region modulus and peak stress, and an increase in corner stretch. The limited
published data regarding the longitudinal properties of the porcine CCA under cyclic loading [25-
27] show that the majority of stress softening occurs in the initial loading cycle [25, 27], similar to
our observations regarding first cycle hysteresis (Figure C.2). The same phenomenon was
reported in human aorta [56]. We speculate that our observations of large amounts of softening
occurring in the initial cycle and softer response in the low-stretch toe region with successive
cycling may be attributed to irreversible (plastic) changes to matrix elements as collagen fibers
are pulled apart from one another transverse to their axes, or due to reorientation or damage to
collagen fibers. Indeed, several studies of ligament and tendon preconditioning have documented
changes in collagen fiber alignment towards the direction of loading with successive cycling [57,
58]. However, the levels of stretch examined in this study were not high enough to show any
appreciable change in the high-stretch linear region response with increasing numbers of loading
cycles. Future studies should investigate the role of fiber reorientation in cyclic deformation of
CCAs, and higher levels of peak stretch. To determine whether the observed softening may be
attributed to transient changes associated with viscoelasticity rather than permanent alterations
due to tissue fatigue, periods of relaxation may be prescribed between multiple loading protocols
for comparison across the same sample. Finally, future studies may use histological sections to

190
investigate if the prolonged softening, similar to the large amount of softening in the initial cycle, is
due to structural alterations in the vessel wall: either to the matrix as collagen fibers are pulled
apart, or to collagen fibers themselves by comparing unloaded samples, samples undergoing a
single cycle, and those undergoing many cycles.
Preconditioning is a procedure often used in mechanical testing of soft tissues in which a
specified loading and unloading protocol is recommended to stabilize the mechanical response of
the tissue. However, preconditioning is not a standardized procedure and the number of cycles,
peak loading parameter, and the inclusion and length of viscoelastic recovery rest periods
between cycles vary widely between studies [59]. Furthermore, it is generally accepted that a
preconditioning loading protocol should be conducted under conditions as similar as possible to
the test itself [59-65]. However, in the case of large deformation or failure testing, preconditioning
tissue to test levels may damage the tissue prior to testing [66]. No preconditioning was
performed on the samples tested in this study, as the aim of the experiments presented was to
investigate the effect of prolonged cycling on tissue response. Nonetheless, future studies should
determine the influence of a preconditioning protocol at sub-damage loading levels, perhaps to in
situ longitudinal stretches, on CCA behavior under cyclic loading.
Limitations
There are several limitations to our findings. First, vessels were moistened and tested at
room temperature, as in other studies [18, 21, 25, 26]. Future studies may evaluate properties at
body temperature. Second, we measured needle-to-needle displacement to capture average
vessel response. Investigators interested in edge effects near the grips [67] may use speckle
patterning to capture local variations in vessel stretch. Third, we stretched our CCA specimens
from their traction-free state. To capture in vivo conditions, future studies should characterize
hysteresis and fatigue in vessels stretched from their in situ length. Finally, we used a
displacement-controlled study design, and observed softening beyond the sixth cycle, as
evidenced by the increasing corner stretch point (where stress begins to increase dramatically

191
with each cycle) and decreasing peak stress. Future stress or force-controlled studies should be
conducted to confirm fatigue by an increase in creep response beyond the first few cycles.
Conclusions
To our knowledge, this study is the first to investigate cyclic loading of the CCA beyond 5
cycles [27]. We find that under subcatastrophic cyclic longitudinal extension, the immature
porcine CCA displays softening behavior. This softening can be represented by decreasing toe
region modulus and peak stress as well as increasing corner stretch with an increasing number of
loading cycles. This investigation is an important first step in modeling fatigue-like behavior in
arterial tissue that may be subjected to repeated longitudinal loads.
Acknowledgements
We would like to thank Amy Clevenger and Jill Ralston for their technical assistance. We
are grateful for the support of the American Heart Association (12PRE12040315), the National
Institutes of Health (U01 NS069545 and R21 HD078842), and the University of Pennsylvania
Rachleff Scholars Program. Study sponsors had no role in study design, data collection,
interpretation, manuscript writing, or submission. The authors (Pasquesi, Liu, and Margulies)
have no relationships or obligations with individuals or organizations that could bias our findings.
References
1. Faul, M., et al., Traumatic Brain Injury in the United States: Emergency Department
Visits, Hospitalizations and Deaths 2002-2006., 2010, Centers for Disease Control and
Prevention, National Center for Injury Prevention and Control: Atlanta, GA.
2. Duckles, S.P., R.D. Bevan, and J.A. Bevan, An in vitro study of prolonged vasospasm of
a rabbit cerebral artery. Stroke, 1976. 7(2): p. 174-8.

192
3. Tanaka, Y., K. Shigenobu, and K. Nakayama, Inhibitory actions of various vasorelaxants
on the myogenic contraction induced by quick stretch studied in canine cerebral artery.
European Journal of Pharmacology, 1998. 356(2-3): p. 225-230.
4. Nakayama, K., Calcium-Dependent Contractile Activation of Cerebral-Artery Produced by
Quick Stretch. American Journal of Physiology, 1982. 242(5): p. H760-H768.
5. O'Brien, N.F., et al., Vasospasm in children with traumatic brain injury. Intensive Care
Med, 2010. 36(4): p. 680-7.
6. Clevenger, A.C., T.J. Kilbaugh, and S.S. Margulies, Carotid Artery Blood Flow Decreases
After Rapid Head Rotation in Piglets. Journal of Neurotrauma, 2014.
7. Eucker, S.A., et al., Physiological and histopathological responses following closed
rotational head injury depend on direction of head motion. Exp Neurol, 2011. 227(1): p.
79-88.
8. Friess, S.H., et al., Neurocritical care monitoring correlates with neuropathology in a
swine model of pediatric traumatic brain injury. Neurosurgery, 2011. 69(5): p. 1139-47;
discussion 1147.
9. Oishi, Y., et al., Vascular aging of common carotid artery and abdominal aorta in clinically
normal individuals and preclinical patients with cardiovascular risk factors: diagnostic
value of two-dimensional speckle-tracking echocardiography. Heart Vessels, 2013. 28(2):
p. 222-8.
10. Cox, R.H., Effects of age on the mechanical properties of rat carotid artery. American
Journal of Physiology, 1977. 233(2): p. H256-63.
11. Zanchi, A., H.R. Brunner, and D. Hayoz, Age-related changes of the mechanical
properties of the carotid artery in spontaneously hypertensive rats. J Hypertens, 1997.
15(12 Pt 1): p. 1415-22.
12. Masson, I., et al., Carotid artery mechanical properties and stresses quantified using in
vivo data from normotensive and hypertensive humans. Biomech Model Mechanobiol,
2011. 10(6): p. 867-82.

193
13. Benetos, A., et al., Role of adrenergic tone in mechanical and functional properties of
carotid artery during aging. American Journal of Physiology, 1993. 265(4 Pt 2): p. H1132-
8.
14. Lanne, T., et al., Differences in mechanical properties of the common carotid artery and
abdominal aorta in healthy males. J Vasc Surg, 1994. 20(2): p. 218-25.
15. Humphrey, J.D., et al., Fundamental role of axial stress in compensatory adaptations by
arteries. J Biomech, 2009. 42(1): p. 1-8.
16. Wagenseil, J.E. and R.P. Mecham, Elastin in large artery stiffness and hypertension. J
Cardiovasc Transl Res, 2012. 5(3): p. 264-73.
17. Safar, M.E., et al., Stiffness of carotid artery wall material and blood pressure in humans:
application to antihypertensive therapy and stroke prevention. Stroke, 2000. 31(3): p.
782-90.
18. Lee, M.C. and R.C. Haut, Strain rate effects on tensile failure properties of the common
carotid artery and jugular veins of ferrets. J Biomech, 1992. 25(8): p. 925-7.
19. Weizsacker, H.W., H. Lambert, and K. Pascale, Analysis of the passive mechanical
properties of rat carotid arteries. J Biomech, 1983. 16(9): p. 703-15.
20. Dye, W.W., et al., Altered biomechanical properties of carotid arteries in two mouse
models of muscular dystrophy. J Appl Physiol (1985), 2007. 103(2): p. 664-72.
21. Williams, C., et al., Altered structural and mechanical properties in decellularized rabbit
carotid arteries. Acta Biomater, 2009. 5(4): p. 993-1005.
22. Wan, W., H. Yanagisawa, and R.L. Gleason, Jr., Biomechanical and microstructural
properties of common carotid arteries from fibulin-5 null mice. Ann Biomed Eng, 2010.
38(12): p. 3605-17.
23. Ning, J., et al., Deformation measurements and material property estimation of mouse
carotid artery using a microstructure-based constitutive model. J Biomech Eng, 2010.
132(12): p. 121010.

194
24. Silver, F.H., P.B. Snowhill, and D.J. Foran, Mechanical behavior of vessel wall: a
comparative study of aorta, vena cava, and carotid artery. Ann Biomed Eng, 2003. 31(7):
p. 793-803.
25. Garcia, A., M.A. Martinez, and E. Pena, Viscoelastic properties of the passive mechanical
behavior of the porcine carotid artery: influence of proximal and distal positions.
Biorheology, 2012. 49(4): p. 271-88.
26. Garcia, A., M.A. Martinez, and E. Pena, Determination and modeling of the inelasticity
over the length of the porcine carotid artery. J Biomech Eng, 2013. 135(3): p. 31004.
27. Maher, E., et al., Site specific inelasticity of arterial tissue. J Biomech, 2012. 45(8): p.
1393-9.
28. Pukacki, F., et al., The mechanical properties of fresh and cryopreserved arterial
homografts. Eur J Vasc Endovasc Surg, 2000. 20(1): p. 21-4.
29. Adham, M., et al., Mechanical characteristics of fresh and frozen human descending
thoracic aorta. J Surg Res, 1996. 64(1): p. 32-4.
30. Armentano, R.L., et al., An in vitro study of cryopreserved and fresh human arteries: a
comparison with ePTFE prostheses and human arteries studied non-invasively in vivo.
Cryobiology, 2006. 52(1): p. 17-26.
31. Bia, D., et al., Cryopreservation procedure does not modify human carotid homografts
mechanical properties: an isobaric and dynamic analysis. Cell Tissue Bank, 2006. 7(3): p.
183-94.
32. Bia, D., et al., Femoral arteries energy dissipation and filtering function remain
unchanged after cryopreservation procedure. Transpl Int, 2005. 18(12): p. 1346-55.
33. Langerak, S.E., et al., Impact of current cryopreservation procedures on mechanical and
functional properties of human aortic homografts. Transpl Int, 2001. 14(4): p. 248-55.
34. Masson, I., et al., Mechanical properties of arteries cryopreserved at -80 degrees C and -
150 degrees C. Med Eng Phys, 2009. 31(7): p. 825-32.
195
35. Stemper, B.D., et al., Mechanics of fresh, refrigerated, and frozen arterial tissue. J Surg
Res, 2007. 139(2): p. 236-42.
36. Monson, K.L., N.M. Barbaro, and G.T. Manley, Biaxial response of passive human
cerebral arteries. Ann Biomed Eng, 2008. 36(12): p. 2028-41.
37. Bell, E.D., R.S. Kunjir, and K.L. Monson, Biaxial and failure properties of passive rat
middle cerebral arteries. J Biomech, 2013. 46(1): p. 91-6.
38. Aggoun, Y., et al., Mechanical properties of the common carotid artery in Williams
syndrome. Heart, 2000. 84(3): p. 290-3.
39. Stabouli, S., et al., Blood pressure and carotid artery intima-media thickness in children
and adolescents: the role of obesity. Hellenic J Cardiol, 2012. 53(1): p. 41-7.
40. Miersch, A., et al., Influence of seasonal variation on blood pressure measurements in
children, adolescents and young adults. Pediatr Nephrol, 2013. 28(12): p. 2343-9.
41. Prange, M.T., et al., Anthropomorphic simulations of falls, shakes, and inflicted impacts in
infants. J Neurosurg, 2003. 99(1): p. 143-50.
42. Duhaime, A.C., et al., The shaken baby syndrome. A clinical, pathological, and
biomechanical study. J Neurosurg, 1987. 66(3): p. 409-15.
43. Duhaime, A.C., Large animal models of traumatic injury to the immature brain. Dev
Neurosci, 2006. 28(4-5): p. 380-7.
44. Zahnd, G., et al., Measurement of two-dimensional movement parameters of the carotid
artery wall for early detection of arteriosclerosis: a preliminary clinical study. Ultrasound
Med Biol, 2011. 37(9): p. 1421-9.
45. Tozzi, P., et al., Systolic axial artery length reduction: an overlooked phenomenon in vivo.
Am J Physiol Heart Circ Physiol, 2001. 280(5): p. H2300-5.
46. Svedlund, S. and L.M. Gan, Longitudinal wall motion of the common carotid artery can be
assessed by velocity vector imaging. Clin Physiol Funct Imaging, 2011. 31(1): p. 32-8.
47. Golemati, S., et al., Carotid artery wall motion estimated from B-mode ultrasound using
region track ing and block matching. Ultrasound Med Biol, 2003. 29(3): p. 387-99.

196
48. Cinthio, M. and A.R. Ahlgren, Intra-observer variability of longitudinal displacement and
intramural shear strain measurements of the arterial wall using ultrasound noninvas ively
in vivo. Ultrasound Med Biol, 2010. 36(5): p. 697-704.
49. Cinthio, M., et al., Longitudinal movements and resulting shear strain of the arterial wall.
Am J Physiol Heart Circ Physiol, 2006. 291(1): p. H394-402.
50. Cinthio, M., et al., Evaluation of an ultrasonic echo-tracking method for measurements of
arterial wall movements in two dimensions. IEEE Trans Ultrason Ferroelectr Freq
Control, 2005. 52(8): p. 1300-11.
51. Persson, M., et al., A new non-invasive ultrasonic method for simultaneous
measurements of longitudinal and radial arterial wall movements: first in vivo trial. Clin
Physiol Funct Imaging, 2003. 23(5): p. 247-51.
52. L'Italien, G.J., et al., Biaxial elastic properties of rat arteries in vivo: influence of vascular
wall cells on anisotropy. American Journal of Physiology, 1994. 267(2 Pt 2): p. H574-9.
53. Yli-Ollila, H., et al., Axial and radial waveforms in common carotid artery: an advanced
method for studying arterial elastic properties in ultrasound imaging. Ultrasound Med Biol,
2013. 39(7): p. 1168-77.
54. Garcia, A., et al., Experimental study and constitutive modelling of the passive
mechanical properties of the porcine carotid artery and its relation to histological analysis:
Implications in animal cardiovascular device trials. Med Eng Phys, 2011. 33(6): p. 665-
76.
55. Dobrin, P., T. Canfield, and S. Sinha, Development of longitudinal retraction of carotid
arteries in neonatal dogs. Experientia, 1975. 31(11): p. 1295-6.
56. Horny, L., et al., Mullins Effect in Aorta and Limiting Extensibility Evolution. Bulletin of
Applied Mechanics, 2010. 6(21): p. 1-5.
57. Miller, K.S., et al., Effect of preconditioning and stress relaxation on local collagen fiber
re-alignment: inhomogeneous properties of rat supraspinatus tendon. J Biomech Eng,
2012. 134(3): p. 031007.

197
58. Quinn, K.P. and B.A. Winkelstein, Preconditioning is correlated with altered collagen fiber
alignment in ligament. J Biomech Eng, 2011. 133(6): p. 064506.
59. Tonge, T.K., et al., Minimal preconditioning effects observed for inflation tests of planar
tissues. J Biomech Eng, 2013. 135(11): p. 114502.
60. Tanaka, T.T. and Y.C. Fung, Elastic and inelastic properties of the canine aorta and their
variation along the aortic tree. J Biomech, 1974. 7(4): p. 357-70.
61. Lanir, Y. and Y.C. Fung, Two-dimensional mechanical properties of rabbit skin. II.
Experimental results. J Biomech, 1974. 7(2): p. 171-82.
62. Eshel, H. and Y. Lanir, Effects of strain level and proteoglycan depletion on
preconditioning and viscoelastic responses of rat dorsal skin. Ann Biomed Eng, 2001.
29(2): p. 164-72.
63. Cheng, S., E.C. Clarke, and L.E. Bilston, The effects of preconditioning strain on
measured tissue properties. J Biomech, 2009. 42(9): p. 1360-2.
64. Carew, E.O., J.E. Barber, and I. Vesely, Role of preconditioning and recovery time in
repeated testing of aortic valve tissues: validation through quasilinear viscoelastic theory.
Ann Biomed Eng, 2000. 28(9): p. 1093-100.
65. Fung, Y.C., Biomechanics : mechanical properties of living tissues. 2nd ed1993, New
York: Springer-Verlag. xviii, 568 p.
66. Shah, C.S., et al., Dynamic biaxial tissue properties of the human cadaver aorta. Stapp
Car Crash J, 2006. 50: p. 217-46.
67. Monson, K.L., V. Mathur, and D.A. Powell, Deformations and end effects in isolated blood
vessel testing. J Biomech Eng, 2011. 133(1): p. 011005.

198
APPENDIX D: AVERAGED BRIDGING VEIN STRESS-STRETCH CURVES
Porcine Newborn High Rate Averaged Bridging Vein Stress-Stretch Curve. Black ‘X’ represents average high rate ultimate stretch failure criterion.
Porcine Newborn Post-Cyclic Averaged Bridging Vein Stress-Stretch Curve. Black ‘X’ represents average high rate ultimate stretch failure criterion.

199
Human Infant High Rate Averaged Bridging Vein Stress-Stretch Curve. Black ‘X’ represents average high rate ultimate stretch failure criterion.
Human Infant Post-Cyclic Averaged Bridging Vein Stress-Stretch Curve. Black ‘X’ represents average high rate ultimate stretch failure criterion.

200
APPENDIX E: SAGITTAL PLANE PHYSICAL TRANSECTION BRAIN-SKULL
DISPLACEMENT TIME-HISTORIES

201

202

203

204

205

206
APPENDIX F: ALTERNATE MEASURES OF NEONATAL PORCINE ROTATIONAL
INJURY KINEMATICS
F.1 Single Low Level Rotational Injury Kinematics Determined from Raw Angular
Velocity and Gaussian Smoothed Angular Acceleration Traces
Table F.1 Single low level sagittal rotational injury kinematics as determined from raw velocity and Gaussian smoothed acceleration traces. All values are averaged across Ncrit determination groups and all studies.
Subject
Ncrit
Determination
Group
Survival
Time
Peak Angular
Velocity
(rad/s)
Peak Angular
Acceleration
(krad/s2)
Peak Angular
Deceleration
(krad/s2)
090924; 1L Development 3-8 hour 34.7 3.1 4.3
090929; 2L Development 3-8 hour 41.0 3.1 3.9
091112; 3L Development 3-8 hour 39.5 3.6 5.7
110504B-2; 4L Development 24 hour 51.3 5.8 17.0
110511B-1; 5L Development 24 hour 43.3 5.6 16.6
110511B-2; 6L Development 24 hour 41.3 3.8 11.8
110520-2;7L Development 24 hour 34.7 4.7 10.3
091110; 8L Validation 3-8 hour 33.3 2.7 4.1
091124; 9L Validation 3-8 hour 37.4 2.9 6.1
110504B-1; 10L Validation 24 hour 51.1 5.5 14.5
110520-1; 11L Validation 24 hour 37.1 5.0 10.4
40.8±5.7 4.2±1.1 9.9±5.5
39.7±7.8 4.0±1.4 8.8±4.6
40.4±6.2 4.2±1.2 9.5±5.0
Development Group Average
Validation Group Average
Overall Average

207
F.2 Single High Level Rotational Injury Kinematics Determined from Raw Angular
Velocity and Gaussian Smoothed Angular Acceleration Traces
Table F.2 Single high level sagittal rotational injury kinematics as determined from raw velocity and Gaussian smoothed acceleration traces. All values are averaged across Ncrit determination groups and all studies.
Subject
Ncrit
Determination
Group
Survival
Time
Peak Angular
Velocity
(rad/s)
Peak Angular
Acceleration
(krad/s2)
Peak Angular
Deceleration
(krad/s2)
060517; 1H Development 3-8 hour 166.7 65.8 111.0
060811; 2H Development 3-8 hour 169.7 61.4 78.1
070830; 3H Development 3-8 hour 160.5 43.6 54.2
090721-1; 4H Development 3-8 hour 150.2 38.2 68.6
100408-1; 5H Development 3-8 hour 157.5 41.7 61.4
100422D-2; 6H Development 3-8 hour 139.2 37.4 139.5
110224; 7H Development 3-8 hour 151.4 32.2 90.5
110520-4; 8H Development 3-8 hour 148.8 32.7 90.5
080604; 9H Development 24 hour 145.0 34.9 53.3
090729-1; 10H Development 24 hour 151.8 35.7 78.8
090729-3; 11H Development 24 hour 152.6 35.6 70.7
110202-1; 12H Development 24 hour 150.7 33.1 80.4
110202-2; 13H Development 24 hour 150.8 32.8 77.2
110217; 14H Development 24 hour 149.8 33.7 80.9
110304-1; 15H Development 24 hour 147.4 29.9 72.6
110615-1; 16H Development 24 hour 155.9 33.4 106.9
110615-2; 17H Development 24 hour 153.0 29.4 91.1
060914; 18H Validation 3-8 hour 169.6 58.6 59.3
110128; 19H Validation 3-8 hour 156.6 40.9 87.4
110520-3; 20H Validation 3-8 hour 148.3 28.7 83.9
080606-1; 21H Validation 24 hour 149.9 34.1 55.8
090722-1; 22H Validation 24 hour 151.8 39.1 70.7
090722-2; 23H Validation 24 hour 151.1 39.4 69.3
090729-2; 24H Validation 24 hour 150.6 35.7 77.1
110304-2; 25H Validation 24 hour 147.3 32.5 86.5
153.0±7.4 38.3±10.2 82.7±21.6
153.2±7.2 38.6±9.0 73.8±12.1
153.0±7.2 38.4±9.7 79.8±19.3
Development Group Average
Validation Group Average
Overall Average

208
F.3 Cyclic Rotational Injury Kinematics Determined from the Entire Injury History
Trace
S
ub
ject
Ro
tati
on
al
Pla
ne
Su
rviv
al
Tim
e
Ave
rag
e
Fre
qu
en
cy
(Hz)
Ave
rag
e P
ea
k-
Pe
ak A
ng
ula
r
Ve
locit
y (
rad
/s)
Ma
xim
um
Pe
ak-
Pe
ak A
ng
ula
r
Ve
locit
y (
rad
/s)
Ave
rag
e P
ea
k
Acce
lera
tio
n
Ma
gn
itu
de
(ra
d/s
2)
Ma
xim
um
Pe
ak
Acce
lera
tio
n
Ma
gn
itu
de
(ra
d/s
2)
To
tal
Ce
reb
rum
EA
H (
%)
Nfa
il
090407;
1C
Sagitta
l3-8
hr
2.1
8±0.3
019.3
±1.8
20.6
493±81
634
0.0
%0
090618;
2C
Sagitta
l3-8
hr
2.5
0±0.3
923.4
±2.3
24.7
818±174
1307
0.0
%0
091015;
3C
Sagitta
l3-8
hr
2.4
8±0.4
024.0
±2.7
26.2
536±97
671
0.7
%0
091105;
4C
Sagitta
l3-8
hr
2.7
3±0.4
826.4
±3.4
28.6
736±270
1161
0.3
%0
091218;
5C
Axia
l3-8
hr
2.7
3±0.4
428.0
±3.8
32.1
814±296
1424
0.0
%0
100526;
6C
Axia
l3-8
hr
2.8
9±0.2
730.7
±2.4
35.2
691±205
1166
0.0
%0
100106;
7C
Axia
l24 h
r2.7
3±0.3
629.0
±3.2
31.2
1001±403
1719
1.8
%0
100213;
8C
Axia
l24 h
r2.7
7±0.4
226.8
±3.5
33.7
869±293
1643
2.7
%0
100610;
9C
Axia
l24 h
r2.8
4±0.2
731.4
±2.3
38.5
711±273
1440
0.0
%0
100630;
10C
Axia
l24 h
r2.8
5±0.2
928.5
±1.3
30.8
733±317
1248
0.0
%0
2.7
0±0.2
226.8
±3.7
30.2
±5.3
740±150
1241±361
0.5
±0.9
%0
Ove
rall
Ave
rag
e

209
APPENDIX G: PORCINE FINITE ELEMENT MODEL SIMULATED ANGULAR
VELOCITY, SIMULATED ANGULAR ACCELERATION, AND BRIDGING VEIN
FAILURE - TIME HISTORIES
G.1 Single Low Level Sagittal Finite Element Simulated Kinematics and Resulting
Bridging Vein Element Failures Across Time

210

211

212

213

214

215

216
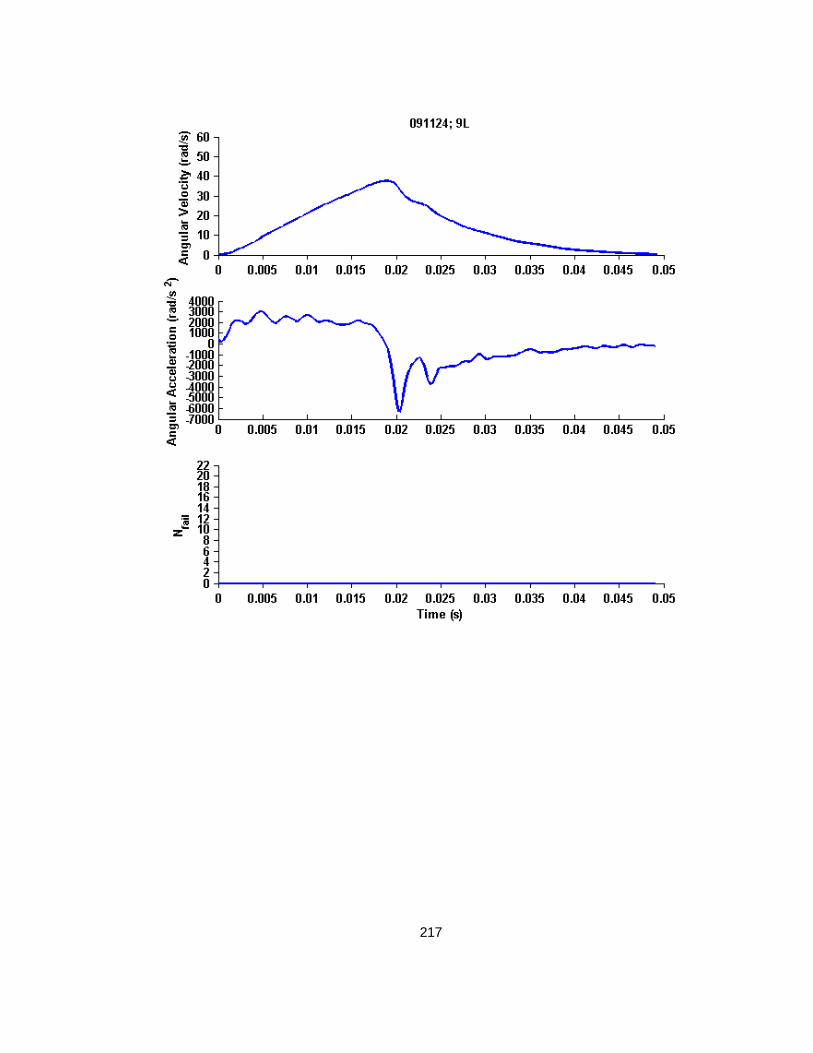
217

218

219

220
G.2 Single High Level Sagittal Finite Element Simulated Kinematics and Resulting
Bridging Vein Element Failures Across Time

221

222

223

224

225

226

227

228

229

230

231
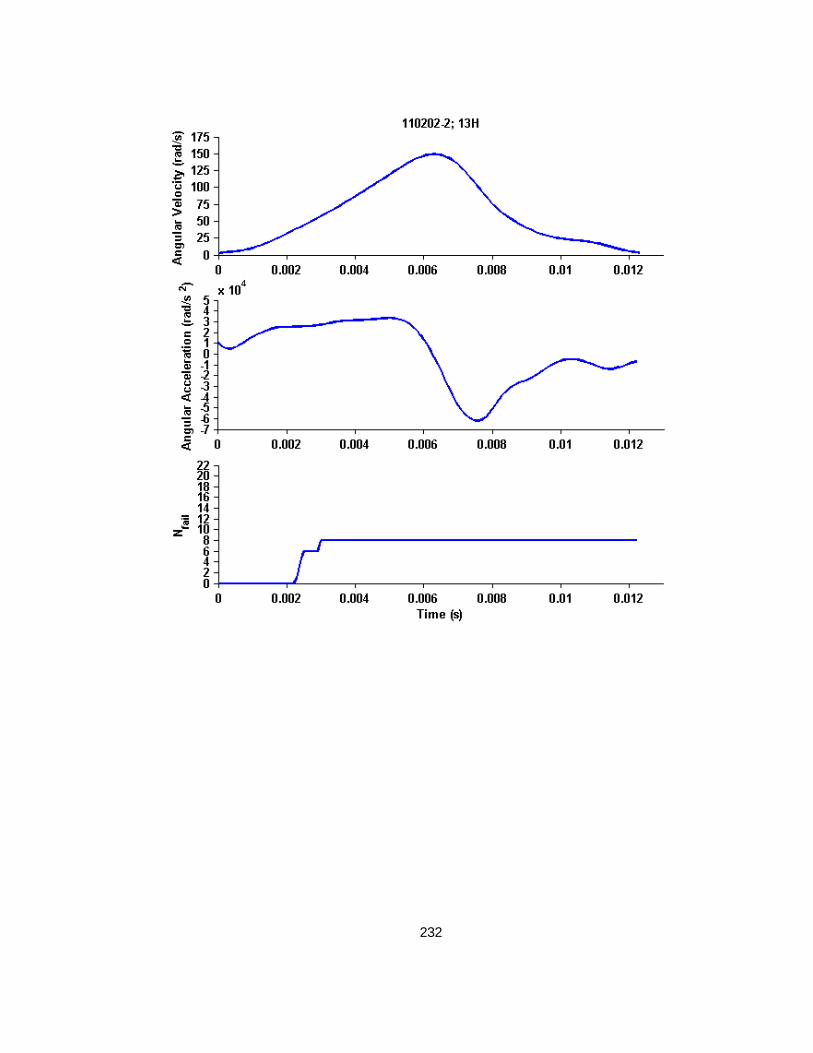
232

233
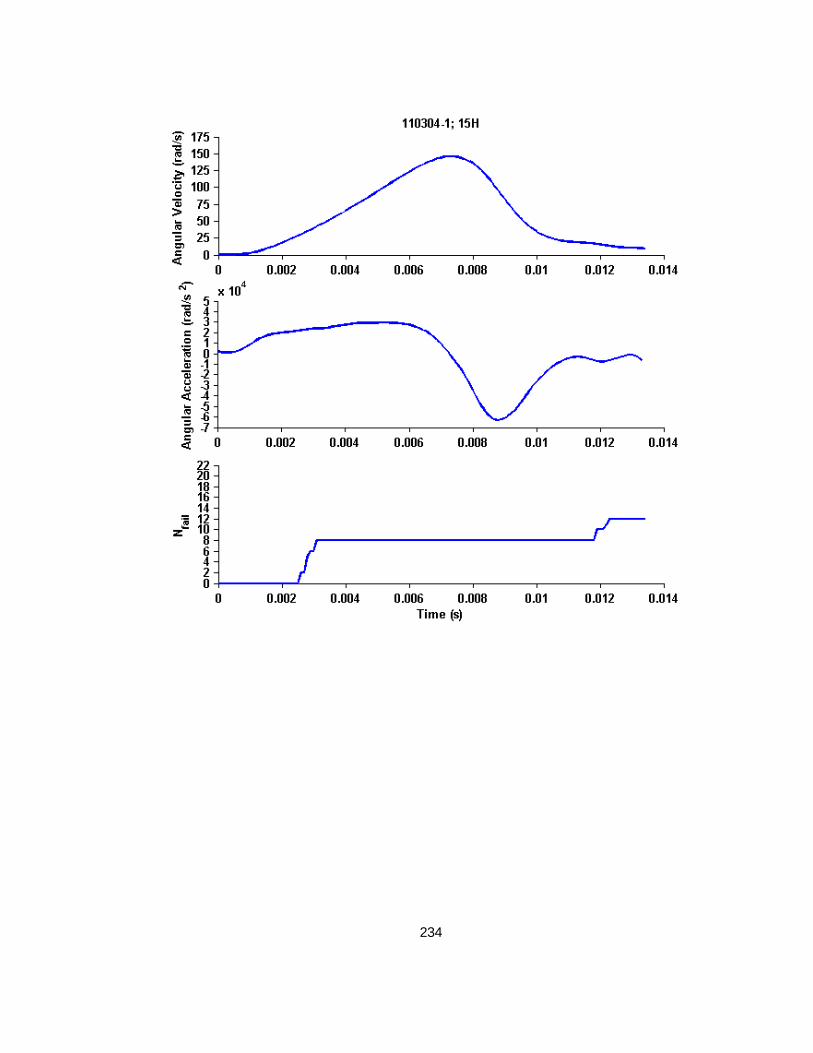
234

235

236

237

238

239

240

241

242

243
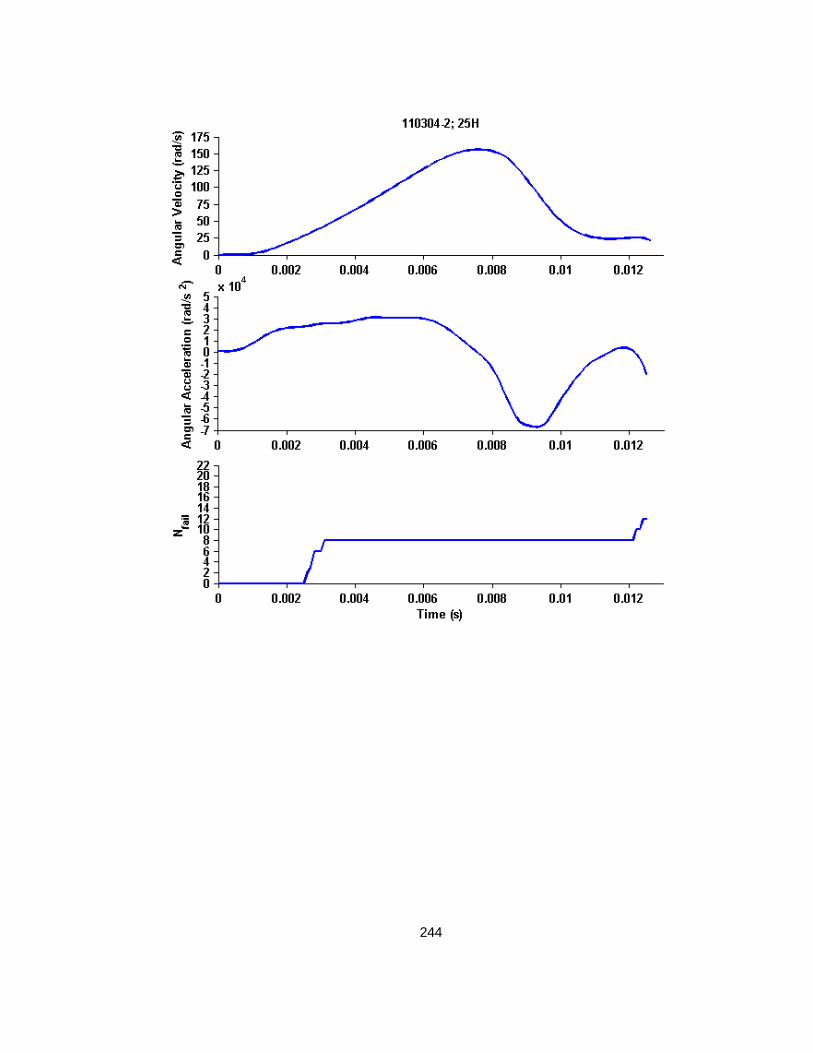
244

245
G.1 Cyclic Finite Element Simulated Kinematics and Resulting Bridging Vein
Element Failures Across Time

246

247

248

249

250

251

252

253
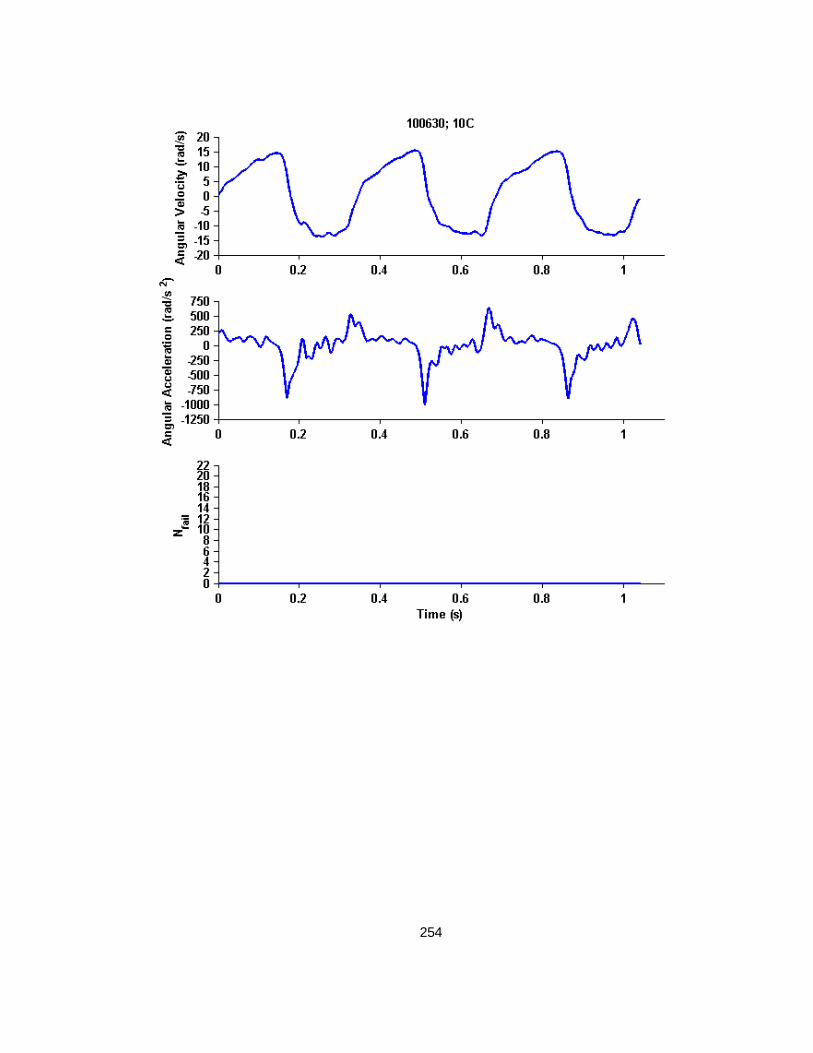
254

255
APPENDIX H: INSTRUMENTED SURROGATE SHAKING TRACES
H.1 Trial 1 Shakes, without Instruction to use Maximum Neck Range of Motion

256

257
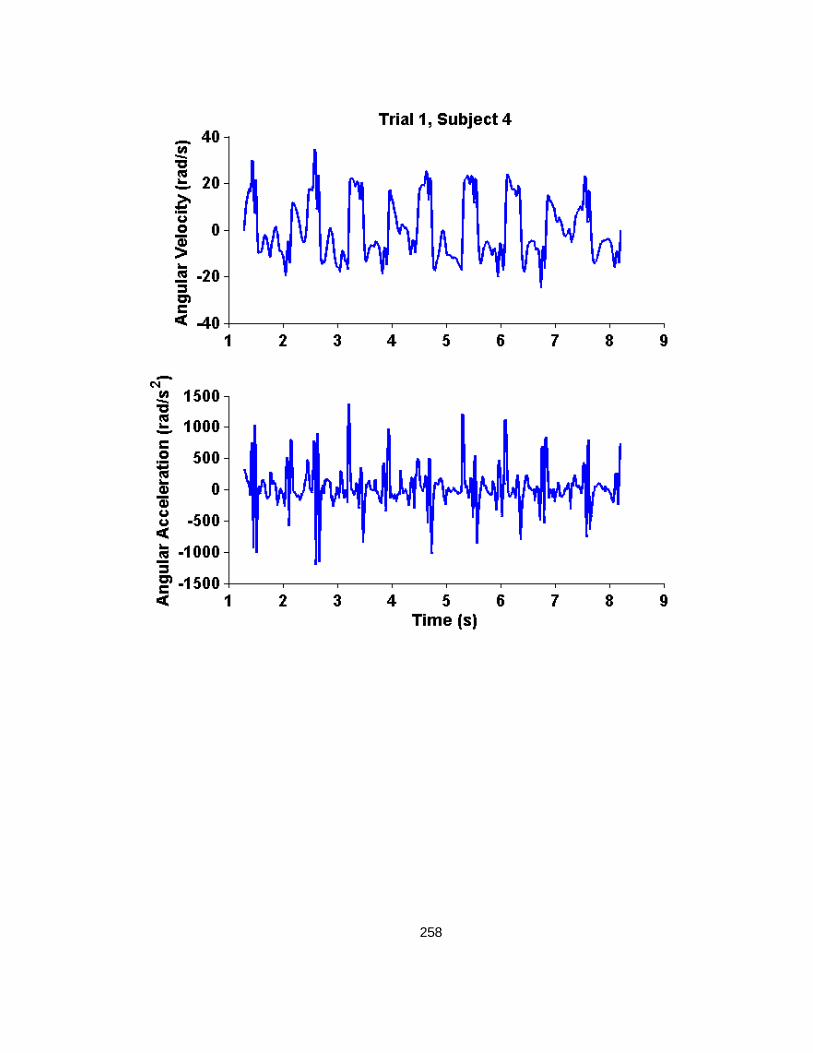
258

259

260

261

262

263

264

265
H.2 Trial 2 Shakes, with Instruction to use Maximum Neck Range of Motion

266

267

268

269

270

271

272

273

274

275
APPENDIX I: HUMAN FINITE ELEMENT MODEL SIMULATED VELOCITY,
SIMULATED ACCELERATION, AND BRIDGING VEIN FAILURE - TIME HISTORIES

276

277

278

279

280

281

282
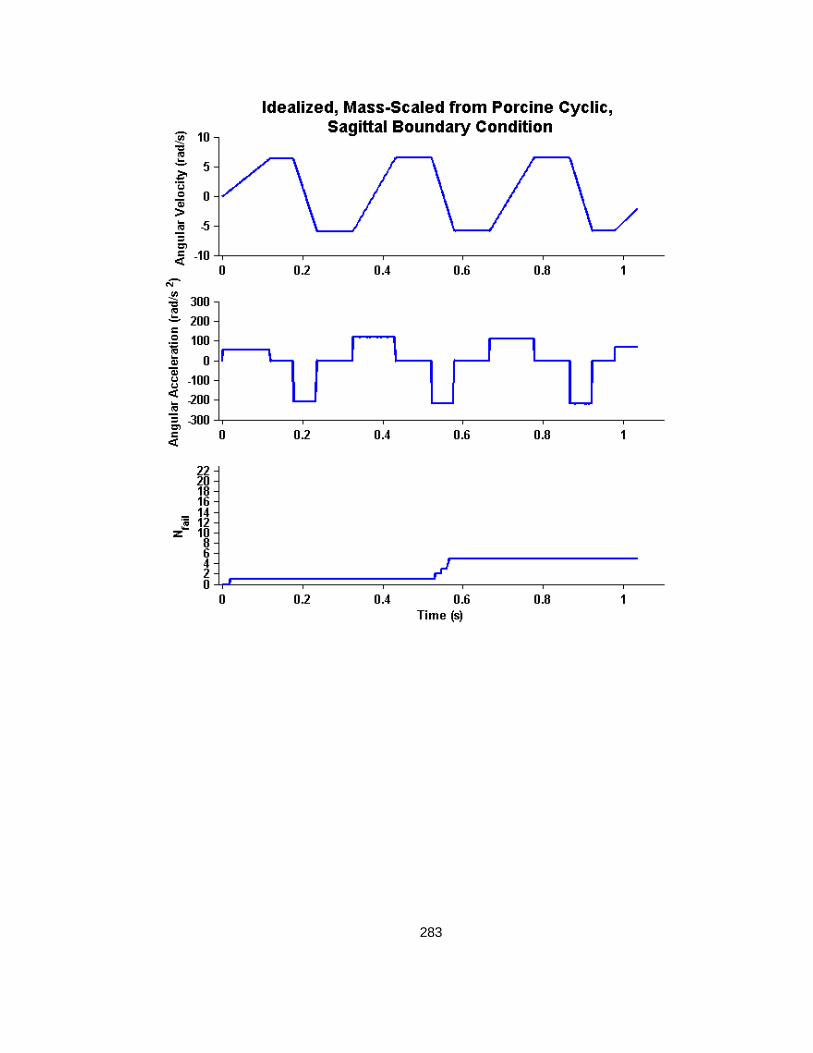
283

284