Embed Size (px)
Citation preview
Can you tell me what these mean?
Definitions:Opportunity Costs, Resources are scarce,
trade-off, incentive, specialization, equilibrium, interaction of choices, efficiency.
BU 204 MACROECONOMICSCHAPTER 2
Economic Models: Trade-Offs and Trade
What you will learn in this chapter:
Why models? Simplified representations of reality play a
crucial role in economics.Three simple but important models:
Production possibility frontierComparative advantageCircular-flow diagram
The difference between positive economics and normative economics.When economists agree and why they sometimes disagree.
Models in Economics:
A model is a simplified representation of a real situation that is used to better understand real-life situations.
The production possibility frontier (PPF) illustrates the trade-offs facing an economy that produces only two goods. It shows the maximum quantity of one good that can be produced for any given production of the other.
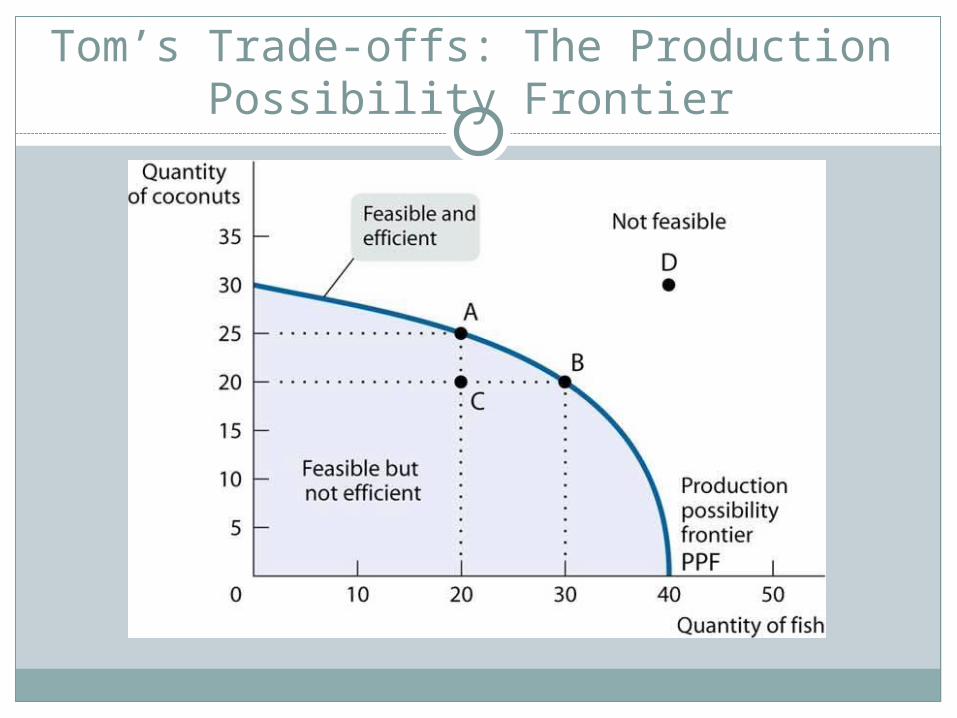
Tom’s Trade-offs: The Production Possibility Frontier
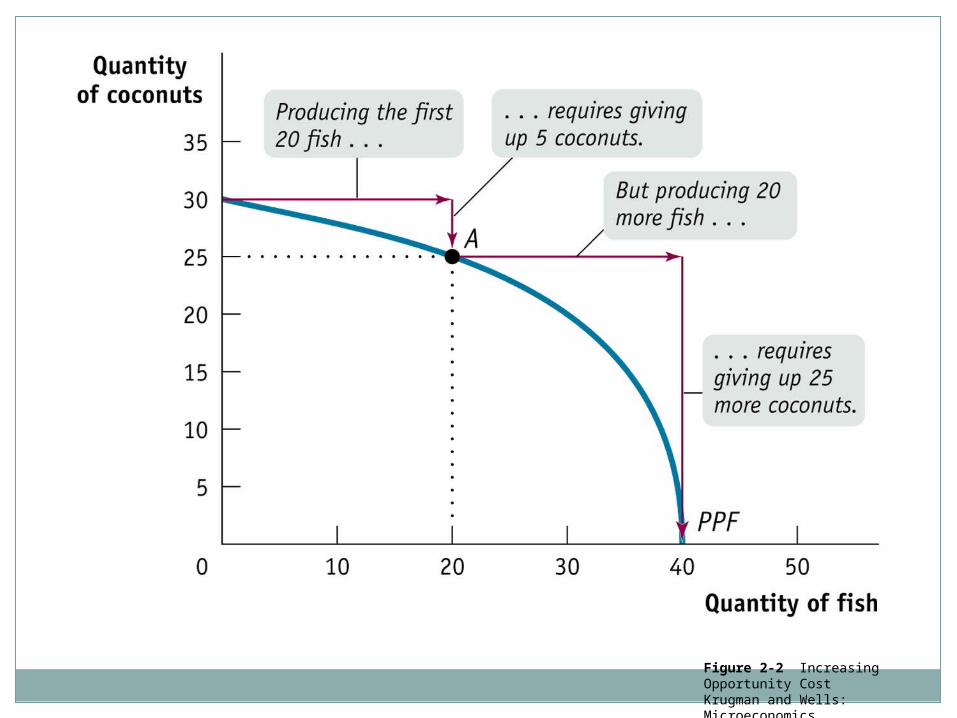
Figure 2-2 Increasing Opportunity CostKrugman and Wells: MicroeconomicsCopyright © 2005 by Worth Publishers
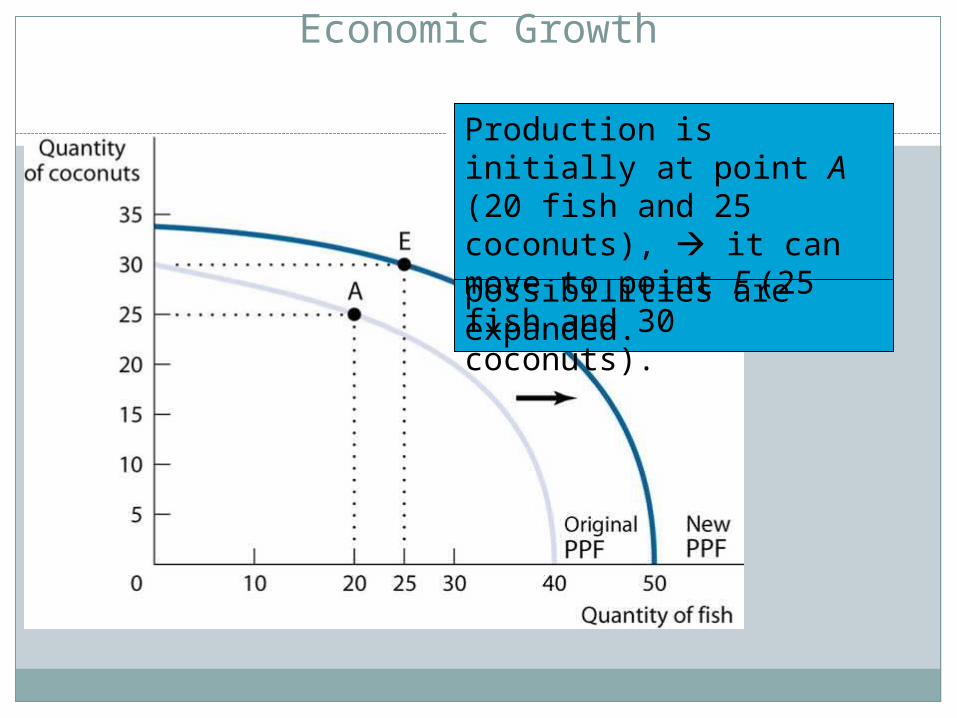
Economic Growth
7Economic growth results in an outward shift of the PPF because production possibilities are expanded.
The economy can now produce more of everything.
Production is initially at point A (20 fish and 25 coconuts), it can move to point E (25 fish and 30 coconuts).
Production Possibility Frontier
Improve understanding of trade offsIllustrates efficiencyShows opportunity costsSee economic growthWith Trade a country can consume outside
its PPF

PPF Efficiency
1. Point A to B show increase in number of computers and decrease in food produced.
2. Resource are taken from food to produce computers.
3. All points on curve show maximum productive efficiency
4. Points inside curve are feasible but inefficient
5. Points outside of curve are
infeasible
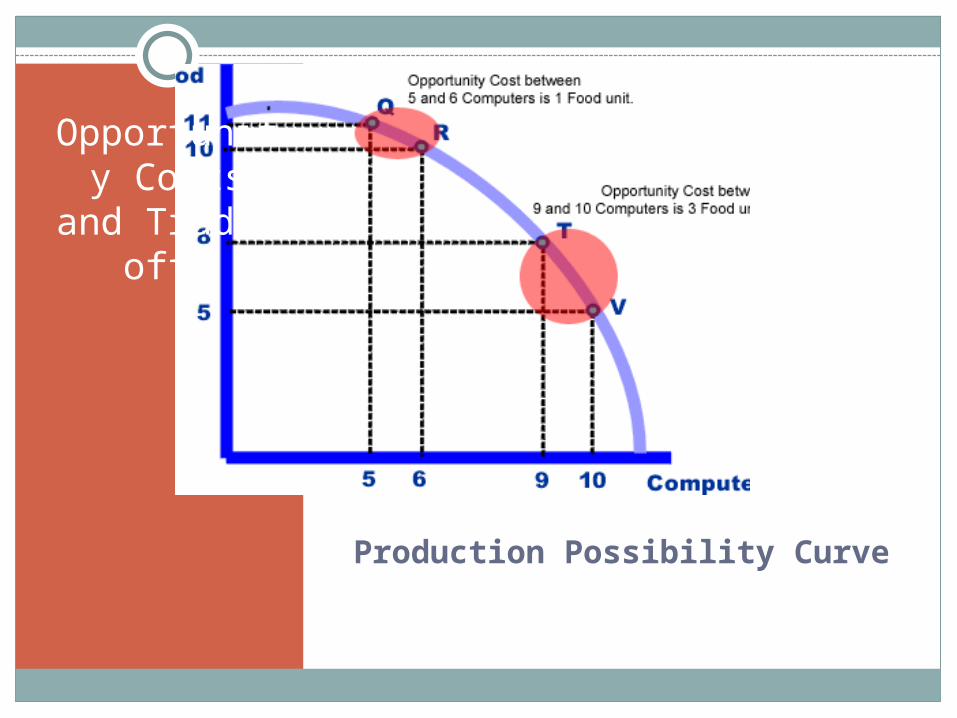
Production Possibility Curve
Opportunity Costs and Trade-offs
Comparative Advantage Model
An individual has “comparative advantage” in producing a good if the opportunity cost is lower than it would be for someone else
An individual has “absolute advantage” if he/she can produce more than someone else can
Comparative advantage not absolute advantage is the basis for gains in trade
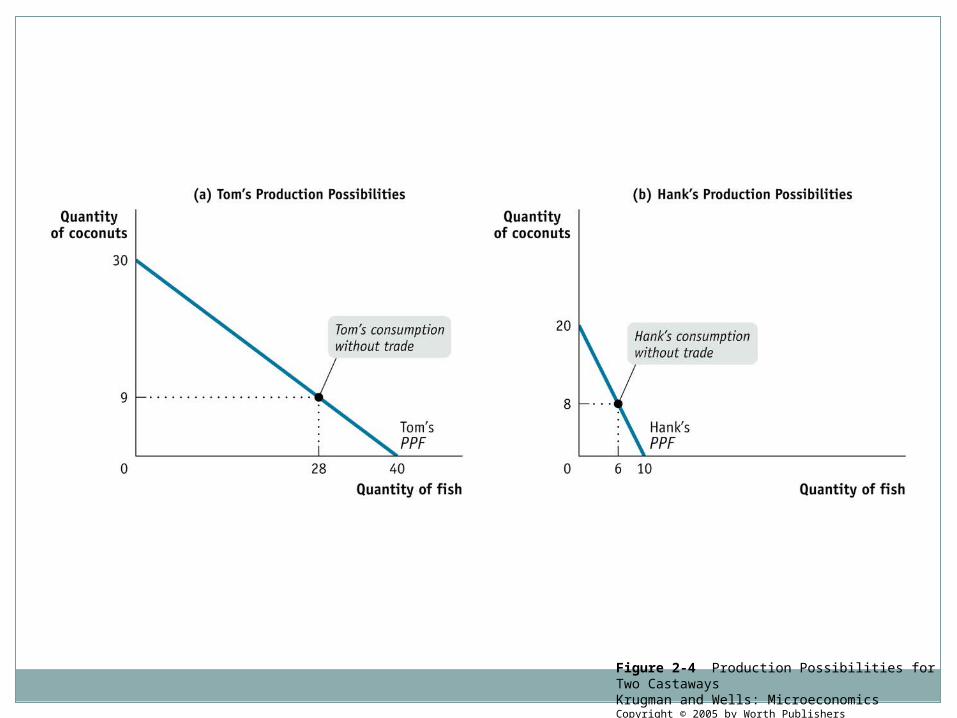
Figure 2-4 Production Possibilities for Two CastawaysKrugman and Wells: MicroeconomicsCopyright © 2005 by Worth Publishers
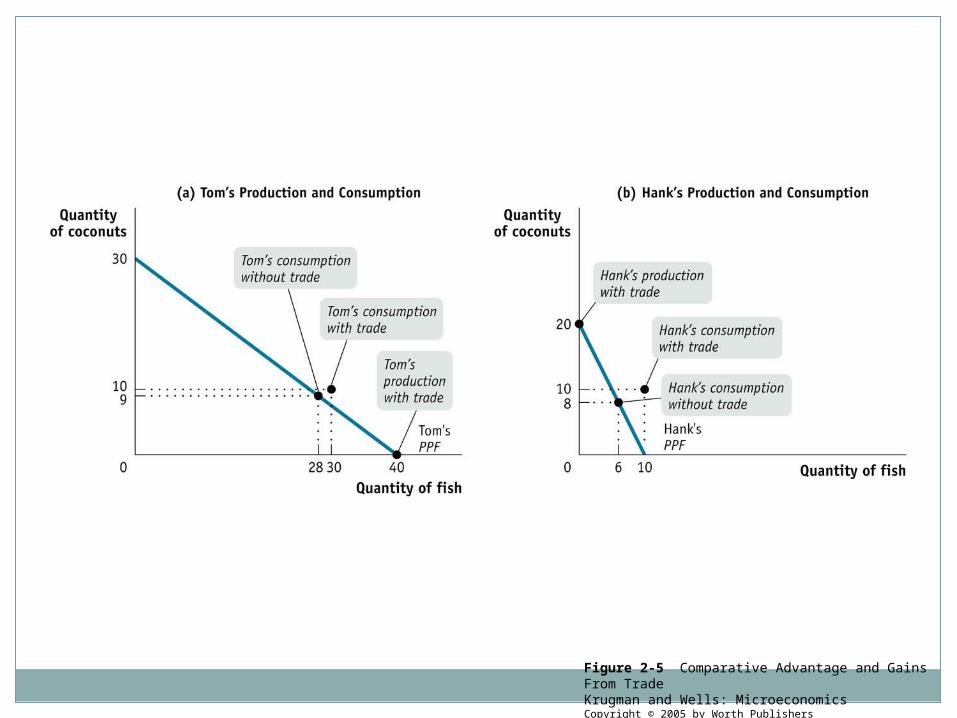
Figure 2-5 Comparative Advantage and Gains From TradeKrugman and Wells: MicroeconomicsCopyright © 2005 by Worth Publishers
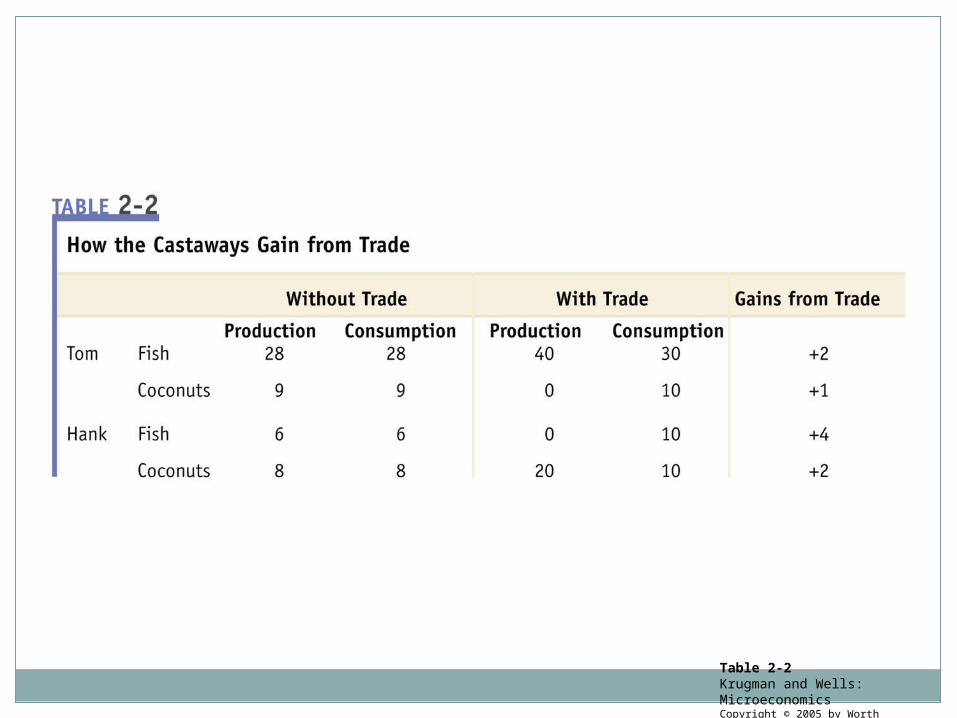
Table 2-2Krugman and Wells: MicroeconomicsCopyright © 2005 by Worth Publishers
Circular Flow Diagram
Model that shows transactions by flows around a circle
Household defined as a person or group who share their income
A firm is an organization that produces good or service
Market for Goods-where firms sellFactor Markets-where firms buy resources

Figure 2-7 The Circular-Flow DiagramKrugman and Wells: MicroeconomicsCopyright © 2005 by Worth Publishers
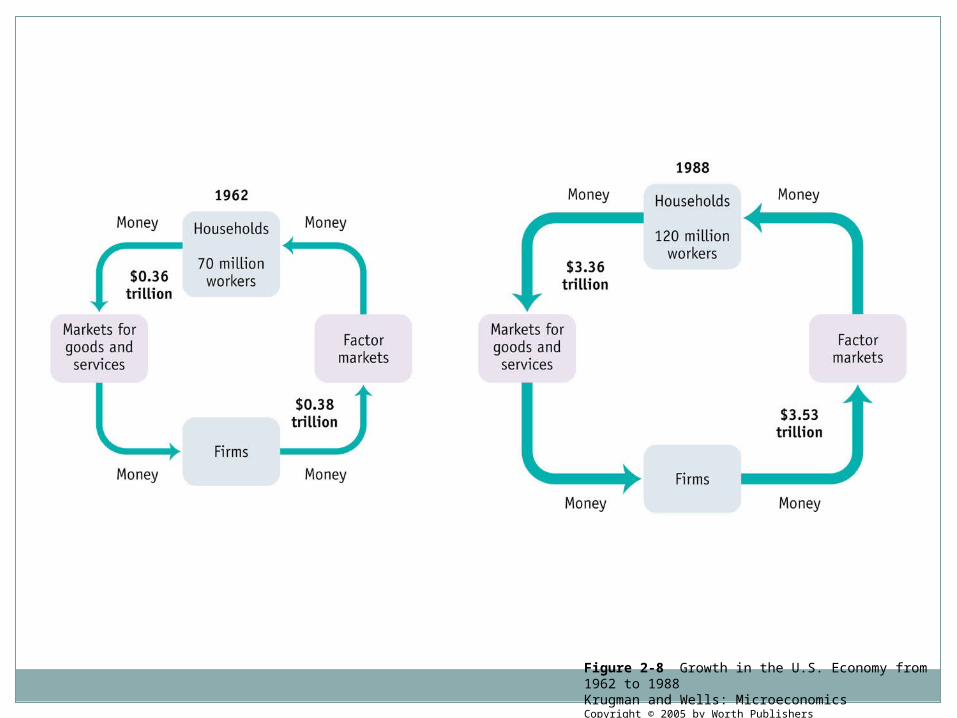
Figure 2-8 Growth in the U.S. Economy from 1962 to 1988Krugman and Wells: MicroeconomicsCopyright © 2005 by Worth Publishers
Economics
Positive economics: How economy really worksNormative economics: How the economy should work. For fun: (Positive? or Negative?)
-More than 60% of women are in labor force-Rent control laws should be implemented because thy help achieve fairness-Society should take measures to end gun violence-People who smoke pass on increased medical coststo society
Quick Review
1-Why are models used in economics?2-Technological improvement will shift curve in
which direction?3-If an economy is producing at level of output
that is on the PPF curve, it is using resources efficiently? Non-efficiently? Is it using all it resources?
4-An economy has the lowest opportunity cost for producing a particular good when it has an absolute or comparative advantage?
More Review
5-What are some types of factors of production?
6- Which graphical model shows us how households buy goods and services and sell factors of production.
7-Trade is beneficial to an economy because more goods and services can be obtained at a lower _______________.
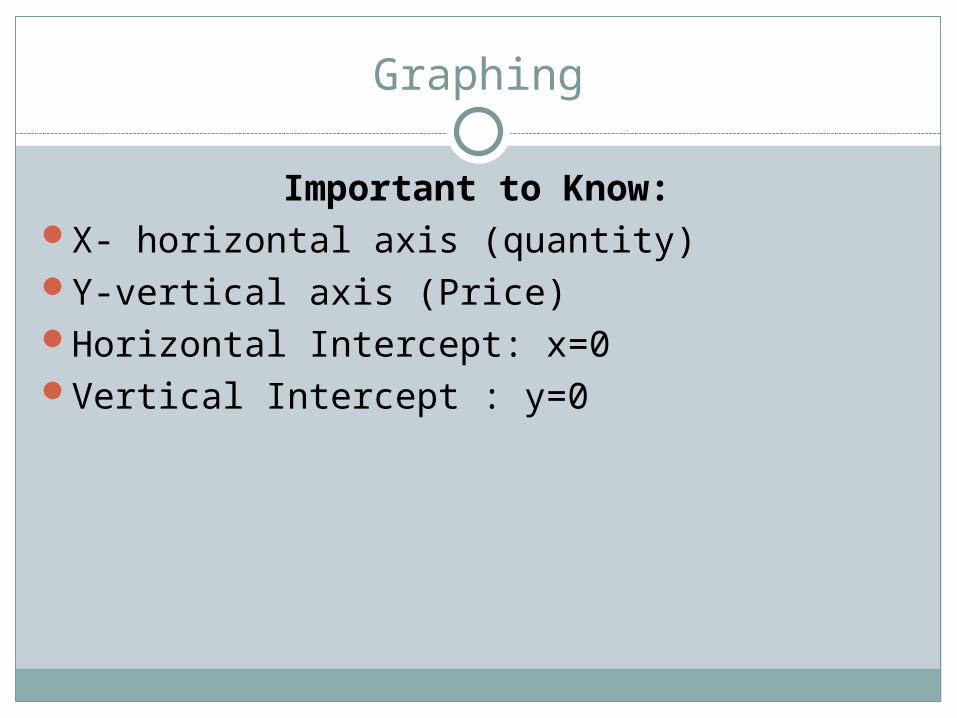
Graphing
Important to Know:X- horizontal axis (quantity)Y-vertical axis (Price)Horizontal Intercept: x=0Vertical Intercept : y=0
Homework
1. Graph, and question related to graph, should similar to (next slide)
3. Absolute vs. comparative advantage10. Economic models 11. Positive vs. Normative economics.
Homework #3
Peter Pundit, an economic reporter states that the EU is increasing productivity in all industries. He claims that this productivity advances in output will soon exceed U.S. and as a result U.S. will not longer benefit from trade with EU.
a.Do you think Peter is correct? What is the source of his mistake?
b.If the EU and the U.S. Continue to trade, what will characterize the goods that EU exports to U.S., and the good U.S. exports to EU?
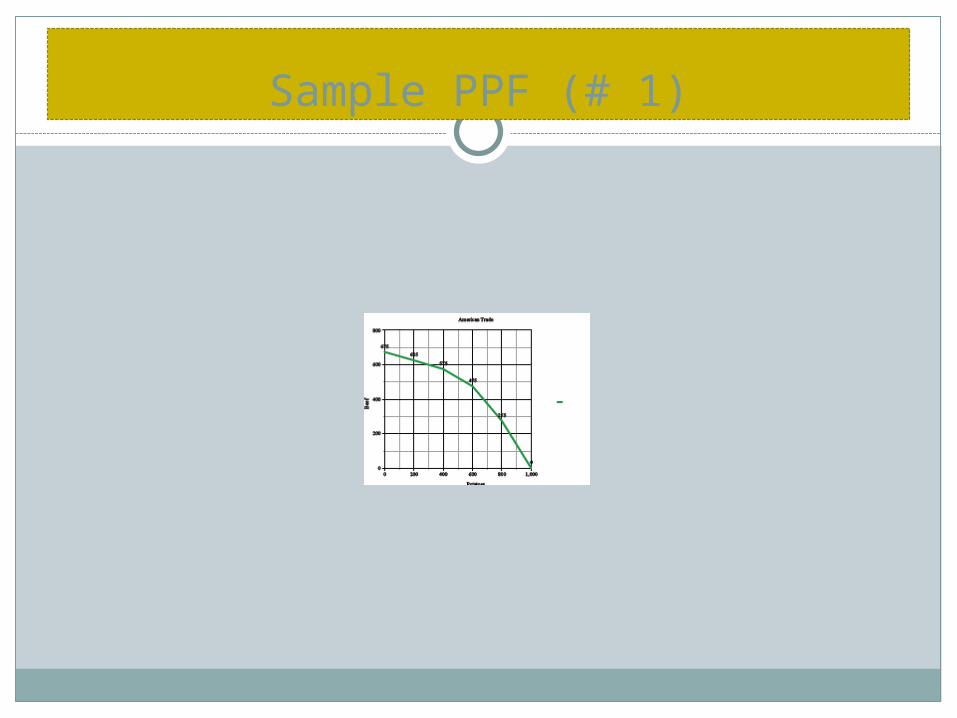
Sample PPF (# 1)

The End of Chapter 2Coming attraction:
Chapter 3: Supply and Demand
Thank you attending!