Embed Size (px)
Citation preview
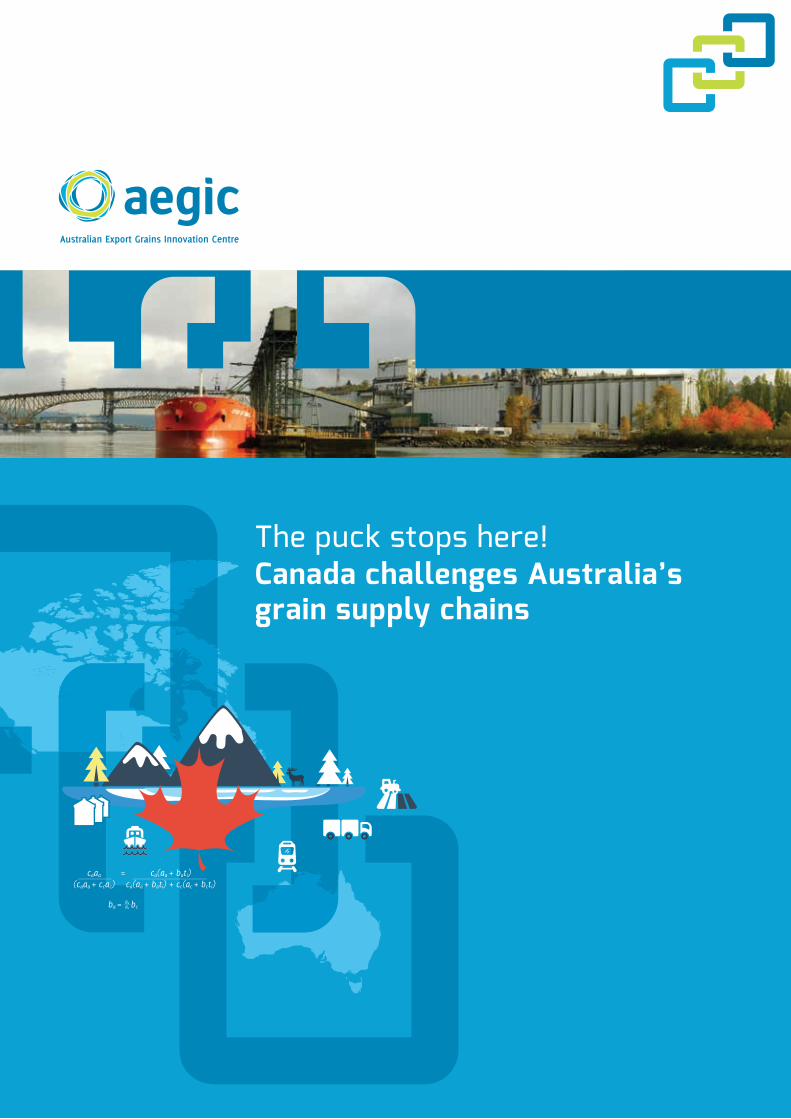
The puck stops here!Canada challenges Australia’s grain supply chains
caaa = ca(aa + bati) (caaa + ccac) ca(aa + bati) + cc(ac + bcti)
ba = bc
Australian Export Grains Innovation Centre3 Baron-Hay CourtSouth PerthWestern Australia 6151P: +61 8 9368 3785E: [email protected]: aegic.org.au
All contents copyright © AEGIC. All rights reserved.
The related bodies, directors and employees of AEGIC accept no liability whatsoever for any injury, loss, claim, damage, incidental or consequential damage, arising out of, or in any way connected with, the use of any information, or any error or defect in the information contained in this publication. Whilst every care has been taken in the preparation of this publication AEGIC accepts no responsibility for the accuracy of the information supplied.
May, 2015
AEGIC is an initiative of the Western Australian State Government and Australia’s Grains Research and Development Corporation
Department ofAgriculture and Food
The puck stops here!Canada challenges Australia’s grain supply chains
Prepared by:
Dr Peter White Supply Chain Specialist | [email protected]
Dr Chris Carter Economist | [email protected]
Prof Ross Kingwell Chief Economist | [email protected]
List of abbreviations
$/NTK $ per net tonne kilometre
ABARES Australian Bureau of Agricultural and Resource Economics and Sciences
ACCC Australian Competition and Consumer Commission
ARTC Australian Rail Track Corporation Ltd
AWB Australian Wheat Board
BOM Bureau of Meteorology
CBH Cooperative Bulk Handling
CGC Canadian Grain Commission
CIGI Canadian International Grains Institute
CN Canadian National Railway
CP Canadian Pacific Railway
CSIRO Commonwealth Scientific and Industrial Research Organisation
CWB Canadian Wheat Board
DFATD Department of Foreign Affairs, Trade and Development
ESCOSA Essential Services Commission of South Australia
FIS Free-in-store
FOB Free-on-board
GM Genetically modified
GMOs Genetically modified organisms
GRDC Grain Research and Development Corporation
ha hectares
IFIM Institut de Formation de l’industrie Meunière
k thousand
km kilometres
m metres
mt metric tonnes
mmt million metric tonnes
n/a not applicable
NSW New South Wales
Qld Queensland
SA South Australia
SD standard deviation
t tonnes
Track grain price unloaded at port
Vic Victoria
WA Western Australia
WGRF Western Grains Research Foundation
USDA United States Department of Agriculture
UPOV International Union for the Protection of New Varieties of Plants
List of equivalent terms
Australia Canada
Receival site Elevator
Warehouse storage Condominium storage
Rail car Rail wagon
Levy Check-off
Aussie Canuck
1The puck stops here!Canada challenges Australia’s grain supply chains
Contents
Foreword 3
Highlights 4Supply chain costs 4
Supply chain structure 4
Key findings 5
Executive summary 6Supply chains 6
Supply chain costs 7
Relative competitiveness 8
Enabling organisations 8
Points for action 9
Grain supply in Canada and Australia 10Areas of production 10
Crop yields and production 10
Production and harvest 11
Agricultural productivity trends in Canada and Australia 14
Impacts of climate change on cropping 14
Crop productivity 15
Overview of supply chains for bulk grain exports from Canada and Australia 17Similarities 17
Differences 18
Markets 19
Grain flows from farm to port 21
Restructuring supply chain infrastructure 26Canada 26
Australia 28
Ownership of supply chains 30Ownership of supply chain infrastructure 30
Farmer ownership of supply chain infrastructure 30
Deregulation of wheat export 32
Barriers to entry 32
Institutions supporting export grains supply chains 33Market support through the Canadian International Grains Institute 33
Monitoring of grain supply chains 34
Outbound shipment certifications through the Canadian Grains Commission 35
Cereals Canada 35
The puck stops here!Canada challenges Australia’s grain supply chains2
Itemisation of supply chain costs 36Total costs 36
On-farm storage 37
Cost of on-farm storage 37
Transport from farm to receival site 39
Costs of transport from farm to receival site 39
Receival sites 40
Costs of handling and elevation 41
Costs of storage 41
Crop information 41
Transport from receival site to port 41
Costs of transport from receival site to port 43
Grain revenue cap 43
Inter-switching 43
Contracts 44
Capital inflexibility 44
Ports 44
Storage time 45
Shipping efficiency 45
Increased demurrage 46
Check-offs 46
End point royalties 47
Shipping 47
Other issues affecting the competitiveness of Canada’s grain exports and their grain supply chains 48Role of government in grain supply chains 48
Implications for the Australian Grain Industry and its Export Supply Chain 50Better integrated, clear and consistent road and rail policy 50
Network optimisation 50
Fair access and cost efficiency 51
Strengthen key markets 51
A research challenge 51
Acknowledgments 52Canada 52
Australia 52
References 53
3The puck stops here!Canada challenges Australia’s grain supply chains
Foreword
This report is the second in a series of studies into the transport, storage, and handling systems for bulk export grain in Australia and its major competitors. The first report: The cost of Australia’s bulk grain export supply chains: an information paper, was published in January 2014 and focused exclusively on Australia.
Here we report on significant points of similarity and difference between grain supply chains in Canada and Australia. We highlight trends and likely future developments expected to affect the grain supply chains in each country and discuss ways in which Australian export grain supply chains might be improved.
We focus on the supply chain that feeds grain into Canada’s western ports: Vancouver and Prince Rupert. These ports export the majority of the grain from Canada and supply the Asian markets in competition with Australian grain.
Grain supply chains are complex with high geographic dependency and multiple pricing structures at various points along the chain. A high level summary of this complexity is provided in this report. We acknowledge that there are also commercial, political and social considerations surrounding various aspects of the supply chains that are beyond simple financial considerations of costs and services. This report does not comment in detail on those considerations.
We note that the Australian and Canadian dollar have been strongly correlated for the past five years, trading roughly at 1:1 parity. Hence, in this report we assume that the exchange rate remains at parity, meaning $AUD and $CND are directly comparable. All figures relating to costs in Australia are quoted in Australian dollars while those relating to costs in Canada are quoted in Canadian dollars.
Grain receival site, Saskatchewan
The puck stops here!Canada challenges Australia’s grain supply chains4
Highlights
Supply chain costs• The total cost of a typical export grain supply chain in
Canada is around $107 per tonne, including on-farm storage. By contrast the equivalent supply chain in Australia has a total cost of around $87 per tonne.
• In Canada, the transport distance from upcountry storage to port is about six times longer than occurs in Australia, so the transport cost is higher: $49 per tonne for Canada versus $28 per tonne for Australia. However, the per tonne kilometre cost of rail freight is almost five times lower: 0.03$/NTK in Canada versus 0.14$/NTK in Australia.
• On-farm storage costs on a per tonne basis are higher in Australia than in Canada, but only a small proportion of the grain bound for export is stored on farm in Australia. Most is stored in much cheaper warehouse storage. In Canada, nearly all grain is stored on farm so the total cost of the storage task is higher: $18 per tonne in Canada versus $9 per tonne in Australia.
• Port receival, handling and vessel charges in Canada are two thirds of the equivalent charges in Australia for the same service: $14 per tonne in Canada versus $21 per tonne in Australia. This difference can be partly explained by higher throughput volumes at Canadian ports allowing for economies of scale and reduced regulation that enables more flexibility in loading vessels.
Supply chain structure• Supply chains in Canada mainly operate a ‘pull’ delivery
system where grain is moved from farm to a receival site then to a port, ‘just-in-time’ as ships arrive. Australia, by contrast, mostly operates a ‘push’ system where grain is moved from farm to upcountry or port storage immediately after harvest, in readiness for a ship’s future arrival.
• Warehouse storage reduces risks for individual farmers, lowers storage costs and provides convenient selling options to multiple traders. These are significant benefits to Australian farmers not available to Canadian farmers who are required to store almost all their grain on farm.
• Australia’s export grain supply chains are inherently more flexible due to the availability of multiple ports and the greater opportunity to use either road or rail transport. Hence, contract execution risk is typically less in Australia than Canada.
• Canada’s grain supply chain is particularly exposed to the pricing and efficiency of rail freight provided by two dominant private rail companies. Australia’s rail operations are subject to greater competition from road transport due to shorter freight distances which improves the viability of road transport.
• Unit trains in Canada are larger and deliver at least 10,000 tonnes per train to port whereas in Australia the volumes can be a quarter to half as much. Train cycle-times in Australia, are shorter. Canadian wagons take up to two weeks to cycle compared with 24 to 36 hours in Australia.
• In Australia a high proportion of the rail network used to transport grain is used almost exclusively for grain. By contrast in Canada, on the main lines, the grain transport task makes up only 17–18 per cent of the total rail task.
• In Canada, as in Australia, three companies own the majority of the grain port terminals. Each of these port owners is also a dominant exporter and owner of upcountry infrastructure.
• The Canadian government and grains industry have maintained or established valuable organisations that protect the international reputation of Canadian grain and support the efficiency of Canada’s grain supply chain. Australia lacks equivalent organisations.
• The Canadian government is more supportive of its grains industry and agriculture in general than the Australian government. An inter-country comparison suggests that Australian governments under-invest in agricultural marketing, grain promotion and agricultural infrastructure funding.
Cascadia Port Terminal, Vancouver, British Colombia
5The puck stops here!Canada challenges Australia’s grain supply chains
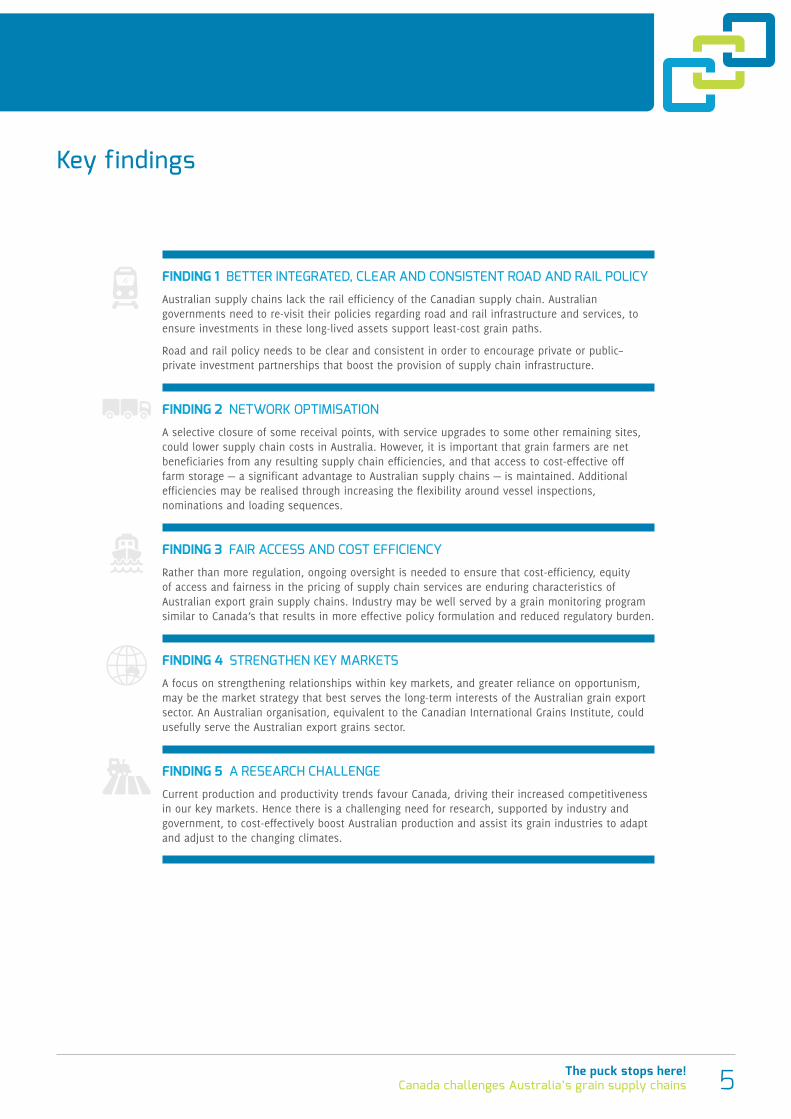
Key findings
FINDING 1 BETTER INTEGRATED, CLEAR AND CONSISTENT ROAD AND RAIL POLICY
Australian supply chains lack the rail efficiency of the Canadian supply chain. Australian governments need to re-visit their policies regarding road and rail infrastructure and services, to ensure investments in these long-lived assets support least-cost grain paths.
Road and rail policy needs to be clear and consistent in order to encourage private or public–private investment partnerships that boost the provision of supply chain infrastructure.
FINDING 2 NETWORK OPTIMISATION
A selective closure of some receival points, with service upgrades to some other remaining sites, could lower supply chain costs in Australia. However, it is important that grain farmers are net beneficiaries from any resulting supply chain efficiencies, and that access to cost-effective off farm storage — a significant advantage to Australian supply chains — is maintained. Additional efficiencies may be realised through increasing the flexibility around vessel inspections, nominations and loading sequences.
FINDING 3 FAIR ACCESS AND COST EFFICIENCY
Rather than more regulation, ongoing oversight is needed to ensure that cost-efficiency, equity of access and fairness in the pricing of supply chain services are enduring characteristics of Australian export grain supply chains. Industry may be well served by a grain monitoring program similar to Canada’s that results in more effective policy formulation and reduced regulatory burden.
FINDING 4 STRENGTHEN KEY MARKETS
A focus on strengthening relationships within key markets, and greater reliance on opportunism, may be the market strategy that best serves the long-term interests of the Australian grain export sector. An Australian organisation, equivalent to the Canadian International Grains Institute, could usefully serve the Australian export grains sector.
FINDING 5 A RESEARCH CHALLENGE
Current production and productivity trends favour Canada, driving their increased competitiveness in our key markets. Hence there is a challenging need for research, supported by industry and government, to cost-effectively boost Australian production and assist its grain industries to adapt and adjust to the changing climates.
The puck stops here!Canada challenges Australia’s grain supply chains6
Executive summary
Grain in Canada is mostly produced in the warm summer months over a four to five month growing season, whereas in Australia it is produced mostly during cooler winter months over a seven to eight month growing season. Yields in Canada are about 50–60 per cent higher than in Australia because of more fertile soils and higher, more reliable stored soil moisture fed by melted snow. Long-term production and productivity trends appear to be diverging between the two countries, favouring Canada.
Supply chains
Grain production and export is less variable in Canada than Australia. Although the average volume of production of wheat has been somewhat similar in both countries since 1999–00, the variation of output from Canada is three-quarters of that from Australia. Canada’s greater consistency of production facilitates the operation of its supply chain infrastructure and reduces the riskiness of returns from investment in its infrastructure.
Supply chains in Canada operate a ‘pull’ delivery system where grain is moved from farm to a receival site and then to a port, ‘just-in-time’ as ships arrive. Australia, by contrast, mostly operates a ‘push’ system where grain is moved from farm to upcountry or port storage immediately after harvest, in readiness for a ship’s future arrival. Both systems offer advantages.
Almost all grain in Canada is stored on farm immediately after harvest with less than 10 per cent delivered to a receival site directly from the paddock. Canadian farmers present grain samples stored in farm bins to receival sites and negotiate prices and grades. Farmers’ sales are largely restricted to their local receival sites, which compete for grain through their price and contract offers.
In Australia, by contrast, most export grain is warehoused in upcountry or port bulk storage at harvest rather than stored on-farm. Australian farmers retain ownership of the grain while in warehouse storage and offer it to many potential buyers usually via the warehouse owner’s electronic stock management system. Grain traders compete for this grain through price offers, with grain often being sold ‘free-in-store’ (FIS) at port. Grain sales, however, can also occur at upcountry receival sites, particularly in eastern Australia, with specific pricing at individual sites. Bulk handling companies that own and operate the warehousing services are usually contracted to deliver farmers’ grain to port for export.
Seventy-five per cent of grain exported from Canada travels long distances by rail from the prairie provinces to two main west coast ports. Journeys of 1300 to 1800km are commonplace. Oil and mineral fields in Canada are close to agricultural areas so the rail network is shared by both industries. By contrast, Australian grain is transported relatively short distances to many ports with journey lengths between 200 to 400km; and a higher proportion of the rail network is used almost exclusively for grain. In addition, in Australia about 50 per cent of grain is transported to port by road while almost no grain is transported to port by road in Canada.
Two rail companies dominate the provision of rail freight in Canada. There is limited inter-switching between the networks, so they operate largely as regional monopolies, owning both above and below rail assets. As a consequence, Canada’s grain supply chains are particularly exposed to the pricing and efficiency of rail freight provided by these two dominant companies. By contrast, there are more than seven rail operators in Australia and rail operations are subject to greater competition from road transport. Australia also has greater volatility in grain production, which affects rates of return to rail investments and adds to the riskiness of these investments. In addition, Australia has diverse track gauges and aged infrastructure on some branch lines that impede the efficiency of rail operations.
Unloading grain, Kwinana Grain Terminal, Western Australia
7The puck stops here!Canada challenges Australia’s grain supply chains
Most Australian ports have only one grain export terminal while Canada’s main export port, Vancouver, has six grain export terminals. Three companies in Canada: Richardsons, Viterra and Cargill own most of the port infrastructure and account for about 75 per cent of the annual exports of grain. In Australia, three companies: GrainCorp, Viterra and CBH own 16 of the 20 port terminals but occupy a less dominant position in grain exports than their counterparts in Canada. For example in 2012–13, GrainCorp, CBH and Viterra (through its parent trading Glencore Grain) were responsible for only 53 per cent of total wheat, barley and canola exported from Australia.
Grain exporters in Canada without port infrastructure negotiate commercial agreements with the port owners for access. Port owners enter into these commercial agreements to maximise usage of their port infrastructure and also to manage port access strategically to maintain their competitive advantage. Australian port terminal operators by contrast must comply with port loading protocols as part of the Mandatory Port Terminal Access Code overseen by the Australian Competition and Consumer Commission (ACCC).
Terminal operators in Canada manage ship queues and loading order to maximise efficiency with operators generally preferring to have empty ships waiting at anchorage while loading ships. This often leads to higher demurrage rates, but it allows more constant grain movement and ship loading as the grain arrives by rail. In Australia, the Mandatory Port Terminal Access Code limits the flexibility of port operators.
Grain supply chains in both Australia and Canada are characterised by major historical and ongoing investments in long-lived infrastructure and increasing levels of privatisation. Over the past few decades the governments in both countries have divested their involvement in most parts of the grain supply chain, with the most significant recent events being the dismantling of mandated export controls. The loss of the exclusive right of the Canadian Wheat Board (CWB) to sell wheat and barley from western provinces came into effect in 2012–13 while the single-desk marketing arrangements for the Australian Wheat Board (AWB) were removed in 2008.
Supply chain costs
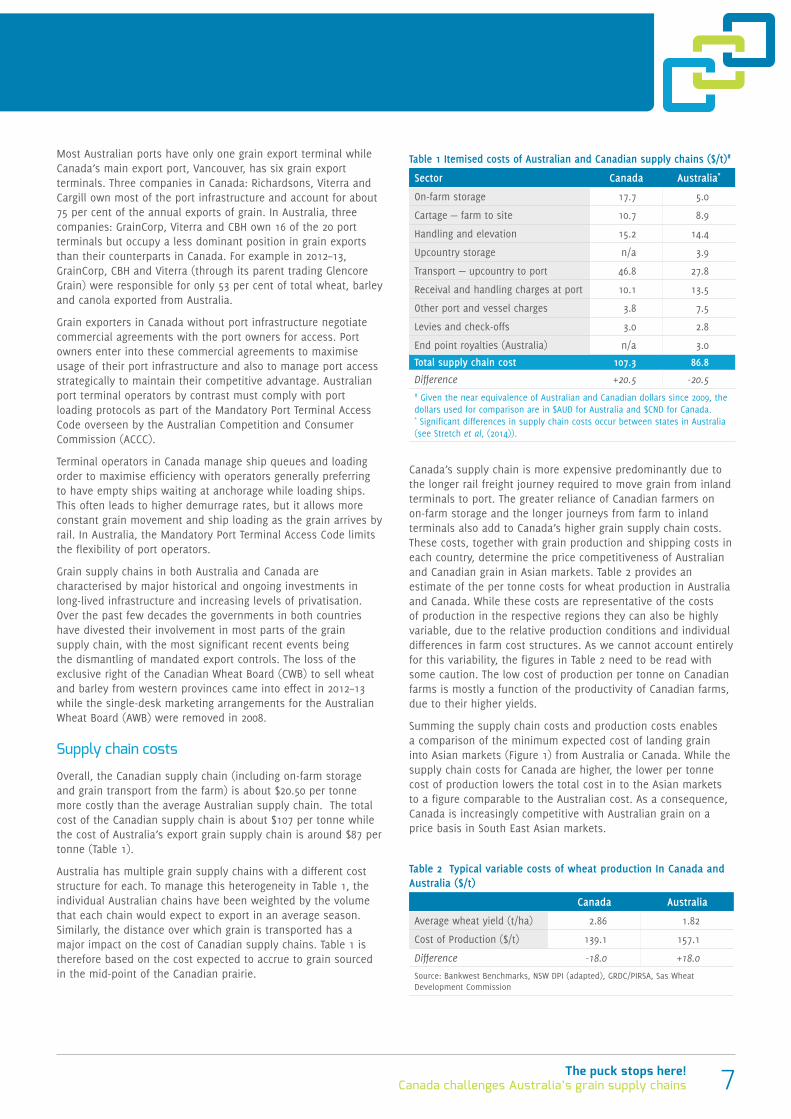
Overall, the Canadian supply chain (including on-farm storage and grain transport from the farm) is about $20.50 per tonne more costly than the average Australian supply chain. The total cost of the Canadian supply chain is about $107 per tonne while the cost of Australia’s export grain supply chain is around $87 per tonne (Table 1).
Australia has multiple grain supply chains with a different cost structure for each. To manage this heterogeneity in Table 1, the individual Australian chains have been weighted by the volume that each chain would expect to export in an average season. Similarly, the distance over which grain is transported has a major impact on the cost of Canadian supply chains. Table 1 is therefore based on the cost expected to accrue to grain sourced in the mid-point of the Canadian prairie.
Canada’s supply chain is more expensive predominantly due to the longer rail freight journey required to move grain from inland terminals to port. The greater reliance of Canadian farmers on on-farm storage and the longer journeys from farm to inland terminals also add to Canada’s higher grain supply chain costs. These costs, together with grain production and shipping costs in each country, determine the price competitiveness of Australian and Canadian grain in Asian markets. Table 2 provides an estimate of the per tonne costs for wheat production in Australia and Canada. While these costs are representative of the costs of production in the respective regions they can also be highly variable, due to the relative production conditions and individual differences in farm cost structures. As we cannot account entirely for this variability, the figures in Table 2 need to be read with some caution. The low cost of production per tonne on Canadian farms is mostly a function of the productivity of Canadian farms, due to their higher yields.
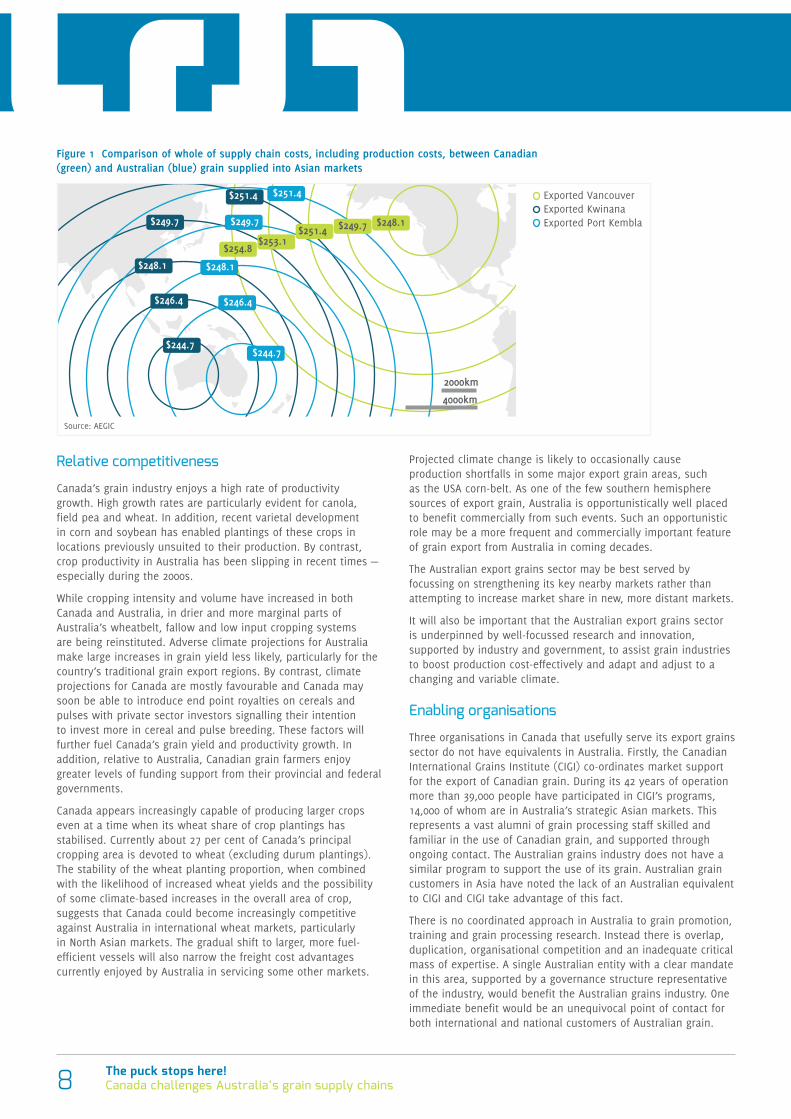
Summing the supply chain costs and production costs enables a comparison of the minimum expected cost of landing grain into Asian markets (Figure 1) from Australia or Canada. While the supply chain costs for Canada are higher, the lower per tonne cost of production lowers the total cost in to the Asian markets to a figure comparable to the Australian cost. As a consequence, Canada is increasingly competitive with Australian grain on a price basis in South East Asian markets.
Table 1 Itemised costs of Australian and Canadian supply chains ($/t)#
Sector Canada Australia*
On-farm storage 17.7 5.0
Cartage — farm to site 10.7 8.9
Handling and elevation 15.2 14.4
Upcountry storage n/a 3.9
Transport — upcountry to port 46.8 27.8
Receival and handling charges at port 10.1 13.5
Other port and vessel charges 3.8 7.5
Levies and check-offs 3.0 2.8
End point royalties (Australia) n/a 3.0
Total supply chain cost 107.3 86.8
Difference +20.5 -20.5# Given the near equivalence of Australian and Canadian dollars since 2009, the dollars used for comparison are in $AUD for Australia and $CND for Canada. * Significant differences in supply chain costs occur between states in Australia (see Stretch et al, (2014)).
Table 2 Typical variable costs of wheat production In Canada and Australia ($/t)
Canada Australia
Average wheat yield (t/ha) 2.86 1.82
Cost of Production ($/t) 139.1 157.1
Difference -18.0 +18.0
Source: Bankwest Benchmarks, NSW DPI (adapted), GRDC/PIRSA, Sas Wheat Development Commission
The puck stops here!Canada challenges Australia’s grain supply chains8
Relative competitiveness
Canada’s grain industry enjoys a high rate of productivity growth. High growth rates are particularly evident for canola, field pea and wheat. In addition, recent varietal development in corn and soybean has enabled plantings of these crops in locations previously unsuited to their production. By contrast, crop productivity in Australia has been slipping in recent times — especially during the 2000s.
While cropping intensity and volume have increased in both Canada and Australia, in drier and more marginal parts of Australia’s wheatbelt, fallow and low input cropping systems are being reinstituted. Adverse climate projections for Australia make large increases in grain yield less likely, particularly for the country’s traditional grain export regions. By contrast, climate projections for Canada are mostly favourable and Canada may soon be able to introduce end point royalties on cereals and pulses with private sector investors signalling their intention to invest more in cereal and pulse breeding. These factors will further fuel Canada’s grain yield and productivity growth. In addition, relative to Australia, Canadian grain farmers enjoy greater levels of funding support from their provincial and federal governments.
Canada appears increasingly capable of producing larger crops even at a time when its wheat share of crop plantings has stabilised. Currently about 27 per cent of Canada’s principal cropping area is devoted to wheat (excluding durum plantings). The stability of the wheat planting proportion, when combined with the likelihood of increased wheat yields and the possibility of some climate-based increases in the overall area of crop, suggests that Canada could become increasingly competitive against Australia in international wheat markets, particularly in North Asian markets. The gradual shift to larger, more fuel-efficient vessels will also narrow the freight cost advantages currently enjoyed by Australia in servicing some other markets.
Projected climate change is likely to occasionally cause production shortfalls in some major export grain areas, such as the USA corn-belt. As one of the few southern hemisphere sources of export grain, Australia is opportunistically well placed to benefit commercially from such events. Such an opportunistic role may be a more frequent and commercially important feature of grain export from Australia in coming decades.
The Australian export grains sector may be best served by focussing on strengthening its key nearby markets rather than attempting to increase market share in new, more distant markets.
It will also be important that the Australian export grains sector is underpinned by well-focussed research and innovation, supported by industry and government, to assist grain industries to boost production cost-effectively and adapt and adjust to a changing and variable climate.
Enabling organisations
Three organisations in Canada that usefully serve its export grains sector do not have equivalents in Australia. Firstly, the Canadian International Grains Institute (CIGI) co-ordinates market support for the export of Canadian grain. During its 42 years of operation more than 39,000 people have participated in CIGI’s programs, 14,000 of whom are in Australia’s strategic Asian markets. This represents a vast alumni of grain processing staff skilled and familiar in the use of Canadian grain, and supported through ongoing contact. The Australian grains industry does not have a similar program to support the use of its grain. Australian grain customers in Asia have noted the lack of an Australian equivalent to CIGI and CIGI take advantage of this fact.
There is no coordinated approach in Australia to grain promotion, training and grain processing research. Instead there is overlap, duplication, organisational competition and an inadequate critical mass of expertise. A single Australian entity with a clear mandate in this area, supported by a governance structure representative of the industry, would benefit the Australian grains industry. One immediate benefit would be an unequivocal point of contact for both international and national customers of Australian grain.
Figure 1 Comparison of whole of supply chain costs, including production costs, between Canadian (green) and Australian (blue) grain supplied into Asian markets
$244.7$244.7
$253.1 $254.8
$251.4
$249.7
$248.1
$246.4
$251.4
$249.7
$248.1
$246.4
$248.1 $249.7 $251.4
Exported VancouverExported KwinanaExported Port Kembla
2000km
4000km
Source: AEGIC
9The puck stops here!Canada challenges Australia’s grain supply chains
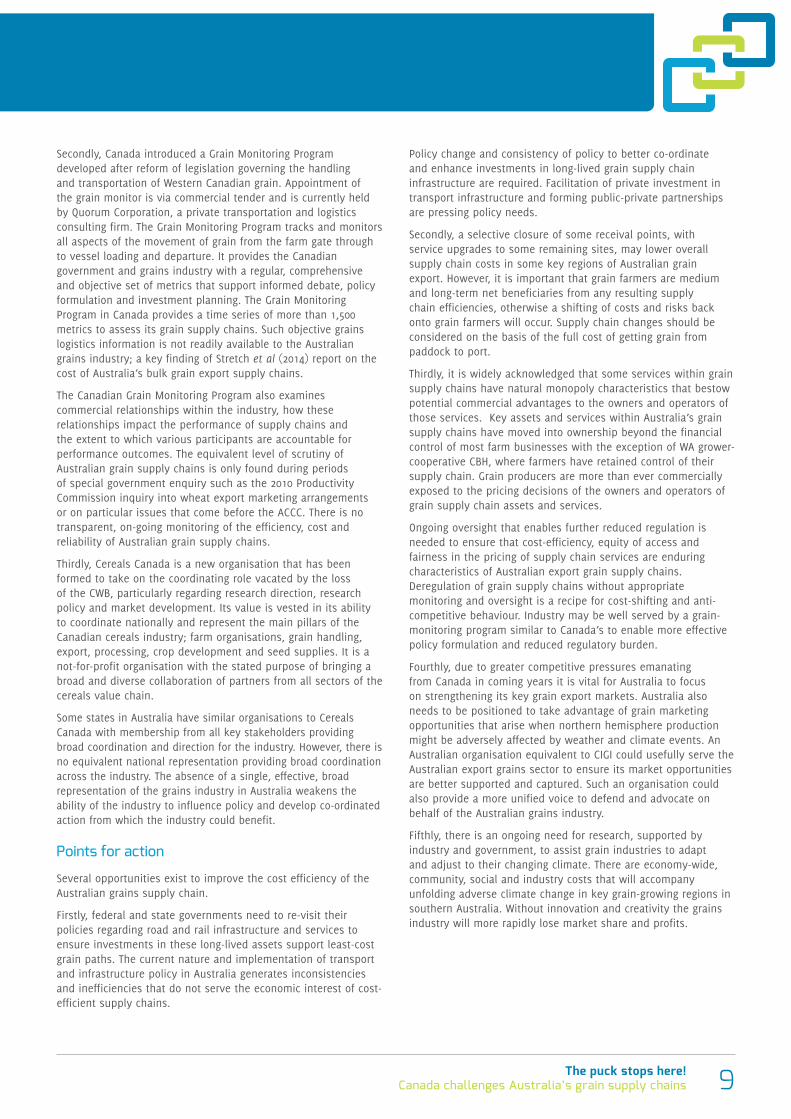
Secondly, Canada introduced a Grain Monitoring Program developed after reform of legislation governing the handling and transportation of Western Canadian grain. Appointment of the grain monitor is via commercial tender and is currently held by Quorum Corporation, a private transportation and logistics consulting firm. The Grain Monitoring Program tracks and monitors all aspects of the movement of grain from the farm gate through to vessel loading and departure. It provides the Canadian government and grains industry with a regular, comprehensive and objective set of metrics that support informed debate, policy formulation and investment planning. The Grain Monitoring Program in Canada provides a time series of more than 1,500 metrics to assess its grain supply chains. Such objective grains logistics information is not readily available to the Australian grains industry; a key finding of Stretch et al (2014) report on the cost of Australia’s bulk grain export supply chains.
The Canadian Grain Monitoring Program also examines commercial relationships within the industry, how these relationships impact the performance of supply chains and the extent to which various participants are accountable for performance outcomes. The equivalent level of scrutiny of Australian grain supply chains is only found during periods of special government enquiry such as the 2010 Productivity Commission inquiry into wheat export marketing arrangements or on particular issues that come before the ACCC. There is no transparent, on-going monitoring of the efficiency, cost and reliability of Australian grain supply chains.
Thirdly, Cereals Canada is a new organisation that has been formed to take on the coordinating role vacated by the loss of the CWB, particularly regarding research direction, research policy and market development. Its value is vested in its ability to coordinate nationally and represent the main pillars of the Canadian cereals industry; farm organisations, grain handling, export, processing, crop development and seed supplies. It is a not-for-profit organisation with the stated purpose of bringing a broad and diverse collaboration of partners from all sectors of the cereals value chain.
Some states in Australia have similar organisations to Cereals Canada with membership from all key stakeholders providing broad coordination and direction for the industry. However, there is no equivalent national representation providing broad coordination across the industry. The absence of a single, effective, broad representation of the grains industry in Australia weakens the ability of the industry to influence policy and develop co-ordinated action from which the industry could benefit.
Points for action
Several opportunities exist to improve the cost efficiency of the Australian grains supply chain.
Firstly, federal and state governments need to re-visit their policies regarding road and rail infrastructure and services to ensure investments in these long-lived assets support least-cost grain paths. The current nature and implementation of transport and infrastructure policy in Australia generates inconsistencies and inefficiencies that do not serve the economic interest of cost-efficient supply chains.
Policy change and consistency of policy to better co-ordinate and enhance investments in long-lived grain supply chain infrastructure are required. Facilitation of private investment in transport infrastructure and forming public-private partnerships are pressing policy needs.
Secondly, a selective closure of some receival points, with service upgrades to some remaining sites, may lower overall supply chain costs in some key regions of Australian grain export. However, it is important that grain farmers are medium and long-term net beneficiaries from any resulting supply chain efficiencies, otherwise a shifting of costs and risks back onto grain farmers will occur. Supply chain changes should be considered on the basis of the full cost of getting grain from paddock to port.
Thirdly, it is widely acknowledged that some services within grain supply chains have natural monopoly characteristics that bestow potential commercial advantages to the owners and operators of those services. Key assets and services within Australia’s grain supply chains have moved into ownership beyond the financial control of most farm businesses with the exception of WA grower-cooperative CBH, where farmers have retained control of their supply chain. Grain producers are more than ever commercially exposed to the pricing decisions of the owners and operators of grain supply chain assets and services.
Ongoing oversight that enables further reduced regulation is needed to ensure that cost-efficiency, equity of access and fairness in the pricing of supply chain services are enduring characteristics of Australian export grain supply chains. Deregulation of grain supply chains without appropriate monitoring and oversight is a recipe for cost-shifting and anti-competitive behaviour. Industry may be well served by a grain-monitoring program similar to Canada’s to enable more effective policy formulation and reduced regulatory burden.
Fourthly, due to greater competitive pressures emanating from Canada in coming years it is vital for Australia to focus on strengthening its key grain export markets. Australia also needs to be positioned to take advantage of grain marketing opportunities that arise when northern hemisphere production might be adversely affected by weather and climate events. An Australian organisation equivalent to CIGI could usefully serve the Australian export grains sector to ensure its market opportunities are better supported and captured. Such an organisation could also provide a more unified voice to defend and advocate on behalf of the Australian grains industry.
Fifthly, there is an ongoing need for research, supported by industry and government, to assist grain industries to adapt and adjust to their changing climate. There are economy-wide, community, social and industry costs that will accompany unfolding adverse climate change in key grain-growing regions in southern Australia. Without innovation and creativity the grains industry will more rapidly lose market share and profits.
The puck stops here!Canada challenges Australia’s grain supply chains10
Grain supply in Canada and Australia
Areas of production
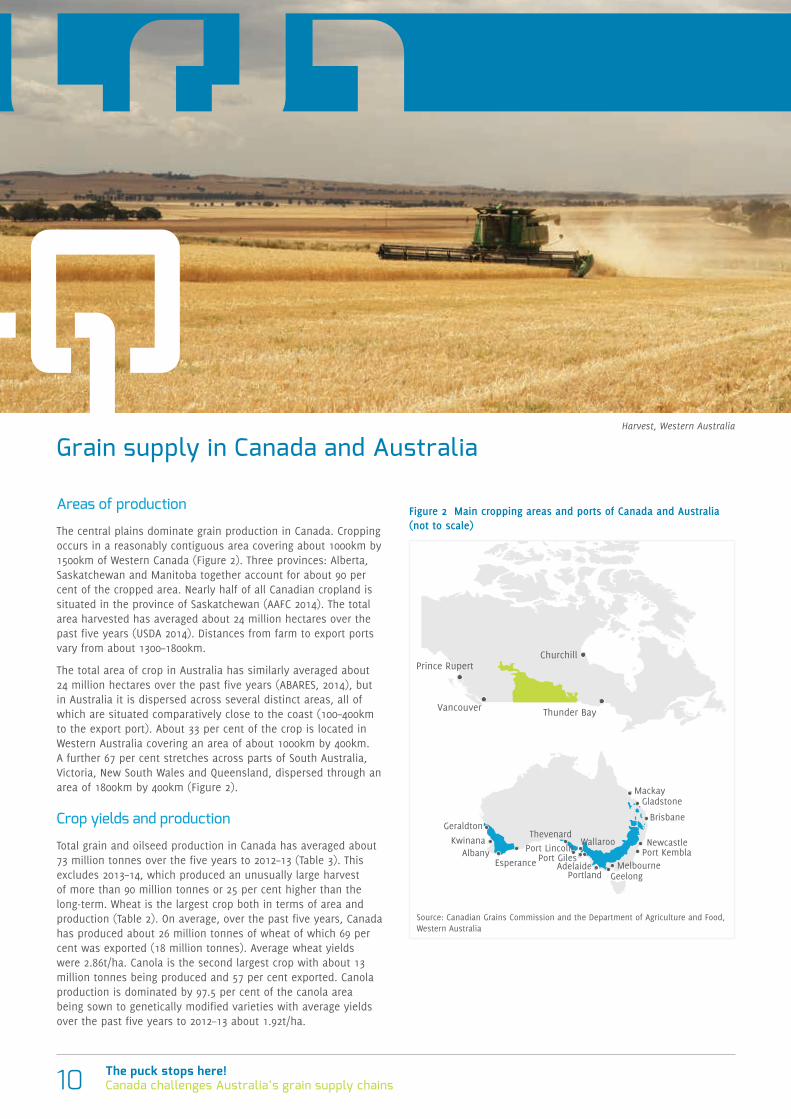
The central plains dominate grain production in Canada. Cropping occurs in a reasonably contiguous area covering about 1000km by 1500km of Western Canada (Figure 2). Three provinces: Alberta, Saskatchewan and Manitoba together account for about 90 per cent of the cropped area. Nearly half of all Canadian cropland is situated in the province of Saskatchewan (AAFC 2014). The total area harvested has averaged about 24 million hectares over the past five years (USDA 2014). Distances from farm to export ports vary from about 1300–1800km.
The total area of crop in Australia has similarly averaged about 24 million hectares over the past five years (ABARES, 2014), but in Australia it is dispersed across several distinct areas, all of which are situated comparatively close to the coast (100–400km to the export port). About 33 per cent of the crop is located in Western Australia covering an area of about 1000km by 400km. A further 67 per cent stretches across parts of South Australia, Victoria, New South Wales and Queensland, dispersed through an area of 1800km by 400km (Figure 2).
Crop yields and production
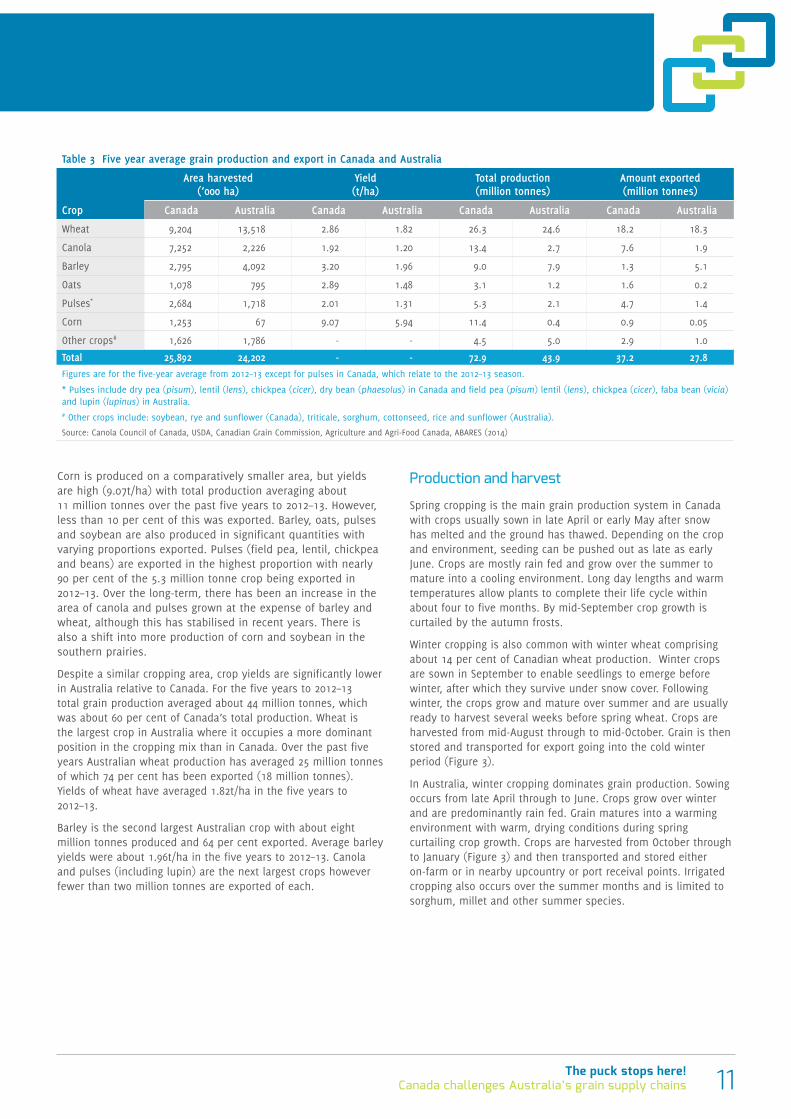
Total grain and oilseed production in Canada has averaged about 73 million tonnes over the five years to 2012–13 (Table 3). This excludes 2013–14, which produced an unusually large harvest of more than 90 million tonnes or 25 per cent higher than the long-term. Wheat is the largest crop both in terms of area and production (Table 2). On average, over the past five years, Canada has produced about 26 million tonnes of wheat of which 69 per cent was exported (18 million tonnes). Average wheat yields were 2.86t/ha. Canola is the second largest crop with about 13 million tonnes being produced and 57 per cent exported. Canola production is dominated by 97.5 per cent of the canola area being sown to genetically modified varieties with average yields over the past five years to 2012–13 about 1.92t/ha.
Figure 2 Main cropping areas and ports of Canada and Australia (not to scale)
Vancouver Thunder Bay
Churchill Prince Rupert
Source: Canadian Grains Commission and the Department of Agriculture and Food, Western Australia
Mackay Gladstone
Brisbane
Newcastle
GeelongPortland Adelaide
Port Giles
Thevenard
Albany Kwinana
Geraldton
Port Kembla Melbourne
Wallaroo Port Lincoln
Esperance
Harvest, Western Australia
11The puck stops here!Canada challenges Australia’s grain supply chains
Corn is produced on a comparatively smaller area, but yields are high (9.07t/ha) with total production averaging about 11 million tonnes over the past five years to 2012–13. However, less than 10 per cent of this was exported. Barley, oats, pulses and soybean are also produced in significant quantities with varying proportions exported. Pulses (field pea, lentil, chickpea and beans) are exported in the highest proportion with nearly 90 per cent of the 5.3 million tonne crop being exported in 2012–13. Over the long-term, there has been an increase in the area of canola and pulses grown at the expense of barley and wheat, although this has stabilised in recent years. There is also a shift into more production of corn and soybean in the southern prairies.
Despite a similar cropping area, crop yields are significantly lower in Australia relative to Canada. For the five years to 2012–13 total grain production averaged about 44 million tonnes, which was about 60 per cent of Canada’s total production. Wheat is the largest crop in Australia where it occupies a more dominant position in the cropping mix than in Canada. Over the past five years Australian wheat production has averaged 25 million tonnes of which 74 per cent has been exported (18 million tonnes). Yields of wheat have averaged 1.82t/ha in the five years to 2012–13.
Barley is the second largest Australian crop with about eight million tonnes produced and 64 per cent exported. Average barley yields were about 1.96t/ha in the five years to 2012–13. Canola and pulses (including lupin) are the next largest crops however fewer than two million tonnes are exported of each.
Production and harvest
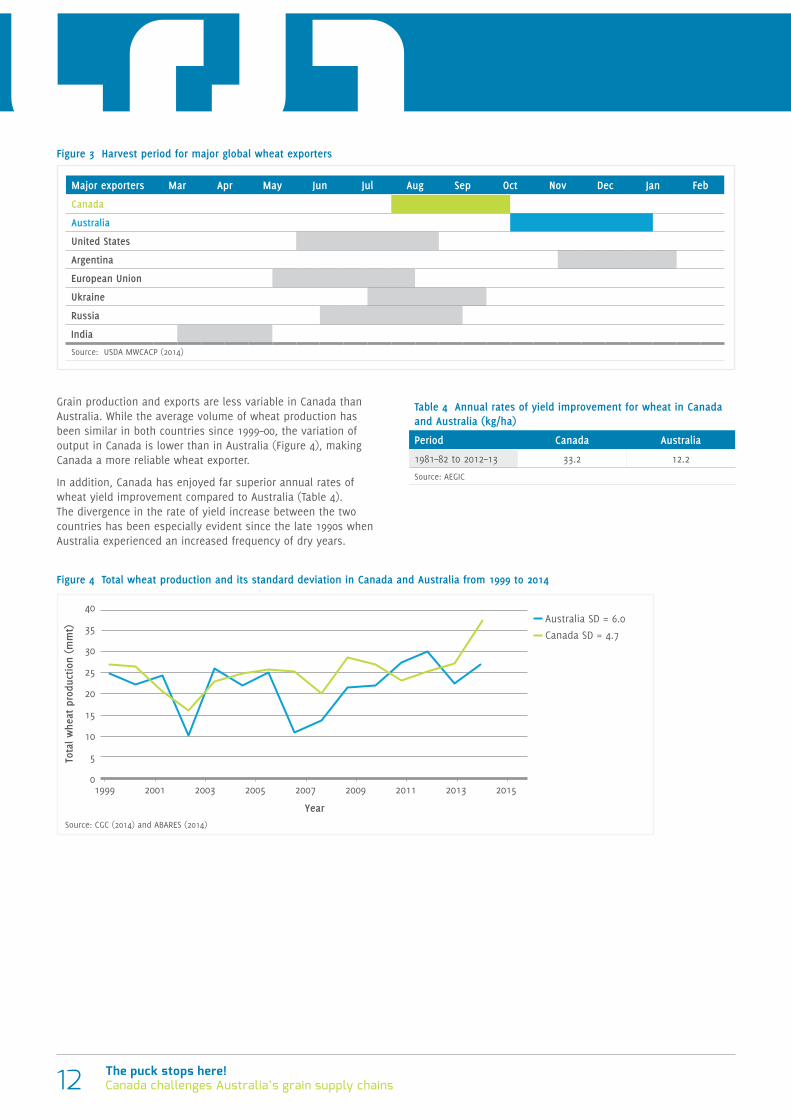
Spring cropping is the main grain production system in Canada with crops usually sown in late April or early May after snow has melted and the ground has thawed. Depending on the crop and environment, seeding can be pushed out as late as early June. Crops are mostly rain fed and grow over the summer to mature into a cooling environment. Long day lengths and warm temperatures allow plants to complete their life cycle within about four to five months. By mid-September crop growth is curtailed by the autumn frosts.
Winter cropping is also common with winter wheat comprising about 14 per cent of Canadian wheat production. Winter crops are sown in September to enable seedlings to emerge before winter, after which they survive under snow cover. Following winter, the crops grow and mature over summer and are usually ready to harvest several weeks before spring wheat. Crops are harvested from mid-August through to mid-October. Grain is then stored and transported for export going into the cold winter period (Figure 3).
In Australia, winter cropping dominates grain production. Sowing occurs from late April through to June. Crops grow over winter and are predominantly rain fed. Grain matures into a warming environment with warm, drying conditions during spring curtailing crop growth. Crops are harvested from October through to January (Figure 3) and then transported and stored either on-farm or in nearby upcountry or port receival points. Irrigated cropping also occurs over the summer months and is limited to sorghum, millet and other summer species.
Table 3 Five year average grain production and export in Canada and Australia
Crop
Area harvested (‘000 ha)
Yield (t/ha)
Total production (million tonnes)
Amount exported (million tonnes)
Canada Australia Canada Australia Canada Australia Canada Australia
Wheat 9,204 13,518 2.86 1.82 26.3 24.6 18.2 18.3
Canola 7,252 2,226 1.92 1.20 13.4 2.7 7.6 1.9
Barley 2,795 4,092 3.20 1.96 9.0 7.9 1.3 5.1
Oats 1,078 795 2.89 1.48 3.1 1.2 1.6 0.2
Pulses* 2,684 1,718 2.01 1.31 5.3 2.1 4.7 1.4
Corn 1,253 67 9.07 5.94 11.4 0.4 0.9 0.05
Other crops# 1,626 1,786 - - 4.5 5.0 2.9 1.0
Total 25,892 24,202 - - 72.9 43.9 37.2 27.8Figures are for the five-year average from 2012–13 except for pulses in Canada, which relate to the 2012–13 season.
* Pulses include dry pea (pisum), lentil (lens), chickpea (cicer), dry bean (phaesolus) in Canada and field pea (pisum) lentil (lens), chickpea (cicer), faba bean (vicia) and lupin (lupinus) in Australia.# Other crops include: soybean, rye and sunflower (Canada), triticale, sorghum, cottonseed, rice and sunflower (Australia).
Source: Canola Council of Canada, USDA, Canadian Grain Commission, Agriculture and Agri-Food Canada, ABARES (2014)
The puck stops here!Canada challenges Australia’s grain supply chains12
Grain production and exports are less variable in Canada than Australia. While the average volume of wheat production has been similar in both countries since 1999–00, the variation of output in Canada is lower than in Australia (Figure 4), making Canada a more reliable wheat exporter.
In addition, Canada has enjoyed far superior annual rates of wheat yield improvement compared to Australia (Table 4). The divergence in the rate of yield increase between the two countries has been especially evident since the late 1990s when Australia experienced an increased frequency of dry years.
Table 4 Annual rates of yield improvement for wheat in Canada and Australia (kg/ha)
Period Canada Australia
1981–82 to 2012–13 33.2 12.2
Source: AEGIC
Figure 3 Harvest period for major global wheat exporters
Major exporters Mar Apr May Jun Jul Aug Sep Oct Nov Dec Jan Feb
Canada
Australia
United States
Argentina
European Union
Ukraine
Russia
India
Source: USDA MWCACP (2014)
Figure 4 Total wheat production and its standard deviation in Canada and Australia from 1999 to 2014
0
5
10
15
20
25
30
35
40
Tota
l whe
at p
rodu
ctio
n (m
mt)
Year
Australia SD = 6.0
Canada SD = 4.7
2015 2013 2011 2009 2005 2007 2003 2001 1999
Source: CGC (2014) and ABARES (2014)
13The puck stops here!Canada challenges Australia’s grain supply chains
WHY AUSTRALIA NEEDS TO BOOST ITS WHEAT YIELD
If Australia wants to maintain its share of the wheat market compared with Canada then it needs to keep pace with the production increases occurring in Canada. Currently, Australia’s wheat production is increasing at only 45% of what it needs to be.
Over the whole period 1981 to 2012 linear growth occurred in wheat yields in Australia and Canada. This growth can be expressed mathematically as:
ya = 12.21t + 1416.4 (1) Australia
yc = 33.20t + 1710.2 (2) Canada
(for t=1,2,….,22 and where ya and yc are yields in Australia and Canada respectively).
The equations show that Australian wheat yields are increasing at a rate of 12.2kg/ha a year, while in Canada the yields are growing at 33.2kg/ha a year. Similarly, it shows that at the start of the analysis, 1981, wheat production in Australia averaged 1416kg/ha, while in Canada it averaged 1710kg/ha.
The average area sown to wheat over that period was 11.2 and 11.6 million hectares in Australia and Canada respectively. Total wheat production (million tonnes) in 1981 for each country, based on the average areas sown to wheat, was 11.2*(12.2+1416.4)/1000 for Australia and 11.6*(33.2+1710.2)/1000 for Canada. Hence Australia’s share of the two countries’ combined production was 44.2% at the start of the period. Yet by the end of the 22 year period, due to Canada’s greater rate of yield improvement, Australia’s share of the two countries’ joint production had slipped to 40%.
In order for Australia to boost its market share it must lift its rate of yield improvement relative to that achieved by Canada, assuming all other factors that can influence market share, such as relative costs of wheat production and market prices, are unchanged. The exact level of yield improvement required can be determined mathematically by re-stating equations (1) and (2) as:
ya=bat+aa
yc=bct+ac
Then assuming both countries can maintain their respective average areas planted to wheat at cc and ca for Canada and Australia respectively, Australia’s market share can remain unchanged from its starting share, if in any year i (i.e. ti) :
caaa = ca(aa + bati) (caaa + ccac) ca(aa + bati) + cc(ac + bcti)
This can be simplified to: ba = bc (3)
The implication of equation (3) is that as long as Australia maintains its yield improvement (ba) to be the proportion ( ) of Canada’s rate of wheat yield improvement (bc) then Australia’s market share will be unchanged. Note this does not mean that Australia’s rate of wheat yield improvement must match that of Canada. Rather, it must maintain its rate of yield improvement at the same proportion ( ) of Canada’s rate of wheat yield improvement. Applying equation (3) to equations (1) and (2) suggests that Australia’s rate of yield improvement has needed to be 27.5kg/ha/yr rather than the observed relatively low increase of 12.2kg/ha/yr. Australia is losing market share because its comparative rate of yield improvement has lagged too far behind that observed for Canada.
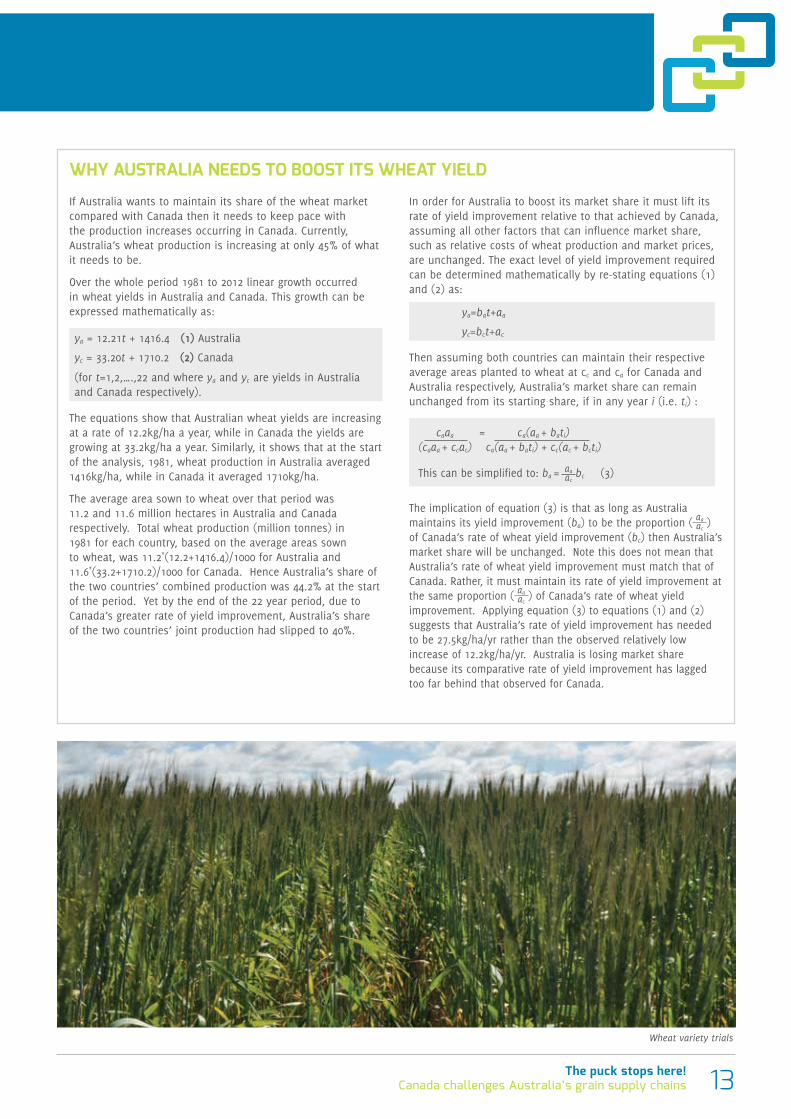
Wheat variety trials
The puck stops here!Canada challenges Australia’s grain supply chains14
Agricultural productivity trends in Canada and Australia
High annual productivity growth and increasing diversity of cropping options have characterised Canadian grain farming in recent years. Over the past decade the average annual rate of productivity growth in Canadian grain production has been about 1.7 per cent. By contrast, cropping industry productivity in Australia was one per cent per annum between 1999–2000 to 2010–11. Grain production systems in Canada have moved from traditional wheat-fallow systems to continuous crop rotations based on wheat, canola, peas, barley and specialty crops. In addition, new cultivars of corn and soybean are helping expand the range of adaptation of these high-yielding crops. The area of soybeans has almost doubled since 2008 with 2.27 million hectares planted in 2014. This increased portfolio of crop options adds to the flexibility and resilience of Canadian grain farm operations.
In Australia, cropping is intensifying in the high rainfall area that has traditionally been used mainly for animal production. However, at the same time, fallow is being reinstituted in some drier parts of the wheatbelt and low input cropping systems are being implemented more widely. The continued heavy reliance on wheat cropping in Australia restricts flexibility and exposes farmers heavily to adverse movements in wheat markets.
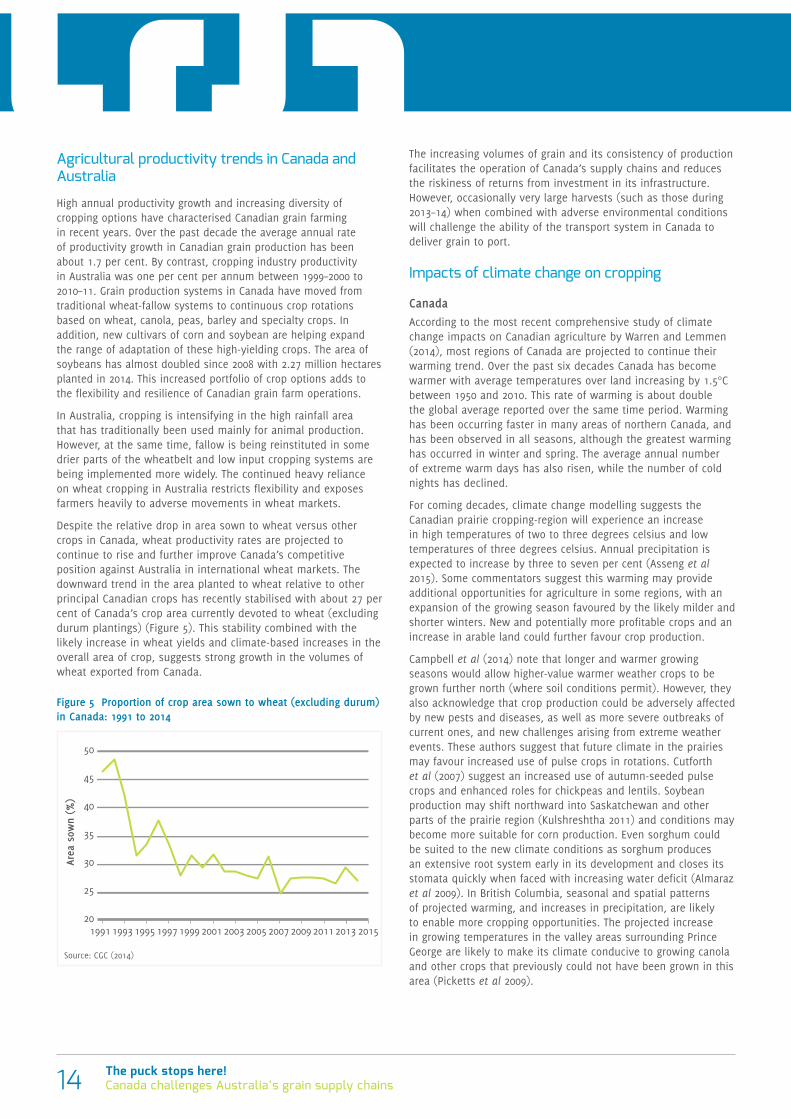
Despite the relative drop in area sown to wheat versus other crops in Canada, wheat productivity rates are projected to continue to rise and further improve Canada’s competitive position against Australia in international wheat markets. The downward trend in the area planted to wheat relative to other principal Canadian crops has recently stabilised with about 27 per cent of Canada’s crop area currently devoted to wheat (excluding durum plantings) (Figure 5). This stability combined with the likely increase in wheat yields and climate-based increases in the overall area of crop, suggests strong growth in the volumes of wheat exported from Canada.
The increasing volumes of grain and its consistency of production facilitates the operation of Canada’s supply chains and reduces the riskiness of returns from investment in its infrastructure. However, occasionally very large harvests (such as those during 2013–14) when combined with adverse environmental conditions will challenge the ability of the transport system in Canada to deliver grain to port.
Impacts of climate change on cropping
CanadaAccording to the most recent comprehensive study of climate change impacts on Canadian agriculture by Warren and Lemmen (2014), most regions of Canada are projected to continue their warming trend. Over the past six decades Canada has become warmer with average temperatures over land increasing by 1.5°C between 1950 and 2010. This rate of warming is about double the global average reported over the same time period. Warming has been occurring faster in many areas of northern Canada, and has been observed in all seasons, although the greatest warming has occurred in winter and spring. The average annual number of extreme warm days has also risen, while the number of cold nights has declined.
For coming decades, climate change modelling suggests the Canadian prairie cropping-region will experience an increase in high temperatures of two to three degrees celsius and low temperatures of three degrees celsius. Annual precipitation is expected to increase by three to seven per cent (Asseng et al 2015). Some commentators suggest this warming may provide additional opportunities for agriculture in some regions, with an expansion of the growing season favoured by the likely milder and shorter winters. New and potentially more profitable crops and an increase in arable land could further favour crop production.
Campbell et al (2014) note that longer and warmer growing seasons would allow higher-value warmer weather crops to be grown further north (where soil conditions permit). However, they also acknowledge that crop production could be adversely affected by new pests and diseases, as well as more severe outbreaks of current ones, and new challenges arising from extreme weather events. These authors suggest that future climate in the prairies may favour increased use of pulse crops in rotations. Cutforth et al (2007) suggest an increased use of autumn-seeded pulse crops and enhanced roles for chickpeas and lentils. Soybean production may shift northward into Saskatchewan and other parts of the prairie region (Kulshreshtha 2011) and conditions may become more suitable for corn production. Even sorghum could be suited to the new climate conditions as sorghum produces an extensive root system early in its development and closes its stomata quickly when faced with increasing water deficit (Almaraz et al 2009). In British Columbia, seasonal and spatial patterns of projected warming, and increases in precipitation, are likely to enable more cropping opportunities. The projected increase in growing temperatures in the valley areas surrounding Prince George are likely to make its climate conducive to growing canola and other crops that previously could not have been grown in this area (Picketts et al 2009).
Figure 5 Proportion of crop area sown to wheat (excluding durum) in Canada: 1991 to 2014
Area
sow
n (%
)
20
25
30
35
40
45
50
1991 1993 1995 1997 1999 2001 2003 2005 2007 2009 2011 2013 2015
Source: CGC (2014)
15The puck stops here!Canada challenges Australia’s grain supply chains
AustraliaAustralian export grain production will be increasingly challenged under projected climate change scenarios, especially if further reductions in winter rainfall occur. Since 1970 there has been a 17 per cent decline in average winter rainfall in the southwest of Australia (CSIRO and BOM 2014). In addition, the southeast of Australia has experienced a 15 per cent decline in late autumn and early winter rainfall since the mid-1990s, with a 25 per cent reduction in average rainfall across April and May.
For coming decades CSIRO and BOM (2014) note there will likely be a further decline in average rainfall across southern Australia, with a likely increase in drought frequency and severity. These conditions are unfavourable for crop production and are unlikely to be offset by the beneficial agronomic impacts on crop yield of higher atmospheric concentrations of CO2, which are also projected to be a feature of future climate.
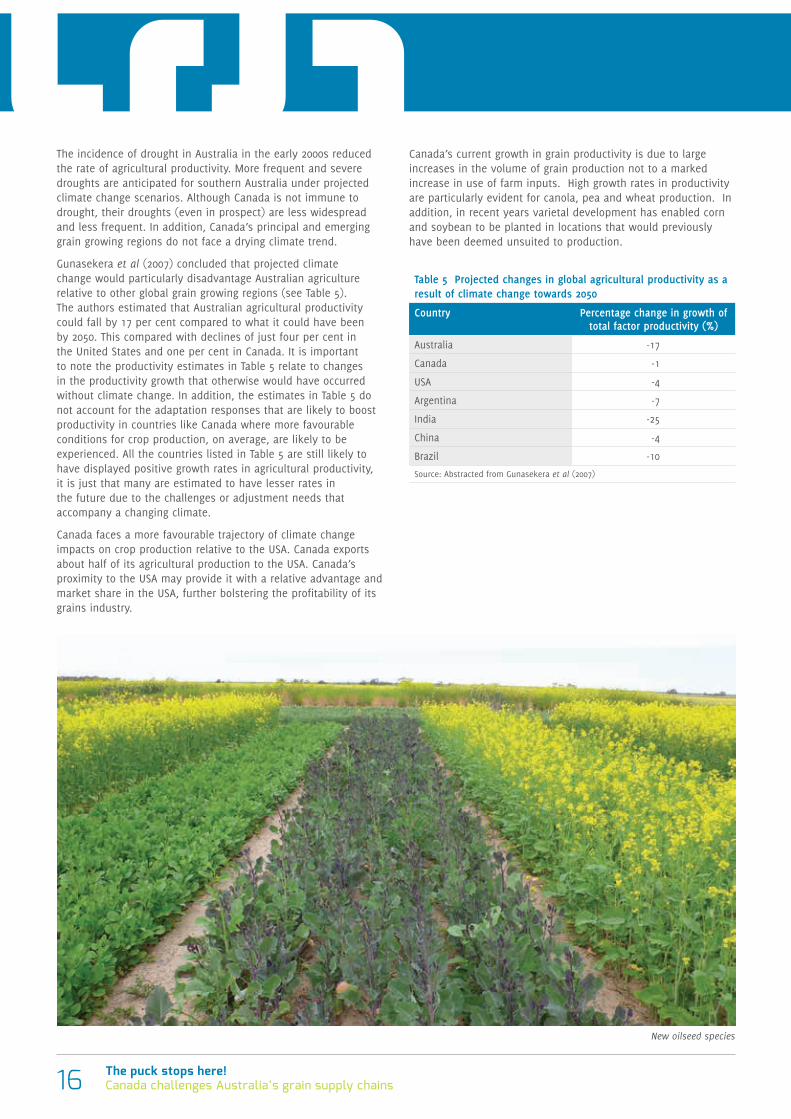
Other grain producing countriesZabel et al (2014) indicate that crop production in many northern high latitude regions will benefit from projected climate change, whereas regions in the Mediterranean, India, southern Africa and southern Australia face worsening conditions for crop production (Figure 6). Figure 6 summarises the projected climate change impact on the global distribution of land suitable for crop production by 2100.
Climate change is projected to increase the supply of cropland in the high latitudes of the northern hemisphere (Canada, Russia, China) over the next 80 years. Figure 6 accounts for the influence of climate, soil quality, water supply and topography in determining the suitability of land for crop production. Major food and energy crops are considered, including maize, rice, soybeans and wheat. As input for this mapping study, Zabel et al (2014) used data obtained from the global climate model ECHAM5 and relied on the SRES A1B climate scenario (IPCC 2000). In their study the area of land suitable for cropping increases by five million square kilometres by 2100.
Crop productivity
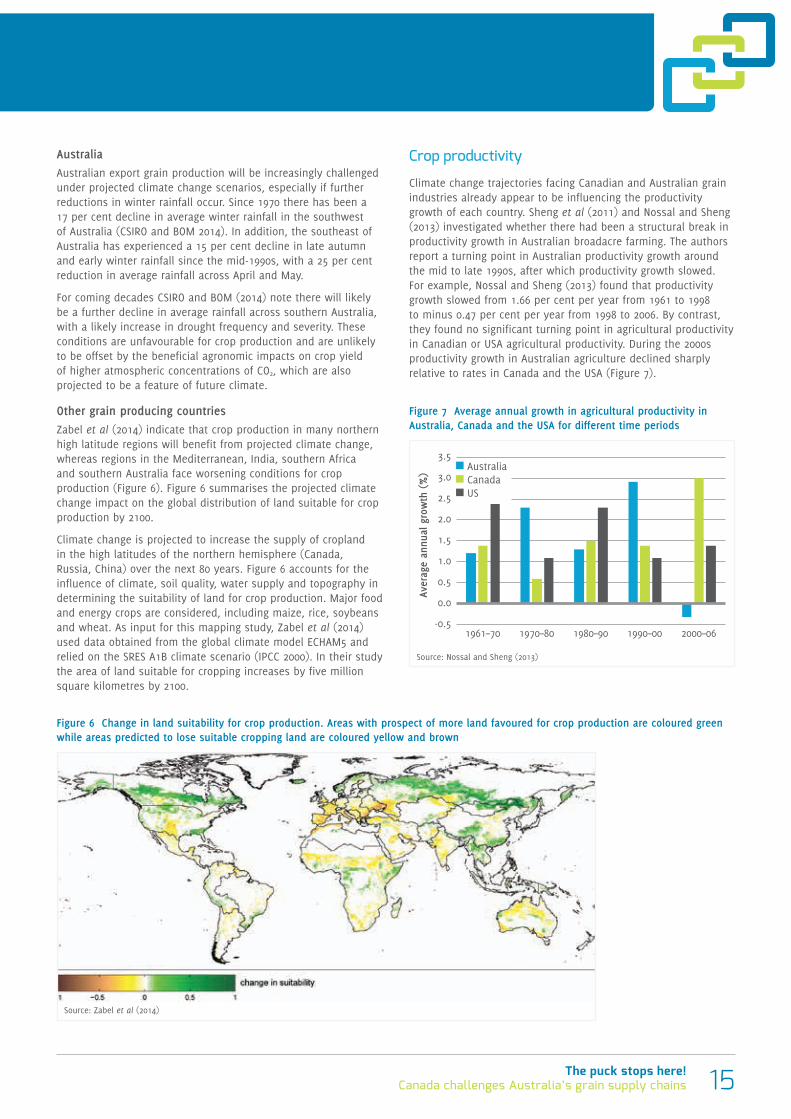
Climate change trajectories facing Canadian and Australian grain industries already appear to be influencing the productivity growth of each country. Sheng et al (2011) and Nossal and Sheng (2013) investigated whether there had been a structural break in productivity growth in Australian broadacre farming. The authors report a turning point in Australian productivity growth around the mid to late 1990s, after which productivity growth slowed. For example, Nossal and Sheng (2013) found that productivity growth slowed from 1.66 per cent per year from 1961 to 1998 to minus 0.47 per cent per year from 1998 to 2006. By contrast, they found no significant turning point in agricultural productivity in Canadian or USA agricultural productivity. During the 2000s productivity growth in Australian agriculture declined sharply relative to rates in Canada and the USA (Figure 7).
Figure 7 Average annual growth in agricultural productivity in Australia, Canada and the USA for different time periods
Aver
age
annu
al g
row
th (
%)
-0.5
0.0
0.5
1.0
1.5
2.0
2.5
3.0
3.5
1961–70 1970–80 1980–90 1990–00 2000–06
Australia Canada US
Source: Nossal and Sheng (2013)
Figure 6 Change in land suitability for crop production. Areas with prospect of more land favoured for crop production are coloured green while areas predicted to lose suitable cropping land are coloured yellow and brown
Source: Zabel et al (2014)
The puck stops here!Canada challenges Australia’s grain supply chains16
The incidence of drought in Australia in the early 2000s reduced the rate of agricultural productivity. More frequent and severe droughts are anticipated for southern Australia under projected climate change scenarios. Although Canada is not immune to drought, their droughts (even in prospect) are less widespread and less frequent. In addition, Canada’s principal and emerging grain growing regions do not face a drying climate trend.
Gunasekera et al (2007) concluded that projected climate change would particularly disadvantage Australian agriculture relative to other global grain growing regions (see Table 5). The authors estimated that Australian agricultural productivity could fall by 17 per cent compared to what it could have been by 2050. This compared with declines of just four per cent in the United States and one per cent in Canada. It is important to note the productivity estimates in Table 5 relate to changes in the productivity growth that otherwise would have occurred without climate change. In addition, the estimates in Table 5 do not account for the adaptation responses that are likely to boost productivity in countries like Canada where more favourable conditions for crop production, on average, are likely to be experienced. All the countries listed in Table 5 are still likely to have displayed positive growth rates in agricultural productivity, it is just that many are estimated to have lesser rates in the future due to the challenges or adjustment needs that accompany a changing climate.
Canada faces a more favourable trajectory of climate change impacts on crop production relative to the USA. Canada exports about half of its agricultural production to the USA. Canada’s proximity to the USA may provide it with a relative advantage and market share in the USA, further bolstering the profitability of its grains industry.
Canada’s current growth in grain productivity is due to large increases in the volume of grain production not to a marked increase in use of farm inputs. High growth rates in productivity are particularly evident for canola, pea and wheat production. In addition, in recent years varietal development has enabled corn and soybean to be planted in locations that would previously have been deemed unsuited to production.
Table 5 Projected changes in global agricultural productivity as a result of climate change towards 2050
Country Percentage change in growth of total factor productivity (%)
Australia -17
Canada -1
USA -4
Argentina -7
India -25
China -4
Brazil -10
Source: Abstracted from Gunasekera et al (2007)
New oilseed species
17The puck stops here!Canada challenges Australia’s grain supply chains
Overview of supply chains for bulk grain exports from Canada and Australia
Large volumes of grain are exported from Canada and Australia each year along well-defined pathways (Figure 8). Transactions occur at each of the main steps of these pathways and depending on these transactions grain may flow to alternative destinations. Ultimately grain destined for export markets is loaded at port terminals as either bulk or containerised product.
Supply chains for exported grain are well established but continue to evolve as they are influenced by a range of factors including commercial arrangements, natural environment, geography, government regulation and history. This has resulted in significant similarities and differences between supply chains in Canada and Australia. The overwhelming challenge for both countries remains to improve their supply chains to enhance the execution of sales, improve satisfaction of export customers, increase returns to farmers and reward all essential participants across the supply chains.
Similarities
Canada and Australia have significant similarities in their grain production systems. They produce similar sorts of grains, export large proportions of these grains and compete in similar markets. Production in both countries is predominantly cereals, canola and pulses. Corn (Canada) and sorghum (Australia) are also important grains but are currently not a major part of the export supply chains in either country. Both countries are relatively small producers on a global scale, but their small domestic demand relative to their production make both significant exporters to global markets.
Both the Canadian and Australian governments have been heavily involved in their grain supply chains through regulation and provision of capital. Grain supply chains are characterised by their infrastructure costs and their tendency to be based on natural monopolies. In recent years the governments of both countries have divested their involvement in most parts of the grain supply chain, with the most significant recent events being the dismantling of export marketing controls. The exclusive right of the Canadian Wheat Board (CWB) to sell wheat and barley from western provinces ceased in 2012, while the single-desk marketing arrangements for the Australian Wheat Board (AWB) were removed in 2008.
Home-grown grain companies occupy a significant position in the supply chains of both countries. In Canada, Richardsons and Viterra (now owned by Glencore) own substantial infrastructure and export most of Canada’s grain while in Australia CBH and GrainCorp are the dominant home-grown players. Re-organisation of the supply chains is ongoing in both countries with consolidation of smaller companies or cooperatives into larger entities, new investments in infrastructure and foreign grain companies seeking to increase their market share.
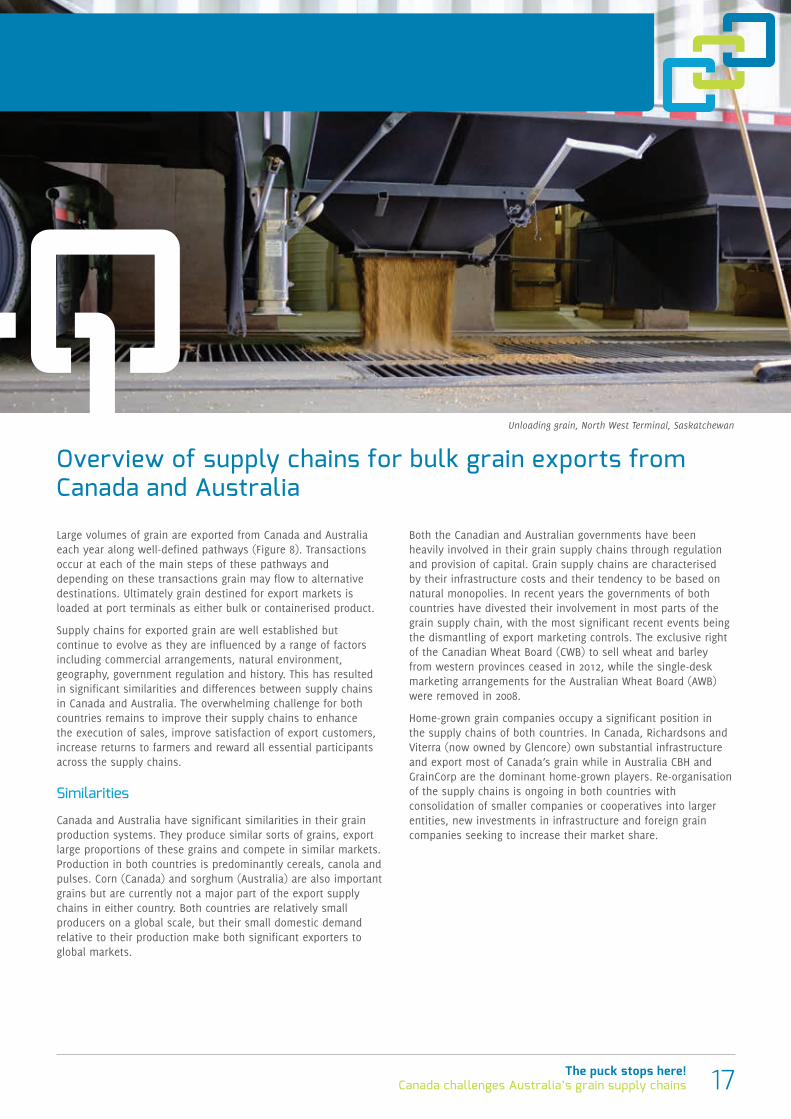
Unloading grain, North West Terminal, Saskatchewan
The puck stops here!Canada challenges Australia’s grain supply chains18
Differences
Grain exported from Canada must be transported long distances across provincial boundaries to export ports. This requires heavy reliance on rail transport to move grain from country receival points to a few main ports, such as Vancouver. Canada’s federal government maintains strong regulatory control of rail transport costs. In contrast, Australian grain is transported relatively short distances to many ports, which has resulted in export grain transport systems being constructed within state boundaries. Coordinated investment by federal and state governments in export grain supply has historically been rare in Australia. In addition, complementarity of investments in road and rail transport services has not been a key feature of export grain supply chain investment in Australia.
Supply chains in Canada operate a ‘pull’ delivery system where most grain is stored on-farm and then moved from farm to receival site to port ‘just-in-time’ as ships arrive. Australia operates on a ‘push’ system where only a small proportion of the grain is stored on-farm. Grain is moved from farm to upcountry or port storage immediately after harvest, in readiness for a ship’s future arrival. Both systems offer advantages.
Grain received into warehouse storage in Australia is offered for sale to all registered traders using the bulk handler’s electronic stock management system. In contrast, Canadian growers are mostly only able to sell their grain to buyers that can physically receive the grain. This restricts farmers’ sales to their local receival sites. Farmers wanting to bypass their local receival sites are reliant on the Canadian government’s producer car system (see Box 3) to transport grain to port and other potential buyers. Only about three per cent of the grain is transported using producer cars.
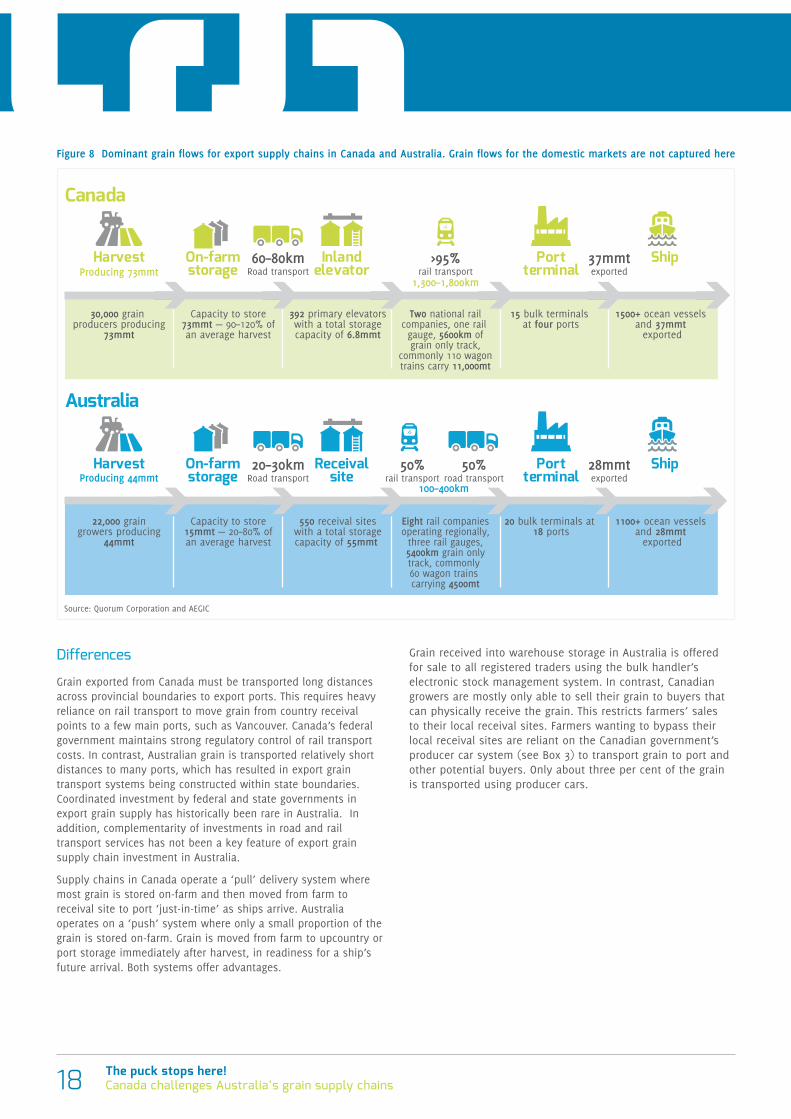
Figure 8 Dominant grain flows for export supply chains in Canada and Australia. Grain flows for the domestic markets are not captured here
Harvest ShipInlandelevator
On-farmstorage
Portterminal
100–400km
30,000 grain producers producing
73mmt
22,000 graingrowers producing
44mmt
Capacity to store73mmt — 90–120% ofan average harvest
Capacity to store15mmt — 20–80% ofan average harvest
392 primary elevatorswith a total storagecapacity of 6.8mmt
60–80kmRoad transport
550 receival siteswith a total storagecapacity of 55mmt
Two national railcompanies, one rail gauge, 5600km ofgrain only track,
commonly 110 wagontrains carry 11,000mt
15 bulk terminals at four ports
20 bulk terminals at 18 ports
1500+ ocean vessels and 37mmt
exported
Eight rail companiesoperating regionally,
three rail gauges,5400km grain onlytrack, commonly 60 wagon trains carrying 4500mt
1100+ ocean vessels and 28mmt
exported
Receivalsite
Canada
Australia
1,300–1,800km
20–30kmRoad transport
>95%rail transportProducing 73mmt
Producing 44mmt50%
rail transport50%
road transportHarvest ShipOn-farm
storagePort
terminal
37mmtexported
28mmtexported
Source: Quorum Corporation and AEGIC
19The puck stops here!Canada challenges Australia’s grain supply chains
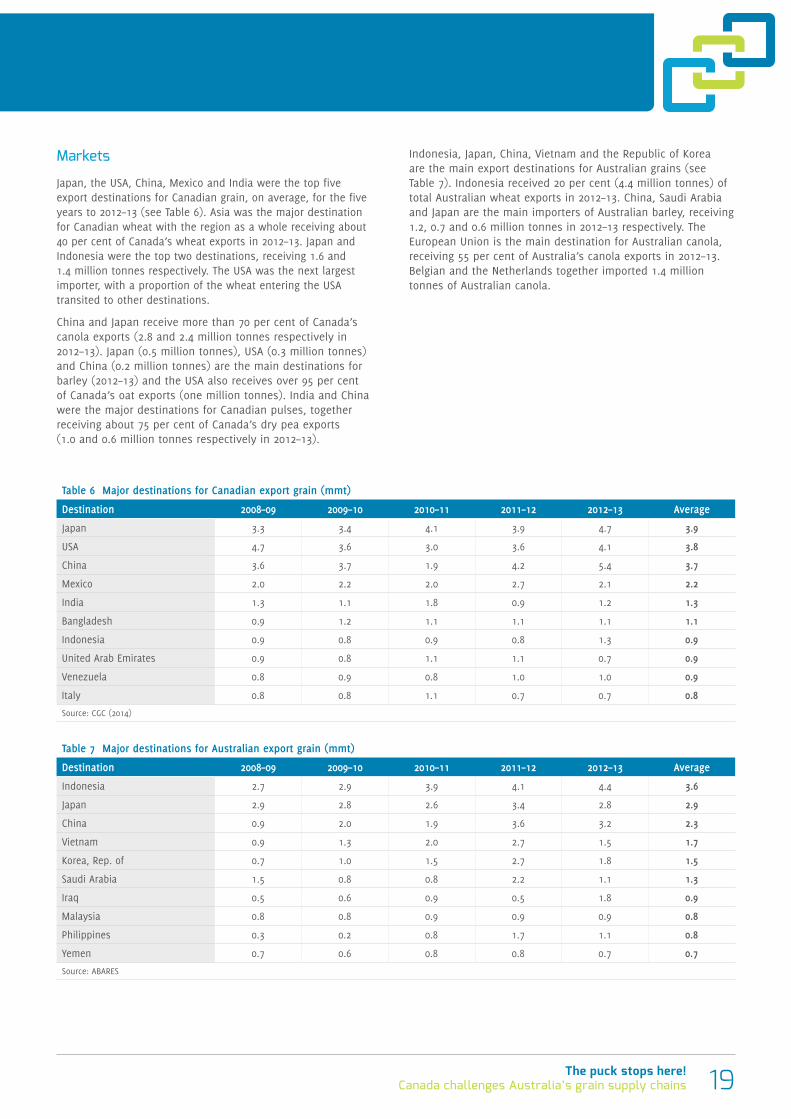
Markets
Japan, the USA, China, Mexico and India were the top five export destinations for Canadian grain, on average, for the five years to 2012–13 (see Table 6). Asia was the major destination for Canadian wheat with the region as a whole receiving about 40 per cent of Canada’s wheat exports in 2012–13. Japan and Indonesia were the top two destinations, receiving 1.6 and 1.4 million tonnes respectively. The USA was the next largest importer, with a proportion of the wheat entering the USA transited to other destinations.
China and Japan receive more than 70 per cent of Canada’s canola exports (2.8 and 2.4 million tonnes respectively in 2012–13). Japan (0.5 million tonnes), USA (0.3 million tonnes) and China (0.2 million tonnes) are the main destinations for barley (2012–13) and the USA also receives over 95 per cent of Canada’s oat exports (one million tonnes). India and China were the major destinations for Canadian pulses, together receiving about 75 per cent of Canada’s dry pea exports (1.0 and 0.6 million tonnes respectively in 2012–13).
Indonesia, Japan, China, Vietnam and the Republic of Korea are the main export destinations for Australian grains (see Table 7). Indonesia received 20 per cent (4.4 million tonnes) of total Australian wheat exports in 2012–13. China, Saudi Arabia and Japan are the main importers of Australian barley, receiving 1.2, 0.7 and 0.6 million tonnes in 2012–13 respectively. The European Union is the main destination for Australian canola, receiving 55 per cent of Australia’s canola exports in 2012–13. Belgian and the Netherlands together imported 1.4 million tonnes of Australian canola.
Table 6 Major destinations for Canadian export grain (mmt)
Destination 2008–09 2009–10 2010–11 2011–12 2012–13 Average
Japan 3.3 3.4 4.1 3.9 4.7 3.9
USA 4.7 3.6 3.0 3.6 4.1 3.8
China 3.6 3.7 1.9 4.2 5.4 3.7
Mexico 2.0 2.2 2.0 2.7 2.1 2.2
India 1.3 1.1 1.8 0.9 1.2 1.3
Bangladesh 0.9 1.2 1.1 1.1 1.1 1.1
Indonesia 0.9 0.8 0.9 0.8 1.3 0.9
United Arab Emirates 0.9 0.8 1.1 1.1 0.7 0.9
Venezuela 0.8 0.9 0.8 1.0 1.0 0.9
Italy 0.8 0.8 1.1 0.7 0.7 0.8
Source: CGC (2014)
Table 7 Major destinations for Australian export grain (mmt)
Destination 2008–09 2009–10 2010–11 2011–12 2012–13 Average
Indonesia 2.7 2.9 3.9 4.1 4.4 3.6
Japan 2.9 2.8 2.6 3.4 2.8 2.9
China 0.9 2.0 1.9 3.6 3.2 2.3
Vietnam 0.9 1.3 2.0 2.7 1.5 1.7
Korea, Rep. of 0.7 1.0 1.5 2.7 1.8 1.5
Saudi Arabia 1.5 0.8 0.8 2.2 1.1 1.3
Iraq 0.5 0.6 0.9 0.5 1.8 0.9
Malaysia 0.8 0.8 0.9 0.9 0.9 0.8
Philippines 0.3 0.2 0.8 1.7 1.1 0.8
Yemen 0.7 0.6 0.8 0.8 0.7 0.7
Source: ABARES
The puck stops here!Canada challenges Australia’s grain supply chains20
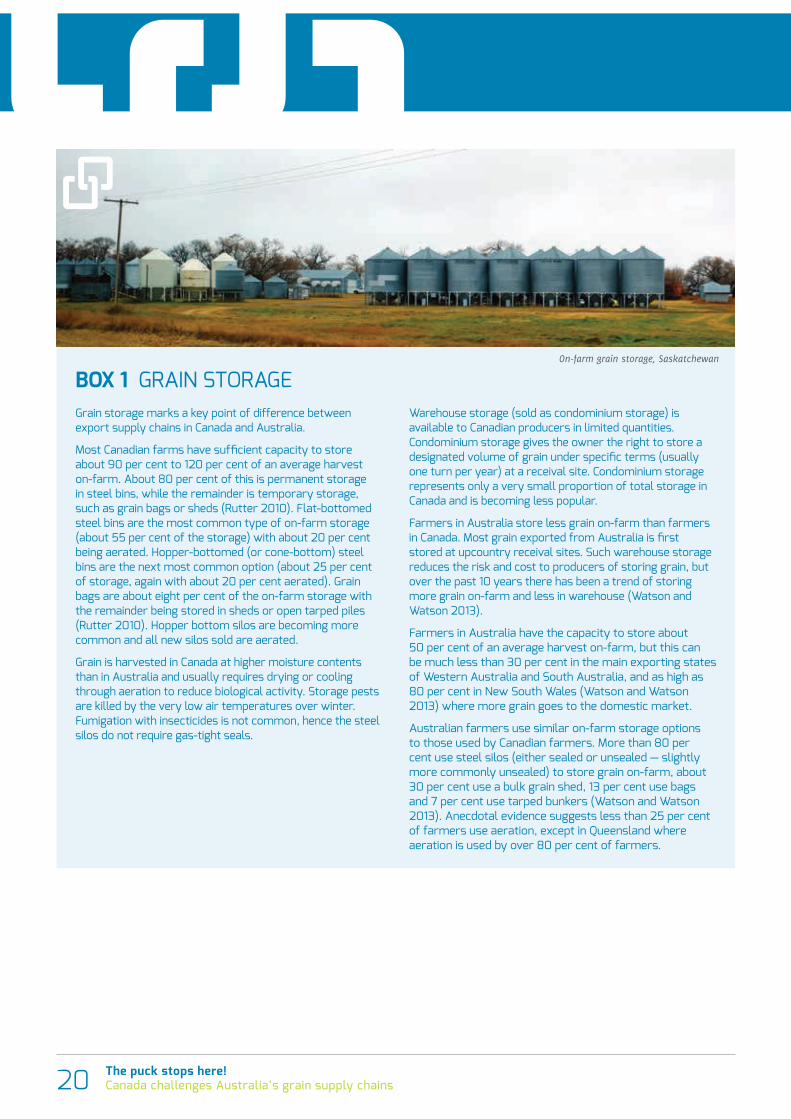
BOX 1 GRAIN STORAGE Grain storage marks a key point of difference between export supply chains in Canada and Australia.
Most Canadian farms have sufficient capacity to store about 90 per cent to 120 per cent of an average harvest on-farm. About 80 per cent of this is permanent storage in steel bins, while the remainder is temporary storage, such as grain bags or sheds (Rutter 2010). Flat-bottomed steel bins are the most common type of on-farm storage (about 55 per cent of the storage) with about 20 per cent being aerated. Hopper-bottomed (or cone-bottom) steel bins are the next most common option (about 25 per cent of storage, again with about 20 per cent aerated). Grain bags are about eight per cent of the on-farm storage with the remainder being stored in sheds or open tarped piles (Rutter 2010). Hopper bottom silos are becoming more common and all new silos sold are aerated.
Grain is harvested in Canada at higher moisture contents than in Australia and usually requires drying or cooling through aeration to reduce biological activity. Storage pests are killed by the very low air temperatures over winter. Fumigation with insecticides is not common, hence the steel silos do not require gas-tight seals.
Warehouse storage (sold as condominium storage) is available to Canadian producers in limited quantities. Condominium storage gives the owner the right to store a designated volume of grain under specific terms (usually one turn per year) at a receival site. Condominium storage represents only a very small proportion of total storage in Canada and is becoming less popular.
Farmers in Australia store less grain on-farm than farmers in Canada. Most grain exported from Australia is first stored at upcountry receival sites. Such warehouse storage reduces the risk and cost to producers of storing grain, but over the past 10 years there has been a trend of storing more grain on-farm and less in warehouse (Watson and Watson 2013).
Farmers in Australia have the capacity to store about 50 per cent of an average harvest on-farm, but this can be much less than 30 per cent in the main exporting states of Western Australia and South Australia, and as high as 80 per cent in New South Wales (Watson and Watson 2013) where more grain goes to the domestic market.
Australian farmers use similar on-farm storage options to those used by Canadian farmers. More than 80 per cent use steel silos (either sealed or unsealed — slightly more commonly unsealed) to store grain on-farm, about 30 per cent use a bulk grain shed, 13 per cent use bags and 7 per cent use tarped bunkers (Watson and Watson 2013). Anecdotal evidence suggests less than 25 per cent of farmers use aeration, except in Queensland where aeration is used by over 80 per cent of farmers.
On-farm grain storage, Saskatchewan
21The puck stops here!Canada challenges Australia’s grain supply chains
Grain flows from farm to port
Storage and receival of grainAlmost all grain in Canada is stored on-farm following harvest with less than 10 per cent delivered to receival sites directly from the paddock (Figure 8). After harvest, farmers present samples of the grain stored in their farm bins to buyers at receival sites and negotiate prices and grades. Local receival sites, which are mostly owned by large grain companies, compete for farmers’ grain through their price offers, contract terms and other incentives. These buyers will often accept lower grade grain into higher grades depending on their inventory profile and opportunities for blending. Farmers usually spread their sales across a few receival sites and are willing to bypass closer receival sites and deliver grain over long distances (more than 100km), to take advantage of attractive offers.
Prices are usually offered ‘delivered’ at the grain receival site. Most receival site services (receival, storage, cleaning and out-loading) are not charged directly but are embedded within the price offered for the grain. Efficient grain receival sites with lower grain handling costs can offer higher prices to attract more grain. However, receival site owners are still required by the Canadian Grain Commission (CGC) to post prices for their services — a condition left over from the period of CWB’s marketing monopoly. Ownership of the grain changes at the inland receival site, so costs beyond the receival site are not transparent to the farmer unless they move their grain using the producer car system (see Box 3).
Grain companies develop a thorough understanding of the quantity and quality of grain available based on the accumulated data from bin samples presented by farmers. They therefore have potential to target exact grain specifications by purchasing grain stored in particular farmer bins to meet individual customer requirements. However the profitability of receival sites is dependent on throughput of grain, so receival site operators are strongly motivated to attract high volumes of grain rather than target small niche volumes.
Total storage at inland grain receival sites in western Canada has fluctuated between 5.7 and 7.6 million tonnes over the past 13 years. In 2012–13, there was about 6.8 million tonnes of storage, which was less than 10 per cent of an average Canadian harvest (Quorum 2013). All inland receival sites are located on rail lines with storage used primarily to manage grain inventories and the logistics of loading rail cars for the onward transport of grain.
Farmers cannot always deliver grain to receival sites when they desire, particularly when there is high demand for receival site services. Receival sites control grain receival either through price offers or contract terms that specify delivery times. High prices are offered when receival sites are willing to accept grain and low prices are offered when grain is not required. In Canada, deliveries to receival sites usually occur at an even pace after harvest without causing a spike in demand for trucks or trucking rates.
Storage limits can force receival sites to stop taking deliveries, which in turn pushes the cost and risk of storing grain back onto farmers. For example, the unusually large 2013–14 harvest combined with delays transporting grain to port by rail caused a backlog of grain in the system resulting in a period of sustained low prices offered to farmers, as receival sites were unable to accept large quantities of grain (see Box 2).
In Australia, grain destined for export is mostly delivered to warehouse storage at receival points directly from the harvested paddock (Figure 8). This causes a spike in demand for trucking at harvest time and increased rates charged for trucking services. However, it also transfers the storage risk to the bulk handler, which is of value to the growers.
Grain is usually delivered to the closest receival site because longer distances to receival sites increases transport costs, delays harvest and increases risks to standing crops. However, minor grades of grain are only accepted at limited locations causing farmers to travel further to deliver particular types of grain. Demand for storage is met as required, with bulk handlers opening surge storage sites during large harvests. Grain must meet specific receival standards and is only accepted into designated grades. However, using the quality optimisation service offered by CBH, Western Australian farmers can in some circumstances blend their loads of grain ‘virtually’ after delivery to achieve a higher grade.
Most receival and storage sites within a region are operated by one major bulk handling company and prices for receival and storage services are the same within a region regardless of the efficiency of the site. However, recent changes to industry organisation have seen more competition for farmers’ grain between bulk handlers and some price differentiation based on receival site efficiency; but these changes have so far been limited. The GrainCorp network of receival sites throughout Queensland, New South Wales and Victoria, faces the highest level of competition from competing bulk handlers, but GrainCorp still owns 85 per cent of the commercial warehouse storage (ADM, 2013). Viterra, with most of its assets in South Australia, is currently the only major bulk handler to offer differential receival site pricing with their more efficient ‘tier one’ sites attracting lower receival fees.
With increasing yields and increasing harvester capacity, farmers are demanding receival and storage sites to accommodate larger volumes of grain over shorter periods of time. This is also being accompanied by demand from traders to move larger volumes of grain to port to enable execution of sales sooner after harvest.
The puck stops here!Canada challenges Australia’s grain supply chains22
Farmers retain ownership of grain while the grain is in warehouse storage and offer the grain to potential buyers usually via the warehouse owner’s electronic stock management system. Grain traders compete for the grain through price offers with grain usually being sold FIS at port. About 90 per cent of the grain is committed within 9–12 weeks of harvest (Reading, 2012). Grain, however, can also be sold when it is delivered to specific upcountry receival sites, particularly in eastern Australia where individual site pricing applies. Bulk handling companies that operate the warehousing services are usually contracted to deliver farmers’ grain to port for export. Grain within a company’s bulk handling system, however, is readily exchangeable so the grain bought and exported by a grain trader is of the equivalent segregation to the grain purchased from a farmer, but may not be the same physical grain.
Bunge has recently re-entered the export grain industry in Australia and operates a supply chain model more akin to the inland receival site system of Canada and differing from the more common Australian bulk handling models. Bunge has one port terminal operating in Bunbury in Western Australia, with the potential to export about 0.5 million tonnes per year and will open another in Geelong in Victoria. They have also invested in upcountry storage as feeder sites for the Bunbury port. Bunge competes for grain through price and other product offerings. The terminals operate on just-in-time delivery, pulling grain from farmers’ storage when a ship is ready to load. Grain is priced and accepted on specification with less emphasis on grade.
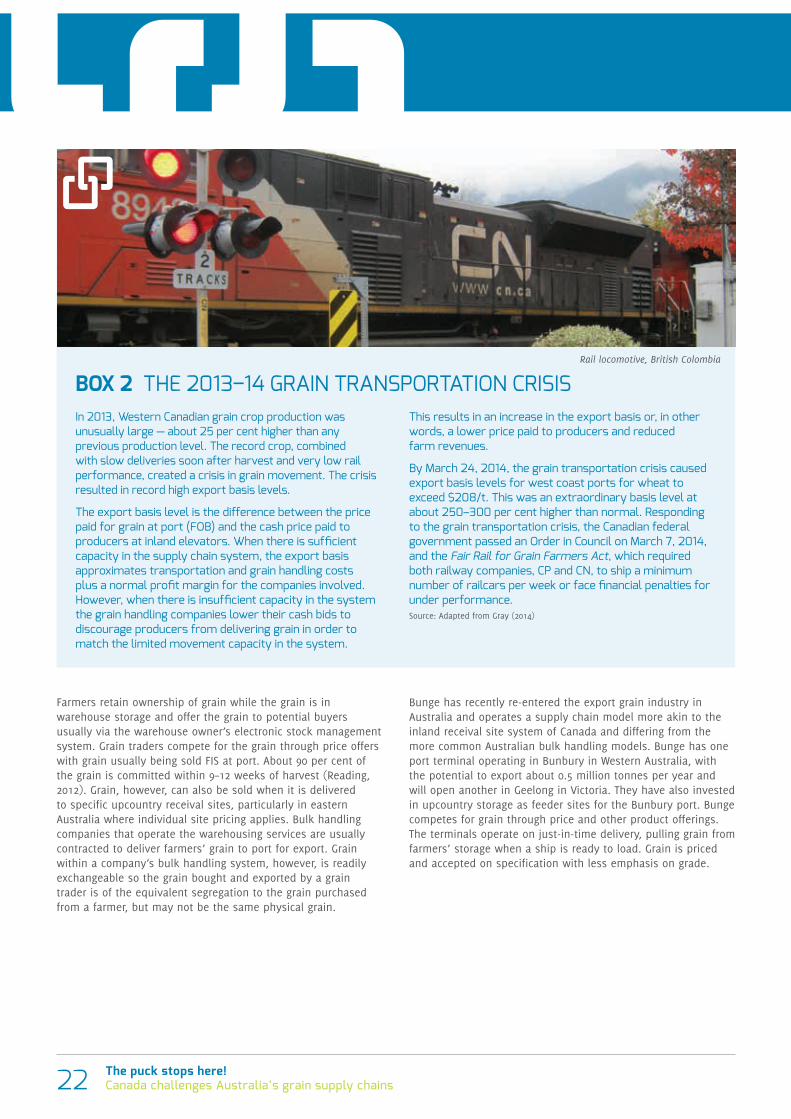
BOX 2 THE 2013–14 GRAIN TRANSPORTATION CRISISIn 2013, Western Canadian grain crop production was unusually large — about 25 per cent higher than any previous production level. The record crop, combined with slow deliveries soon after harvest and very low rail performance, created a crisis in grain movement. The crisis resulted in record high export basis levels.
The export basis level is the difference between the price paid for grain at port (FOB) and the cash price paid to producers at inland elevators. When there is sufficient capacity in the supply chain system, the export basis approximates transportation and grain handling costs plus a normal profit margin for the companies involved. However, when there is insufficient capacity in the system the grain handling companies lower their cash bids to discourage producers from delivering grain in order to match the limited movement capacity in the system.
This results in an increase in the export basis or, in other words, a lower price paid to producers and reduced farm revenues.
By March 24, 2014, the grain transportation crisis caused export basis levels for west coast ports for wheat to exceed $208/t. This was an extraordinary basis level at about 250–300 per cent higher than normal. Responding to the grain transportation crisis, the Canadian federal government passed an Order in Council on March 7, 2014, and the Fair Rail for Grain Farmers Act, which required both railway companies, CP and CN, to ship a minimum number of railcars per week or face financial penalties for under performance.Source: Adapted from Gray (2014)
Rail locomotive, British Colombia
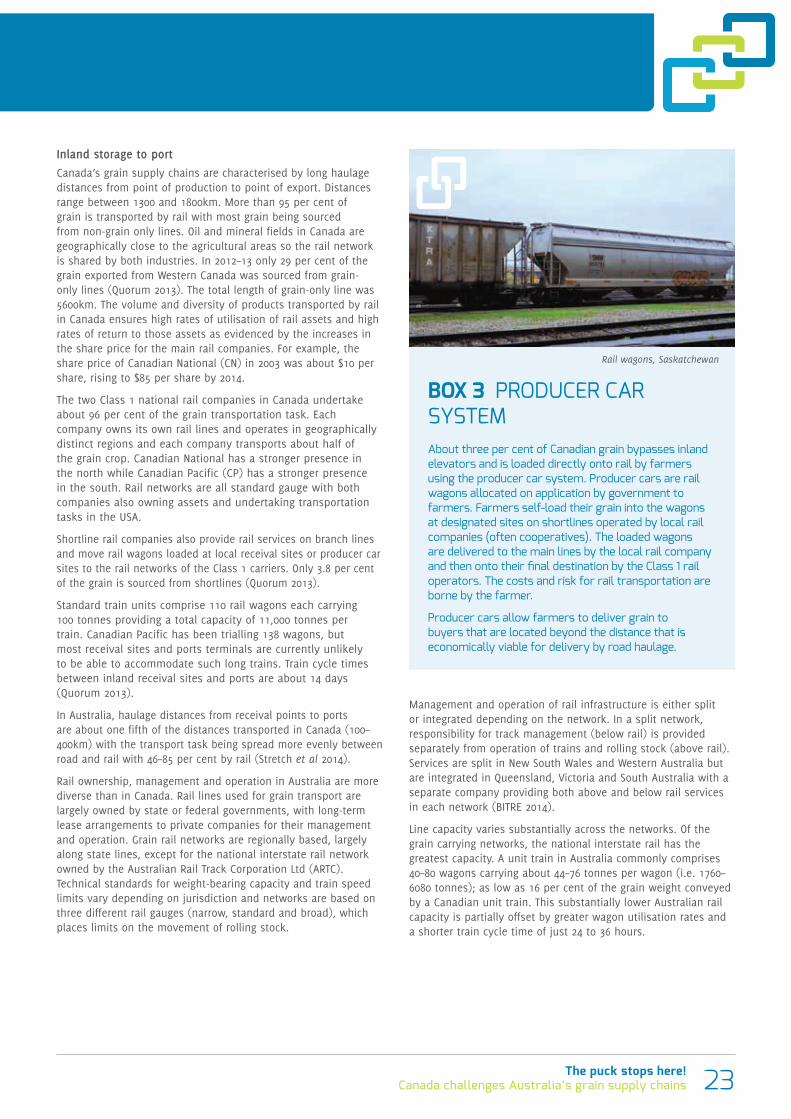
23The puck stops here!Canada challenges Australia’s grain supply chains
Inland storage to portCanada’s grain supply chains are characterised by long haulage distances from point of production to point of export. Distances range between 1300 and 1800km. More than 95 per cent of grain is transported by rail with most grain being sourced from non-grain only lines. Oil and mineral fields in Canada are geographically close to the agricultural areas so the rail network is shared by both industries. In 2012–13 only 29 per cent of the grain exported from Western Canada was sourced from grain-only lines (Quorum 2013). The total length of grain-only line was 5600km. The volume and diversity of products transported by rail in Canada ensures high rates of utilisation of rail assets and high rates of return to those assets as evidenced by the increases in the share price for the main rail companies. For example, the share price of Canadian National (CN) in 2003 was about $10 per share, rising to $85 per share by 2014.
The two Class 1 national rail companies in Canada undertake about 96 per cent of the grain transportation task. Each company owns its own rail lines and operates in geographically distinct regions and each company transports about half of the grain crop. Canadian National has a stronger presence in the north while Canadian Pacific (CP) has a stronger presence in the south. Rail networks are all standard gauge with both companies also owning assets and undertaking transportation tasks in the USA.
Shortline rail companies also provide rail services on branch lines and move rail wagons loaded at local receival sites or producer car sites to the rail networks of the Class 1 carriers. Only 3.8 per cent of the grain is sourced from shortlines (Quorum 2013).
Standard train units comprise 110 rail wagons each carrying 100 tonnes providing a total capacity of 11,000 tonnes per train. Canadian Pacific has been trialling 138 wagons, but most receival sites and ports terminals are currently unlikely to be able to accommodate such long trains. Train cycle times between inland receival sites and ports are about 14 days (Quorum 2013).
In Australia, haulage distances from receival points to ports are about one fifth of the distances transported in Canada (100–400km) with the transport task being spread more evenly between road and rail with 46–85 per cent by rail (Stretch et al 2014).
Rail ownership, management and operation in Australia are more diverse than in Canada. Rail lines used for grain transport are largely owned by state or federal governments, with long-term lease arrangements to private companies for their management and operation. Grain rail networks are regionally based, largely along state lines, except for the national interstate rail network owned by the Australian Rail Track Corporation Ltd (ARTC). Technical standards for weight-bearing capacity and train speed limits vary depending on jurisdiction and networks are based on three different rail gauges (narrow, standard and broad), which places limits on the movement of rolling stock.
Management and operation of rail infrastructure is either split or integrated depending on the network. In a split network, responsibility for track management (below rail) is provided separately from operation of trains and rolling stock (above rail). Services are split in New South Wales and Western Australia but are integrated in Queensland, Victoria and South Australia with a separate company providing both above and below rail services in each network (BITRE 2014).
Line capacity varies substantially across the networks. Of the grain carrying networks, the national interstate rail has the greatest capacity. A unit train in Australia commonly comprises 40–80 wagons carrying about 44–76 tonnes per wagon (i.e. 1760–6080 tonnes); as low as 16 per cent of the grain weight conveyed by a Canadian unit train. This substantially lower Australian rail capacity is partially offset by greater wagon utilisation rates and a shorter train cycle time of just 24 to 36 hours.
BOX 3 PRODUCER CAR SYSTEMAbout three per cent of Canadian grain bypasses inland elevators and is loaded directly onto rail by farmers using the producer car system. Producer cars are rail wagons allocated on application by government to farmers. Farmers self-load their grain into the wagons at designated sites on shortlines operated by local rail companies (often cooperatives). The loaded wagons are delivered to the main lines by the local rail company and then onto their final destination by the Class 1 rail operators. The costs and risk for rail transportation are borne by the farmer.
Producer cars allow farmers to deliver grain to buyers that are located beyond the distance that is economically viable for delivery by road haulage.
Rail wagons, Saskatchewan
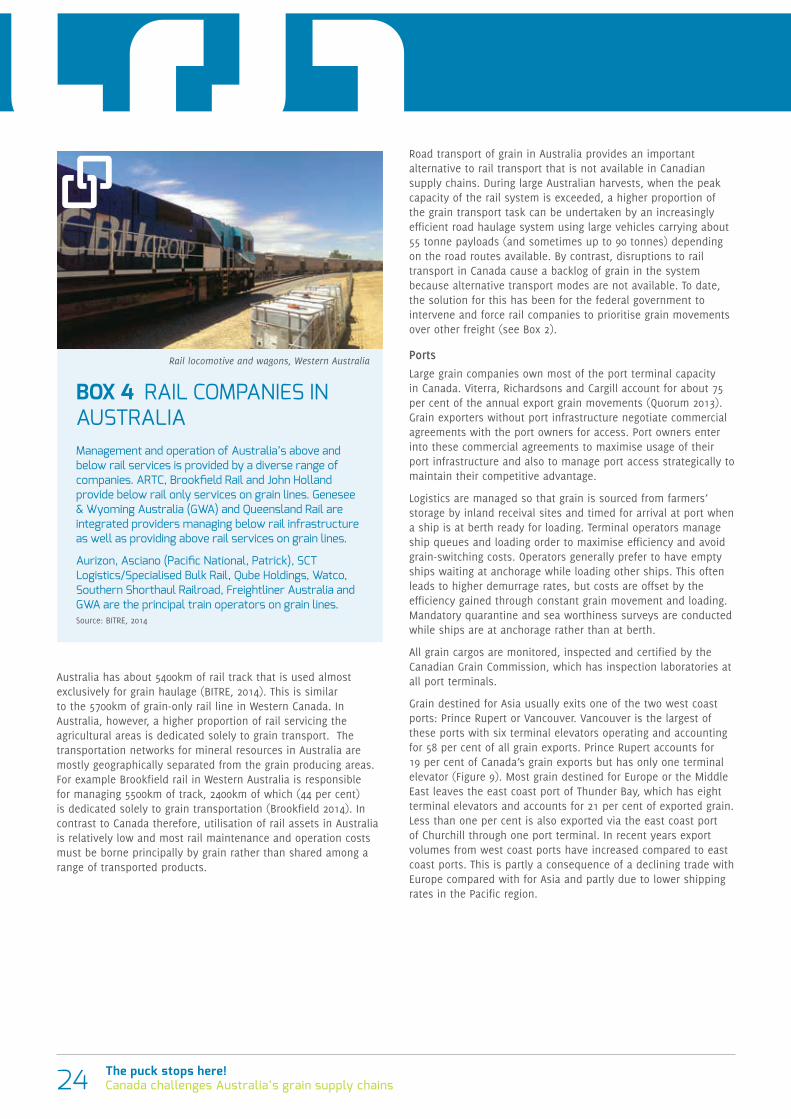
The puck stops here!Canada challenges Australia’s grain supply chains24
Australia has about 5400km of rail track that is used almost exclusively for grain haulage (BITRE, 2014). This is similar to the 5700km of grain-only rail line in Western Canada. In Australia, however, a higher proportion of rail servicing the agricultural areas is dedicated solely to grain transport. The transportation networks for mineral resources in Australia are mostly geographically separated from the grain producing areas. For example Brookfield rail in Western Australia is responsible for managing 5500km of track, 2400km of which (44 per cent) is dedicated solely to grain transportation (Brookfield 2014). In contrast to Canada therefore, utilisation of rail assets in Australia is relatively low and most rail maintenance and operation costs must be borne principally by grain rather than shared among a range of transported products.
Road transport of grain in Australia provides an important alternative to rail transport that is not available in Canadian supply chains. During large Australian harvests, when the peak capacity of the rail system is exceeded, a higher proportion of the grain transport task can be undertaken by an increasingly efficient road haulage system using large vehicles carrying about 55 tonne payloads (and sometimes up to 90 tonnes) depending on the road routes available. By contrast, disruptions to rail transport in Canada cause a backlog of grain in the system because alternative transport modes are not available. To date, the solution for this has been for the federal government to intervene and force rail companies to prioritise grain movements over other freight (see Box 2).
PortsLarge grain companies own most of the port terminal capacity in Canada. Viterra, Richardsons and Cargill account for about 75 per cent of the annual export grain movements (Quorum 2013). Grain exporters without port infrastructure negotiate commercial agreements with the port owners for access. Port owners enter into these commercial agreements to maximise usage of their port infrastructure and also to manage port access strategically to maintain their competitive advantage.
Logistics are managed so that grain is sourced from farmers’ storage by inland receival sites and timed for arrival at port when a ship is at berth ready for loading. Terminal operators manage ship queues and loading order to maximise efficiency and avoid grain-switching costs. Operators generally prefer to have empty ships waiting at anchorage while loading other ships. This often leads to higher demurrage rates, but costs are offset by the efficiency gained through constant grain movement and loading. Mandatory quarantine and sea worthiness surveys are conducted while ships are at anchorage rather than at berth.
All grain cargos are monitored, inspected and certified by the Canadian Grain Commission, which has inspection laboratories at all port terminals.
Grain destined for Asia usually exits one of the two west coast ports: Prince Rupert or Vancouver. Vancouver is the largest of these ports with six terminal elevators operating and accounting for 58 per cent of all grain exports. Prince Rupert accounts for 19 per cent of Canada’s grain exports but has only one terminal elevator (Figure 9). Most grain destined for Europe or the Middle East leaves the east coast port of Thunder Bay, which has eight terminal elevators and accounts for 21 per cent of exported grain. Less than one per cent is also exported via the east coast port of Churchill through one port terminal. In recent years export volumes from west coast ports have increased compared to east coast ports. This is partly a consequence of a declining trade with Europe compared with for Asia and partly due to lower shipping rates in the Pacific region.
BOX 4 RAIL COMPANIES IN AUSTRALIAManagement and operation of Australia’s above and below rail services is provided by a diverse range of companies. ARTC, Brookfield Rail and John Holland provide below rail only services on grain lines. Genesee & Wyoming Australia (GWA) and Queensland Rail are integrated providers managing below rail infrastructure as well as providing above rail services on grain lines.
Aurizon, Asciano (Pacific National, Patrick), SCT Logistics/Specialised Bulk Rail, Qube Holdings, Watco, Southern Shorthaul Railroad, Freightliner Australia and GWA are the principal train operators on grain lines.Source: BITRE, 2014
Rail locomotive and wagons, Western Australia
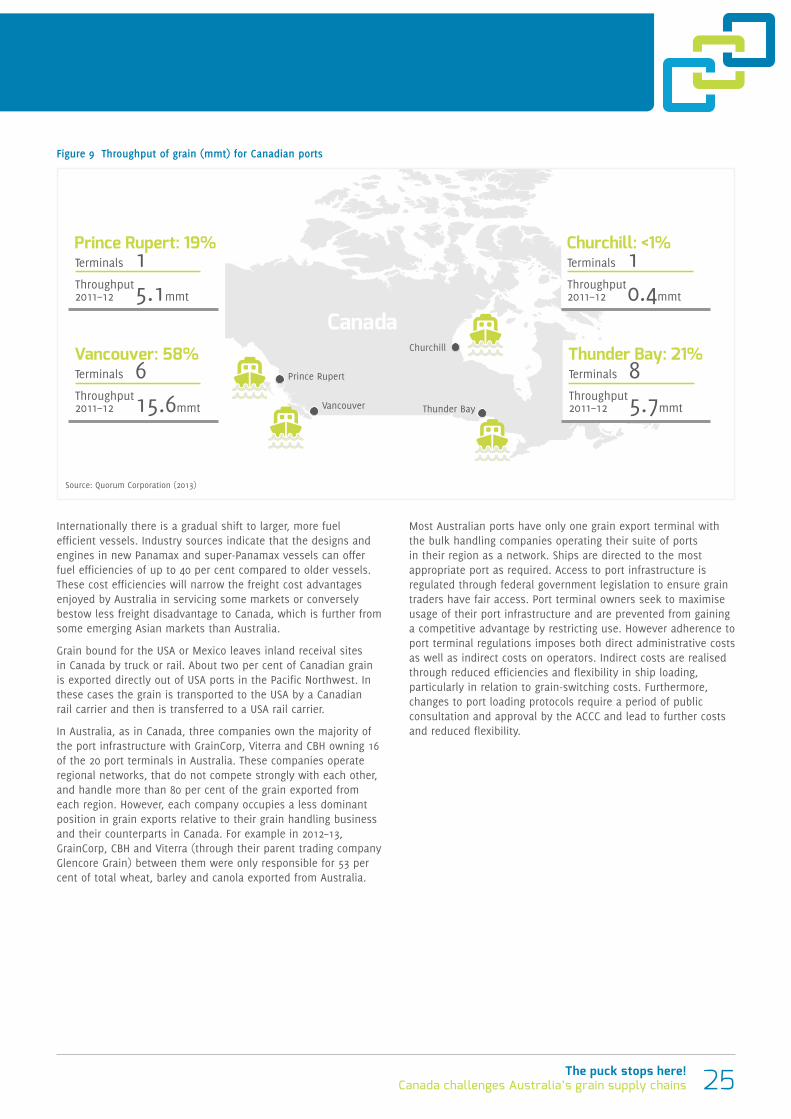
25The puck stops here!Canada challenges Australia’s grain supply chains
Internationally there is a gradual shift to larger, more fuel efficient vessels. Industry sources indicate that the designs and engines in new Panamax and super-Panamax vessels can offer fuel efficiencies of up to 40 per cent compared to older vessels. These cost efficiencies will narrow the freight cost advantages enjoyed by Australia in servicing some markets or conversely bestow less freight disadvantage to Canada, which is further from some emerging Asian markets than Australia.
Grain bound for the USA or Mexico leaves inland receival sites in Canada by truck or rail. About two per cent of Canadian grain is exported directly out of USA ports in the Pacific Northwest. In these cases the grain is transported to the USA by a Canadian rail carrier and then is transferred to a USA rail carrier.
In Australia, as in Canada, three companies own the majority of the port infrastructure with GrainCorp, Viterra and CBH owning 16 of the 20 port terminals in Australia. These companies operate regional networks, that do not compete strongly with each other, and handle more than 80 per cent of the grain exported from each region. However, each company occupies a less dominant position in grain exports relative to their grain handling business and their counterparts in Canada. For example in 2012–13, GrainCorp, CBH and Viterra (through their parent trading company Glencore Grain) between them were only responsible for 53 per cent of total wheat, barley and canola exported from Australia.
Most Australian ports have only one grain export terminal with the bulk handling companies operating their suite of ports in their region as a network. Ships are directed to the most appropriate port as required. Access to port infrastructure is regulated through federal government legislation to ensure grain traders have fair access. Port terminal owners seek to maximise usage of their port infrastructure and are prevented from gaining a competitive advantage by restricting use. However adherence to port terminal regulations imposes both direct administrative costs as well as indirect costs on operators. Indirect costs are realised through reduced efficiencies and flexibility in ship loading, particularly in relation to grain-switching costs. Furthermore, changes to port loading protocols require a period of public consultation and approval by the ACCC and lead to further costs and reduced flexibility.
Figure 9 Throughput of grain (mmt) for Canadian ports
Vancouver: 58%Terminals 6 15.6mmtThroughput2011–12
Throughput2011–12
Thunder Bay: 21%Terminals 8 5.7mmt
Prince Rupert: 19%Terminals 1 5.1mmtThroughput2011–12
Churchill: <1%Terminals 1 0.4mmtThroughput2011–12
Canada
Vancouver Thunder Bay
Churchill
Prince Rupert
Source: Quorum Corporation (2013)
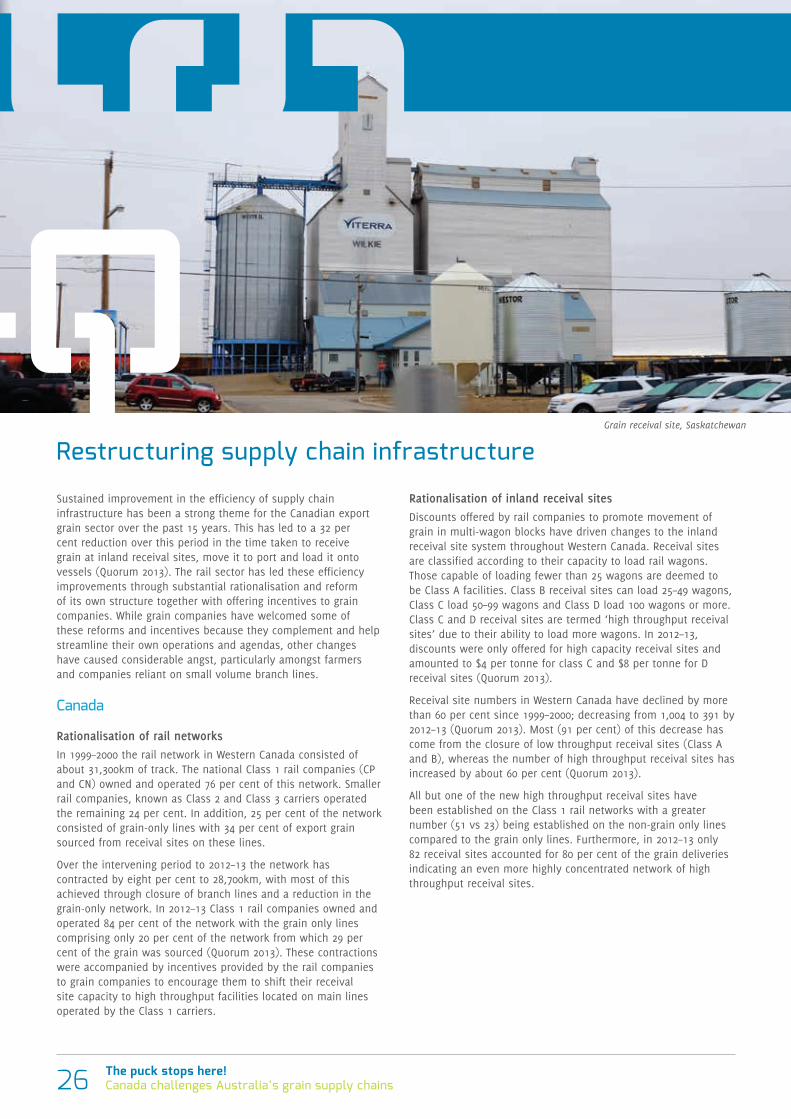
The puck stops here!Canada challenges Australia’s grain supply chains26
Restructuring supply chain infrastructure
Sustained improvement in the efficiency of supply chain infrastructure has been a strong theme for the Canadian export grain sector over the past 15 years. This has led to a 32 per cent reduction over this period in the time taken to receive grain at inland receival sites, move it to port and load it onto vessels (Quorum 2013). The rail sector has led these efficiency improvements through substantial rationalisation and reform of its own structure together with offering incentives to grain companies. While grain companies have welcomed some of these reforms and incentives because they complement and help streamline their own operations and agendas, other changes have caused considerable angst, particularly amongst farmers and companies reliant on small volume branch lines.
Canada
Rationalisation of rail networksIn 1999–2000 the rail network in Western Canada consisted of about 31,300km of track. The national Class 1 rail companies (CP and CN) owned and operated 76 per cent of this network. Smaller rail companies, known as Class 2 and Class 3 carriers operated the remaining 24 per cent. In addition, 25 per cent of the network consisted of grain-only lines with 34 per cent of export grain sourced from receival sites on these lines.
Over the intervening period to 2012–13 the network has contracted by eight per cent to 28,700km, with most of this achieved through closure of branch lines and a reduction in the grain-only network. In 2012–13 Class 1 rail companies owned and operated 84 per cent of the network with the grain only lines comprising only 20 per cent of the network from which 29 per cent of the grain was sourced (Quorum 2013). These contractions were accompanied by incentives provided by the rail companies to grain companies to encourage them to shift their receival site capacity to high throughput facilities located on main lines operated by the Class 1 carriers.
Rationalisation of inland receival sitesDiscounts offered by rail companies to promote movement of grain in multi-wagon blocks have driven changes to the inland receival site system throughout Western Canada. Receival sites are classified according to their capacity to load rail wagons. Those capable of loading fewer than 25 wagons are deemed to be Class A facilities. Class B receival sites can load 25–49 wagons, Class C load 50–99 wagons and Class D load 100 wagons or more. Class C and D receival sites are termed ‘high throughput receival sites’ due to their ability to load more wagons. In 2012–13, discounts were only offered for high capacity receival sites and amounted to $4 per tonne for class C and $8 per tonne for D receival sites (Quorum 2013).
Receival site numbers in Western Canada have declined by more than 60 per cent since 1999–2000; decreasing from 1,004 to 391 by 2012–13 (Quorum 2013). Most (91 per cent) of this decrease has come from the closure of low throughput receival sites (Class A and B), whereas the number of high throughput receival sites has increased by about 60 per cent (Quorum 2013).
All but one of the new high throughput receival sites have been established on the Class 1 rail networks with a greater number (51 vs 23) being established on the non-grain only lines compared to the grain only lines. Furthermore, in 2012–13 only 82 receival sites accounted for 80 per cent of the grain deliveries indicating an even more highly concentrated network of high throughput receival sites.
Grain receival site, Saskatchewan
27The puck stops here!Canada challenges Australia’s grain supply chains
Impacts of rationalisation on Canadian farmers
Road haulage
The contraction in receival site numbers and closure of shortlines in Canada has caused farmers to cart grain from their farms by truck over longer distances to reach receival sites. In 1999–00 the average distance travelled from farm to receival site was 26km. In 2012–13 this had stretched to 80km with many farmers travelling much further. This has increased the cost and risk of the grain haulage borne by the farmer, but this has been offset by lower receival site and rail transport costs. Multi-wagon discounts offered by rail companies were passed on in-part to farmers by the grain companies in the form of trucking premiums and higher grain prices. Similarly efficiency gains from high throughput receival sites enabled grain companies to offer higher grain prices to farmers to attract higher grain volumes. However, increased cost and risks related to road maintenance caused by the greater road use by heavy vehicles has been passed on to local and provincial governments as well as local communities.
Shortlines
Many farmers were disenfranchised by removal of their local rail service and receival sites, through closure of branch lines over the past 20 years. The Class 1 rail companies abandoned these lines because they were underused and deemed uneconomic to maintain. Reopening of these lines by new operators, however was not supported by the Class 1 carriers with the process proving to be “adversarial, costly and time-consuming” (Johansen 1995). In response the Canadian Federal Government introduced Current Conveyance and Abandonment Procedure legislation (Bill C-101) which forced the Class 1 carriers to lease or sell abandoned lines to shortline rail operators. As a result several new, shortline rail companies were established, with new operating models to take over these lines, with the aim of preserving the local rail services. The new companies tended to include farmer ownership (e.g. Great Western Railway) and the majority were situated in Saskatchewan, with a few others in Manitoba and Alberta.
The new companies have met with mixed success. Many were unable to maintain the economic viability of the branch lines, particularly as grain companies closed their low capacity receival sites on which these lines were dependent. In 1999–2000 the Class 1 carriers transported 91.8 per cent (or 23.6MT) of all railed grain whereas by 2012–13 the proportion had risen to 96.2 per cent (or 27.3MT). Nevertheless, some shortline rail companies have remained viable. In the 2011–12 crop year there were 15 separate shortline carriers operating in Western Canada (Quorum 2013).
Costs for shortline railways are partly reduced through a modified regulatory regime. Provincial governments are responsible for the regulation of the short line railways while the federal government regulates the national carriers. Provincial governments can therefore regulate safety and labour standards at a level more appropriate to the individual circumstances of the shortline companies.
There is still significant debate within Canada about the long-term viability of the remaining shortline rail companies. Their lines have lower axle weights and run at slower speeds and often their capital replacement programs are under-funded. Without track transport demand from oil companies, many short haul rail operators would struggle to be financially viable. Class 1 rail operators view short haul rail as a useful but minor complement to the Class 1 traffic. Some elements for a sustained operation of the current short-line companies seem to be:
• Modified operating procedures. Slower speeds, altered timelines, reduced regulation and lower payloads on the shortlines allow for ‘fit for purpose’ procedures that lower operating costs.
• Local farmer and community involvement. Most shortline companies provide services to local farmers, so ownership by the community encourages preferred patronage of their local asset.
• Some level of government support. The Government of Saskatchewan has provided several shortline companies with interest-free loans and established a Shortline Railway Sustainability Program.
• Modified capital replacement timelines. The Great Western Railway and the Battle River Railway are two examples where provision for expenditure on replacement of rail track has been deferred to an undefined future time. This is partly possible because of the new heavy rail infrastructure that was installed by the Canadian federal government in the 1980s.
• Some leverage with the Class 1 rail companies. Shortlines are dependent on the Class 1 rail networks into which they feed. Access to more than one Class 1 network or support through government regulation provides the necessary leverage to maintain sustainable service levels by the Class 1 to the shortlines.
Ongoing rail reform
The large 2013–14 grain harvest exposed deficiencies within Canada’s rail transport system that prompted many people within the grains industry to question whether the rail reforms had gone too far. Rail companies have sought to maximise the efficiency of their capital utilisation with consistent volumes transported throughout the year. This has involved rationalisation of ‘excess’ rolling stock. The strategy, however, runs counter to the grain companies’ seasonal requirement for grain transport that involves movement of larger volumes of grain, and hence more rolling stock, soon after harvest.
Rail companies can partly manage these conflicting requirements through differential tariffs for transport services over the year; charging higher rates during high demand periods and lower rates during other periods to shift the demand for services. However, the revenue cap for rail services limits the effectiveness of this mechanism because it does not allow for the higher total costs that would be associated with a seasonally skewed transport task. Rail companies, therefore, tend to force a more even spread of rail utilisation over the year.
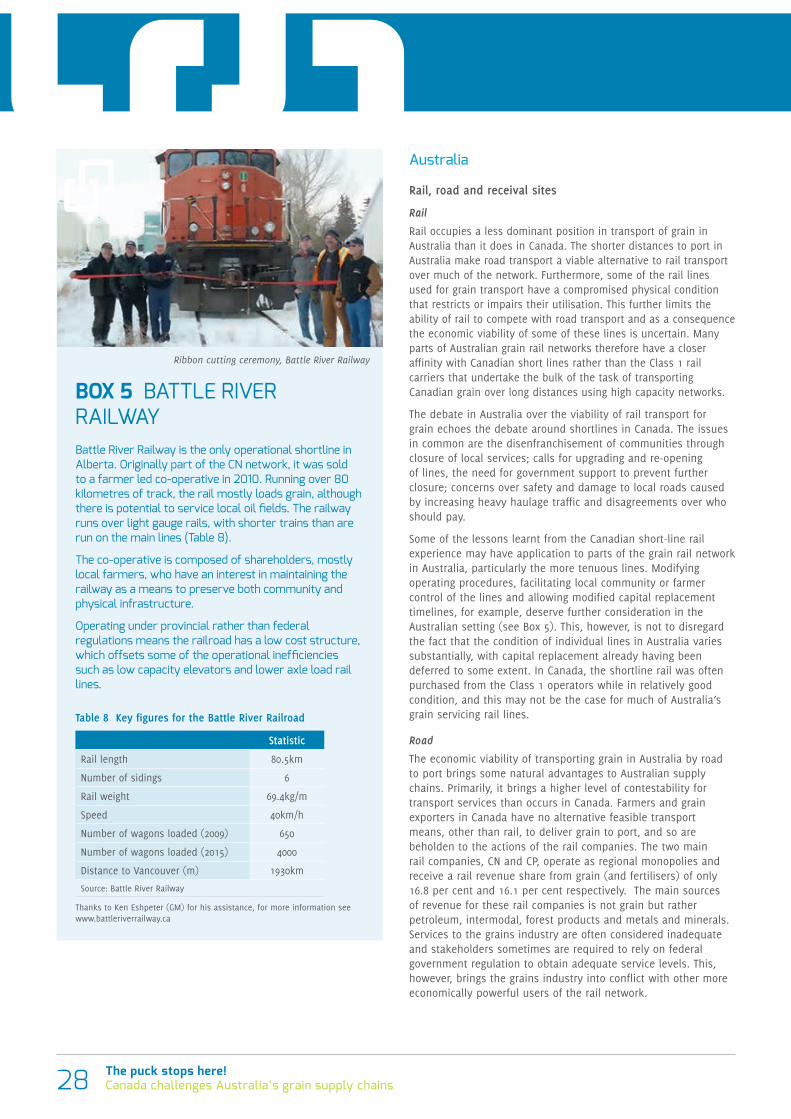
The puck stops here!Canada challenges Australia’s grain supply chains28
Australia
Rail, road and receival sites
Rail
Rail occupies a less dominant position in transport of grain in Australia than it does in Canada. The shorter distances to port in Australia make road transport a viable alternative to rail transport over much of the network. Furthermore, some of the rail lines used for grain transport have a compromised physical condition that restricts or impairs their utilisation. This further limits the ability of rail to compete with road transport and as a consequence the economic viability of some of these lines is uncertain. Many parts of Australian grain rail networks therefore have a closer affinity with Canadian short lines rather than the Class 1 rail carriers that undertake the bulk of the task of transporting Canadian grain over long distances using high capacity networks.
The debate in Australia over the viability of rail transport for grain echoes the debate around shortlines in Canada. The issues in common are the disenfranchisement of communities through closure of local services; calls for upgrading and re-opening of lines, the need for government support to prevent further closure; concerns over safety and damage to local roads caused by increasing heavy haulage traffic and disagreements over who should pay.
Some of the lessons learnt from the Canadian short-line rail experience may have application to parts of the grain rail network in Australia, particularly the more tenuous lines. Modifying operating procedures, facilitating local community or farmer control of the lines and allowing modified capital replacement timelines, for example, deserve further consideration in the Australian setting (see Box 5). This, however, is not to disregard the fact that the condition of individual lines in Australia varies substantially, with capital replacement already having been deferred to some extent. In Canada, the shortline rail was often purchased from the Class 1 operators while in relatively good condition, and this may not be the case for much of Australia’s grain servicing rail lines.
Road
The economic viability of transporting grain in Australia by road to port brings some natural advantages to Australian supply chains. Primarily, it brings a higher level of contestability for transport services than occurs in Canada. Farmers and grain exporters in Canada have no alternative feasible transport means, other than rail, to deliver grain to port, and so are beholden to the actions of the rail companies. The two main rail companies, CN and CP, operate as regional monopolies and receive a rail revenue share from grain (and fertilisers) of only 16.8 per cent and 16.1 per cent respectively. The main sources of revenue for these rail companies is not grain but rather petroleum, intermodal, forest products and metals and minerals. Services to the grains industry are often considered inadequate and stakeholders sometimes are required to rely on federal government regulation to obtain adequate service levels. This, however, brings the grains industry into conflict with other more economically powerful users of the rail network.
BOX 5 BATTLE RIVER RAILWAYBattle River Railway is the only operational shortline in Alberta. Originally part of the CN network, it was sold to a farmer led co-operative in 2010. Running over 80 kilometres of track, the rail mostly loads grain, although there is potential to service local oil fields. The railway runs over light gauge rails, with shorter trains than are run on the main lines (Table 8).
The co-operative is composed of shareholders, mostly local farmers, who have an interest in maintaining the railway as a means to preserve both community and physical infrastructure.
Operating under provincial rather than federal regulations means the railroad has a low cost structure, which offsets some of the operational inefficiencies such as low capacity elevators and lower axle load rail lines.
Table 8 Key figures for the Battle River Railroad
Statistic
Rail length 80.5km
Number of sidings 6
Rail weight 69.4kg/m
Speed 40km/h
Number of wagons loaded (2009) 650
Number of wagons loaded (2015) 4000
Distance to Vancouver (m) 1930km
Source: Battle River Railway
Thanks to Ken Eshpeter (GM) for his assistance, for more information see www.battleriverrailway.ca
Ribbon cutting ceremony, Battle River Railway
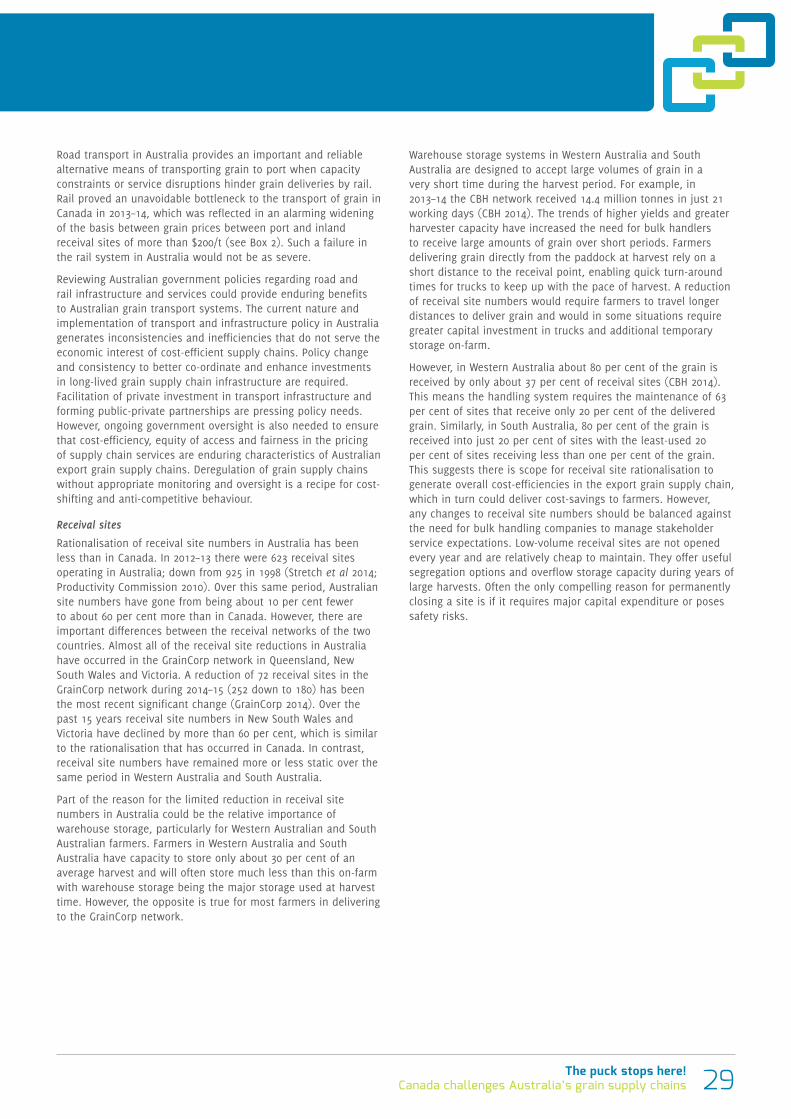
29The puck stops here!Canada challenges Australia’s grain supply chains
Road transport in Australia provides an important and reliable alternative means of transporting grain to port when capacity constraints or service disruptions hinder grain deliveries by rail. Rail proved an unavoidable bottleneck to the transport of grain in Canada in 2013–14, which was reflected in an alarming widening of the basis between grain prices between port and inland receival sites of more than $200/t (see Box 2). Such a failure in the rail system in Australia would not be as severe.
Reviewing Australian government policies regarding road and rail infrastructure and services could provide enduring benefits to Australian grain transport systems. The current nature and implementation of transport and infrastructure policy in Australia generates inconsistencies and inefficiencies that do not serve the economic interest of cost-efficient supply chains. Policy change and consistency to better co-ordinate and enhance investments in long-lived grain supply chain infrastructure are required. Facilitation of private investment in transport infrastructure and forming public-private partnerships are pressing policy needs. However, ongoing government oversight is also needed to ensure that cost-efficiency, equity of access and fairness in the pricing of supply chain services are enduring characteristics of Australian export grain supply chains. Deregulation of grain supply chains without appropriate monitoring and oversight is a recipe for cost-shifting and anti-competitive behaviour.
Receival sites
Rationalisation of receival site numbers in Australia has been less than in Canada. In 2012–13 there were 623 receival sites operating in Australia; down from 925 in 1998 (Stretch et al 2014; Productivity Commission 2010). Over this same period, Australian site numbers have gone from being about 10 per cent fewer to about 60 per cent more than in Canada. However, there are important differences between the receival networks of the two countries. Almost all of the receival site reductions in Australia have occurred in the GrainCorp network in Queensland, New South Wales and Victoria. A reduction of 72 receival sites in the GrainCorp network during 2014–15 (252 down to 180) has been the most recent significant change (GrainCorp 2014). Over the past 15 years receival site numbers in New South Wales and Victoria have declined by more than 60 per cent, which is similar to the rationalisation that has occurred in Canada. In contrast, receival site numbers have remained more or less static over the same period in Western Australia and South Australia.
Part of the reason for the limited reduction in receival site numbers in Australia could be the relative importance of warehouse storage, particularly for Western Australian and South Australian farmers. Farmers in Western Australia and South Australia have capacity to store only about 30 per cent of an average harvest and will often store much less than this on-farm with warehouse storage being the major storage used at harvest time. However, the opposite is true for most farmers in delivering to the GrainCorp network.
Warehouse storage systems in Western Australia and South Australia are designed to accept large volumes of grain in a very short time during the harvest period. For example, in 2013–14 the CBH network received 14.4 million tonnes in just 21 working days (CBH 2014). The trends of higher yields and greater harvester capacity have increased the need for bulk handlers to receive large amounts of grain over short periods. Farmers delivering grain directly from the paddock at harvest rely on a short distance to the receival point, enabling quick turn-around times for trucks to keep up with the pace of harvest. A reduction of receival site numbers would require farmers to travel longer distances to deliver grain and would in some situations require greater capital investment in trucks and additional temporary storage on-farm.
However, in Western Australia about 80 per cent of the grain is received by only about 37 per cent of receival sites (CBH 2014). This means the handling system requires the maintenance of 63 per cent of sites that receive only 20 per cent of the delivered grain. Similarly, in South Australia, 80 per cent of the grain is received into just 20 per cent of sites with the least-used 20 per cent of sites receiving less than one per cent of the grain. This suggests there is scope for receival site rationalisation to generate overall cost-efficiencies in the export grain supply chain, which in turn could deliver cost-savings to farmers. However, any changes to receival site numbers should be balanced against the need for bulk handling companies to manage stakeholder service expectations. Low-volume receival sites are not opened every year and are relatively cheap to maintain. They offer useful segregation options and overflow storage capacity during years of large harvests. Often the only compelling reason for permanently closing a site is if it requires major capital expenditure or poses safety risks.
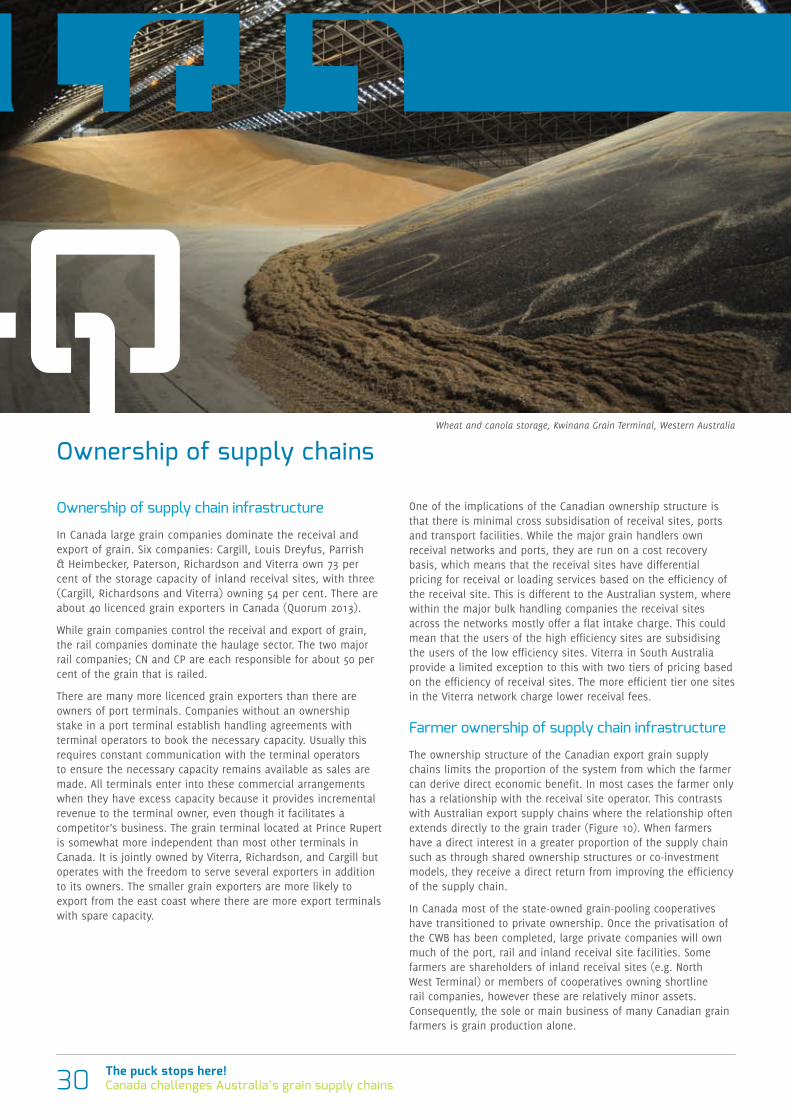
The puck stops here!Canada challenges Australia’s grain supply chains30
Ownership of supply chains
Ownership of supply chain infrastructure
In Canada large grain companies dominate the receival and export of grain. Six companies: Cargill, Louis Dreyfus, Parrish & Heimbecker, Paterson, Richardson and Viterra own 73 per cent of the storage capacity of inland receival sites, with three (Cargill, Richardsons and Viterra) owning 54 per cent. There are about 40 licenced grain exporters in Canada (Quorum 2013).
While grain companies control the receival and export of grain, the rail companies dominate the haulage sector. The two major rail companies; CN and CP are each responsible for about 50 per cent of the grain that is railed.
There are many more licenced grain exporters than there are owners of port terminals. Companies without an ownership stake in a port terminal establish handling agreements with terminal operators to book the necessary capacity. Usually this requires constant communication with the terminal operators to ensure the necessary capacity remains available as sales are made. All terminals enter into these commercial arrangements when they have excess capacity because it provides incremental revenue to the terminal owner, even though it facilitates a competitor’s business. The grain terminal located at Prince Rupert is somewhat more independent than most other terminals in Canada. It is jointly owned by Viterra, Richardson, and Cargill but operates with the freedom to serve several exporters in addition to its owners. The smaller grain exporters are more likely to export from the east coast where there are more export terminals with spare capacity.
One of the implications of the Canadian ownership structure is that there is minimal cross subsidisation of receival sites, ports and transport facilities. While the major grain handlers own receival networks and ports, they are run on a cost recovery basis, which means that the receival sites have differential pricing for receival or loading services based on the efficiency of the receival site. This is different to the Australian system, where within the major bulk handling companies the receival sites across the networks mostly offer a flat intake charge. This could mean that the users of the high efficiency sites are subsidising the users of the low efficiency sites. Viterra in South Australia provide a limited exception to this with two tiers of pricing based on the efficiency of receival sites. The more efficient tier one sites in the Viterra network charge lower receival fees.
Farmer ownership of supply chain infrastructure
The ownership structure of the Canadian export grain supply chains limits the proportion of the system from which the farmer can derive direct economic benefit. In most cases the farmer only has a relationship with the receival site operator. This contrasts with Australian export supply chains where the relationship often extends directly to the grain trader (Figure 10). When farmers have a direct interest in a greater proportion of the supply chain such as through shared ownership structures or co-investment models, they receive a direct return from improving the efficiency of the supply chain.
In Canada most of the state-owned grain-pooling cooperatives have transitioned to private ownership. Once the privatisation of the CWB has been completed, large private companies will own much of the port, rail and inland receival site facilities. Some farmers are shareholders of inland receival sites (e.g. North West Terminal) or members of cooperatives owning shortline rail companies, however these are relatively minor assets. Consequently, the sole or main business of many Canadian grain farmers is grain production alone.
Wheat and canola storage, Kwinana Grain Terminal, Western Australia
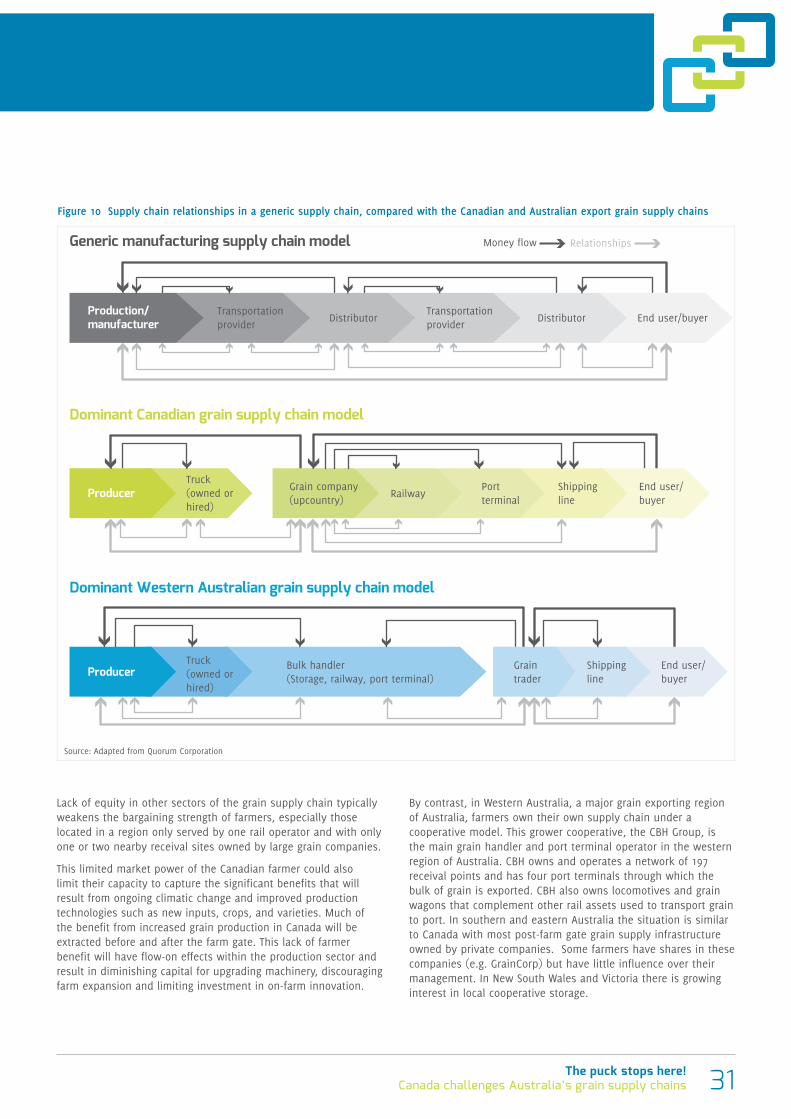
31The puck stops here!Canada challenges Australia’s grain supply chains
End user/buyer
Shippingline
Portterminal
RailwayGrain company(upcountry)
Truck(owned or hired)
Producer
Dominant Canadian grain supply chain model
Shippingline
Bulk handler(Storage, railway, port terminal)
Producer Graintrader
Dominant Western Australian grain supply chain model
End user/buyerDistributorTransportationprovider
DistributorTransportationprovider
Production/manufacturer
Generic manufacturing supply chain model Money flow Relationships
Truck(owned or hired)
End user/buyer
Figure 10 Supply chain relationships in a generic supply chain, compared with the Canadian and Australian export grain supply chains
Lack of equity in other sectors of the grain supply chain typically weakens the bargaining strength of farmers, especially those located in a region only served by one rail operator and with only one or two nearby receival sites owned by large grain companies.
This limited market power of the Canadian farmer could also limit their capacity to capture the significant benefits that will result from ongoing climatic change and improved production technologies such as new inputs, crops, and varieties. Much of the benefit from increased grain production in Canada will be extracted before and after the farm gate. This lack of farmer benefit will have flow-on effects within the production sector and result in diminishing capital for upgrading machinery, discouraging farm expansion and limiting investment in on-farm innovation.
By contrast, in Western Australia, a major grain exporting region of Australia, farmers own their own supply chain under a cooperative model. This grower cooperative, the CBH Group, is the main grain handler and port terminal operator in the western region of Australia. CBH owns and operates a network of 197 receival points and has four port terminals through which the bulk of grain is exported. CBH also owns locomotives and grain wagons that complement other rail assets used to transport grain to port. In southern and eastern Australia the situation is similar to Canada with most post-farm gate grain supply infrastructure owned by private companies. Some farmers have shares in these companies (e.g. GrainCorp) but have little influence over their management. In New South Wales and Victoria there is growing interest in local cooperative storage.
Source: Adapted from Quorum Corporation
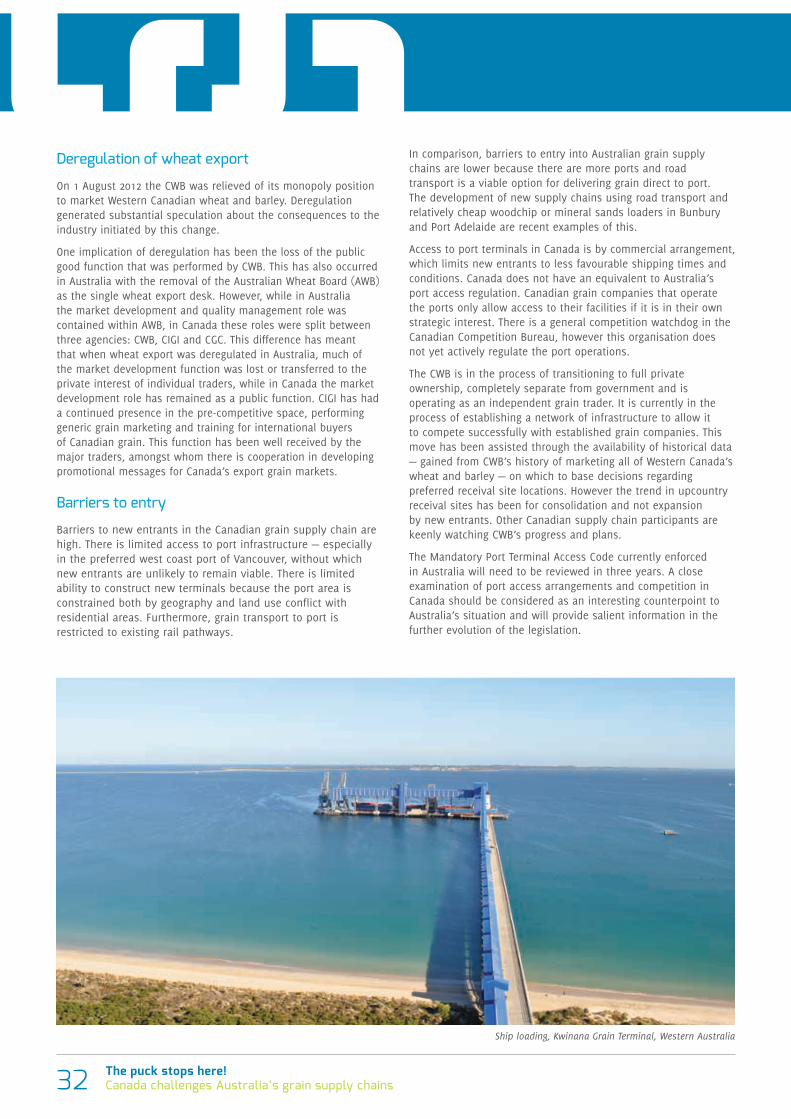
The puck stops here!Canada challenges Australia’s grain supply chains32
Deregulation of wheat export
On 1 August 2012 the CWB was relieved of its monopoly position to market Western Canadian wheat and barley. Deregulation generated substantial speculation about the consequences to the industry initiated by this change.
One implication of deregulation has been the loss of the public good function that was performed by CWB. This has also occurred in Australia with the removal of the Australian Wheat Board (AWB) as the single wheat export desk. However, while in Australia the market development and quality management role was contained within AWB, in Canada these roles were split between three agencies: CWB, CIGI and CGC. This difference has meant that when wheat export was deregulated in Australia, much of the market development function was lost or transferred to the private interest of individual traders, while in Canada the market development role has remained as a public function. CIGI has had a continued presence in the pre-competitive space, performing generic grain marketing and training for international buyers of Canadian grain. This function has been well received by the major traders, amongst whom there is cooperation in developing promotional messages for Canada’s export grain markets.
Barriers to entry
Barriers to new entrants in the Canadian grain supply chain are high. There is limited access to port infrastructure — especially in the preferred west coast port of Vancouver, without which new entrants are unlikely to remain viable. There is limited ability to construct new terminals because the port area is constrained both by geography and land use conflict with residential areas. Furthermore, grain transport to port is restricted to existing rail pathways.
In comparison, barriers to entry into Australian grain supply chains are lower because there are more ports and road transport is a viable option for delivering grain direct to port. The development of new supply chains using road transport and relatively cheap woodchip or mineral sands loaders in Bunbury and Port Adelaide are recent examples of this.
Access to port terminals in Canada is by commercial arrangement, which limits new entrants to less favourable shipping times and conditions. Canada does not have an equivalent to Australia’s port access regulation. Canadian grain companies that operate the ports only allow access to their facilities if it is in their own strategic interest. There is a general competition watchdog in the Canadian Competition Bureau, however this organisation does not yet actively regulate the port operations.
The CWB is in the process of transitioning to full private ownership, completely separate from government and is operating as an independent grain trader. It is currently in the process of establishing a network of infrastructure to allow it to compete successfully with established grain companies. This move has been assisted through the availability of historical data — gained from CWB’s history of marketing all of Western Canada’s wheat and barley — on which to base decisions regarding preferred receival site locations. However the trend in upcountry receival sites has been for consolidation and not expansion by new entrants. Other Canadian supply chain participants are keenly watching CWB’s progress and plans.
The Mandatory Port Terminal Access Code currently enforced in Australia will need to be reviewed in three years. A close examination of port access arrangements and competition in Canada should be considered as an interesting counterpoint to Australia’s situation and will provide salient information in the further evolution of the legislation.
Ship loading, Kwinana Grain Terminal, Western Australia
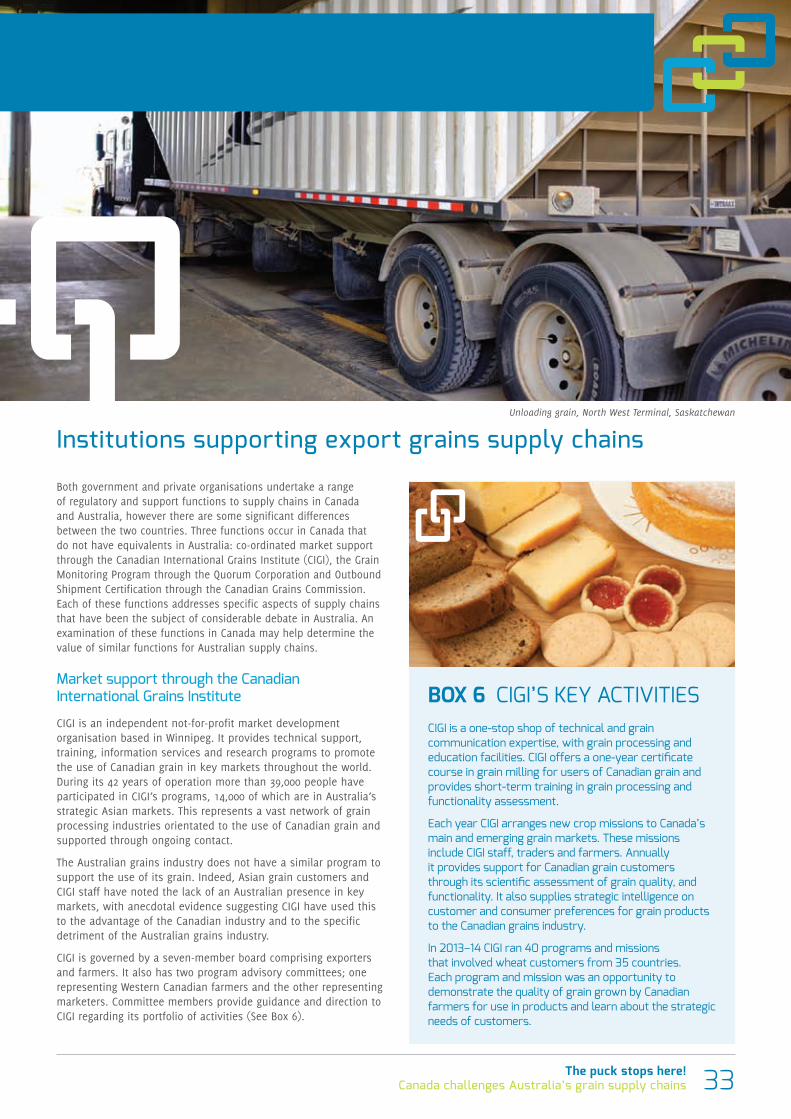
33The puck stops here!Canada challenges Australia’s grain supply chains
Institutions supporting export grains supply chains
Both government and private organisations undertake a range of regulatory and support functions to supply chains in Canada and Australia, however there are some significant differences between the two countries. Three functions occur in Canada that do not have equivalents in Australia: co-ordinated market support through the Canadian International Grains Institute (CIGI), the Grain Monitoring Program through the Quorum Corporation and Outbound Shipment Certification through the Canadian Grains Commission. Each of these functions addresses specific aspects of supply chains that have been the subject of considerable debate in Australia. An examination of these functions in Canada may help determine the value of similar functions for Australian supply chains.
Market support through the Canadian International Grains Institute
CIGI is an independent not-for-profit market development organisation based in Winnipeg. It provides technical support, training, information services and research programs to promote the use of Canadian grain in key markets throughout the world. During its 42 years of operation more than 39,000 people have participated in CIGI’s programs, 14,000 of which are in Australia’s strategic Asian markets. This represents a vast network of grain processing industries orientated to the use of Canadian grain and supported through ongoing contact.
The Australian grains industry does not have a similar program to support the use of its grain. Indeed, Asian grain customers and CIGI staff have noted the lack of an Australian presence in key markets, with anecdotal evidence suggesting CIGI have used this to the advantage of the Canadian industry and to the specific detriment of the Australian grains industry.
CIGI is governed by a seven-member board comprising exporters and farmers. It also has two program advisory committees; one representing Western Canadian farmers and the other representing marketers. Committee members provide guidance and direction to CIGI regarding its portfolio of activities (See Box 6).
BOX 6 CIGI’S KEY ACTIVITIESCIGI is a one-stop shop of technical and grain communication expertise, with grain processing and education facilities. CIGI offers a one-year certificate course in grain milling for users of Canadian grain and provides short-term training in grain processing and functionality assessment.
Each year CIGI arranges new crop missions to Canada’s main and emerging grain markets. These missions include CIGI staff, traders and farmers. Annually it provides support for Canadian grain customers through its scientific assessment of grain quality, and functionality. It also supplies strategic intelligence on customer and consumer preferences for grain products to the Canadian grains industry.
In 2013–14 CIGI ran 40 programs and missions that involved wheat customers from 35 countries. Each program and mission was an opportunity to demonstrate the quality of grain grown by Canadian farmers for use in products and learn about the strategic needs of customers.
Unloading grain, North West Terminal, Saskatchewan
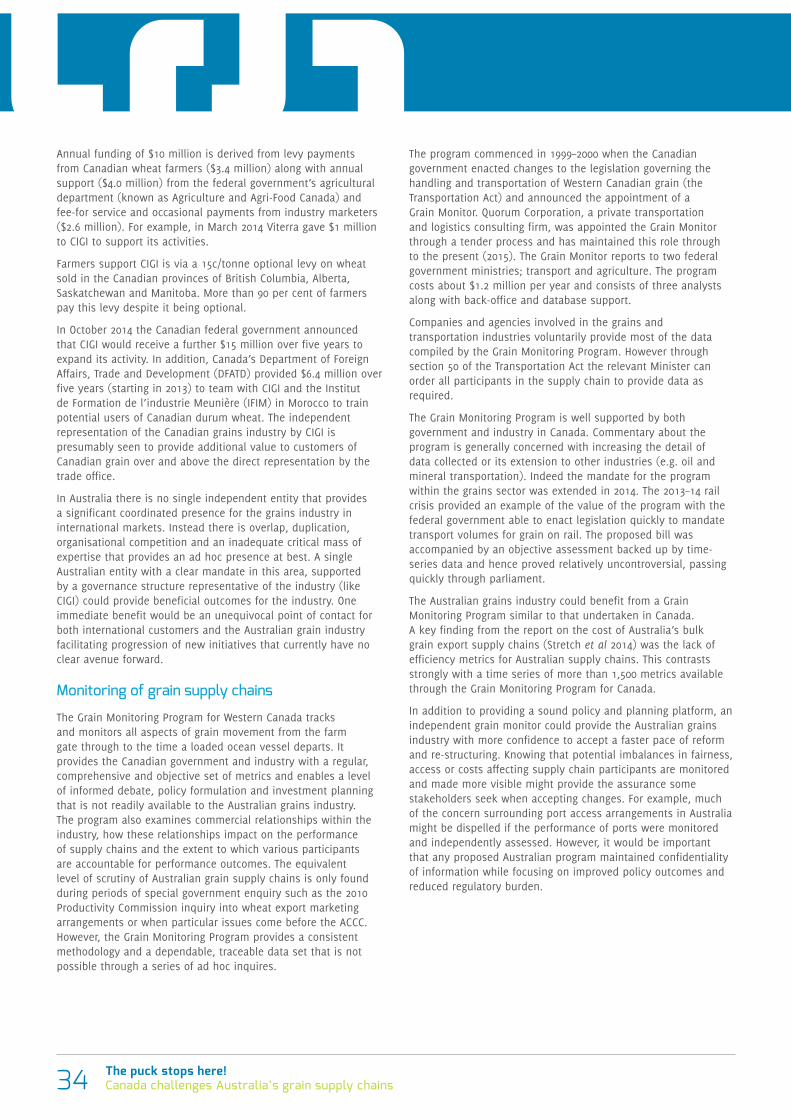
The puck stops here!Canada challenges Australia’s grain supply chains34
Annual funding of $10 million is derived from levy payments from Canadian wheat farmers ($3.4 million) along with annual support ($4.0 million) from the federal government’s agricultural department (known as Agriculture and Agri-Food Canada) and fee-for service and occasional payments from industry marketers ($2.6 million). For example, in March 2014 Viterra gave $1 million to CIGI to support its activities.
Farmers support CIGI is via a 15c/tonne optional levy on wheat sold in the Canadian provinces of British Columbia, Alberta, Saskatchewan and Manitoba. More than 90 per cent of farmers pay this levy despite it being optional.
In October 2014 the Canadian federal government announced that CIGI would receive a further $15 million over five years to expand its activity. In addition, Canada’s Department of Foreign Affairs, Trade and Development (DFATD) provided $6.4 million over five years (starting in 2013) to team with CIGI and the Institut de Formation de l’industrie Meunière (IFIM) in Morocco to train potential users of Canadian durum wheat. The independent representation of the Canadian grains industry by CIGI is presumably seen to provide additional value to customers of Canadian grain over and above the direct representation by the trade office.
In Australia there is no single independent entity that provides a significant coordinated presence for the grains industry in international markets. Instead there is overlap, duplication, organisational competition and an inadequate critical mass of expertise that provides an ad hoc presence at best. A single Australian entity with a clear mandate in this area, supported by a governance structure representative of the industry (like CIGI) could provide beneficial outcomes for the industry. One immediate benefit would be an unequivocal point of contact for both international customers and the Australian grain industry facilitating progression of new initiatives that currently have no clear avenue forward.
Monitoring of grain supply chains
The Grain Monitoring Program for Western Canada tracks and monitors all aspects of grain movement from the farm gate through to the time a loaded ocean vessel departs. It provides the Canadian government and industry with a regular, comprehensive and objective set of metrics and enables a level of informed debate, policy formulation and investment planning that is not readily available to the Australian grains industry. The program also examines commercial relationships within the industry, how these relationships impact on the performance of supply chains and the extent to which various participants are accountable for performance outcomes. The equivalent level of scrutiny of Australian grain supply chains is only found during periods of special government enquiry such as the 2010 Productivity Commission inquiry into wheat export marketing arrangements or when particular issues come before the ACCC. However, the Grain Monitoring Program provides a consistent methodology and a dependable, traceable data set that is not possible through a series of ad hoc inquires.
The program commenced in 1999–2000 when the Canadian government enacted changes to the legislation governing the handling and transportation of Western Canadian grain (the Transportation Act) and announced the appointment of a Grain Monitor. Quorum Corporation, a private transportation and logistics consulting firm, was appointed the Grain Monitor through a tender process and has maintained this role through to the present (2015). The Grain Monitor reports to two federal government ministries; transport and agriculture. The program costs about $1.2 million per year and consists of three analysts along with back-office and database support.
Companies and agencies involved in the grains and transportation industries voluntarily provide most of the data compiled by the Grain Monitoring Program. However through section 50 of the Transportation Act the relevant Minister can order all participants in the supply chain to provide data as required.
The Grain Monitoring Program is well supported by both government and industry in Canada. Commentary about the program is generally concerned with increasing the detail of data collected or its extension to other industries (e.g. oil and mineral transportation). Indeed the mandate for the program within the grains sector was extended in 2014. The 2013–14 rail crisis provided an example of the value of the program with the federal government able to enact legislation quickly to mandate transport volumes for grain on rail. The proposed bill was accompanied by an objective assessment backed up by time-series data and hence proved relatively uncontroversial, passing quickly through parliament.
The Australian grains industry could benefit from a Grain Monitoring Program similar to that undertaken in Canada. A key finding from the report on the cost of Australia’s bulk grain export supply chains (Stretch et al 2014) was the lack of efficiency metrics for Australian supply chains. This contrasts strongly with a time series of more than 1,500 metrics available through the Grain Monitoring Program for Canada.
In addition to providing a sound policy and planning platform, an independent grain monitor could provide the Australian grains industry with more confidence to accept a faster pace of reform and re-structuring. Knowing that potential imbalances in fairness, access or costs affecting supply chain participants are monitored and made more visible might provide the assurance some stakeholders seek when accepting changes. For example, much of the concern surrounding port access arrangements in Australia might be dispelled if the performance of ports were monitored and independently assessed. However, it would be important that any proposed Australian program maintained confidentiality of information while focusing on improved policy outcomes and reduced regulatory burden.
35The puck stops here!Canada challenges Australia’s grain supply chains
Outbound shipment certifications through the Canadian Grains Commission
The CGC is a federal government agency that inspects all grain shipments exported from Canada to ensure grain contract specifications for quality, safety and quantity. Inspection and certification by the CGC is a mandatory requirement and independent of all other quality assurance and inspection regimes that exporters may have with customers. The CGC state that grain inspection and grading services as mandated “are essential for producers to realize maximum value from their grain,” (CGC 2012). Further, the CGC state that “Canada’s Grain Quality Assurance system is a key factor in permitting Canadian exporters to market successfully in competitive international grain markets,” (CGC 2012).
Despite the CGC’s certification of grain exports there have been media reports about increasing numbers of customers noting a drop in the quality of grain supplied by Canada since removal of the CWB’s marketing monopoly (see Nickel 2014). Similar observations regarding a reduction in wheat quality have also been reported from customers of Australian grain since the removal of AWB’s marketing monopoly. However, Australia does not have the mandatory certification of grain exports against contract specifications as occurs in Canada
Reasons for the perceived changes in grain quality are varied. Some commentators suggest that the Canadian and Australian wheat boards built loyalty by providing customers with higher quality wheat than they paid for, whereas exporters now provide wheat exactly to specification. Some grain companies dismiss this, stating that it is in their own commercial interest to build relationships with customers and to meet their quality expectations. Others believe the access of CWB and AWB to the entire wheat crop provided them with substantial capacity to source wheat of varying qualities and tailor shipments to each buyer’s requirements. By contrast, both Canadian and Australian exporters now have access to only a limited proportion of the wheat crop and therefore have less capacity to mix and match grain to meet the quality requirements of customers. The problem is exacerbated when buyers frequently source grain from different companies. Each company, while supplying the same grade and quality of grain, source it from different growing regions thus leading to slightly varying end-use performance of the grain. These issues are less of a problem for large grain companies than for small traders with limited export volumes.
The extent to which the mandatory inspection and certification of wheat shipments would enhance the export competitiveness of the Australian grains industry is difficult to determine. Australian and Canadian exporters acknowledge the reputational damage that poor quality wheat shipments have on the industry. Canadian traders, however, are not strongly supportive of the CGC’s mandatory inspection requirements and regard the charges as excessive. At $1.60/t the CGC rates are more than three times those of equivalent third-party commercial service providers. The high charges are presumably designed to recover costs associated with other components of CGC’s quality assurance program, such as the maintaining the Canadian grain grading system; a function undertaken by Wheat Quality Australia in Australia. Export customers, nevertheless, welcome independent certification of grain shipments by non-commercial providers such as the CGC in Canada. In Australia, the only option for export customers is to contract a third-party commercial provider.
Cereals Canada
Cereals Canada is a new organisation that is still developing its role in the Canadian grains industry. It has been formed to take on coordination roles vacated by the demise of the CWB; particularly in research direction, research policy and market development. Its value is vested in its ability to coordinate nationally and represent the main pillars of the Canadian cereals industry: farm organisations, grain handling, export, processing, crop development and seed supplies. It is a not-for-profit organisation with a stated purpose of bringing a broad and diverse collaboration of partners from all sectors of the cereals value chain. It is still developing its membership base and only started its activities in 2014 with the release of its inaugural strategic planning document.
Some Australian states have similar organisations to Cereals Canada with membership from all key stakeholders providing broad coordination and direction for the industry. However, there is no equivalent national representation providing broad coordination across the industry.
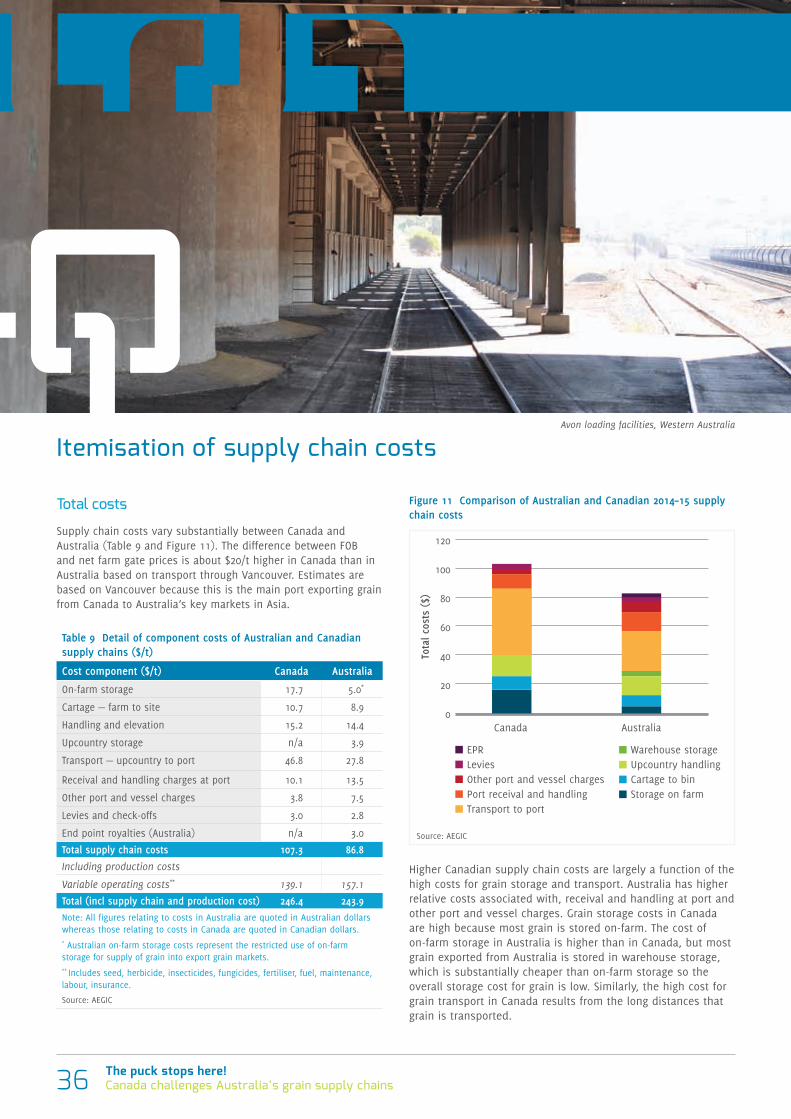
The puck stops here!Canada challenges Australia’s grain supply chains36
Itemisation of supply chain costs
Total costs
Supply chain costs vary substantially between Canada and Australia (Table 9 and Figure 11). The difference between FOB and net farm gate prices is about $20/t higher in Canada than in Australia based on transport through Vancouver. Estimates are based on Vancouver because this is the main port exporting grain from Canada to Australia’s key markets in Asia.
Table 9 Detail of component costs of Australian and Canadian supply chains ($/t)
Cost component ($/t) Canada Australia
On-farm storage 17.7 5.0*
Cartage — farm to site 10.7 8.9
Handling and elevation 15.2 14.4
Upcountry storage n/a 3.9
Transport — upcountry to port 46.8 27.8
Receival and handling charges at port 10.1 13.5
Other port and vessel charges 3.8 7.5
Levies and check-offs 3.0 2.8
End point royalties (Australia) n/a 3.0
Total supply chain costs 107.3 86.8
Including production costs
Variable operating costs** 139.1 157.1
Total (incl supply chain and production cost) 246.4 243.9Note: All figures relating to costs in Australia are quoted in Australian dollars whereas those relating to costs in Canada are quoted in Canadian dollars. * Australian on-farm storage costs represent the restricted use of on-farm storage for supply of grain into export grain markets. ** Includes seed, herbicide, insecticides, fungicides, fertiliser, fuel, maintenance, labour, insurance.
Source: AEGIC
Figure 11 Comparison of Australian and Canadian 2014–15 supply chain costs
0
20
40
60
80
100
120
Canada Australia
Levies EPR
Other port and vessel charges Port receival and handlingTransport to port
Storage on farm
Warehouse storage Upcountry handling Cartage to bin
Tota
l cos
ts (
$)
Source: AEGIC
Higher Canadian supply chain costs are largely a function of the high costs for grain storage and transport. Australia has higher relative costs associated with, receival and handling at port and other port and vessel charges. Grain storage costs in Canada are high because most grain is stored on-farm. The cost of on-farm storage in Australia is higher than in Canada, but most grain exported from Australia is stored in warehouse storage, which is substantially cheaper than on-farm storage so the overall storage cost for grain is low. Similarly, the high cost for grain transport in Canada results from the long distances that grain is transported.
Avon loading facilities, Western Australia
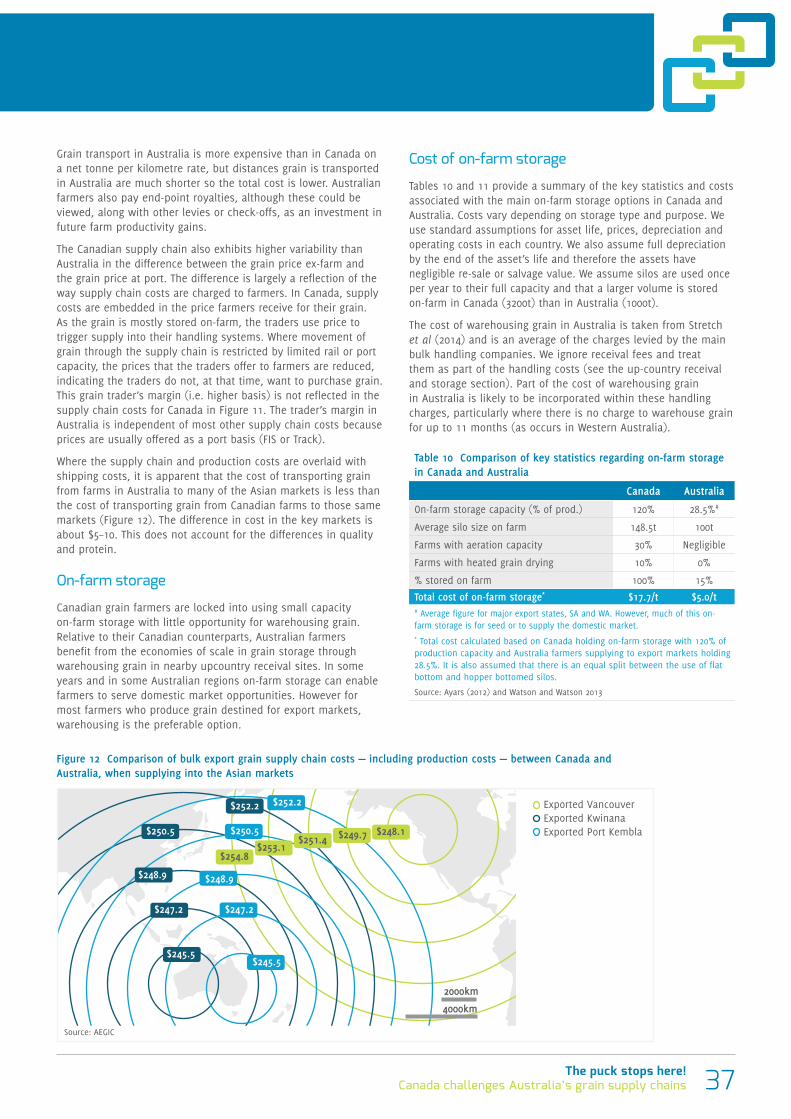
37The puck stops here!Canada challenges Australia’s grain supply chains
Grain transport in Australia is more expensive than in Canada on a net tonne per kilometre rate, but distances grain is transported in Australia are much shorter so the total cost is lower. Australian farmers also pay end-point royalties, although these could be viewed, along with other levies or check-offs, as an investment in future farm productivity gains.
The Canadian supply chain also exhibits higher variability than Australia in the difference between the grain price ex-farm and the grain price at port. The difference is largely a reflection of the way supply chain costs are charged to farmers. In Canada, supply costs are embedded in the price farmers receive for their grain. As the grain is mostly stored on-farm, the traders use price to trigger supply into their handling systems. Where movement of grain through the supply chain is restricted by limited rail or port capacity, the prices that the traders offer to farmers are reduced, indicating the traders do not, at that time, want to purchase grain. This grain trader’s margin (i.e. higher basis) is not reflected in the supply chain costs for Canada in Figure 11. The trader’s margin in Australia is independent of most other supply chain costs because prices are usually offered as a port basis (FIS or Track).
Where the supply chain and production costs are overlaid with shipping costs, it is apparent that the cost of transporting grain from farms in Australia to many of the Asian markets is less than the cost of transporting grain from Canadian farms to those same markets (Figure 12). The difference in cost in the key markets is about $5–10. This does not account for the differences in quality and protein.
On-farm storage
Canadian grain farmers are locked into using small capacity on-farm storage with little opportunity for warehousing grain. Relative to their Canadian counterparts, Australian farmers benefit from the economies of scale in grain storage through warehousing grain in nearby upcountry receival sites. In some years and in some Australian regions on-farm storage can enable farmers to serve domestic market opportunities. However for most farmers who produce grain destined for export markets, warehousing is the preferable option.
Figure 12 Comparison of bulk export grain supply chain costs — including production costs — between Canada and Australia, when supplying into the Asian markets
$245.5 $245.5
$253.1 $254.8
2000km
4000km
$252.2
$250.5
$248.9
$247.2
$252.2
$250.5
$248.9
$247.2
$248.1 $249.7 $251.4
Exported VancouverExported KwinanaExported Port Kembla
Table 10 Comparison of key statistics regarding on-farm storage in Canada and Australia
Canada Australia
On-farm storage capacity (% of prod.) 120% 28.5%#
Average silo size on farm 148.5t 100t
Farms with aeration capacity 30% Negligible
Farms with heated grain drying 10% 0%
% stored on farm 100% 15%
Total cost of on-farm storage* $17.7/t $5.0/t# Average figure for major export states, SA and WA. However, much of this on-farm storage is for seed or to supply the domestic market.* Total cost calculated based on Canada holding on-farm storage with 120% of production capacity and Australia farmers supplying to export markets holding 28.5%. It is also assumed that there is an equal split between the use of flat bottom and hopper bottomed silos.
Source: Ayars (2012) and Watson and Watson 2013
Source: AEGIC
Cost of on-farm storage
Tables 10 and 11 provide a summary of the key statistics and costs associated with the main on-farm storage options in Canada and Australia. Costs vary depending on storage type and purpose. We use standard assumptions for asset life, prices, depreciation and operating costs in each country. We also assume full depreciation by the end of the asset’s life and therefore the assets have negligible re-sale or salvage value. We assume silos are used once per year to their full capacity and that a larger volume is stored on-farm in Canada (3200t) than in Australia (1000t).
The cost of warehousing grain in Australia is taken from Stretch et al (2014) and is an average of the charges levied by the main bulk handling companies. We ignore receival fees and treat them as part of the handling costs (see the up-country receival and storage section). Part of the cost of warehousing grain in Australia is likely to be incorporated within these handling charges, particularly where there is no charge to warehouse grain for up to 11 months (as occurs in Western Australia).
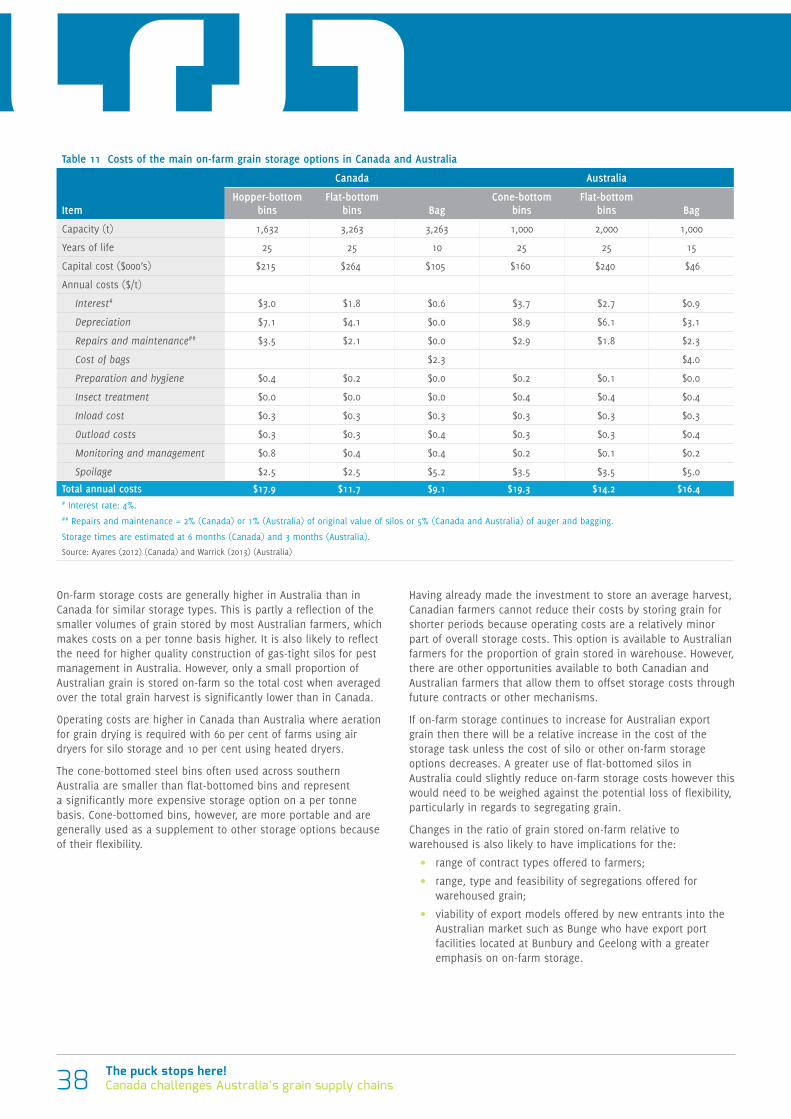
The puck stops here!Canada challenges Australia’s grain supply chains38
On-farm storage costs are generally higher in Australia than in Canada for similar storage types. This is partly a reflection of the smaller volumes of grain stored by most Australian farmers, which makes costs on a per tonne basis higher. It is also likely to reflect the need for higher quality construction of gas-tight silos for pest management in Australia. However, only a small proportion of Australian grain is stored on-farm so the total cost when averaged over the total grain harvest is significantly lower than in Canada.
Operating costs are higher in Canada than Australia where aeration for grain drying is required with 60 per cent of farms using air dryers for silo storage and 10 per cent using heated dryers.
The cone-bottomed steel bins often used across southern Australia are smaller than flat-bottomed bins and represent a significantly more expensive storage option on a per tonne basis. Cone-bottomed bins, however, are more portable and are generally used as a supplement to other storage options because of their flexibility.
Having already made the investment to store an average harvest, Canadian farmers cannot reduce their costs by storing grain for shorter periods because operating costs are a relatively minor part of overall storage costs. This option is available to Australian farmers for the proportion of grain stored in warehouse. However, there are other opportunities available to both Canadian and Australian farmers that allow them to offset storage costs through future contracts or other mechanisms.
If on-farm storage continues to increase for Australian export grain then there will be a relative increase in the cost of the storage task unless the cost of silo or other on-farm storage options decreases. A greater use of flat-bottomed silos in Australia could slightly reduce on-farm storage costs however this would need to be weighed against the potential loss of flexibility, particularly in regards to segregating grain.
Changes in the ratio of grain stored on-farm relative to warehoused is also likely to have implications for the:
• range of contract types offered to farmers;
• range, type and feasibility of segregations offered for warehoused grain;
• viability of export models offered by new entrants into the Australian market such as Bunge who have export port facilities located at Bunbury and Geelong with a greater emphasis on on-farm storage.
Table 11 Costs of the main on-farm grain storage options in Canada and Australia
Item
Canada Australia
Hopper-bottom bins
Flat-bottom bins Bag
Cone-bottom bins
Flat-bottom bins Bag
Capacity (t) 1,632 3,263 3,263 1,000 2,000 1,000
Years of life 25 25 10 25 25 15
Capital cost ($000’s) $215 $264 $105 $160 $240 $46
Annual costs ($/t)
Interest# $3.0 $1.8 $0.6 $3.7 $2.7 $0.9
Depreciation $7.1 $4.1 $0.0 $8.9 $6.1 $3.1
Repairs and maintenance## $3.5 $2.1 $0.0 $2.9 $1.8 $2.3
Cost of bags $2.3 $4.0
Preparation and hygiene $0.4 $0.2 $0.0 $0.2 $0.1 $0.0
Insect treatment $0.0 $0.0 $0.0 $0.4 $0.4 $0.4
Inload cost $0.3 $0.3 $0.3 $0.3 $0.3 $0.3
Outload costs $0.3 $0.3 $0.4 $0.3 $0.3 $0.4
Monitoring and management $0.8 $0.4 $0.4 $0.2 $0.1 $0.2
Spoilage $2.5 $2.5 $5.2 $3.5 $3.5 $5.0
Total annual costs $17.9 $11.7 $9.1 $19.3 $14.2 $16.4# Interest rate: 4%.## Repairs and maintenance = 2% (Canada) or 1% (Australia) of original value of silos or 5% (Canada and Australia) of auger and bagging.
Storage times are estimated at 6 months (Canada) and 3 months (Australia).
Source: Ayares (2012) (Canada) and Warrick (2013) (Australia)
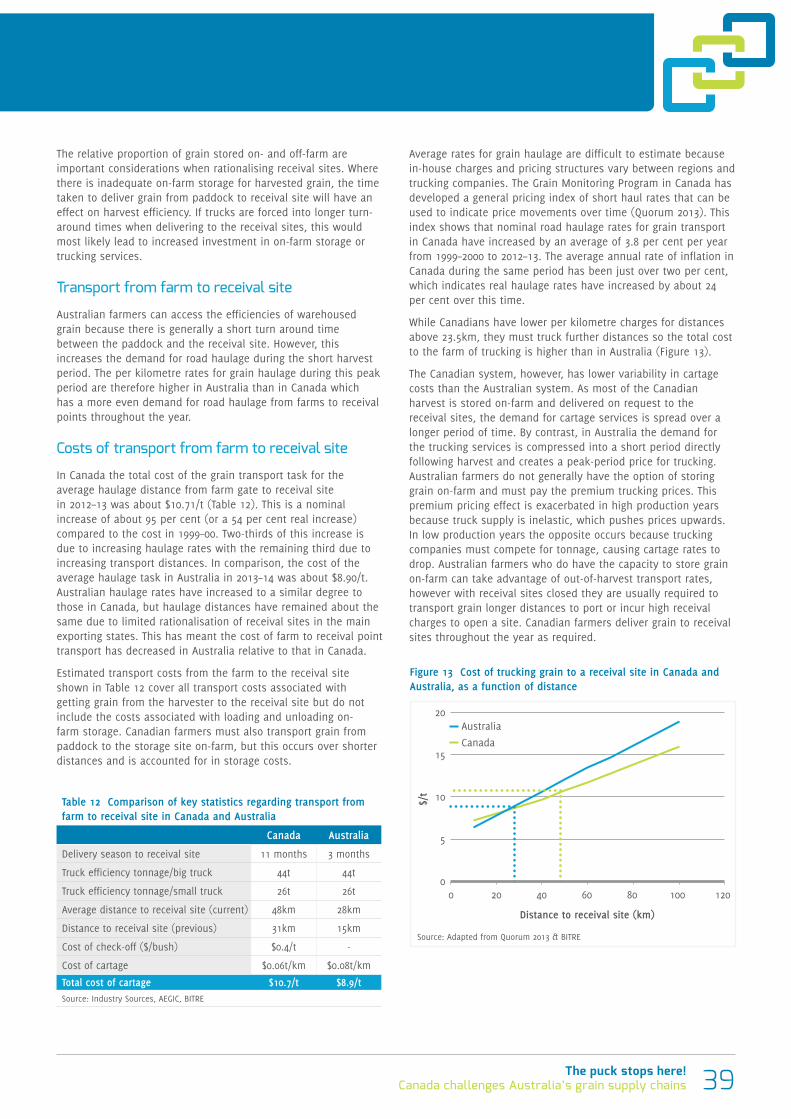
39The puck stops here!Canada challenges Australia’s grain supply chains
The relative proportion of grain stored on- and off-farm are important considerations when rationalising receival sites. Where there is inadequate on-farm storage for harvested grain, the time taken to deliver grain from paddock to receival site will have an effect on harvest efficiency. If trucks are forced into longer turn-around times when delivering to the receival sites, this would most likely lead to increased investment in on-farm storage or trucking services.
Transport from farm to receival site
Australian farmers can access the efficiencies of warehoused grain because there is generally a short turn around time between the paddock and the receival site. However, this increases the demand for road haulage during the short harvest period. The per kilometre rates for grain haulage during this peak period are therefore higher in Australia than in Canada which has a more even demand for road haulage from farms to receival points throughout the year.
Costs of transport from farm to receival site
In Canada the total cost of the grain transport task for the average haulage distance from farm gate to receival site in 2012–13 was about $10.71/t (Table 12). This is a nominal increase of about 95 per cent (or a 54 per cent real increase) compared to the cost in 1999–00. Two-thirds of this increase is due to increasing haulage rates with the remaining third due to increasing transport distances. In comparison, the cost of the average haulage task in Australia in 2013–14 was about $8.90/t. Australian haulage rates have increased to a similar degree to those in Canada, but haulage distances have remained about the same due to limited rationalisation of receival sites in the main exporting states. This has meant the cost of farm to receival point transport has decreased in Australia relative to that in Canada.
Estimated transport costs from the farm to the receival site shown in Table 12 cover all transport costs associated with getting grain from the harvester to the receival site but do not include the costs associated with loading and unloading on-farm storage. Canadian farmers must also transport grain from paddock to the storage site on-farm, but this occurs over shorter distances and is accounted for in storage costs.
Average rates for grain haulage are difficult to estimate because in-house charges and pricing structures vary between regions and trucking companies. The Grain Monitoring Program in Canada has developed a general pricing index of short haul rates that can be used to indicate price movements over time (Quorum 2013). This index shows that nominal road haulage rates for grain transport in Canada have increased by an average of 3.8 per cent per year from 1999–2000 to 2012–13. The average annual rate of inflation in Canada during the same period has been just over two per cent, which indicates real haulage rates have increased by about 24 per cent over this time.
While Canadians have lower per kilometre charges for distances above 23.5km, they must truck further distances so the total cost to the farm of trucking is higher than in Australia (Figure 13).
The Canadian system, however, has lower variability in cartage costs than the Australian system. As most of the Canadian harvest is stored on-farm and delivered on request to the receival sites, the demand for cartage services is spread over a longer period of time. By contrast, in Australia the demand for the trucking services is compressed into a short period directly following harvest and creates a peak-period price for trucking. Australian farmers do not generally have the option of storing grain on-farm and must pay the premium trucking prices. This premium pricing effect is exacerbated in high production years because truck supply is inelastic, which pushes prices upwards. In low production years the opposite occurs because trucking companies must compete for tonnage, causing cartage rates to drop. Australian farmers who do have the capacity to store grain on-farm can take advantage of out-of-harvest transport rates, however with receival sites closed they are usually required to transport grain longer distances to port or incur high receival charges to open a site. Canadian farmers deliver grain to receival sites throughout the year as required.
Table 12 Comparison of key statistics regarding transport from farm to receival site in Canada and Australia
Canada Australia
Delivery season to receival site 11 months 3 months
Truck efficiency tonnage/big truck 44t 44t
Truck efficiency tonnage/small truck 26t 26t
Average distance to receival site (current) 48km 28km
Distance to receival site (previous) 31km 15km
Cost of check-off ($/bush) $0.4/t -
Cost of cartage $0.06t/km $0.08t/km
Total cost of cartage $10.7/t $8.9/tSource: Industry Sources, AEGIC, BITRE
Figure 13 Cost of trucking grain to a receival site in Canada and Australia, as a function of distance
Australia
Canada
0
5
10
15
20
0 20 40 60 80 100 120
$/t
Distance to receival site (km)
Source: Adapted from Quorum 2013 & BITRE
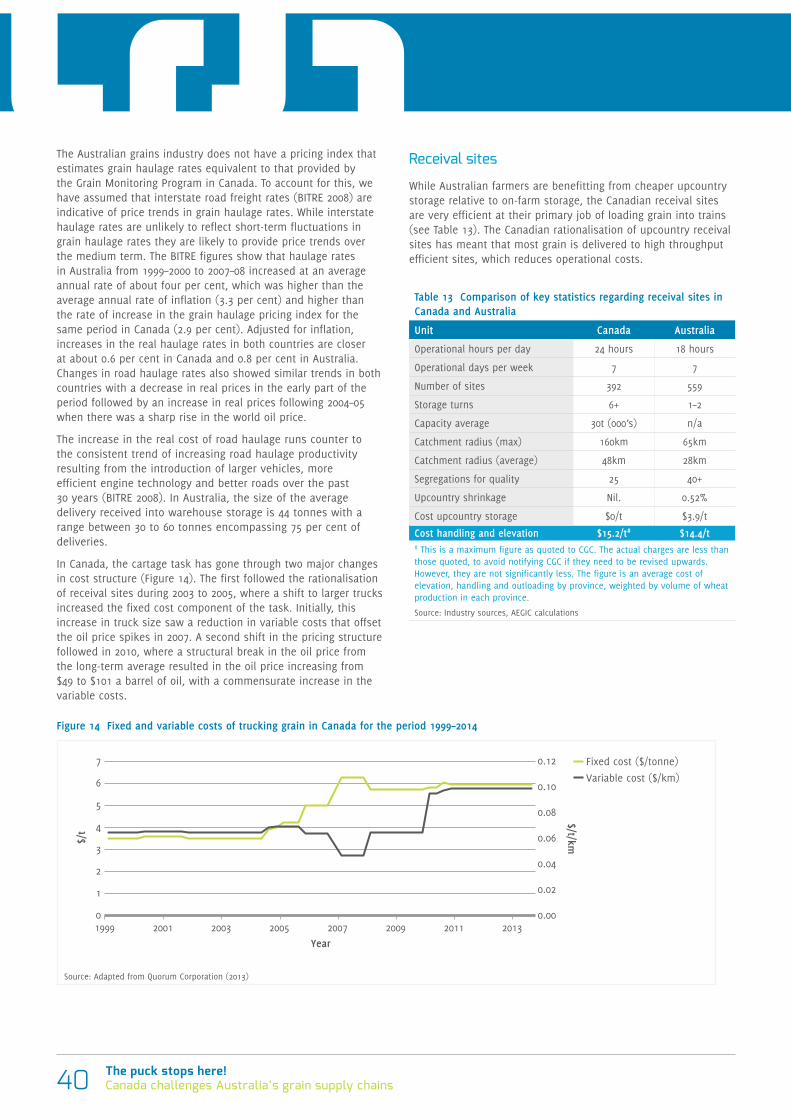
The puck stops here!Canada challenges Australia’s grain supply chains40
The Australian grains industry does not have a pricing index that estimates grain haulage rates equivalent to that provided by the Grain Monitoring Program in Canada. To account for this, we have assumed that interstate road freight rates (BITRE 2008) are indicative of price trends in grain haulage rates. While interstate haulage rates are unlikely to reflect short-term fluctuations in grain haulage rates they are likely to provide price trends over the medium term. The BITRE figures show that haulage rates in Australia from 1999–2000 to 2007–08 increased at an average annual rate of about four per cent, which was higher than the average annual rate of inflation (3.3 per cent) and higher than the rate of increase in the grain haulage pricing index for the same period in Canada (2.9 per cent). Adjusted for inflation, increases in the real haulage rates in both countries are closer at about 0.6 per cent in Canada and 0.8 per cent in Australia. Changes in road haulage rates also showed similar trends in both countries with a decrease in real prices in the early part of the period followed by an increase in real prices following 2004–05 when there was a sharp rise in the world oil price.
The increase in the real cost of road haulage runs counter to the consistent trend of increasing road haulage productivity resulting from the introduction of larger vehicles, more efficient engine technology and better roads over the past 30 years (BITRE 2008). In Australia, the size of the average delivery received into warehouse storage is 44 tonnes with a range between 30 to 60 tonnes encompassing 75 per cent of deliveries.
In Canada, the cartage task has gone through two major changes in cost structure (Figure 14). The first followed the rationalisation of receival sites during 2003 to 2005, where a shift to larger trucks increased the fixed cost component of the task. Initially, this increase in truck size saw a reduction in variable costs that offset the oil price spikes in 2007. A second shift in the pricing structure followed in 2010, where a structural break in the oil price from the long-term average resulted in the oil price increasing from $49 to $101 a barrel of oil, with a commensurate increase in the variable costs.
Receival sites
While Australian farmers are benefitting from cheaper upcountry storage relative to on-farm storage, the Canadian receival sites are very efficient at their primary job of loading grain into trains (see Table 13). The Canadian rationalisation of upcountry receival sites has meant that most grain is delivered to high throughput efficient sites, which reduces operational costs.
Table 13 Comparison of key statistics regarding receival sites in Canada and Australia
Unit Canada Australia
Operational hours per day 24 hours 18 hours
Operational days per week 7 7
Number of sites 392 559
Storage turns 6+ 1–2
Capacity average 30t (000’s) n/a
Catchment radius (max) 160km 65km
Catchment radius (average) 48km 28km
Segregations for quality 25 40+
Upcountry shrinkage Nil. 0.52%
Cost upcountry storage $0/t $3.9/t
Cost handling and elevation $15.2/t# $14.4/t# This is a maximum figure as quoted to CGC. The actual charges are less than those quoted, to avoid notifying CGC if they need to be revised upwards. However, they are not significantly less. The figure is an average cost of elevation, handling and outloading by province, weighted by volume of wheat production in each province.
Source: Industry sources, AEGIC calculations
Figure 14 Fixed and variable costs of trucking grain in Canada for the period 1999–2014
Fixed cost ($/tonne)
Variable cost ($/km)
0.00
0.02
0.04
0.06
0.08
0.10
0.12
0
1
2
3
4
5
6
7
1999 2001 2003 2005 2007 2009 2011 2013
$/t
$/t/km
Year
Source: Adapted from Quorum Corporation (2013)
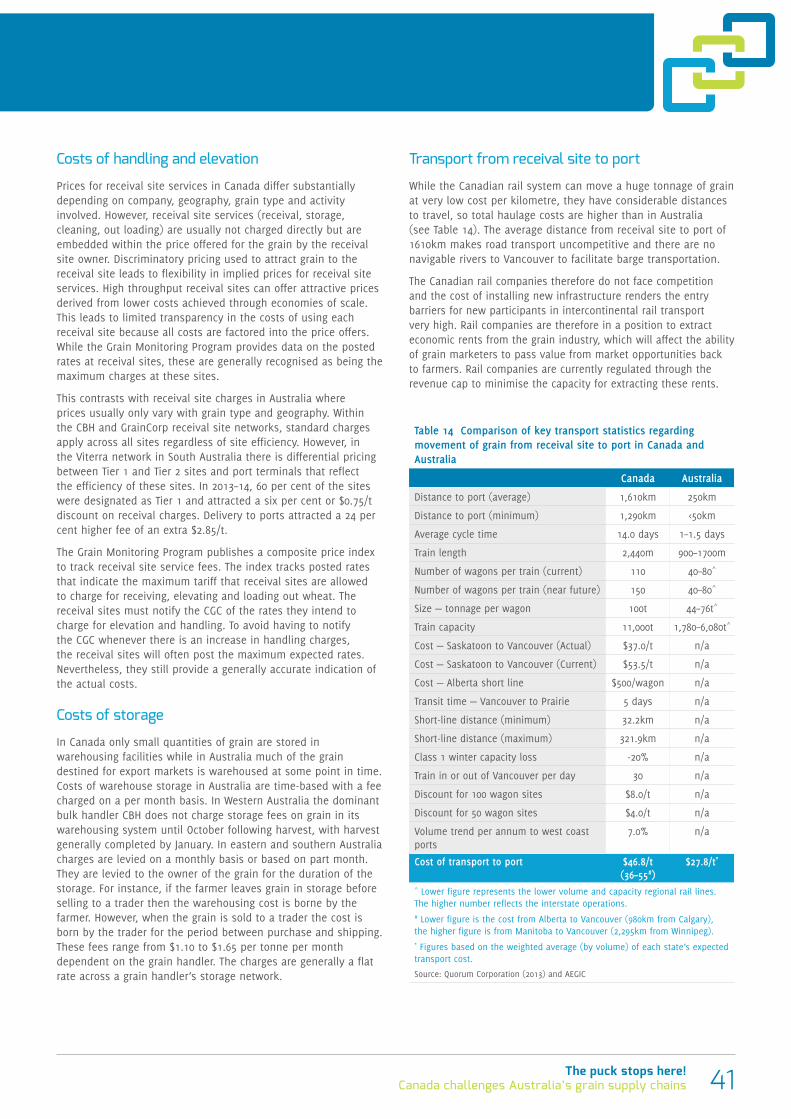
41The puck stops here!Canada challenges Australia’s grain supply chains
Costs of handling and elevation
Prices for receival site services in Canada differ substantially depending on company, geography, grain type and activity involved. However, receival site services (receival, storage, cleaning, out loading) are usually not charged directly but are embedded within the price offered for the grain by the receival site owner. Discriminatory pricing used to attract grain to the receival site leads to flexibility in implied prices for receival site services. High throughput receival sites can offer attractive prices derived from lower costs achieved through economies of scale. This leads to limited transparency in the costs of using each receival site because all costs are factored into the price offers. While the Grain Monitoring Program provides data on the posted rates at receival sites, these are generally recognised as being the maximum charges at these sites.
This contrasts with receival site charges in Australia where prices usually only vary with grain type and geography. Within the CBH and GrainCorp receival site networks, standard charges apply across all sites regardless of site efficiency. However, in the Viterra network in South Australia there is differential pricing between Tier 1 and Tier 2 sites and port terminals that reflect the efficiency of these sites. In 2013–14, 60 per cent of the sites were designated as Tier 1 and attracted a six per cent or $0.75/t discount on receival charges. Delivery to ports attracted a 24 per cent higher fee of an extra $2.85/t.
The Grain Monitoring Program publishes a composite price index to track receival site service fees. The index tracks posted rates that indicate the maximum tariff that receival sites are allowed to charge for receiving, elevating and loading out wheat. The receival sites must notify the CGC of the rates they intend to charge for elevation and handling. To avoid having to notify the CGC whenever there is an increase in handling charges, the receival sites will often post the maximum expected rates. Nevertheless, they still provide a generally accurate indication of the actual costs.
Costs of storage
In Canada only small quantities of grain are stored in warehousing facilities while in Australia much of the grain destined for export markets is warehoused at some point in time. Costs of warehouse storage in Australia are time-based with a fee charged on a per month basis. In Western Australia the dominant bulk handler CBH does not charge storage fees on grain in its warehousing system until October following harvest, with harvest generally completed by January. In eastern and southern Australia charges are levied on a monthly basis or based on part month. They are levied to the owner of the grain for the duration of the storage. For instance, if the farmer leaves grain in storage before selling to a trader then the warehousing cost is borne by the farmer. However, when the grain is sold to a trader the cost is born by the trader for the period between purchase and shipping. These fees range from $1.10 to $1.65 per tonne per month dependent on the grain handler. The charges are generally a flat rate across a grain handler’s storage network.
Transport from receival site to port
While the Canadian rail system can move a huge tonnage of grain at very low cost per kilometre, they have considerable distances to travel, so total haulage costs are higher than in Australia (see Table 14). The average distance from receival site to port of 1610km makes road transport uncompetitive and there are no navigable rivers to Vancouver to facilitate barge transportation.
The Canadian rail companies therefore do not face competition and the cost of installing new infrastructure renders the entry barriers for new participants in intercontinental rail transport very high. Rail companies are therefore in a position to extract economic rents from the grain industry, which will affect the ability of grain marketers to pass value from market opportunities back to farmers. Rail companies are currently regulated through the revenue cap to minimise the capacity for extracting these rents.
Table 14 Comparison of key transport statistics regarding movement of grain from receival site to port in Canada and Australia
Canada Australia
Distance to port (average) 1,610km 250km
Distance to port (minimum) 1,290km <50km
Average cycle time 14.0 days 1–1.5 days
Train length 2,440m 900–1700m
Number of wagons per train (current) 110 40–80^
Number of wagons per train (near future) 150 40–80^
Size — tonnage per wagon 100t 44–76t^
Train capacity 11,000t 1,780–6,080t^
Cost — Saskatoon to Vancouver (Actual) $37.0/t n/a
Cost — Saskatoon to Vancouver (Current) $53.5/t n/a
Cost — Alberta short line $500/wagon n/a
Transit time — Vancouver to Prairie 5 days n/a
Short-line distance (minimum) 32.2km n/a
Short-line distance (maximum) 321.9km n/a
Class 1 winter capacity loss -20% n/a
Train in or out of Vancouver per day 30 n/a
Discount for 100 wagon sites $8.0/t n/a
Discount for 50 wagon sites $4.0/t n/a
Volume trend per annum to west coast ports
7.0% n/a
Cost of transport to port $46.8/t(36–55#)
$27.8/t*
^ Lower figure represents the lower volume and capacity regional rail lines. The higher number reflects the interstate operations.# Lower figure is the cost from Alberta to Vancouver (980km from Calgary), the higher figure is from Manitoba to Vancouver (2,295km from Winnipeg). * Figures based on the weighted average (by volume) of each state’s expected transport cost.
Source: Quorum Corporation (2013) and AEGIC
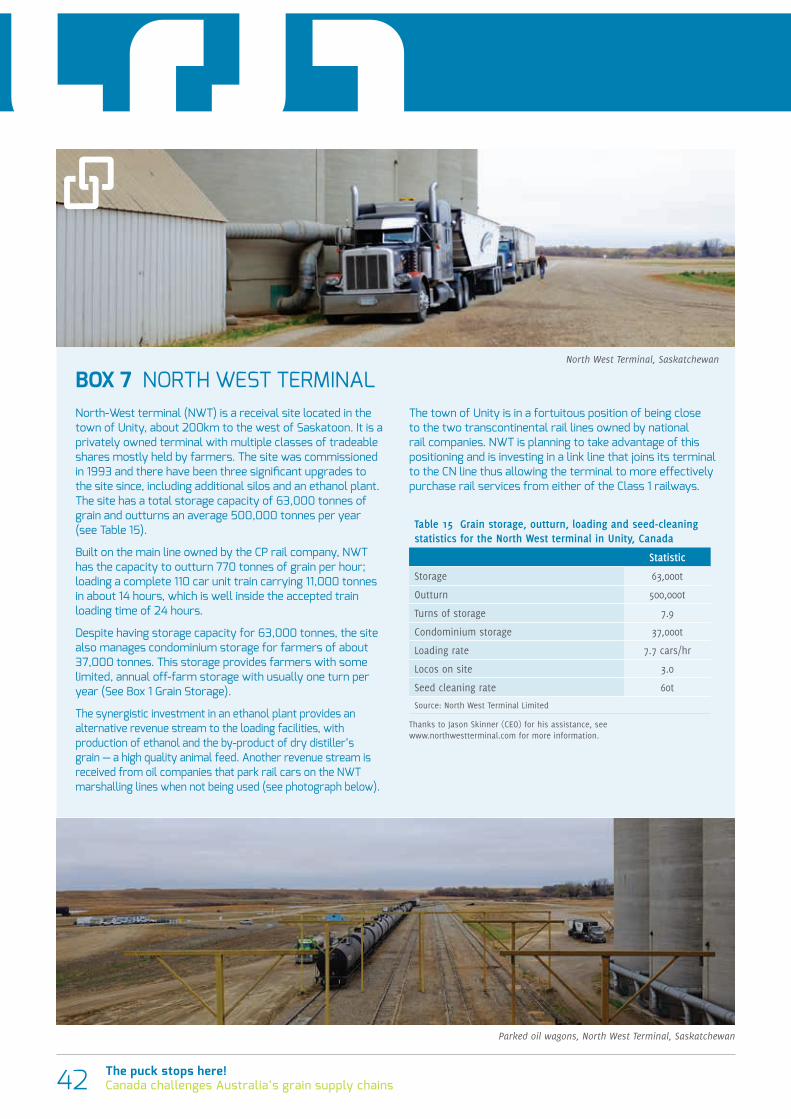
The puck stops here!Canada challenges Australia’s grain supply chains42
BOX 7 NORTH WEST TERMINALNorth-West terminal (NWT) is a receival site located in the town of Unity, about 200km to the west of Saskatoon. It is a privately owned terminal with multiple classes of tradeable shares mostly held by farmers. The site was commissioned in 1993 and there have been three significant upgrades to the site since, including additional silos and an ethanol plant. The site has a total storage capacity of 63,000 tonnes of grain and outturns an average 500,000 tonnes per year (see Table 15).
Built on the main line owned by the CP rail company, NWT has the capacity to outturn 770 tonnes of grain per hour; loading a complete 110 car unit train carrying 11,000 tonnes in about 14 hours, which is well inside the accepted train loading time of 24 hours.
Despite having storage capacity for 63,000 tonnes, the site also manages condominium storage for farmers of about 37,000 tonnes. This storage provides farmers with some limited, annual off-farm storage with usually one turn per year (See Box 1 Grain Storage).
The synergistic investment in an ethanol plant provides an alternative revenue stream to the loading facilities, with production of ethanol and the by-product of dry distiller’s grain — a high quality animal feed. Another revenue stream is received from oil companies that park rail cars on the NWT marshalling lines when not being used (see photograph below).
The town of Unity is in a fortuitous position of being close to the two transcontinental rail lines owned by national rail companies. NWT is planning to take advantage of this positioning and is investing in a link line that joins its terminal to the CN line thus allowing the terminal to more effectively purchase rail services from either of the Class 1 railways.
Table 15 Grain storage, outturn, loading and seed-cleaning statistics for the North West terminal in Unity, Canada
Statistic
Storage 63,000t
Outturn 500,000t
Turns of storage 7.9
Condominium storage 37,000t
Loading rate 7.7 cars/hr
Locos on site 3.0
Seed cleaning rate 60t
Source: North West Terminal Limited
Thanks to Jason Skinner (CEO) for his assistance, see www.northwestterminal.com for more information.
North West Terminal, Saskatchewan
Parked oil wagons, North West Terminal, Saskatchewan
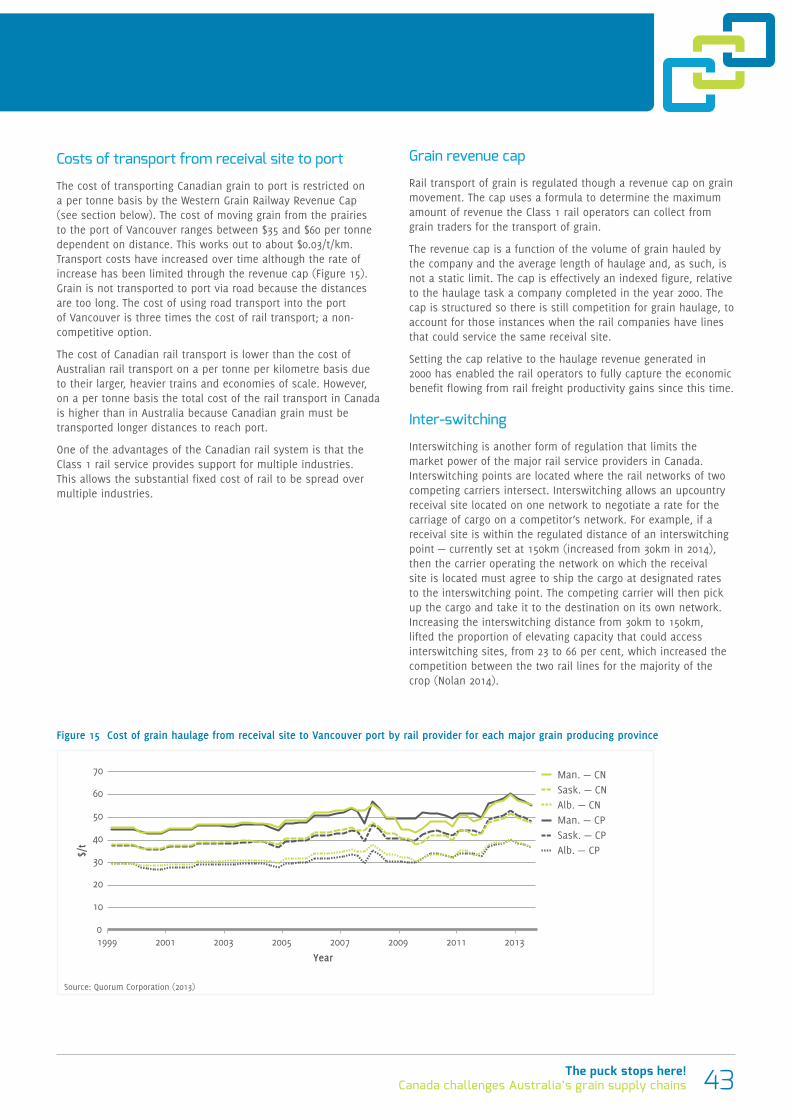
43The puck stops here!Canada challenges Australia’s grain supply chains
Costs of transport from receival site to port
The cost of transporting Canadian grain to port is restricted on a per tonne basis by the Western Grain Railway Revenue Cap (see section below). The cost of moving grain from the prairies to the port of Vancouver ranges between $35 and $60 per tonne dependent on distance. This works out to about $0.03/t/km. Transport costs have increased over time although the rate of increase has been limited through the revenue cap (Figure 15). Grain is not transported to port via road because the distances are too long. The cost of using road transport into the port of Vancouver is three times the cost of rail transport; a non-competitive option.
The cost of Canadian rail transport is lower than the cost of Australian rail transport on a per tonne per kilometre basis due to their larger, heavier trains and economies of scale. However, on a per tonne basis the total cost of the rail transport in Canada is higher than in Australia because Canadian grain must be transported longer distances to reach port.
One of the advantages of the Canadian rail system is that the Class 1 rail service provides support for multiple industries. This allows the substantial fixed cost of rail to be spread over multiple industries.
Grain revenue cap
Rail transport of grain is regulated though a revenue cap on grain movement. The cap uses a formula to determine the maximum amount of revenue the Class 1 rail operators can collect from grain traders for the transport of grain.
The revenue cap is a function of the volume of grain hauled by the company and the average length of haulage and, as such, is not a static limit. The cap is effectively an indexed figure, relative to the haulage task a company completed in the year 2000. The cap is structured so there is still competition for grain haulage, to account for those instances when the rail companies have lines that could service the same receival site.
Setting the cap relative to the haulage revenue generated in 2000 has enabled the rail operators to fully capture the economic benefit flowing from rail freight productivity gains since this time.
Inter-switching
Interswitching is another form of regulation that limits the market power of the major rail service providers in Canada. Interswitching points are located where the rail networks of two competing carriers intersect. Interswitching allows an upcountry receival site located on one network to negotiate a rate for the carriage of cargo on a competitor’s network. For example, if a receival site is within the regulated distance of an interswitching point — currently set at 150km (increased from 30km in 2014), then the carrier operating the network on which the receival site is located must agree to ship the cargo at designated rates to the interswitching point. The competing carrier will then pick up the cargo and take it to the destination on its own network. Increasing the interswitching distance from 30km to 150km, lifted the proportion of elevating capacity that could access interswitching sites, from 23 to 66 per cent, which increased the competition between the two rail lines for the majority of the crop (Nolan 2014).
Figure 15 Cost of grain haulage from receival site to Vancouver port by rail provider for each major grain producing province
0
10
20
30
40
50
60
70
$/t
Man. — CN Sask. — CN Alb. — CN Man. — CP Sask. — CP Alb. — CP
1999 2001 2003 2005 2007 2009 2011 2013
Year
1999 2001 2003 2005 2007 2009 2011 2013
Year
Source: Quorum Corporation (2013)
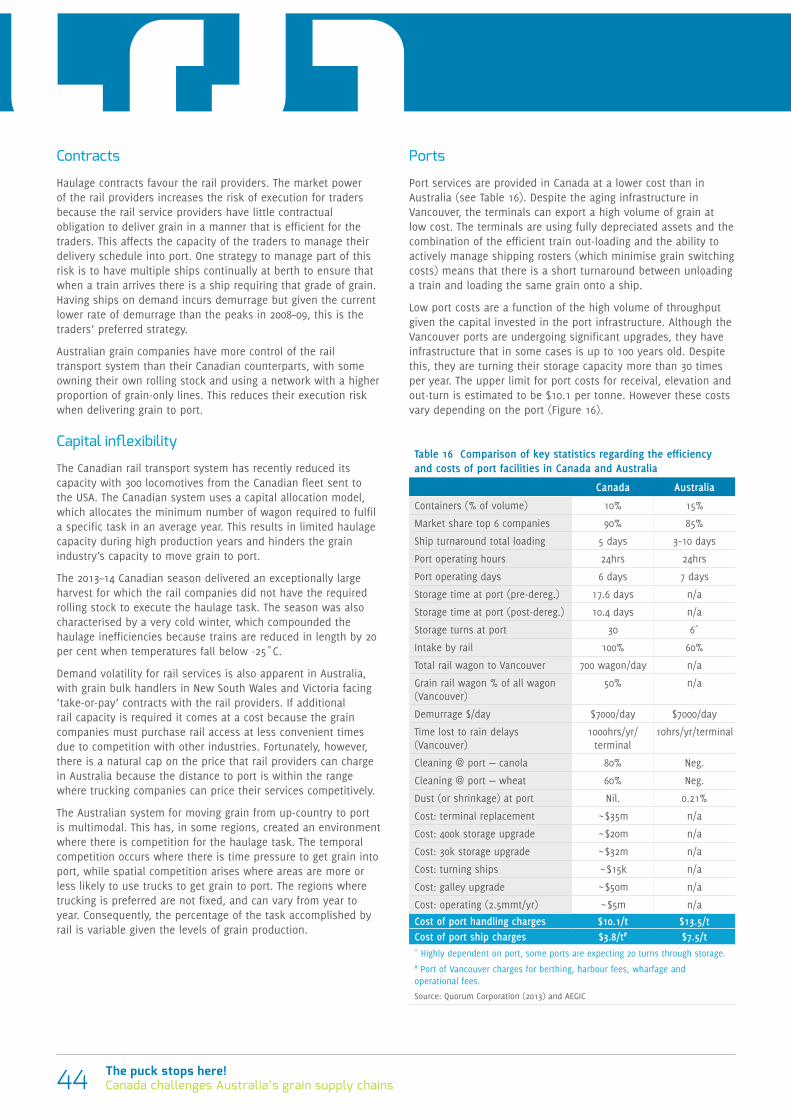
The puck stops here!Canada challenges Australia’s grain supply chains44
Contracts
Haulage contracts favour the rail providers. The market power of the rail providers increases the risk of execution for traders because the rail service providers have little contractual obligation to deliver grain in a manner that is efficient for the traders. This affects the capacity of the traders to manage their delivery schedule into port. One strategy to manage part of this risk is to have multiple ships continually at berth to ensure that when a train arrives there is a ship requiring that grade of grain. Having ships on demand incurs demurrage but given the current lower rate of demurrage than the peaks in 2008–09, this is the traders’ preferred strategy.
Australian grain companies have more control of the rail transport system than their Canadian counterparts, with some owning their own rolling stock and using a network with a higher proportion of grain-only lines. This reduces their execution risk when delivering grain to port.
Capital inflexibility
The Canadian rail transport system has recently reduced its capacity with 300 locomotives from the Canadian fleet sent to the USA. The Canadian system uses a capital allocation model, which allocates the minimum number of wagon required to fulfil a specific task in an average year. This results in limited haulage capacity during high production years and hinders the grain industry’s capacity to move grain to port.
The 2013–14 Canadian season delivered an exceptionally large harvest for which the rail companies did not have the required rolling stock to execute the haulage task. The season was also characterised by a very cold winter, which compounded the haulage inefficiencies because trains are reduced in length by 20 per cent when temperatures fall below -25˚C.
Demand volatility for rail services is also apparent in Australia, with grain bulk handlers in New South Wales and Victoria facing ‘take-or-pay’ contracts with the rail providers. If additional rail capacity is required it comes at a cost because the grain companies must purchase rail access at less convenient times due to competition with other industries. Fortunately, however, there is a natural cap on the price that rail providers can charge in Australia because the distance to port is within the range where trucking companies can price their services competitively.
The Australian system for moving grain from up-country to port is multimodal. This has, in some regions, created an environment where there is competition for the haulage task. The temporal competition occurs where there is time pressure to get grain into port, while spatial competition arises where areas are more or less likely to use trucks to get grain to port. The regions where trucking is preferred are not fixed, and can vary from year to year. Consequently, the percentage of the task accomplished by rail is variable given the levels of grain production.
Ports
Port services are provided in Canada at a lower cost than in Australia (see Table 16). Despite the aging infrastructure in Vancouver, the terminals can export a high volume of grain at low cost. The terminals are using fully depreciated assets and the combination of the efficient train out-loading and the ability to actively manage shipping rosters (which minimise grain switching costs) means that there is a short turnaround between unloading a train and loading the same grain onto a ship.
Low port costs are a function of the high volume of throughput given the capital invested in the port infrastructure. Although the Vancouver ports are undergoing significant upgrades, they have infrastructure that in some cases is up to 100 years old. Despite this, they are turning their storage capacity more than 30 times per year. The upper limit for port costs for receival, elevation and out-turn is estimated to be $10.1 per tonne. However these costs vary depending on the port (Figure 16).
Table 16 Comparison of key statistics regarding the efficiency and costs of port facilities in Canada and Australia
Canada Australia
Containers (% of volume) 10% 15%
Market share top 6 companies 90% 85%
Ship turnaround total loading 5 days 3–10 days
Port operating hours 24hrs 24hrs
Port operating days 6 days 7 days
Storage time at port (pre-dereg.) 17.6 days n/a
Storage time at port (post-dereg.) 10.4 days n/a
Storage turns at port 30 6^
Intake by rail 100% 60%
Total rail wagon to Vancouver 700 wagon/day n/a
Grain rail wagon % of all wagon (Vancouver)
50% n/a
Demurrage $/day $7000/day $7000/day
Time lost to rain delays (Vancouver)
1000hrs/yr/terminal
10hrs/yr/terminal
Cleaning @ port — canola 80% Neg.
Cleaning @ port — wheat 60% Neg.
Dust (or shrinkage) at port Nil. 0.21%
Cost: terminal replacement ~$35m n/a
Cost: 400k storage upgrade ~$20m n/a
Cost: 30k storage upgrade ~$32m n/a
Cost: turning ships ~$15k n/a
Cost: galley upgrade ~$50m n/a
Cost: operating (2.5mmt/yr) ~$5m n/a
Cost of port handling charges $10.1/t $13.5/tCost of port ship charges $3.8/t# $7.5/t^ Highly dependent on port, some ports are expecting 20 turns through storage. # Port of Vancouver charges for berthing, harbour fees, wharfage and operational fees.
Source: Quorum Corporation (2013) and AEGIC
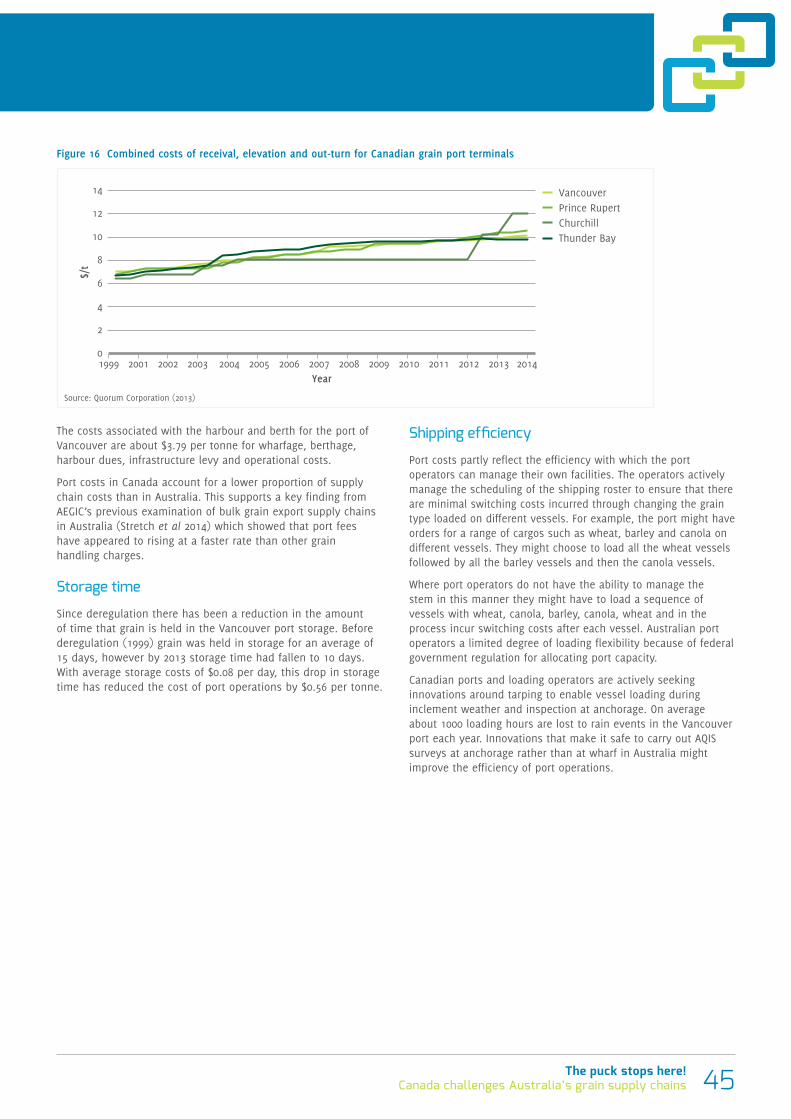
45The puck stops here!Canada challenges Australia’s grain supply chains
The costs associated with the harbour and berth for the port of Vancouver are about $3.79 per tonne for wharfage, berthage, harbour dues, infrastructure levy and operational costs.
Port costs in Canada account for a lower proportion of supply chain costs than in Australia. This supports a key finding from AEGIC’s previous examination of bulk grain export supply chains in Australia (Stretch et al 2014) which showed that port fees have appeared to rising at a faster rate than other grain handling charges.
Storage time
Since deregulation there has been a reduction in the amount of time that grain is held in the Vancouver port storage. Before deregulation (1999) grain was held in storage for an average of 15 days, however by 2013 storage time had fallen to 10 days. With average storage costs of $0.08 per day, this drop in storage time has reduced the cost of port operations by $0.56 per tonne.
Shipping efficiency
Port costs partly reflect the efficiency with which the port operators can manage their own facilities. The operators actively manage the scheduling of the shipping roster to ensure that there are minimal switching costs incurred through changing the grain type loaded on different vessels. For example, the port might have orders for a range of cargos such as wheat, barley and canola on different vessels. They might choose to load all the wheat vessels followed by all the barley vessels and then the canola vessels.
Where port operators do not have the ability to manage the stem in this manner they might have to load a sequence of vessels with wheat, canola, barley, canola, wheat and in the process incur switching costs after each vessel. Australian port operators a limited degree of loading flexibility because of federal government regulation for allocating port capacity.
Canadian ports and loading operators are actively seeking innovations around tarping to enable vessel loading during inclement weather and inspection at anchorage. On average about 1000 loading hours are lost to rain events in the Vancouver port each year. Innovations that make it safe to carry out AQIS surveys at anchorage rather than at wharf in Australia might improve the efficiency of port operations.
Figure 16 Combined costs of receival, elevation and out-turn for Canadian grain port terminals
$/t
Year
Vancouver Prince Rupert Churchill Thunder Bay
0
2
4
6
8
10
12
14
1999 2001 20032002 2005 2007 2009 2011 2013 2004 2006 2008 2010 2012 2014
Source: Quorum Corporation (2013)
The puck stops here!Canada challenges Australia’s grain supply chains46
Increased demurrage
A growing proportion of Canadian grain exports is moving through its western ports. Despite upgrades to terminal facilities at these ports, an increase in demurrage has occurred. In 1999 the average number of days a ship was in port was 5.6 days however by 2013–14 this had increased to 19.1 days.
While this figure is somewhat higher than expected due to the impact of the big harvest and colder than average winter on rail movements, it is worth noting that since 2010, in three of the four years the average time in port was greater than 14 days. This has led to an increase in demurrage. In 1999 dispatch was greater than demurrage by $4 million, but by 2012–13 the net demurrage cost was $16.2 million at the Vancouver port.
As demurrage currently only costs $6000 to $8000 per day, 10 days of demurrage represents a cost of $1.20 to $1.60 per tonne for a Panamax vessel. Some port terminal operators in Canada prefer to incur some demurrage costs to ensure their port terminal facilities operate at greater levels of throughput.
The number of days in port and demurrage costs at most Australian grain ports is significantly less than in Canada. For example, average days in port in South Australia were 10, 6.4 and 5.7 days between 2012 and 2014 and a consistent four days in Western Australia over the same time period.
Check-offs
Check-offs collected along the supply chain fund agricultural research aimed at developing innovations that, over time, will reduce unit production costs and increase market demand for grain. In the short term, however, the check-offs reduce the net farm gate price of grain and for this reason they are included as a cost of using the export grain supply chain (Table 17).
Canada uses a system of check-offs to support key research agencies including CIGI and the Western Grains Research Foundation (WGRF). There is discussion in the industry as to whether an end point royalty system would better deliver funding for research. However, the federal government and all levy collecting provinces have so far opted to retain the check-off system as the primary tool for collecting levies from grain production.
The CGC maintains a grain inspection service, which inspects grain at the shipping stem on all export bound grain. The inspection is charged to the shipper at $1.82 per tonne, in return for certification of grade and quality.
The Alberta Wheat Commission collects $0.48 per tonne of wheat grown in the Peace River district of British Columbia, Alberta, Saskatchewan and Manitoba on behalf of several federal research agencies. The check-off is voluntary and is imposed when the grain is sold, at which point the farmer can opt out and apply for a refund. The check-off contributes to the following agencies:
• $0.30 to the WGRF;
• $0.15 to CIGI; and
• $0.03 for administration (via Alberta Barley Commission)
For barley grown in Peace River, Manitoba and Saskatchewan a $0.56 per tonne check-off applies.
Provincial check-offs are managed centrally through agencies such as the Agriculture Council of Saskatchewan. This council manages the collection of 12 levies across the provinces of Alberta, Saskatchewan and Manitoba. Within the British Columbia Peace River district there is a levy fixed at 0.33 per cent of gross payable value at point of sale from farmer to buyer.
In Australia, the federal government imposes a total levy of 1.015 per cent of expected farm gate value payable at the time of sale of grain by the farmer. The levy funds two national industry bodies, the GRDC (levy of 0.99 per cent) and Plant Health Australia (levy of 0.015 per cent). There are a variety of state levies that are either voluntary or mandatory. The following are collected at the state level:
• Western Australia
— Biosecurity and Agricultural Management Act (BAMA): $0.30/t; and
• South Australia
— Primary Industry Funding Scheme (PIFS): $0.20/t Grain Research and Development Fund (PIFS GRDF): $0.30/t
Table 17 Comparison of check-offs and levies in Canada and Australia
Canada Australia
Outwards grain inspections $1.82/t Nil*
Federal levies $0.48/t ~$2.7/t
Provincial (State) check-offs (Levies) $0.7/t $0.11/t
Other mechanisms (EPR) n/a $3.0/t
Total $3.0/t $5.81/t* Costs associated with biosecurity inspections are incorporated into the ‘other port and vessel costs’.
Source: Canadian Provincial government websites, Australian Department of Agriculture
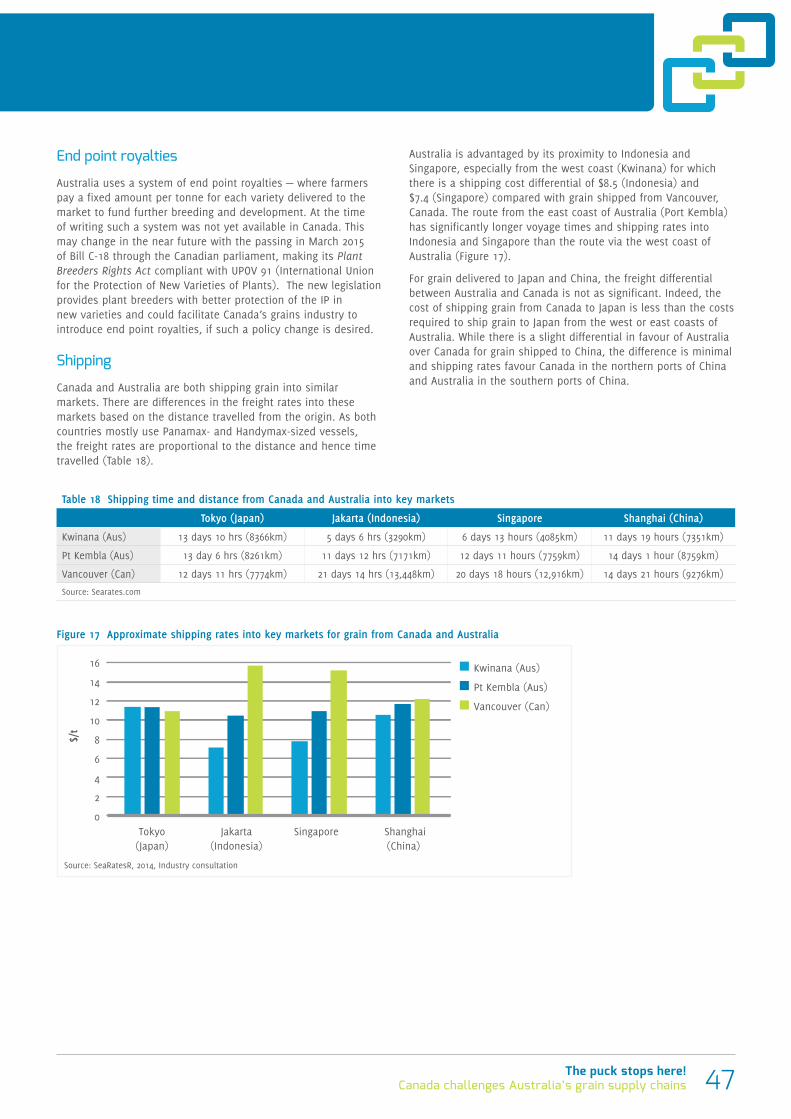
47The puck stops here!Canada challenges Australia’s grain supply chains
Table 18 Shipping time and distance from Canada and Australia into key markets
Tokyo (Japan) Jakarta (Indonesia) Singapore Shanghai (China)
Kwinana (Aus) 13 days 10 hrs (8366km) 5 days 6 hrs (3290km) 6 days 13 hours (4085km) 11 days 19 hours (7351km)
Pt Kembla (Aus) 13 day 6 hrs (8261km) 11 days 12 hrs (7171km) 12 days 11 hours (7759km) 14 days 1 hour (8759km)
Vancouver (Can) 12 days 11 hrs (7774km) 21 days 14 hrs (13,448km) 20 days 18 hours (12,916km) 14 days 21 hours (9276km)
Source: Searates.com
Figure 17 Approximate shipping rates into key markets for grain from Canada and Australia
$/t
Kwinana (Aus)
Pt Kembla (Aus)
Vancouver (Can)
0
2
4
6
8
10
12
14
16
Tokyo(Japan)
Jakarta(Indonesia)
Singapore Shanghai(China)
Source: SeaRatesR, 2014, Industry consultation
End point royalties
Australia uses a system of end point royalties — where farmers pay a fixed amount per tonne for each variety delivered to the market to fund further breeding and development. At the time of writing such a system was not yet available in Canada. This may change in the near future with the passing in March 2015 of Bill C-18 through the Canadian parliament, making its Plant Breeders Rights Act compliant with UPOV 91 (International Union for the Protection of New Varieties of Plants). The new legislation provides plant breeders with better protection of the IP in new varieties and could facilitate Canada’s grains industry to introduce end point royalties, if such a policy change is desired.
Shipping
Canada and Australia are both shipping grain into similar markets. There are differences in the freight rates into these markets based on the distance travelled from the origin. As both countries mostly use Panamax- and Handymax-sized vessels, the freight rates are proportional to the distance and hence time travelled (Table 18).
Australia is advantaged by its proximity to Indonesia and Singapore, especially from the west coast (Kwinana) for which there is a shipping cost differential of $8.5 (Indonesia) and $7.4 (Singapore) compared with grain shipped from Vancouver, Canada. The route from the east coast of Australia (Port Kembla) has significantly longer voyage times and shipping rates into Indonesia and Singapore than the route via the west coast of Australia (Figure 17).
For grain delivered to Japan and China, the freight differential between Australia and Canada is not as significant. Indeed, the cost of shipping grain from Canada to Japan is less than the costs required to ship grain to Japan from the west or east coasts of Australia. While there is a slight differential in favour of Australia over Canada for grain shipped to China, the difference is minimal and shipping rates favour Canada in the northern ports of China and Australia in the southern ports of China.
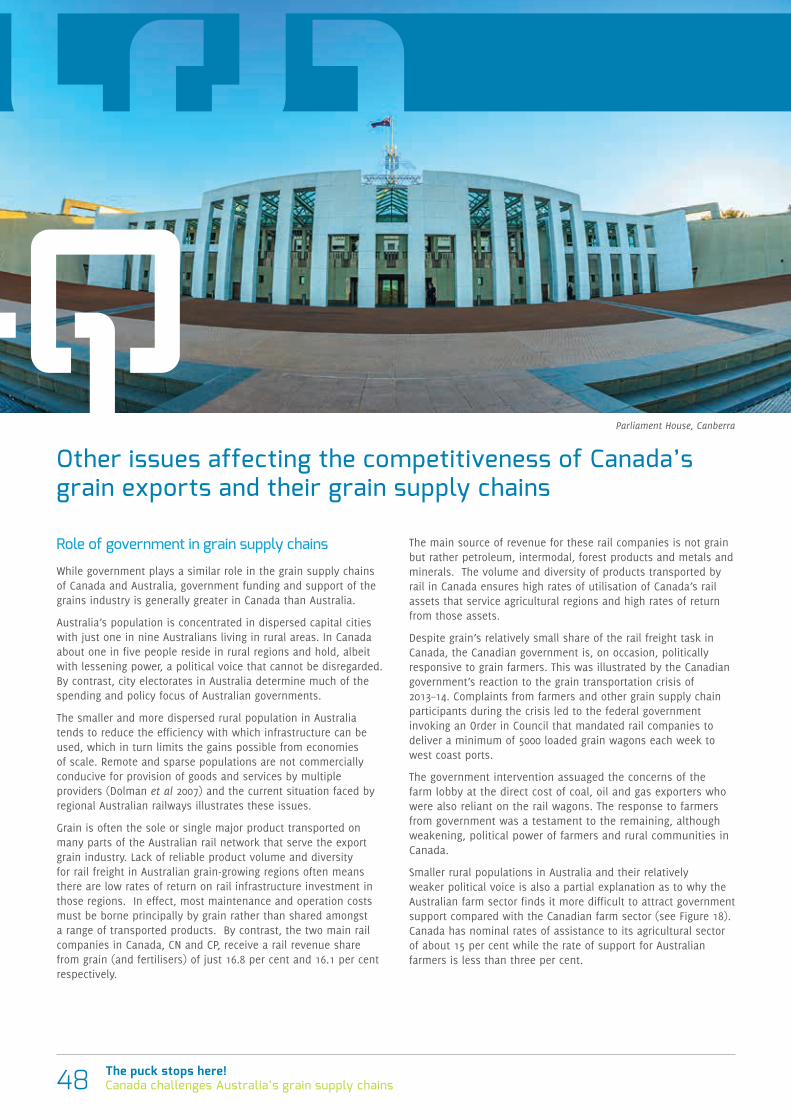
The puck stops here!Canada challenges Australia’s grain supply chains48
Other issues affecting the competitiveness of Canada’s grain exports and their grain supply chains
Role of government in grain supply chains
While government plays a similar role in the grain supply chains of Canada and Australia, government funding and support of the grains industry is generally greater in Canada than Australia.
Australia’s population is concentrated in dispersed capital cities with just one in nine Australians living in rural areas. In Canada about one in five people reside in rural regions and hold, albeit with lessening power, a political voice that cannot be disregarded. By contrast, city electorates in Australia determine much of the spending and policy focus of Australian governments.
The smaller and more dispersed rural population in Australia tends to reduce the efficiency with which infrastructure can be used, which in turn limits the gains possible from economies of scale. Remote and sparse populations are not commercially conducive for provision of goods and services by multiple providers (Dolman et al 2007) and the current situation faced by regional Australian railways illustrates these issues.
Grain is often the sole or single major product transported on many parts of the Australian rail network that serve the export grain industry. Lack of reliable product volume and diversity for rail freight in Australian grain-growing regions often means there are low rates of return on rail infrastructure investment in those regions. In effect, most maintenance and operation costs must be borne principally by grain rather than shared amongst a range of transported products. By contrast, the two main rail companies in Canada, CN and CP, receive a rail revenue share from grain (and fertilisers) of just 16.8 per cent and 16.1 per cent respectively.
The main source of revenue for these rail companies is not grain but rather petroleum, intermodal, forest products and metals and minerals. The volume and diversity of products transported by rail in Canada ensures high rates of utilisation of Canada’s rail assets that service agricultural regions and high rates of return from those assets.
Despite grain’s relatively small share of the rail freight task in Canada, the Canadian government is, on occasion, politically responsive to grain farmers. This was illustrated by the Canadian government’s reaction to the grain transportation crisis of 2013–14. Complaints from farmers and other grain supply chain participants during the crisis led to the federal government invoking an Order in Council that mandated rail companies to deliver a minimum of 5000 loaded grain wagons each week to west coast ports.
The government intervention assuaged the concerns of the farm lobby at the direct cost of coal, oil and gas exporters who were also reliant on the rail wagons. The response to farmers from government was a testament to the remaining, although weakening, political power of farmers and rural communities in Canada.
Smaller rural populations in Australia and their relatively weaker political voice is also a partial explanation as to why the Australian farm sector finds it more difficult to attract government support compared with the Canadian farm sector (see Figure 18). Canada has nominal rates of assistance to its agricultural sector of about 15 per cent while the rate of support for Australian farmers is less than three per cent.
Parliament House, Canberra
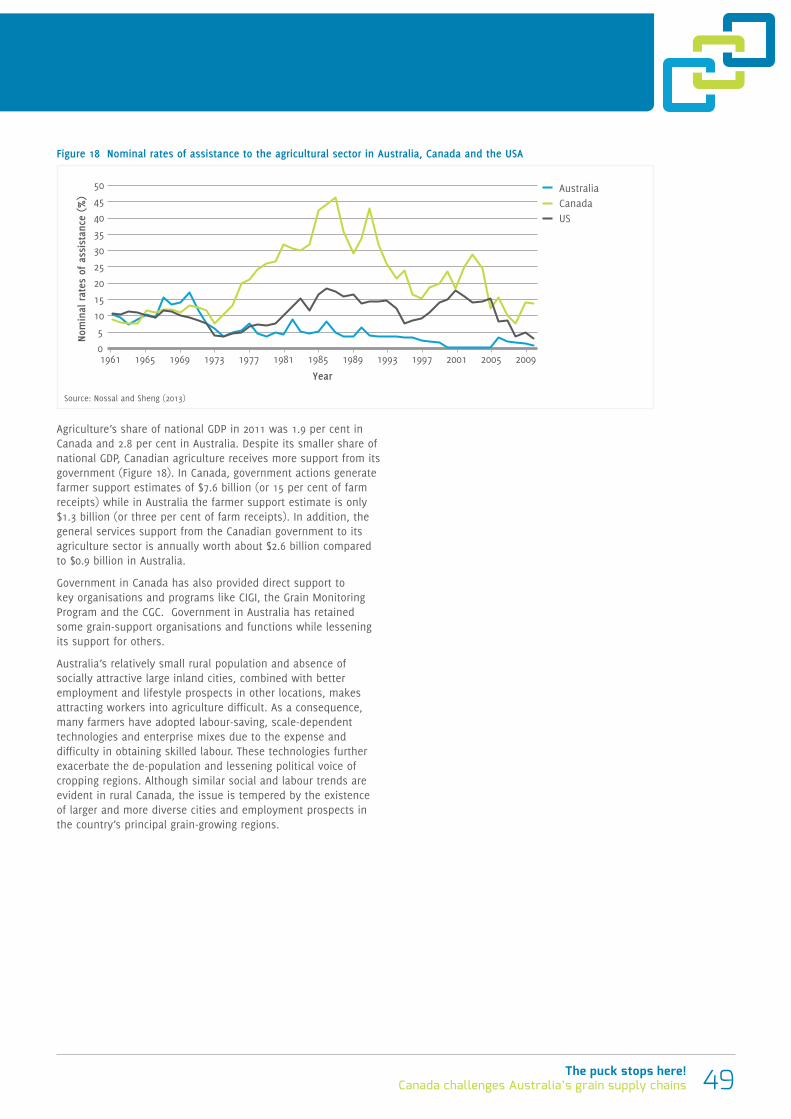
49The puck stops here!Canada challenges Australia’s grain supply chains
Agriculture’s share of national GDP in 2011 was 1.9 per cent in Canada and 2.8 per cent in Australia. Despite its smaller share of national GDP, Canadian agriculture receives more support from its government (Figure 18). In Canada, government actions generate farmer support estimates of $7.6 billion (or 15 per cent of farm receipts) while in Australia the farmer support estimate is only $1.3 billion (or three per cent of farm receipts). In addition, the general services support from the Canadian government to its agriculture sector is annually worth about $2.6 billion compared to $0.9 billion in Australia.
Government in Canada has also provided direct support to key organisations and programs like CIGI, the Grain Monitoring Program and the CGC. Government in Australia has retained some grain-support organisations and functions while lessening its support for others.
Australia’s relatively small rural population and absence of socially attractive large inland cities, combined with better employment and lifestyle prospects in other locations, makes attracting workers into agriculture difficult. As a consequence, many farmers have adopted labour-saving, scale-dependent technologies and enterprise mixes due to the expense and difficulty in obtaining skilled labour. These technologies further exacerbate the de-population and lessening political voice of cropping regions. Although similar social and labour trends are evident in rural Canada, the issue is tempered by the existence of larger and more diverse cities and employment prospects in the country’s principal grain-growing regions.
Figure 18 Nominal rates of assistance to the agricultural sector in Australia, Canada and the USA
Australia Canada US
0
5
10
15
20
25
30
35
40
45
50
1961 1965 1969 1973 1977 1981 1985 1989 1993 1997 2001 2005 2009
Nom
inal
rat
es o
f as
sist
ance
(%
)
Year
Source: Nossal and Sheng (2013)
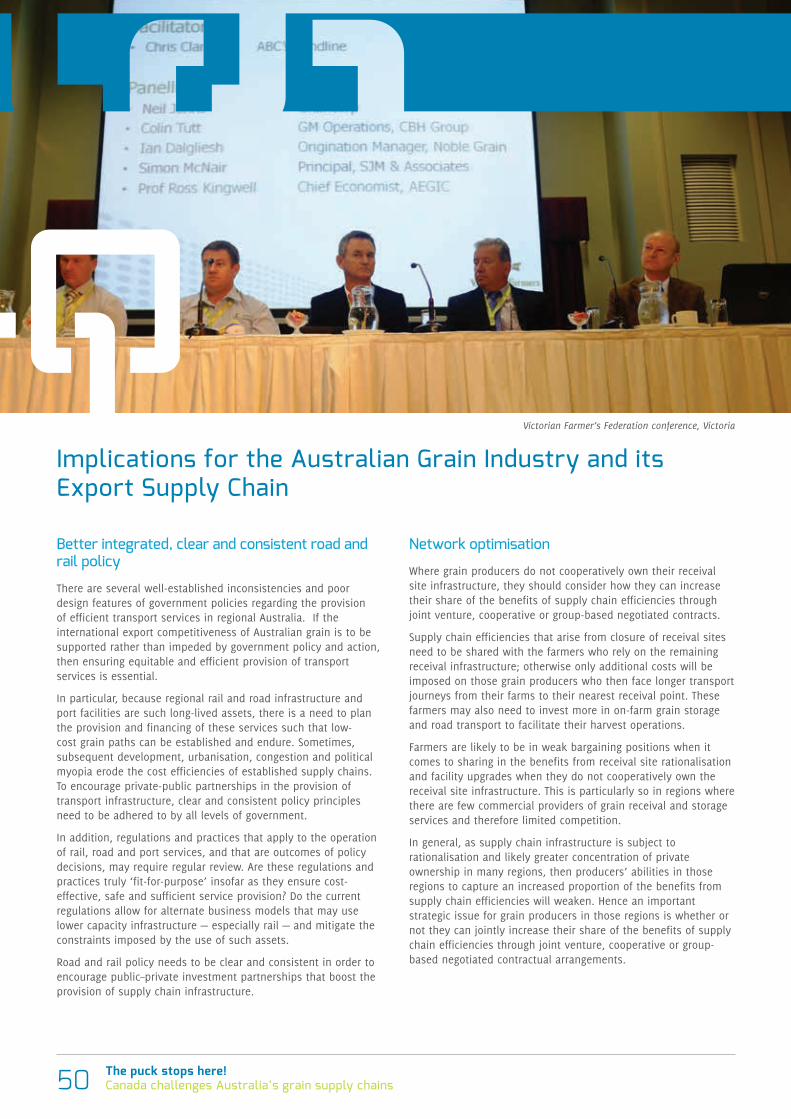
The puck stops here!Canada challenges Australia’s grain supply chains50
Implications for the Australian Grain Industry and its Export Supply Chain
Better integrated, clear and consistent road and rail policy
There are several well-established inconsistencies and poor design features of government policies regarding the provision of efficient transport services in regional Australia. If the international export competitiveness of Australian grain is to be supported rather than impeded by government policy and action, then ensuring equitable and efficient provision of transport services is essential.
In particular, because regional rail and road infrastructure and port facilities are such long-lived assets, there is a need to plan the provision and financing of these services such that low-cost grain paths can be established and endure. Sometimes, subsequent development, urbanisation, congestion and political myopia erode the cost efficiencies of established supply chains. To encourage private-public partnerships in the provision of transport infrastructure, clear and consistent policy principles need to be adhered to by all levels of government.
In addition, regulations and practices that apply to the operation of rail, road and port services, and that are outcomes of policy decisions, may require regular review. Are these regulations and practices truly ‘fit-for-purpose’ insofar as they ensure cost-effective, safe and sufficient service provision? Do the current regulations allow for alternate business models that may use lower capacity infrastructure — especially rail — and mitigate the constraints imposed by the use of such assets.
Road and rail policy needs to be clear and consistent in order to encourage public–private investment partnerships that boost the provision of supply chain infrastructure.
Network optimisation
Where grain producers do not cooperatively own their receival site infrastructure, they should consider how they can increase their share of the benefits of supply chain efficiencies through joint venture, cooperative or group-based negotiated contracts.
Supply chain efficiencies that arise from closure of receival sites need to be shared with the farmers who rely on the remaining receival infrastructure; otherwise only additional costs will be imposed on those grain producers who then face longer transport journeys from their farms to their nearest receival point. These farmers may also need to invest more in on-farm grain storage and road transport to facilitate their harvest operations.
Farmers are likely to be in weak bargaining positions when it comes to sharing in the benefits from receival site rationalisation and facility upgrades when they do not cooperatively own the receival site infrastructure. This is particularly so in regions where there are few commercial providers of grain receival and storage services and therefore limited competition.
In general, as supply chain infrastructure is subject to rationalisation and likely greater concentration of private ownership in many regions, then producers’ abilities in those regions to capture an increased proportion of the benefits from supply chain efficiencies will weaken. Hence an important strategic issue for grain producers in those regions is whether or not they can jointly increase their share of the benefits of supply chain efficiencies through joint venture, cooperative or group-based negotiated contractual arrangements.
Victorian Farmer’s Federation conference, Victoria
51The puck stops here!Canada challenges Australia’s grain supply chains
Supply chain changes should be made on the basis of the full cost of getting grain from paddock to port. A selective closure of some receival points, with service upgrades to some other remaining sites, may lower supply chain costs in Australia. However, it is important that grain farmers are net beneficiaries from any resulting supply chain efficiencies, and that access to cost effective off-farm storage — a significant advantage to Australian supply chains — is maintained. Additional efficiencies may be released through increasing the flexibility around vessel nominations and loading sequences.
Fair access and cost efficiency
It is widely acknowledged that some services within grain supply chains have natural monopoly characteristics that bestow potential commercial advantages to the owners and operators of those services. Key assets and services within Australia’s grain supply chains have moved into ownership beyond the financial control of most farm businesses. Grain producers are more than ever commercially exposed to the pricing decisions of those owners and operators of those assets and services.
Ongoing government oversight is needed to ensure that cost-efficiency, equity of access and fairness in the pricing of supply chain services are enduring characteristics of Australian export grain supply chains. Industry may be well served by a Grain Monitoring Program similar to Canada’s that results in more effective policy formulation and reduced regulatory burden.
Strengthen key markets
In coming decades, if grain production in southern Australia becomes increasingly constrained by environmental conditions and land limitations and if the higher relative productivity of grain production in Canada continues, then the Australian prospects for burgeoning grain volumes and increasing market shares in export destinations are limited.
Conversely, the prospects for production in Canada are bright, with the impacts of climate change fuelling optimism in the industry for continued productivity growth through yield improvements and hence increased competitiveness into some of Australia’s key markets. Moreover, the Canadian government has passed legislation making Canada a signatory to UPOV 91 (International Union for the Protection of New Varieties of Plants). This may eventually lead to Canada implementing end point royalties for crop breeding. This is likely to inject additional private investment into wheat and pulse breeding and accelerate their yield and quality improvement.
Accordingly, a focus on strengthening key markets, and greater reliance on opportunism, may be the market strategy that best serves the long-term interests of the Australian grain export sector. An Australian organisation, equivalent to the Canadian International Grains Institute, could usefully serve the Australian export grains sector by helping fuel demand for Australian grain.
A research challenge
Because there are economy-wide, community, social and industry costs that will accompany unfolding adverse climate change in key grain-growing regions in southern Australia, a range of research and development activity will be needed across the gamut of basic to highly applied research.
The changing climate is likely to affect the volumes and types of grains produced in southern Australia and thereby export grain supply chains also will be affected. Often the need to consider climate volatility and likely climate change will intrinsically be imbedded in current research and development activity. However, some additional strategic and basic research that more specifically helps the grains industry prepare for a changing climate will be needed.
Hence there is a challenging need for research, supported by industry and government, to cost-effectively boost Australian production and assist its grain industries to adapt and adjust to their changing climate.
The puck stops here!Canada challenges Australia’s grain supply chains52
Acknowledgments
We gratefully acknowledge the many people who have contributed to this report through meetings and consultation.
Canada• Prof. Richard Gray, University of Saskatchewan
• Prof. James Nolan, University of Saskatchewan
• Jeremy Karwandy, Ministry of the Economy, Government of Saskatchewan
• Ed Zsombor, Ministry of Highways and Infrastructure, Government of Saskatchewan
• Roger Gadd, Great Western Railway
• Morley Ayers, Ministry of Agriculture, Government of Saskatchewan
• Jason Skinner, North West Terminal Limited
• Brent Watchorn, Richardson International Limited
• Carsten Bredin, Richardson International Limited
• Aaron Anderson, Richardson International Limited
• John Peterson, Richardson International Limited
• Mark Dyck, CWB Limited
• Elwin Hermanson, Canadian Grains Commission, Government of Canada
• Murdoch Mackay, Canadian Grains Commission, Government of Canada
• Jim Smolik, Canadian Grains Commission, Government of Canada
• Randy Dennis, Canadian Grains Commission, Government of Canada
• John Sawicz, Canadian Grains Commission, Government of Canada
• David Burrows, Canadian International Grains Institute
• Gerald Pilcher, Farm Business communications
• Ken Eshpeter, Battle River Railway
• Wayne Atamanchuk, Canadian National Railway Company
• Mark Hemmes, Quorum Corporation
• Bruce McFadden, Quorum Corporation
• Marcel Beaulieu, Quorum Corporation
• David Kushnier, Alliance Grain Terminal Limited
• Don Drombolis, Viterra Canada
• John Dewar, Cascadia Port Management Corporation
• Tracy and Tim Charabin, North Battleford farmers
Australia• Chris Warrick, Kondinin Group
• Ben White, Kondinin Group
• Brianna Peake, CBH Group
• Justin Bayles, CBH Group
• Adam Sidebottom, Brookfield Rail
• Tim Cooling, Brookfield Rail
• Damian Fitzgerald, Viterra
• Tim Krause, Viterra
• Bill Thompson, Emerald Grain
• May Fu, Emerald Grain
• Grant McDougall, Cargill Australia
• Chris Aucote, Bunge Australia
• Tamara Alexander, Department of Agriculture and Food, Western Australia
• Ian Wilkinson, Department of Agriculture and Food, Western Australia
• Alexandra Edward, Department of Agriculture and Food, Western Australia
• Courtney Draper, Department of Agriculture and Food, Western Australia
• Peter Kain, Bureau of Infrastructure, Transport and Regional Economics, Government of Australia
• David Mitchell, Bureau of Infrastructure, Transport and Regional Economics, Government of Australia

53The puck stops here!Canada challenges Australia’s grain supply chains

The puck stops here!Canada challenges Australia’s grain supply chains54
55The puck stops here!Canada challenges Australia’s grain supply chains
The puck stops here!Canada challenges Australia’s grain supply chains56
References
1. AAFC 2014, Agriculture and Agri-food Canada. Statistics and Market information. Agriculture and Agri-Food Canada. www.agr.gc.ca
2. ABARES 2014, Australian Crop Report, February 2014, No. 169, Australian Bureau of Agricultural and Resource Economics and Sciences, Canberra, Australia.
3. ADM 2013, The Ownership Arrangements for Grain Handling Submission 1, Archer Daniels Midland Company submission to the Senate Rural and Regional Affairs and Transport References Committee, retrieved from: www.aph.gov.au/Parliamentary_Business/Committees/Senate/Rural_and_Regional_Affairs_and_Transport/Grain_Handling/Submissions
4. Almaraz, J. Mabood, F. Zhou, X. Strachan, I. Ma, B. and Smith, D. 2009, Performance of agricultural systems under contrasting growing season conditions in south-western Quebec, Journal of Agronomy and Crop Science 195, 319–327.
5. Asseng et al, 2015, Rising temperatures reduce global wheat production, Nature Climate Change 5, 143-147.
6. Ayars, M. 2012 Economics of Grain Storage — Bin, Bag or Condo, Crop Opportunities and Scott Research Update. Saskatchewan Canola Development Commission Saskatoon, Canada
7. Ayris, C. 1999, Heritage ingrained: a history of Co-operative Bulk Handling Ltd. 1933–2000, Perth, WA: Cooperative Bulk Handling Ltd.
8. BITRE 2008, Freight rates in Australia 1964–65 to 2007–08, Information Sheet 28. Bureau of Infrastructure, Transport and Regional Economics retrieved from: www.bitre.gov.au/publications/2008/is_028.aspx
9. BITRE 2014, Trainline 2 Statistical Report. Bureau of Infrastructure, Transport and Regional Economics retrieved from: www.bitre.gov.au/publications/2014/files/trainline_002.pdf
10. Brookfield 2014, Grain Freight Rail Network Fact Sheet, retrieved from: www.brookfieldrail.com/assets/br_files/Resources/2014-08-25_BR_Grain%20Rail%20Fact%20Sheet%20Reprint_v1.pdf
11. Campbell, I. Durant, D. Hunter, K. and Hyatt, K. 2014, ‘Food Production’ In F.J. Warren and D.S. Lemmen (eds) Canada in a Changing Climate: Sector Perspectives on Impacts and Adaptation (pp. 99–134), Ottawa: Ontario Government of Canada.
12. CGC 2014, Canadian Grain Exports, Canadian Grains Commission. viewed 17 June 2014, retrieved from: www.grainscanada.gc.ca/statistics-statistiques/cge-ecg/cgem-mecg-eng.htm
13. Canola Council of Canada 2014, Markets and Statistics, viewed 17 June 2014, retrieved from: www.canolacouncil.org
14. CBH 2011, CBH Group Submission to the Rural Affairs and Transport Committee Inquiry into Operational Issues Arising in the Export Grain Storage, Transport, Handling and Shipping Network in Australia, retrieved from: https://senate.aph.gov.au/submissions/comittees/viewdocument.aspx?id=ae76a398-229f-4b6c-ba04-4388f25e10cb
15. CBH 2014 CBH Group Submission to Senate Rural and Regional Affairs and Transport References Committee Inquiry into Grain Export Networks, retrieved from: http://www.aph.gov.au/DocumentStore.ashx?id=c2a70496-4933-4fe2-b43a-5c1c3c657a1a&subId=298604
16. CGC 2012, Canadian Grain Commission 2011–12 Departmental Performance Report. Winnipeg, Canada: Canadian Grain Commission, retrieved from: www.grainscanada.gc.ca/cgc-ccg/cr-rm/dpr-rmr/2012/dpr-rmr-2012-eng.pdf
17. CSIRO and BOM 2014, State of the Climate 2014, Commonwealth Scientific and Industrial Research Organisation and Australian Government Bureau of Meteorology, retrieved from: www.bom.gov.au/state-of-the-climate/documents/state-of-the-climate-2014_low-res.pdf?ref=button
18. Cutforth, H. McGinn, S. McPhee, K. and Miller, P. 2007, ‘Adaptation of pulse crops to the changing climate of the Northern Great Plains’ Agronomy Journal 99, 1684–1699.
19. Dolman, B. Parham, D. and Zheng, Y. 2007, Can Australia match US productivity performance? Productivity Commission Staff Working Paper, Productivity Commission, Canberra.
20. GrainCorp 2013, The Ownership Arrangements for Grain Handling Submission 9, GrainCorp submission to the Senate Rural and Regional Affairs and Transport References Committee, retrieved from: www.aph.gov.au/Parliamentary_Business/Committees/Senate/Rural_and_Regional_Affairs_and_Transport/Grain_Handling/Submissions
21. GrainCorp 2014, Project Regeneration: creating a more efficient and reliable network for all customers, retrieved from: www.graincorp.com.au/LiteratureRetrieve.aspx?ID=167001
22. Gray, R. 2014, The economic impacts of elevated export basis levels on Western Canadian grain producers (Appendix 1) in Producer Recommendations on the Future of Canada’s Transportation Act, submission to Canadian Transportation Act Review Panel retrieved from: www.realagriculture.com/wp-content/uploads/2014/12/CTA-Joint-Producer-Group-Submission-Dec-2-2014_DS-edits_APAS-accepted.pdf
23. Gunasekera, D. Kim, Y. Tulloh, C. and Ford, M. 2007, Climate change: impacts on Australian agriculture. Australian Commodities 14, pp. 657–676.
24. IPCC 2000, Summary for Policymakers: emissions scenarios, a special report of IPCC Working Group III: Intergovernmental Panel on Climate Change, retrieved from: www.ipcc.ch/pdf/special-reports/spm/sres-en.pdf
25. Johansen, D. 1995, Rail lines: current conveyance and abandonment procedures and replacement proposals in Bill C-101, Government of Canada, Background Paper BP-403E, retrieved from: http://publications.gc.ca/Collection-R/LoPBdP/BP/bp403-e.htm
26. Kulshreshtha, S. 2011, Climate change, prairie agriculture, and prairie economy: the new normal, Canadian Journal of Agricultural Economics 59, 19–44.
27. Nickel, R. 2014 (Dec 3 2014) Canada wheat exports dogged by quality complaints, Reuters, retrieved from: www.reuters.com/article/2014/12/03/us-canada-wheat-idUSKCN0JH0W320141203
28. Nolan, J. and Skotheim, J. 2008, Spatial competition and regulatory change in the grain handling and transportation system in Western Canada, Annals of Regional Science 41, 929–944.
29. Nossal, K. and Sheng, Y. 2013, Cross-country comparisons of agricultural productivity: An Australian perspective, RIRDC Publication No. 13/011, Rural Industries Research and Development Corporation, Canberra, ACT.
30. Picketts, I. Werner, A. and Murdock, T. 2009, Climate change in Prince George: summary of past trends and future projections. Pacific Climate Impacts Consortium, University of Victoria, Victoria BC, 48 pp.
31. Productivity Commission 2010, Wheat Export Marketing Arrangements, Report no. 51, Ch 6 Transport, storage and handling.
57The puck stops here!Canada challenges Australia’s grain supply chains
32. Quorum Corporation 2013 Annual Report of the Monitor — Canadian grain handling and transport system, 2012–13 crop year, retrieved from: http://quorumcorp.net/Downloads/AnnualReports/AnnualReport201213.pdf
33. Reading, P. 2012, Information requirements for an effective bulk wheat export market: ensuring a ‘level playing field’, report commissioned by the Department of Agriculture, Fisheries and Forestry, Canberra, ACT, retrieved from: www.agriculture.gov.au/Style%20Library/Images/DAFF/__data/assets/pdffile/0011/2157770/information-req-for-an-effective-bulk-wheat-export-market.pdf
34. Rutter, B. 2010, Prairie on-farm grain storage: practices and trends. Presentation to Canada Grains Council Mycotoxin Workshop, Winnipeg, Manitoba, retrieved from: www.canadagrainscouncil.ca/uploads/Rutter_mycotoxin_(abridged).pdf
35. Sheng, Y. Mullen, J. and Zhao, S. 2011, A turning point in agricultural productivity: consideration of the causes. ABARES research report 11.4 for the Grains Research and Development Corporation, Canberra.
36. Stretch, T. Carter, C. and Kingwell, R. 2014, The cost of Australia’s bulk grain export supply chains: An information paper, retrieved from: www.aegic.org.au/media/22950/140130%20Final%20AEGIC%20Supply%20Chains%20Report.pdf
37. USDA 2014, United States Department of Agriculture, Foreign Agricultural Service viewed 17 June 2014, retrieved from: http://apps.fas.usda.gov/psdonline/
38. USDA MWCACP 2014, Major World Crop Areas and Climate Profiles, viewed 17 June 2014, retrieved from: http://usda.gov/oce/weather/pubs/Other/MWCACP/
39. Warrick, C. 2013, Economics of on-farm grain storage. Cost-benefit analysis, a grains industry guide. Grains Research and Development Corporation, Canberra, Australia.
40. Warren, F. and Lemmen, D. Eds 2014, Canada in a Changing Climate: Sector Perspectives on Impacts and Adaptation; Government of Canada, Ottawa, Ontario, 286p.
41. Watson, P. and Watson, D. 2013, GRDC Organisational Performance Research — 2013 Grower Survey Report. Grains Research and Development Corporation, Canberra, ACT viewed 9 July 2014, retrieved from: www.grdc.com.au/Downloads.ashx?q=/~/media/0676B47E9B494F029E0E7DDF84D88123.PDF
42. Zabel, F. Putzenlechner, B. and Mauser, W. 2014, Global agricultural land resources — A high resolution suitability evaluation and its perspectives until 2100 under climate change conditions, retrieved from: PLoS ONE 99: e107522 doi:10.1371/journal.pone.0107522


3 Baron-Hay CourtSouth PerthWestern Australia 6151P: +61 8 9368 3785E: [email protected]
aegic.org.au
AEGIC is an initiative of the Western Australian State Government and Australia’s Grains Research and Development Corporation
Department ofAgriculture and Food