Embed Size (px)
Citation preview

Business Research& Economic Advisors P.O. Box 955 Exton, PA 19341
The Economic Contribution of the International Cruise Industry in Canada
2007
Executive Summary
Prepared for:
NorthWest CruiseShip Association Cruise Newfoundland and Labrador
Cruise the Saint Lawrence Atlantic Canada Cruise Association
Cruise BC
March 2008
BREA
Business Research & Economic Advisors
Business Research & Economic Advisors Page 1 March 2008
Business Research and Economic Advisors (BREA) was engaged by the NorthWest Cruiseship Association (NWCA) and its Canadian cruise port partners to analyze the direct and indirect economic contribution of the cruise industry to the Canadian economy and the economies of selected provinces in 2007. This study is an update and expansion of the economic impact analysis for 2003 that was also conducted by BREA. As part of this project BREA with the assistance of the NWCA member lines completed over 22,000 passenger and crew surveys at nine cruise destination ports1 in Canada. The results of these surveys were used to estimate passenger satisfaction and passenger and crew spending at these ports.
The mass market cruise lines offer three primary cruise itineraries to Canada as follows.
Canada/New England – These are generally 7 or 10 day cruises which originate in northeastern U.S. ports. These cruises usually make 2 port calls in Canada and 2 or 3 calls in New England ports.
Quebec – These are typically 7 or 10 day cruises that sail between Montreal and a northeastern U.S. port. The northbound cruises originate in the U.S. and terminate in Montreal while the southbound cruises originate in Montreal and terminate in the United States. These cruises ordinarily make 2 port calls in the Province of Quebec, including Montreal, and 3 port calls at Atlantic Canada ports.
Alaska – Again these are 7 or 10 day cruises. There are two major Alaska itineraries. Those that originate and terminate in the United States, usually Seattle and San Francisco, and those that sail between Vancouver and an Alaska port, usually Seward or Whittier. The U.S. roundtrip cruises generally make one port call in Canada, primarily Victoria, but also Campbell River and Prince Rupert. There are both one‐way and roundtrip cruises between Vancouver and the Alaska ports. These cruises usually only include one Canada port call, the origination or termination call at Vancouver, but a few of the cruises may also include another call at one of the BC ports.
It should also be noted that a new Pacific Northwest cruise itinerary has been developed which includes 3‐ and 4‐day cruises. These cruises originate in Vancouver and include calls at the other BC ports. In fact, most of the cruise calls made at Nanaimo are done so as part of this itinerary. In addition to these cruises there are cruises by the small expedition ships2 that will make numerous calls on their itineraries at small ports, as well as the major cruise destinations. These itineraries are generally bound for Alaska or Atlantic Canada. Finally, a few transatlantic cruises will call at two or more Atlantic Canada destinations.
During 2007 approximately 1,000 cruise ship calls were made at Canadian cruise ports generating nearly 2 million passenger arrivals throughout the six‐month cruise season3. On a regional basis, 1 The nine ports were: Charlottetown, PEI, Saint John, NB; Corner Brook and St. John’s in Newfoundland and Labrador; Halifax and Sydney in Nova Scotia and Campbell River, Victoria, Prince Rupert in British Columbia. 2 Expedition ships are much smaller than the mass market cruise ships and range in size from less than 100 passengers to several hundred passengers. 3 The Canadian cruise season generally begins in May and ends in October. However, some ports will receive a few cruise ship calls in April and November. This is the sum of passenger embarkations, debarkations and port‐of‐call arrivals.
Business Research & Economic Advisors Page 2 March 2008
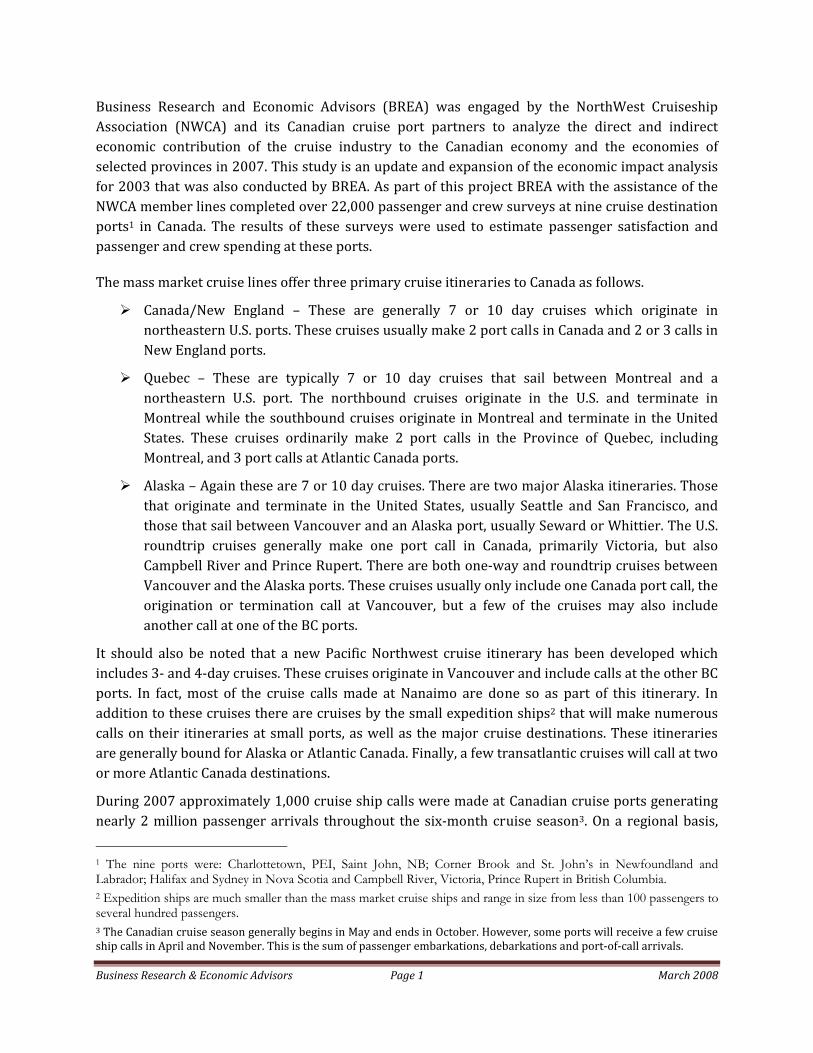
the Pacific ports of Campbell River, Nanaimo, Prince Rupert, Victoria and Vancouver accounted for 73% of the Canadian cruise passenger traffic. Vancouver is primarily a port of embarkation and debarkation for Alaska cruises while Victoria and the remaining BC ports serve as ports of call for Alaska cruises that originate at U.S. ports and Vancouver.
Figure ES1 – Cruise Passenger Traffic in Canada by Port, 2007
Vancouver960,554 50%
Victoria324,000 17%
Halifax176,742 9% Nanaimo
30,418 2%
Montreal28,688 2%
Cornerbrook20,462 1%
Charlottetown19,358 1%
Other Quebec Ports15,296 St. John's
8,696
Other NFL Ports7,727
Campbell River2,305
Other132,950 8%
Source: BREA survey of Canadian cruise ports.
The Atlantic Canada4 ports, led by Halifax, accounted for 21% of the Canadian passenger traffic in 2007 with just under 410,000 cruise passenger arrivals. These ports are primarily destinations along the Canada/New England cruise itineraries that originate in the northeastern United States but calls are also made by expedition ships and ships on transatlantic itineraries. Finally, the St. Lawrence ports, including Montreal, Saguenay, Quebec and several smaller ports, accounted for the remaining 6% of Canadian passenger traffic with just over 110,000 cruise passenger arrivals. Again, these are primarily ports‐of‐call; however, about 45% of their passenger traffic consists of passenger embarkations and disembarkations.
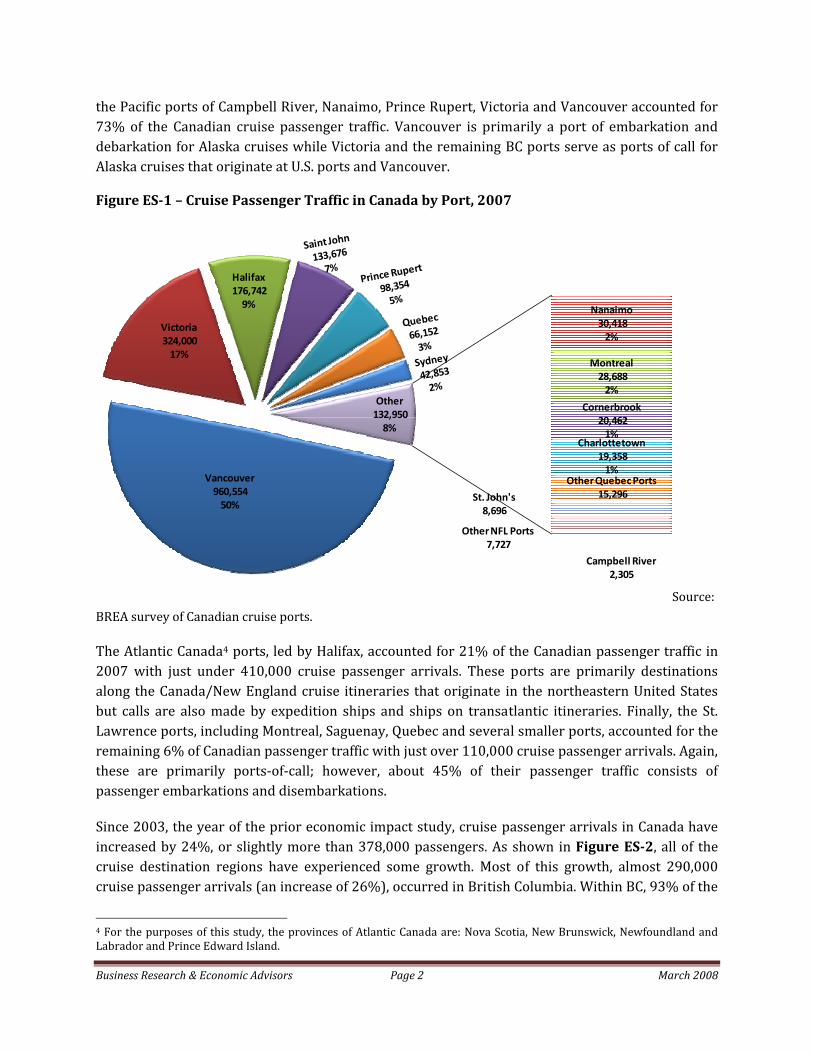
Since 2003, the year of the prior economic impact study, cruise passenger arrivals in Canada have increased by 24%, or slightly more than 378,000 passengers. As shown in Figure ES2, all of the cruise destination regions have experienced some growth. Most of this growth, almost 290,000 cruise passenger arrivals (an increase of 26%), occurred in British Columbia. Within BC, 93% of the
4 For the purposes of this study, the provinces of Atlantic Canada are: Nova Scotia, New Brunswick, Newfoundland and Labrador and Prince Edward Island.
Business Research & Economic Advisors Page 3 March 2008
growth in passenger arrivals was generated by the growth in port‐of‐call traffic. This was supplemented by a 2% increase in embarkations and disembarkations in Vancouver.
The ports of the Province of Quebec experienced an 18% increase in cruise passenger traffic. Again, most of the increase has been generated by the growth of intransit, or port‐of‐call, passengers. Finally, the Atlantic Canada ports have experienced a 21% increase in intransit passenger traffic since 2003.
Figure ES2 – Cruise Passenger Traffic in Canada by Region, 2003 and 2007
110,136
92,995
409,514
338,083
1,415,631
1,125,991
0 200,000 400,000 600,000 800,000 1,000,000 1,200,000 1,400,000 1,600,000
2007
2003
2007
2003
2007
2003
British Co
lumbia
Que
bec
Atlantic C
anada
Port of Call Embarks Debarks
Source: BREA survey of Canadian cruise ports.
Economic Impacts
The economic benefits that accrue to the Canadian economy arise from five principal sources:
spending by cruise passengers and crew for goods and services associated with their cruise, including travel to the port of embarkation and pre‐ and post‐cruise vacation spending;
expenditures by the cruise lines for goods and services necessary for cruise operations, including food and beverages, fuel, vessel maintenance and repair, ship’s supplies and so forth;
shore‐side staffing by the cruise lines for their cruise and land transportation and excursion activities;
spending by the cruise lines for port services at Canadian ports‐of‐embarkation and ports‐of‐call; and
capital expenditures for equipment and facilities purchased from Canadian businesses.
Business Research & Economic Advisors Page 4 March 2008
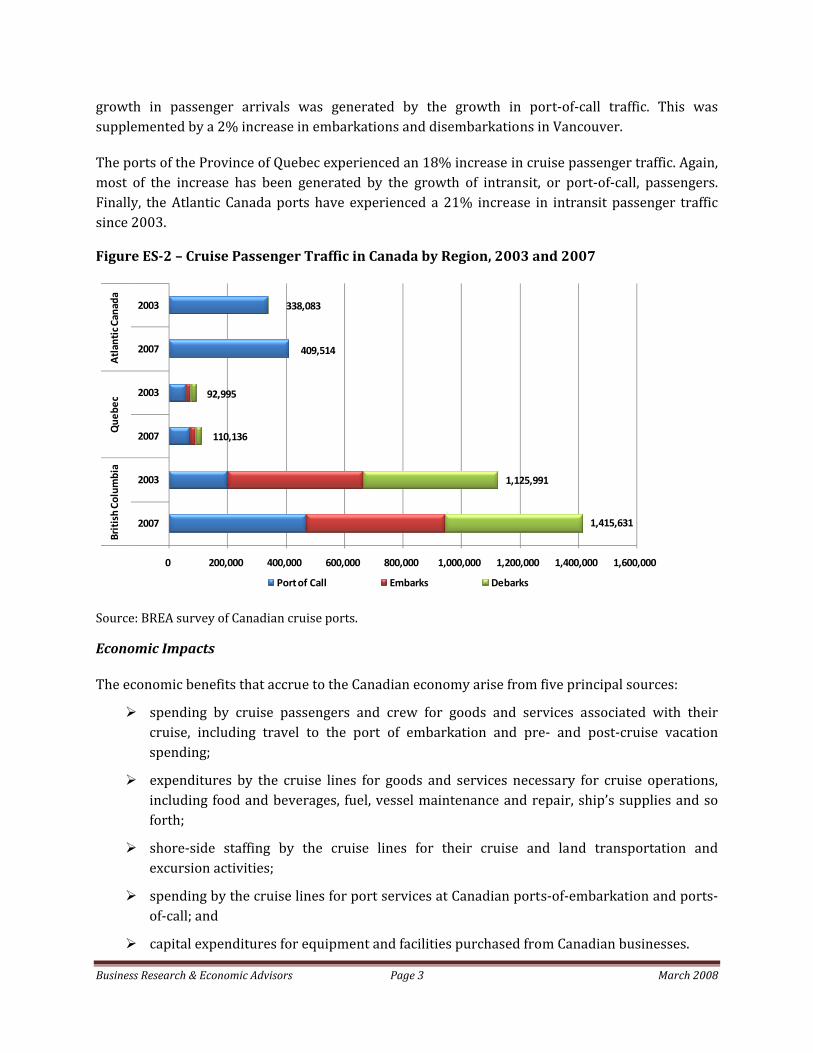
As shown in Table ES1, the resulting spending by cruise lines, passengers and crew associated with this cruise activity generated significant employment, income and other economic benefits throughout Canada. Cruise activity at Canadian ports generated significant economic activity throughout the Canadian economy, on both an industry and regional basis.
The major economic impacts of the international cruise industry during 2007 were as follows.
Cruise calls in Canada generated $1.1 billion in direct spending by the cruise lines and their passengers and crew generating 9,791 annualized full‐ and part‐time jobs5 paying $344 million in wages and salaries. (Note: all dollar denominated figures are in Canadian dollars).
Including the indirect economic impacts, the spending of the cruise lines and their crew and passengers was responsible for the generation of $2.3 billion in total output in the Canadian economy. This, in turn, generated 16,645 full‐ and part‐time jobs in Canada paying a total of $642 million in wages and salaries.
Table ES1 – Summary of Cruise Industry Economic Impacts, 2007 Millions of Dollars
Canada British Columbia
Quebec Atlantic Canada
Rest of Canada
Passenger Traffic* 1,955,937 1,415,631 110,136 409,514 N.A. Direct Economic Impacts
Cruise Industry Direct Spending $ 1,116 $ 765 $ 78 $ 60 $ 213 Employment 9,791 6,910 609 476 1,796 Wages and Salaries $ 344 $ 233 $ 21 $ 14 $ 76 Indirect Business and Income Taxes $ 110 $ 73 $ 7 $ 7 $ 23
Total Economic Impacts Total Output $ 2,259 $ 1,498 $ 150 $ 122 $ 489 Employment 16,645 11,816 1,104 872 2,853 Wages and Salaries $ 642 $ 446 $ 41 $ 30 $ 125 Indirect Business and Income Taxes $ 198 $ 133 $ 13 $ 12 $ 40 * Includes embarkation, disembarkation and intransit passengers.
The total output and income generated by the international cruise industry also generated nearly $200 million in indirect business (less subsidies) and income taxes in Canada.
British Columbia, benefiting from the Alaskan cruise traffic at the ports of Vancouver, Victoria, Nanaimo, Prince Rupert and Campbell River, was Canada’s center of cruise activity. This province accounted for more than two‐thirds of the national impacts with $1.5 billion
5 The economic impacts generated by the models are average annual impacts and include part-time (including seasonal) and full-time employees. Since these expenditures occur over a 6-month period, the peak employment impacts will actually be higher than those reported. Because many of the seasonal workers will incur significant overtime, the six-month impacts, while larger than the average annual impacts, are not necessarily twice as large. Adjusting the employment figures for part-time employees, the direct employment impact is equivalent to approximately 7,697 full-time employees.
Business Research & Economic Advisors Page 5 March 2008
in industry output and 11,816 annualized full‐ and part‐time jobs paying $446 million in wage income.
In eastern Canada, the ports of Quebec and Atlantic Canada on a combined basis accounted for about 12 percent of the cruise industry’s impact on the Canadian economy. Nearly 2,000 annualized full‐and part‐time jobs were generated in the provinces of Quebec and Atlantic Canada. These workers produced an estimated $272 million in output and received over $71 million in wages and salaries.
The economic impacts of cruise tourism were not limited to just those provinces with cruise ports. The interior provinces were impacted as source markets for cruise passengers; providers of business services and advertising located in Ontario, food and provisions from Alberta; and post cruise tourism in the Yukon Territories. Combined, the remaining Canadian provinces benefited from cruise tourism with more than 2,800 annualized full‐ and part‐time jobs paying $125 million in wage income.
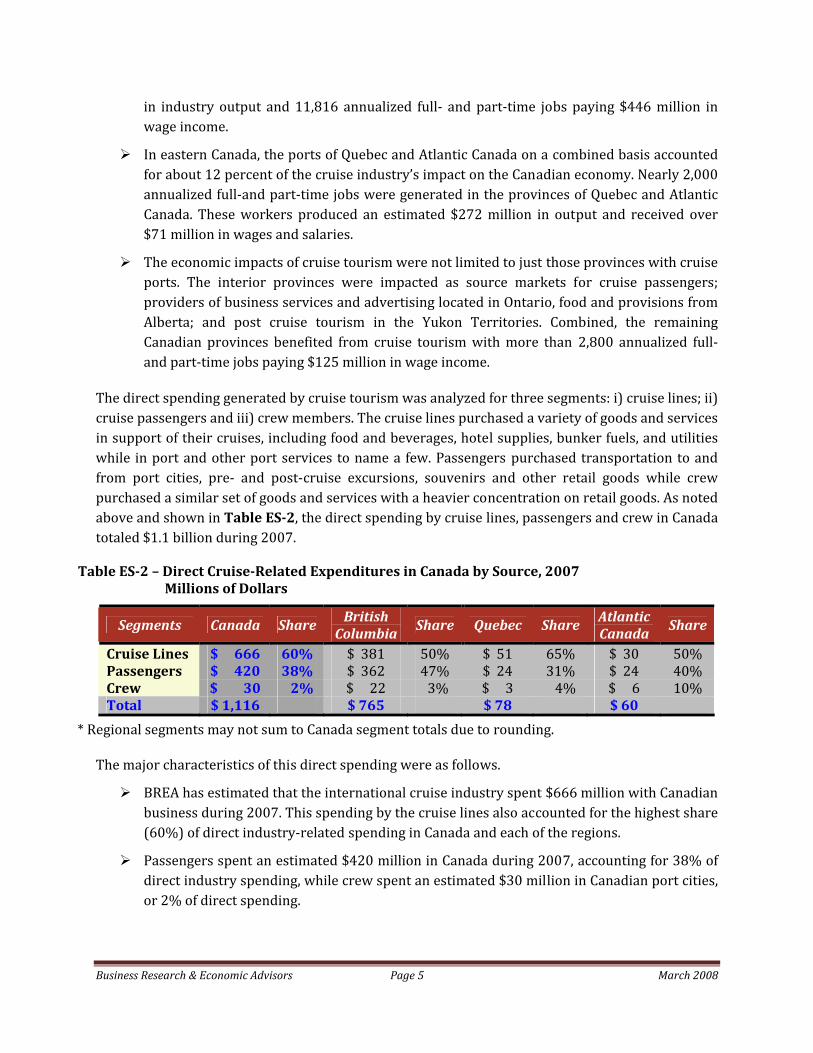
The direct spending generated by cruise tourism was analyzed for three segments: i) cruise lines; ii) cruise passengers and iii) crew members. The cruise lines purchased a variety of goods and services in support of their cruises, including food and beverages, hotel supplies, bunker fuels, and utilities while in port and other port services to name a few. Passengers purchased transportation to and from port cities, pre‐ and post‐cruise excursions, souvenirs and other retail goods while crew purchased a similar set of goods and services with a heavier concentration on retail goods. As noted above and shown in Table ES2, the direct spending by cruise lines, passengers and crew in Canada totaled $1.1 billion during 2007.
Table ES2 – Direct CruiseRelated Expenditures in Canada by Source, 2007 Millions of Dollars
Segments Canada Share British Columbia
Share Quebec Share Atlantic Canada
Share
Cruise Lines $ 666 60% $ 381 50% $ 51 65% $ 30 50% Passengers $ 420 38% $ 362 47% $ 24 31% $ 24 40% Crew $ 30 2% $ 22 3% $ 3 4% $ 6 10% Total $ 1,116 $ 765 $ 78 $ 60
* Regional segments may not sum to Canada segment totals due to rounding.
The major characteristics of this direct spending were as follows.
BREA has estimated that the international cruise industry spent $666 million with Canadian business during 2007. This spending by the cruise lines also accounted for the highest share (60%) of direct industry‐related spending in Canada and each of the regions.
Passengers spent an estimated $420 million in Canada during 2007, accounting for 38% of direct industry spending, while crew spent an estimated $30 million in Canadian port cities, or 2% of direct spending.
Business Research & Economic Advisors Page 6 March 2008
British Columbia, with the most cruise activity among the provinces of Canada, accounted for the most direct spending from each of the three segments with $765 million in total cruise‐related expenditures. With the highest volume of passenger and crew arrivals, passenger and crew spending in British Columbia accounted for a higher share of direct spending than the national average.
Direct spending in Quebec totaled $78 million during 2007. Because Quebec had the lowest volume of passenger and crew arrivals but is a relatively large source market in Canada for international cruises, spending by cruise lines, at 65% of total direct spending in the province, was relatively more important to the Quebec economy.
Cruise lines, passengers and crew spent $60 million in the Atlantic Canada provinces during 2007. Like British Columbia spending by passengers and crew accounted for half of the total direct spending.
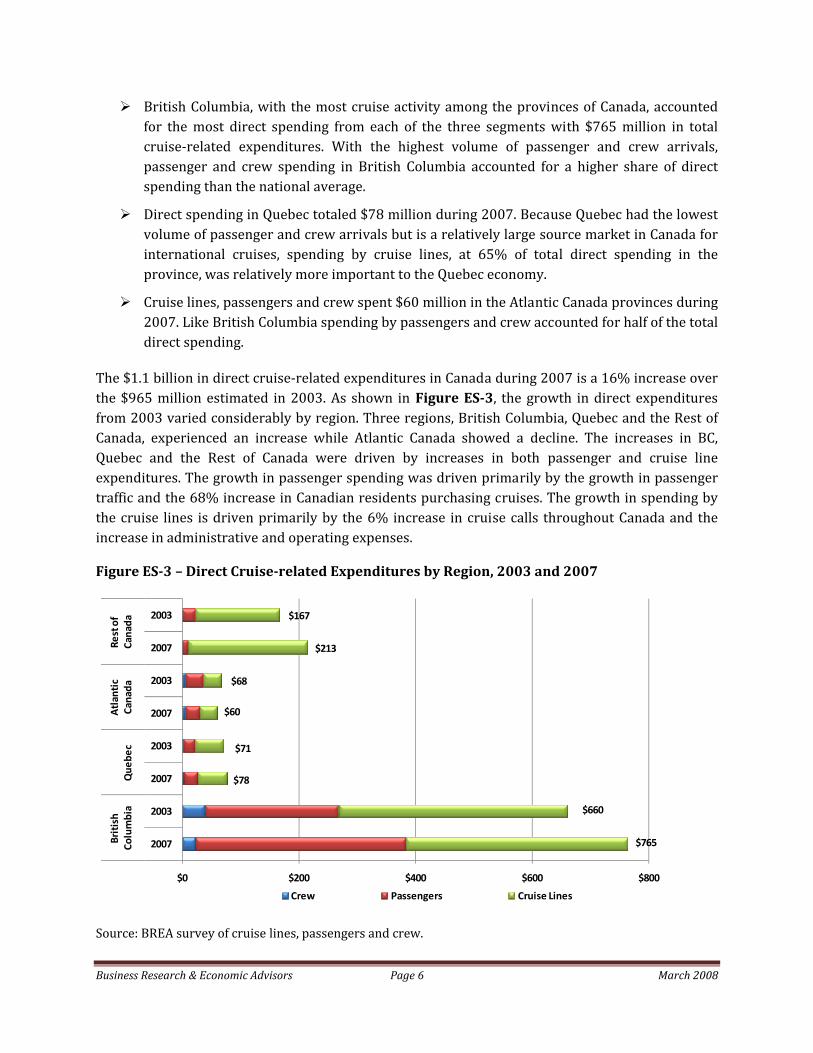
The $1.1 billion in direct cruise‐related expenditures in Canada during 2007 is a 16% increase over the $965 million estimated in 2003. As shown in Figure ES3, the growth in direct expenditures from 2003 varied considerably by region. Three regions, British Columbia, Quebec and the Rest of Canada, experienced an increase while Atlantic Canada showed a decline. The increases in BC, Quebec and the Rest of Canada were driven by increases in both passenger and cruise line expenditures. The growth in passenger spending was driven primarily by the growth in passenger traffic and the 68% increase in Canadian residents purchasing cruises. The growth in spending by the cruise lines is driven primarily by the 6% increase in cruise calls throughout Canada and the increase in administrative and operating expenses.
Figure ES3 – Direct Cruiserelated Expenditures by Region, 2003 and 2007
$78
$71
$60
$68
$765
$660
$213
$167
$0 $200 $400 $600 $800
2007
2003
2007
2003
2007
2003
2007
2003
British
Columbia
Que
bec
Atlantic
Canada
Rest of
Canada
Crew Passengers Cruise Lines
Source: BREA survey of cruise lines, passengers and crew.
Business Research & Economic Advisors Page 7 March 2008
The decline of 12% in direct spending in Atlantic Canada is primarily the result of a decline in passenger and crew spending in Atlantic Canada. The decline in passenger and crew spending in Atlantic Canada resulted from a decline in the reported average spend per passenger and crew. The figures for 2007 are based upon over 12,000 surveys conducted by BREA in Atlantic Canada during 2007. These data were lower than figures reported for 2003. Contributing to this decline is the 33% decline in the value of the U.S. dollar between 2003 and 2007. This decline primarily impacted the Canadian value of shore excursions purchased by cruise passengers onboard cruise ships that are purchased in U.S. dollars.
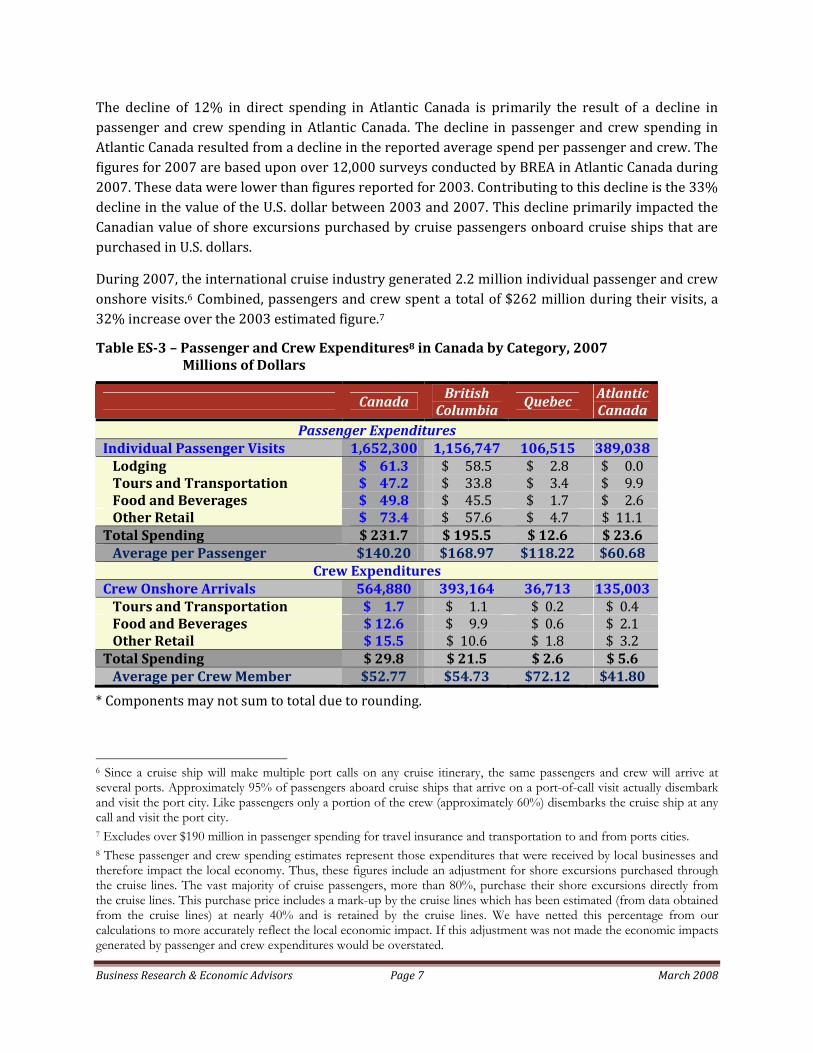
During 2007, the international cruise industry generated 2.2 million individual passenger and crew onshore visits.6 Combined, passengers and crew spent a total of $262 million during their visits, a 32% increase over the 2003 estimated figure.7
Table ES3 – Passenger and Crew Expenditures8 in Canada by Category, 2007 Millions of Dollars
Canada British Columbia
Quebec Atlantic Canada
Passenger Expenditures Individual Passenger Visits 1,652,300 1,156,747 106,515 389,038 Lodging $ 61.3 $ 58.5 $ 2.8 $ 0.0 Tours and Transportation $ 47.2 $ 33.8 $ 3.4 $ 9.9 Food and Beverages $ 49.8 $ 45.5 $ 1.7 $ 2.6 Other Retail $ 73.4 $ 57.6 $ 4.7 $ 11.1 Total Spending $ 231.7 $ 195.5 $ 12.6 $ 23.6 Average per Passenger $140.20 $168.97 $118.22 $60.68
Crew Expenditures Crew Onshore Arrivals 564,880 393,164 36,713 135,003 Tours and Transportation $ 1.7 $ 1.1 $ 0.2 $ 0.4 Food and Beverages $ 12.6 $ 9.9 $ 0.6 $ 2.1 Other Retail $ 15.5 $ 10.6 $ 1.8 $ 3.2 Total Spending $ 29.8 $ 21.5 $ 2.6 $ 5.6 Average per Crew Member $52.77 $54.73 $72.12 $41.80
* Components may not sum to total due to rounding.
6 Since a cruise ship will make multiple port calls on any cruise itinerary, the same passengers and crew will arrive at several ports. Approximately 95% of passengers aboard cruise ships that arrive on a port-of-call visit actually disembark and visit the port city. Like passengers only a portion of the crew (approximately 60%) disembarks the cruise ship at any call and visit the port city. 7 Excludes over $190 million in passenger spending for travel insurance and transportation to and from ports cities. 8 These passenger and crew spending estimates represent those expenditures that were received by local businesses and therefore impact the local economy. Thus, these figures include an adjustment for shore excursions purchased through the cruise lines. The vast majority of cruise passengers, more than 80%, purchase their shore excursions directly from the cruise lines. This purchase price includes a mark-up by the cruise lines which has been estimated (from data obtained from the cruise lines) at nearly 40% and is retained by the cruise lines. We have netted this percentage from our calculations to more accurately reflect the local economic impact. If this adjustment was not made the economic impacts generated by passenger and crew expenditures would be overstated.
Business Research & Economic Advisors Page 8 March 2008
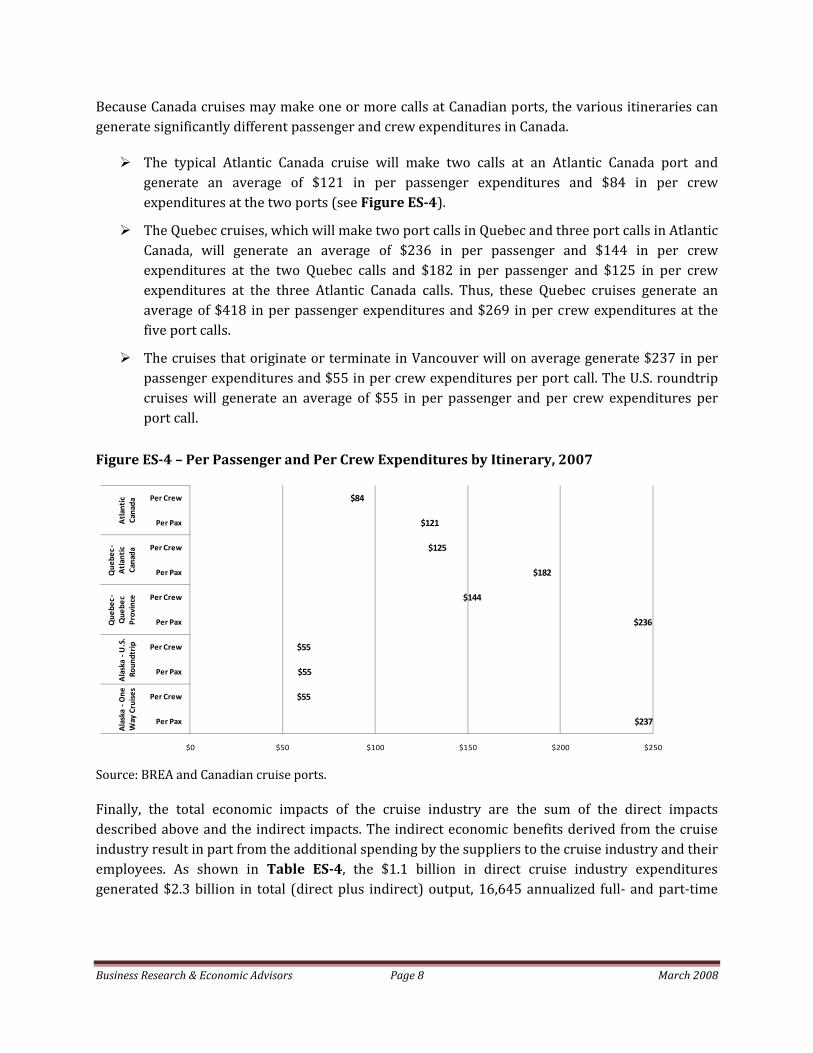
Because Canada cruises may make one or more calls at Canadian ports, the various itineraries can generate significantly different passenger and crew expenditures in Canada.
The typical Atlantic Canada cruise will make two calls at an Atlantic Canada port and generate an average of $121 in per passenger expenditures and $84 in per crew expenditures at the two ports (see Figure ES4).
The Quebec cruises, which will make two port calls in Quebec and three port calls in Atlantic Canada, will generate an average of $236 in per passenger and $144 in per crew expenditures at the two Quebec calls and $182 in per passenger and $125 in per crew expenditures at the three Atlantic Canada calls. Thus, these Quebec cruises generate an average of $418 in per passenger expenditures and $269 in per crew expenditures at the five port calls.
The cruises that originate or terminate in Vancouver will on average generate $237 in per passenger expenditures and $55 in per crew expenditures per port call. The U.S. roundtrip cruises will generate an average of $55 in per passenger and per crew expenditures per port call.
Figure ES4 – Per Passenger and Per Crew Expenditures by Itinerary, 2007
$237
$55
$55
$55
$236
$144
$182
$125
$121
$84
$0 $50 $100 $150 $200 $250
Per Pax
Per Crew
Per Pax
Per Crew
Per Pax
Per Crew
Per Pax
Per Crew
Per Pax
Per Crew
Alaska ‐O
ne
Way Cruises
Alaska ‐U
.S.
Roun
dtrip
Que
bec ‐
Que
bec
Province
Que
bec ‐
Atlantic
Canada
Atlantic
Canada
Source: BREA and Canadian cruise ports.
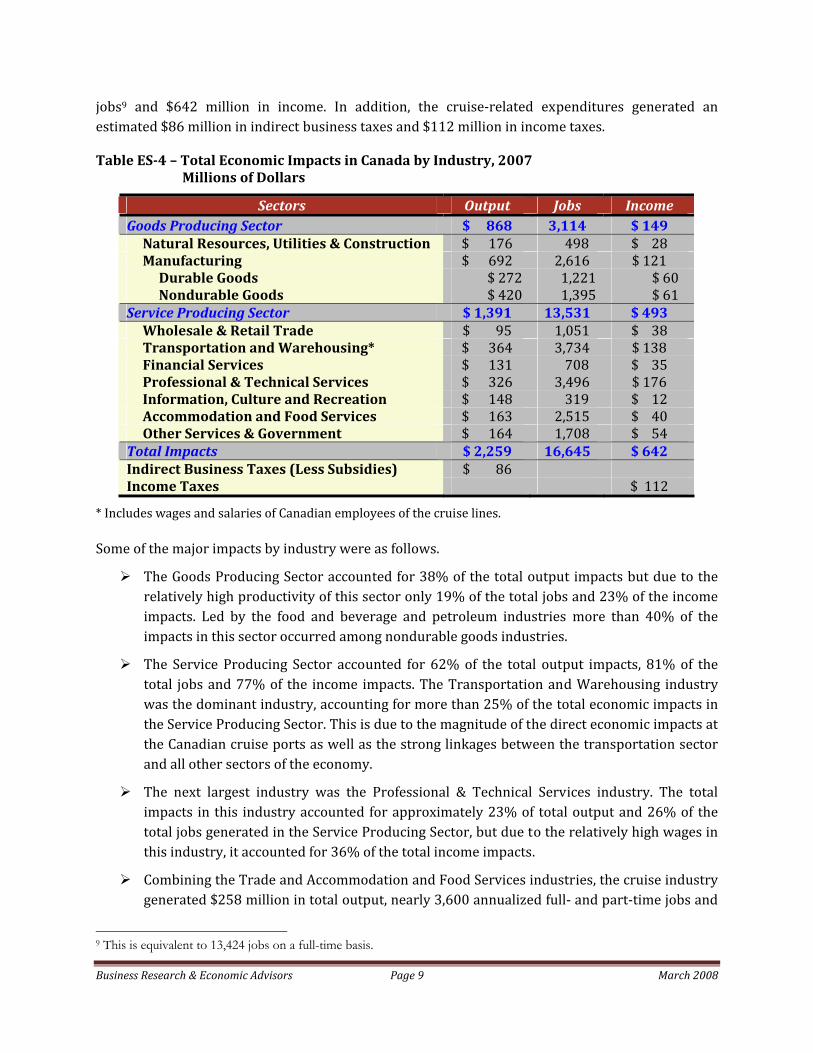
Finally, the total economic impacts of the cruise industry are the sum of the direct impacts described above and the indirect impacts. The indirect economic benefits derived from the cruise industry result in part from the additional spending by the suppliers to the cruise industry and their employees. As shown in Table ES4, the $1.1 billion in direct cruise industry expenditures generated $2.3 billion in total (direct plus indirect) output, 16,645 annualized full‐ and part‐time
Business Research & Economic Advisors Page 9 March 2008
jobs9 and $642 million in income. In addition, the cruise‐related expenditures generated an estimated $86 million in indirect business taxes and $112 million in income taxes.
Table ES4 – Total Economic Impacts in Canada by Industry, 2007 Millions of Dollars
Sectors Output Jobs Income Goods Producing Sector $ 868 3,114 $ 149 Natural Resources, Utilities & Construction $ 176 498 $ 28 Manufacturing $ 692 2,616 $ 121 Durable Goods $ 272 1,221 $ 60 Nondurable Goods $ 420 1,395 $ 61 Service Producing Sector $ 1,391 13,531 $ 493 Wholesale & Retail Trade $ 95 1,051 $ 38 Transportation and Warehousing* $ 364 3,734 $ 138 Financial Services $ 131 708 $ 35 Professional & Technical Services $ 326 3,496 $ 176 Information, Culture and Recreation $ 148 319 $ 12 Accommodation and Food Services $ 163 2,515 $ 40 Other Services & Government $ 164 1,708 $ 54 Total Impacts $ 2,259 16,645 $ 642 Indirect Business Taxes (Less Subsidies) $ 86 Income Taxes $ 112
* Includes wages and salaries of Canadian employees of the cruise lines.
Some of the major impacts by industry were as follows.
The Goods Producing Sector accounted for 38% of the total output impacts but due to the relatively high productivity of this sector only 19% of the total jobs and 23% of the income impacts. Led by the food and beverage and petroleum industries more than 40% of the impacts in this sector occurred among nondurable goods industries.
The Service Producing Sector accounted for 62% of the total output impacts, 81% of the total jobs and 77% of the income impacts. The Transportation and Warehousing industry was the dominant industry, accounting for more than 25% of the total economic impacts in the Service Producing Sector. This is due to the magnitude of the direct economic impacts at the Canadian cruise ports as well as the strong linkages between the transportation sector and all other sectors of the economy.
The next largest industry was the Professional & Technical Services industry. The total impacts in this industry accounted for approximately 23% of total output and 26% of the total jobs generated in the Service Producing Sector, but due to the relatively high wages in this industry, it accounted for 36% of the total income impacts.
Combining the Trade and Accommodation and Food Services industries, the cruise industry generated $258 million in total output, nearly 3,600 annualized full‐ and part‐time jobs and
9 This is equivalent to 13,424 jobs on a full-time basis.
Business Research & Economic Advisors Page 10 March 2008
$78 million in income. These impacts were generated primarily by passenger and crew spending. Due to the relatively low productivity and wages within the Retail Trade and Accommodation and Food Services industries, they accounted for 16% of the total income in the Service Producing Sector, but 26% of the direct jobs and 19% of the total output.
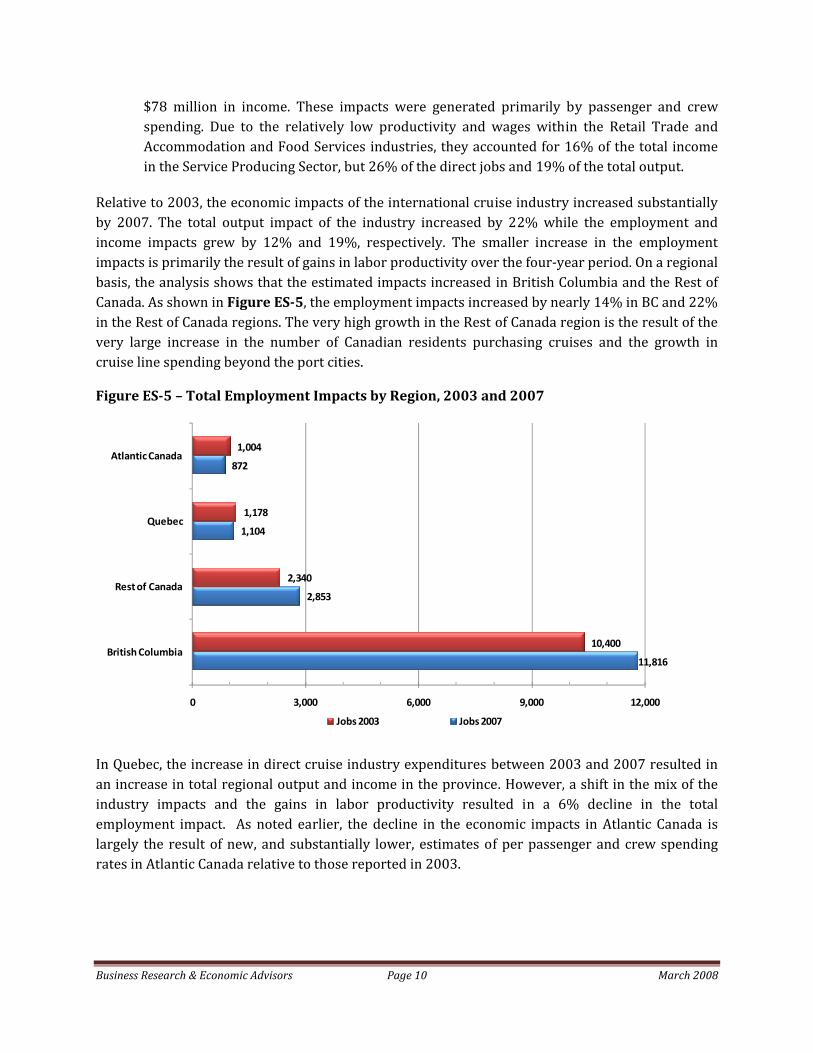
Relative to 2003, the economic impacts of the international cruise industry increased substantially by 2007. The total output impact of the industry increased by 22% while the employment and income impacts grew by 12% and 19%, respectively. The smaller increase in the employment impacts is primarily the result of gains in labor productivity over the four‐year period. On a regional basis, the analysis shows that the estimated impacts increased in British Columbia and the Rest of Canada. As shown in Figure ES5, the employment impacts increased by nearly 14% in BC and 22% in the Rest of Canada regions. The very high growth in the Rest of Canada region is the result of the very large increase in the number of Canadian residents purchasing cruises and the growth in cruise line spending beyond the port cities.
Figure ES5 – Total Employment Impacts by Region, 2003 and 2007
11,816
2,853
1,104
872
10,400
2,340
1,178
1,004
0 3,000 6,000 9,000 12,000
British Columbia
Rest of Canada
Quebec
Atlantic Canada
Jobs 2003 Jobs 2007
In Quebec, the increase in direct cruise industry expenditures between 2003 and 2007 resulted in an increase in total regional output and income in the province. However, a shift in the mix of the industry impacts and the gains in labor productivity resulted in a 6% decline in the total employment impact. As noted earlier, the decline in the economic impacts in Atlantic Canada is largely the result of new, and substantially lower, estimates of per passenger and crew spending rates in Atlantic Canada relative to those reported in 2003.
Business Research & Economic Advisors Page 11 March 2008
Passenger Attributes and Satisfaction
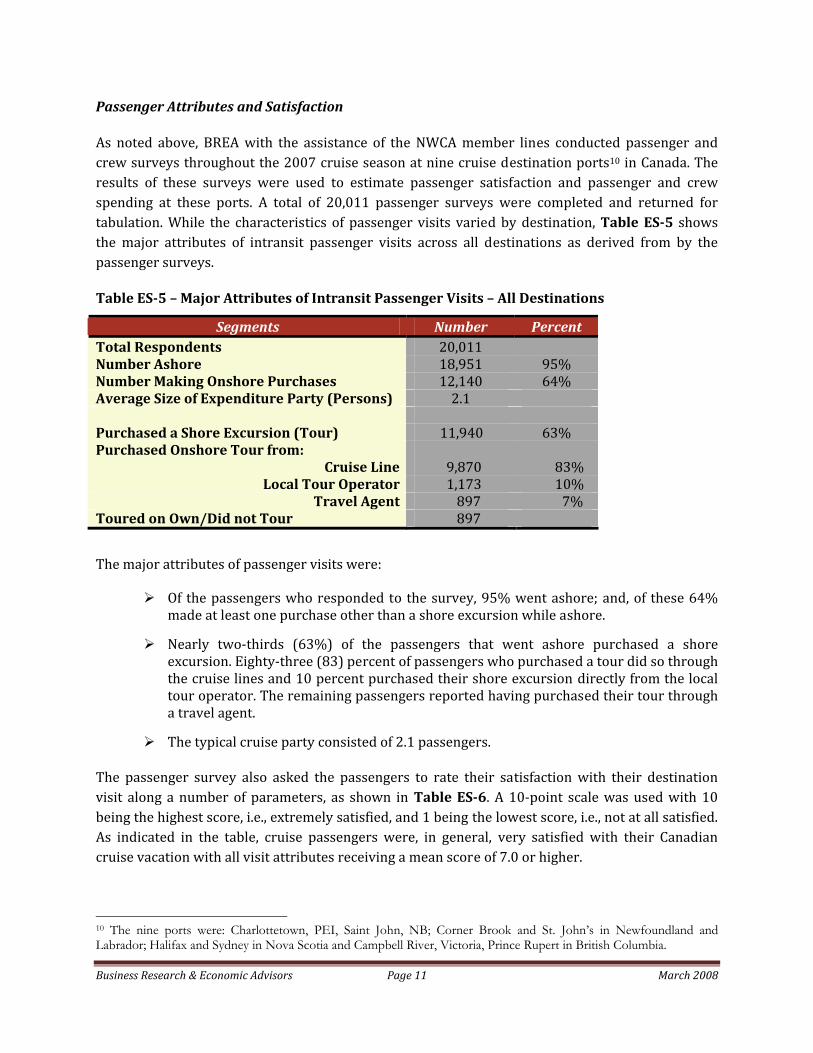
As noted above, BREA with the assistance of the NWCA member lines conducted passenger and crew surveys throughout the 2007 cruise season at nine cruise destination ports10 in Canada. The results of these surveys were used to estimate passenger satisfaction and passenger and crew spending at these ports. A total of 20,011 passenger surveys were completed and returned for tabulation. While the characteristics of passenger visits varied by destination, Table ES5 shows the major attributes of intransit passenger visits across all destinations as derived from by the passenger surveys.
Table ES5 – Major Attributes of Intransit Passenger Visits – All Destinations
Segments Number Percent Total Respondents 20,011 Number Ashore 18,951 95% Number Making Onshore Purchases 12,140 64% Average Size of Expenditure Party (Persons) 2.1 Purchased a Shore Excursion (Tour) 11,940 63% Purchased Onshore Tour from:
Cruise Line 9,870 83% Local Tour Operator 1,173 10%
Travel Agent 897 7% Toured on Own/Did not Tour 897
The major attributes of passenger visits were:
Of the passengers who responded to the survey, 95% went ashore; and, of these 64% made at least one purchase other than a shore excursion while ashore.
Nearly two‐thirds (63%) of the passengers that went ashore purchased a shore excursion. Eighty‐three (83) percent of passengers who purchased a tour did so through the cruise lines and 10 percent purchased their shore excursion directly from the local tour operator. The remaining passengers reported having purchased their tour through a travel agent.
The typical cruise party consisted of 2.1 passengers.
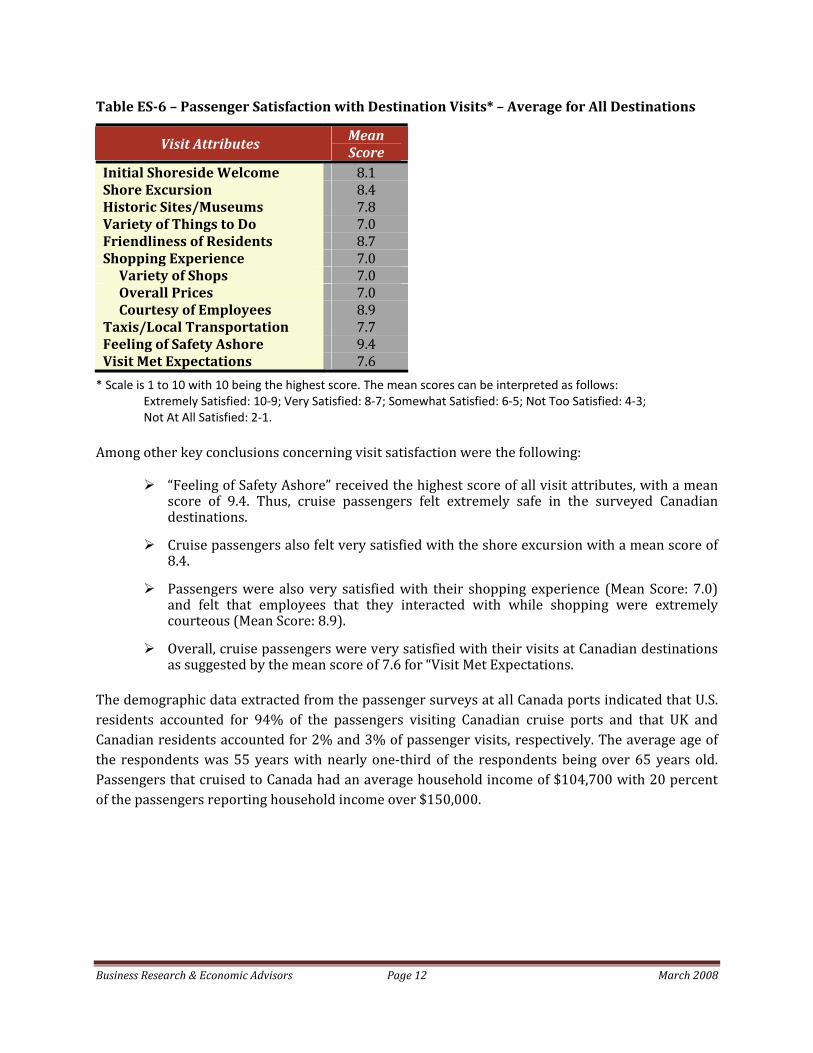
The passenger survey also asked the passengers to rate their satisfaction with their destination visit along a number of parameters, as shown in Table ES6. A 10‐point scale was used with 10 being the highest score, i.e., extremely satisfied, and 1 being the lowest score, i.e., not at all satisfied. As indicated in the table, cruise passengers were, in general, very satisfied with their Canadian cruise vacation with all visit attributes receiving a mean score of 7.0 or higher.
10 The nine ports were: Charlottetown, PEI, Saint John, NB; Corner Brook and St. John’s in Newfoundland and Labrador; Halifax and Sydney in Nova Scotia and Campbell River, Victoria, Prince Rupert in British Columbia.
Business Research & Economic Advisors Page 12 March 2008
Table ES6 – Passenger Satisfaction with Destination Visits* – Average for All Destinations
Visit Attributes Mean Score
Initial Shoreside Welcome 8.1 Shore Excursion 8.4 Historic Sites/Museums 7.8 Variety of Things to Do 7.0 Friendliness of Residents 8.7 Shopping Experience 7.0 Variety of Shops 7.0 Overall Prices 7.0 Courtesy of Employees 8.9 Taxis/Local Transportation 7.7 Feeling of Safety Ashore 9.4 Visit Met Expectations 7.6
* Scale is 1 to 10 with 10 being the highest score. The mean scores can be interpreted as follows: Extremely Satisfied: 10‐9; Very Satisfied: 8‐7; Somewhat Satisfied: 6‐5; Not Too Satisfied: 4‐3; Not At All Satisfied: 2‐1.
Among other key conclusions concerning visit satisfaction were the following:
“Feeling of Safety Ashore” received the highest score of all visit attributes, with a mean score of 9.4. Thus, cruise passengers felt extremely safe in the surveyed Canadian destinations.
Cruise passengers also felt very satisfied with the shore excursion with a mean score of 8.4.
Passengers were also very satisfied with their shopping experience (Mean Score: 7.0) and felt that employees that they interacted with while shopping were extremely courteous (Mean Score: 8.9).
Overall, cruise passengers were very satisfied with their visits at Canadian destinations as suggested by the mean score of 7.6 for “Visit Met Expectations.
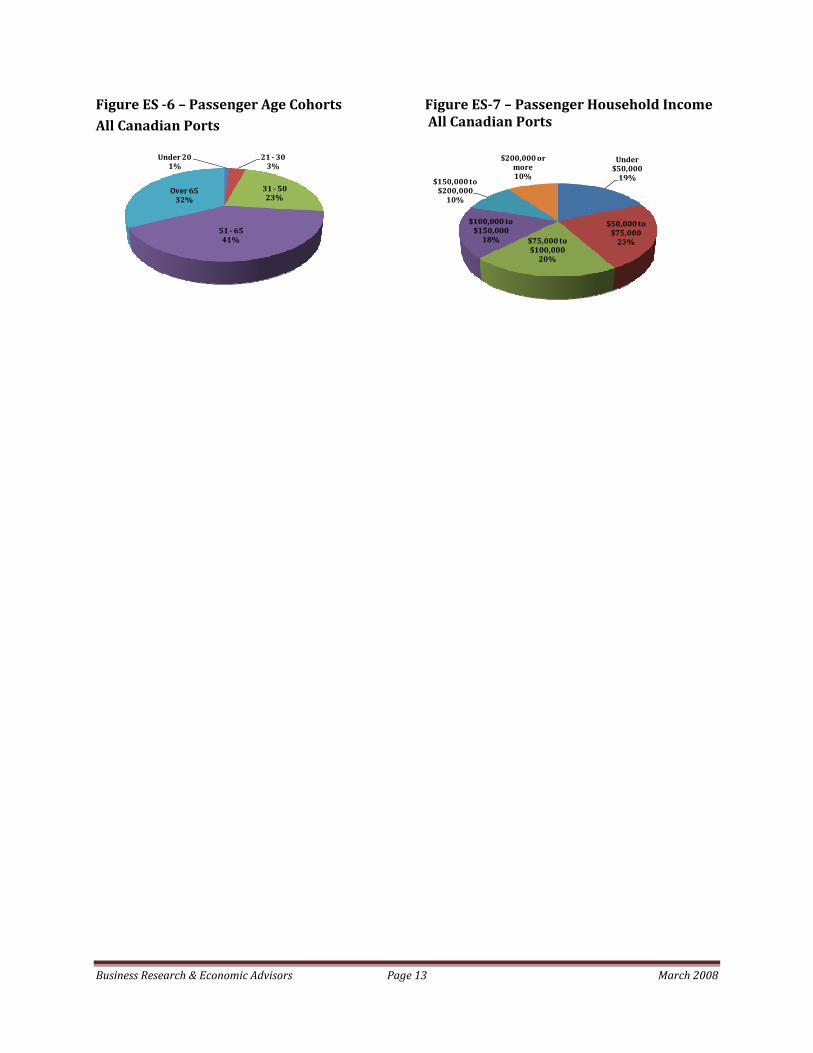
The demographic data extracted from the passenger surveys at all Canada ports indicated that U.S. residents accounted for 94% of the passengers visiting Canadian cruise ports and that UK and Canadian residents accounted for 2% and 3% of passenger visits, respectively. The average age of the respondents was 55 years with nearly one‐third of the respondents being over 65 years old. Passengers that cruised to Canada had an average household income of $104,700 with 20 percent of the passengers reporting household income over $150,000.
Business Research & Economic Advisors Page 13 March 2008
Figure ES 6 – Passenger Age Cohorts All Canadian Ports
Under 201%
21 303%
31 5023%
51 6541%
Over 6532%
Figure ES7 – Passenger Household Income All Canadian Ports
Under $50,00019%
$50,000 to $75,00023%$75,000 to
$100,00020%
$100,000 to $150,00018%
$150,000 to $200,00010%
$200,000 or more10%
Business Research & Economic Advisors Page 14 March 2008
BREA specializes in custom market analyses for clients throughout the private and public sectors. These unique market analyses integrate economic, financial, and demographic trends with primary market research, proprietary client data, and advanced statistical and modeling techniques. This approach results in comprehensive and actionable analysis, databases and models designed to support planning, sales and marketing, and public relations within client organizations. BREA’s principals each have more than twenty-five years of experience in consulting and forecasting with a wide range of international product and service companies, including consumer products, leisure, retailing, gaming, business services, telecommunications, utility and financial services. Their consulting assignments provide critical analysis and insight into market dynamics, product demand, economic trends, consumer behavior and public policy. BREA’s approach to market analysis focuses on determining market or product characteristics that can be summarized by three attributes: size, share, and growth. Since studies are designed to meet the specific needs of each client, they can incorporate many dimensions of the market and include a variety of ancillary services. To carry out this market analysis BREA provides the following services: Market Research: design and implementation of primary market research instruments using telephone, mail, and intercept surveys. Test instruments are designed to collect information on product demand, attributes of consumers and users, perceived product attributes, and customer satisfaction. Segmentation Analyses: segmenting demand attributes by product line, consumer demographics (age, income, region, etc.) and business characteristics using market research, government statistics and proprietary databases. Statistical and Econometric Modeling: developing quantitative models relating market and product demand to key economic factors and demographic market/consumer attributes. Models can be used for forecasting, trend analysis and divergence/convergence analysis. Market Studies and Trend Analyses: detailed descriptions of markets (defined as products, regions, industries, consumer segments, etc.) and comprehensive analyses of underlying market forces (such as economic and financial conditions, competitive environment, technology, etc.). Economic Impact Studies: thorough analysis of industries and consumption behavior and their contribution to or impact on national and regional (state, metropolitan areas, counties, etc.) economies.
BREA
Business Research and Economic Advisors